Article

Breakdown Time Phenomena: Analyzing the Conductive Channel of Positive Impulse Voltage Discharges under Standard Temperature and Pressure Air Conditions

by
Muhammad Ikhwanus
1,2,* and
Takeshi Morimoto
1
1
Graduate School of Science and Engineering, Kindai University, Osaka 577-8502, Japan
2
Electrical Department, Malikussaleh University, Lhokseumawe 24351, Indonesia
*
Author to whom correspondence should be addressed.
Energies 2024, 17(17), 4222; https://doi.org/10.3390/en17174222
Submission received: 14 June 2024 / Revised: 28 July 2024 / Accepted: 16 August 2024 / Published: 23 August 2024
(This article belongs to the Section F: Electrical Engineering)

Abstract

:
Even though the streamer process can be identified in nanoseconds and microseconds through experimental measurements, the breakdown time of air discharge is still unknown. The instability of electrons is suspected to be an attachment-instability phenomenon of the channel conductivity. We investigated breakdown time across milliseconds to better understand how the oxygen excitations of the 200–400 nm range influence a high-conductivity channel even with a weaker applied voltage. Experiments were performed with positive impulse voltages ranging from +42 to +75 kV in the step of +6 kV at a 3 cm gap between needle-to-plane electrodes in a horizontal configuration. A spectrometer with an integration time of 70 ms was used to capture the spectra during voltage discharge. The shortest breakdown time was found at +60 kV with 77 ns compared to +66, +72, and +75 kV. We conclude that the shorter breakdown time at +60 kV is primarily due to the oxygen-excited state in O IV at 262.999 nm. This state helps maintain electron flow by preventing electron loss, with a decay time of 2.5 µs, while releasing Joule heat at a temperature of 26,003 K, which optimizes conductivity. This process occurs before the recombination of the O I line at 777.417 nm, which has a significantly shorter decay time of 27 ns.

1. Introduction

In our previous study [1], investigations with high-impulse voltages of ±100 kV, ±125 kV, and ±150 kV in positive and negative voltage configurations between needle-to-plane electrodes with a gap spacing of 3.5 cm were conducted. Theoretically, a higher applied voltage should enhance electron acceleration and facilitate gap bridging by increasing the electric field at the needle electrode. In addition to applied voltages above +100 kV, we found that the intensity of oxygen excitation, with higher peak intensities in the 200–400 nm range than the O I peak intensity at 777.417 nm, may also play a role in rapid breakdown under positive impulse voltages. The excited oxygen atoms release photons (de-excitation process) accelerating electrons after making the channel conductive above 10,000 K. Despite extensive theoretical and experimental investigations, a comprehensive understanding of the electrical breakdown time due to photon emission remains unresolved, particularly regarding breakdown mechanisms due to the instability of oxygen transitions by observing spectral line transitions before the recombination process occurs. Our previous study discussed the basic discharge mechanisms governing the breakdown time phenomena, particularly focusing on oxygen excitations that showed larger peak intensities in the 200–400 nm wavelength range compared to O I at 777.417 nm.
However, fully comprehending the breakdown process is further complicated by the uncertain role of oxygen transitions throughout these breakdowns. The primary challenge in unraveling the mystery of breakdown mechanisms in non-uniform electric fields lies in observing streamer propagation within extremely short timeframes, ranging from picoseconds to nanoseconds. This significant obstacle poses a challenge to conducting in-depth analyses to identify complex behaviors and characteristics during critical breakdown initiation and development phases. Due to the difficulty of the real-time observation of dynamic streamers, numerous studies, such as Naidis [2], have simulated the transition from streamer to spark in short uniform air gaps of 1 cm using the streamer model. These simulations demonstrated that the delay to breakdown is heavily influenced by the mean of the reduced electric field within the gap and is attributed only to kinetic or chemical processes within the discharge channel. As the channel evolution in the nanosecond time range is considered, the gas number density is assumed to be time-dependent. The kinetic models include 14 components: neutral particles N 2 , N , O 2 , O , N O , N 2 (A3Ʃ), N 2 (a’1Ʃ), O 2 ( a 1 Δ ) ; ions O , O 2 , O 3 , O 2 + , O 4 + ; and electrons. Due to the relative concentration of positive ions ( N 2 + ,   N 4 + , N 2 O 2 + ) being small, these ions quickly convert to O 2 + and O 4 + . He found the distribution of the electric field in the channel at various times after bridging the gap. According to his simulation results, this transition can be attributed to the accumulation of predominantly oxygen atoms to activate the electron detachment process. As the transition progresses to its final stage, stepwise and associative ionization processes become increasingly significant roles in the transition. Next, Kieu et al.’s experiments [3] explored the presence of molecular species over exposure times of 160 ns and at microsecond-to-sub-microsecond timescales at 1.488 µs and a 0.714 µs temporal resolution. They observed approximately one-meter-long lightning-like discharges producing sparks up to 900 kV using Galius high-speed spectroscopy within the 380–800 nm wavelength range. These discharges exhibited optical emissions similar to natural lightning, including neutral hydrogen, N II, O II, and N III. Additionally, molecular species, such as the cyanide radical (CN), N2 (second positive system), N2+ (first negative system), C2 (Swan band), and CO (quintet and Angstrom bands), were identified. Next, Nijdam et al. [4] distinguished physical and chemical mechanisms: (a) electric breakdown occurs when conductivity increases due to ionization, heating, and thermal gas expansion utilized in high-voltage switchgear; (b) the excitation, ionization, and dissociation of molecules via electron impact initiate plasma chemical reactions in the gas. In air and similar gas mixtures, this results in the production of OH, O, and N radicals, along with excited species and ions, such as O , O 2 , O + , N 4 + , a n d   O 4 + , ending following the initial formation of N 2 + and O 2 + . These species can trigger further chemical reactions within the bulk gas, on nearby surfaces, or even in nearby liquids if they survive long enough and are easily absorbed.
Lowke’s [5] investigation explored electrical breakdown in the air for non-uniform electric fields. It was proposed that space-charge effects tend to make the electric field in the streamer column uniform at a value of E/N (where E is the electric field and N is the gas number density), for which the effective ionization and attachment rates are equal. He also proposed that the O2(1Δg) metastable states, with a decay time of 45 min produced in the pre-breakdown processes, such as the corona and streamer, had a dominant role in determining E/N in the streamer channel. Because of their ability to detach electrons from O2 ions, these metastable states reduced the effective attachment coefficient. The effect of the O2(1Δg) metastable state could reduce the breakdown field in plane-parallel electrodes by a factor of 6.
Furthermore, Hotta et al. [6] categorized the breakdown process into three phases: the leader progress region, the transition region, and the secondary streamer progress region. They investigated the transition region between leader and secondary streamer progress with the applied voltage range from 42 to 72 kV in the step of 6 kV at a 3 cm gap distance to understand the dominance of secondary streamer propagation in the discharge channel. Based on initial breakdown observations, Sigmoid [7] proposed that the secondary streamer typically served more as an indicator of an approaching breakdown, rather than as the primary cause. Additional research supports this theory indicating that a secondary streamer either does not exist before a breakdown or forms after the initial streamer reaches the grounded plane electrode [8,9]. It was thought that as soon as a primary streamer makes contact with the ground, the secondary streamer could propagate across the channel causing a breakdown after a few microseconds [10] due to the increasingly heated channel mediated by the secondary streamers [7,8]. Many studies reported the breakdown characteristics of long and short gap distances under positive and negative lightning impulses showing unpredictable breakdown times with an increasing applied voltage [11,12,13,14].
Consequently, while substantial developments have been made in identifying general patterns and triggering mechanisms, the specific reactions and transitions at the atomic level, particularly those involving oxygen in the discussed wavelength range, are still not fully understood. The lack of knowledge contributes to the ongoing mystery surrounding the circumstances and timing of the breakdown process in non-uniform electric fields. Although substantial theoretical and experimental progress has clarified the fundamental discharge mechanisms leading to breakdown through streamer mechanisms, a thorough comprehension of the breakdown process remains unknown. Mysteries still surround breakdown streamers in the air; Ono et al. argued that the luminous intensity of the secondary streamer was due to the distribution of the atomic oxygen density. Additionally, Komoro et al. reported that the secondary streamer, about 2–3 eV of electron energy, was insufficient to lead to electron impact ionization [15,16].
In the metastable state, atomic transitions play roles over long times, usually more than 10−3 s, either completely ionizing or returning to a lower energy state with photon emission. Due to the longer decay time of metastable atoms, we investigated channel conductivity by observing oxygen transitions in the 200–400 nm ranges during positive impulse voltage discharges. We conducted experiments with positive impulse voltages ranging from +42 to +75 kV incremented by 6 kV with a 3 cm gap between electrodes to study channel conductivity. Breakdown time was analyzed by examining the conductivity effects of oxygen-excited transitions in the 200–400 nm wavelength region. We utilized theoretical simplifications and spectroscopy to understand how air becomes conductive during the breakdown process. Oxygen excitation and de-excitation mechanisms were evaluated using optical measurements during the breakdown, tracking typical transitions where oxygen excitation leads to channel conductivity. The exponential increase in free electrons, creating avalanches with a space charge and flowing towards the plane electrode, forms the basis of these theoretical insights. When the electric field strength magnitude is insufficient to sustain electron acceleration through the gas’s ionization energy, the instability of the oxygen-excited state may trigger rapid breakdown at lower voltages. Detailed examinations of factors influencing oxygen transitions on channel conductivity are conducted. In Section 2, the experimental setup and methodology were described by utilizing the Boltzmann law to estimate the temperatures in Local Thermodynamic Equilibrium (LTE) conditions and the inverse of the Einstein coefficient to calculate decay times. Section 3 presents the results of the breakdown time and excitation temperature derived from the spectral lines of oxygen excitation corresponding to the decay time. The influence of peak intensity, excitation temperature, and electrical conductivity to examine channel conductivity was analyzed in Section 4. Finally, Section 5 concluded our findings.

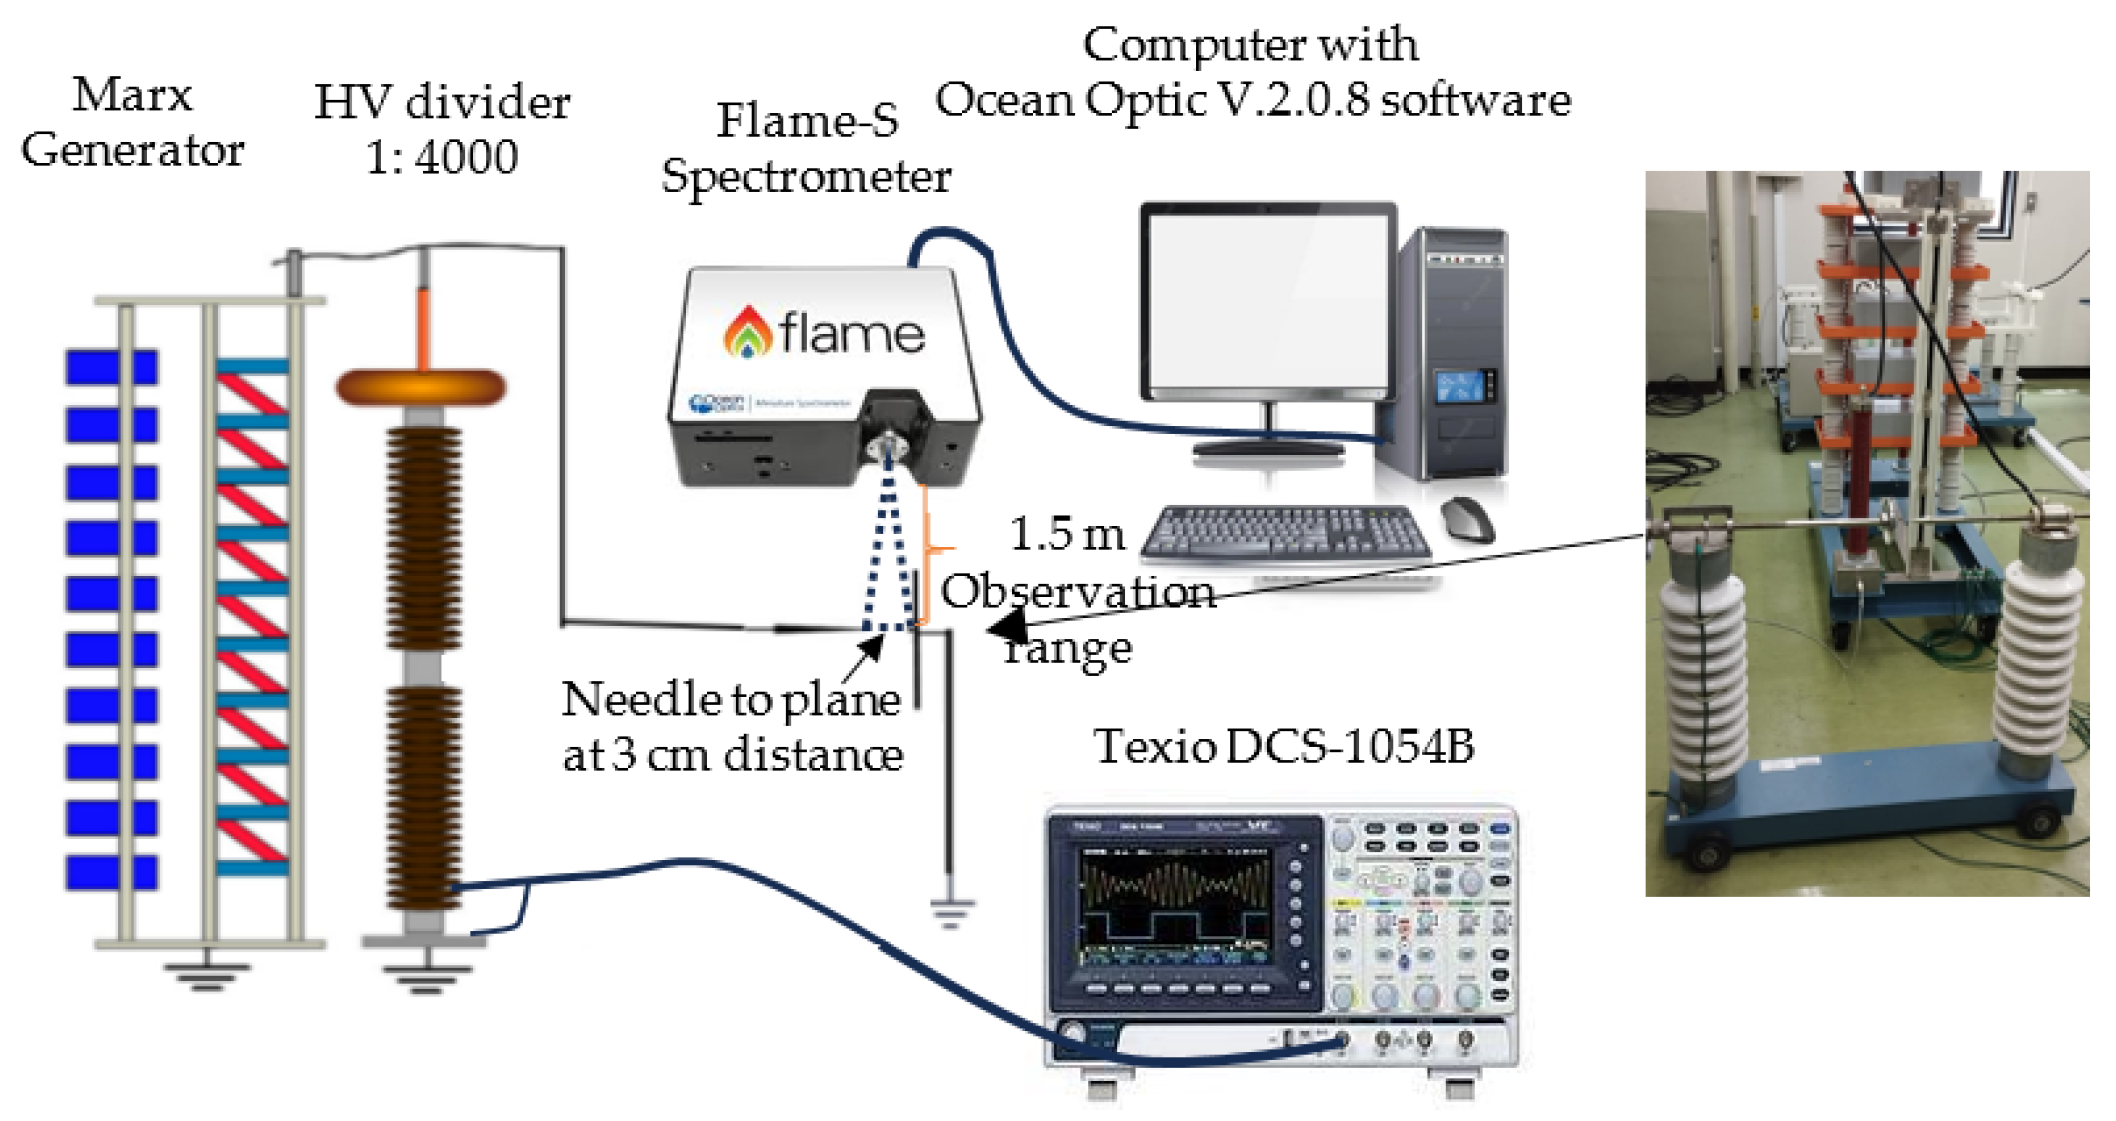
2. Experiments and Methods

This study employed spectral analysis to investigate breakdown time phenomena through experimental observations. A High-Volt, age (HV) Marx Generator, Pultec Electronics co., Ltd., Tokyo, Japan was utilized serving as an HVDC positive impulse voltage source with a voltage divider resistor measured using a 1:4000 HV probe. The experimental setup maintained a gap distance of 3 cm between the needle and plane electrodes, following the methodology outlined in our prior studies, as shown in Figure 1. To facilitate the examination of rapid breakdown time transitions at lower applied voltages, the research was conducted by progressively varying operating voltages from +42 kV in steps of 6 kV up to +75 kV under Standard Temperature and Pressure (STP) conditions of 20 °C (293 K) and 101.3 kPa. Two tungsten electrodes were arranged horizontally in a needle-to-plane orientation within the experimental setup. The needle electrode was subjected to positive impulse voltages, while the plane electrode remained grounded. A Texio DCS 1054B oscilloscope, Texio Technology Corporation, Yokohama, Japan, with 1 Gbps capability and a bandwidth of 50 Mhz, was used to capture up to 1 ns with a time-tag resolution of 4 ns.
The comprehensive studies examined waveform voltage discharge through spectroscopy analysis. Spectral lines were monitored using the Ocean Optics Flame-S spectrometer, Ocean Insight, Orlando, FL, USA, which has an optical resolution of 1.33 nm (with spectral resolution varying from 0.1 to 10 nm), an entrance slit of 25 µm, and a scan rate of 400 Hz (equivalent to 2.5 ms), with the integration time configured to 70 ms. The spectrometer was positioned 1.5 cm from the midpoint between the needle and plane electrodes. It was connected to a computer with Ocean View software version 2.08 and stored the datalogger data through a USB cable. The spectral lines of oxygen were analyzed using the deconvolution method with Origin 2018 SR1 b9.5.1.195 software examining the spectra of breakdown time data corresponding to the applied voltage. Specifically, higher peak intensities of oxygen excitations were observed in the 200–400 nm wavelength region compared to O I at 777.417 nm as suspected in our previous study to indicate rapid breakdown. The individual peak intensities of these oxygen spectral lines were determined using Gaussian distribution based on correlations between the fitting spectra results and reference data from the NIST database [17].
Furthermore, Boltzmann’s Law principle serves to clarify the distribution of atomic energy levels during their transition from the upper state to the lower state upon reaching thermal equilibrium. We use the Boltzmann plot method to calculate the excitation temperature, Tex, which is a crucial parameter of the plasma, using the following equation [18]:
T e x = E j k ln λ k i I k i h c   g k A k i 1 + C
and the decay time, τk, of an atomic level k, is estimated based on the inverse of transition probabilities as follows [19]:
τk = 1/Ak
We provide a thorough explanation of the techniques and processes used in Reference [1], which contextualizes and confirms the observed phenomena. These parameters enhance our understanding of the dynamic interactions in oxygen excitations as they propagate during high-voltage electron propagation. This method observes rapid breakdown times at lower applied positive impulse voltages under STP conditions. We estimate the electron density, which indicates the amount of free charge present at each point per unit volume of space. By considering the electron concentration inside the channel, we estimate the electrical conductivity concerning temperature and electron density using the Saha–Boltzmann equation and their impact on breakdown times. From this perspective, we explore how the electron contribution affects rapid breakdown at lower applied voltages. To assess the influence of the electron concentration and temperature on the breakdown time, we examined electrical conductivity, which represents the air’s ability to conduct electrons within the channel, as discussed in Section 4.

3. Results

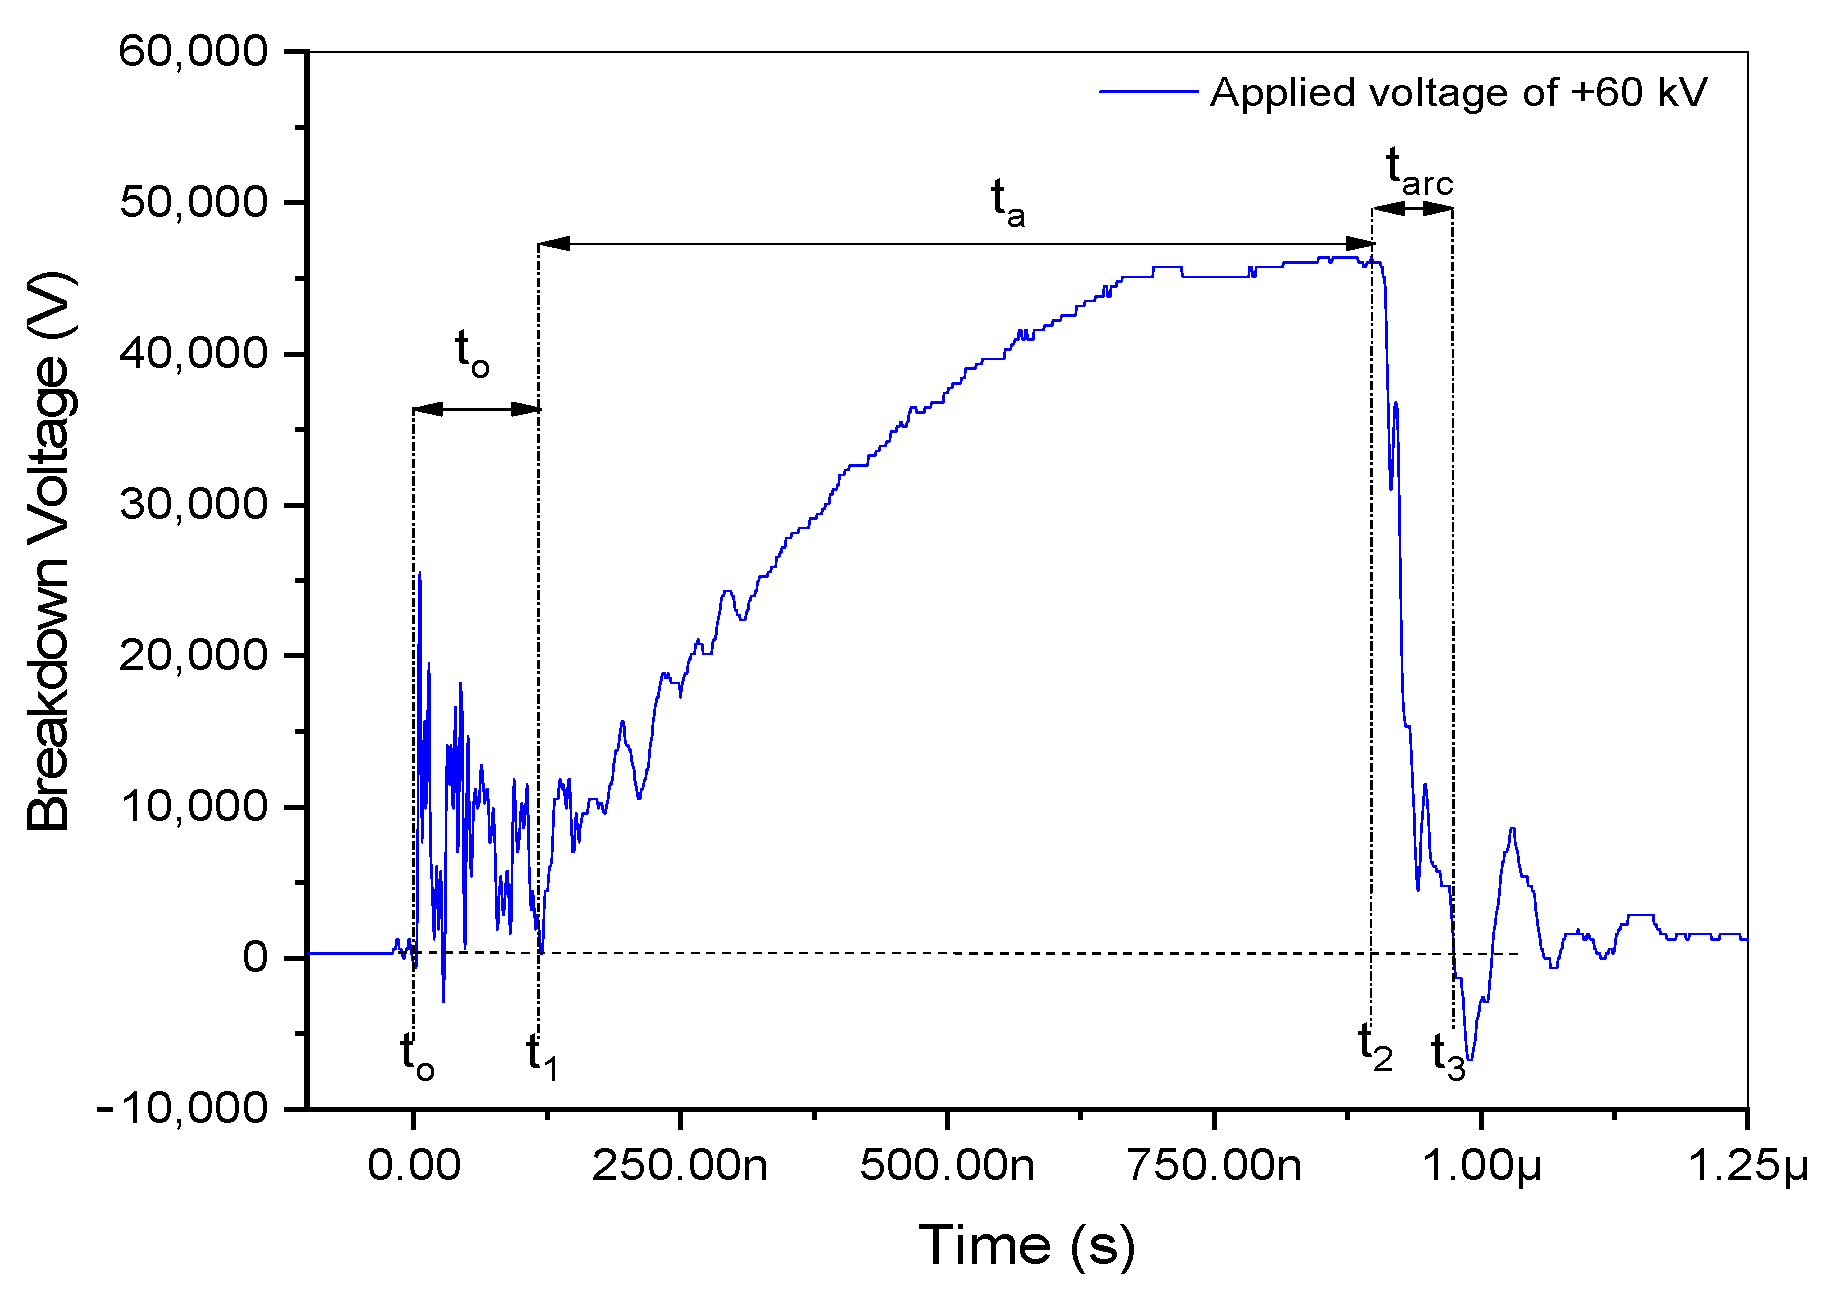
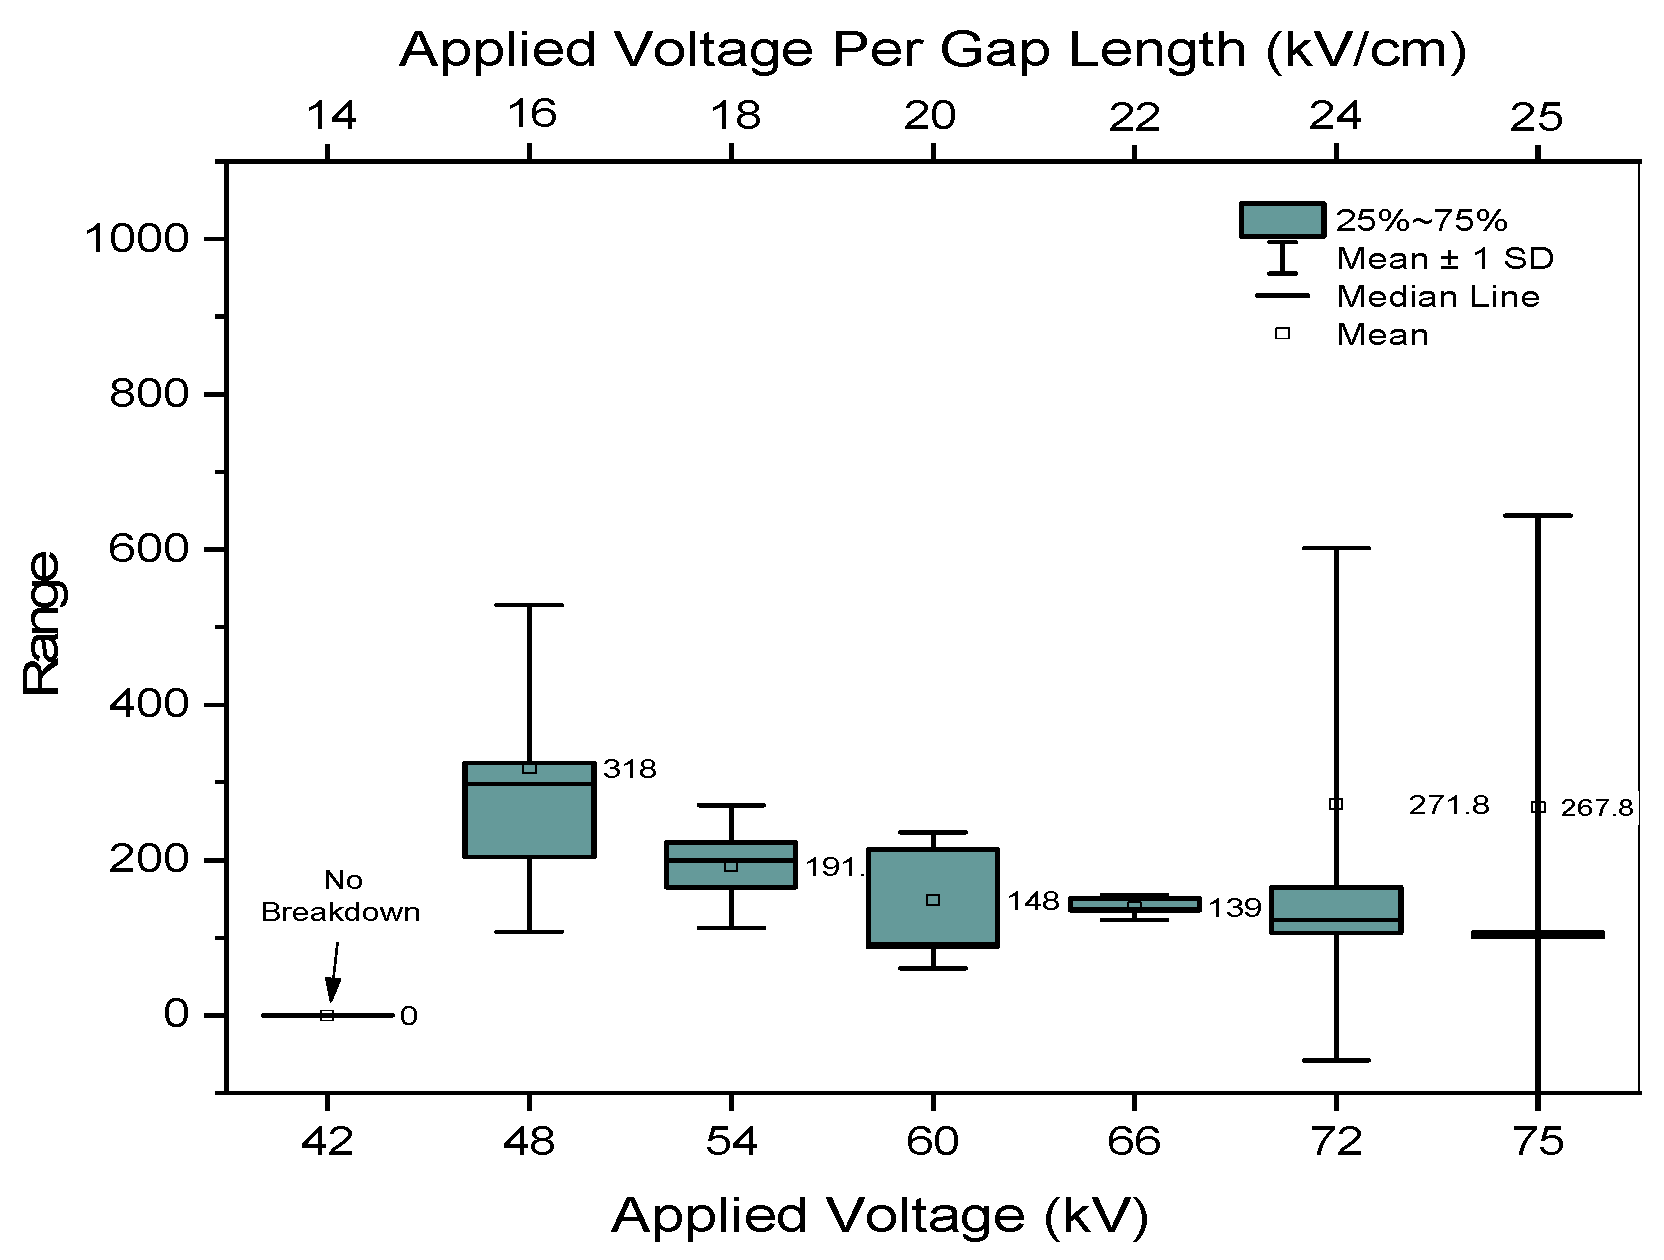
3.1. Times of Breakdown

Seven different positive impulse voltage levels (+42 kV, +48 kV, +54 kV, +60 kV, +66 kV, +72 kV, and +75 kV) were used in the experimental analysis to investigate their conductivity impacts on electrical breakdown time phenomena. Six voltages were successfully recorded by the oscilloscope as depicted in Figure 2. In our previous study, we calculated the breakdown time of the positive impulse voltage waveforms by subtracting the endpoint of t3, a zero peak, from the endpoint of t2, a maximum peak, as illustrated in Figure 3. Here, ta represents the time required for avalanche buildup until the critical charge density is reached, and tarc is the time required for the formation of a low-resistance arc to bridge the gap.
Detailed information about breakdown times is tabulated in Table 1 providing specific breakdown durations (t3 − t2) for each applied voltage. Notably, no breakdown occurred at the lowest tested voltage of +42 kV due to an insufficient electric field strength magnitude above the critical value of 25–30 kV/cm needed to release electrons in the air from the needle electrode to the plane electrode. Electron avalanches successfully bridged the gap in 200 ns at the higher voltage of +48 kV, as shown in Table 1. The breakdown time increased to 289 ns when the voltage was further raised to +54 kV. Subsequently, a decrease to +60 kV resulted in the experiment’s fastest breakdown time, recorded at just 77 ns. However, increasing the voltage to +66 kV led to a longer breakdown time of 115 ns. Further increases in voltage to +72 kV and +75 kV showed a linear trend, with breakdown durations progressively decreasing from 105 to 102 ns, respectively.
These results indicate that there is no direct correlation between breakdown time and the incremental increase in applied voltage from +48 to +60 kV. These observations are further illustrated in Figure 4, which shows fluctuations in breakdown times at various applied voltages corresponding to the applied voltage per gap length. The value of breakdown time tabulated in Table 1 was analyzed in this study. This variability in breakdown times highlights the complexity of the breakdown process with an increasing applied voltage at the same gap distance. We consider examining the kinetic mechanisms of oxygen-excited transitions, such as temperature, which influence the timing of successful electrical discharges through air gaps. These mechanisms form the conductive channels during the breakdown transition and contribute to rapid breakdown times.

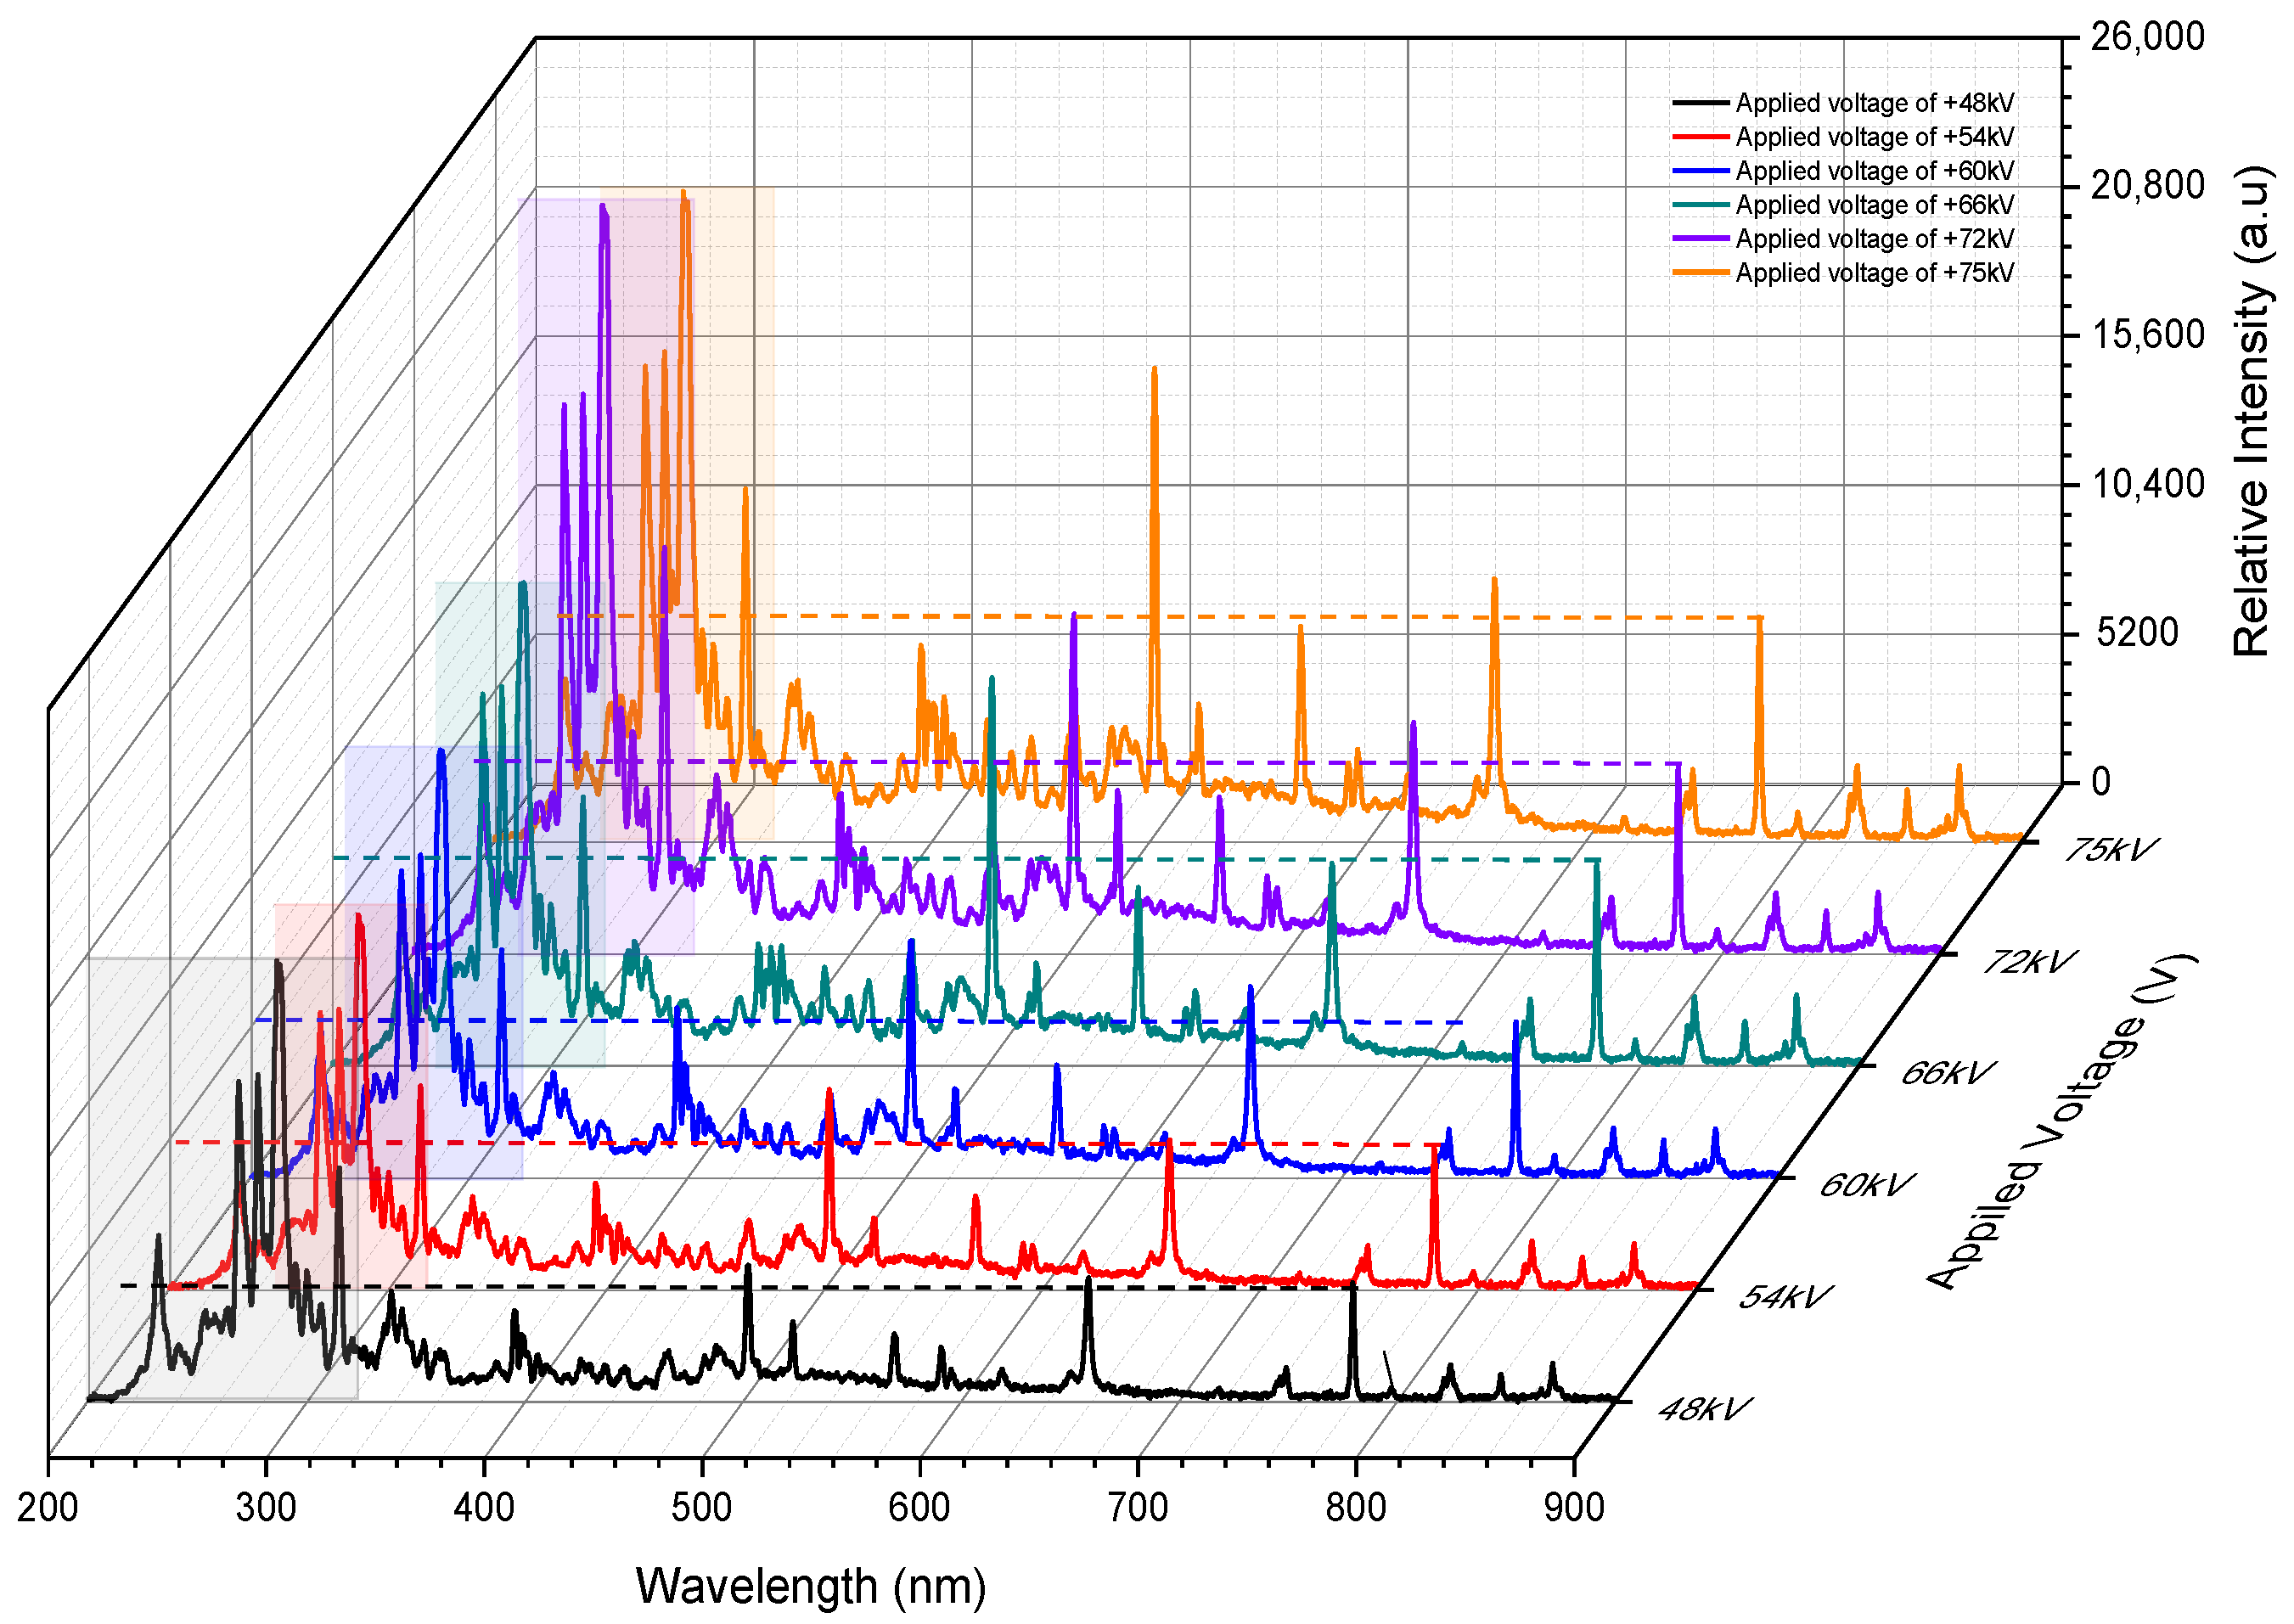
3.2. Lines of the Spectrum during Arc Discharges

The times during which the spectra were measured correspond to the values shown in Figure 3. These spectra cover the wavelength range of 200–900 nm during arc discharge (t3 − t2) as depicted in Figure 5. Common air constituents, such as nitrogen (N), oxygen (O), hydrogen (H), and argon (Ar), are consistently present in these spectra. Our primary objective was to precisely identify individual oxygen transition spectra, with particular attention on examining peak intensities in the 200–400 nm region, especially those exceeding the peak intensity of the O I line at 777.417 nm. Table 2 tabulates the resulting oxygen distribution after fitting the curve, which involved identifying individual spectral lines from the spectra in Figure 5 using the Gaussian distribution to pinpoint higher peak intensities of spectral lines in the wavelength range of 200–400 nm above the O I line at 777.417 nm. Most spectral lines in the 200–400 nm range appear above the O I level at 777.417 nm.
The emission spectra consistently demonstrate the patterns of the oxygen distribution across excited states at evaluated voltage levels of +48 kV, +54 kV, +60 kV, +66 kV, and +75 kV. The most dominant excited states observed are O III at 268.615 nm and 286.262 nm, O IV at 300.028 nm, O II at 313.421 nm, and O I at 777.417 nm. Additionally, O II at 303.946 nm is observed except at +48 kV. Further peaks were observed at +48 kV, +60 kV, and +75 kV, corresponding to O II at 304.293 nm, O III at 306.498 nm, O IV at 262.999 nm, and O III at 270.887 nm, respectively. Interestingly, all oxygen-excited states exhibit higher peak intensities than O I at 777.417 nm. Moreover, O III consistently shows the highest peak intensity at 286.262 nm across all applied voltages.
Certain excitation temperatures and decay times highlighted in Figure 6 and Table 2 are considered less reliable due to the absence of transition probability coefficients for oxygen excitation in the NIST database. Figure 6a,b show the highest temperature and decay time observed at +60 kV for O IV at 262.999 nm, while O IV at 337.806 nm was also examined in our previous study. The excitation temperatures in the O II excited state typically exceed 10,000 K, and temperatures above 20,000 K were observed for O IV. In our previous work, the highest temperature recorded was over 20,000 K for O IV at 337.806 nm, a finding consistent with O IV at 262.999 nm. No correlation between the decay time and the oxygen-excited state was discussed in our previous study. Table 2 provides specific information on the excitation temperature, decay time, and peak intensity of spectral lines in the 200–400 nm wavelength range, as well as O I at 777.417 nm.

4. Discussion

4.1. Breakdown Time Influenced by Peak Intensity

It is well known that the emission spectra of spectral lines are due to disturbances caused by electrically excited states of atoms and molecules in the plasma system. Electrons impact ionization, excitation, and dissociation, which result from collisions between electrons and plasma particles, creating these excited states. Additionally, atoms can be stimulated through collisions with each other, photon bombardment, electron acceleration, or an increased temperature. An excited oxygen atom may collide with a free electron, leading to step ionization, or absorb additional energy from another photon in a process known as step photoionization. The excitation of particle species to upper states primarily occurs due to electron effects [20]. The oxygen atoms listed in Table 2 are in an excited state condition (O II, O III, and O IV) and experienced the ionization process, as well as neutral oxygen (O I). After reaching a decay time limit, they return to a lower state by releasing a photon. The process after glow discharge is contributed to by mutual neutralization between positive and negative oxygen ions, expressed as O + + O O * + O , which produces excited oxygen atoms ( O * ) and neutral oxygen atoms ( O ) [21]. The possible reactions of excited atoms are O * + e O + + e (step ionization), O * + e O + h f + e (de-excitation), O * + e O * * (dielectronic excitation), O * * O * + e (autoionization), O * * O + h f (dielectronic recombination), and O * + h f O + + e (step photoionization) [22].
During the breakdown transition at lower applied voltages ranging from +42 kV to +75 kV, the result in Table 1 demonstrates that breakdown is not observed at +42 kV because the electric field level is below the critical threshold required to release an electron in the air of 25–30 kV/cm. Consequently, the spectrometer could not capture any spectra. Breakdown initiates from +48 kV to +75 kV showing higher peak intensities in this range compared to the O I line at 777.417 nm. Additionally, Table 2 presents the peak intensities, decay times, and excitation temperatures related to oxygen distribution in the wavelength range of 200–400 nm. Interestingly, all spectra from +48 kV to +75 kV exhibit higher peak intensities in this range compared to the O I line at 777.417 nm. The crossed breakdown at +48 kV is most likely due to dominant oxygen excitations. At this voltage, three O III lines at 268.615 nm, 286.262 nm, and 304.293 nm, along with one O IV line at 300.028 nm and one O II line at 313.421 nm represent the five dominant oxygen excitations. Ionization of the air is evidenced by these five oxygen excitations, with the highest intensity observed in the O III line at 286.262 nm resulting in a breakdown time of 200 ns.
At +54 kV, five spectral lines were observed with the O II line at 304.293 nm replaced by the O II line at 303.946 nm. Among these lines, the O III line at 286.262 nm exhibited the strongest relative peak intensity. However, all spectral lines displayed lower peak intensities than those at +48 kV resulting in a longer breakdown time of 288 ns. Notably, at +60 kV, significant oxygen excitations are observed presenting additional spectra: O IV at 262.999 nm and O III at 306.498 nm. Compared to other applied voltages, the rapid breakdown time of 77 ns is facilitated by the presence of these two additional spectral lines of oxygen in excited states (O IV at 262.999 nm and O III at 306.498 nm) with peak intensities of 3238 a.u and 3085 a.u, respectively. These intense channels contribute to brightness within a decay time of 2.5 µs and 46 ns, respectively, correlating with electron production in their excited states, as experimentally evidenced by Amarasinghe et al. [23] to support the relationship between brightness intensity and current. Their result showed that the measured peak current and the brightness of the main spark channel had a high degree of correlation (R2 = 0.97). These electron concentrations contribute to the recombination state of O I at 777.417 nm discussed in Section 4.3. In this section, we investigate the transitions of oxygen-excited states in the 200–400 nm wavelength range by considering the peak intensity.
The acceleration of breakdown time can be attributed to the O IV line at 262.999 nm, as its highest excited state contributes to more intense electron collisions compared to lower states, releasing Joule heat as discussed in the following Section 4.2. In other applied voltages, the spectral line initiated with the O III line at 268.615 nm. The excitation of O IV at 262.999 nm in +60 kV suggests that oxygen was excited to a higher level from 2s 2p(3p0) 5d to 2s 2p(3p0) 4f, followed by photon emission after a lifetime of 2.5 µs, transitioning to a lower state of 4f. It is evident from the peak intensity of O I at 777.417 nm, measured at only 340 arbitrary units (a.u.), compared to +66, +72, and +75 kV, which have peak intensities of 587, 538, and 607 a.u., respectively. This suggests that the intense oxygen excitations appearing in the 200–400 nm wavelength range, which releases photons, are also responsible for the quick breakdown time of 77 ns at +60 kV, as observed in our previous study. Additionally, they produce the number of electrons from oxygen excitations discussed in the following Section 4.3. Two additional spectral lines, O IV at 262.999 nm and O II at 306.498 nm, were identified at +60 kV, and one additional spectral line was observed at +75 kV compared to other applied voltages. These additional spectral lines are suspected to contribute to the rapid breakdown time of 77 ns at +60 kV and 102 ns at +75 kV, as examined in Section 4.2 and Section 4.3 through the perspectives of temperature and electrical conductivity.
Table 2 demonstrates that the peak intensities from +48 to +75 kV do not exhibit a linear trend with applied voltages, which contrasts our previous results. In our earlier study, higher voltages of ±100, ±125, and ±150 kV with a 3.5 cm gap produced more electrons, with peak intensities of O I at 777.417 nm exceeding tens of thousands of arbitrary units. Additionally, the highest peak intensity was observed in O II at 313.421 nm with a decay time of approximately 13.02 ns. This higher intensity, compared to the O I line at 777.417 nm, contributes to a shorter breakdown time due to photon emission within 13.02 ns after releasing Joule heat to maintain the channel. Despite observing more intense peak intensities of oxygen excitation than the peak intensity of O I at 777.417 nm, a rapid breakdown cannot be solely guaranteed by these existing spectral lines. Therefore, other parameters contributing to rapid breakdown, such as temperature and electrical conductivity, were discussed in the following Section 4.2 and Section 4.3.
Interestingly, in this study, the highest peak intensity above 10,000 a.u. was observed in O III at 286.26 nm with a decay time of 281 ns. In contrast, the highest peak intensity above 40,000s a.u. in the previous work was in O III at 313.421 nm with a shorter decay time of 13 ns due to the brightness representing a larger peak current (electrons) inside the channel. This suggests that more intense oxygen excitations, especially in the shorter wavelength range, such as O IV at 262.999 nm as the initial transition, contribute to releasing higher kinetic energy and increasing electron production at +60 kV. This results from the ionization process at higher levels than other voltages with a 3 cm gap. Conversely, less-intense oxygen excitations lead to reduced electron production in the ionization process, resulting in a fluctuated range of breakdown times until critical breakdown is achieved, typically beyond the decay time of 27 ns. As noted previously, shorter breakdown times can be achieved through more dominant oxygen excitations, especially in the shorter wavelength range, such as O IV at 262.999 nm. These excitations produce more electrons in the 200–400 nm range, with a higher peak intensity than O I at 777.417 nm, particularly across applied voltages of +60 kV.

4.2. Impact of Excitation Temperature on Breakdown Time

As a reference, under LTE conditions where the ionization temperature is uniform, the electron temperature is determined by the kinetic energy of electrons, the gas temperature mediated by the kinetic energy of atoms and ions, and the excited state temperature by the distribution of particles across energy states. Thus, the ionization temperature of spectral lines satisfies Equation (1). We consider the temperature of O I at 777.417 nm to observe the transition temperature among spectra due to its correlation with electron concentrations. It can be observed that the temperature of O I at 777.417 nm does not exhibit a consistently decreasing trend with an increased applied voltage across the range from +48 to +75 kV, as shown in Table 2. This contrasts our previous findings, where all temperatures of spectral lines decrease with an increasing applied voltage. The observed decrease in temperature with an increasing applied voltage for O I at 777.417 nm suggests that the arc channel becomes more conductive due to the increasing electric field, facilitating electron avalanches and electron flow within the channel. In Table 2, the oxygen excitation temperatures fluctuate with an increasing applied voltage. These high temperatures in the wavelength range of 200–400 nm contribute to impeding the attachment process before the recombination state occurs.
All spectral lines from +48 kV to +75 kV predominantly begin with the spectral line of O III at 268.615 nm, followed by O III at 286.262 nm and O IV at 300.028 nm, maintaining the channel for approximately 0.26 µs and 0.72 µs, respectively. The excitation temperature of O III at 268.615 nm is approximately 18,000 K, sustaining the channel for a short duration of around 6.3 ns. Interestingly, at +60 kV, the process starts with a higher temperature observed in O IV at 262.999 nm, approximately 26,003 K, with a longer decay time of 2.5 µs compared to others contributing to maintaining the arc channel during the recombination state of the O I line at 777.417 nm, which has a 27 ns decay time. The highest temperature is observed only at +60 kV with the spectral line of O IV at 262.999 nm. The elevated temperature of this spectral line results from oxygen atoms reaching a higher state by absorbing more photons or electrons, which then excite to a higher state before releasing a photon or electron after reaching the decay time. The presence of more spectral lines at higher temperatures leads to increased collisions between electrons and neutral atoms, which correspond to longer-lasting channels dependent on the decay time of each spectral line.
At other applied voltages, the excitation temperature initially sustains the conductivity of the channel for durations of about 0.28 µs and 0.72 µs, which are shorter than the 2.5 µs lifetime observed at +60 kV. These spectral lines reach the critical breakdown voltage necessary to form a conductive channel across the gap. In contrast, at other applied voltages, the temperature initiates a hot channel starting with O III at 268.615 nm, ranging from around 17,000 K to 18,000 K, which is lower compared to O IV at 262.999 nm at 26,003 K. At +75 kV, the channel is sustained with an increasing voltage, resulting in a higher temperature observed in O III at 270.887 nm with a decay time of 0.26 µs, measured at 15,212 K. The elevated temperatures of the O IV line at 262.999 nm and the O III line at 270.887 nm help maintain the hot channel for around 2.5 µs and 0.26 µs, respectively. This release of Joule heat enhances channel conductivity compared to other applied voltages. Additionally, the longer duration of a high temperature indicates more intense collisions between electrons and neutral atoms, resulting in increased electron production. Consequently, a faster breakdown time of 77 ns is observed at +60 kV due to the contribution of the highest excitation temperature, 26,003 K, of O IV line at 262.999 nm, enhancing and maintaining channel conductivity before recombination occurs.

4.3. Electrical Conductivity of the Channel

In quasi-neutral plasma, the electron density and ion density are nearly identical. Consequently, the intensity of O I at 777.417 nm reflects the total amount of ionized oxygen, corresponding to the total number of electrons within the discharge channel. Thermodynamic equilibrium allows us to use the temperature of an arc discharge as a descriptor of its properties, including the electron density. The electron density represents the number of free dissociated electrons from their respective atoms per unit volume. Electrons play a crucial role in arc discharge processes, as most atomic interactions depend on their presence. Temperature and density computations within arc discharges can be achieved using the Boltzmann plot, two peak method, Saha equation, and Stark width method.
The Saha–Boltzmann equation is an expression that relates the particle densities of two different ionization levels of a gas in thermal equilibrium to the temperature, density, and ionization energies of the atoms. In the present study, the spectra of successive ionization states are used to determine the electron number density within a channel by applying the Saha–Boltzmann equation, as shown in Equations [24,25]:
n e = I i I i + 1 2   ( 2 π m k T h 3 ) 3 2 g i + 1 v i + 1 A i + 1 g i v i A i   e x p ε i ε i + 1 χ k T
where ne is the electron number density (cm−3), I is the line intensity, i represents the ionization state, h is Planck’s constant (eV.s), εn is the excitation energy (eV) of the nth level, k is the Boltzmann constant (eV/K), T is the electron temperature (K), gn is the statistical weight of the level, m is the electron mass (eV), νn is the frequency (s−1) of the emitted photon, and χ is the first ionization energy of the atom (eV). This is only valid when multiple ionization states are present during the early stages of the plasma channel, specifically when singly and doubly ionized lines are observed.
Electrical conductivity, represented by σ, refers to the ability of the air to conduct an electrical current and is correlated with both the temperature and electron density, as calculated in Table 3. Within the heated channel related to an arc discharge, electrical conductivity is predominantly governed by σ C o u l o m b , as described by Raizer and Allen [26,27] in the following equation:
σ C o u l o m b = e 2 N e m v m = 1.9 × 10 4 × [ T e ( e V ) ] 1.5 × l n Λ 1     S m 1
with T e ( e V ) , Ne, Vm, e, and m being the electron temperature in eV, the electron density in cm−3, the effective collision frequency for the momentum, electron charge, and mass of the electron, respectively, and
l n Λ = 13.57 + 1.5   l o g T e ( e V ) 0.5 log N e c m 3
As mentioned earlier, in quasi-neutral plasma, electron density and ion density are nearly identical. Therefore, to observe the impact of the breakdown time for the applied impulse voltages of +48, +54, +60, +66, +72, and +75 kV, we examined the electrical conductivity corresponding to the O I line at 777.417 nm as a representative indicator of electron production accumulation returning to the ground state. Assuming that the discharge is in LTE conditions [18,28,29], equation (1) can be utilized to estimate the electron temperature. The spectral lines of O III at 268.615 nm and O I at 777.417 nm were used to estimate electron density using the Saha–Boltzmann Equation (3). Figure 7 shows the trend of the breakdown time correlated with electron density, electrical conductivity, and temperature for the O I line at 777.417 nm. The calculation results of the estimated electron density and electrical conductivity are tabulated in Table 3.
At +60 kV, the electrical conductivity, the ability of the air to conduct an electrical current during the transition from O III at 268.615 nm to O I at 777.417 nm, was observed at 734 S/m corresponding to a breakdown time at 77 ns with the highest electron density of 3.233 × 1014 cm−3, as shown in Table 3. The highest electron density at 60 kV is attributed to the spectral lines of O IV at 262.999 nm and O II at 306.498 nm, which release electrons through ionization. The high temperature of 26,003 K associated with O IV at 262.999 nm suggests that collisions between free electrons and atoms/molecules inside the channel impede the attachment process. Consequently, the rapid breakdown at +60 kV is primarily driven by the O IV line at 262.999 nm, which maintains the hot channel at this elevated temperature for 2.5 µs, impeding the attachment process before the O III line at 268.615 nm is present. In contrast, although +48 kV also exhibited an estimated conductivity of approximately 742 S/m and an electron density of 3.656 × 1014 cm−3, higher than other applied voltages, its breakdown time of 200 ns is greater than other applied voltages. This indicates that, despite having the highest electron density among the voltages tested, the presence of excited oxygen at +48 kV does not significantly contribute to maintaining collisions between the electrons and neutral molecules needed to release Joule heat inside the channel. This is due to its short decay time of 6.3 ns, which makes the attachment process more dominant, even though the intensity is higher and correlated with the current. This is especially evident when compared to +60 kV with O IV, which has higher kinetic energy. A similar situation is observed at +54 kV, +66 kV, +72 kV, and +75 kV, where the breakdown times are 289 ns, 115 ns, 105 ns, and 102 ns, respectively. The contribution of O IV, with a hot temperature and longer decay time, enhances collisions inside the channel, resulting in higher temperatures that maintain the channel by releasing Joule heat at +60 kV.
Therefore, we conclude that the rapid breakdown time at +60 kV correlates with the dominance of oxygen excitations in the 200–400 nm range, particularly the O IV line at 262.999 nm, which exhibits a temperature of 26,003 K due to its higher kinetic energy and longer decay time. This line releases Joule heat, maintaining high channel conductivity for 2.5 µs before the attachment process and the subsequent recombination process of O I at 777.417 nm, which occurs in 27 ns. These findings are consistent with observations from our previous studies. Our findings align with Naidis’ simulation results [3], illustrating that the transition from streamer to spark in short, uniform air gaps significantly influences the breakdown delay time. This phenomenon is primarily driven by the mean reduced electric field within the gap, influenced by kinetic factors, such as oxygen-excited transitions that contribute to the rapid breakdown within the discharge channel, as discussed in Section 4.1 and Section 4.2. It is evident that the presence of highly excited oxygen during discharge increases electron collisions and production. Electrons can be sustained in the air with minimal loss due to attachment or recombination processes if the hot channel effectively maintains its temperature by releasing Joule heat before breakdown occurs. Therefore, a long decay time with more electrons is necessary to keep the channel hot. This allows electrons to gain energy through collisions and overcome attachment and recombination processes. The impact of higher peak intensities and excitation states in the 200–400 nm range, compared to O I at 777.417 nm, on rapid breakdown times is complex and requires further investigation. Previous research identified two or three spectral lines in the 200–400 nm range above the peak intensity of O I at 777.417 nm, contributing to rapid breakdown with an increasing applied voltage. Meanwhile, in this study, most oxygen excitations appear in the UV band resulting in fluctuating breakdown times. Future works will focus on understanding the role of a single oxygen spectral line within the 200–400 nm wavelength range above the peak intensity of O I at 777.417 nm in influencing rapid breakdown times.

5. Conclusions

Based on our observations during millisecond-duration experiments with positive-impulse voltage discharges at +48, +54, +60, +66, +72, and +75 kV across a 3 cm gap, we conclude the following:
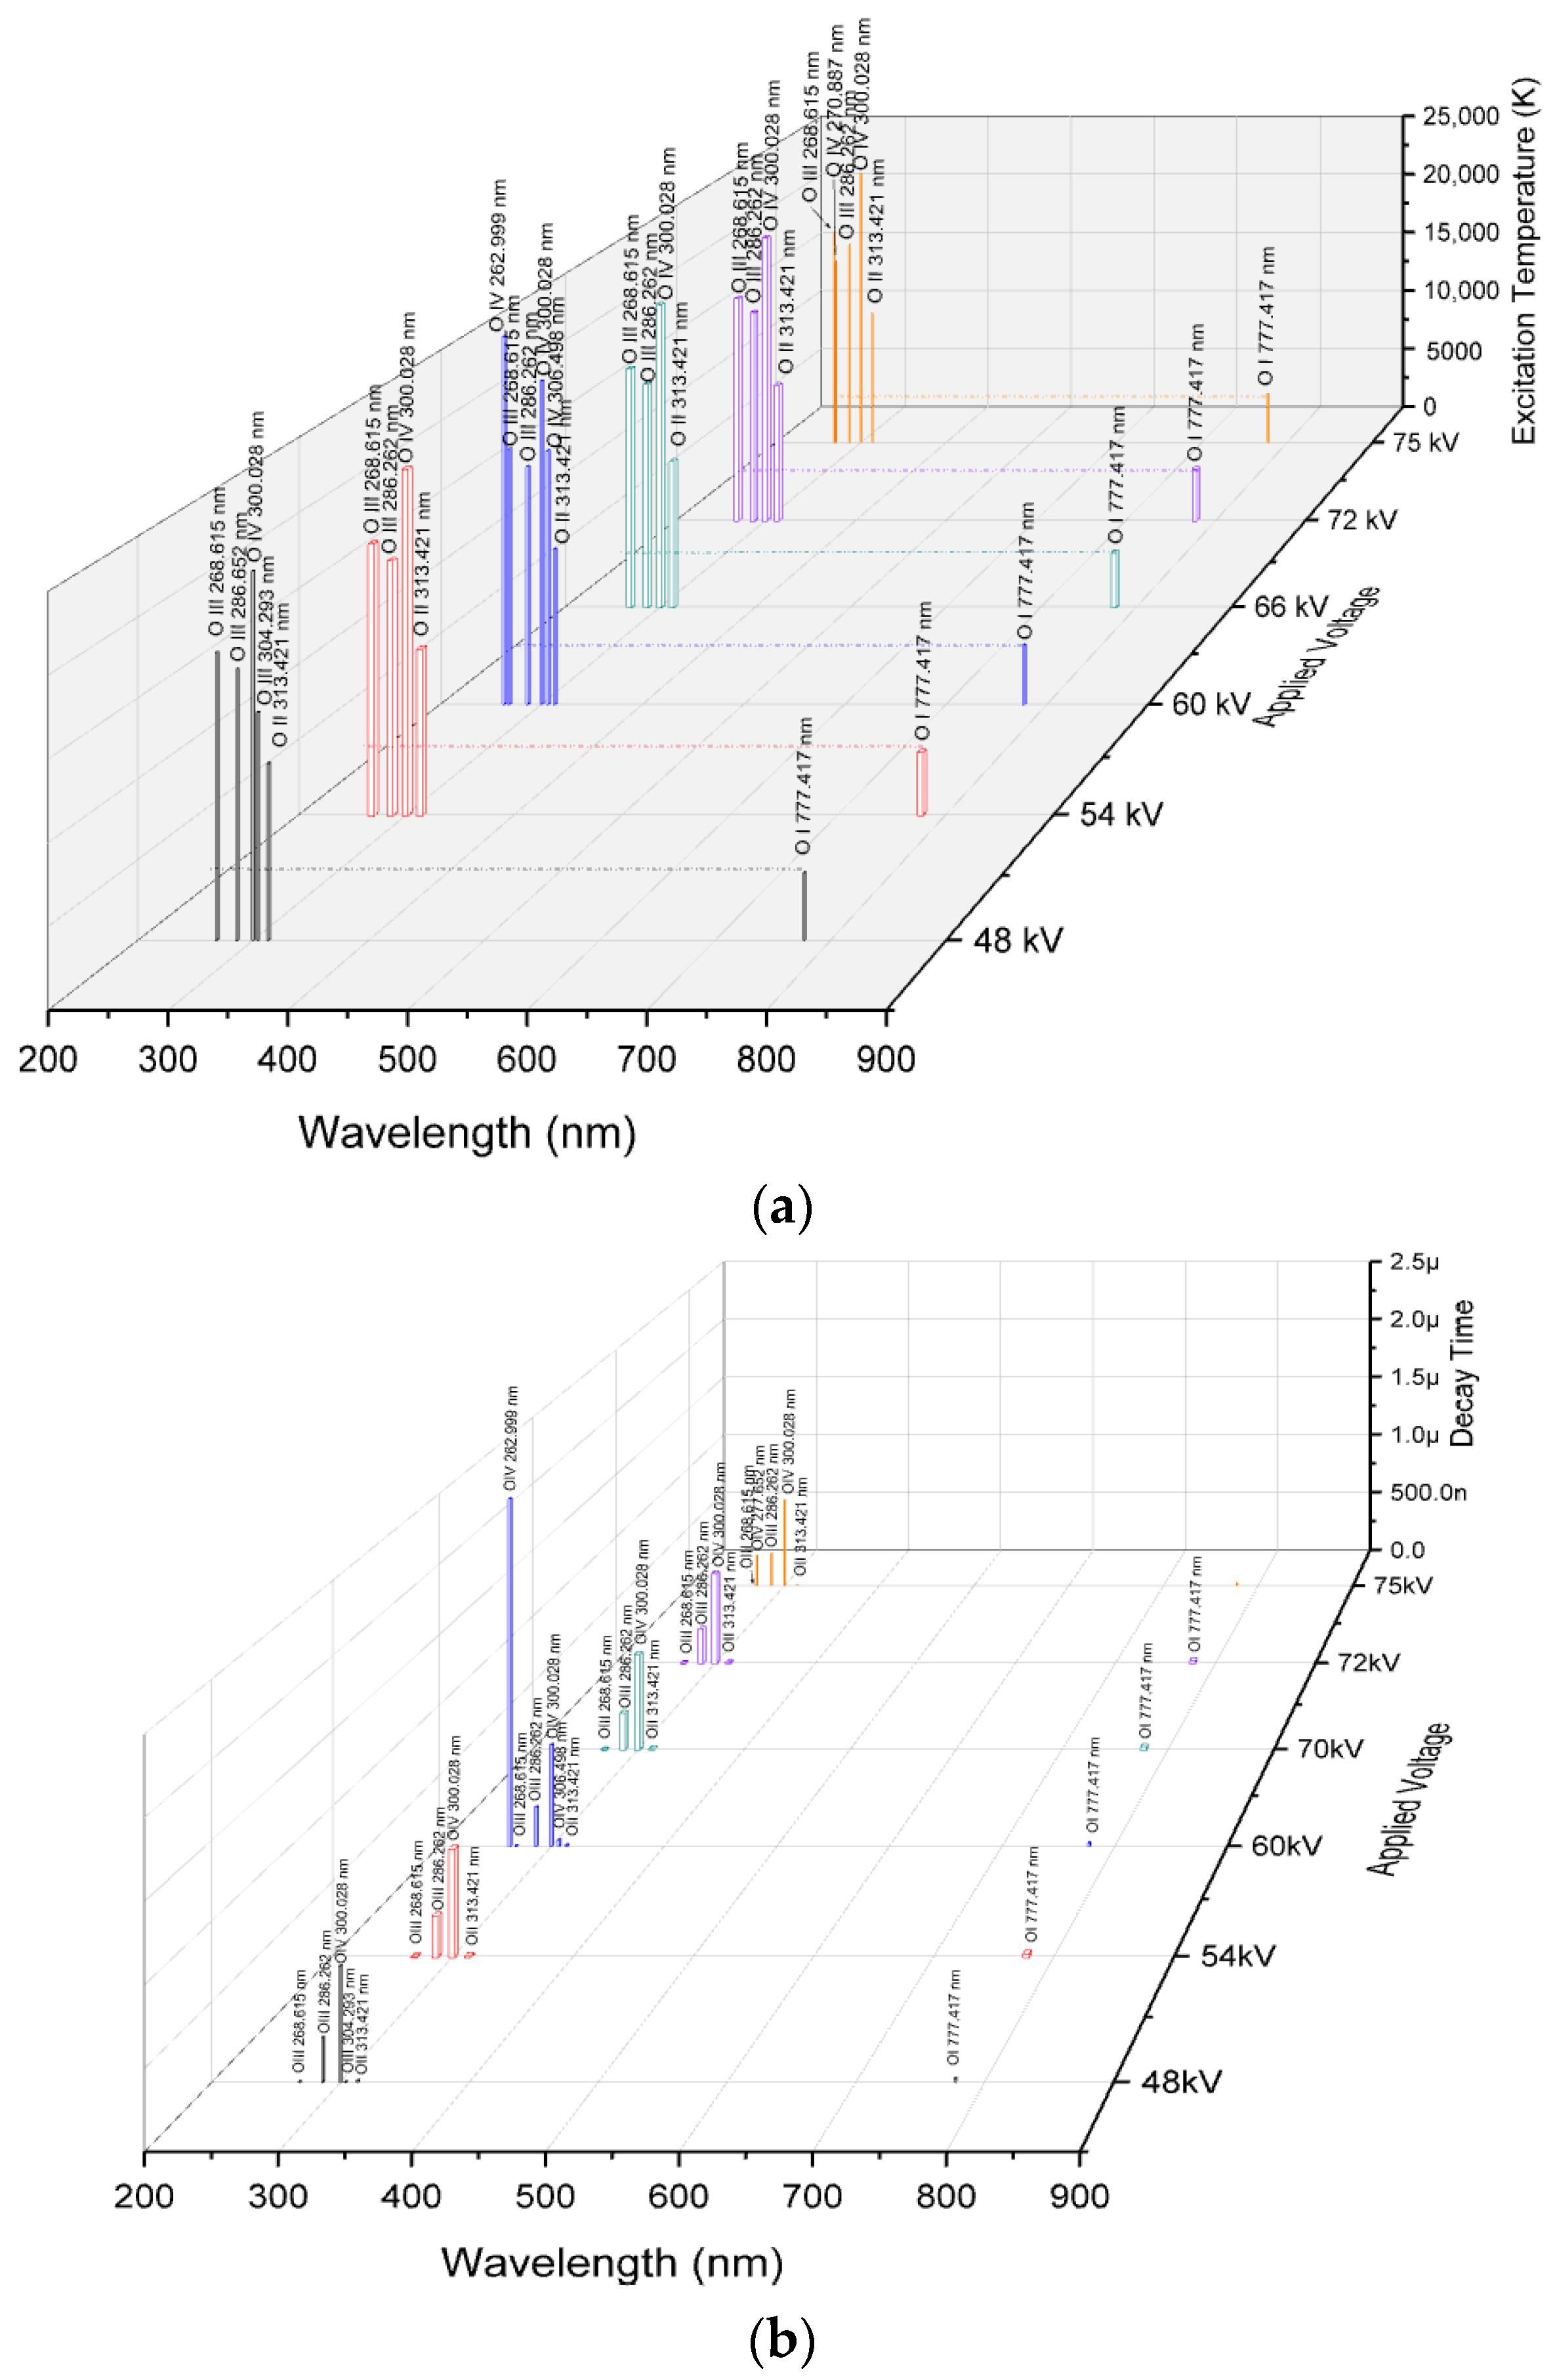
  • Shorter breakdown times can be attributed to the channel conductivity with the increased oxygen excitations observed at +60 kV and +75 kV, compared to other applied voltages. These excitations are particularly evident in the 200–400 nm range, especially in the shorter wavelength region of O IV at 262.999 nm and O III at 270.887 nm at +60 kV, as well as O III at 270.887 nm at +75 kV, due to their higher excited states. In contrast, only two spectral lines, in O IV at 262.999 nm and O III at 270.887 nm, contribute to electron flow within the channel at +60 kV and +75 kV with decay times of 2.5 µs and 0.26 µs, respectively. At +48 kV, even though electron density and electrical conductivity are higher than at +60 kV, electrons do not remain in the air for long because they attach to or recombine with neutral atoms and molecules. The shorter breakdown times at +60 kV and +75 kV are achieved through the dominance of oxygen excitations in the 200–400 nm range, with longer decay times allowing electrons to collide with other neutral atoms and molecules. This facilitates the flow of electrons within the channel to bridge the gap.
  • The higher excitation temperature of O IV at 262.999 nm maintains electrons in the hot channel to impede the attachment process by releasing Joule heat at 26,003 K for a decay time of 2.5 µs before the recombination process of the O I line at 777.417 nm occurs in 27 ns, thus enhancing channel conductivity compared to other applied voltages. Consequently, the elevated excitation temperature in O IV at 262.999 nm, with sustained electron presences, contributes to the fast breakdown time of 77 ns at +60 kV. Meanwhile, at +75 kV, the additional temperature in O III at 270.887 nm sustains hot conductivity for approximately 0.26 µs resulting in a breakdown time of 102 ns.
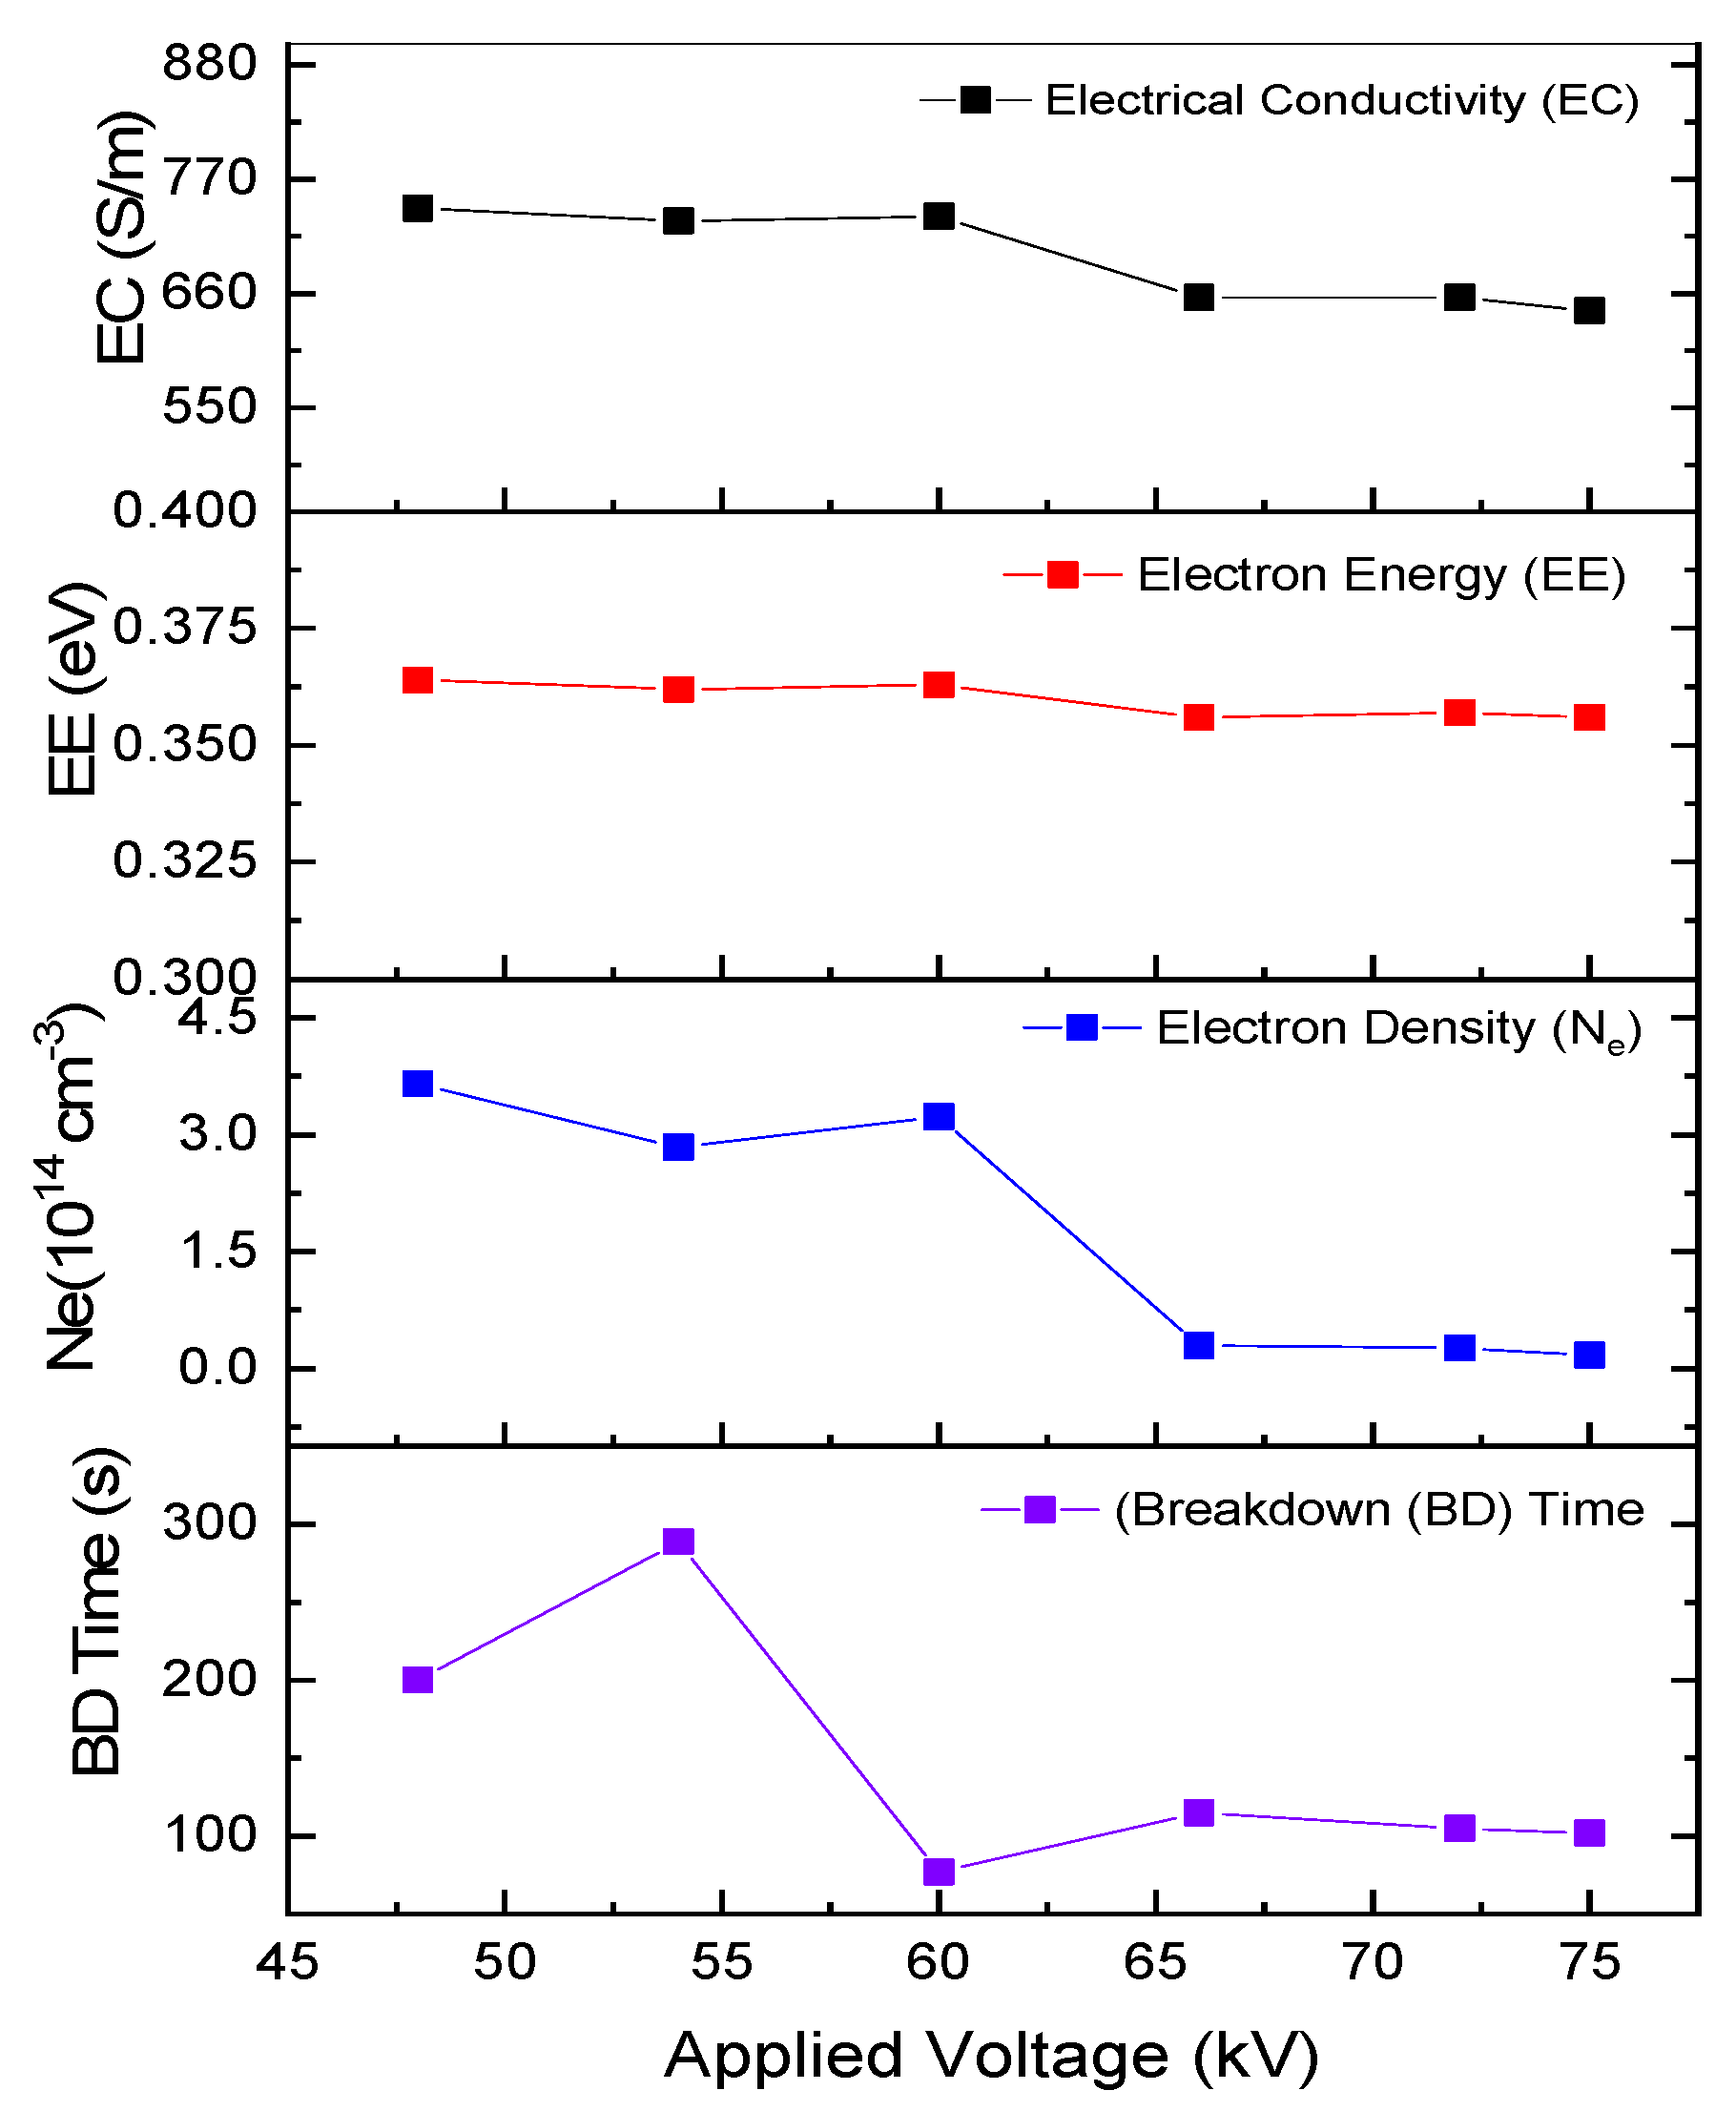
  • Understanding the electrical conductivity, electron density, and electron energy of O I at 777.417 nm helps to elucidate the breakdown time process. Examining the temperature transitions of oxygen within the 200–400 nm range provides insight into how electrons are prevented from being lost due to the attachment process in the air.
  • Increasing the impulse voltage does not guarantee a quick breakdown time. In contrast, at +60 kV, rapid breakdown is achieved due to more intense oxygen excitations, which produce more electrons in higher excited states to maintain the channel through Joule heat. Therefore, O IV at 262.999 nm and O III at 306.498 nm contributed to this effect. The excitation of O IV at 262.999 nm maintains a hot channel at 26,003 K for up to 2.5 µs keeping the electrons energized and enhancing their ability to collide with neutral atoms and molecules thereby preventing the attachment process. Additionally, these oxygen excitations exhibit higher peak intensities in the shorter wavelength range of 200–400 nm than O I at 777.417 nm, which may contribute to the rapid breakdown.

Author Contributions

All authors made valuable contributions to this paper. Conceptualization; methodology; validation; formal analysis; investigation; writing; writing—review and editing. All authors have read and agreed to the published version of the manuscript.

Funding

This research received no external funding.

Data Availability Statement

Data are contained within the article.

Acknowledgments

This work was partly supported and sponsored by ADB AKSI Malikussaleh Univeristy. Senku Tanaka, Kindai University, helped set up devices and contribute to discussions. We also extend thanks to all members of the Remote Sensing Laboratory at Kindai University for their technical assistance.

Conflicts of Interest

The authors declare no conflicts of interest.

References

  1. Ikhwanus, M.; Morimoto, T. Rapid Breakdown Time in Positive Impulse Voltages through Spectroscopy Analysis. Energies 2024, 17, 705. [Google Scholar] [CrossRef]
  2. Naidis, G.V. Simulation of streamer-to-spark transition in short non-uniform air gaps. J. Phys. D Appl. Phys 1999, 32, 2649. [Google Scholar] [CrossRef]
  3. Kieu, N.; Gordillo-Vazquez, F.J.; Passas, M.; Sanchez, J.; Perez-Invernon, F.J. High-speed spectroscopy of lightning-like discharges: Evidence of molecular optical emissions. J. Geophys. Res. Atmos. 2021, 126, e2021JD035016. [Google Scholar] [CrossRef]
  4. Nijdam, S.; Teunissen, J.; Ebert, U. The physics of streamer discharge phenomena. Plasma Sources Sci. Technol. 2020, 29, 103001. [Google Scholar] [CrossRef]
  5. Lowke, J.J. Theory of electrical breakdown in air-the role of metastable oxygen molecules. J. Phys. D Appl. Phys. 1992, 25, 202–210. [Google Scholar] [CrossRef]
  6. Hotta, K.; Iwata, T.; Kojima, H.; Hayakawa, N.; Yanagita, N.; Kato, T.; Rokunohe, T.; Okubo, H. Impulse breakdown mechanism based on discharge propagation process under non-uniform electric field in air. In Proceedings of the Annual Report Conference on Electrical Insulation and Dielectric Phenomena, Cancun, Mexico, 16–19 October 2011; pp. 534–537. [Google Scholar]
  7. Sigmond, R.S. The residual streamer channel: Return strokes and secondary streamers. J. Appl. Phys 1984, 56, 1355–1370. [Google Scholar] [CrossRef]
  8. Marode, E. The mechanism of spark breakdown in air at atmospheric pressure between a positive point and plane. II. Theoretical: Computer simulation of the streamer track. J. Appl. Phys. 1975, 46, 2016–2020. [Google Scholar] [CrossRef]
  9. Naidis, G.V. Dynamics of streamer breakdown of short non uniform air gaps. J. Phys. D 2005, 38, 3889–3893. [Google Scholar] [CrossRef]
  10. Ducasse, O.; Eichwald, O.; Merbahi, N.; Dubois, D.; Yousfi, M. Numerical simulation and comparison with experiment for a positive point to plane corona discharges in dry air. In Proceedings of the ICPIG 2007: XXVIII International Conference on Phenomena in Ionized Gases, Prague, Czech Republic, 15–20 July 2007. [Google Scholar]
  11. Chowdhuri, P.; Mishra, A.K.; Martin, P.M.; McConnell, B.W. The effects of nonstandard lightning voltage waveshapes on the impulse strength of short air gaps. IEEE Trans. Power Deliv. 1994, 9, 1991–1999. [Google Scholar] [CrossRef]
  12. Wu, S.; Wang, L.; Gao, J.; Xie, C.; Liu, L.; Wang, T.; Li, E. Breakdown characteristics of combined air gaps under lightning impulse. AIP Adv. 2022, 12, 035024. [Google Scholar] [CrossRef]
  13. Wu, S.; Wang, L.; Gao, J.; Xie, C.; Liu, L.; Song, B.; Peng, Y.; Liu, J.; Liu, Y. Breakdown voltage characteristics of combined air gaps under negative lightning impulse. Energy Rep. 2022, 8, 1230–1236. [Google Scholar] [CrossRef]
  14. Kip, A.F. Positive-Point-to-Plane Discharge in Air at Atmospheric Pressure. Phys. Rev. 1938, 54, 139–146. [Google Scholar] [CrossRef]
  15. Ono, R.; Takezawa, K.; Oda, T. Two-photon absorption laser-induced fluorescence of atomic oxygen in the afterglow of pulsed positive corona discharge. J. Appl. Phys. 2009, 106, 043302. [Google Scholar] [CrossRef]
  16. Komuro, A.; Suzuki, K.; Yoshida, K.; Ando, A. Characteristics of spatiotemporal variations of primary and secondary streamers under pulsed-voltage in air at atmospheric pressure. Jpn. J. Appl. Phys. 2019, 59, SAAB03. [Google Scholar] [CrossRef]
  17. NIST Atomic Spectra Database Lines Form. Available online: https://physics.nist.gov/ (accessed on 14 June 2024).
  18. Sahin, N.; Tanish, M. Electron temperature estimation of helium plasma via line intensity ratio at atmospheric pressure. Eur. Phys. J. Plus 2020, 135, 653. [Google Scholar] [CrossRef]
  19. Corliss, C.H.; Tech, J.L. Lifetimes of Energy Levels in Neutral Iron. J. Res. Natl. Bur. Stand. A Phys. Chem. 1967, 71A, 567–573. [Google Scholar] [CrossRef]
  20. Boogaard, A.; Kovalgin, A.Y.; Aarmink, A.A.I.; Wolters, R.A.M.; Holleman, J.; Brunets, I.; Schmitz, J. Measurement of electron temperatures of Argon Plasmas in a High-Density Inductively-Coupled Remote Plasma System by Langmuir Probe and Optical-Emission Spectroscopy. In Proceedings of the 9th Annual Workshop on Semiconductor Advances for Future Electronics and Sensors, Utrecht, The Netherlands, 23–24 November 2006; pp. 412–418. [Google Scholar]
  21. Zhou, X.; Dickinson, A.S. Mutual neutralisation of N+ by O− and O+ by O− in slow collisions. Nucl. Instrum. Methods Phys. Res. Sect. B Beam Interact. Mater. At. 1997, 124, 5–11. [Google Scholar] [CrossRef]
  22. Janet, L.; Pralhad, R. Foundations of Pulsed Power Technology; John Wiley & Sons, Inc.: Hoboken, NJ, USA, 2017; pp. 378–383. [Google Scholar]
  23. Amarasinghe, D.U.; Berg, S.M.; Cooray, V. Correlation between brightness and channel currents of electrical discharges. IEEE Trans. Dielectr. Electr. Insul. 2007, 14, 1154–1160. [Google Scholar] [CrossRef]
  24. Walker, T.D.; Christian, H.J. Triggered Lightning Spectroscopy: 2. A Quantitative Analysis. J. Geophys. Res. Atmos. 2019, 124, 3930–3942. [Google Scholar] [CrossRef]
  25. Gangopadhyay, G. Hundred years of the Saha equation and astrophysics. Eur. Phys. J. Spec. Top. 2021, 230, 495–503. [Google Scholar] [CrossRef]
  26. Varo, M.P.; Vázquez, F.J.G.; Sánchez, J.; Kieu, N. Experimental radial profiles of early time (<4 μs) neutral and ion spectroscopic signatures in lightning-like discharges. J. Geophys. Res. Atmos. 2022, 127, e2022JD036553. [Google Scholar]
  27. Raizer, Y.P.; Allen, J.E.; Kisin, V.I. Gas Discharge Physics; Springer: Berlin/Heidelberg, Germany, 1991; pp. 27–30. [Google Scholar]
  28. Hegazy, H. Oxygen spectral lines for diagnostics of atmospheric laser-induced plasmas. Appl. Phys. B 2010, 98, 601–606. [Google Scholar] [CrossRef]
  29. Clark, D.; Carr, D.; Mitchard, D.; Stone, C.; Haddad, A. Spectroscopic techniques for temperature measurement of laboratory generated lightning arcs. In Proceedings of the 20th International Symposium on High Voltage Engineering, Buenos Aires, Argentina, 28 August–1 September 2017. [Google Scholar]
Figure 1. Experimental setup.
Energies 17 04222 g001
Figure 2. The breakdown voltage of the impulse voltage of +48, +54, +60, +66, +72, and +75 kV at a 3 cm gap distance.
Energies 17 04222 g002
Figure 3. Determining of breakdown time of +60 kV at a 3 cm gap.
Energies 17 04222 g003
Figure 4. Breakdown time of the impulse voltage of +42, +48, +54, +60, +66, +72, and +75 kV at 3 cm gap distances.
Energies 17 04222 g004
Figure 5. Spectra of the positive impulse voltage discharge of +48, +54, +60, +66, +72, and +75 kV at a 3 cm gap distance.
Energies 17 04222 g005
Figure 6. Oxygen distribution in the applied voltages of +48, +54, +60, +66, +72, and +75 kV. (a) Excitation temperature; (b) decay time.
Energies 17 04222 g006
Figure 7. The trend of the breakdown time correlated with the electron density, electrical conductivity, and electron energy.
Energies 17 04222 g007
Table 1. The amount of time to bridge the gap at a 3 cm gap.
Applied VoltageBreakdown Time (t3 – t2)
+42 kVNo breakdown occurs
+48 kV(1.280–1.080) µs = 0.2 µs = 200 ns
+54 kV(1.292–1.003) µs = 0.289 µs = 289 ns
+60 kV(0.968–0.891) µs = 0.077 µs = 77 ns
+66 kV(1.019–0.904) µs = 0.115 µs = 115 ns
+72 kV(0.891–0.786) µs = 0.105 µs = 105 ns
+75 kV(0.850–0.748) µs = 0.102 µs = 102 ns
Table 2. Relative intensity and excitation temperature of oxygen distributions based on the applied voltages of +48, +54, +60, +66, +72, and +75 kV.
AtomsWavelength (nm)Relative Intensity (a.u) at a Voltage of Excitation Temperature (K) at a Voltage ofDecay Time (s)
48 kV54 kV60 kV66 kV72 kV75 kV 48 kV54 kV60 kV66 kV72 kV75 kV
(1)(2)(3)(4)(5)(6)(7)(8) (9)(10)(11)(12)(13)(14)(15)
O IV262.999--3238--- -- 26,003---2.5 × 10⁻⁶
O III268.615882862926019747911,81610,804 17,82918,03018,05717,92717,65917,7116.3 × 10−9
O III270.887-----9662 -----15,2120.26 × 10−6
O III286.26214,67412,68214,45915,95225,03021,936 16,81316,88516,82016,77216,55616,6190.28 × 10−6
O IV300.028435338244549537476456671 22,87822,96422,84922,74022,51322,6000.72 × 10−6
O II303.946-19562487284643463586 ------No data
O III304.2932329----- 14,142-----5.2 × 10⁻⁹
O III306.498--3085--- --17,943---46 × 10−9
O II313.421359529683557351961255335 10,98911,05710,99310,99610,80510,1051.3 × 10−8
O I777.41730034740587538607 42274206420941334145412827 × 10−9
Table 3. Estimation of electrical conductivity vs breakdown time for the applied impulse voltages of +48, +54, +60, +66, +72, and +75 kV.
Parameter+48 kV+54 kV+60 kV+66 kV+72 kV+75 kV
Electron Density ( O   I I I 268.615   n m O I 777.417 n m ) (cm−3)3.656 × 10142.840 × 10143.233 × 10142.945 × 10132.644 × 10131.756 × 1013
Electron Energy (eV)0.3640.3630.3630.3560.3570.356
Electrical Conductivity (S/m)742730734656656643
Breakdown time (ns)20028977115105102
Disclaimer/Publisher’s Note: The statements, opinions and data contained in all publications are solely those of the individual author(s) and contributor(s) and not of MDPI and/or the editor(s). MDPI and/or the editor(s) disclaim responsibility for any injury to people or property resulting from any ideas, methods, instructions or products referred to in the content.

