Review

Progress of Gas Injection EOR Surveillance in the Bakken Unconventional Play—Technical Review and Machine Learning Study †

by
Jin Zhao
1,2,
Lu Jin
1,*,
Xue Yu
1,
Nicholas A. Azzolina
1,
Xincheng Wan
1,
Steven A. Smith
1,
Nicholas W. Bosshart
1,
James A. Sorensen
1 and
Kegang Ling
2
1
Energy & Environmental Research Center, University of North Dakota, Grand Forks, ND 58202, USA
2
Department of Energy and Petroleum Engineering, University of North Dakota, Grand Forks, ND 58202, USA
*
Author to whom correspondence should be addressed.
This paper is an extended version of our paper published in Zhao, J.; Jin, L.; Yu, X.; Azzolina, N.A.; Wan, X.; Smith, S.A.; Bosshart, N.W.; Sorensen, J.A. Field Implementation and Sur-veillance of Gas Injection Enhanced Oil Recovery in the Bakken. In Proceedings of the SPE/AAPG/SEG Unconventional Resources Technology Conference, Houston, TX, USA, 17–19 June 2024.
Energies 2024, 17(17), 4200; https://doi.org/10.3390/en17174200
Submission received: 5 July 2024 / Revised: 31 July 2024 / Accepted: 2 August 2024 / Published: 23 August 2024

Abstract

:
Although considerable laboratory and modeling activities were performed to investigate the enhanced oil recovery (EOR) mechanisms and potential in unconventional reservoirs, only limited research has been reported to investigate actual EOR implementations and their surveillance in fields. Eleven EOR pilot tests that used CO2, rich gas, surfactant, water, etc., have been conducted in the Bakken unconventional play since 2008. Gas injection was involved in eight of these pilots with huff ‘n’ puff, flooding, and injectivity operations. Surveillance data, including daily production/injection rates, bottomhole injection pressure, gas composition, well logs, and tracer testing, were collected from these tests to generate time-series plots or analytics that can inform operators of downhole conditions. A technical review showed that pressure buildup, conformance issues, and timely gas breakthrough detection were some of the main challenges because of the interconnected fractures between injection and offset wells. The latest operation of co-injecting gas, water, and surfactant through the same injection well showed that these challenges could be mitigated by careful EOR design and continuous reservoir monitoring. Reservoir simulation and machine learning were then conducted for operators to rapidly predict EOR performance and take control actions to improve EOR outcomes in unconventional reservoirs.

1. Introduction

Enhanced oil recovery (EOR) technologies have been used to restore oil production in conventional reservoirs for decades. To offset the rapid single-well oil production rate and reproduce the success of EOR in unconventional reservoirs, many experimental, modeling, and simulation studies have been performed to understand the fundamental oil recovery mechanisms in these formations with ultralow permeability [1,2,3,4,5,6,7,8,9,10]. In addition, a few pilot tests have been conducted in some of the main unconventional oil plays, including the Bakken petroleum system (BPS), Eagle Ford, and Permian Basin, to examine EOR performance in actual fields. The pilots in the BPS showed that gas injection was the most popular EOR method, and injectivity was not an issue because of the highly connected fractures between wells [8,9,10,11,12,13,14,15,16,17,18]. However, this good connectivity also caused a significant challenge for gas containment (i.e., gas injected into one well rapidly migrated to other wells or unknown regions in the formation) [12,19,20,21]. As a result, pressure could not build up around the EOR wells for gas to penetrate and extract oil from the tight rocks. Therefore, monitoring gas breakthrough behavior in offset wells has become a key factor for operators to control an EOR process.
Various monitoring technologies have been used to detect fluid breakthrough behavior in conventional reservoirs when waterflooding or gas flooding operations are implemented [22,23,24,25,26]. For example, pulsed-neutron logs and seismic surveys are frequently used to detect whether gas has entered a production well or passed a certain location in a CO2-flooding process [25,26,27,28,29,30]. However, such methods usually require days to weeks to interpret the measured data (i.e., these methods do not produce near-real-time data/information). In addition, EOR implemented in conventional reservoirs typically utilizes vertical wells arranged in flood patterns instead of unconventional Bakken reservoir development, which utilizes long horizontal wells (laterals) with 10,000 ft or more of completed lateral. Using conventional production logs, it is challenging to evaluate the flow behavior in long horizontal wells with tens of fracture stages. The complex completion methods for unconventional reservoirs, like the Bakken, combined with reservoir heterogeneity make regular production data (oil/gas/water rates) too noisy to detect gas breakthrough accurately [31].
Tracer testing has been used in the oil and gas industry for many years with a range of applications, including evaluation of reservoir heterogeneity, determination of connectivity between wells/fractures, identification of thief zones (as well as flow barriers) in a reservoir, and estimation of sweep efficiency [32,33,34,35]. The fast evolution of tracer technologies has made tracer testing an important monitoring and surveillance method for field practices, including various EOR operations [36,37]. Various tracers have been developed in the past decades, and different tracers can be used to rapidly identify and characterize the movement of gas, oil, or water, depending on the project requirements [38,39,40].
Since inter-well connectivity is common between hydraulically fractured wells, the goals of this study were to (1) study well interference effects on actual gas injection EOR performance in the Bakken Formation and (2) explore real-time visualization, forecasting, and control methods for improved reservoir surveillance during gas injection EOR. The integration of these pieces—visualizing reservoir surveillance data in real time and rapidly forecasting reservoir performance—constitutes the workflow for gas EOR monitoring in unconventional reservoirs.

2. Technical Review of EOR Surveillance in the Bakken

This section presents a review of reservoir surveillance data generated for previous Bakken EOR pilot tests, which used rich gas, carbon dioxide, surfactant, water, or combinations of these fluids. The operational data were used to screen candidate effective EOR-monitoring methods, which were then applied to an extensive set of reservoir simulation outputs of a reference gas EOR project to evaluate gas breakthrough at offset production wells.

2.1. Overview of EOR Pilot Tests

Table 1 provides general information for the previous pilots, including pilot test time, injectate, operational method, operator/reporter, and state and county (if available). Ten pilot tests were conducted in North Dakota, and two were conducted in Montana [11,12,13,14,15,16,17,18,19,31]. While many different technologies have been developed and applied to monitor the EOR process in conventional reservoirs, comparatively fewer technologies were used in the historical Bakken EOR pilot tests to monitor injection and production behavior. Most of the Bakken EOR pilot studies included monthly production and/or injection rates (oil, gas, and water volumes per month) and well logs. Six pilots had daily production/injection rates, and four pilots had bottomhole pressure (BHP) measurements. Three pilots included gas composition monitoring, and two pilots had tracer testing. The table shows that eight of the pilot tests employed gas injection (propane, rich gas, or CO2), and three successful cases (Case Nos. 8, 9, and 12) were reported with a gas injectate (hereafter, gas EOR) involved. Relatively comprehensive monitoring data were generated in Cases 8, 9, 11, and 12 to analyze Bakken gas EOR processes [31].
Since the main purpose of EOR is to recover oil that is contained in the tight rock matrix, the injectivity of gas becomes a critical factor for designing an effective EOR plan. A series of laboratory experiments have demonstrated that gas (produced gas, CO2, etc.) can permeate the rocks of the Middle Member and Shale Members of the Bakken Formation to increase oil mobility [42,43,44,45,46,47,48,49,50,51,52,53]. However, past CO2 pilot tests in the Bakken showed little to no effect on mobilizing the oil in the rock matrix from an oil recovery point of view [12,54,55,56,57]. Poor conformance control was one of the main reasons that caused ineffective CO2 EOR pilots in the Bakken. The high-conductivity fractures became the main flow paths for the injected CO2 to flow between the inter-connected wells, and as a result, the injected CO2 could not be contained around the EOR well to build up pressure, penetrate the tight rock matrix, and extract oil from there. Clearly, there is a gap between the laboratory experiments and actual field observations, especially for the potential CO2 EOR and storage operations in unconventional reservoirs.

2.2. Case Study 1: CO2 Injectivity Test

To close this knowledge gap between the laboratory/modeling results and field responses, XTO and the EERC conducted a CO2 injectivity pilot (Case No. 8) in the Bakken to test the following hypotheses: (1) CO2 can be injected into an unstimulated Bakken matrix at a high bottomhole injection pressure, and (2) the injected CO2 can interact with the fluids residing in the pore space, wherein the hydrocarbons will be extracted for EOR while part of the CO2 will be trapped in the formation for storage [13]. Besides testing the hypotheses, such an injectivity test can also be used to determine key parameters for designing large-scale flooding or HnP EOR operations in the formation. Different from most of the pilots in unconventional reservoirs, this pilot utilized an existing vertical well that is located in northern Dunn County, North Dakota, one of the core production areas of the BPS. The well penetrated the Middle Bakken member but has not previously produced fluids from this formation. This reservoir condition offered a unique opportunity to test the injectivity of CO2 into the unstimulated Bakken matrix, thereby making the lessons learned from the test directly applicable to gas injection operations that require high BHP to penetrate the tight rock.
As part of the reservoir monitoring process, baseline well logs (Gamma-ray [GR], density [DT-TGS], and pulsed-neutron log [PNL]) were run in the test well to calibrate the formation before performing CO2 injection. The PNL was used to determine baseline fluid (oil, gas, and water) saturations in the zones of interest. The PNL also yielded lithology and estimates of reservoir porosity through the integration of the logging data with Schlumberger’s ELAN petrophysical analysis software. Figure 1 shows the stratigraphy of the Bakken Formation along the wellbore with a completion diagram for the injection operations.
The CO2 injectivity pilot was performed in two individual tests: (1) a small-scale injection test, referred to as the “pretest”, and (2) a larger-scale “main test”. The pretest was a short-duration, low-volume injectivity test to determine the basic reservoir conditions and injection parameters cost-effectively. The results of the pretest were then used to determine the key parameters for the main test, which was used to calibrate the injectivity. Both tests were performed in the same completion interval. The pretest was conducted on 13 April 2017, and some important reservoir and operational data/information were collected through the monitoring system, as shown in Table 2. After obtaining the essential reservoir properties through the small-scale injectivity test, the main injection test was initiated in the Middle Bakken on 24 June 2017.
Table 3 shows the timing and duration of each activity conducted during the main CO2 injection test. The main test included periods of cyclic injection and continuous injection, as well as a brief shut-in period on 27 June to conduct a pressure falloff test, which was then followed by a period of continuous injection until the test was completed.
Bottomhole pressure and temperature data were collected continuously using the downhole gauges and transferred to the surface through the downhole monitoring system. These datasets were crucial components of the efforts to interpret the results of the test. A total of 98.9 tons of CO2 were injected during the main injection test. The well was then shut in for several days so that the injected CO2 would soak into the reservoir. Table 4 shows the statistics for the main injection test. Key operational parameters of the main injection test were continuously monitored through the data collection system:
  • The BHP during continuous injection ranged from 9400 to 9470 psi.
  • The maximum BHP was 9480 psi, which reactived natural fractures around the wellbore.
  • The BHT ranged from 251° to 257 °F.
  • The CO2 injection rate was stabilized between 6 and 12 gpm.
The soaking period of the test began on 28 June and extended into the first 2 weeks of July. Reservoir pressure and temperature were continuously monitored. The well was opened after the soaking period to conduct a flowback test, during which, pressure, temperature, and gas composition were measured, while fluid samples were collected at the surface. The initial BHP on 7 July was at 8740 psi, which was close to the initial reservoir pressure. Gas flowed for 8.5 h, and the BHP had dropped to 100 psi. The composition of the gas started with 100% CO2, and some traces of hydrocarbons were observed in the gas stream in the last 2 h of the first flowback period. The well was shut in again, and the soaking period was extended for another 6 days. The second flowback period began on 13 July, and the BHP was 3116 psi at the start of this flowback period. A mix of CO2 and hydrocarbon gas was produced for 10.5 h, and then oil started flowing to the surface from the well at a rate of approximately an eighth of a barrel/minute. The BHP was approximately 1890 psi when the oil started flowing to the surface. A total of nine bbls of oil was produced in 45 min. Oil, gas, and water samples were collected during this flowback period.
Since the Middle Bakken reservoir is so tight, the rock would not release fluid until the BHP dropped below the bubble point, at which the gas (formation gas and the remaining injected CO2) would essentially “push” the oil to the surface. When the BHP dropped below the saturation pressure, the dissolved gas was released from the oil in the near-wellbore region and rapidly increased the oil volume, providing an additional force that enhanced the transport of fluids from the formation to the wellbore. At the same time, the small tubing size of the wellbore caused higher gas velocities, which temporarily enhanced the transport of fluids from the bottomhole to the surface. However, this effect could not last long as the gas expansion does not propagate deep into the far-wellbore region, where the oil flow is controlled by the tight matrix and the native high reservoir pressure [58]. Also, the reactivated natural fractures would close soon after the BHP dropped below the fracture closure pressure. A postinjection PNL was run in the injection well after the injectivity test was complete to determine any changes in oil, water, or gas saturation that may have occurred as a result of the CO2 injection. Figure 2 illustrates the results of the postinjection PNL, which does not show the migration of CO2 out of the target injection zone, which means the injection test was designed reasonably.

2.3. Case Study 2: Rich Gas HnP Test

Case No. 8 demonstrated the possibility of injecting gas into the tight Bakken matrix and extracting oil from the formation at high pressure. The pilot test bridged the laboratory findings to a vertical well in an actual field. The next step was to extend the vertical well to hydraulically fractured horizontal wells, which are the main means for developing unconventional plays. A cyclic multiwell HnP EOR pilot (Case No. 11) using rich gas was performed by Liberty Resources LLC (Liberty) in Williams County, North Dakota, from July 2018 through May 2019 [14]. Eleven horizontal wells were drilled and completed in the drilling space unit (DSU), and five of them were used for HnP operations, as illustrated in Figure 3. A total of ~160 MMscf of rich gas was injected into the formation through these wells. An extensive monitoring dataset, including daily production and injection rates, BHP, gas composition, and tracer testing data, was generated during the pilot period. Figure 4 shows the change of BHP with cumulative gas injection in the EOR wells.
Generally, BHP increased initially with gas injection and then leveled off after injecting ~13 MMscf of rich gas in most wells. None of the wells reached minimum miscibility pressure (MMP) between the oil and rich gas (~2500 psi) under reservoir conditions. The BHP behavior demonstrated that the injected gas filled the fractures and then rapidly migrated to the depleted pore space around the wells. The tracer analysis confirmed this inference: gas tracer breakthrough was observed in offset wells within 48 h, often followed by increased gas-to-oil ratio (GOR) [14]. The gas production in the puff stages showed that around 91% of the injected gas could be recovered from both the HnP and offset wells. This observation indicated that most of the injected gas migrated to offset wells through fractures instead of building BHP, penetrating the tight rocks, and extracting oil from there in the EOR process.

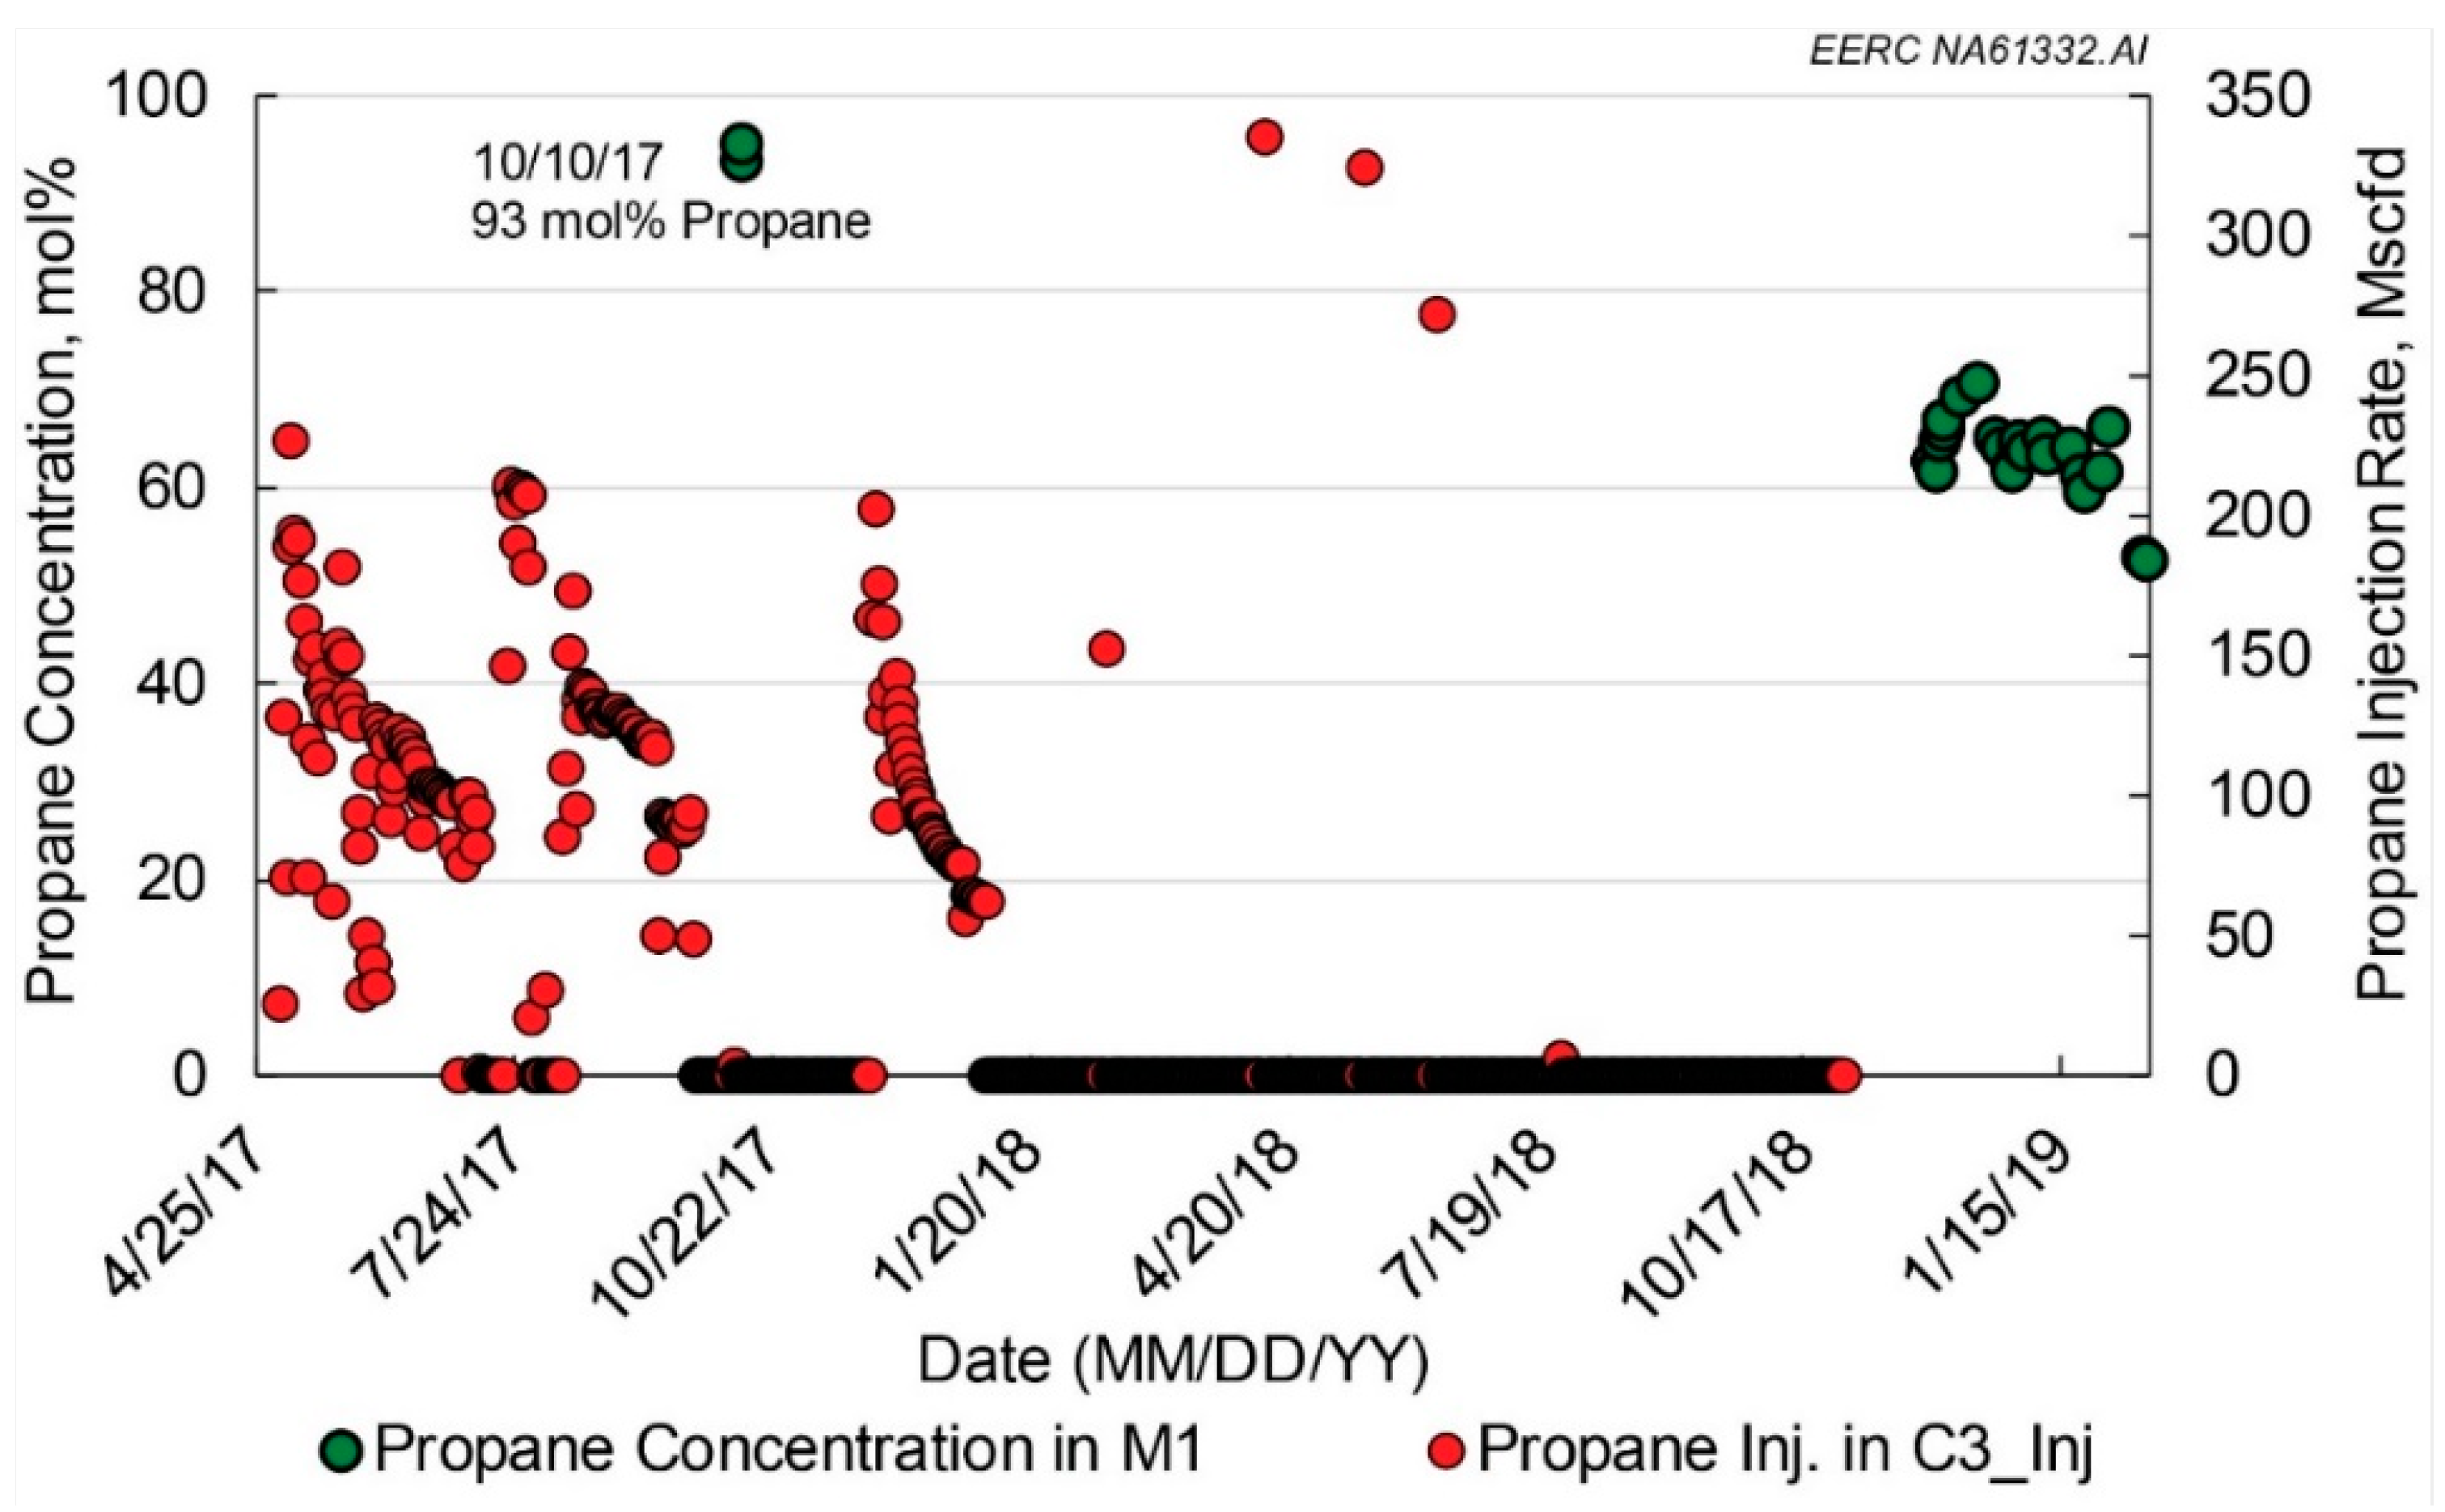
2.4. Case Study 3: Propane Flooding Test

Figure 5 illustrates the distribution of the gas injection well and its offset production wells in the propane EOR pilot test (Case No. 9) conducted in the BPS by Hess Corporation from May 2017 through November 2018. A vertical well, C3_Inj, was used to inject propane, and oil/gas/water production rates were monitored at the offset production wells, M1–M6, which were completed by horizontal laterals with different lengths. Well M1 was the closest production well to the propane injection well, with a distance of around 1000 ft. Compared to massive fracture connectivity in other cases, the fracture connectivity between C3_Inj and M1 was limited in this case. A total of 19.88 MMscf of propane was intermittently injected into C3_Inj from May 2017 through August 2018. The injection rate varied from month to month, as shown in Figure 6. The WHP was maintained between 4200 and 4500 psi, which was much greater than the first miscibility pressure (650 psi) between propane and oil under reservoir temperature (220 °F). Similar to other cases, no injectivity problem was experienced during the injection process, except for some injection interruptions caused by mechanical issues [17,18].
Figure 7 shows the daily fluid production rates (gas, oil, and water) for M1 and the propane injection rate for C3-Inj. As shown in the figure, the fluid production rates did not provide sufficient information to determine when the injected propane breakthrough occurred in the offset production well, M1. In contrast, compositional measurements of the gas stream produced from M1 provided robust signals for gas breakthrough diagnosis. The propane concentration (in mole percentage) in the produced gas stream from a normal Bakken production well is usually below 20 mol%, based on many pressure, volume, and temperature reports collected from the BPS. This concentration can be relatively stable for a long time during the normal production process. Accordingly, a propane concentration in the produced gas stream of an offset well that is significantly higher than 20 mol% could be a clear signal of propane breakthrough.
Figure 8 demonstrates how the propane concentration changed in the produced gas stream of M1 during the monitoring period. The data showed that the propane concentration exceeded 93 mol% on 10 October 2017, which clearly indicated that the injected propane had breakthrough to the M1 well as most of the produced gas was propane. Since 19.88 MMscf of propane was injected into the formation near M1, the propane production from this well lasted for months after injection operations ceased in C3_Inj. The prolonged high-concentration propane production in M1 also showed that the injected gas could be contained in the target reservoir volume for a long time when the EOR wells were selected properly (e.g., limited connectivity between wells).

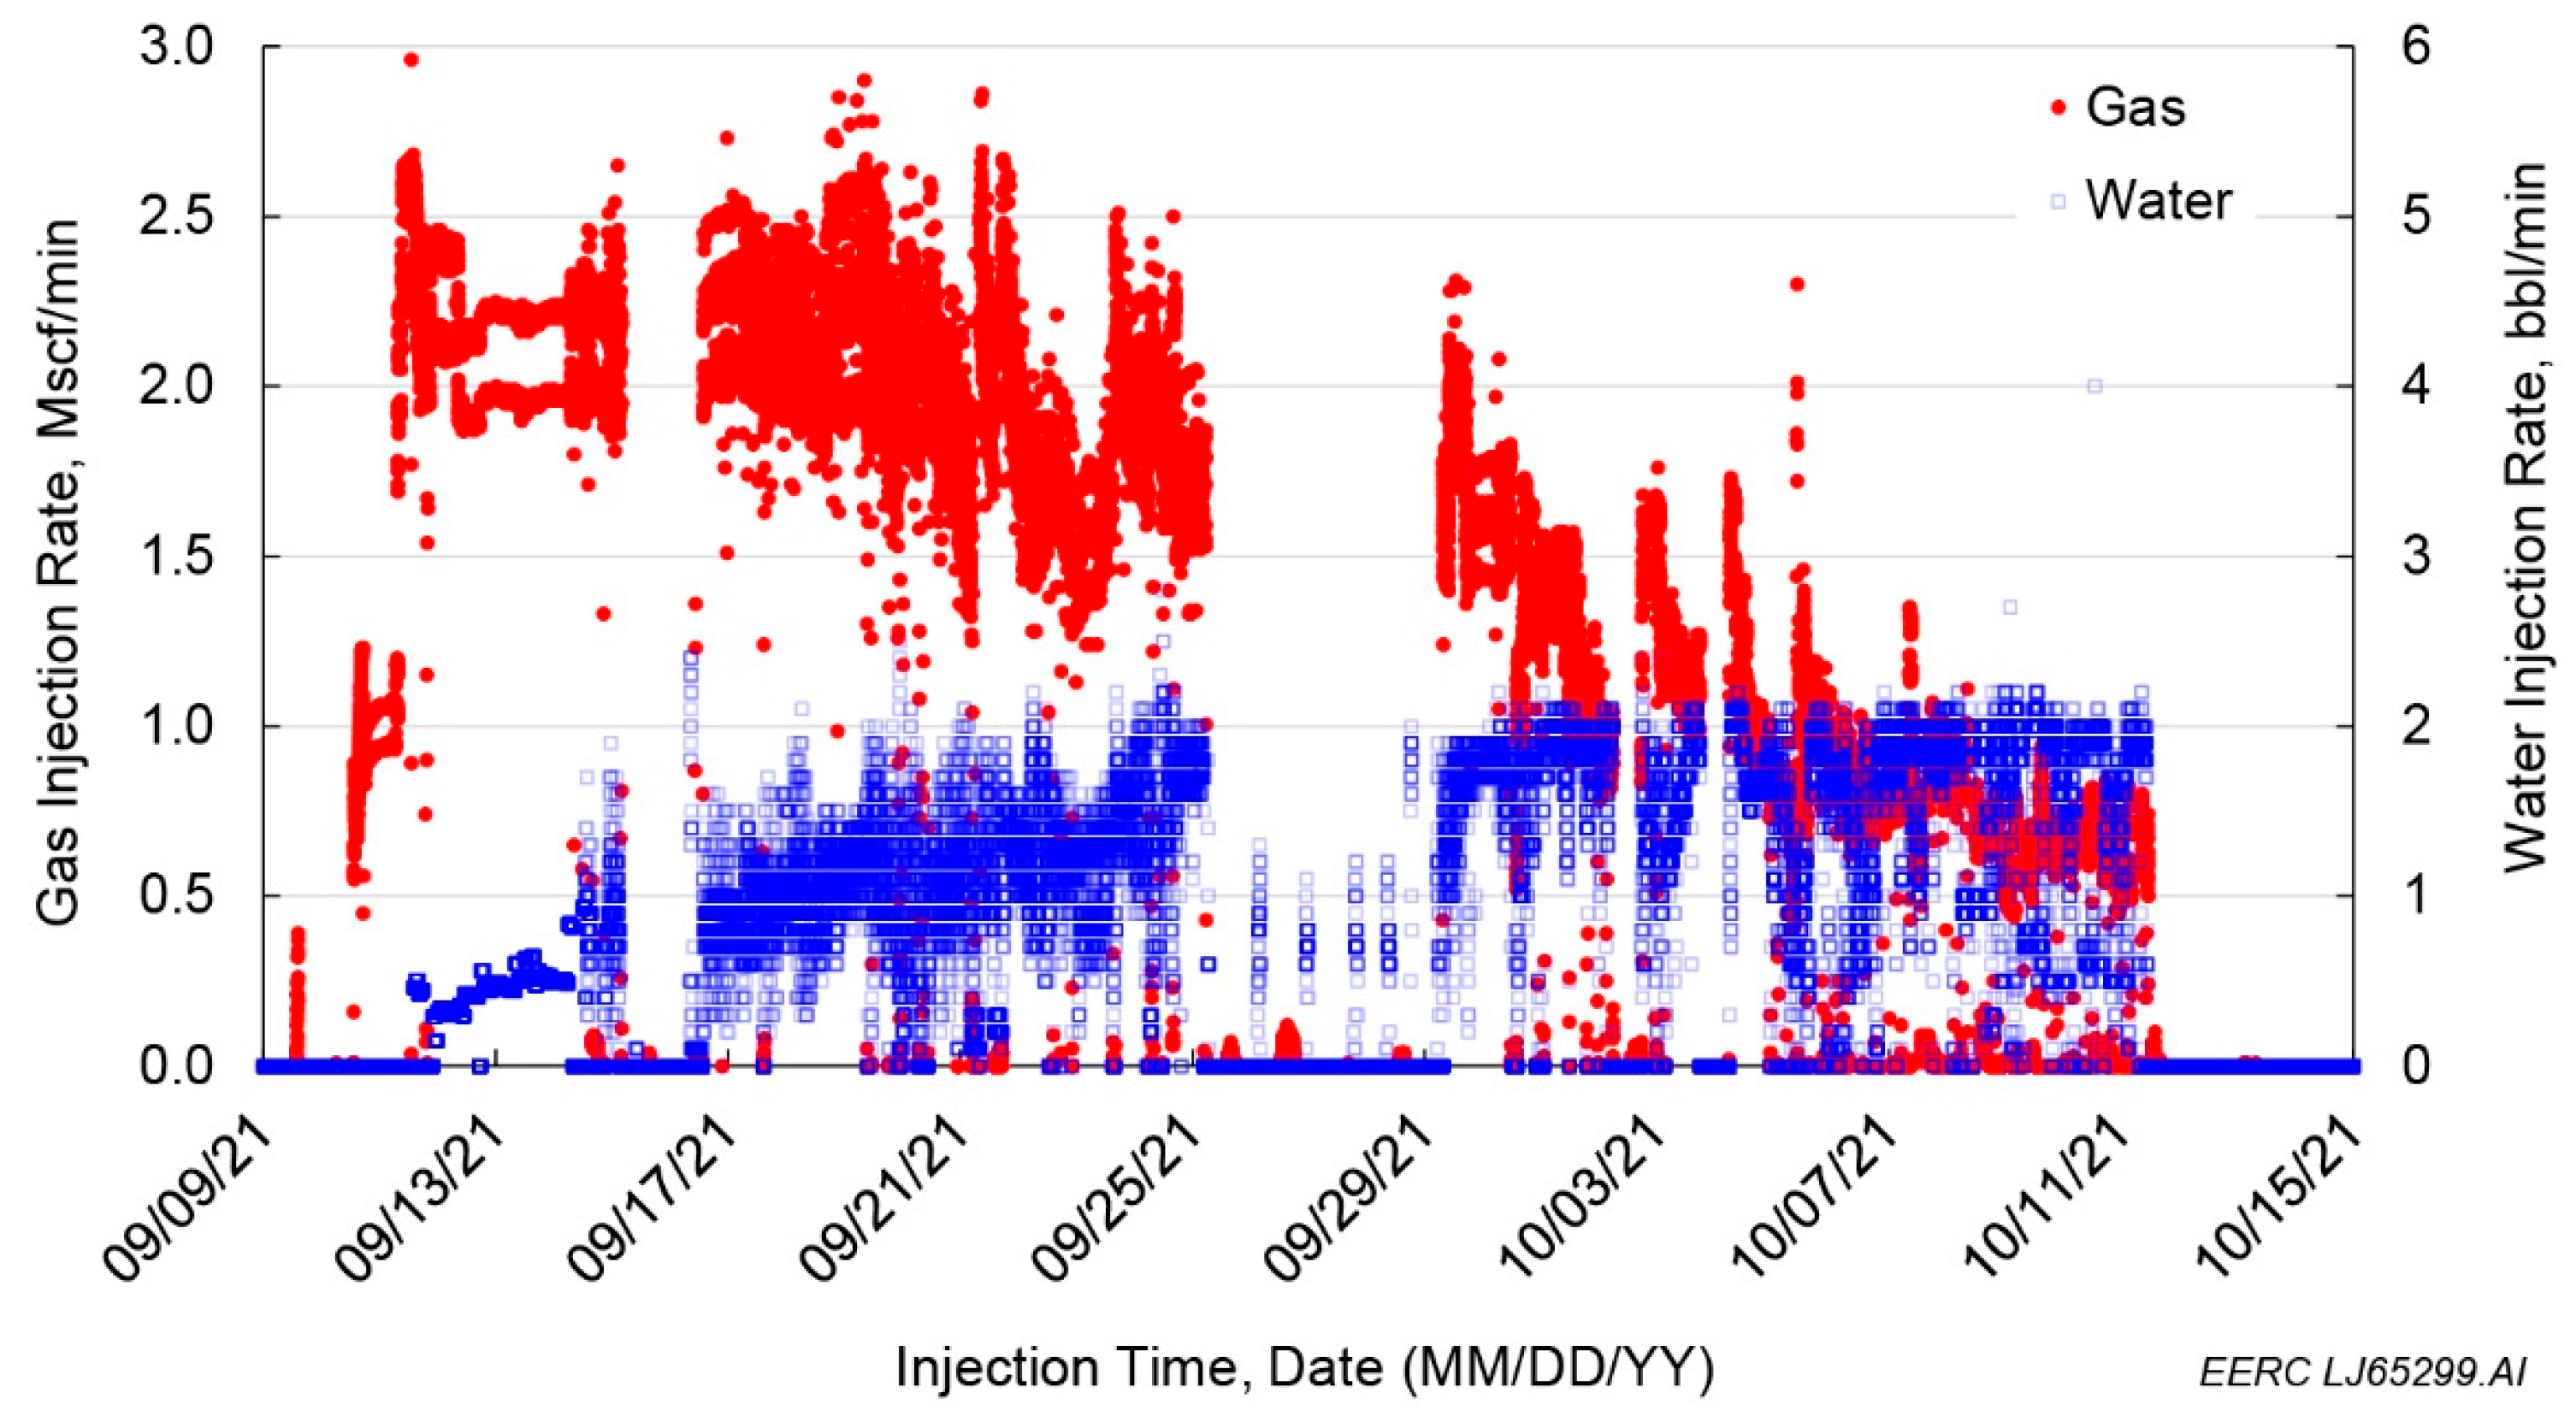
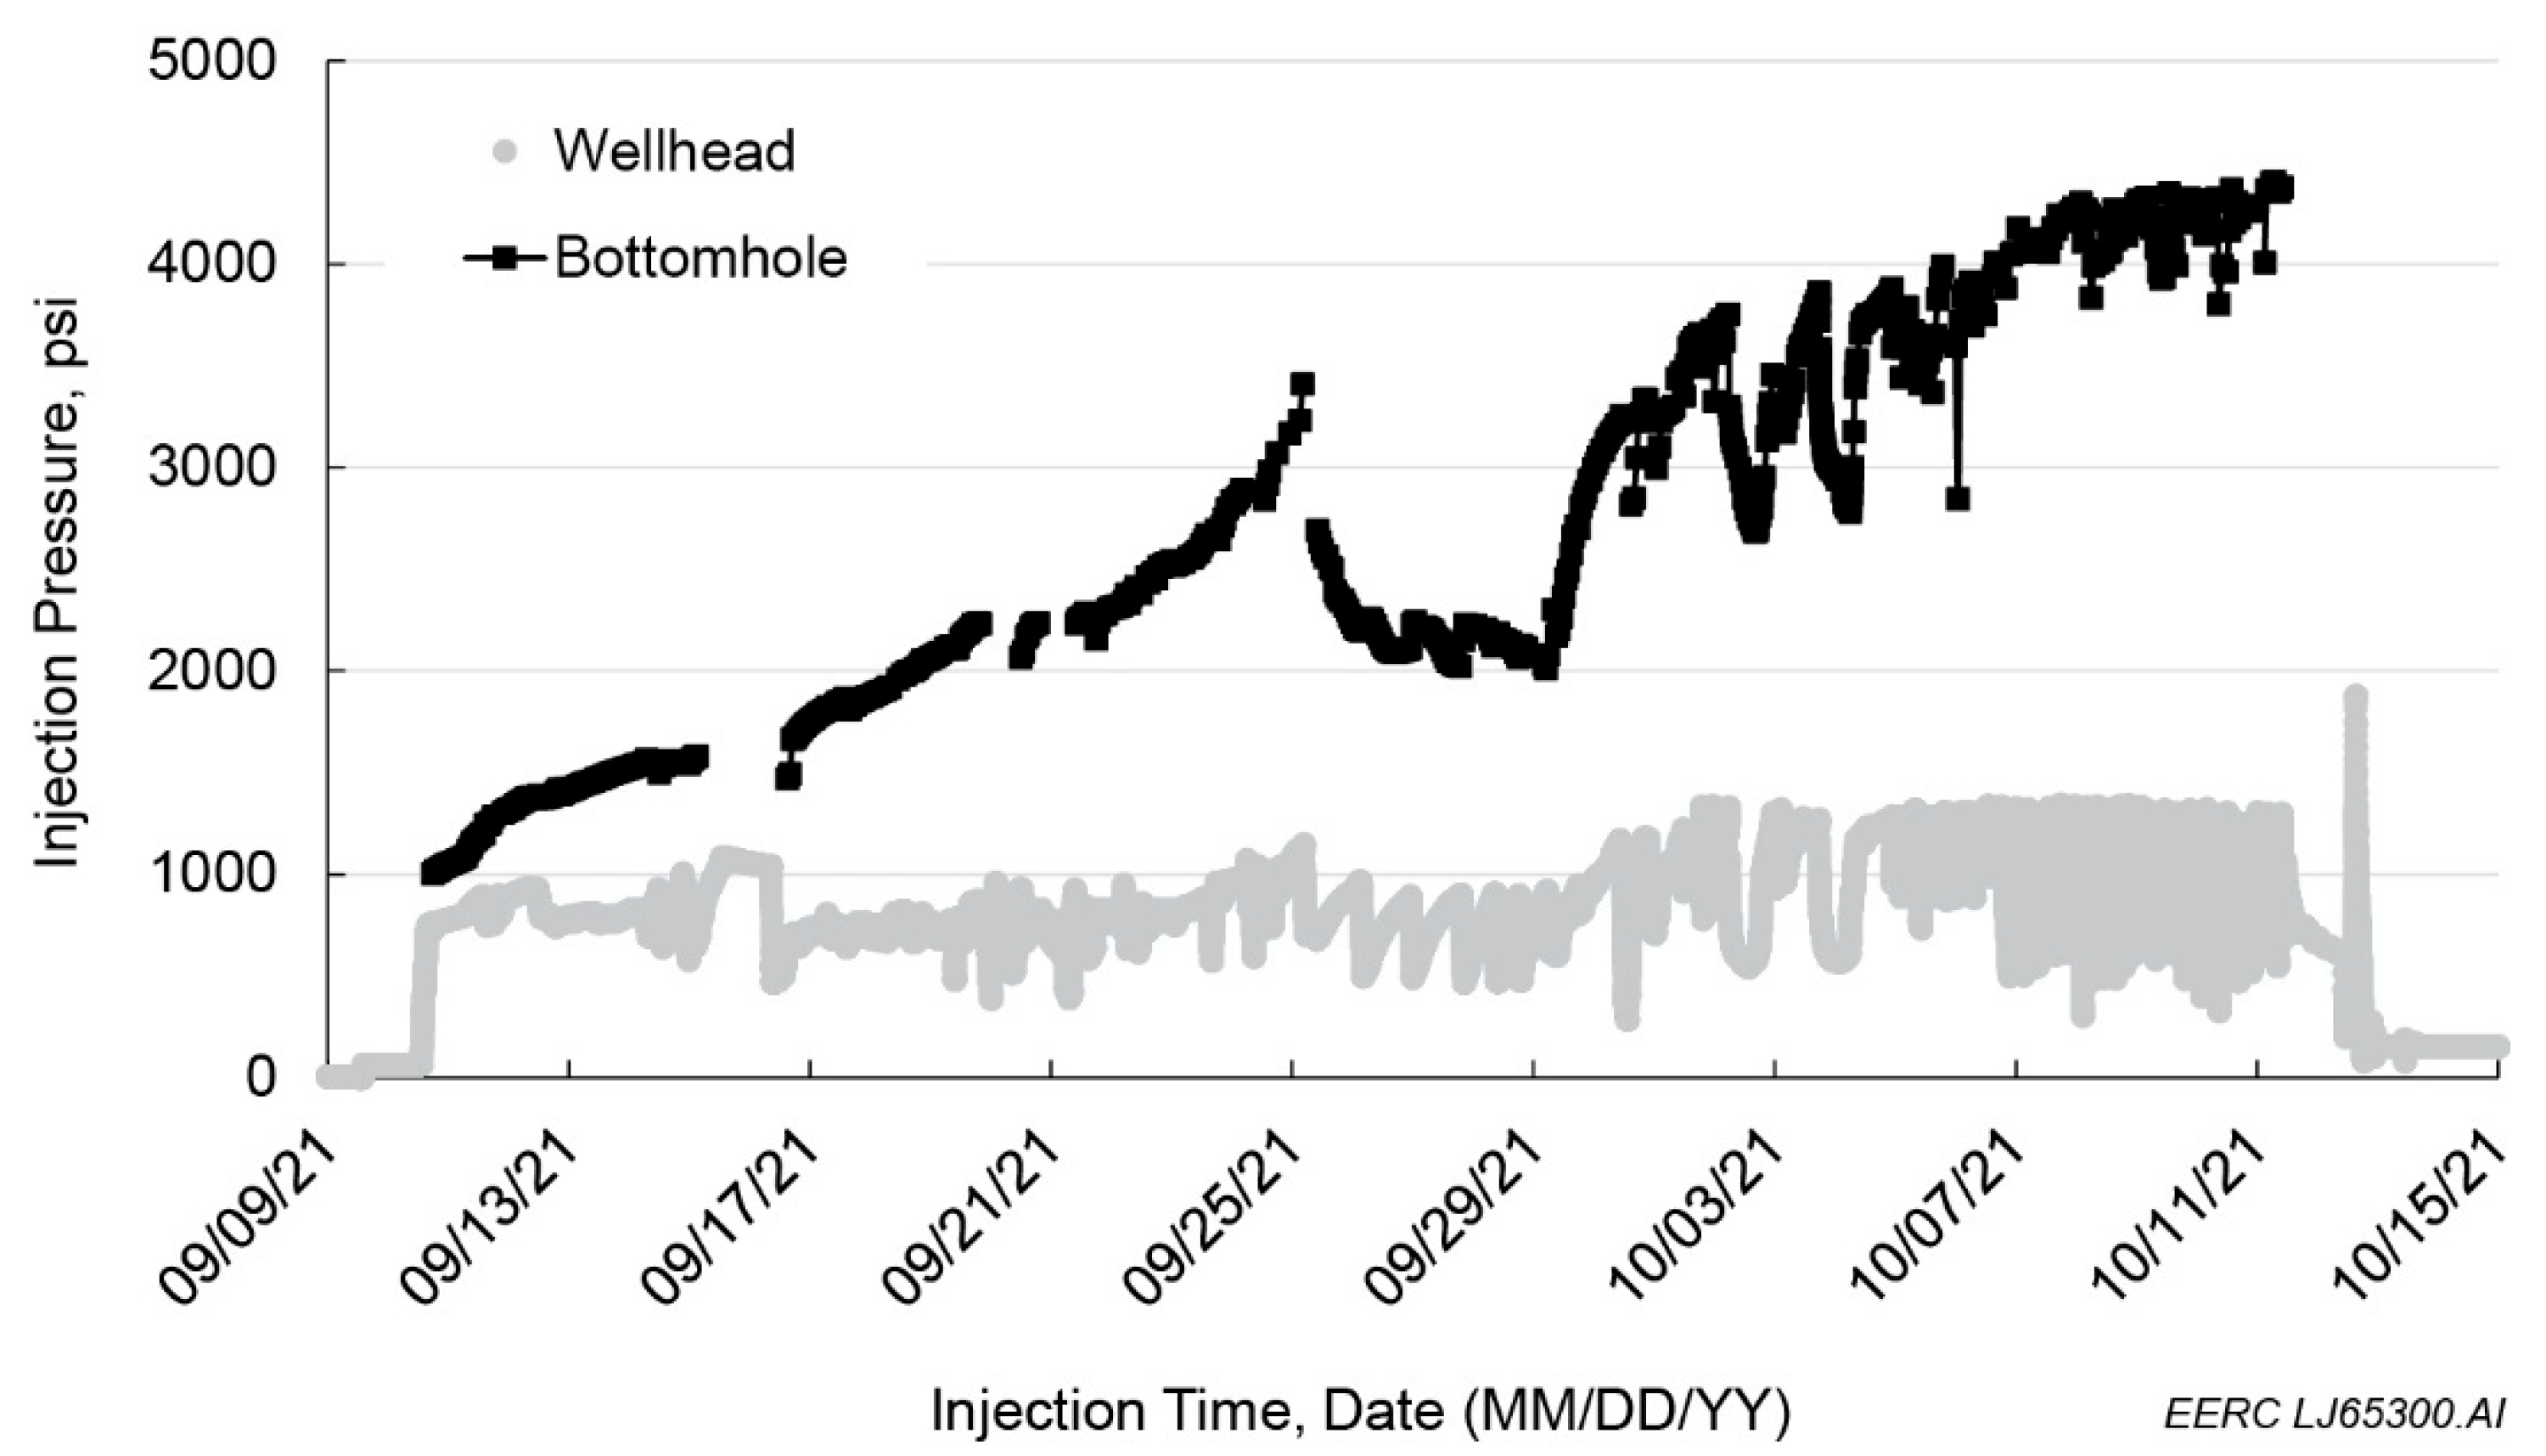
2.5. Case Study 4: Rich Gas–Water–Surfactant HnP Test

In 2021, Liberty performed a single-well HnP pilot (Case No. 12) using rich gas, water, and surfactant in a 2560 acre DSU in Mountrail County, North Dakota [15]. Based on experience from the previous rich gas HnP pilot (Case No. 11), this pilot was specifically designed to (1) build BHP to inject gas at low surface pressures and improve gas conformance in the reservoir, (2) repressure the reservoir above MMP around the HnP well, and (3) use a surfactant to improve EOR performance through changing rock wettability and reducing interfacial tension between the reservoir fluids and the injected EOR agents.
Figure 9 illustrates the arrangement of wells for the pilot test: the middle well (10 MBH) was selected for HnP operations, two offset wells (1 TFH and 4 TFH) were used as the main monitoring wells, and the remaining four wells (1 MBH, 2 TFH, 3 MBH, and 4 MBH) were used as monitoring and boundary wells. The monitoring wells were produced continuously during the pilot to limit possible migration of the injected fluids out of the DSU. A supervisory control and data acquisition system was employed to collect high-frequency rate and pressure data in the HnP well. The pilot test was performed with one cycle of injection from 10 September 2021 through to 11 October 2021, followed by regular production operations. A total of 46 MMscf of gas, 40,000 bbl of water, and 2400 gallons of surfactant were injected into the HnP well during the injection cycle.
A new injection technology called the rapid-switched, stacked-slug (RSSS) system was utilized to perform water–gas coinjection. The technology could boost BHP to the desired level effectively while considerably reducing the requirement of surface injection pressure. This was a significant advantage for EOR applications in fractured reservoirs compared to traditional gas compression along with the addition of surfactant. Figure 10 shows gas and water injection rates at 10 MBH during the injection cycle. The gas injection rate was relatively stable in the first 2 weeks and then decreased gradually. The water injection rate showed a different trend, gradually increasing in the first 2 weeks and then stabilizing. WHP and BHP response is illustrated in Figure 11. The injection increased BHP from 1000 to 4500 psi, while WHP was maintained at around 1000 psi. This clearly demonstrated the effectiveness of the RSSS system for raising BHP without requiring high WHP during the injection process.
Gas and water production rates were closely monitored in the offset wells to observe the breakthrough of injected fluids into these wells. Once gas breakthrough was detected in an offset well, the RSSS system could rapidly adjust the water-to-gas ratio (WGR) in the HnP well to prevent large gas production increases in the offset wells. The high WGR greatly reduced the mobility of the injected fluids in the fractures so that the injected gas could be contained in the near-injection well area instead of flowing through the fractures and produced through the offset wells, as observed in Case No. 11. Figure 12 shows the gas and water production rates in 1 TFH in the HnP process. A minor gas breakthrough was observed in the well, but the conformance issue was effectively controlled by increasing the WGR in the HnP well. This observation indicated the potential of the RSSS technology to solve the conformance control issue, which is one of the most critical challenges for EOR in unconventional reservoirs.

3. Simulation Model for EOR Monitoring

Premature gas breakthrough and poor conformance control caused by well interference have been identified as two of the most critical factors for underperforming gas EOR tests in the BPS, which was illustrated in Case No. 11. The well interference effects were also widely observed and reported in hydraulic fracturing and hydrocarbon production processes in other unconventional plays across the world [59,60,61,62,63,64,65,66,67,68,69]. Case No. 12 showed that these issues could be mitigated by closely monitoring injection and production behavior in the EOR process and acting quickly after the detection of gas breakthrough. For gas EOR without water injection, tracer and/or injection gas composition analysis could efficiently detect premature gas breakthrough in offset wells, as demonstrated in Case Nos. 9 and 11. Since it is challenging to mimic well interference in a lab, reservoir simulation becomes an essential tool to investigate this phenomenon [61,62,63,64,65,66,67,68,69]. Therefore, reservoir simulations were performed in this study to investigate gas EOR monitoring in a Bakken DSU.

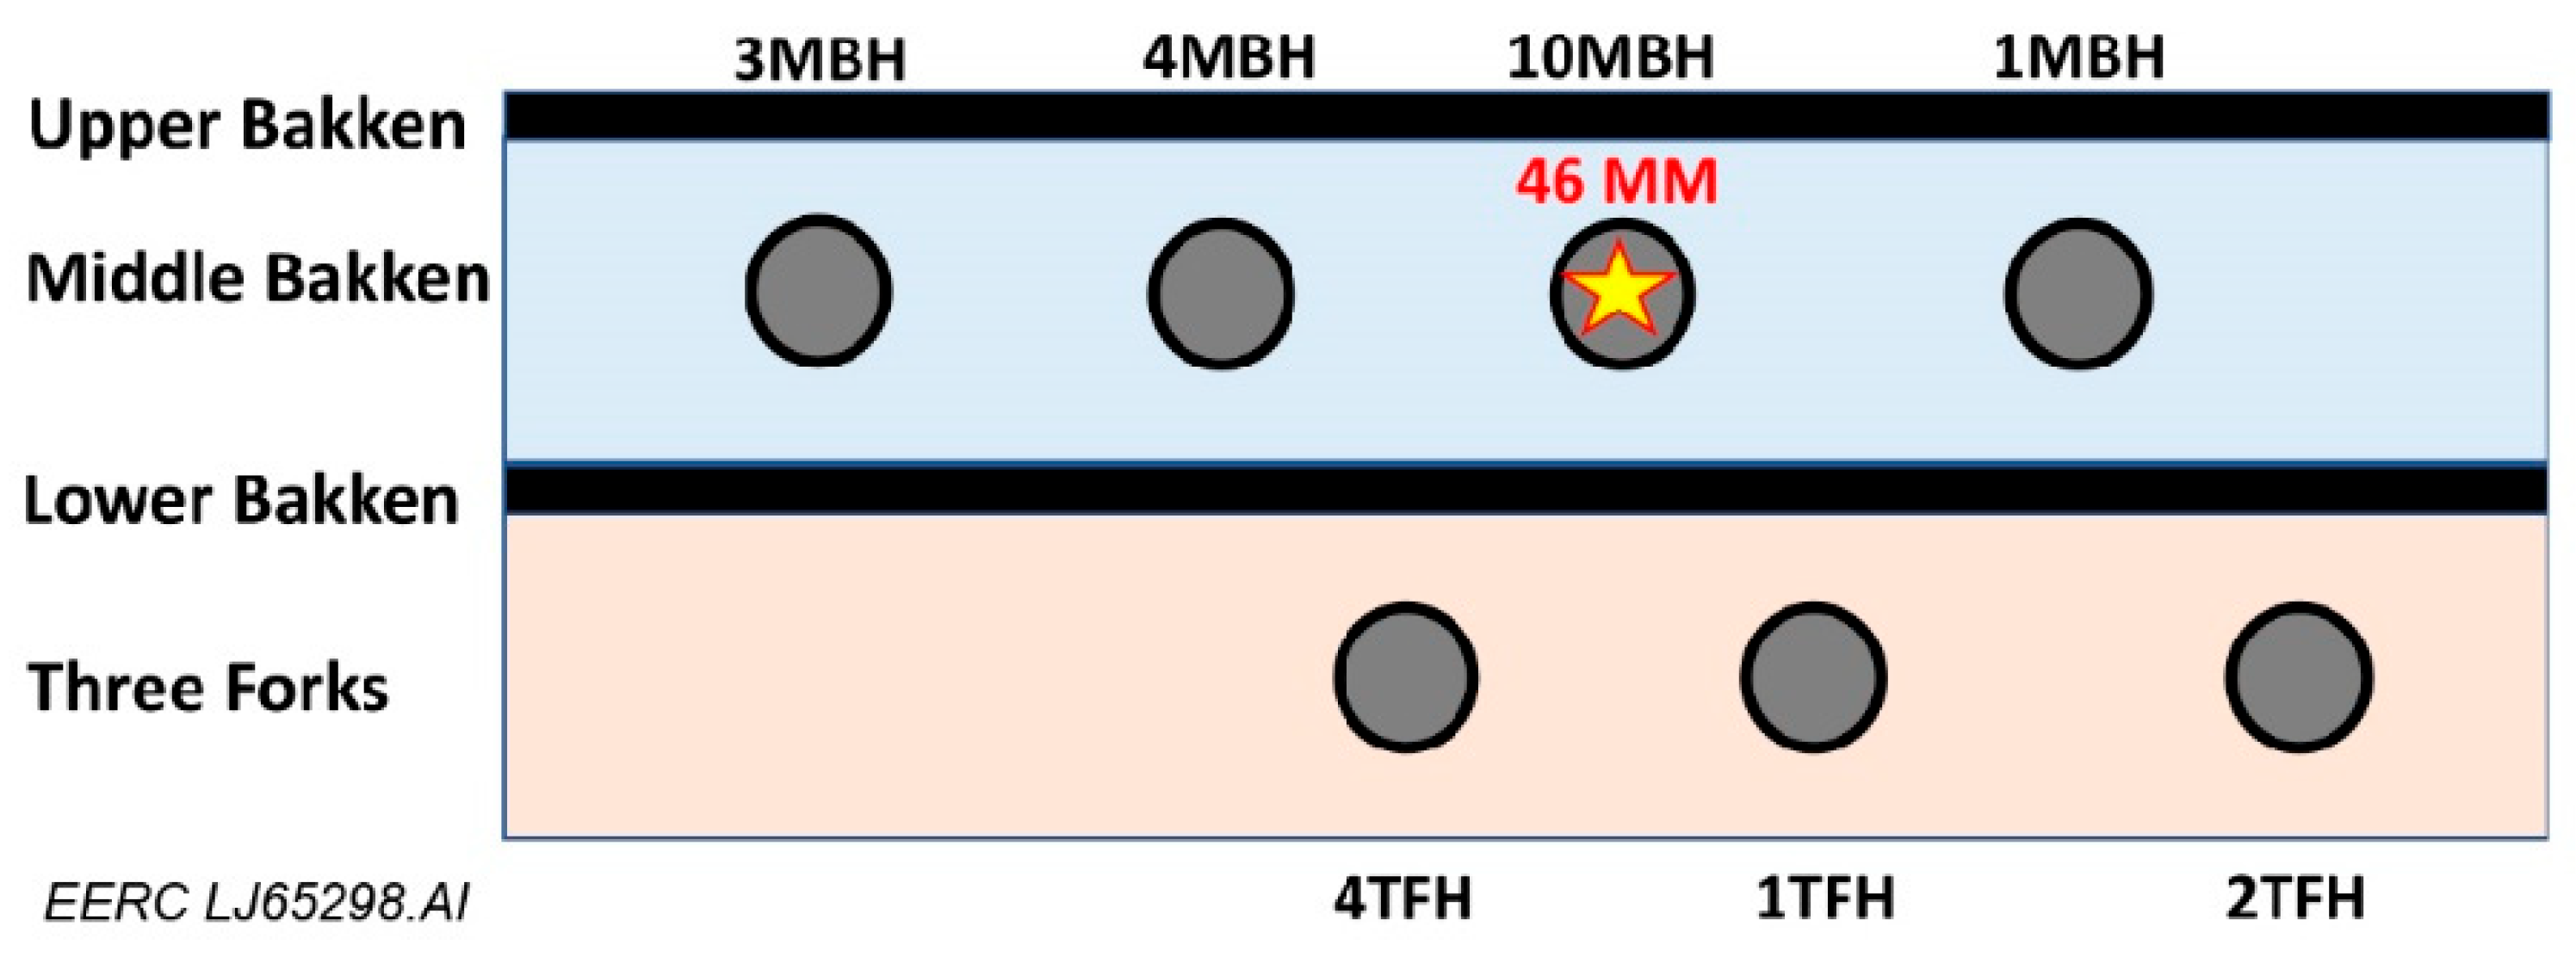
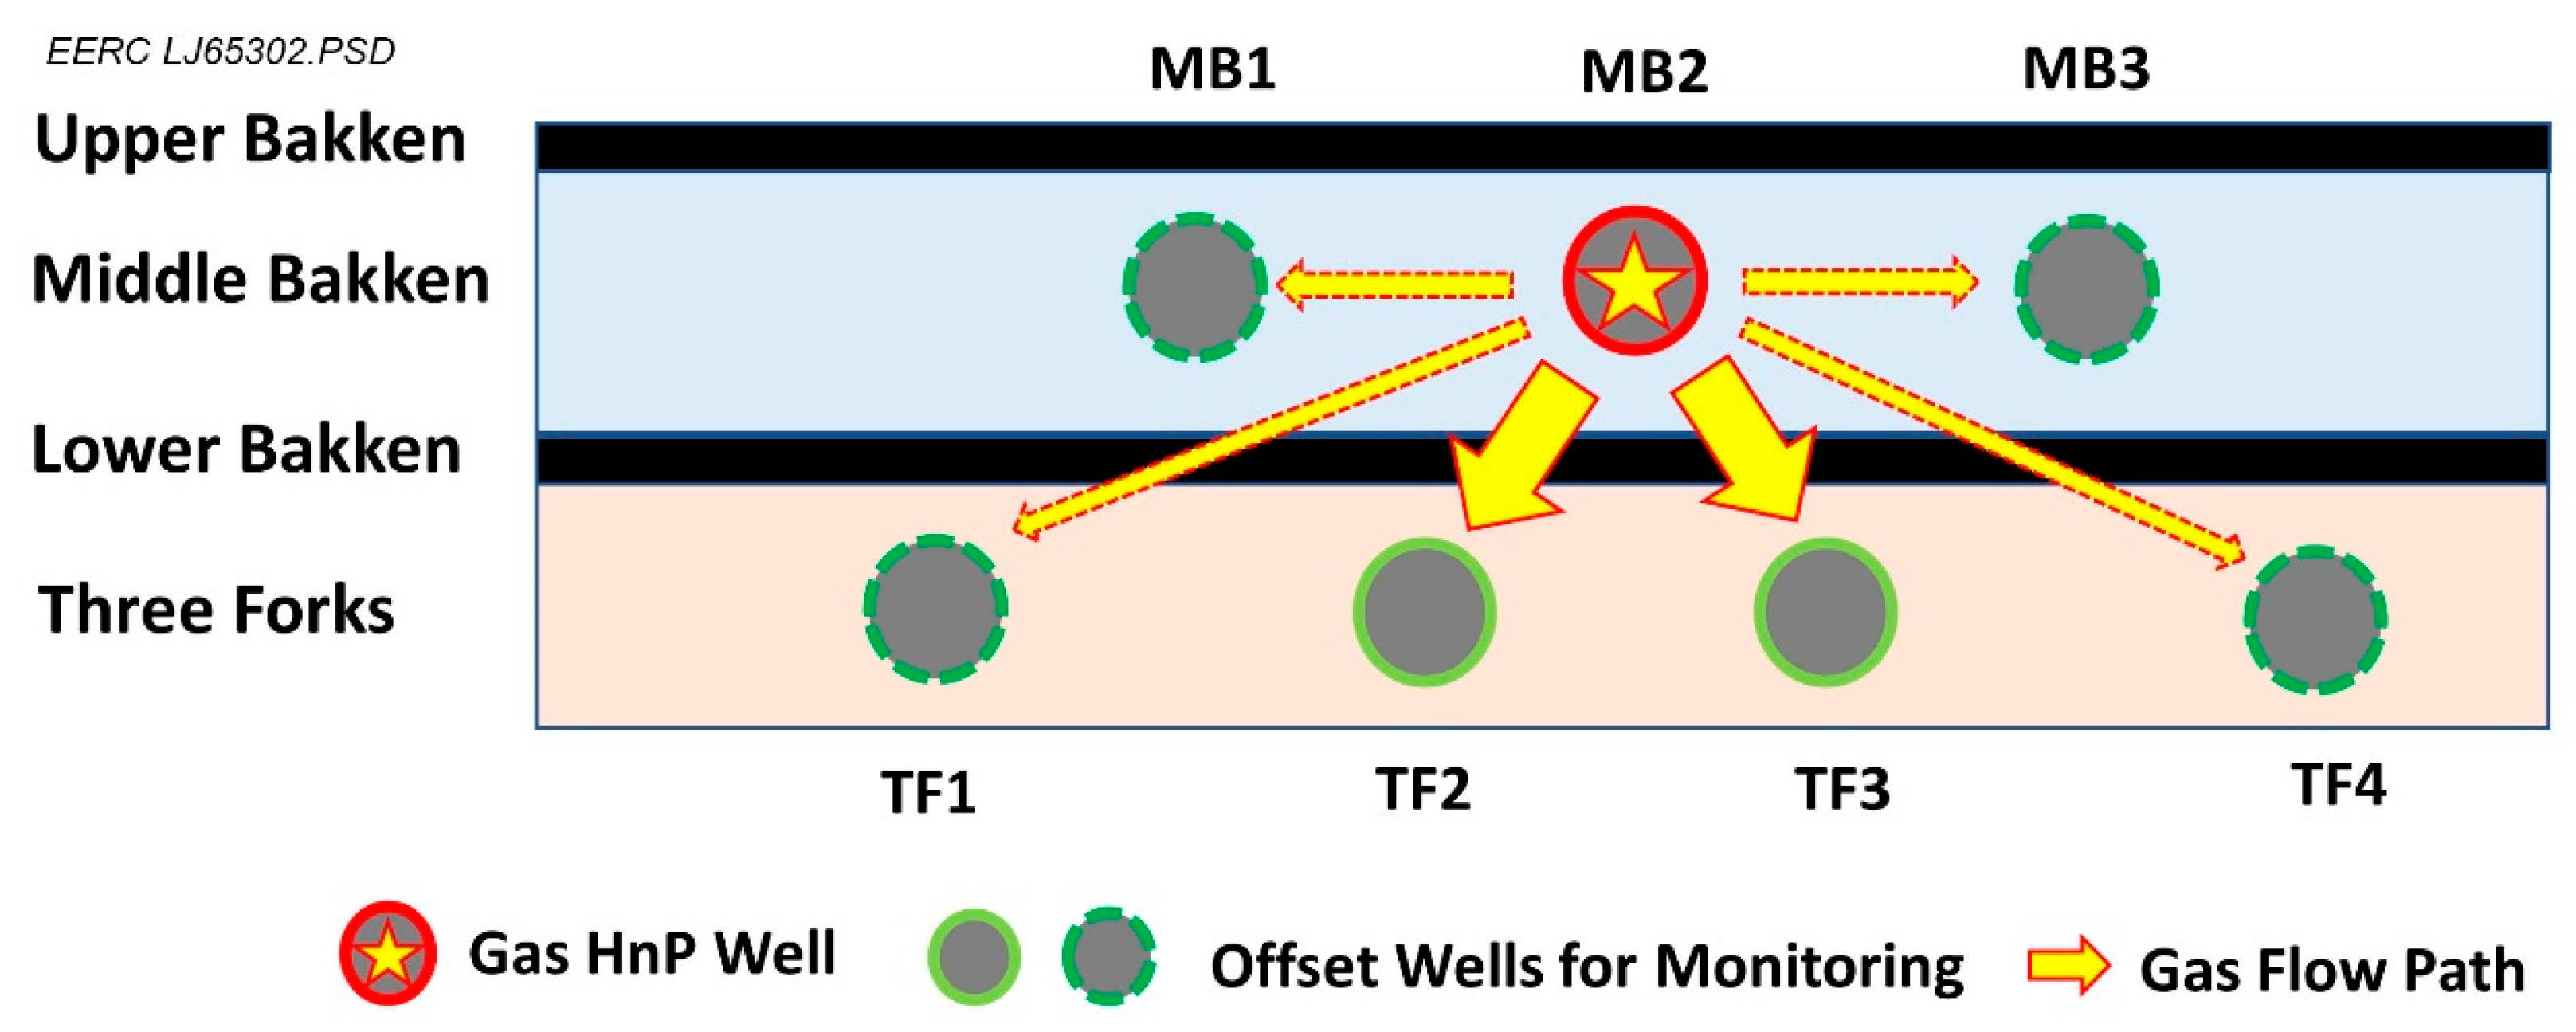
3.1. Baseline Model of a Seven-Well DSU
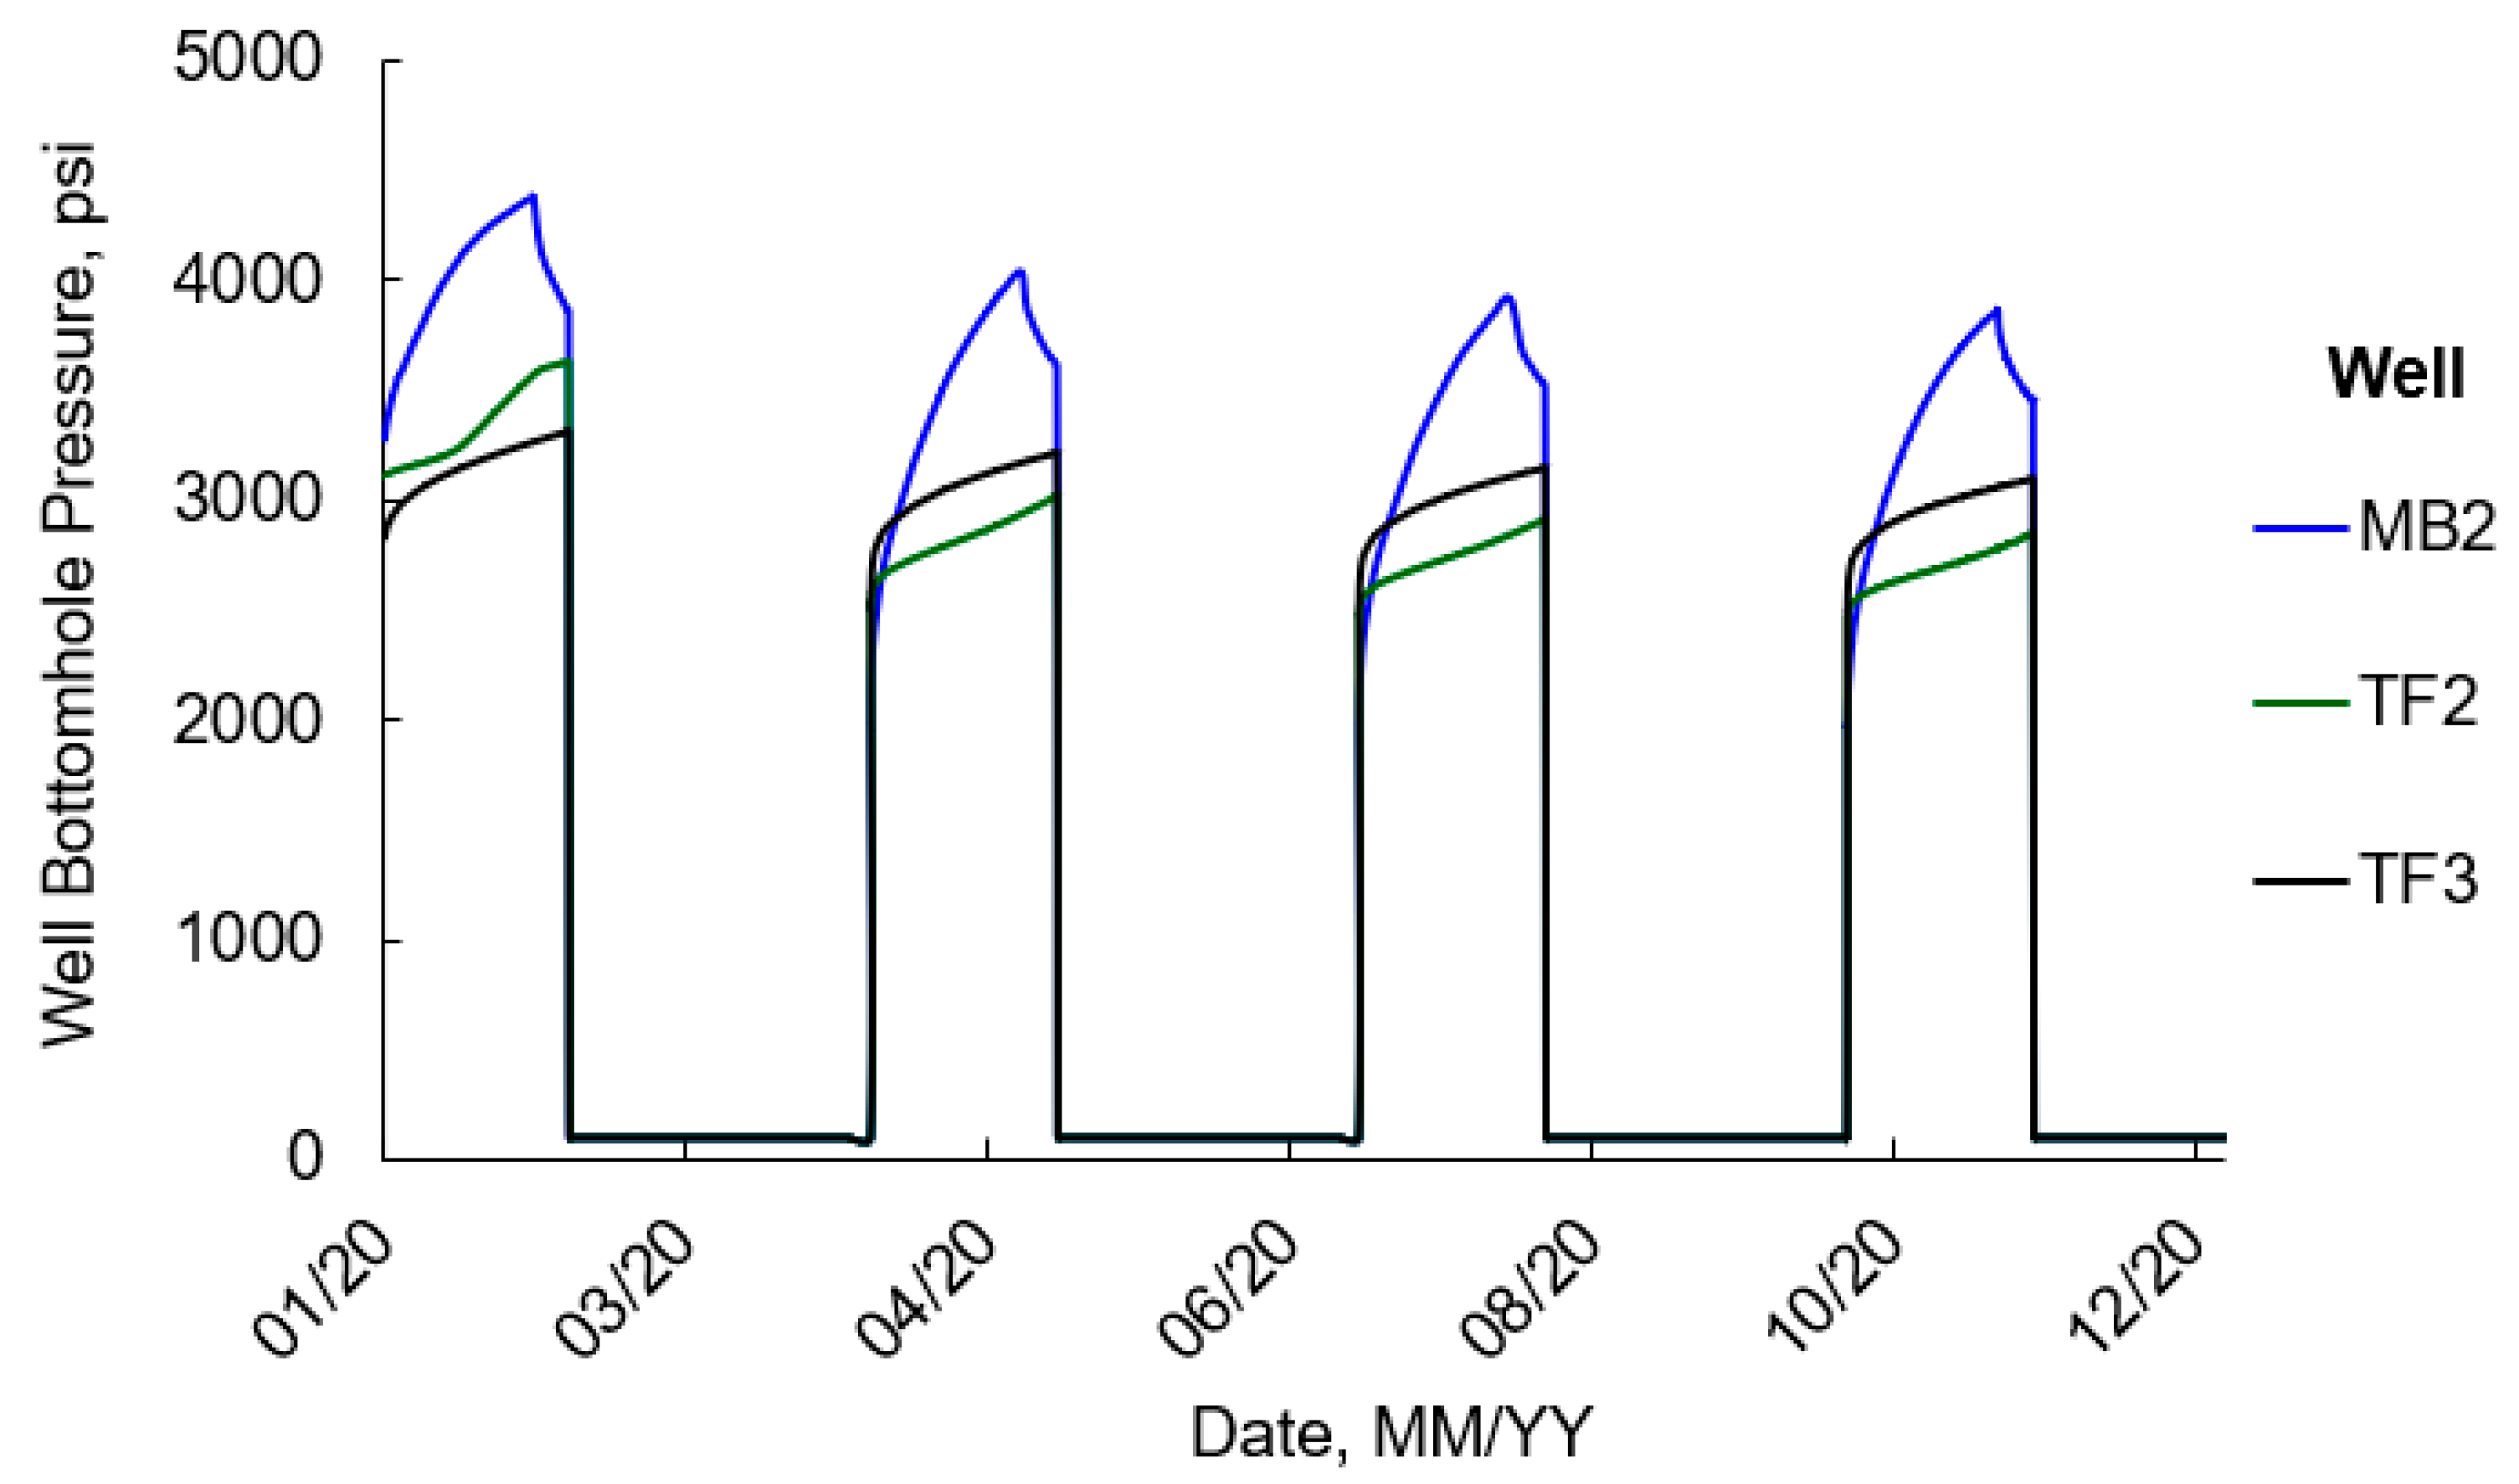
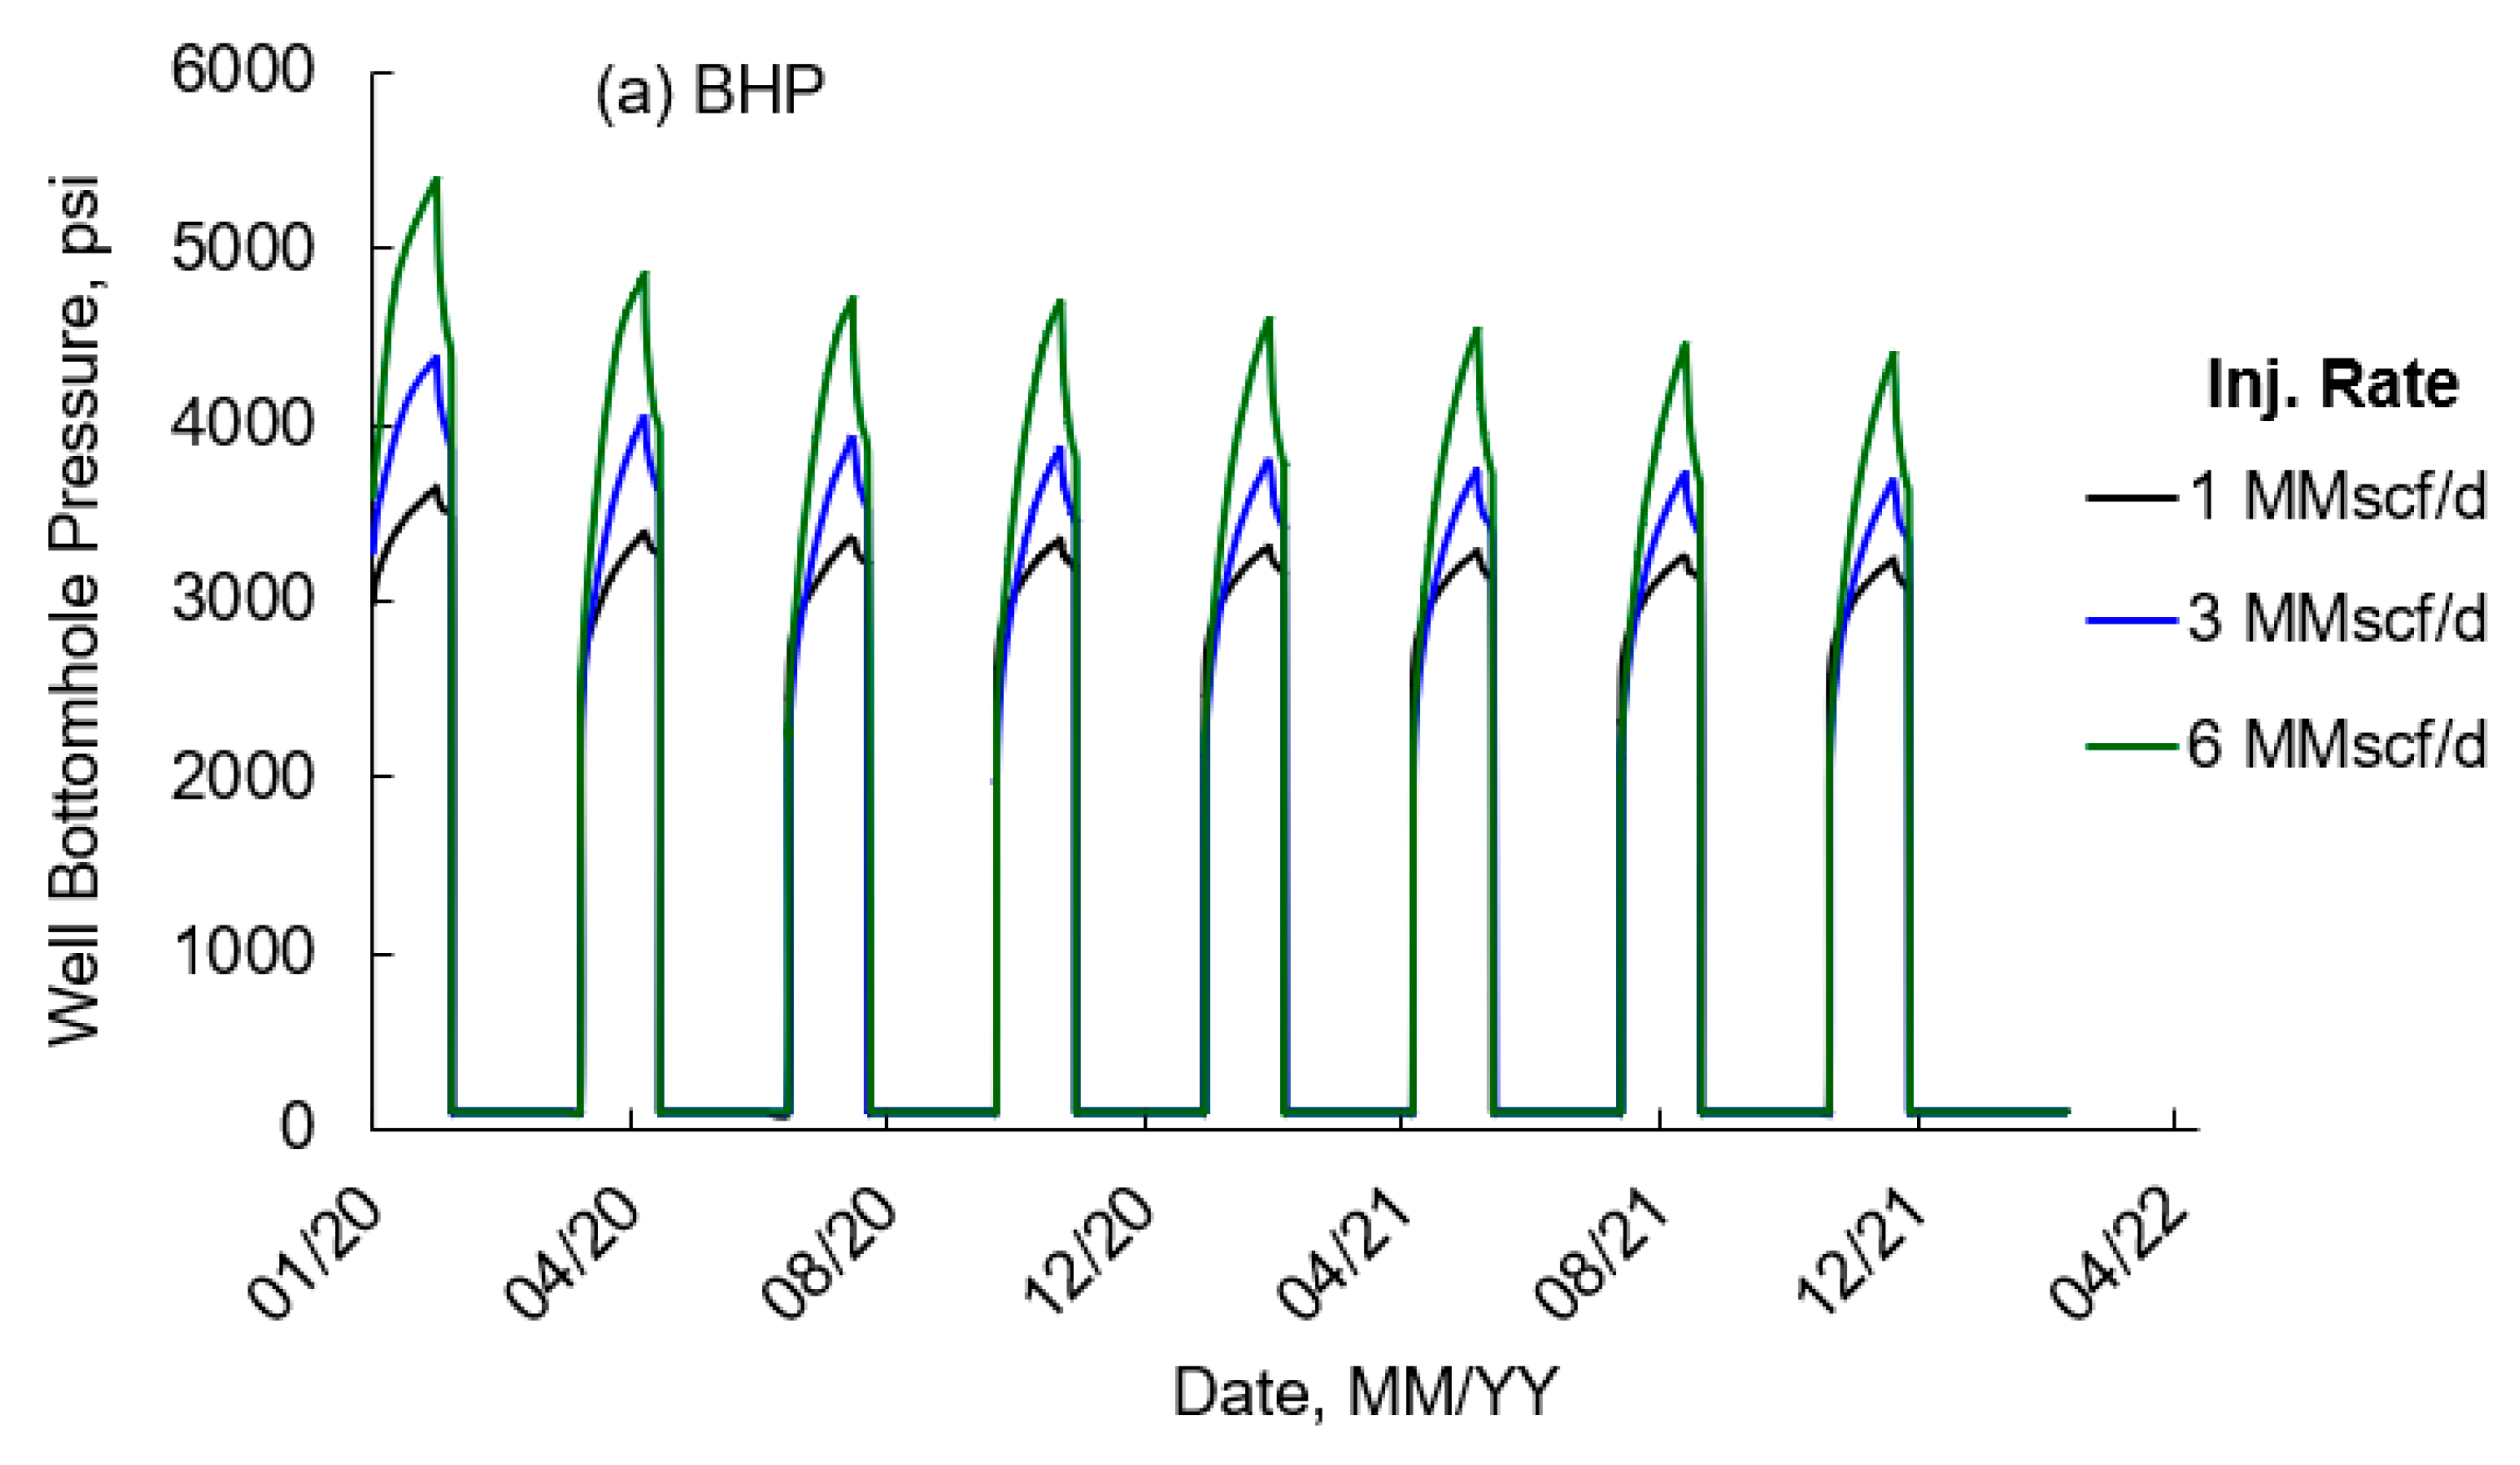
A simulation model with seven wells in Dunn County, North Dakota, was adopted for EOR-monitoring simulation based on reported well interference and conformance control work [45,46]. Three wells were completed in the Middle Bakken (MB) unit (MB1, MB2, and MB3), and four wells were completed in the Three Forks (TF) Formation (TF1, TF2, TF3, and TF4). Well interference was observed in the DSU, indicating the wells could be interconnected through fractures, as illustrated in Figure 13. Using the geologic and reservoir properties, equation-of-state (EOS), and embedded discrete fracture model (EDFM) method, a compositional reservoir simulation model with main hydraulic fractures was developed to simulate gas EOR performance in this DSU, employing Computer Modelling Group Ltd.’s (CMG’s) GEM compositional simulation module. The EOS defined the gas components (N2, C1, C2, and C3) individually so that different gas injection EOR scenarios can be simulated by combining the injection gas composition. Figure 14 demonstrates that the EOS matched the experimental data satisfactorily after careful regression [45].
The length (x direction), width (y direction), and height (z direction) of the simulation model were 4000, 3250, and 206 ft, respectively. The model was divided into five formations with a total of 17 layers, including the Lodgepole (LP), Upper Bakken (UB), MB, Lower Bakken (LB), and TF units, from the top to the bottom of the model. The thicknesses of the LP, UB, MB, LB, and TF were 40, 18, 40, 18, and 90 ft, respectively. An additional 16 cells in the x direction were added to the EDFM for fracture calculation based on the algorithm described above. The additional cells were used for flow calculation only, and they did not change the material balance in the model. History matching was conducted to reproduce the production data in the DSU. Since wells TF2, MB2, TF3, and MB3 are the parent wells that were completed in the middle of the DSU with longer production history, these wells were grouped to demonstrate the history-matching results [46]. Figure 15 shows that the model was able to capture the production behavior of the wells satisfactorily.

3.2. EOR Simulation

Figure 16 illustrates an example of well arrangement for gas EOR simulation using the history-matched model. The reservoir simulations evaluated scenarios with all wells open (i.e., Offset Wells MB1, MB3, TF1, TF2, TF3, and TF4 open) and scenarios with the exterior offset wells closed (i.e., Offset Wells MB1, MB3, TF1, and TF4 shut in and TF2 and TF3 open), as shown by the dashed and solid outlines in the figure. The yellow arrows in the figure illustrate potential gas flow paths from the injection well (MB2) to the offset production wells. A baseline case study was performed following this well arrangement and the HnP parameters shown in Table 5 [46]. Figure 17 shows the bottomhole pressure response in the HnP well (MB2) and two monitoring wells (TF2 and TF3) during the first four cycles of HnP at a gas injection rate of 3 MMscf/d. The data show that all three wells had a clear pressure increase during the injection cycle since the injected gas flowed into them. This is consistent with what was observed in most HnP pilot tests reported in the Bakken. Figure 18 demonstrates the EOR prediction of the HnP well (MB2) with different gas injection rates, which showed similar observations to Case Study 2 in that a low gas injection rate (≤3 MMscf/d) could not yield a satisfactory EOR response. Therefore, high injection rates and high pressure are required to have positive EOR results in the Bakken Formation, considering the connectivity between wells.
One of the objectives for EOR monitoring was to rapidly detect gas breakthrough into the offset wells during the gas injection process. As summarized in the case study section, propane concentration could be used to detect gas breakthrough behavior more effectively than fluid production rates (oil, gas, or water). Based on the same logic, if another pure gas like methane or ethane is injected for EOR operations, then its concentration could also be used to detect gas breakthrough. Therefore, the gas components were set up individually in the EOS so that pure-component gas injection scenarios could be simulated for methane, ethane, and propane.
In unconventional reservoirs, a short tracer breakthrough time in an offset well may indicate that fractures connect the well to the injection well. For example, the tracer tests in Case No. 11 showed that the wells were highly interconnected through fractures in the reservoir [14]. Therefore, tracer tests were included in the reservoir simulations for rich gas EOR to evaluate how the addition of a tracer gas would improve EOR monitoring as compared to rich gas or single-component gas injection without a tracer. Based on the rich gas composition (60 mol% of methane, 25 mol% of ethane, and 15 mol% of propane) simulated in this study, three tracers were attached to three individual gas components, as shown in Table 6. Tracers TRC-C1, TRC-C2, and TRC-C3 were attached to methane, ethane, and propane, respectively. Both pure propane and rich gas (with tracers) EOR scenarios were simulated using CMG’s GEM 2020 version.
Two sets of simulation cases were performed for the seven-well DSU: propane injection and rich gas injection with a tracer (hereafter, tracer injection). These sets were used to evaluate gas breakthrough from the gas injection well (MB2) to the offset production wells (MB1, MB3, and TF1–4) under different operating conditions, as shown in Table 7. Fifty-six simulations were performed for propane injection. The first 28 runs were executed with Offset Wells MB1, MB3, TF1, and TF4 closed (shut-in), and with the wells open (producing) for the next 28 cases. The same settings were applied to tracer injection. Gas was injected at well MB2 and utilized varying injection rates from 0.5 to 18 MMscfd and maximum injection BHP varying from 1500 to 7500 psi across the simulation runs. The rate and pressure settings were designed to cover representative operational ranges for the unconventional Bakken reservoir. The minimum production BHP (100 psi), injection time (30 days), soaking time (7 days), production time (60 days), and cycle time (97 days) were held constant across all runs. The injection–soaking–production cycles through 2 years of prediction can be found in Table 8.
The wells were operated differently in the offset well open and closed scenarios. For cases with offset wells open, wells MB1, MB3, TF1, TF2, TF3, and TF4 were open all the time (producing), and only well MB2 changed its status with cycles, as shown in Table 9. For cases with offset wells closed, wells TF1, MB1, MB3, and TF4 were closed all the time (shut-in), and other wells changed their status with HnP stages, as shown in Table 10. These 112 cases were simulated to create input data for the machine learning (ML) and EOR-monitoring study.

4. Real-Time Visualization and Forecasting

Visualization refers to time-series plots of reservoir surveillance data or analytics (re-expressions of the data that provide better insights than the raw measurement) that can inform the EOR site operator of downhole conditions (e.g., gas breakthrough from the injection well[s] to the offset production well[s]) that could affect the performance of various improved oil recovery (IOR) and EOR projects [70,71,72,73,74,75,76,77,78,79,80]. In recent years, more and more modern approaches of digitalization have been adopted in the oil and gas industry. A variety of real-time visualization and prediction studies have been performed to improve oil production performance and reduce operational risks in different oil and gas fields [81,82,83,84,85,86,87,88,89]. For example, the Dynamic Data Driven Applications Systems (DDDAS) paradigm could help operators gain advantages in many aspects of the petroleum industry by combining emergent technologies (such as artificial intelligence and the Internet of Things) with current practices such as automation, remote sensors, and drones [90].
This proof-of-concept, real-time visualization allows the user to display the simulation results for selected EOR operating parameters and target variables. The visualization process is meant to emulate real-time data that are consistent with similar processes that were applied to gas injection projects. For example, a typical field project for rich gas EOR might include the following sequence of steps: (1) acquiring injection rates, production rates, and well BHPs whenever new data are available, providing the foundation of real-time visualization; (2) preprocessing data to deal with missing and outlier values; (3) compiling the various datasets into a coherent structured data format based on well identifiers, operating scheme, and acquisition timestamp; (4) appending new data to the existing dataset; and (5) creating visualizations and/or updating visualizations based on the updated dataset.
In this proof-of-concept study, the process started with the data already acquired, transferred, aggregated, and cleaned, and the full two-year EOR outputs were used in the visualizations. However, the process may be adapted to real time and can upload and plot the data at whatever acquisition frequency the field operator would like to implement (e.g., hourly, daily, weekly). The EOR operating parameters for the reservoir simulations included external offset well status (MB1, MB3, TF1, and TF4 closed or open), injectate (rich gas or propane), injection rate (0.5, 1.5, 3.0, 6.0, 8.0, 10, or 18 MMscfd), and injection pressure (1500, 3000, 5500, or 7500 psi). The target variables for visualization included the following measurements at each of the seven wells (MB1, MB2 (injection well), MB3, TF1, TF2, TF3, and TF4): production (oil, gas, and water production rates and cumulative production), BHP, and tracer (rich gas or propane) production rate and cumulative production.
An online dashboard was created using R-Shiny, where users can interactively customize the display [91,92,93,94,95,96,97]. The online dashboard was developed by creating a server that provides the backbone of the visualizations and a user interface (UI) where pages show different time-series visualizations of well performance based on a set of user-defined selections. The interactive function of the input data was accomplished by controllers in R-Shiny, which allows the users to query and extract data from the server. Controllers were created via Checkbox Input and/or Radio Buttons for discrete variables and Slider Input for continuous variables. The time-series plots of the well performance variables were created using the R package (version: 3.4.0) ggplot [98]. The grid wrap function was used so that the data from different wells could be visualized vertically and interactively. The UI has four pages: Welcome, Tracer Injection, Propane Injection, and Prediction. The dashboard is made for operators to view forecasting results conveniently, as illustrated in Figure 19, which shows the tracer (attached to C1) concentration change for wells MB2, TF2, and TF3 for the given conditions of gas injection rate of 18 MMscfd, closed external offset production wells (MB1, MB3, TF1, and TF4), and 7500 psi injection well BHP.
Forecasting refers to predictive modeling, the rapid generation of a prediction about future performance that the EOR site operator can compare against the observed performance. The Prediction page shows a visualization of forecasted results from ML-based predictive models that were trained on the reservoir simulations. The created ML models were uploaded to the R-Shiny server and deployed to make predictions of different rich gas EOR scenarios.

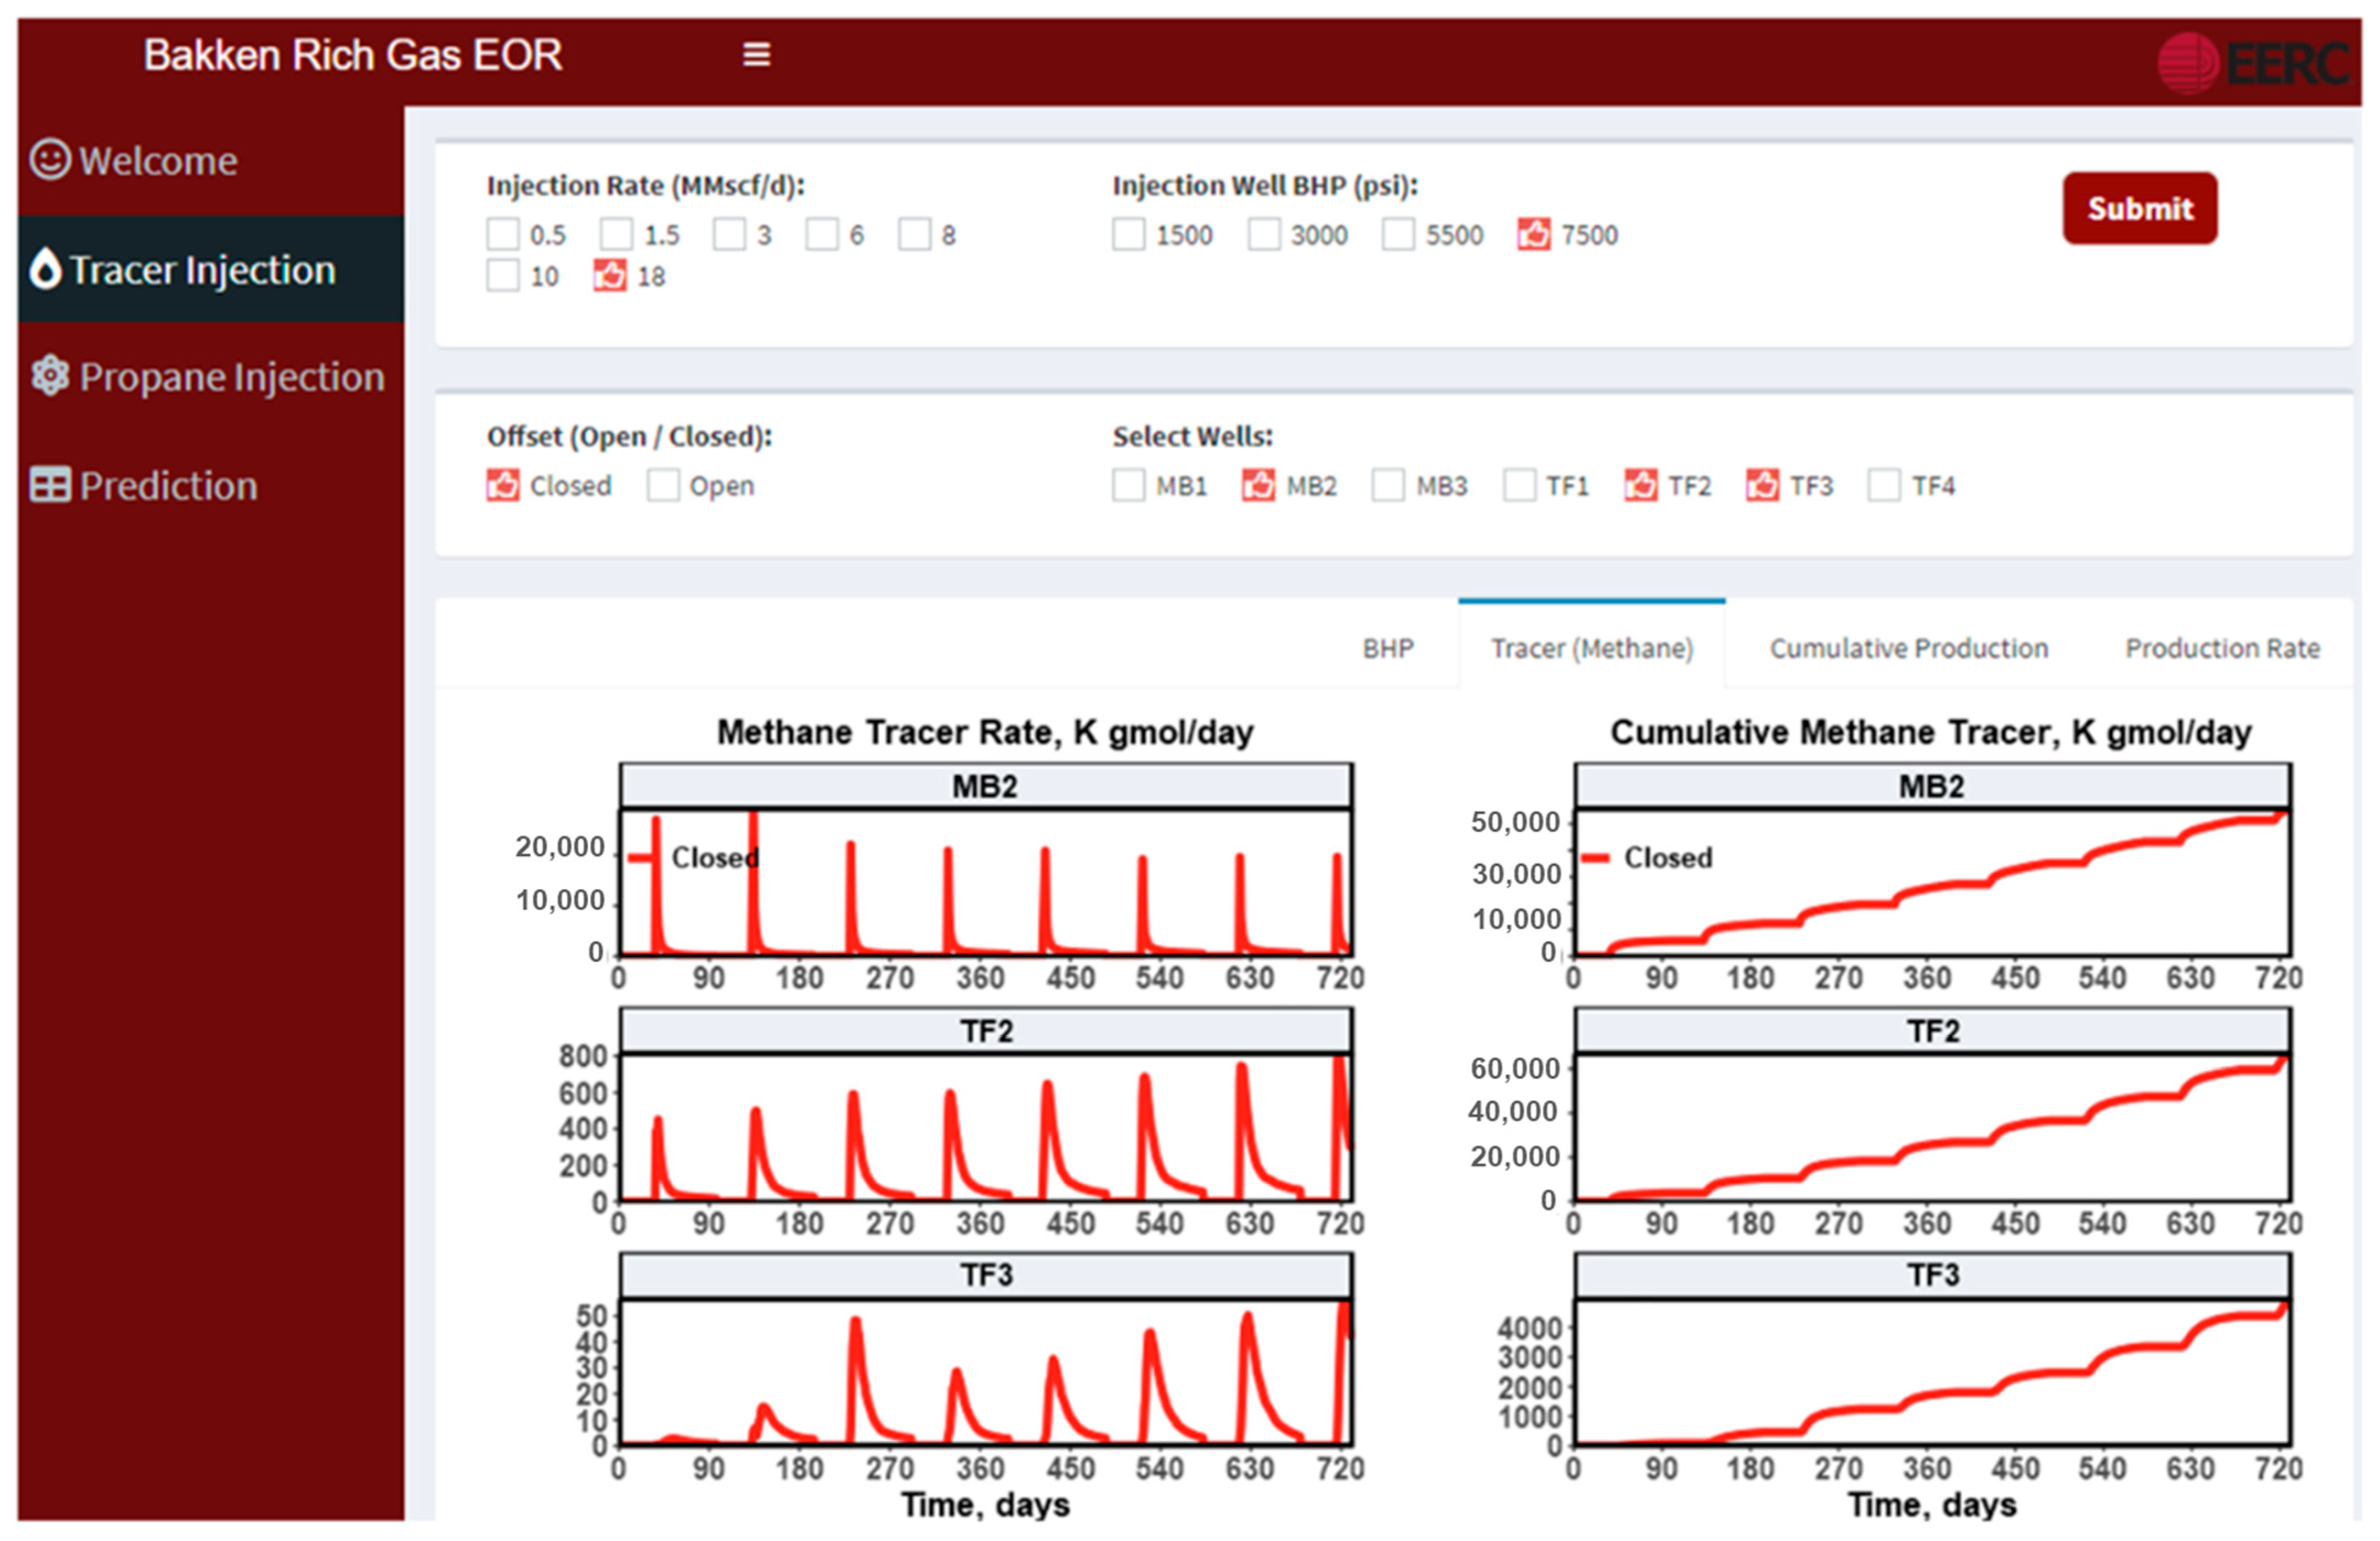
4.1. Machine Learning Tool Development

Together with the boom of digital and computational technologies, the use of artificial intelligence (AI) and machine learning (ML) techniques have received considerable notice as trending technologies in the petroleum industry in the last few years [99,100,101,102,103,104,105]. Different AI/ML algorithms, including artificial neural networks (ANNs), support vector machines (SVMs), fuzzy logic (FL), decision tree (DT), Bayesian belief networks (BBN), gradient boosted machine (GBM), extreme gradient boosting (XGBoost), random forest (RF), etc., have been employed to solve challenges and improve oil and gas production performance in the industry [106,107,108,109,110,111,112,113,114,115,116,117,118].
For this proof of concept, the extreme gradient boosting (XGBoost) algorithm was used for predictive modeling due to its robust data integration capability and forecast reliability; however, this could be replaced with other ML algorithms. XGBoost is a boosting ensemble learning algorithm that integrates predictions of “weak” tree models to achieve a strong tree model via a sequential process [99,106]. The simplified XGBoost algorithm works by building a sequential list of decision trees, and in each successive round, the decision tree uses the residuals from the prior tree as the target variable. The loss function, or the errors between the predicted and actual values, are minimized using a gradient descent approach to estimate the coefficients within the XGBoost model. There are seven hyperparameters to tune, and the optimal values were tuned by k-fold cross-validation (Table 11).
The predictor variables were identical to the controllers used in the visualizations: (1) injection rate (0.5, 1.5, 3.0, 6.0, 8.0, 10, or 18 MMscfd), (2) injection well BHP (1500, 3000, 5500, or 7500 psi), and (3) offset well status (open or closed). In addition to these three EOR parameters, the time stamp was also used as an input variable since time is highly correlated with EOR performance. The target variables were oil, water, and gas production rates and cumulative production for the seven wells and two different injectates (rich gas with tracer or propane). Therefore, the total number of target variables was 42: 3 (oil, water, and gas) × 1 (production rate) × 7 (seven wells) × 2 (two injectates). The cumulative production data were calculated from the production rate data, which led to the final number of target variables as 84.
The input data and the 42 target variables (production rate variables) were compiled and used as the data to develop the ML models. The compiled data were randomly divided into training and testing sets by the ratio of 0.8:0.2 (i.e., 80% of the compiled data were randomly placed into the training set, and the remaining 20% were placed into the testing set). The training set was used to train the XGBoost model, and the testing set was used to evaluate the performance of the model. The modeling performance was evaluated using r2 and relative root mean square error (RRMSE), where a model with high r2 and low RRMSE values was considered a good-performing model. The RRMSE is defined as the value of the root mean square error divided by the mean value of that variable.
Corresponding to the target variables, 84 XGBoost models were developed. The average (±standard deviation) values of r2 values for both training and testing sets for models with rich gas injection were 0.996 (±0.008) and 0.984 (±0.025), respectively, and for models with propane injection were 0.997 (±0.004) and 0.985 (±0.02), respectively. The average (±standard deviation) RRMSE values for both training and testing sets for models with rich gas injection were 0.04 (±0.08) and 0.08 (±0.16), respectively, and for models with propane injection were 0.03 (±0.04) and 0.05 (±0.07), respectively. Figure 20 shows the r2 and RRMSE performance results for all of the 42 models in the training and testing sets for the models with EOR injection by rich gas or propane. Approximately 60% of the models had r2 values greater than 0.9, and roughly 85% of the models had RRMSE values less than 0.1 for both training and testing sets. These performance indicators showed that most of the models performed well for both the training and testing sets. Therefore, for the current study, all the models were accepted for predictive modeling purposes.
In this proof of concept, the training and testing data for the predictive modeling were the same data as the simulations used for the real-time visualizations. However, this need not be the case. The real-time visualizations are designed to display data acquired in the field and saved to the R-Shiny server; these data can be any data type acquired at various frequencies (e.g., hourly, daily, weekly). The simulations were used as an example. In contrast, the workflow for developing the predictive models requires reservoir simulations that explore the parameter space of the EOR operating controls. Therefore, prior to initiating the rich gas EOR, it is necessary to have a set of reservoir simulations that identifies the EOR operating controls and their expected ranges, generates the reservoir simulation outputs, and then trains and tests ML-based models using the model development strategy.
Once the XGBoost models were developed, they were saved to a local drive and deployed to the R-Shiny server. The fitted XGBoost models allow the user to create forecasts of the target variables based on their user-defined selections of the predictor variables (injection rate, injection well BHP, and offset well status). These forecasts allow the operator to compare the observed data (visualization) against the forecasted data (prediction) to evaluate whether to continue operating the EOR project as is or to make one or more adjustments.
Figure 21 illustrates XGBoost predictions of EOR monitoring in wells TF2 and TF3 for the user inputs of the 18-MMscf/d rich gas injection rate and 7500 psi injection well maximum BHP in HnP well MB2. Since TF2 and TF3 are offset wells, their open and closed scenarios were considered in the predictions. The results showed that TF2 had more fracture connectivity with MB2 and thus yielded a stronger EOR response than TF3 in the high-rate, high-pressure HnP process. This observation is consistent with the simulation results shown in Figure 17, which means the machine model can mimic the EOR monitoring process quickly.

4.2. Real-Time Control

As a natural extension of the real-time visualization and forecasting system, real-time control has also become increasingly important for field operations, especially in harsh environments or where prompt responses are needed to control the system [118,119,120,121,122,123,124,125,126,127,128,129,130]. In this study, control methods refer to operational changes that the EOR site operator can enact (e.g., changing gas injection rates) to affect the observed performance and potentially improve the EOR outcome. The integration of visualizing reservoir surveillance data in real time allows for rapidly forecasting reservoir performance and deploying operational changes to affect EOR performance. The real-time visualizations are designed to show field data for well BHP, tracer or propane breakthrough, production rate, and cumulative production. Real-time forecasting is designed to predict future well performance based on EOR operational controls. In this proof-of-concept study, the EOR operational controls include injection rate, injection well BHP, and offset status (open or closed), as these factors are significantly related to rich gas EOR performance. Comparative assessments between real-time visualization (what is occurring in the field) and forecasting (what is predicted given a set of EOR operational controls) provide a means for real-time control.

5. Conclusions

A few EOR pilot tests have been conducted to offset the rapid decline in oil production in single wells of the Bakken Formation since the shale revolution. Most of these pilot tests had gas injection involved; however, only limited research has been reported to investigate actual field implementations and their surveillance for gas EOR in the BPS. Based on analyzing the gas EOR monitoring in various pilot tests, a series of data analysis, reservoir simulation, and machine learning activities were performed in this study to explore real-time visualization, forecasting, and control methods for improved reservoir surveillance during EOR processes [131]. The main conclusions can be summarized as follows:
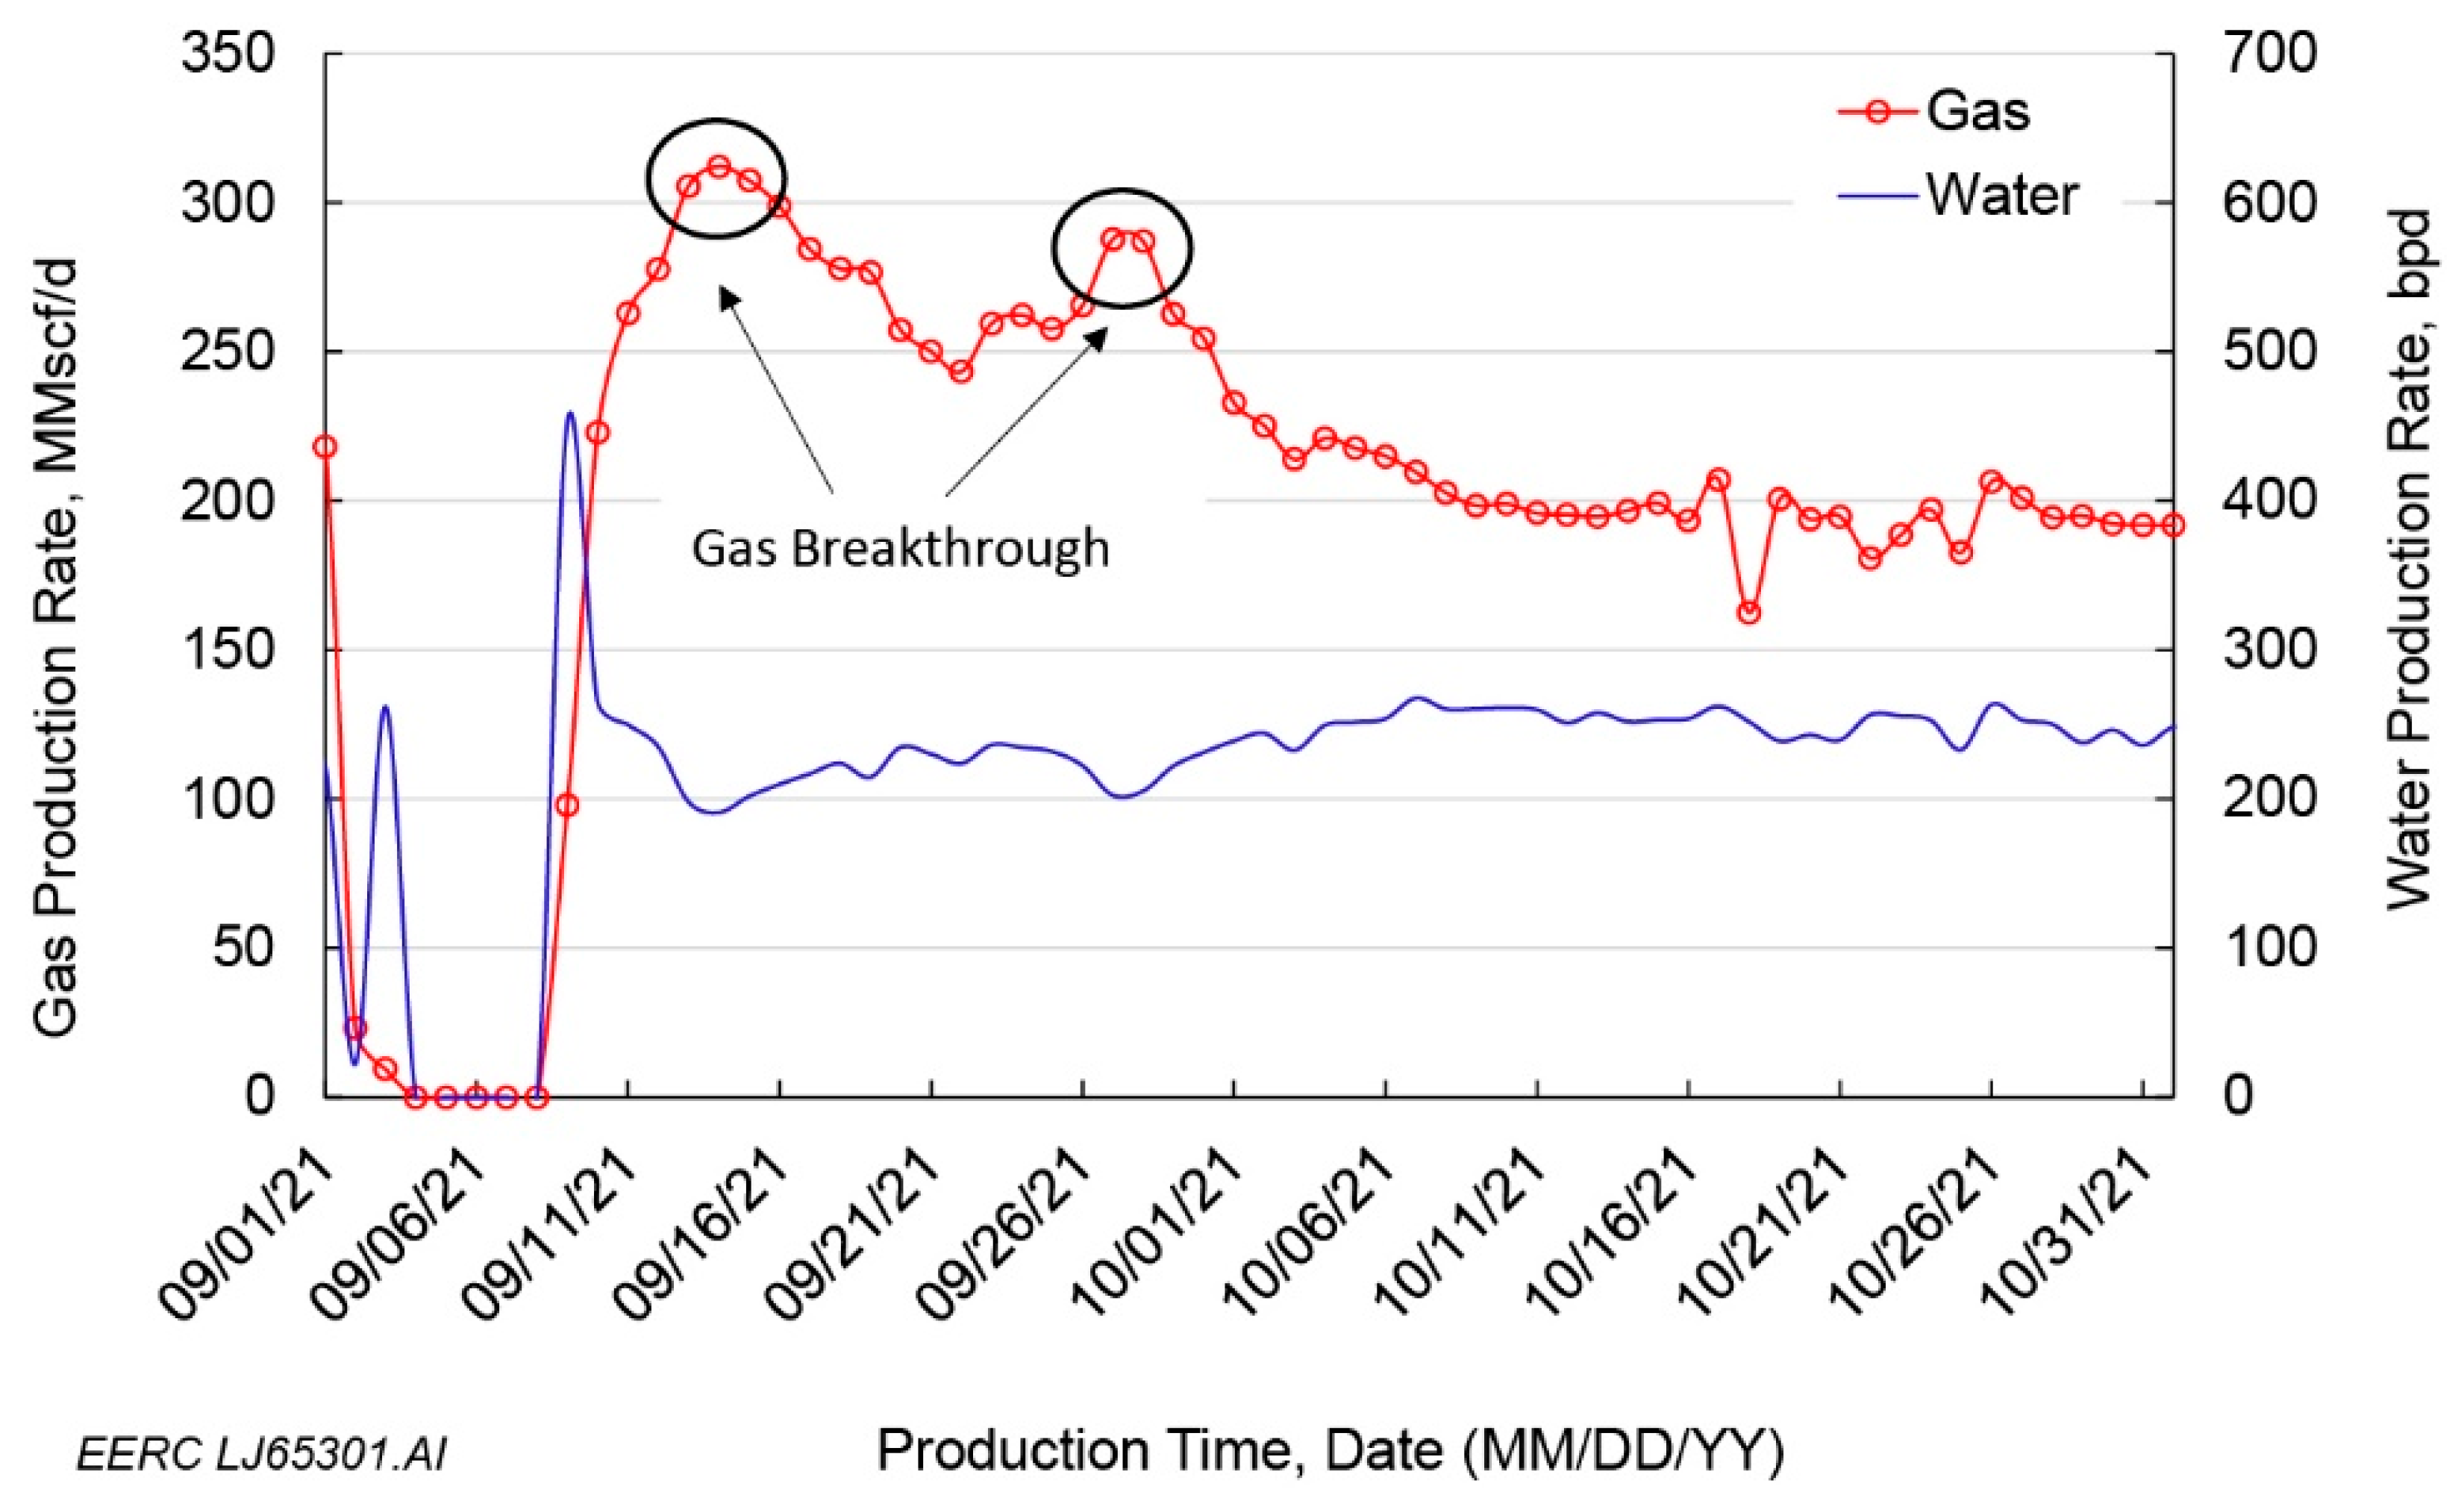
  • Pressure buildup, conformance issues, and timely gas breakthrough detection were some of the main challenges for gas EOR in unconventional wells because of the interconnected fractures between injection and offset wells.
  • The injectivity pilot showed that high bottomhole injection pressure is required for the injected gas to reactivate natural fractures and penetrate the tight rock matrix and extract oil from the Bakken for EOR purposes.
  • Careful EOR design and continuous reservoir monitoring could be key components to mitigate these challenges. Timely gas breakthrough detection followed by immediate control actions through the RSSS system showed effective results in conformance control and pressure buildup.
  • The EOR response in each well could be different, even though the wells are in the same DSU. Various factors, including completion time and formation, number of fractures, offset wells, and production history, etc., could impact the EOR results.
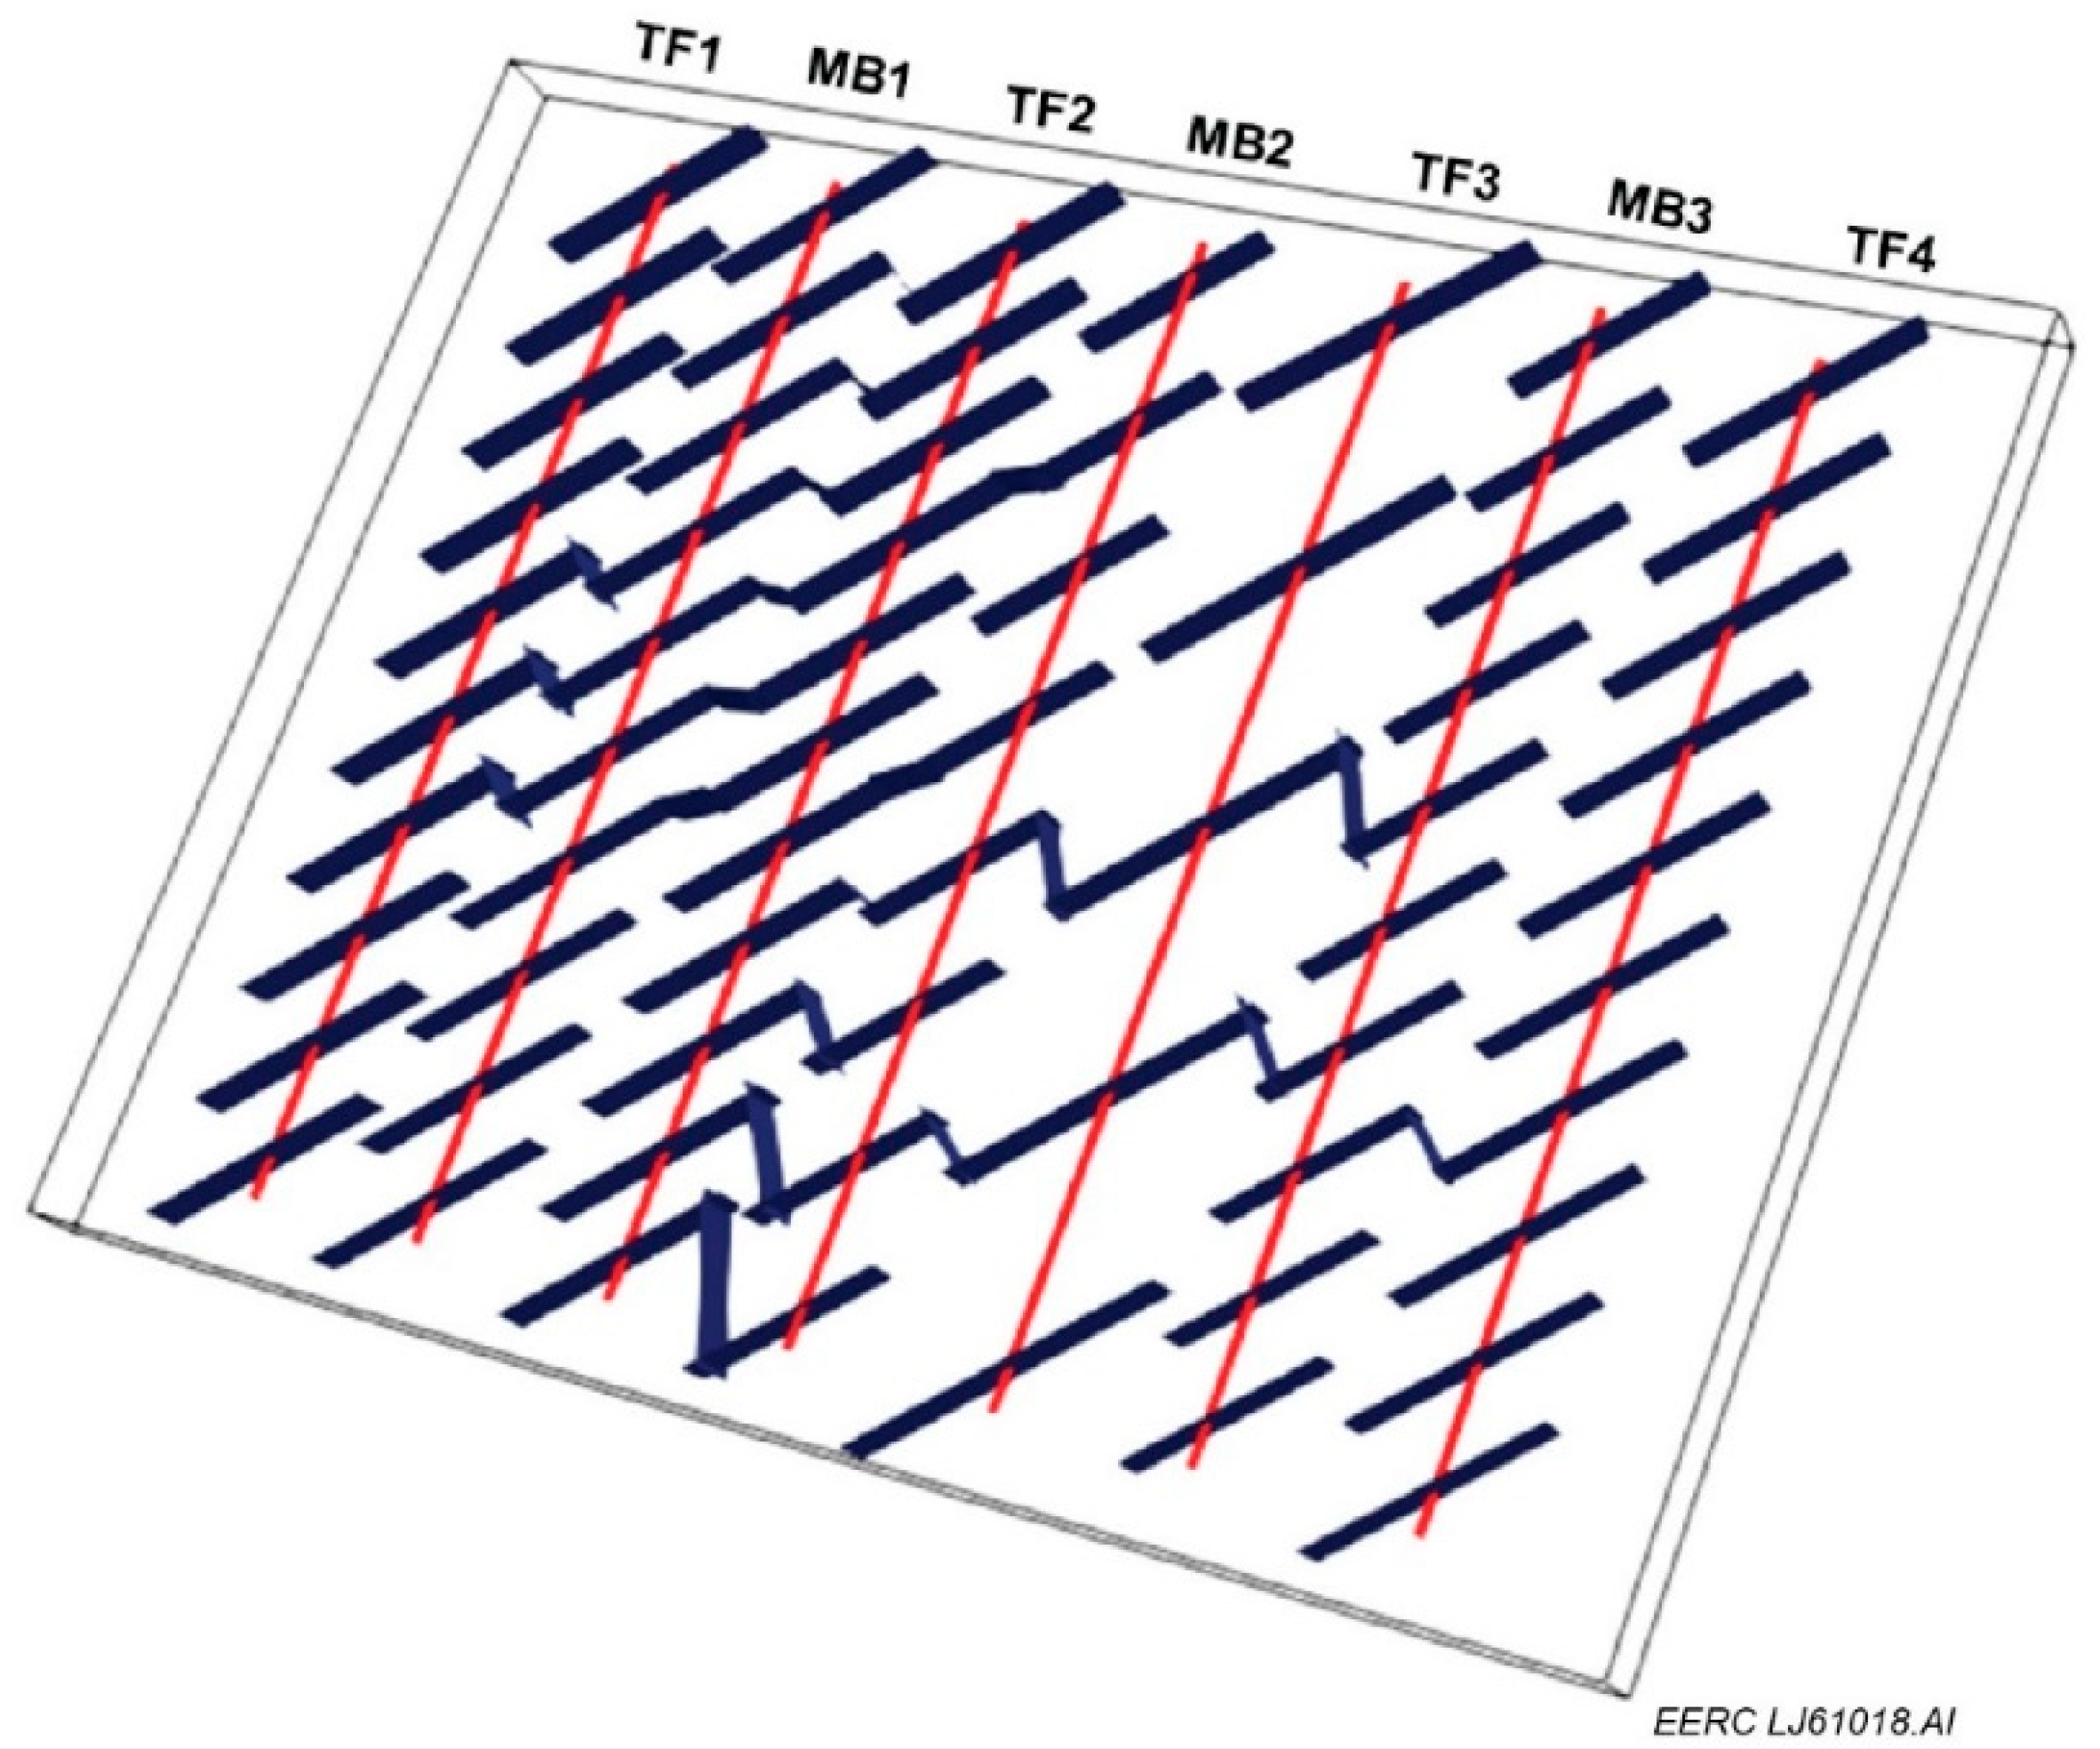
  • Field case studies showed that well interference commonly exists in the Bakken Petroleum System, and therefore multiple-well, multiple-fracture models are required to mimic the actual EOR operations.
  • The EDFM approach is an effective method to simulate the well interference and conformance issues in the Bakken and, thus, it is a more representative method to investigate the complex flow behavior between wells in the EOR processes.
  • Although gas injection has been demonstrated to be useful for EOR in unconventional reservoirs, a large volume of gas is required to fill up the pore space, lift reservoir pressure to a high level, and achieve an effective EOR, given the depleted reservoir volume around the horizontal wells.
  • An operation with a low gas injection rate may not yield a clear EOR response because of the well interference effect (conformance issue). Conformance control is required to confine the injected gas around the well for EOR purposes, especially where the supply of gas is limited.
  • Not all the wells are suitable for EOR operations in the Bakken, so EOR and monitoring wells need to be carefully selected for EOR design and implementation. EOR performance can be improved considerably by optimizing the EOR strategies.
  • Different injection/soaking/production combinations could yield different EOR results when employing the same injection rate and pressure. Therefore, optimizing key design parameters, including well selection, gas injection rate, cycle design, etc., can increase the chance of success for EOR operations.
  • A workflow was developed to explore real-time visualization, forecasting, and control methods for improved reservoir surveillance during EOR processes based on the field pilots and data generated in a large set of synthetic reservoir simulations.
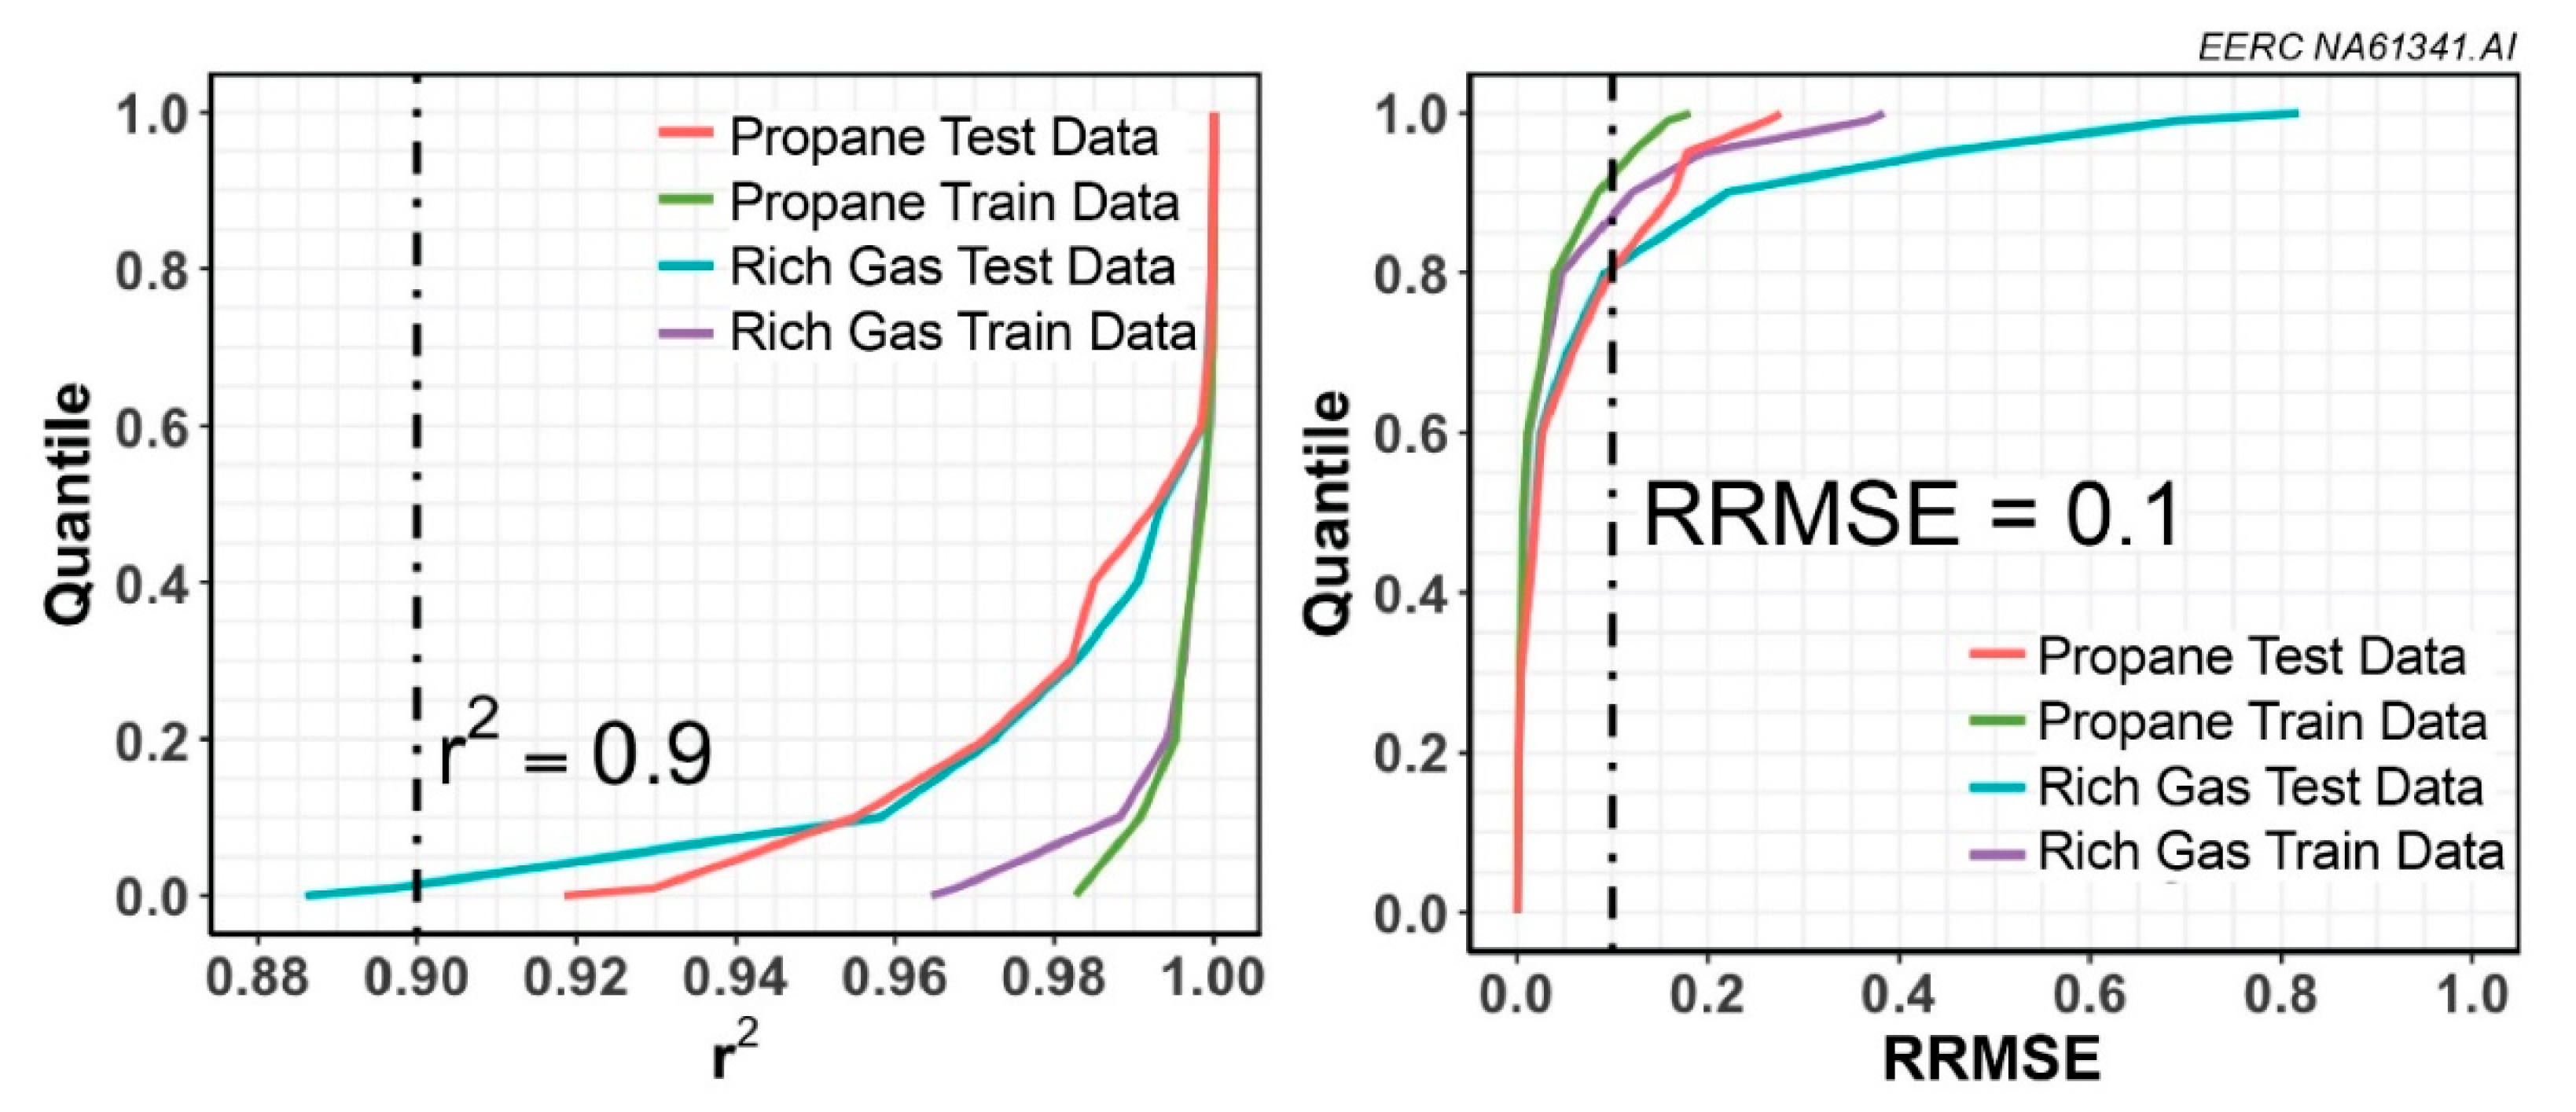
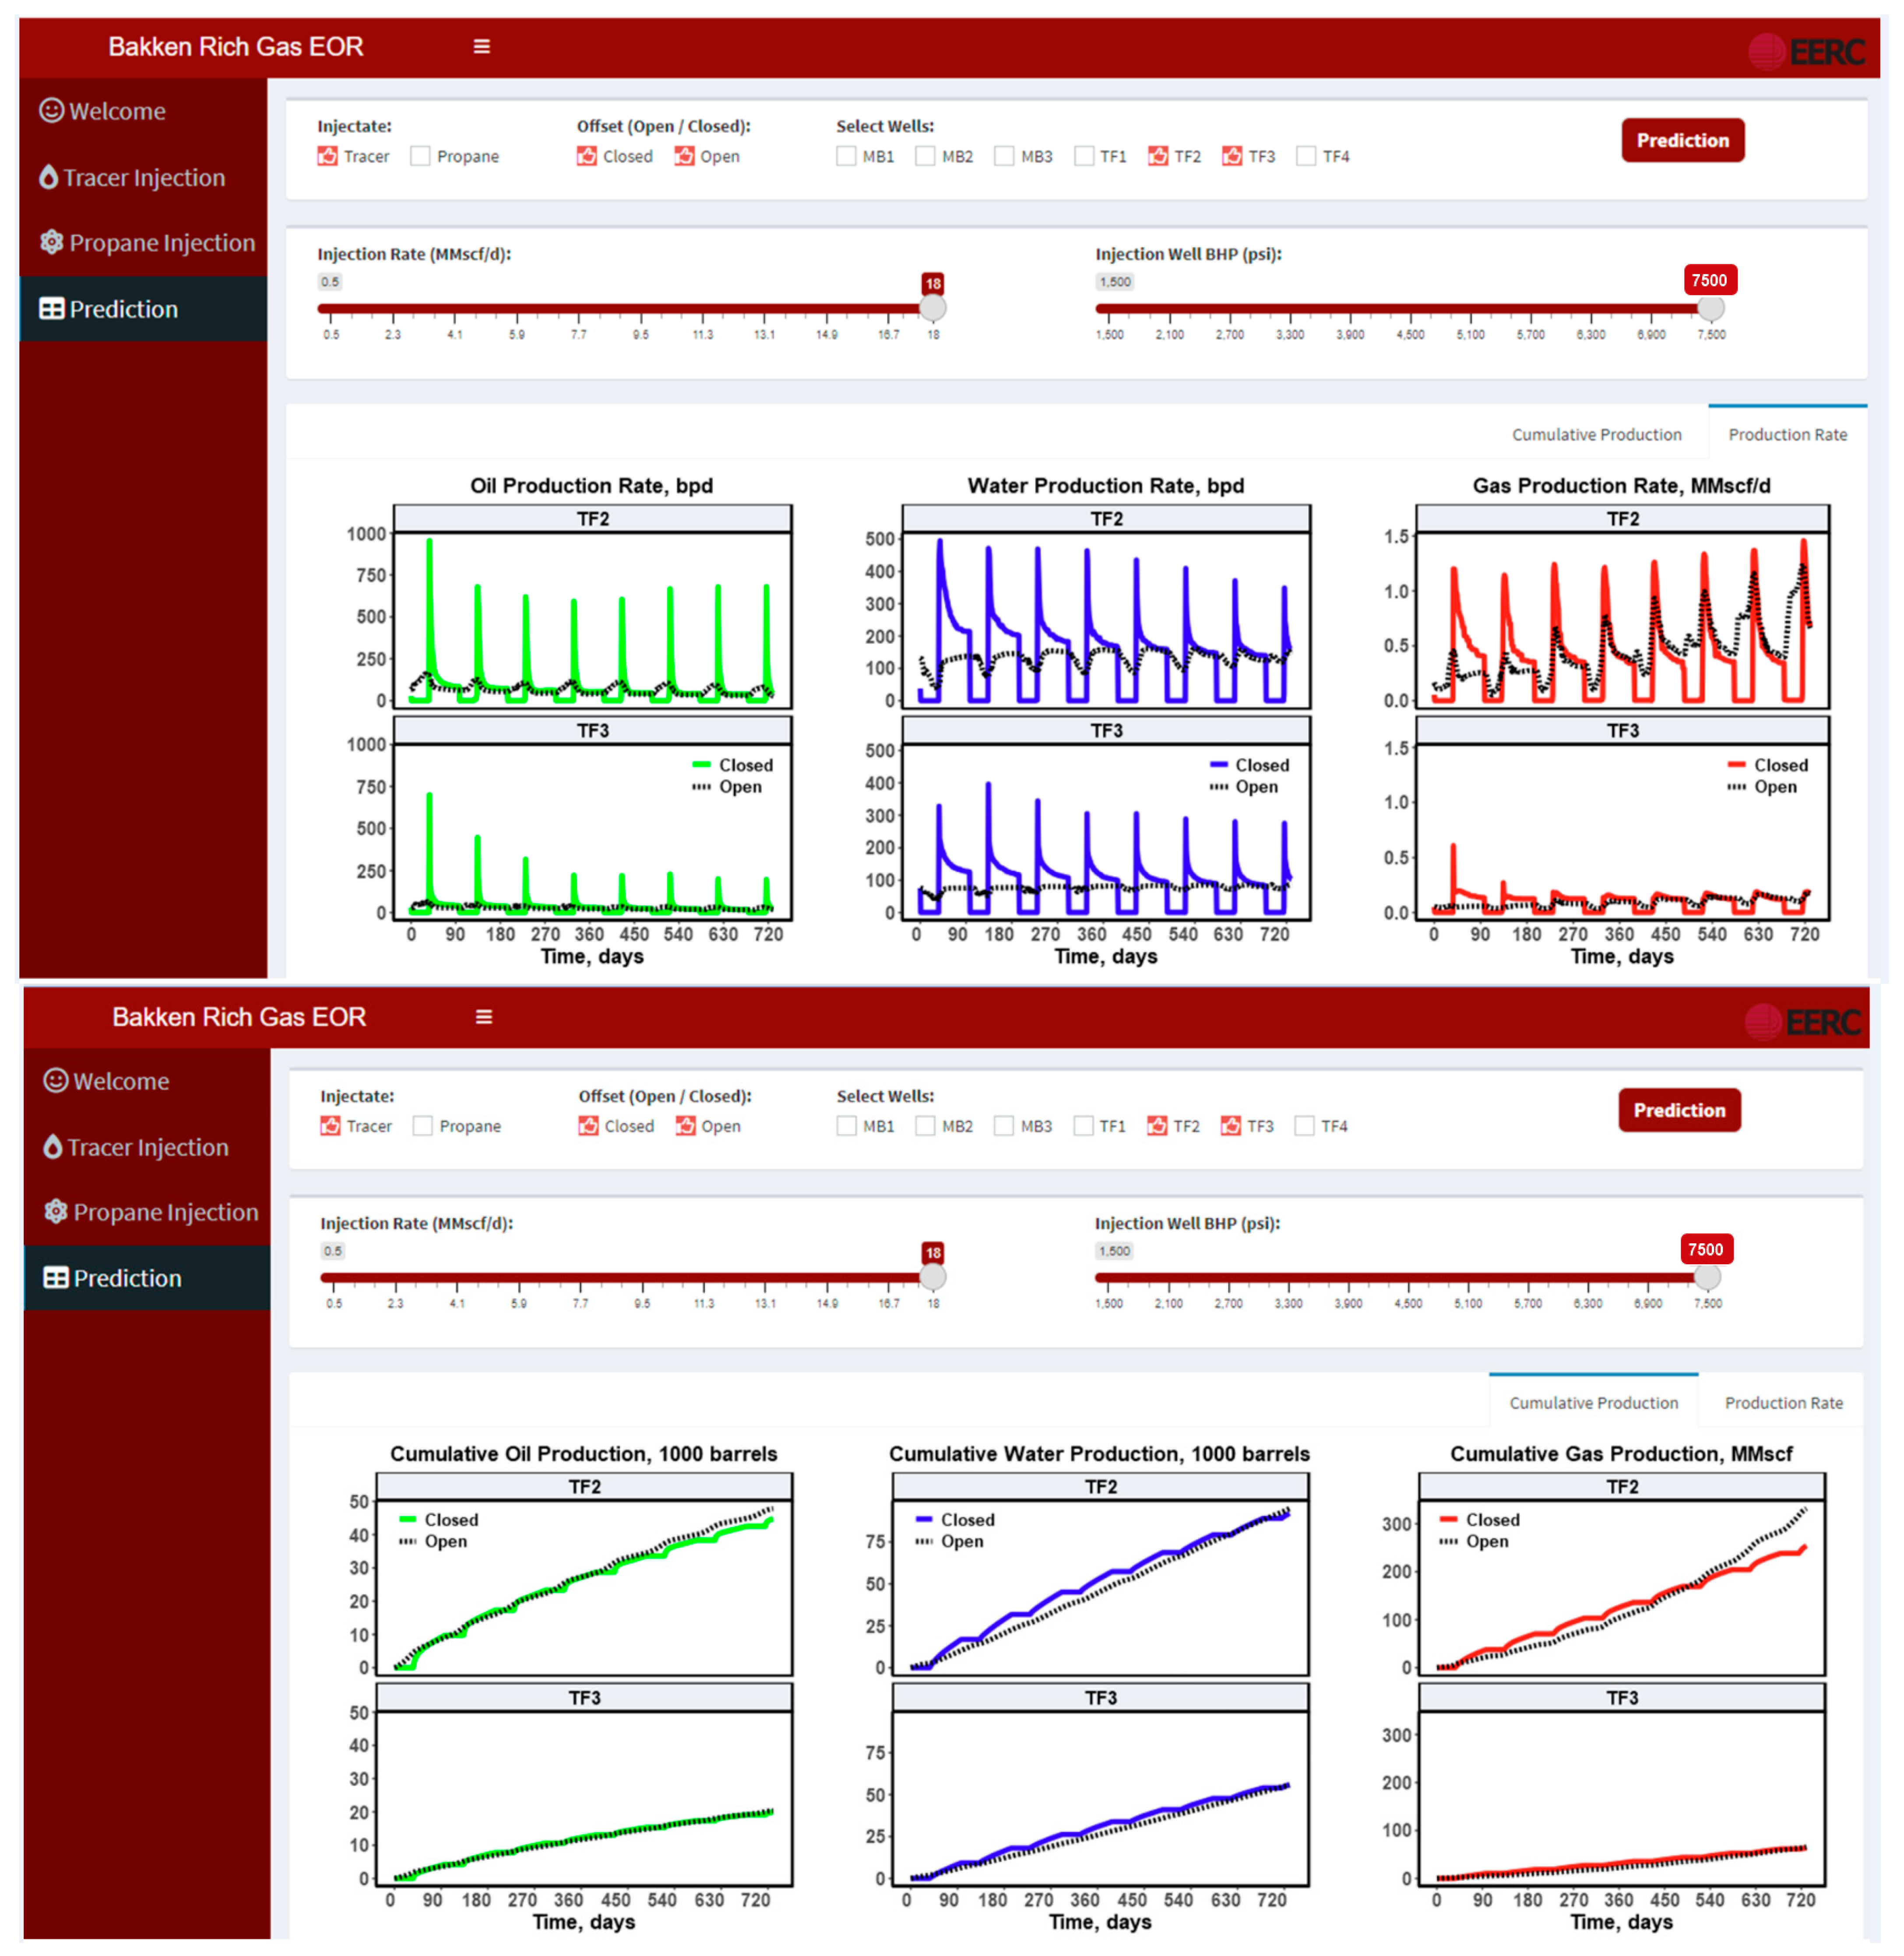
  • ML-based models using the XGBoost algorithm were developed to rapidly forecast well performance given a set of user-defined EOR operating parameters. These predictive models allow the user to modify the offset well status, injection rate, and injection well BHP, as well as predict the potential well response during the EOR process.
  • The combination of real-time visualization tools with real-time forecasting tools provides a framework for real-time control—operational changes that the EOR site operator can enact (e.g., changing gas injection rates) to affect the observed performance and potentially improve the EOR outcome.

Author Contributions

Conceptualization, J.Z. and L.J.; methodology, J.Z., L.J., X.Y. and N.A.A.; software, X.Y. and X.W.; validation, S.A.S., N.W.B., J.A.S. and K.L.; formal analysis, J.Z. and L.J.; investigation, X.Y., X.W. and N.A.A.; resources, S.A.S., N.W.B. and J.A.S.; data curation, X.Y.; writing—original draft preparation, J.Z., L.J., X.Y. and N.A.A.; writing—review and editing, X.W., S.A.S., N.W.B., J.A.S. and K.L.; visualization, X.Y.; supervision, J.A.S. and K.L.; project administration, S.A.S. and N.W.B.; funding acquisition, J.A.S. All authors have read and agreed to the published version of the manuscript.

Funding

This material is based upon work supported by U.S. Department of Energy (DOE) under Award Number FE0024233, and the Bakken Production Optimization Program (BPOP) at the Energy and Environmental Research Center. This research article was prepared by the Energy & Environmental Research Center of the University of North Dakota (UND EERC) as an account of work sponsored by DOE (SPONSOR) and BPOP.

Data Availability Statement

All data used in this paper is public, and additional data may be made available based on request.

Acknowledgments

The authors appreciate the data and financial support provided by partner organizations. The simulation work conducted under this program was made possible by contributions of software licenses from CMG, SimTech, and SLB.

Conflicts of Interest

The authors declare no conflicts of interest. To the best of UND EERC’s knowledge and belief, this report is true, complete, and accurate; however, because of the research nature of the work performed, neither UND EERC, nor any of their directors, officers, or employees, makes any warranty, express or implied, or assumes any legal liability or responsibility for the use of any information, apparatus, product, method, process, or similar item disclosed or represents that its use would not infringe privately owned rights. Reference herein to any specific commercial product, process, or service by trade name, trademark, manufacturer, or otherwise does not necessarily constitute or imply its endorsement or recommendation by UND EERC. SPONSOR understands and accepts that this research report and any associated deliverables are intended for a specific project. Any reuse, extensions, or modifications of the report or any associated deliverables by SPONSOR or others will be at such party’s sole risk and without liability or legal exposure to UND EERC or to their directors, officers, and employees.

References

  1. Sorensen, J.A.; Kurz, B.A.; Hawthorne, S.B.; Jin, L.; Smith, S.A.; Azenkeng, A. Laboratory Characterization and Modeling to Examine CO2 Storage and Enhanced Oil Recovery in an Unconventional Tight Oil Formation. Energy Procedia 2017, 114, 5460–5478. [Google Scholar] [CrossRef]
  2. Jin, L.; Sorensen, J.A.; Hawthorne, S.B.; Smith, S.A.; Pekot, L.J.; Bosshart, N.W.; Burton-Kelly, M.E.; Miller, D.J.; Grabanski, C.B.; Gorecki, C.D.; et al. Improving Oil Recovery by Use of Carbon Dioxide in the Bakken Unconventional System: A Laboratory Investigation. SPE Reserv. Eval. Eng. 2017, 20, 602–612. [Google Scholar] [CrossRef]
  3. Jin, L.; Hawthorne, S.; Sorensen, J.; Pekot, L.; Kurz, B.; Smith, S.; Heebink, L.; Herdegen, V.; Bosshart, N.; Torres, J.; et al. Advancing CO2 Enhanced Oil Recovery and Storage in Unconventional Oil Play—Experimental Studies on Bakken Shales. Appl. Energy 2017, 208, 171–183. [Google Scholar] [CrossRef]
  4. Hawthorne, S.B.; Miller, D.J.; Grabanski, C.B.; Jin, L. Experimental Determinations of Minimum Miscibility Pressures Using Hydrocarbon Gases and CO2 for Crude Oils from the Bakken and Cut Bank Oil Reservoirs. Energy Fuels 2020, 34, 6148–6157. [Google Scholar] [CrossRef]
  5. Hawthorne, S.B.; Grabanski, C.B.; Jin, L.; Bosshart, N.W.; Miller, D.J. Comparison of CO2 and Produced Gas Hydrocarbons to Recover Crude Oil from Williston Basin Shale and Mudrock Cores at 10.3, 17.2, and 34.5 MPa and 110 °C. Energy Fuels 2021, 35, 6658–6672. [Google Scholar] [CrossRef]
  6. Wan, X.; Jin, L.; Azzolina, N.A.; Butler, S.K.; Yu, X.; Zhao, J. Applying Reservoir Simulation and Artificial Intelligence Algorithms to Optimize Fracture Characterization and CO2 Enhanced Oil Recovery in Unconventional Reservoirs: A Case Study in the Wolfcamp Formation. Energies 2022, 15, 8266. [Google Scholar] [CrossRef]
  7. Wan, X.; Jin, L.; Azzolina, N.A.; Zhao, J.; Yu, X.; Smith, S.A.; Sorensen, J.A. Optimization of Operational Strategies for Rich Gas Enhanced Oil Recovery Based on a Pilot Test in the Bakken Tight Oil Reservoir. Pet. Sci. 2023, 20, 2921–2938. [Google Scholar] [CrossRef]
  8. Rezaee, R. Editorial on Special Issues of Development of Unconventional Reservoirs. Energies 2022, 15, 2617. [Google Scholar] [CrossRef]
  9. Kang, W.-L.; Zhou, B.-B.; Issakhov, M.; Gabdullin, M. Advances in Enhanced Oil Recovery Technologies for Low Permeability Reservoirs. Pet. Sci. 2022, 19, 1622–1640. [Google Scholar] [CrossRef]
  10. Li, L.; Zhang, X.; Liu, J.; Xie, Q.; Zhou, X.; Zheng, J.; Su, Y. Research Progress and Prospect of Carbon Dioxide Utilization and Storage Based on Unconventional Oil and Gas Development. Energies 2022, 15, 9383. [Google Scholar] [CrossRef]
  11. Kazempour, M.; Kiani, M.; Nguyen, D.; Salehi, M.; Bidhendi, M.M.; Lantz, M. Boosting Oil Recovery in Unconventional Resources Utilizing Wettability Altering Agents: Successful Translation from Laboratory to Field. In Proceedings of the SPE Improved Oil Recovery Conference, Tulsa, OK, USA, 14–18 April 2018; SPE: Tulsa, OK, USA, 2018; p. D041S015R002. [Google Scholar] [CrossRef]
  12. Todd, H.B.; Evans, J.G. Improved Oil Recovery IOR Pilot Projects in the Bakken Formation. In Proceedings of the SPE Rocky Mountain Petroleum Technology Conference/Low-Permeability Reservoirs Symposium, Denver, CO, USA, 5–6 May 2016; SPE: Denver, CO, USA, 2016; p. SPE-180270-MS. [Google Scholar] [CrossRef]
  13. Sorensen, J.A.; Pekot, L.J.; Torres, J.A.; Jin, L.; Hawthorne, S.B.; Smith, S.A.; Jacobson, L.L.; Doll, T.E. Field Test of CO2 Injection in a Vertical Middle Bakken Well to Evaluate the Potential for Enhanced Oil Recovery and CO2 Storage. In Proceedings of the 6th Unconventional Resources Technology Conference, Houston, TX, USA, 23–25 July 2018; American Association of Petroleum Geologists: Tulsa, OK, USA; pp. 2889–2906. [Google Scholar] [CrossRef]
  14. Pospisil, G.; Weddle, P.; Strickland, S.; McChesney, J.; Tompkins, K.; Neuroth, T.; Pearson, C.M.; Griffin, L.; Kaier, T.; Sorensen, J.; et al. Report on the First Rich Gas EOR Cyclic Multiwell Huff N Puff Pilot in the Bakken Tight Oil Play. In Proceedings of the SPE Annual Technical Conference and Exhibition, Virtual, 26–29 October 2020; SPE: Tulsa, OK, USA, 2020; p. D041S051R002. [Google Scholar] [CrossRef]
  15. Pospisil, G.; Griffin, L.; Souther, T.; Strickland, S.; McChesney, J.; Pearson, C.M.; Dalkhaa, C.; Sorensen, J.; Hamling, J.; Kurz, B.; et al. East Nesson Bakken Enhanced Oil Recovery Pilot: Coinjection of Produced Gas and a Water-Surfactant Mixture. In Proceedings of the 10th Unconventional Resources Technology Conference, Houston, TX, USA, 20–22 June 2022; American Association of Petroleum Geologists: Tulsa, OK, USA, 2022; pp. 803–823. [Google Scholar] [CrossRef]
  16. Torres, J.A.; Jin, L.; Bosshart, N.W.; Pekot, L.J.; Sorensen, J.A.; Peterson, K.; Anderson, P.W.; Hawthorne, S.B. Multiscale Modeling to Evaluate the Mechanisms Controlling CO2-Based Enhanced Oil Recovery and CO2 Storage in the Bakken Formation. In Proceedings of the 6th Unconventional Resources Technology Conference, Houston, TX, USA, 23–25 July 2018; American Association of Petroleum Geologists: Tulsa, OK, USA, 2018; pp. 2757–2776. [Google Scholar] [CrossRef]
  17. Nagarajan, N.; Stoll, D.; Litvak, M.; Prasad, R.; Shaarawi, K. Successful Field Test of Enhancing Bakken Oil Recovery by Propane Injection: Part, I. Field Test Planning, Operations, Surveillance, and Results. In Proceedings of the 8th Unconventional Resources Technology Conference, Online, 20–22 July 2020; American Association of Petroleum Geologists: Tulsa, OK, USA, 2020; pp. 1876–1896. [Google Scholar] [CrossRef]
  18. Litvak, M.; Nagarajan, N.; Prasad, R.S.; Shaarawi, K. Successful Field Test of Enhancing Bakken Oil Recovery with Propane Injection Part II. Development and Application of Innovative Simulation Technology. In Proceedings of the 8th Unconventional Resources Technology Conference, Online, 20–22 July 2020; American Association of Petroleum Geologists: Tulsa, OK, USA, 2020; pp. 1908–1928. [Google Scholar] [CrossRef]
  19. Zhao, J.; Jin, L.; Azzolina, N.A.; Wan, X.; Yu, X.; Sorensen, J.A.; Kurz, B.A.; Bosshart, N.W.; Smith, S.A.; Wu, C.; et al. Investigating Enhanced Oil Recovery in Unconventional Reservoirs Based on Field Case Review, Laboratory, and Simulation Studies. Energy Fuels 2022, 36, 14771–14788. [Google Scholar] [CrossRef]
  20. Gao, Y.; Zhao, M.; Wang, J.; Zong, C. Performance and Gas Breakthrough during CO2 Immiscible Flooding in Ultra-Low Permeability Reservoirs. Pet. Explor. Dev. 2014, 41, 88–95. [Google Scholar] [CrossRef]
  21. Rassenfoss, S. Chevron Applies Some Unconventional Thinking to Try To Make Shale EOR a Standard Treatment. J. Pet. Technol. 2024, 76, 24–28. [Google Scholar] [CrossRef]
  22. Zhang, L.; Huang, H.; Wang, Y.; Ren, B.; Ren, S.; Chen, G.; Zhang, H. CO2 Storage Safety and Leakage Monitoring in the CCS Demonstration Project of Jilin Oilfield, China. Greenh. Gases Sci. Technol. 2014, 4, 425–439. [Google Scholar] [CrossRef]
  23. Alfi, M.; Hosseini, S.A.; Alfi, M.; Shakiba, M. Effectiveness of 4D Seismic Data to Monitor CO2 Plume in Cranfield CO2-EOR Project. In Proceedings of the Carbon Management Technology Conference, Virtual, 20–22 July 2020; CMTC: Sugar Land, TX, USA, 2015; p. CMTC-439559-MS. [Google Scholar] [CrossRef]
  24. Jervis, M.; Bakulin, A.; Smith, R. Making Time-Lapse Seismic Work in a Complex Desert Environment for CO2 EOR Monitoring—Design and Acquisition. Lead. Edge 2018, 37, 598–606. [Google Scholar] [CrossRef]
  25. Zaluski, W.; El-Kaseeh, G.; Lee, S.-Y.; Piercey, M.; Duguid, A. Monitoring Technology Ranking Methodology for CO2-EOR Sites Using the Weyburn-Midale Field as a Case Study. Int. J. Greenh. Gas Control 2016, 54, 466–478. [Google Scholar] [CrossRef]
  26. Jin, L.; Barajas-Olalde, C.; Bosshart, N.; He, J.; Adams, D.; Kalenze, N.; Hamling, J.; Gorecki, C. Application of CO2 Injection Monitoring Techniques for CO2 EOR and Associated Geologic Storage. In Proceedings of the 15th Greenhouse Gas Control Technologies Conference, Abu Dhabi, United Arab Emirates, 15–18 March 2021. [Google Scholar] [CrossRef]
  27. Mur, A.; Barajas-Olalde, C.; Adams, D.C.; Jin, L.; He, J.; Hamling, J.A.; Gorecki, C.D. Integrated Simulation to Seismic and Seismic Reservoir Characterization in a CO2 EOR Monitoring Application. Lead. Edge 2020, 39, 668–678. [Google Scholar] [CrossRef]
  28. Salako, O.; Jin, L.; Barajas-Olalde, C.; Hamling, J.A.; Gorecki, C.D. Implementing Adaptive Scaling and Dynamic Well-Tie for Quantitative 4-D Seismic Evaluation of a Reservoir Subjected to CO2 Enhanced Oil Recovery and Associated Storage. Int. J. Greenh. Gas Control 2018, 78, 306–326. [Google Scholar] [CrossRef]
  29. Barajas-Olalde, C.; Haffinger, P.; Gisolf, D.; Zhang, M.; Droujinina, A.; Doulgeris, P.; Khatibi, S.; Jin, L.; Burnison, S.A.; Hamling, J.A.; et al. Simultaneous time-lapse WEB-AVO inversion for seismic reservoir monitoring: Application to CO2 enhanced oil recovery at the Bell Creek oil field. In Proceedings of the SEG Technical Program Expanded Abstracts; Society of Exploration Geophysicists: Houston, TX, USA, 2019; pp. 564–568. [Google Scholar]
  30. Barajas-Olalde, C.; Mur, A.; Adams, D.C.; Jin, L.; He, J.; Hamling, J.A.; Gorecki, C.D. Joint Impedance and Facies Inversion of Time-Lapse Seismic Data for Improving Monitoring of CO2 Incidentally Stored from CO2 EOR. Int. J. Greenh. Gas Control 2021, 112, 103501. [Google Scholar] [CrossRef]
  31. Smith, S.A.; Sorensen, J.A.; Kurz, B.A.; Heebink, L.V.; Azzolina, N.A.; Jin, L.; Kong, L.; Yu, X.; Wan, X.; Yu, Y.; et al. Findings on Subtask 3.1-Bakken Rich Gas Enhanced Oil Recovery Project; Energy & Environmental Research Center University of North Dakota: Grand Forks, ND, USA, 2022; p. DE-FE0024233. [Google Scholar]
  32. Kumar, A.; Sharma, M.M. Diagnosing Fracture-Wellbore Connectivity Using Chemical Tracer Flowback Data. In Proceedings of the 6th Unconventional Resources Technology Conference, Houston, TX, USA, 23–25 July 2018; American Association of Petroleum Geologists: Tulsa, OK, USA, 2018. [Google Scholar] [CrossRef]
  33. Tayyib, D.; Al-Qasim, A.; Kokal, S.; Huseby, O. Overview of Tracer Applications in Oil and Gas Industry. In Proceedings of the SPE Kuwait oil and gas show and conference, Mishref, Kuwait, 13–16 October 2019; SPE: Mishref, Kuwait, 2019; p. D023S006R004. [Google Scholar] [CrossRef]
  34. Al-Qasim, A.; Kokal, S.; Hartvig, S.; Huseby, O. Reservoir Description Insights from Inter-Well Gas Tracer Test. In Proceedings of the Abu Dhabi International Petroleum Exhibition and Conference, Abu Dhabi, United Arab Emirates, 11–14 November 2019; SPE: Abu Dhabi, United Arab Emirates, 2019; p. D011S014R003. [Google Scholar] [CrossRef]
  35. Al-Qasim, A.; Kokal, S.; Hartvig, S.; Huseby, O. Subsurface Monitoring and Surveillance Using Inter-Well Gas Tracers. Upstream Oil Gas Technol. 2020, 3, 100006. [Google Scholar] [CrossRef]
  36. Sharma, A.; Shook, G.M.; Pope, G.A. Rapid Analysis of Tracers for Use in EOR Flood Optimization. In Proceedings of the SPE Improved Oil Recovery Conference, Tulsa, OK, USA, 12–16 April 2014; SPE: Tulsa, OK, USA, 2014; p. SPE-169109-MS. [Google Scholar] [CrossRef]
  37. Sanni, M.; Abbad, M.; Kokal, S.; Ali, R.; Zefzafy, I.; Hartvig, S.; Huseby, O. A Field Case Study of an Interwell Gas Tracer Test for GAS-EOR Monitoring. In Proceedings of the Abu Dhabi International Petroleum Exhibition and Conference, Abu Dhabi, United Arab Emirates, 13–16 November 2017; SPE: Abu Dhabi, United Arab Emirates, 2017; p. D031S081R004. [Google Scholar] [CrossRef]
  38. Huseby, O.K.; Sagen, J.; Wangen, M.; Viig, S.O. Planning and Interpretation of Offshore-Field Tracer Tests Using Accurate and Refined Tracer Simulations. In Proceedings of the SPE Latin America and Caribbean Petroleum Engineering Conference, Lima, Peru, 1–3 December 2010; SPE: Lima, Peru, 2010; p. SPE-139170-MS. [Google Scholar] [CrossRef]
  39. Al Abbad, M.A.; Sanni, M.L.; Kokal, S.; Krivokapic, A.; Dye, C.; Dugstad, Ø.; Hartvig, S.K.; Huseby, O.K. A Step Change for Single-Well Chemical-Tracer Tests: Field Pilot Testing of New Sets of Novel Tracers. SPE Reserv. Eval. Eng. 2019, 22, 253–265. [Google Scholar] [CrossRef]
  40. Chen, H.; Chang, S.; Thomas, G.; Wang, W.; Mashat, A.; Shateeb, H. Comparison of Water and Gas Tracers Field Breakthrough. In Proceedings of the SPE Annual Technical Conference and Exhibition, Dubai, United Arab Emirates, 21–23 September 2021; SPE: Dubai, United Arab Emirates, 2021; p. D021S033R002. [Google Scholar] [CrossRef]
  41. North Dakota Industrial Commission (NDIC). 2024. Available online: www.dmr.nd.gov/oilgas/ (accessed on 25 March 2024).
  42. Hawthorne, S.B.; Jin, L.; Kurz, B.A.; Miller, D.J.; Grabanski, C.B.; Sorensen, J.A.; Pekot, L.J.; Bosshart, N.W.; Smith, S.A.; Burton-Kelly, M.E.; et al. Integrating Petrographic and Petrophysical Analyses with CO2 Permeation and Oil Extraction and Recovery in the Bakken Tight Oil Formation. In Proceedings of the SPE Canada Unconventional Resources Conference, Calgary, AB, Canada, 15–16 February 2017; SPE: Calgary, Alberta, Canada, 2017; p. D021S009R001. [Google Scholar] [CrossRef]
  43. Jia, B.; Jin, L.; Mibeck, B.A.; Smith, S.A.; Sorensen, J.A. An Integrated Approach of Measuring Permeability of Naturally Fractured Shale. J. Pet. Sci. Eng. 2020, 186, 106716. [Google Scholar] [CrossRef]
  44. Jia, B.; Jin, L.; Smith, S.A.; Bosshart, N.W. Extension of the Gas Research Institute (GRI) Method to Measure the Permeability of Tight Rocks. J. Nat. Gas Sci. Eng. 2021, 91, 103756. [Google Scholar] [CrossRef]
  45. Jin, L.; Kurz, B.A.; Ardali, M.; Wan, X.; Zhao, J.; He, J.; Hawthorne, S.B.; Djezzar, A.B.; Yu, Y.; Morris, D. Investigation of Produced Gas Injection in The Bakken for Enhanced Oil Recovery Considering Well Interference. In Proceedings of the 10th Unconventional Resources Technology Conference, Houston, TX, USA, 20–22 June 2022; American Association of Petroleum Geologists: Tulsa, OK, USA, 2017; pp. 2632–2653. [Google Scholar] [CrossRef]
  46. Jin, L.; Wan, X.; Azzolina, N.A.; Bosshart, N.W.; Zhao, J.; Yu, Y.; Yu, X.; Smith, S.A.; Sorensen, J.A.; Gorecki, C.D. Optimizing Conformance Control for Gas Injection EOR in Unconventional Reservoirs. Fuel 2022, 324, 124523. [Google Scholar] [CrossRef]
  47. Jin, L.; Hawthorne, S.; Sorensen, J.; Pekot, L.; Smith, S.; Heebink, L.; Bosshart, N.; Torres, J.; Dalkhaa, C.; Gorecki, C.; et al. Extraction of Oil from Bakken Shale Formations with Supercritical CO2. In Proceedings of the 5th Unconventional Resources Technology Conference, Austin, TX, USA, 24–26 July 2017; American Association of Petroleum Geologists: Tulsa, OK, USA, 2017. [Google Scholar] [CrossRef]
  48. Jin, L.; Sorensen, J.A.; Hawthorne, S.B.; Smith, S.A.; Bosshart, N.W.; Burton-Kelly, M.E.; Miller, D.J.; Grabanski, C.B.; Harju, J.A. Improving Oil Transportability Using CO2 in the Bakken System—A Laboratory Investigation. In Proceedings of the SPE International Conference and Exhibition on Formation Damage Control, Lafayette, LA, USA, 24–26 February 2016; SPE: Lafayette, LA, USA; p. D012S007R002. [Google Scholar] [CrossRef]
  49. Badrouchi, N.; Pu, H.; Smith, S.; Badrouchi, F. Evaluation of CO2 Enhanced Oil Recovery in Unconventional Reservoirs: Experimental Parametric Study in the Bakken. Fuel 2022, 312, 122941. [Google Scholar] [CrossRef]
  50. Karimi, S.; Saidian, M.; Kazemi, H. Experimental Study of the Effect of Aging on Fluid Distribution in Middle Bakken Cores. J. Pet. Sci. Eng. 2018, 166, 1042–1054. [Google Scholar] [CrossRef]
  51. Hejazi, S.; Assef, Y.; Tavallali, M.; Popli, A. Cyclic CO2-EOR in the Bakken Formation: Variable Cycle Sizes and Coupled Reservoir Response Effects. Fuel 2017, 210, 758–767. [Google Scholar] [CrossRef]
  52. Luo, P.; Luo, W.; Li, S. Effectiveness of Miscible and Immiscible Gas Flooding in Recovering Tight Oil from Bakken Reservoirs in Saskatchewan, Canada. Fuel 2017, 208, 626–636. [Google Scholar] [CrossRef]
  53. Han, L.; Gu, Y. Optimization of Miscible CO2 Water-Alternating-Gas Injection in the Bakken Formation. Energy Fuels 2014, 28, 6811–6819. [Google Scholar] [CrossRef]
  54. Sorensen, J.A.; Hamling, J.A. Historical Bakken test data provide critical insights on EOR in tight oil plays: The American Oil & Gas Reporter. Am. Oil Gas Rep. 2016, 59, 55–61. [Google Scholar]
  55. Burrows, L.C.; Haeri, F.; Cvetic, P.; Sanguinito, S.; Shi, F.; Tapriyal, D.; Goodman, A.L.; Enick, R.M. A Literature Review of CO2, Natural Gas, and Water-Based Fluids for Enhanced Oil Recovery in Unconventional Reservoirs. Energy Fuels 2020, 34, 5331–5380. [Google Scholar] [CrossRef]
  56. Milad, M.; Junin, R.; Sidek, A.; Imqam, A.; Tarhuni, M. Huff-n-Puff Technology for Enhanced Oil Recovery in Shale/Tight Oil Reservoirs: Progress, Gaps, and Perspectives. Energy Fuels 2021, 35, 17279–17333. [Google Scholar] [CrossRef]
  57. Thakur, G. Enhanced Recovery Technologies for Unconventional Oil Reservoirs. J. Pet. Technol. 2019, 71, 66–69. [Google Scholar] [CrossRef]
  58. Owusu, P.A.; DeHua, L.; Nyantakyi, E.K.; Nagre, R.D.; Borkloe, J.K.; Frimpong, I.K. Prognosticating the Production Performance of Saturated Gas Drive Reservoir: A Theoretical Perspective. Int. J. Min. Eng. Miner. Process. 2013, 2, 24–33. [Google Scholar]
  59. Wu, K.; Wu, B.; Yu, W. Mechanism Analysis of Well Interference in Unconventional Reservoirs: Insights From Fracture-Geometry Simulation Between Two Horizontal Wells. SPE Prod. Oper. 2018, 33, 12–20. [Google Scholar] [CrossRef]
  60. Siddiqui, S.; Kumar, A. Well Interference Effects for Multiwell Configurations in Unconventional Reservoirs. In Proceedings of the Abu Dhabi International Petroleum Exhibition and Conference, Abu Dhabi, United Arab Emirates, 7–10 November 2016; SPE: Abu Dhabi, United Arab Emirates, 2016; p. D021S036R004. [Google Scholar] [CrossRef]
  61. Datta-Gupta, A.; Huang, J.; King, M.J.; Olalotiti-Lawal, F. Modeling Well Interference and Optimal Well Spacingin Unconventional Reservoirs Using Fast Marching Method. In Proceedings of the 5th Unconventional Resources Technology Conference, Austin, TX, USA, 26–28 July 2017; American Association of Petroleum Geologists: Tulsa, OK, 2017. [Google Scholar] [CrossRef]
  62. Yu, W.; Wu, K.; Zuo, L.; Tan, X.; Weijermars, R. Physical Models for Inter-Well Interference in Shale Reservoirs: Relative Impacts of Fracture Hits and Matrix Permeability. In Proceedings of the 4th Unconventional Resources Technology Conference, San Antonio, TX, USA, 20–22 July 2016; American Association of Petroleum Geologists: Tulsa, OK, USA, 2016. [Google Scholar] [CrossRef]
  63. Iino, A.; Jung, H.Y.; Onishi, T.; Datta-Gupta, A. Rapid Simulation Accounting for Well Interference in Unconventional Reservoirs Using Fast Marching Method. In Proceedings of the 8th Unconventional Resources Technology Conference, Virtual, 20–22 July 2020; American Association of Petroleum Geologists: Tulsa, OK, USA, 2020. [Google Scholar] [CrossRef]
  64. Qin, J.-Z.; Zhong, Q.-H.; Tang, Y.; Yu, W.; Sepehrnoori, K. Well Interference Evaluation Considering Complex Fracture Networks through Pressure and Rate Transient Analysis in Unconventional Reservoirs. Pet. Sci. 2023, 20, 337–349. [Google Scholar] [CrossRef]
  65. Almasoodi, M.; Andrews, T.; Johnston, C.; Singh, A.; McClure, M. A New Method for Interpreting Well-to-Well Interference Tests and Quantifying the Magnitude of Production Impact: Theory and Applications in a Multi-Basin Case Study. Geomech. Geophys. Geo-Energy Geo-Resour. 2023, 9, 95. [Google Scholar] [CrossRef]
  66. Al-Shami, T.M.; Jufar, S.R.; Kumar, S.; Abdulelah, H.; Abdullahi, M.B.; Al-Hajri, S.; Negash, B.M. A Comprehensive Review of Interwell Interference in Shale Reservoirs. Earth-Sci. Rev. 2023, 237, 104327. [Google Scholar] [CrossRef]
  67. Sambo, C.; Liu, N.; Shaibu, R.; Ahmed, A.A.; Hashish, R.G. A Technical Review of CO2 for Enhanced Oil Recovery in Unconventional Oil Reservoirs. Geoenergy Sci. Eng. 2023, 221, 111185. [Google Scholar] [CrossRef]
  68. Dung, B.; Nguyen, T.; Yoo, H. A Coupled Geomechanics-Reservoir Simulation Workflow to Estimate the Optimal Well-Spacing in the Wolfcamp Formation in Lea County. In Proceedings of the AADE National Technical Conference and Exhibition, Midland, TX, USA, 4–5 April 2023; Zenodo: Geneva, Switzerland, 2023. [Google Scholar] [CrossRef]
  69. Yu, H.; Xu, W.; Li, B.; Huang, H.; Micheal, M.; Wang, Q.; Huang, M.; Meng, S.; Liu, H.; Wu, H. Hydraulic Fracturing and Enhanced Recovery in Shale Reservoirs: Theoretical Analysis to Engineering Applications. Energy Fuels 2023, 37, 9956–9997. [Google Scholar] [CrossRef]
  70. Malozyomov, B.V.; Martyushev, N.V.; Kukartsev, V.V.; Tynchenko, V.S.; Bukhtoyarov, V.V.; Wu, X.; Tyncheko, Y.A.; Kukartsev, V.A. Overview of Methods for Enhanced Oil Recovery from Conventional and Unconventional Reservoirs. Energies 2023, 16, 4907. [Google Scholar] [CrossRef]
  71. Daramola, G.O.; Jacks, B.S.; Ajala, O.A.; Akinoso, A.E. Ai applications in reservoir management: Optimizing production and recovery in oil and gas fields. Comput. Sci. IT Res. J. 2024, 5, 972–984. [Google Scholar] [CrossRef]
  72. Reddicharla, N.; Alshehhi, S.S.; Kumar, A.; Konkati, S.; Ali, M.S.; Elmansour, A. A Novel Digital Framework for Intelligent and Real-Time Water Injection System Management. In Proceedings of the SPE Water Lifecycle Management Conference and Exhibition, Abu Dhabi, United Arab Emirates, 5–7 March 2024; SPE: Abu Dhabi, United Arab Emirates, 2024; p. D021S010R006. [Google Scholar] [CrossRef]
  73. Al Sawafi, M.S.; Al Ghailani, T.A.; Al Kindi, O.; Al Abri, M.; Al Hinai, S. 13 Years of Comprehensive Reservoir Monitoring and Surveillance in South of Oman EOR Polymer Project. In Proceedings of the Abu Dhabi International Petroleum Exhibition and Conference, Abu Dhabi, United Arab Emirates, 2–5 October 2023; SPE: Abu Dhabi, United Arab Emirates, 2023; p. D031S077R006. [Google Scholar] [CrossRef]
  74. Al Jawhari, M.O.; Bazuhair, A.K.; Lopez, J.E.; Alqemzi, M.; Cremades, P. Integration of a Production Optimization System with Intelligent Well Surveillance for an Effective Reservoir Management in Abu Dhabi Field. In Proceedings of the Abu Dhabi International Petroleum Exhibition and Conference, Abu Dhabi, United Arab Emirates, 2–5 October 2023; SPE: Abu Dhabi, United Arab Emirates, 2023; p. D041S130R008. [Google Scholar] [CrossRef]
  75. Rubio, E.; Reddicharla, N. Enhanced Back Allocation Process Assisted by Real Time AI-Based Virtual Metering. Field Case Study in a Giant Field Project. In Proceedings of the Abu Dhabi International Petroleum Exhibition and Conference, Abu Dhabi, United Arab Emirates, 2–5 October 2023; SPE: Abu Dhabi, United Arab Emirates, 2023; p. D041S135R005. [Google Scholar] [CrossRef]
  76. Kim, J.; Yoon, H.; Hwang, S.; Jeong, D.; Ki, S.; Liang, B.; Jeong, H. Real-Time Monitoring of CO2 Transport Pipelines Using Deep Learning. Process. Saf. Environ. Prot. 2024, 181, 480–492. [Google Scholar] [CrossRef]
  77. Jia, D.; Zhang, J.; Li, Y.; Wu, L.; Qiao, M. Recent Development of Smart Field Deployment for Mature Waterflood Reservoirs. Sustainability 2023, 15, 784. [Google Scholar] [CrossRef]
  78. Khalifa, H.; Tomomewo, O.S.; Ndulue, U.F.; Berrehal, B.E. Machine Learning-Based Real-Time Prediction of Formation Lithology and Tops Using Drilling Parameters with a Web App Integration. Eng 2023, 4, 2443–2467. [Google Scholar] [CrossRef]
  79. Bello, K.; Vikara, D.; Sheriff, A.; Viswanathan, H.; Carr, T.; Sweeney, M.; O’Malley, D.; Marquis, M.; Vactor, R.T.; Cunha, L. Evaluation of the Economic Implications of Varied Pressure Drawdown Strategies Generated Using a Real-Time, Rapid Predictive, Multi-Fidelity Model for Unconventional Oil and Gas Wells. Gas Sci. Eng. 2023, 113, 204972. [Google Scholar] [CrossRef]
  80. Al Sawafi, M.M.; Aljabri, A. South Oman Polymer Project: A Decade of Operational Excellence and Comprehensive Reservoir Monitoring and Surveillance. In Proceedings of the Abu Dhabi International Petroleum Exhibition and Conference, Abu Dhabi, United Arab Emirates, 2–5 October 2023; SPE: Tulsa, OK, USA, 2024; p. D021S010R004. [Google Scholar] [CrossRef]
  81. Ouladmansour, A.; Ameur-Zaimeche, O.; Kechiched, R.; Heddam, S.; Wood, D.A. Integrating Drilling Parameters and Machine Learning Tools to Improve Real-Time Porosity Prediction of Multi-Zone Reservoirs. Case Study: Rhourd Chegga Oilfield, Algeria. Geoenergy Sci. Eng. 2023, 223, 211511. [Google Scholar] [CrossRef]
  82. Al-Rbeawi, S. A Review of Modern Approaches of Digitalization in Oil and Gas Industry. Upstream Oil Gas Technol. 2023, 11, 100098. [Google Scholar] [CrossRef]
  83. Shi, W.; Yin, G.; Wang, M.; Tao, L.; Wu, M.; Yang, Z.; Bai, J.; Xu, Z.; Zhu, Q. Progress of Electrical Resistance Tomography Application in Oil and Gas Reservoirs for Development Dynamic Monitoring. Processes 2023, 11, 2950. [Google Scholar] [CrossRef]
  84. Paroha, A.D. Real-Time Monitoring of Oilfield Operations with Deep Neural Networks. In Proceedings of the 2024 2nd International Conference on Advancement in Computation & Computer Technologies (InCACCT), Gharuan, India, 2–3 May 2024; IEEE: Gharuan, India, 2024; pp. 176–181. [Google Scholar] [CrossRef]
  85. Maduabuchi, E. Artificial Intelligence (AI) Application in Process Safety Cumulative Risk Visualization for Petroleum Operations: Conceptual Framework. Int. J. Eng. Adv. Technol. Stud. 2024, 12, 33–49. [Google Scholar] [CrossRef]
  86. Al Aamri, G.; Al Bulushi, A.; Abelazim, M.; Kurniadi, S.D.; Al-Ghaiti, A.; Siddiqui, M.; Hassan, K.; Guzman, R.C.; Mowad, B.; Alyahyaai, H. Real-Time Data Harvesting: A Confirmation of Fracture Geometry Development and Production Using Fiber Optic in Deep Tight Gas Wells. In Proceedings of the SPE EOR Conference at Oil and Gas West Asia, Muscat, Oman, 22–24 April 2024; SPE: Muscat, Oman, 2024; p. D011S010R005. [Google Scholar] [CrossRef]
  87. Patil, P.D.; Al-Qasim, A.S.; Al-Zayani, A.I.; Kokal, S.L. End-To-End Surface and Subsurface Monitoring and Surveillance for the Onshore and Offshore CCS or CCUS Projects. In Proceedings of the Offshore Technology Conference, Houston, TX, USA, 1–4 May 2023; OTC: Houston, TX, USA, 2023; p. D011S002R008. [Google Scholar] [CrossRef]
  88. Pi, Y.; Liu, J.; Cao, R.; Liu, L.; Ma, Y.; Gu, X.; Li, X.; Fan, X.; Zhao, M. Visualized Study on a New Preformed Particle Gels (PPG) + Polymer System to Enhance Oil Recovery by Oil Saturation Monitoring Online Flooding Experiment. Gels 2023, 9, 81. [Google Scholar] [CrossRef] [PubMed]
  89. Yekeen, N.; Salampessy, S.N.; Abu Bakar, A.H.; Ali, M.; Okunade, O.A.; Musa, S.A.; Bavoh, C.B. Synthesis and Pore-Scale Visualization Studies of Enhanced Oil Recovery Mechanisms of Rice Straw Silica Nanoparticles. Geoenergy Sci. Eng. 2023, 221, 111292. [Google Scholar] [CrossRef]
  90. Wang, S.; Schultheiss, N.; Kim, S. DDDAS Within the Oil and Gas Industry. Handb. Dyn. Data Driven Appl. Syst. 2023, 2, 331–351. [Google Scholar]
  91. Chang, W.; Cheng, J.; Allaire, J.J.; Sievert, C.; Schloerke, B.; Xie, Y.; Allen, J.; McPherson, J.; Dipert, A.; Borges, B. Shiny: Web Application Framework for R. R Package Version 1.6.0. 2021. Available online: https://CRAN.R-project.org/package=shiny (accessed on 1 November 2021).
  92. Jiang, Z.; Cao, W.; Chu, H.; Bazerbachi, F.; Siegel, L. RIMeta: An R shiny tool for estimating the reference interval from a meta-analysis. Res. Synth. Methods 2023, 14, 468–478. [Google Scholar] [CrossRef] [PubMed]
  93. Hernández, A.; Endesfelder, D.; Einbeck, J.; Puig, P.; Benadjaoud, M.A.; Higueras, M.; Ainsbury, E.; Gruel, G.; Oestreicher, U.; Barrios, L.; et al. Biodose Tools: An R shiny application for biological dosimetry. Int. J. Radiat. Biol. 2023, 99, 1378–1390. [Google Scholar] [CrossRef] [PubMed]
  94. Meyer, E.L.; Kumaus, C.; Majka, M.; Koenig, F. An Interactive R-Shiny App for Quickly Visualizing a Tidy, Long Dataset with Multiple Dimensions with an Application in Clinical Trial Simulations for Platform Trials. SoftwareX 2023, 22, 101347. [Google Scholar] [CrossRef]
  95. Llambrich, M.; Satorra, P.; Correig, E.; Guma, J.; Brezmes, J.; Tebe, C.; Cumeras, R. Easy-Amanida: An R Shiny application for the meta-analysis of aggregate results in clinical metabolomics using Amanida and Webchem. Res. Synth. Methods 2024, 15, e1713. [Google Scholar] [CrossRef] [PubMed]
  96. Yik, B.J.; Schreurs, D.G.; Raker, J.R. Implementation of an R Shiny App for Instructors: An Automated Text Analysis Formative Assessment Tool for Evaluating Lewis Acid–Base Model Use. J. Chem. Educ. 2023, 100, 3107–3113. [Google Scholar] [CrossRef]
  97. Zhan, L.; Luo, X.; Xie, W.; Zhu, X.-A.; Xie, Z.; Lin, J.; Li, L.; Tang, W.; Wang, R.; Deng, L.; et al. shinyTempSignal: An R Shiny Application for Exploring Temporal and Other Phylogenetic Signals. J. Genet. Genom. 2024, 51, 762–768. [Google Scholar] [CrossRef]
  98. Wickham, H. Ggplot2: Elegant Graphics for Data Analysis; Springer: New York, NY, USA, 2016. [Google Scholar]
  99. Chen, T.; Guestrin, C. XGBoost: A Scalable Tree Boosting System. In Proceedings of the 22nd ACM SIGKDD International Conference on Knowledge Discovery and Data Mining, San Francisco, CA, USA, 13–17 August 2016; ACM: New York, NY, USA, 2016; pp. 785–794. [Google Scholar] [CrossRef]
  100. Bahaloo, S.; Mehrizadeh, M.; Najafi-Marghmaleki, A. Review of Application of Artificial Intelligence Techniques in Petroleum Operations. Pet. Res. 2023, 8, 167–182. [Google Scholar] [CrossRef]
  101. Abdalla, R.; Al-Hakimi, W.; Perozo, N.; Jaeger, P. Real-Time Liquid Rate and Water Cut Prediction From the Electrical Submersible Pump Sensors Data Using Machine-Learning Algorithms. ACS Omega 2023, 8, 12671–12692. [Google Scholar] [CrossRef]
  102. Li, J.; Guo, Y.; Fu, Z.; Zhang, X.; Shen, F. An Intelligent Energy Management Information System with Machine Learning Algorithms in Oil and Gas Industry. Edited by Chia-Huei Wu. Wirel. Commun. Mob. Comput. 2023, 2023, 3385453. [Google Scholar] [CrossRef]
  103. Elahifar, B.; Hosseini, E. A New Approach for Real-Time Prediction of Stick–Slip Vibrations Enhancement Using Model Agnostic and Supervised Machine Learning: A Case Study of Norwegian Continental Shelf. J. Pet. Explor. Prod. Technol. 2023, 14, 175–201. [Google Scholar] [CrossRef]
  104. Khaled, M.S.; Wang, N.; Ashok, P.; van Oort, E.; Wisian, K. Real-Time Prediction of Bottom-Hole Circulating Temperature in Geothermal Wells Using Machine Learning Models. Geoenergy Sci. Eng. 2024, 238, 212891. [Google Scholar] [CrossRef]
  105. Sircar, A.; Yadav, K.; Rayavarapu, K.; Bist, N.; Oza, H. Application of machine learning and artificial intelligence in oil and gas industry. Pet. Res. 2021, 6, 379–391. [Google Scholar] [CrossRef]
  106. Wu, C.; Merzoug, A.; Wan, X.; Ling, K.; Zhao, J.; Jiang, T.; Jin, L. Development of a New CO2 EOR Screening Approach Focused on Deep-Depth Reservoirs. Geoenergy Sci. Eng. 2023, 231, 212335. [Google Scholar] [CrossRef]
  107. Motaei, E.; Ganat, T. Smart Proxy Models Art and Future Directions in the Oil and Gas Industry: A Review. Geoenergy Sci. Eng. 2023, 227, 211918. [Google Scholar] [CrossRef]
  108. Asante, J.; Ampomah, W.; Carther, M. Forecasting Oil Recovery Using Long Short Term Memory Neural Machine Learning Technique. In Proceedings of the SPE Western Regional Meeting, Anchorage, AK, USA, 22–25 May 2023; SPE: Anchorage, AK, USA, 2023; p. D021S004R004. [Google Scholar] [CrossRef]
  109. Nagao, M.; Yao, C.; Onishi, T.; Chen, H.; Datta-Gupta, A.; Mishra, S. An Efficient Deep Learning-Based Workflow for CO2 Plume Imaging Considering Model Uncertainties with Distributed Pressure and Temperature Measurements. Int. J. Greenh. Gas Control 2024, 132, 104066. [Google Scholar] [CrossRef]
  110. Wang, L.; Yao, Y.; Luo, X.; Adenutsi, C.D.; Zhao, G.; Lai, F. A Critical Review on Intelligent Optimization Algorithms and Surrogate Models for Conventional and Unconventional Reservoir Production Optimization. Fuel 2023, 350, 128826. [Google Scholar] [CrossRef]
  111. Alrowayyeh, J.; Dhote, P.; Alqenaei, A. Machine Learning Model for Efficient Surveillance of Electrostatic Pump Operations & Predictive Analytics for Early Alarming System. In Proceedings of the SPE EOR Conference at Oil and Gas West Asia, Muscat, Oman, 22–24 April 2024; SPE: Muscat, Oman, 2024; p. D031S032R004. [Google Scholar] [CrossRef]
  112. Su, S.; Zhang, N.; Wang, P.; Jia, S.; Zhang, A.; Wang, H.; Zhang, M. Investigation and Optimization of EOR Screening by Implementing Machine Learning Algorithms. Appl. Sci. 2023, 13, 12267. [Google Scholar] [CrossRef]
  113. Nagao, M.; Datta-Gupta, A.; Onishi, T.; Sankaran, S. Reservoir Connectivity Identification and Robust Production Forecasting Using Physics Informed Machine Learning. In Proceedings of the SPE Reservoir Simulation Conference, Galveston, TX, USA, 28–30 March 2023; SPE: Galveston, TX, USA, 2023; p. D011S004R002. [Google Scholar] [CrossRef]
  114. Yao, C.; Nagao, M.; Datta-Gupta, A.; Mishra, S. An Efficient Deep Learning-Based Workflow for Real-Time CO2 Plume Visualization in Saline Aquifer Using Distributed Pressure and Temperature Measurements. Geoenergy Sci. Eng. 2024, 239, 212990. [Google Scholar] [CrossRef]
  115. Bigdeli, A.; Delshad, M. The Evolving Landscape of Oil and Gas Chemicals: Convergence of Artificial Intelligence and Chemical-Enhanced Oil Recovery in the Energy Transition Toward Sustainable Energy Systems and Net-Zero Emissions. J. Data Sci. Intell. Syst. 2024, 2, 65–78. [Google Scholar] [CrossRef]
  116. Azmi, P.A.R.; Yusoff, M.; Sallehud-Din, M.T.M. A Review of Predictive Analytics Models in the Oil and Gas Industries. Sensors 2024, 24, 4013. [Google Scholar] [CrossRef] [PubMed]
  117. Samnioti, A.; Gaganis, V. Applications of Machine Learning in Subsurface Reservoir Simulation—A Review—Part II. Energies 2023, 16, 6727. [Google Scholar] [CrossRef]
  118. Mao, J.; Ghahfarokhi, A.J. A Review of Intelligent Decision-Making Strategy for Geological CO2 Storage: Insights from Reservoir Engineering. Geoenergy Sci. Eng. 2024, 240, 212951. [Google Scholar] [CrossRef]
  119. Fetisov, V.; Ilyushin, Y.V.; Vasiliev, G.G.; Leonovich, I.A.; Müller, J.; Riazi, M.; Mohammadi, A.H. Development of the Automated Temperature Control System of the Main Gas Pipeline. Sci. Rep. 2023, 13, 3092. [Google Scholar] [CrossRef]
  120. Arinze, C.A.; Ajala, O.A.; Okoye, C.C.; Ofodile, O.C.; Daraojimba, A.I. Evaluating the integration of advanced it solutions for emission reduction in the oil and gas sector. Eng. Sci. Technol. J. 2024, 5, 639–652. [Google Scholar] [CrossRef]
  121. Knebel, F.P.; Trevisan, R.; Nascimento, G.S.D.; Abel, M.; Wickboldt, J.A. A Study on Cloud and Edge Computing for the Implementation of Digital Twins in the Oil & Gas Industries. Comput. Ind. Eng. 2023, 182, 109363. [Google Scholar] [CrossRef]
  122. Mohammed, A.S.; Anthi, E.; Rana, O.; Saxena, N.; Burnap, P. Detection and Mitigation of Field Flooding Attacks on Oil and Gas Critical Infrastructure Communication. Comput. Secur. 2023, 124, 103007. [Google Scholar] [CrossRef]
  123. Yuan, B.; Zhao, M.; Meng, S.; Zhang, W.; Zheng, H. Intelligent Identification and Real-Time Warning Method of Diverse Complex Events in Horizontal Well Fracturing. Pet. Explor. Dev. 2023, 50, 1487–1496. [Google Scholar] [CrossRef]
  124. Ramizah, A.R.; Gordon, G.K.F.; Tina, L.L.T.; Varma, G.; Muzahidin, M.S.; Willem, S.; Ahmad, S.H.; Sanggeetha, K.; Lester, T.M.; Khairul, A.M.; et al. Real-Time Surveillance and Analysis Tool for Intelligent Completion—An Ultimate Solution to Oil Recovery and Integrated Operation. In Proceedings of the SPE Asia Pacific Oil and Gas Conference and Exhibition, Jakarta, Indonesia, 17–19 October 2017; SPE: Jakarta, Indonesia, 2017; p. D011S004R005. [Google Scholar] [CrossRef]
  125. Ohalete, N.C.; Aderibigbe, A.O.; Ani, E.C.; Ohenhen, P.E.; Akinoso, A. Advancements in Predictive Maintenance in the Oil and Gas Industry: A Review of AI and Data Science Applications. World J. Adv. Res. Rev. 2023, 20, 167–181. [Google Scholar] [CrossRef]
  126. Ochulor, O.J.; Sofoluwe, O.O.; Ukato, A.; Jambol, D.D. Challenges and Strategic Solutions in Commissioning and Start-up of Subsea Production Systems. Magna Sci. Adv. Res. Rev. 2024, 11, 31–39. [Google Scholar] [CrossRef]
  127. Oyewole, A.T.; Okoye, C.C.; Ofodile, O.C.; Odeyemi, O.; Adeoye, O.B.; Addy, W.A.; Ololade, Y.J. Human resource management strategies for safety and risk mitigation in the oil and gas industry: A review. Int. J. Manag. Entrep. Res. 2024, 6, 623–633. [Google Scholar] [CrossRef]
  128. Jambol, D.D.; Sofoluwe, O.O.; Ukato, A.; Ochulor, O.J. Enhancing oil and gas production through advanced instrumentation and control systems. GSC Adv. Res. Rev. 2024, 19, 043–056. [Google Scholar]
  129. Wang, Z.-Z.; Zhang, K.; Chen, G.-D.; Zhang, J.-D.; Wang, W.-D.; Wang, H.-C.; Zhang, L.-M.; Yan, X.; Yao, J. Evolutionary-Assisted Reinforcement Learning for Reservoir Real-Time Production Optimization under Uncertainty. Pet. Sci. 2023, 20, 261–276. [Google Scholar] [CrossRef]
  130. Radich, A.; Filho, S.M.; Borges, R.; Scheid, C.; Meleiro, L.; Calçada, L. Real-Time Control and Monitoring of Drilling Fluids Density by Fuzzy-Based Control System. Geoenergy Sci. Eng. 2023, 222, 211421. [Google Scholar] [CrossRef]
  131. Zhao, J.; Jin, L.; Yu, X.; Azzolina, N.A.; Wan, X.; Smith, S.A.; Bosshart, N.W.; Sorensen, J.A. Field Implementation and Surveillance of Gas Injection Enhanced Oil Recovery in the Bakken. In Proceedings of the SPE/AAPG/SEG Unconventional Resources Technology Conference, Houston, TX, USA, 17–19 June 2024; URTeC: Houston, TX, USA, 2024; p. D021S042R001. [Google Scholar] [CrossRef]
Figure 1. Gamma-ray (GR) and density (DT-TGS) logs showed the stratigraphy of the Bakken Formation in the vertical well. The well was perforated at a depth of 10,940 to 10,950 ft, with packers to isolate the injection zone.
Energies 17 04200 g001
Figure 2. Illustration of postinjection PNL response due to CO2 injection in the Middle Bakken interval. More detailed information about the figure (well logs) was reported by Sorensen et al. [13].
Energies 17 04200 g002
Figure 3. Cross-section of well distribution at the Liberty rich gas EOR site (Case 11), where five wells were used for HnP operations in the field.
Energies 17 04200 g003
Figure 4. BHP changes with cumulative gas injection in the rich gas EOR process.
Energies 17 04200 g004
Figure 5. Schematic of the gas injection well (C3_Inj), offset production wells (M1–M6), and horizontal laterals in the Hess propane EOR pilot test.
Energies 17 04200 g005
Figure 6. Monthly gas injection rate in the Hess propane EOR pilot test.
Energies 17 04200 g006
Figure 7. Daily fluid production rate and propane injection rate in M1 and C3_Inj, respectively, and for the Hess propane EOR pilot test: (A) gas; (B) oil; and (C) water.
Energies 17 04200 g007
Figure 8. Monitoring of propane concentration in the gas stream produced from M1 (mol%, left y-axis) and propane injection rate in C3_Inj (right y-axis) for the Hess propane EOR pilot test.
Energies 17 04200 g008
Figure 9. Cross-section of well distribution for rich gas–water–surfactant EOR at the East Nesson site (Case No. 12), where one well was used for HnP operations in the field. The circle means a regular well and the star means the well was used for HnP test.
Energies 17 04200 g009
Figure 10. Gas and water injection rates at 10 MBH during the injection cycle.
Energies 17 04200 g010
Figure 11. WHP and BHP at 10 MBH during the injection cycle.
Energies 17 04200 g011
Figure 12. Monitoring of gas and water production rates in Offset Well 1 TFH.
Energies 17 04200 g012
Figure 13. Schematic of fracture distribution in the simulation model for the Dunn site.
Energies 17 04200 g013
Figure 14. Illustration of the regression results for the EOS: (a) gas-to-oil ratio and relative oil volume, and (b) oil and gas specific gravity.
Energies 17 04200 g014aEnergies 17 04200 g014b
Figure 15. History-matching results for the parent wells: (a) liquid rate (input constraint), (b) oil rate, (c) gas rate, and (d) water rate.
Energies 17 04200 g015aEnergies 17 04200 g015b
Figure 16. Illustration of an example well arrangement for gas EOR simulation using the seven-well DSU model.
Energies 17 04200 g016
Figure 17. Bottomhole pressure response in the HnP well (MB2) and two monitoring wells (TF2 and TF3) during the first four cycles of HnP at a gas injection rate of 3 MMscf/d.
Energies 17 04200 g017
Figure 18. EOR prediction of the HnP well (MB2) with different gas injection rates: (a) bottomhole pressure, (b) oil production rate, and (c) cumulative oil production.
Energies 17 04200 g018aEnergies 17 04200 g018b
Figure 19. Tracer injection page of the UI showing the tracer (attached to C1) tab for wells MB2, TF2, and TF3 for the given conditions of gas injection rate of 18 MMscfd, closed external offset production wells (MB1, MB3, TF1, and TF4), and 7500 psi injection well BHP. The thumb up sign means the parameter is selected.
Energies 17 04200 g019
Figure 20. Quantile plots of modeling performance evaluated by r2 and RRMSE values for the training and testing sets of EOR using rich gas or propane injection.
Energies 17 04200 g020
Figure 21. XGBoost predictions of EOR monitoring in wells TF2 and TF3 for the user inputs of the 18-MMscf/d rich gas injection rate and 7500 psi injection well maximum BHP in HnP well MB2: (top panel) oil, water, and gas production rates, and (bottom panel) cumulative oil, water, and gas production in wells TF2 and TF3, respectively.
Energies 17 04200 g021
Table 1. Summary of Bakken EOR pilot tests and their monitoring methods.
Case No.Pilot
Start Year
InjectateOperational
Method
Operator/
Reporter
State/
County
Routine DataMonitoring Methods/Data ReportedData Source
11994WaterHnP 1MeridianND/McKenzieMPIR 2, well logs [41]
22012WaterHnPEOGND/MountrailMPIR, well logs [41]
32014WaterFloodingMontana TechMT/(county N/A 3)MPIRDaily injection rate[12,41]
42015SurfactantHnPNalco ChampionND/(county N/A)MPIR [8]
52008CO2HnPEOGND/MountrailMPIR, well logs [41]
62009CO2HnPContinentalMT/(county N/A)MPIR [12]
72014CO2Flooding/injectivityWhitingND/MountrailMPIR, well logsDaily injection rate, WHP 4, gas composition[41]
82017CO2InjectivityXTOND/DunnMPIR, well logsDaily injection rate, BHP, gas composition, oil composition, well logs[13,41]
92017PropaneFloodingHessND/MountrailMPIR, well logsDaily production/injection rates, WHP, gas composition, tracer testing[17,41]
102014Rich gasFloodingEOGND/MountrailMPIR, well logs [41]
112018Rich gasHnPLibertyND/WilliamsMPIR, well logsDaily production/injection rates, BHP, gas composition, tracer testing[14,41]
122021Rich gas, water, surfactantHnPLibertyND/MountrailMPIR, well logsMinutely and daily production/injection rates, WHP, BHP[15,41]
1: Huff ‘n’ puff, an operational method for EOR. 2: Monthly production and injection rates. 3: Not available. 4: Wellhead pressure.
Table 2. Data and information collected from the pretest.
ParameterValue/Observation
Native reservoir pressure, psi8668
Initial bottomhole temperature, °F255
Minimum injection rate, gallons/minute (gpm)4.5
Maximum BHP achieved, psi9113
Tubing integrity to the injection pressureHeld up
Downhole gauge measurementsEffective
Fluid influx into the wellLow but consistent
Table 3. The timing and duration of each activity for the main test.
ActivityDuration, HourDaily Sequence
Site preparation161
Cyclic injection part 1162
Cyclic injection part 2 322–3
Continuous injection324–5
Shut-in45
Table 4. Main test injection statistics.
DayActivityCumulative CO2 Injected, Tons
1Filling10.4
1BHP from 8200 to 8600 psi0.2
1Cyclic inj.—Part 11.0
2Cyclic inj.—Part 15.4
2Cyclic inj.—Part 24.2
2Cyclic inj.—Part 24.7
3Cont. inj.8.1
4Cont. inj.51.8
5Cont. inj.13.0
Total98.9
Table 5. Simulation parameters for the baseline case test.
ParameterValue
HnP well MB2
Injection rate, MMscf/d1, 3, 6
HnP length, year2
Injection–soaking–production time, days/cycle 30–7–60
Injection gas composition (C1:C2:C3 in mole fraction) 0.7:0.2:0.1
Maximum injection pressure (BHP), psi 7500
Minimum production pressure (BHP), psi 100
Table 6. Composition of the EOS for gas breakthrough and EOR simulations.
No.ComponentTracer No.ComponentTracer
1N2N/A5IC4 to NC4N/A
2CH4TRC-C16IC5 to C12N/A
3C2H6TRC-C27C13 to C19N/A
4C3H8TRC-C38C20 to C30N/A
Table 7. Reservoir simulation case matrix for EOR monitoring during the propane and tracer injection processes.
Simulation Case No.IndicatorTF2 and TF3 during InjectionMB1, MB3, TF1, and TF4 during InjectionInj. Rate, MMscfd Max. Inj. BHP, psi
1–28PropaneShut inShut in0.5–181500–7500
29–56PropaneShut inOpen0.5–181500–7500
57–84TracerShut inShut in0.5–181500–7500
85–112TracerShut inOpen0.5–181500–7500
Table 8. Injection–soaking–production cycles in the HnP process.
Date (MM/DD/YY)Cycle
12345678
Injection start01/01/2004/07/2007/13/2010/18/2001/23/2104/30/2108/05/2111/10/21
Injection end01/30/2005/06/2008/11/2011/16/2002/21/2105/29/2109/03/2112/09/21
Soaking start01/31/2005/07/2008/12/2011/17/2002/22/2105/30/2109/04/2112/10/21
Soaking end02/06/2005/13/2008/18/2011/23/2002/28/2106/05/2109/10/2112/16/21
Production start02/07/2005/14/2008/19/2011/24/2003/01/2106/06/2109/11/2112/17/21
Production end 04/06/2007/12/2010/17/2001/22/2104/29/2108/04/2111/09/2112/31/21
Table 9. Change of well status for MB2 in different HnP stages when all the offset wells (MB1, MB3, TF1, TF2, TF3, and TF4) were kept open (producing).
StageCycle 1 as an ExampleWell Status
Date (MM/DD/YY)OpenClosed
Injection01/01/20 to 01/30/20MB2 (injecting)---
Soaking01/31/20 to 02/06/20---MB2
Producing02/07/20 to 04/06/20MB2---
Table 10. Change of well status for MB2, TF2, and TF3 in different HnP stages when external offset wells (MB1, MB2, TF1, TF2, TF3, and TF4) were closed (shut-in).
StageCycle 1 as an ExampleWell Status
Date (MM/DD/YY)OpenClosed
Injection01/01/20 to 01/30/20MB2 (injecting)TF2, TF3
Soaking01/31/20 to 02/06/20---TF2, MB2, TF3
Producing02/07/20 to 04/06/20TF2, MB2, TF3---
Table 11. Hyperparameters of the XGBoost algorithm.
ParameterDescription
nroundsMaximum number of iterations
max_depthMaximum depth of the tree
gammaRegularization coefficient
min_child_weightMinimum number of instances required in a child node
etaLearning rate
subsampleNumber of samples supplied to a tree
colsample_bytreeNumber of features (variables) supplied to a tree
Disclaimer/Publisher’s Note: The statements, opinions and data contained in all publications are solely those of the individual author(s) and contributor(s) and not of MDPI and/or the editor(s). MDPI and/or the editor(s) disclaim responsibility for any injury to people or property resulting from any ideas, methods, instructions or products referred to in the content.

