Article

A New Method for Evaluating the Brittleness of Shale Oil Reservoirs in Block Y of Ordos Basin of China

1
College of Petroleum Engineering, Xi’an Shiyou University, Xi’an 710065, China
2
Shaanxi Key Laboratory of Well Stability and Fluid & Rock Mechanics in Oil and Gas Reservoirs, Xi’an Shiyou University, Xi’an 710065, China
3
Exploration and Development Technology Research Center, Yanchang Oilfield Co., Ltd., Yan’an 716000, China
*
Authors to whom correspondence should be addressed.
Energies 2024, 17(17), 4201; https://doi.org/10.3390/en17174201
Submission received: 18 July 2024 / Revised: 19 August 2024 / Accepted: 21 August 2024 / Published: 23 August 2024
(This article belongs to the Section H: Geo-Energy)

Abstract

:
The brittleness index, as the most important parameter for brittleness evaluation, directly affects the compressibility of unconventional reservoirs. Currently, there is no unified calculation method for the brittleness index. This article uses a three-axis rock mechanics servo testing system to test the rock mechanics parameters of shale oil reservoirs in Block Y of the Ordos Basin and uses an X’Pert PRO X-ray diffractometer to test the rock mineral composition. The average volume fraction of quartz minerals, feldspar, and clay minerals in 36 samples of Block Y was tested to be 22.6%, 51.6%, and 18%, respectively. Calcite, dolomite, and pyrite are only present in a few samples. When the confining pressure is 30 MPa, the elastic modulus of the Chang 7 shale in this block is 14.72–34.58 GPa, with an average value of 23.77 GPa; The Poisson’s ratio ranges from 0.106 to 0.288, with an average of 0.182; The differential stress ranges from 100.8 to 260.1 MPa, with an average of 164.36 MPa; The peak strain ranges from 0.57 to 1.21, with an average of 0.91. This article compares several mainstream brittle index evaluation methods and identifies the most suitable brittle index evaluation method for Block Y. Using the Jarvie mineral composition method to calculate the brittleness index 1 (MBI), the average value of 36 experimental results is 0.5393. Using the Rickman normalized Young’s modulus and Poisson’s ratio average value to calculate the brittleness index 2 (EBI), the average value of 36 experimental results is 0.5204. Based on the stress-strain curve and energy method, a model for brittleness index 3 (DBI) is established, and the average value of 36 experimental results is 0.5306. The trend of the brittleness index calculated by the three methods is consistent, indicating the feasibility of the newly established brittleness evaluation method. From the perspectives of mineral composition, rock mechanics parameters, and energy, establishing a brittleness evaluation method for shale oil reservoirs and studying its evaluation method is of great significance for sweet spot prediction in reservoir engineering, providing theoretical support for the selection of fractured intervals in the Chang 7 shale oil reservoir in Block Y of the Ordos Basin.

1. Introduction

Shale oil and gas resources are highly enriched worldwide [1,2]. In recent years, shale oil and gas production in North America has grown rapidly, and the United States has shifted from an oil-importing country to an oil-exporting country, relying heavily on breakthroughs in shale oil and gas exploration and development [3,4]. Shale oil and gas reservoirs are formed in situ, transformed in situ, and self-generated and self-stored. They have the characteristics of low porosity and low permeability and have no natural production capacity. Therefore, large-scale hydraulic fracturing technology is required for shale reservoir development [5,6,7]. In recent years, China’s dependence on foreign crude oil has gradually increased. The Ordos Basin is the second largest basin in China, with abundant resources such as oil, gas, and coal. Shale oil, as an important replacement resource, is usually developed using the method of “horizontal well + volume fracturing”.
A 1 billion ton Qingcheng shale oil field has been discovered in the Yanchang Formation of the Ordos Basin, with a cumulative proven geological reserve of 11.53 × 10⁸ t [8]. Self-generated and self-stored Chang 7 shale oil has become the main potential resource in the Ordos Basin, and unconventional oil and gas have become important replacement resources. The shale reservoir has a large amount of resources, dense lithology, poor physical conditions, and no effective production capacity under natural conditions. Conventional drilling and production methods cannot achieve large-scale commercial exploitation, and they must be transformed through “horizontal wells+volume fracturing” to improve the reservoir’s permeability [9,10]. The hydraulic fracturing process is complex and requires a large amount of human resources and material resources, especially with the emergence of new technologies represented by horizontal well-segmented fracturing, which further increases the difficulty and cost of construction. Therefore, to reduce the difficulty and cost of construction, scholars at home and abroad have proposed the concept of compressibility in recent years. The aim is to enhance the understanding of different well positions and layers in the research block before fracturing construction, screen suitable objects for fracturing in a short period of time, and ultimately achieve the goal of improving the success rate of fracturing and improving the fracturing effect. The brittleness index is an important parameter in compressibility evaluation, and an accurate description of brittleness is beneficial for layer and section selection. The development well of the Chang 7 reservoir in the research area has the characteristics of high initial production and rapid decline in the early stages. It is in the early stage of development, and research on reservoir characteristics and related aspects is relatively weak. The fracturing effect is directly related to the mechanical characteristics of reservoir rocks. Therefore, it is necessary to study the rock mechanical parameters in the research area [11]. The brittleness index (BI) is an important parameter for evaluating whether shale oil reservoirs are prone to forming complex fracture networks [12,13]. In addition, the brittleness index is also a key parameter for determining the optimal fracturing section of shale oil reservoirs. Currently, there is relatively little research on brittleness in shale oil reservoirs, and scholars at home and abroad have proposed multiple methods to characterize brittleness. Therefore, further discussion is needed when selecting methods for brittleness evaluation. This article evaluates reservoir brittleness using different calculation methods and analyzes the main controlling factors of brittleness.
Domestic and foreign scholars have conducted more evaluations on the brittleness of sandstone reservoirs but less on shale oil reservoirs. Regarding the brittleness index, different people have different purposes and apply it to their respective fields. The accuracy of brittleness index evaluation methods varies among different blocks. This article aims to identify a suitable brittleness index evaluation method for the Chang-7 shale oil reservoir in the northwest of the Ordos Basin, construct a brittleness index evaluation method, ensure accurate evaluation of the brittleness index of the block, and analyze the main controlling factors of brittleness, to more accurately select layers and sections for shale oil reservoir volume fracturing.

2. Rock Brittleness Evaluation Method Theory

At present, scholars at home and abroad have conducted extensive research on the brittleness index, and most of their research results are based on their respective research purposes and applied to their respective fields. Multiple methods have been proposed based on mineral composition, elastic modulus, Poisson’s ratio, fracture toughness, tensile strength, compressive strength, total stress-strain curve, cohesion, internal friction angle, logging curve, etc.
The first method is to evaluate rock brittleness based on the mineral composition method. Mineral composition is an internal factor that affects the mechanical properties of rocks. Studies have shown that different mineral compositions of rocks have a significant impact on mechanical parameters and brittle fracture characteristics. Therefore, there must be a direct correlation between rock mineral composition and brittleness [14,15,16]. Jarvie et al. [17] proposed calculating rock brittleness based on shale mineral composition, dividing rocks into three categories: quartz, carbonate rocks, and clay. The quartz group includes quartz, feldspar, and pyrite. The carbonate rock formation includes calcite, dolomite, and siderite. The clay group includes total clay minerals. Quartz content is the most brittle, carbonate rock is moderate, and the more clay minerals there are, the less brittleness.
The second method is to evaluate rock brittleness based on rock mechanics parameters. Rickman et al. [18] evaluated the brittleness of rocks by combining Young’s modulus and Poisson’s ratio. Due to the different units of Young’s modulus and Poisson’s ratio, the brittleness caused by each component is unified, and then the average value is taken to obtain the brittleness coefficient expressed as a percentage.
Brittleness refers to the deformation characteristics and fracture behavior of rocks under mechanical action. The deformation characteristics of rocks are mainly reflected in the mechanical behavior before the peak, while the fracture behavior is mainly manifested in the stress changes after the peak. According to the characterization of brittleness from different perspectives, the evaluation methods for brittleness at home and abroad are shown in Table 1.

3. Experimental Materials and Method

The Y block of the M oilfield is located in the northwest of the Ordos Basin. The Yanchang formation Chang 7 of the block has abundant oil and gas resources, with a total of 93 oil wells, including 52 conventional wells with a total cumulative oil production of 47,629.51 tons, an average daily oil production of 0.21 tons per well, 41 horizontal wells with a total cumulative oil production of 132,344 tons, and an average daily oil production of 8.45 tons per well. There is a significant difference in production between conventional and horizontal wells. Studying the geological characteristics of the area is helpful for further exploitation of shale oil reservoirs. The development of this block using “horizontal well + volume fracturing” resulted in better results. Before fracturing, evaluate the rock parameters of the reservoir to provide a parameter basis for the fracturing design plan. Firstly, conduct triaxial fracturing experiments to test the mechanical properties of the rock. Secondly, analyze the mineral composition of the rock after triaxial crushing using an X-ray diffractometer. Calculate the brittleness index of rocks using three different methods and analyze the main controlling factors of brittleness. The main purpose of brittle evaluation is to select shale reservoirs with promising oil and gas prospects that can be effectively fractured to achieve profitable production.

3.1. Experimental Samples and Instruments

The experimental cores were all taken from the shale oil reservoir in the Yanchang Formation Chang 7 of Block Y in the northwest of the Ordos Basin, with a depth of 2200–3000 m. Thirty-six cylindrical rock cores (numbered S-1~S-36) were cut into Φ25 mm × 50 mm parallel bedding planes, and the surface of the obtained cores showed no obvious cracks.
Experimental instrument: (1) RTR-1500 static (dynamic) triaxial rock mechanics servo testing system manufactured by GCTS company in the United States. The maximum axial pressure of the testing system is 2000 KN, the maximum confining pressure is 210 MPa, the pore pressure is 210 MPa, the dynamic frequency is 10 Hz, and the temperature is 200 °C. The experimental control accuracy is: pressure is 0.01 MPa, liquid volume is 0.01 g/cm3, and deformation is 0.001 mm. The testing is carried out in accordance with the national standard GB/T 50266-2013 [29] (2) X’Pert PRO X-ray diffractometer, detection basis: SY/T 5163-1995 [30].

3.2. Experimental Steps

The testing steps for the triaxial compression experiment of shale oil reservoirs include (1) rock sample processing (oil washing, soaking, drying), sample plastic sealing, and installation of various sensors. After installation, the sensors are zeroed, hydraulic oil is installed, a vacuum is evacuated to remove air, an experimental control program is developed, a temperature controller is adjusted to simulate formation temperature, and axial and transverse deformation values under various levels of stress are synchronously recorded during the application of axial load. (2) Start the oil pump, apply a differential stress of 0.5 MPa, increase the confining pressure (Pc = σ2 = σ3) to the specified value, keep the confining pressure unchanged, reset various displacement sensors, and start the experimental program. The actual control is to use strain control and increase σ1 until the sample is damaged.
Mineral composition testing steps: (1) First, clean the core with distilled water. (2) After allowing the block sample to stand and dry in the sun, grind it in a mortar to around 150 mesh, (3) and feel it without any particle sensation. Prepare a glass slide. (4) Place the prepared glass slide on the experimental platform of the X-ray diffractometer, select the technical parameters and experimental conditions, start the instrument for testing, and stop the experiment when the goniometer rotates beyond the scanning range.

4. Experimental Results and Analysis

4.1. Experimental Results

The 36 cores obtained from 8 exploration wells were sequentially numbered S-1~S-36. Through X-ray diffraction experiments, the mineral content of the rocks was analyzed using the X’Pert PRO X-ray diffractometer. Test basis: SY/T5163-1995 “X-ray diffraction analysis method for relative content of clay minerals in sedimentary rocks”. The XRD experimental sample is rock powder, and the rock powder used in the experiment is prepared by grinding the core sample after triaxial compression. The triaxial stress test and mineral composition test results of 36 samples from the Chang 7 oil layer group in Block Y of M Oilfield are shown in Table 2 and Figure 1.
From Table 1 and Figure 1, it can be seen that the rocks of the Chang 7 reservoir in Block Y of the M oilfield contain seven minerals, including quartz and feldspar. The volume fraction of quartz minerals is 15.2~31.8%, with an average of 22.6%, and the volume fraction of feldspar is 27.2~68.6%, with an average of 51.6% (including plagioclase with a volume fraction of 19.6~53.5%, with an average of 41.8%). The volume fraction of clay minerals is 9.4~30.2%, with an average of 18%. Calcite, dolomite, and pyrite are only present in a few samples. When the confining pressure is 30 MPa, the elastic modulus of the Chang 7 shale in this block is 14.72~34.58 GPa, with an average value of 23.77 GPa; The Poisson’s ratio is 0.106~0.288, with an average value of 0.182; The differential stress is 100.8~260.1 MPa, with an average value of 164.36 MPa; The peak strain ranges from 0.57 to 1.21, with an average value of 0.91.
Draw a rock classification triangle diagram of mineral component volume content, as shown in Figure 2. From Figure 2, it can be seen that the mineral component points are all located in Region IV and belong to feldspar sandstone.
Further analysis was conducted on 36 samples of clay minerals, and the test results are shown in Table 3. From Table 2, it can be seen that the clay minerals in this block include illite, kaolinite, chlorite, and illite/montmorillonite mixed layers. The volume fraction of illite is 20~48%, with an average of 38%; the volume fraction of kaolinite is 4~18%, with an average of 10%; and the volume fraction of chlorite is 15~60%, with an average of 32%. The volume fraction of the mixed layer is 3~35%, with an average of 20%.
The relationship between elastic modulus and Poisson’s ratio is shown in Figure 3: when the confining pressure is 30 MPa, the elastic modulus of the Chang 7 shale reservoir in this block is 14.72~34.58 GPa, with an average value of 23.77 GPa; The Poisson’s ratio is 0.106~0.288, with an average value of 0.182.
Shale oil reservoirs are mainly composed of siliceous minerals, carbonate minerals, and clay minerals, with significant differences in mechanical properties between different minerals. The elastic modulus and Poisson’s ratio of siliceous minerals, carbonate minerals, and clay minerals that make up shale oil reservoirs have significant differences. Therefore, when the content of each mineral component is different, the macroscopic mechanical properties of shale are inevitably different. The mineral composition and mechanical property test results of shale samples S-1~S-36 also confirmed this viewpoint. Quartz, plagioclase, and potassium feldspar in Table 1 were classified as siliceous minerals, while calcite and dolomite were classified as carbonate minerals. The relationship between the content of siliceous minerals, carbonate minerals, and clay minerals and the elastic modulus and Poisson’s ratio was plotted in Figure 4 and Figure 5.
Figure 4 shows the relationship between mineral component volume content and elastic modulus, while Figure 5 shows the relationship between mineral component volume content and Poisson’s ratio. From Figure 4 and Figure 5, it can be seen that the elastic modulus and Poisson’s ratio vary with different mineral components, and the volume content of mineral components affects the properties of rocks.
The minerals that make up shale can be divided into brittle minerals and ductile minerals based on their mechanical properties. Among them, brittle minerals include siliceous minerals and carbonate minerals, while ductile minerals are mainly clay minerals. In addition, they also contain trace amounts of amphibole, pyrite, and magnetite. However, the proportion of these trace minerals in shale is extremely low, so their impact on brittleness is not considered.

4.2. Research on Brittleness Index Evaluation Methods

The commonly used methods for calculating rock brittleness include the mineral composition method, rock mechanics parameter method, stress-strain analysis method, hardness and fracture toughness method, and internal friction angle method. Jarvie et al. [17] proposed the definition of the brittleness index based on the proportion of mineral components. Quartz accounts for 22.6%, plagioclase accounts for 9.8%, potassium feldspar accounts for 41.8%, and quartz+feldspar brittle minerals account for 74.2% of the Chang 7 reservoir in Y block of M oilfield. Rickman et al. [18] calculated the brittleness index of the specimen using the rock mechanics parameter method.
The first method is the Jarvie mineral composition method, where brittleness is a comprehensive reflection of mineral composition. Mineral composition is the main internal factor affecting mechanical properties, so there must be a direct correlation between rock mineral composition and brittleness. Jarvie et al. described rock brittleness based on the composition of shale minerals, suggesting that quartz minerals have the strongest brittleness, calcite minerals are moderate, and clay minerals are the worst. Therefore, they proposed the brittleness index 1 (MBI) for mineral components.
M B I = V q u a r t z V q u a r t z + V c a r b o n a t e r o c k s + V C l a y m i n e r a l s
where Vquartz represents the volume content of quartz minerals in the rock sample,%; Vcarbonate rocks is the volume content of carbonate rocks minerals,%; Vclay minerals is the volume content of clay minerals,%.
Among them, carbonate rocks include: the minerals that make up carbonate rocks are mainly calcite and dolomite, with the former having a chemical composition of CaCO3 and the latter having a chemical composition of CaMg(CO3)2.
The second method is for Rickman to evaluate the relative brittleness of North American Barnett shale by normalizing the average values of Young’s modulus and Poisson’s ratio and calculating the brittleness index 2 (EBI).
E B I = 1 2 E E min E max E min + ν max ν ν max ν min
where E is the Young’s modulus, GPa; ν is the Poisson’s ratio; Emax and Emin are the maximum and minimum Young’s modulus values, GPa, respectively, and νmax and νmin are the maximum and minimum Poisson’s ratios in the rock sample.
Based on the Jarvie mineral composition method and Rickman’s rock mechanics parameter method, the brittleness index 1 (MBI) and brittleness index 2 (EBI) were obtained, as shown in Table 4.
From Table 4, it can be seen that the maximum elastic modulus is 34.56 GPa, the minimum value is 14.72 GPa, and the average value is 23.77 GPa. The maximum value of Poisson’s ratio is 0.288, the minimum value is 0.106, and the average value is 0.182. The average brittleness index 1 (MBI) calculated by the Jarvie mineral composition method using the first method is 0.5393. The average brittleness index 2 (EBI) calculated by Rickman’s mechanical parameter method using the second method is 0.5204.
The two calculation methods for the brittleness index of 36 experimental groups are plotted in Figure 6: brittleness index 1 (MBI) and brittleness index 2 (EBI) are basically positively correlated, and the trend is basically consistent. The brittleness index calculated by MBI is slightly higher.

4.3. Research on New Methods for Evaluating Brittleness Index

The third method for evaluating brittleness is the Energy Brittleness Index (DBI), constructed based on the stress-strain curve of rocks. The complete stress-strain curve of rock samples under external loading reflects the deformation and fracture characteristics of the samples [31]. The process of rock failure is essentially a balance between energy absorption and release. In the pre-peak stage, the rock undergoes elastic-plastic deformation. After the peak, the accumulated elastic energy is gradually released, forming macroscopic cracks. The stress-strain curve provides a comprehensive understanding of rock deformation and brittle failure mechanisms under various loading conditions. The brittleness of terrestrial shale oil reservoirs can be evaluated using energy methods [32,33,34,35,36].
Figure 7 shows the internal micromechanical mechanism of deformation and failure of rocks under compressive loads [37,38]. In the triaxial compression experiment, the process of rock fracture mainly involves three energies: fracture energy ΔWr, elastic strain energy ΔWe consumed in the rock sample after the peak, and strain energy ΔWa absorbed from the outside during the drop stage after the peak. These three energies are represented by the stress-strain curve and the area enclosed by the strain axis, as shown in Figure 7. Figure 7 shows the stress-strain curve characteristics of the rock fracture process. The OAB curve represents the mechanical behavior before the peak, and the BC curve represents the mechanical characteristics after the peak, where A is the yield point of the rock; B is the peak strength fracture critical point of the rock; Point C is the critical point corresponding to complete rock fracture.
Assuming that when loaded to point B or C and then unloaded, the slope of the stress path curve for unloading is considered equal to the Young’s modulus of the intact rock, then the area of the triangle enclosed by BEF and CGH is the elastic energy stored inside the rock when loaded to point B or C. Therefore, the elastic strain energy ΔWe dissipated during BC loading is the difference in area between the two triangles, and the strain energy ΔWr required for complete rock fracture is the area of the BEGC region.
The required fracture strain energy ΔWr during the formation of cracks is the sum of the consumed elastic strain energy ΔWe and the strain energy ΔWa absorbed by the rock towards the outside world, which conforms to the principle of energy conservation during the post-peak fracture process.
Δ W r = Δ W a + Δ W e
Elastic strain energy consumed after peak: The elastic strain energy consumed after peak ΔWe refers to the degree to which the accumulated elastic energy inside the rock sample is released during the fracture process. Part of the released energy provides the energy required for the brittle fracture of chemical bonds in the rock sample, while the other part is released in the form of thermal energy or kinematics.
Δ W e = σ B 2 σ C 2 2 E
where σ B and σ C are the loading stresses corresponding to B and C-peak stress and residual stress, respectively, and E is Young’s modulus of the complete rock sample.
Absorbed energy after peak: Absorbed energy ΔWa, numerically represents the work done by the stress on the rock sample during the drop stage after peak.
Δ W a = ε B ε C σ ε d ε
where ε B and ε C are the cumulative strains corresponding to B and C, namely peak strain and residual strain, respectively.
For the convenience of calculation, we equivalent the actual stress-strain curve characteristics to an ideal stress-strain curve model (solid red line in Figure 7), and adjust the slope M of the BC line segment to make the area of SBFHC in Figure 7 equal to the absorbed strain energy ΔWa (Formula (5)). Then:
Δ W a = S B F H C = ε B ε C σ ε d ε = σ C 2 σ B 2 2 M
where M is defined as the average post-peak drop modulus, which characterizes the fracture characteristics of the rock after the peak. For this failure mode, M = 0 is the ideal plastic deformation, M > 0 represents ductile deformation, and M < 0 undergoes fracture deformation. Shale oil reservoirs generally undergo fracture deformation with M < 0, and the other two situations will not be discussed for the time being. Based on the actual measured stress-strain data, the numerical integration Formula (6) can obtain the average drop modulus M.
Fracture energy: The fracture energy ΔWr refers to the dissipated energy that occurs during the process of rock fracture, including chemical bond fracture energy and plastic deformation energy.
Adding Formula (4) to Formula (6) yields the fracture energy ΔWr:
Δ W r = Δ W a + Δ W e = ( σ B 2 σ C 2 ) ( M E ) 2 E M
where E is Young’s modulus of the rock sample, M is the average drop modulus after the peak, σ B and σ C are the peak stress and residual stress, and ε B and ε C are the peak strain and residual strain, respectively.
From the above analysis, the post-peak fracture process of rocks involves both brittle fracture and plastic deformation. The consumption of elastic strain energy in rocks will cause brittle fracture. The strain energy absorbed by the rock from the outside causes plastic deformation inside the rock. Therefore, during the fracture process, the larger the proportion of elastic strain energy consumed in the fracture energy, the more brittle the rock becomes. A method of evaluating the rock brittleness index (DBI) through energy is proposed as follows:
D B I = Δ W e Δ W r
Substituting Formulas (4) and (7) into (8) yields
D B I = M M E
The larger the DBI, the more brittle the rock becomes. The calculated brittleness index 3 (DBI) is shown in Table 5: the residual stress and residual elastic modulus of sample S-2 drop rapidly, excluding outliers. The minimum drop modulus of other samples is −187.16, and the maximum value is −7.49. The calculated brittleness index 3 (DBI) has a maximum value of 0.99, a minimum value of 0.26, and an average value of 0.5306, which is between brittleness index 1 (MBI) and brittleness index 2 (EBI). From this, it can be concluded that the brittle index 3 (DBI) calculated using energy is feasible.
The trend of the brittleness index 3 (DBI) calculated using the energy method is basically the same as that calculated using the first two methods, as shown in Figure 8. The S-2 sample directly ruptured after fracturing, with a residual pressure of only 0.79 MPa, which is an outlier. Excluding this, the trend of other data groups is basically the same as that of brittleness index 1 (MBI) and brittleness index 2 (EBI). So, the brittleness index 3 (DBI) calculated using this method is feasible.
The fourth method is based on the relationship between peak stress (differential stress) and residual stress in the stress-strain curve. Bishop et al. proposed their calculation formula in 1967 [22].
P B I = τ p τ r τ p
where τp represents the peak intensity; τr is the residual strength.
The brittleness index 4 (PBI) calculated according to the fourth method is shown in Table 5 and plotted in Figure 9.
There are many evaluation methods for the brittleness index, and there is currently no unified formula. It is crucial to find a suitable brittleness index evaluation method for the region. The brittleness index ranges from 0 to 1, with a higher brittleness index indicating stronger brittleness. The smaller the brittleness index, the weaker the brittleness. If the brittleness index is less than 0.4, the brittleness is weak. Generally, in the process of selecting layers and segments, values with a brittleness index greater than or equal to 0.4 are chosen.

4.4. Analysis of the Main Controlling Factors of Brittleness Index

(1)
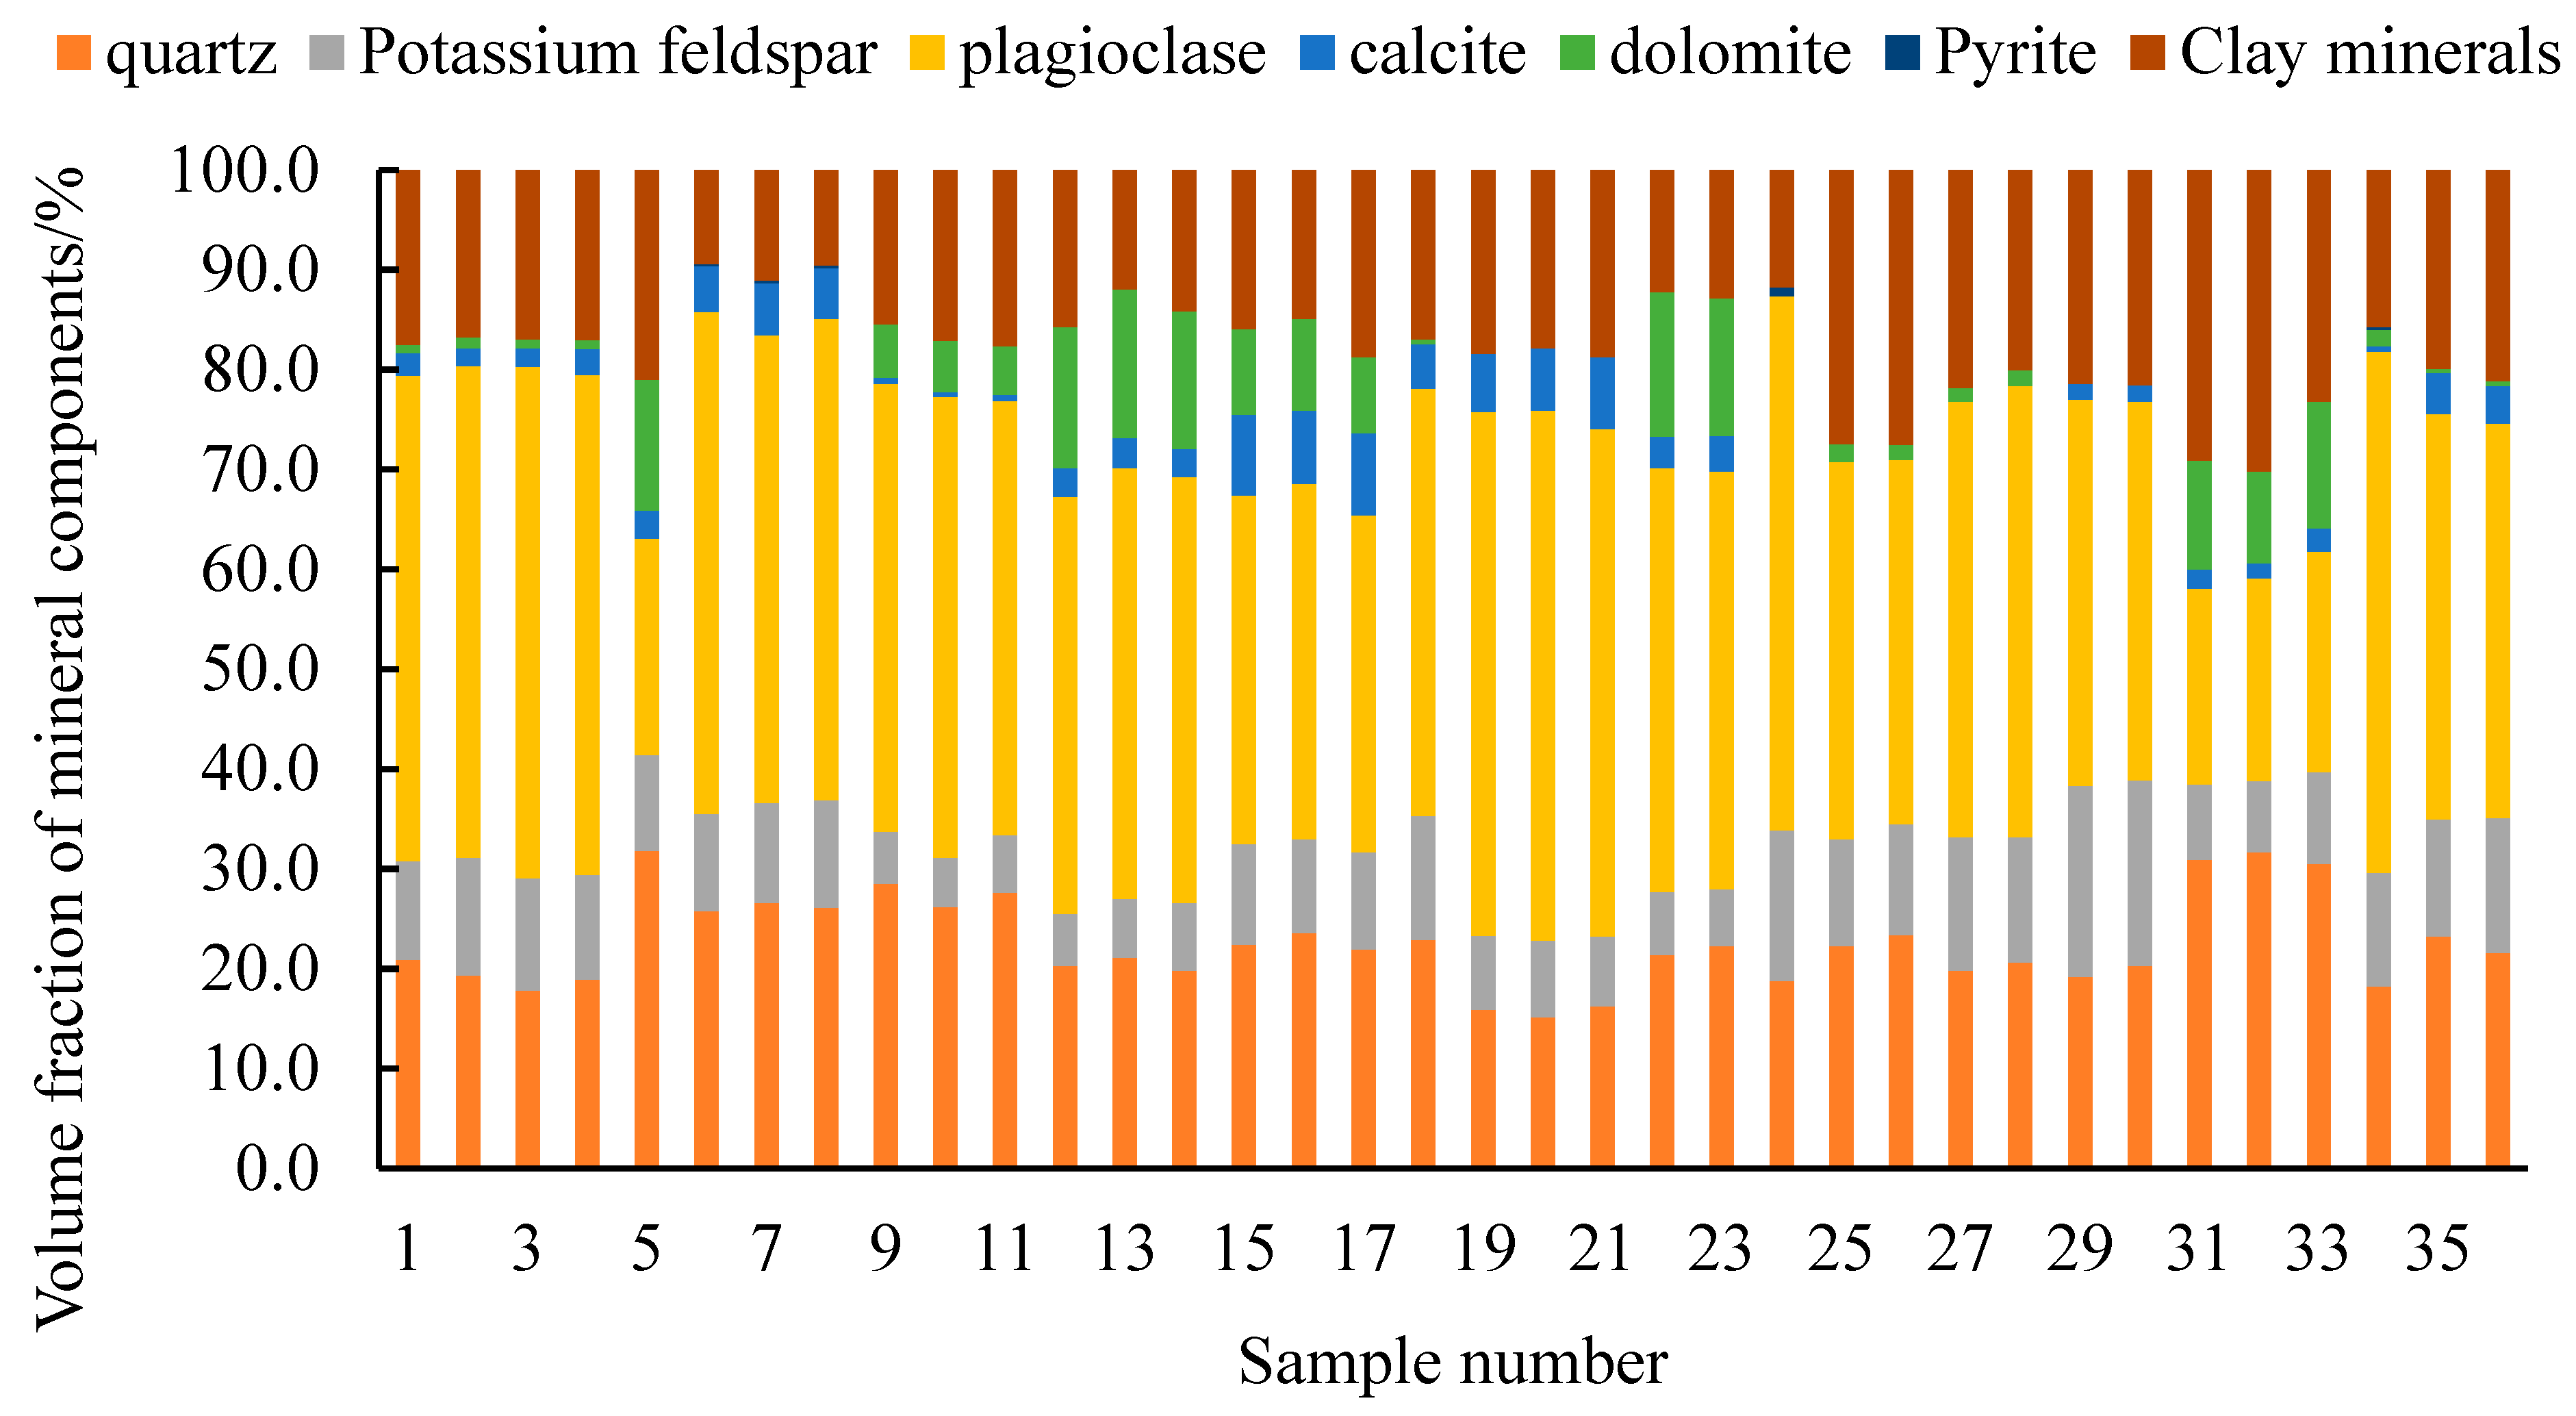
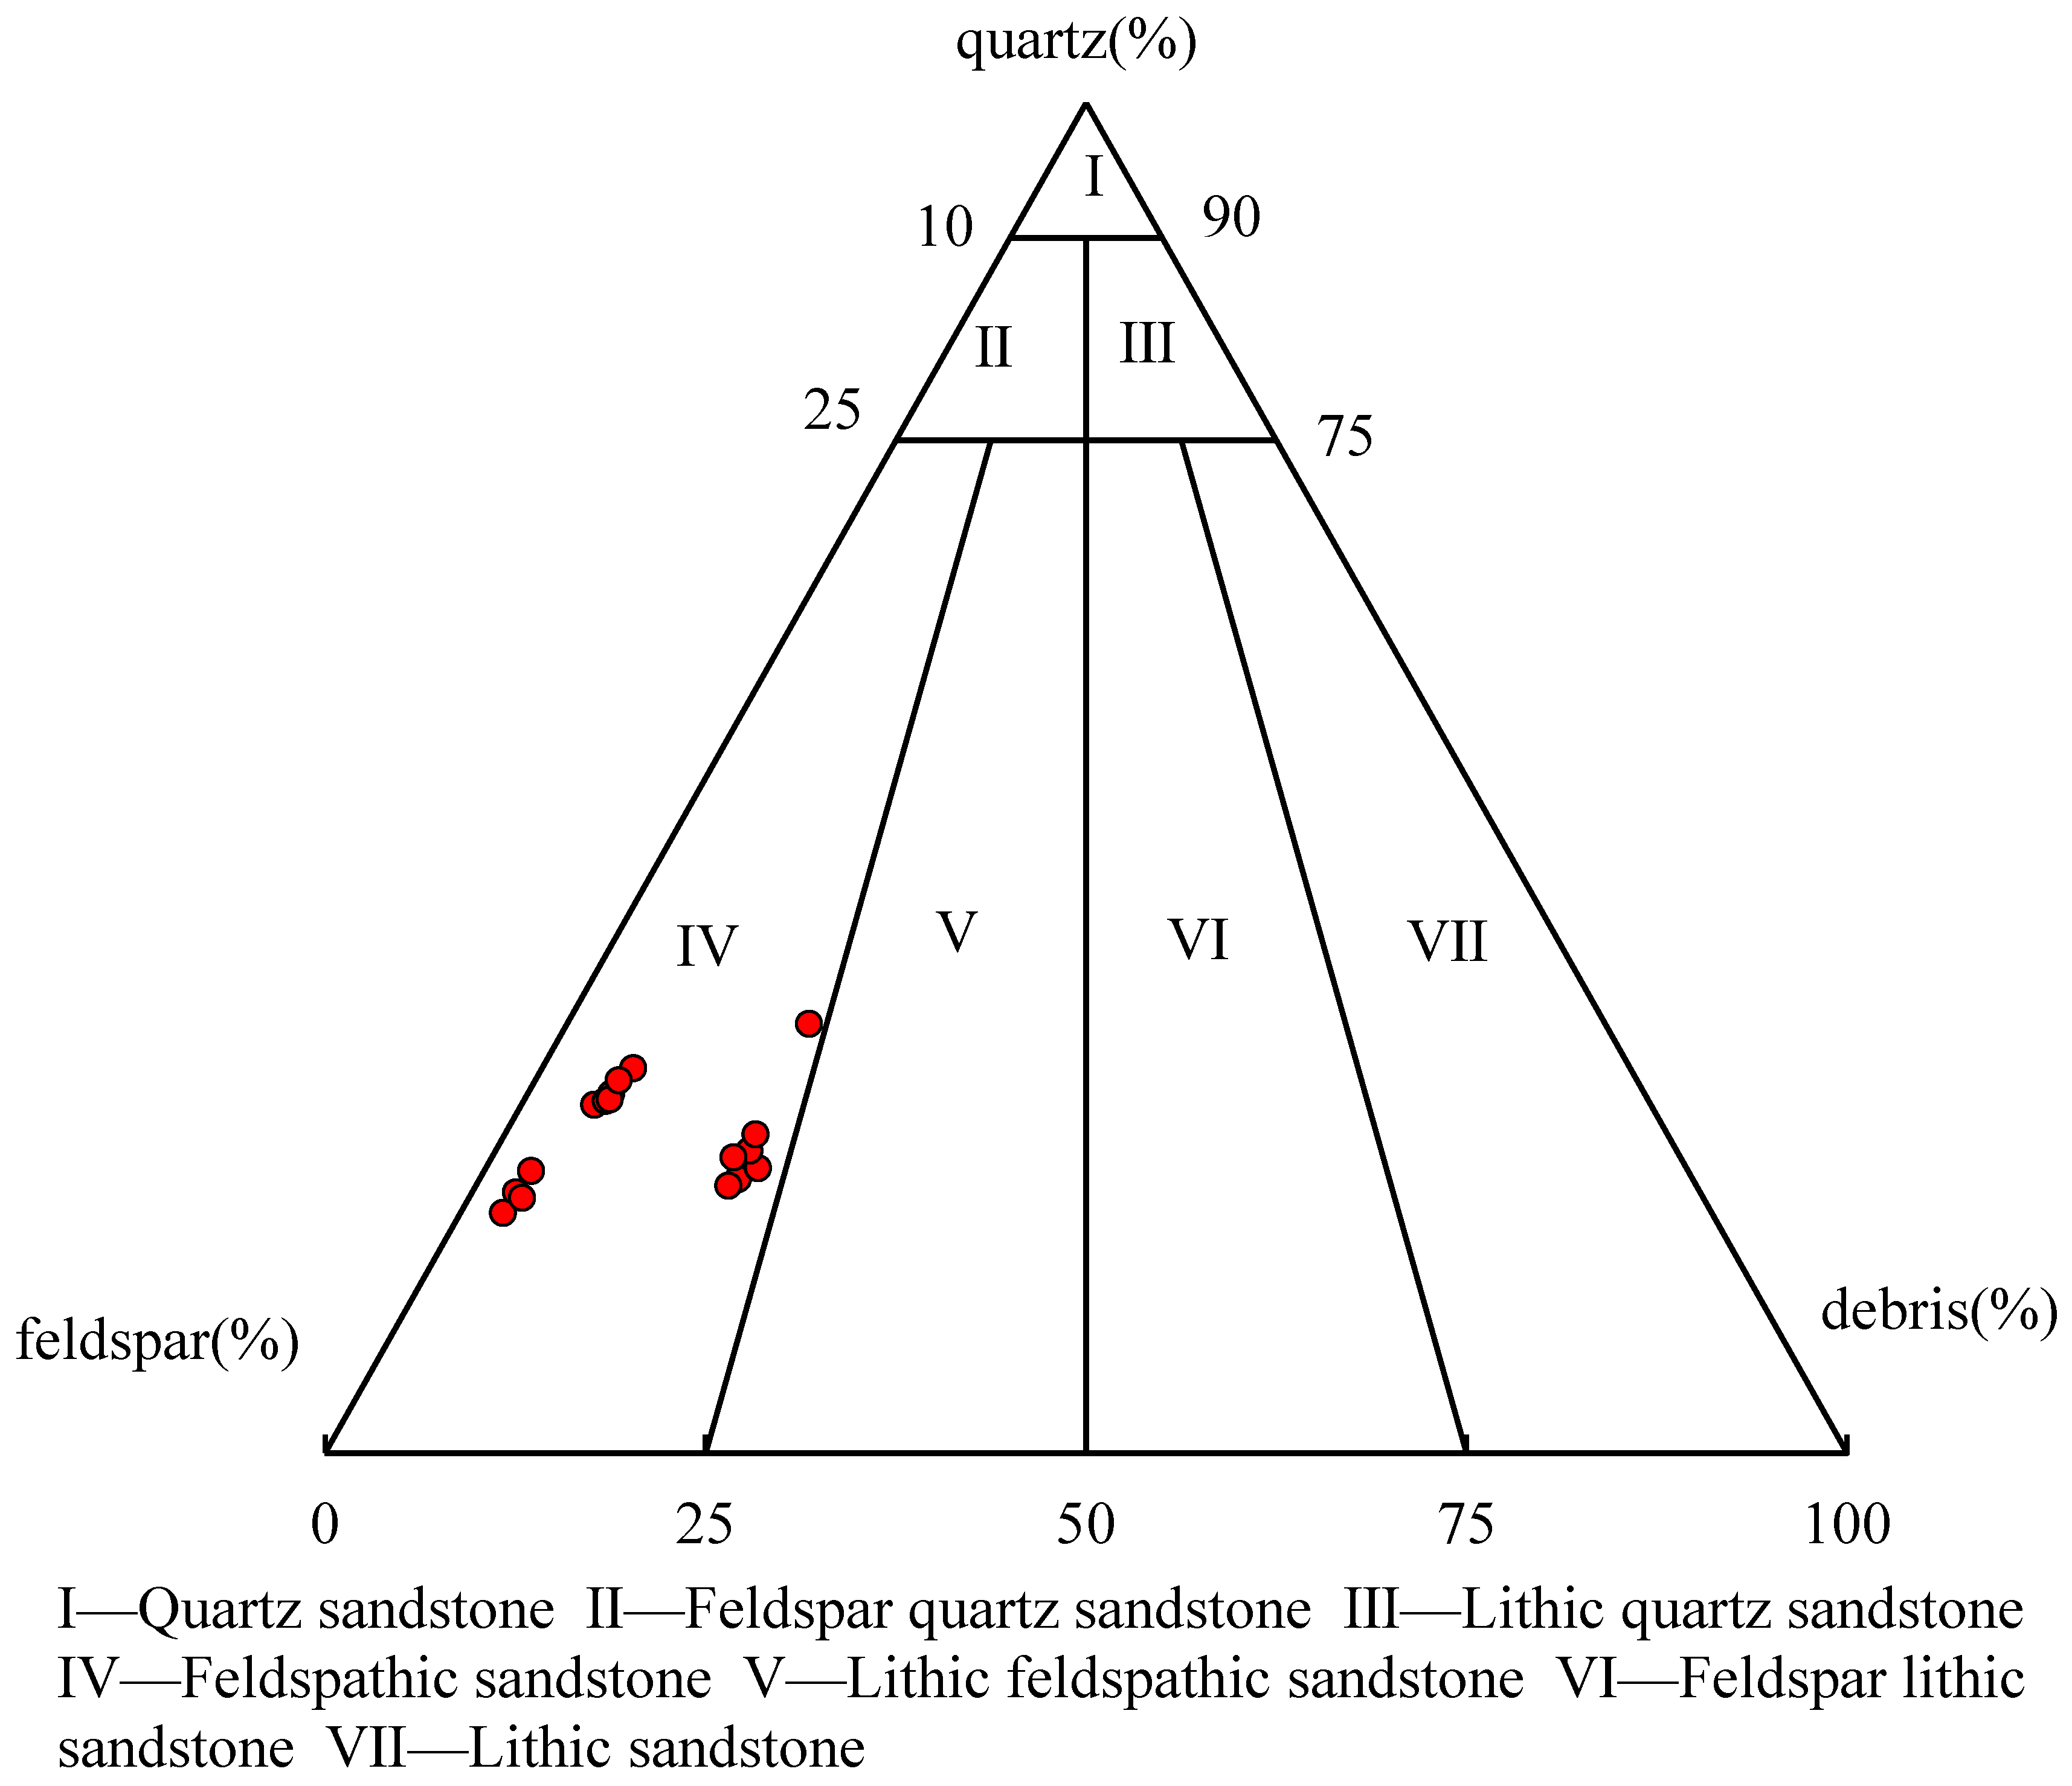
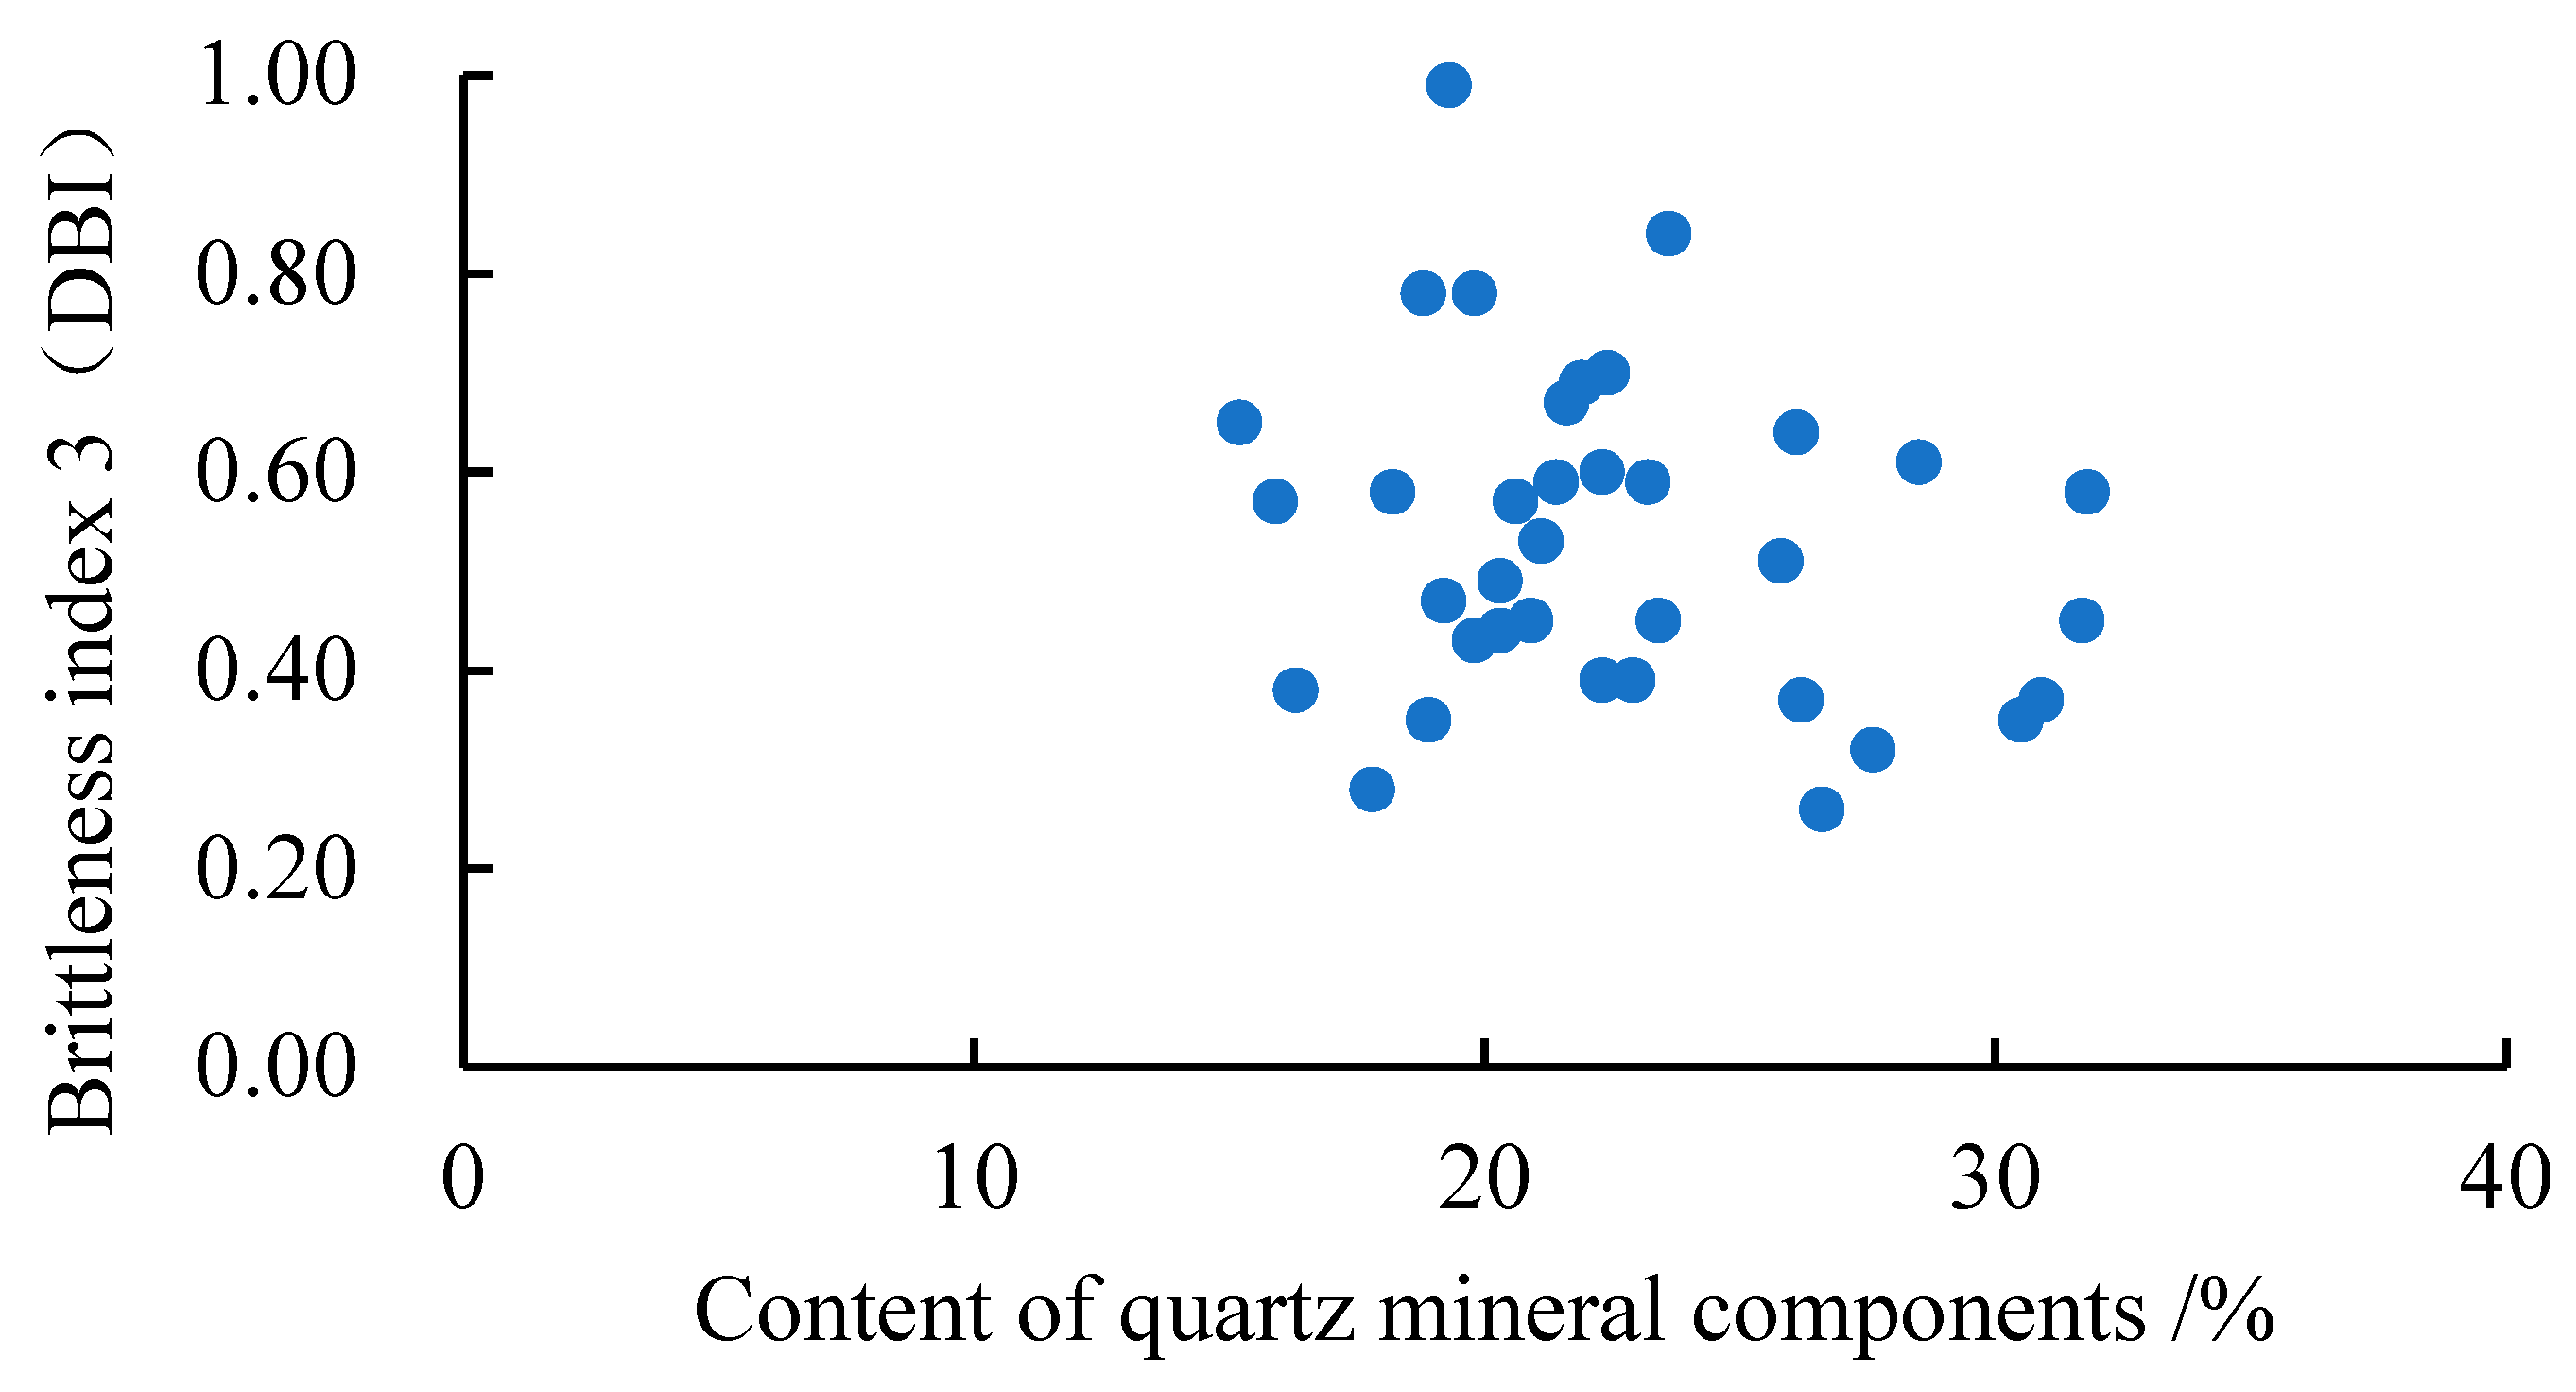
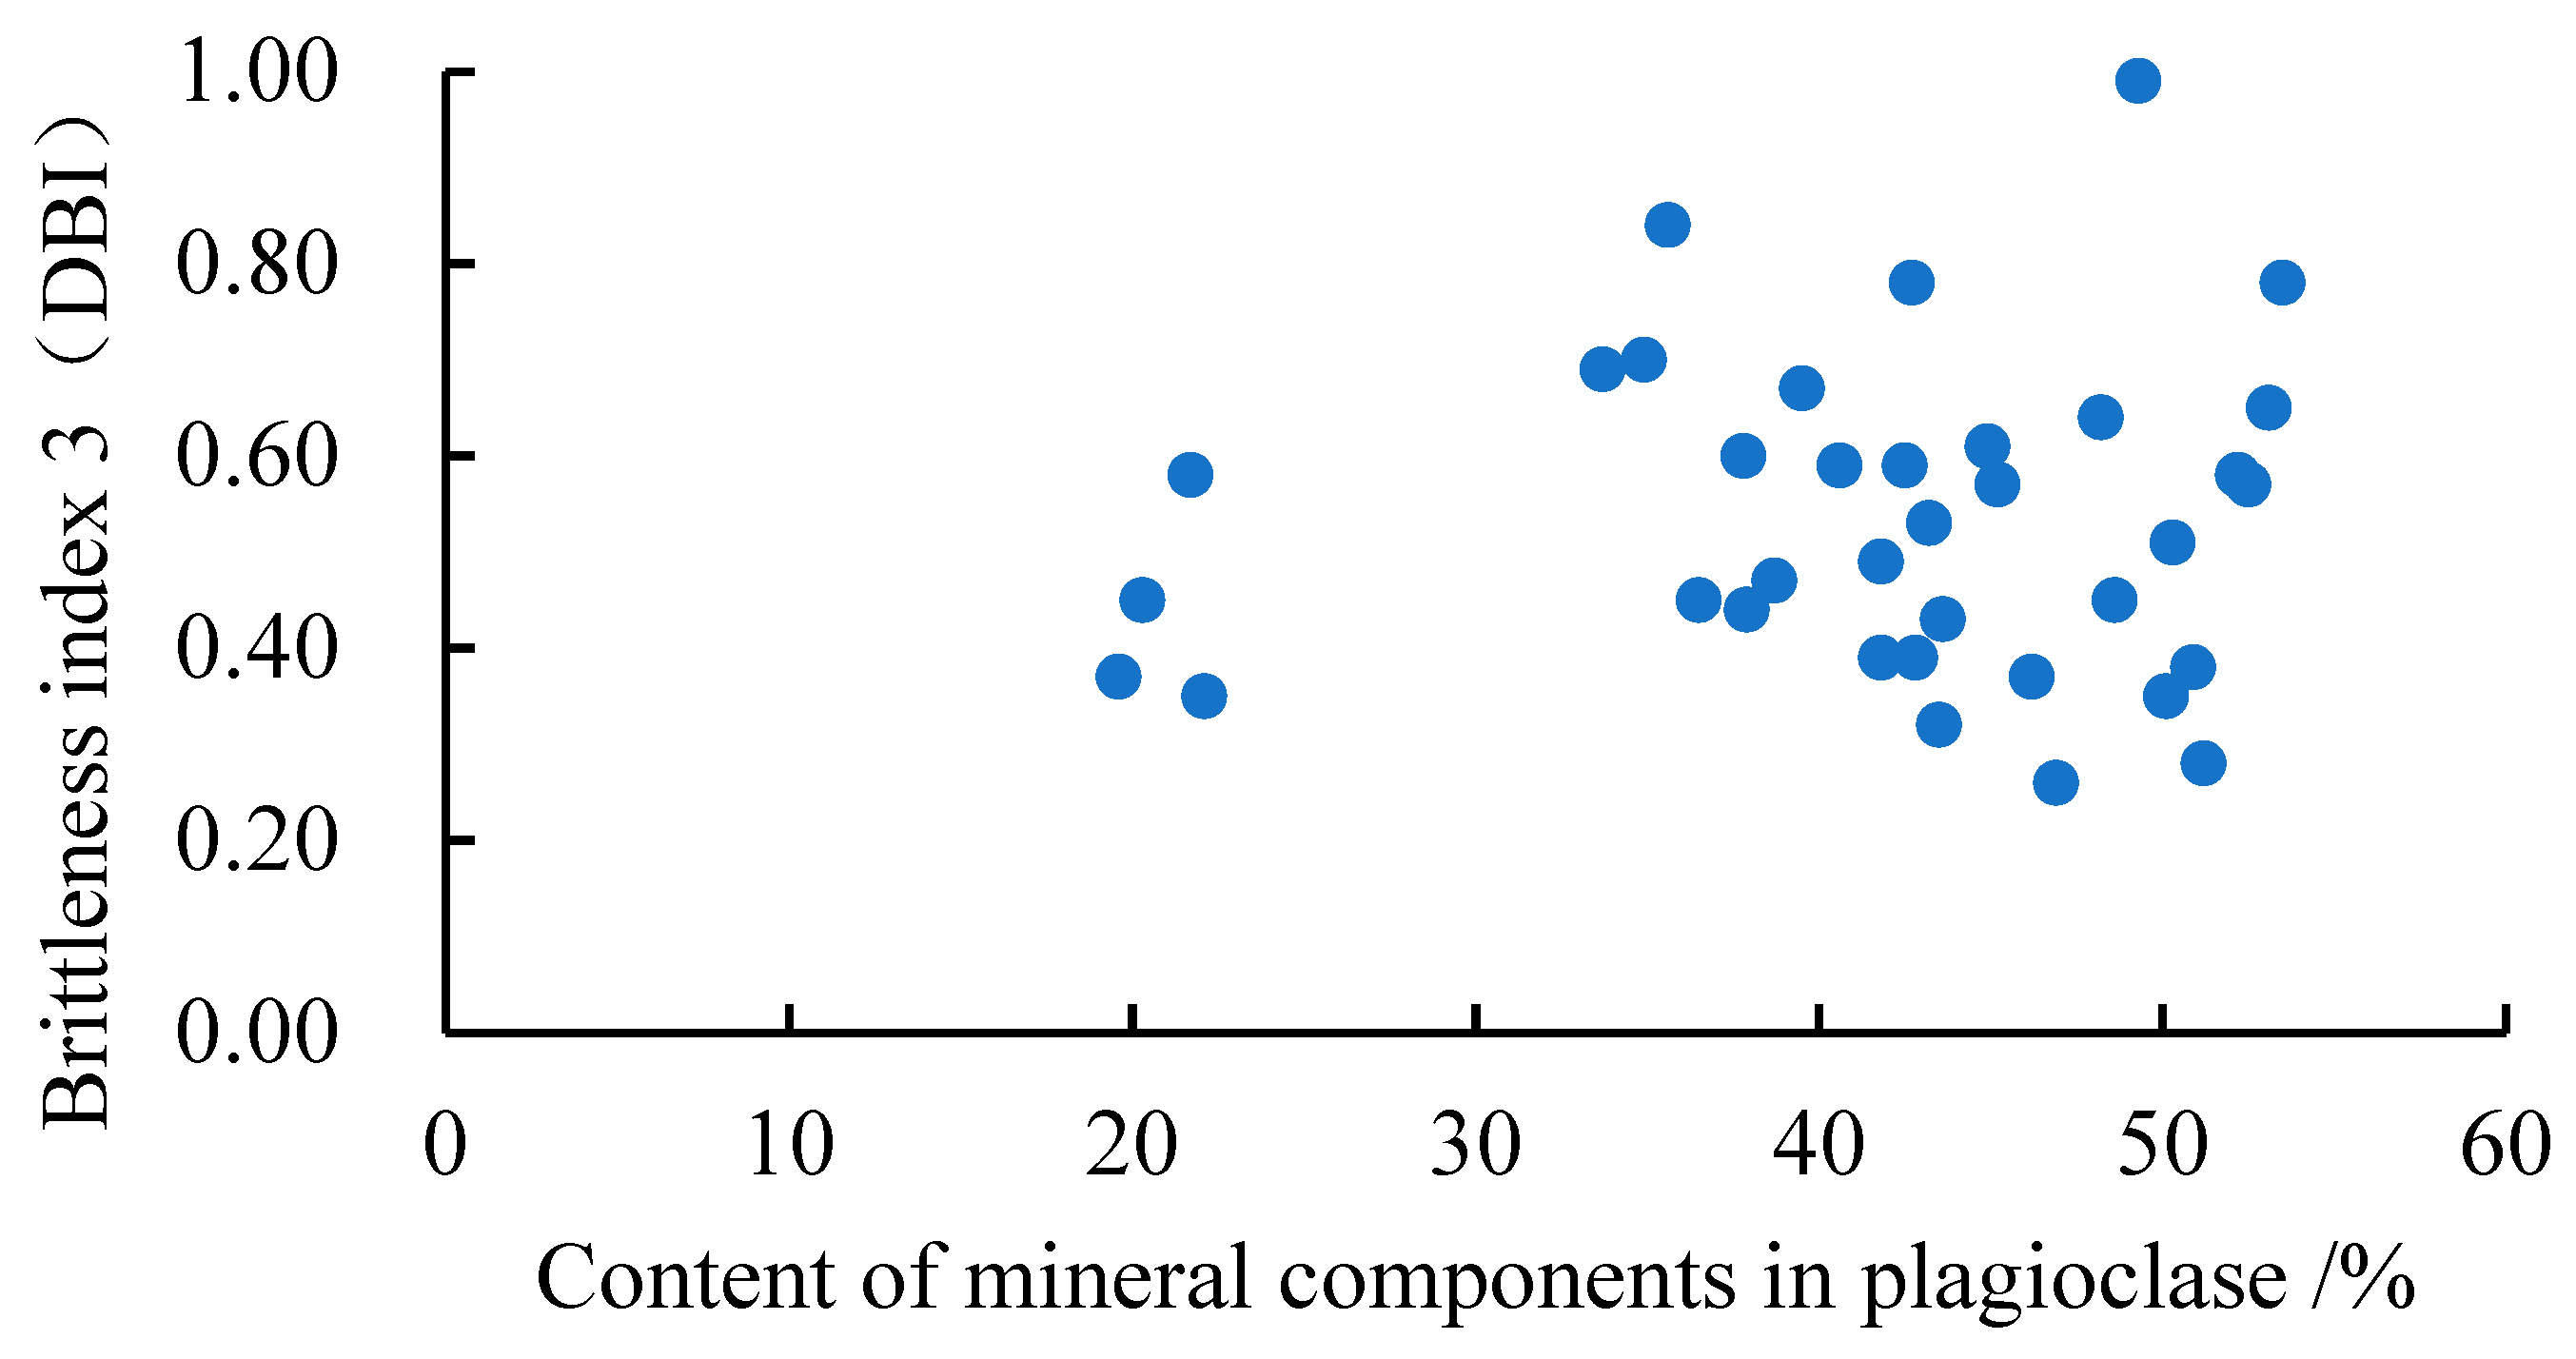
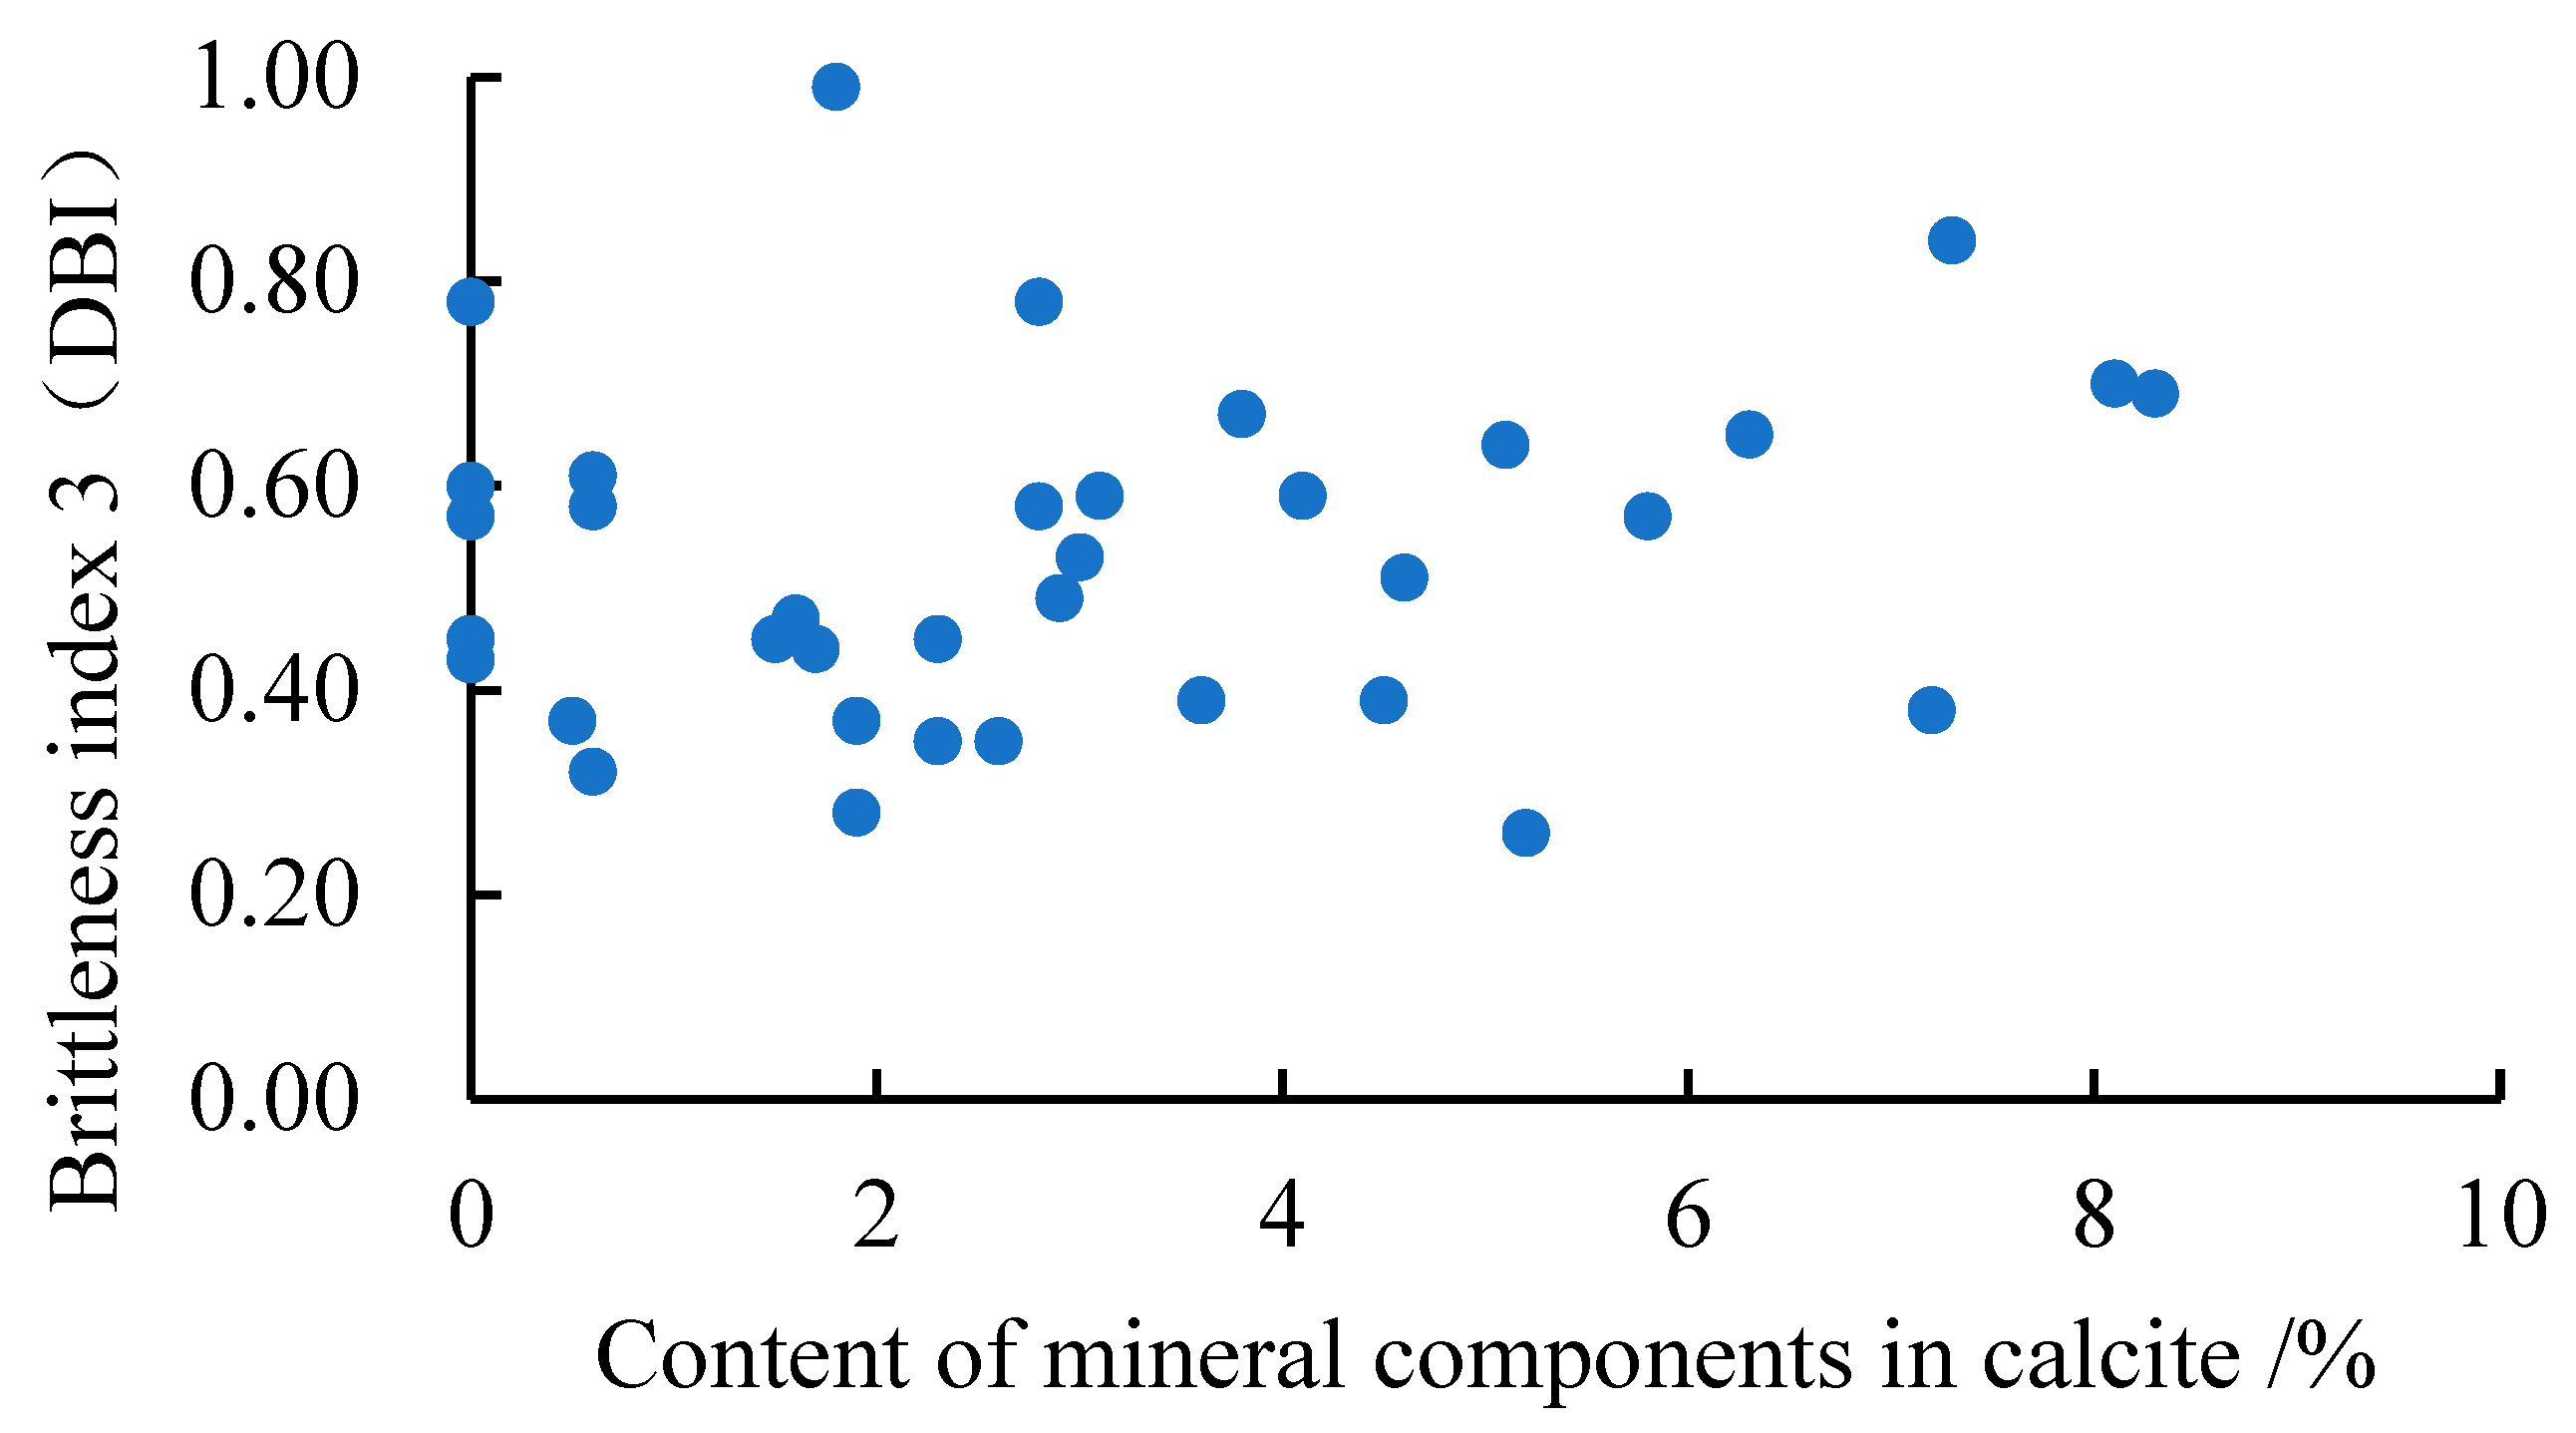
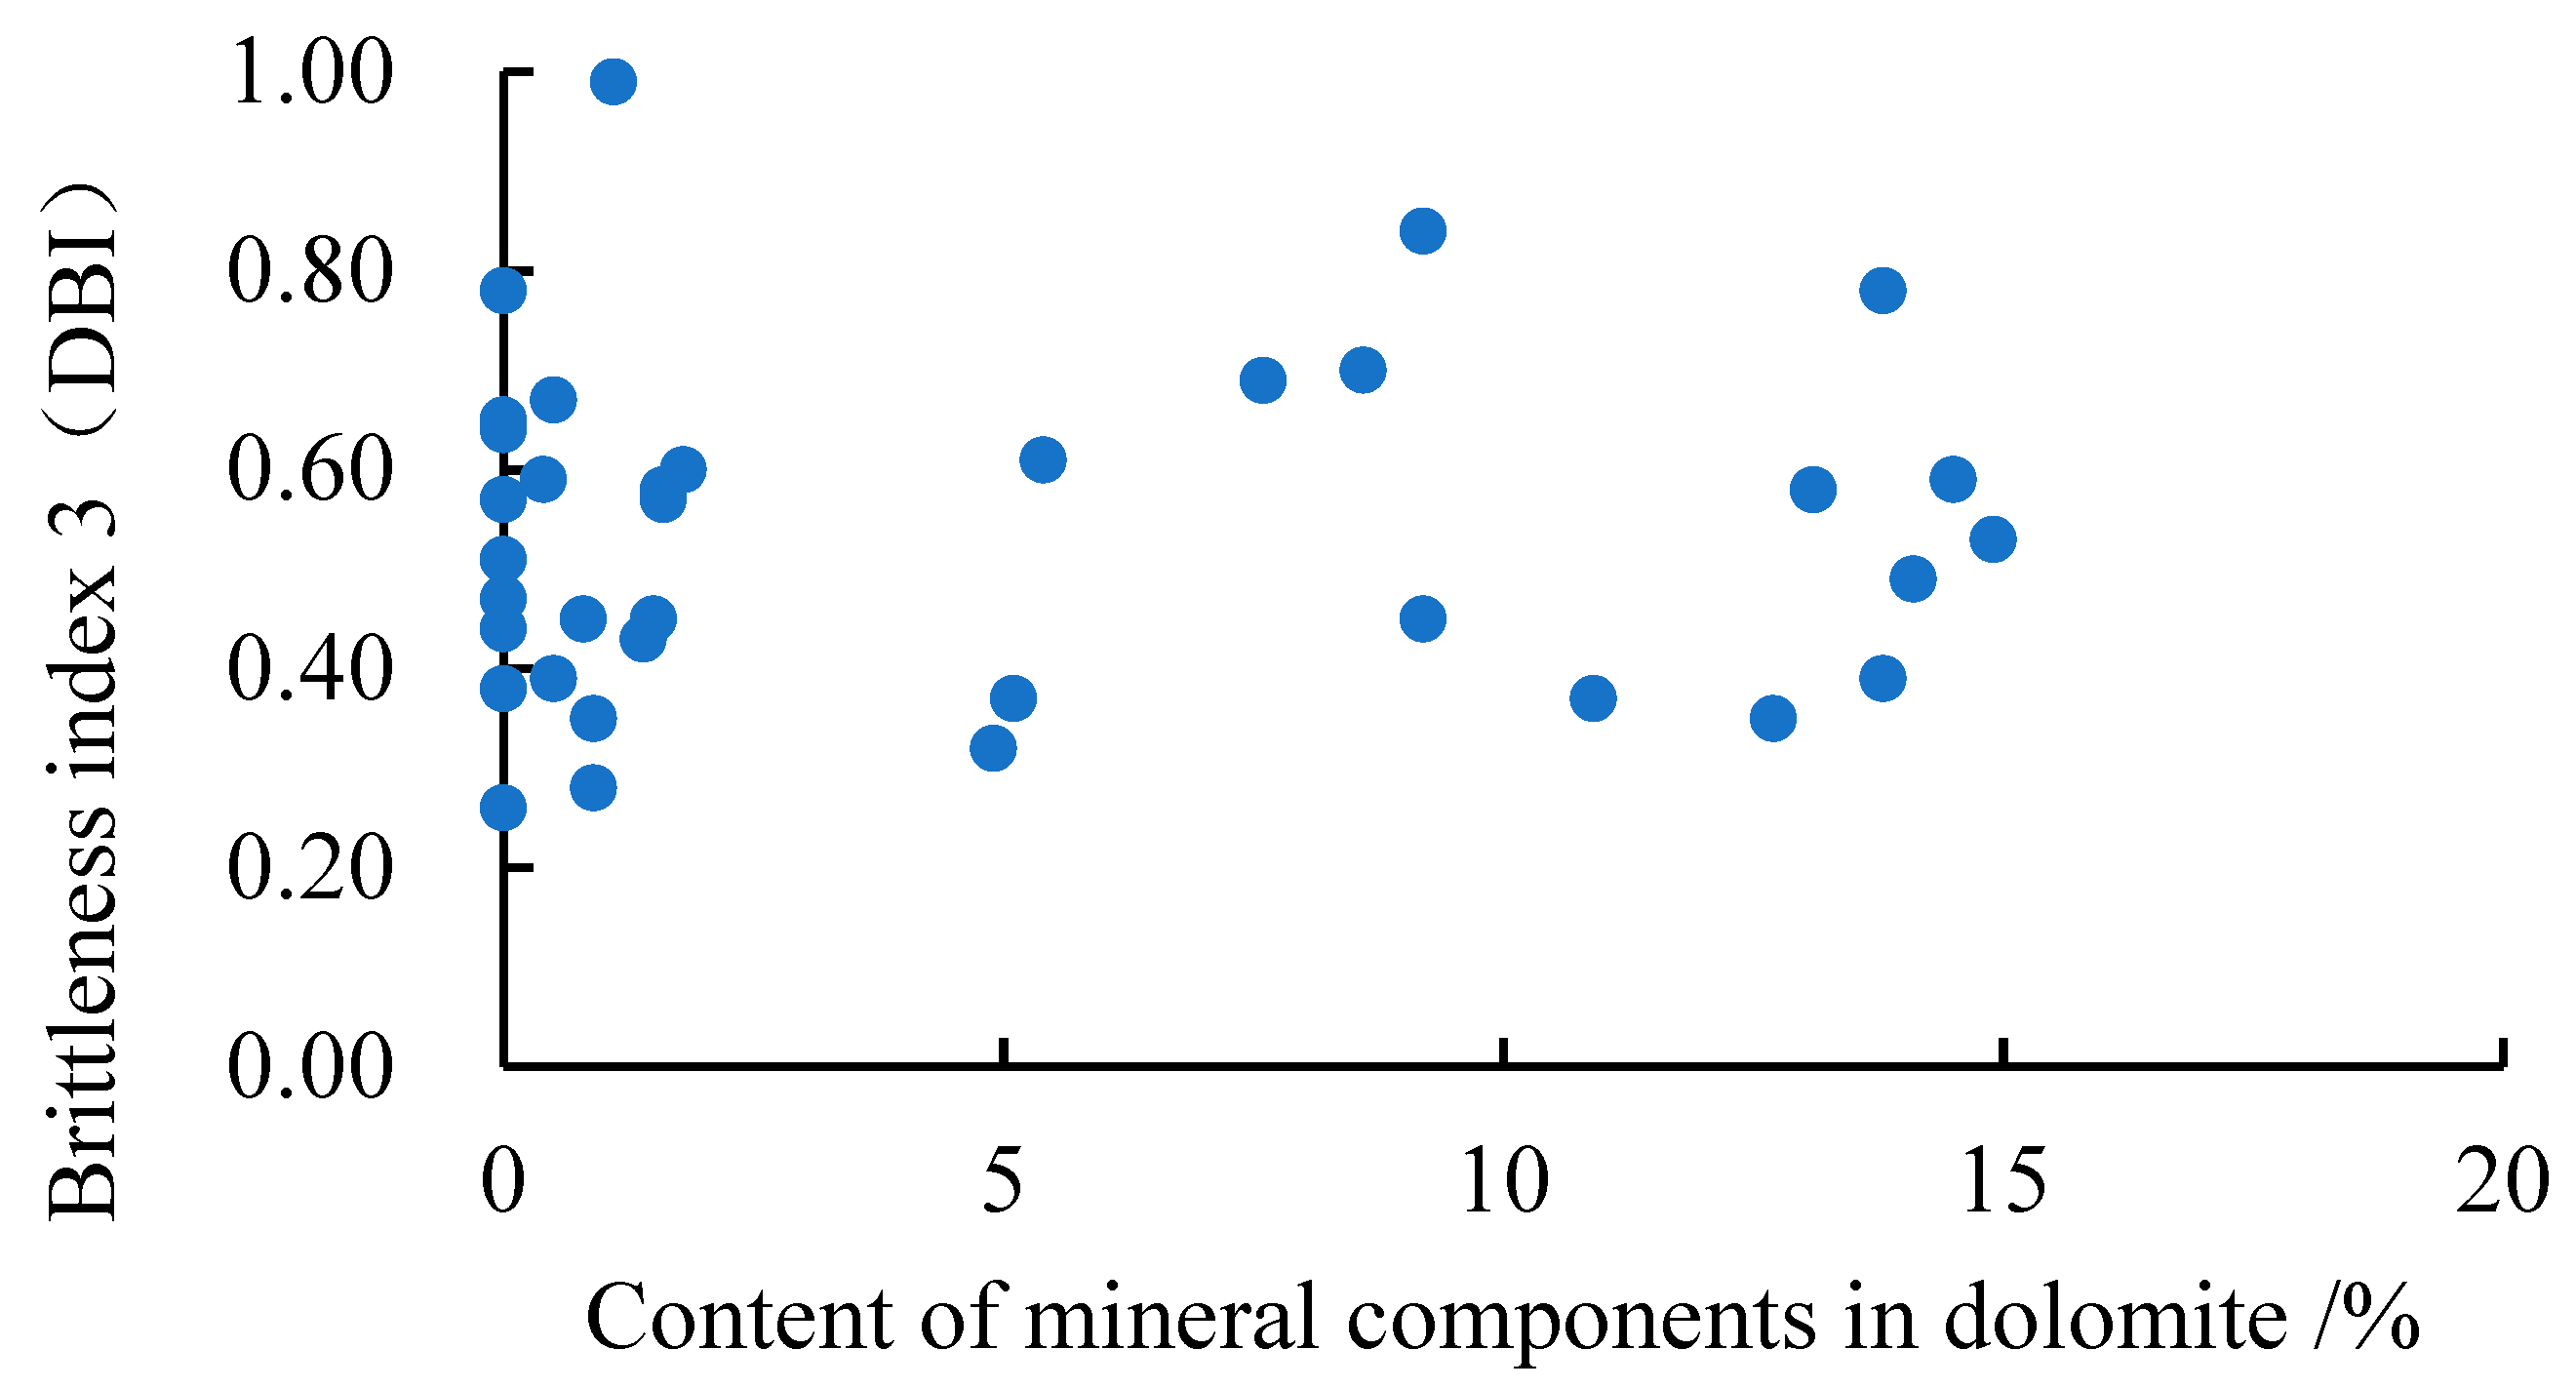
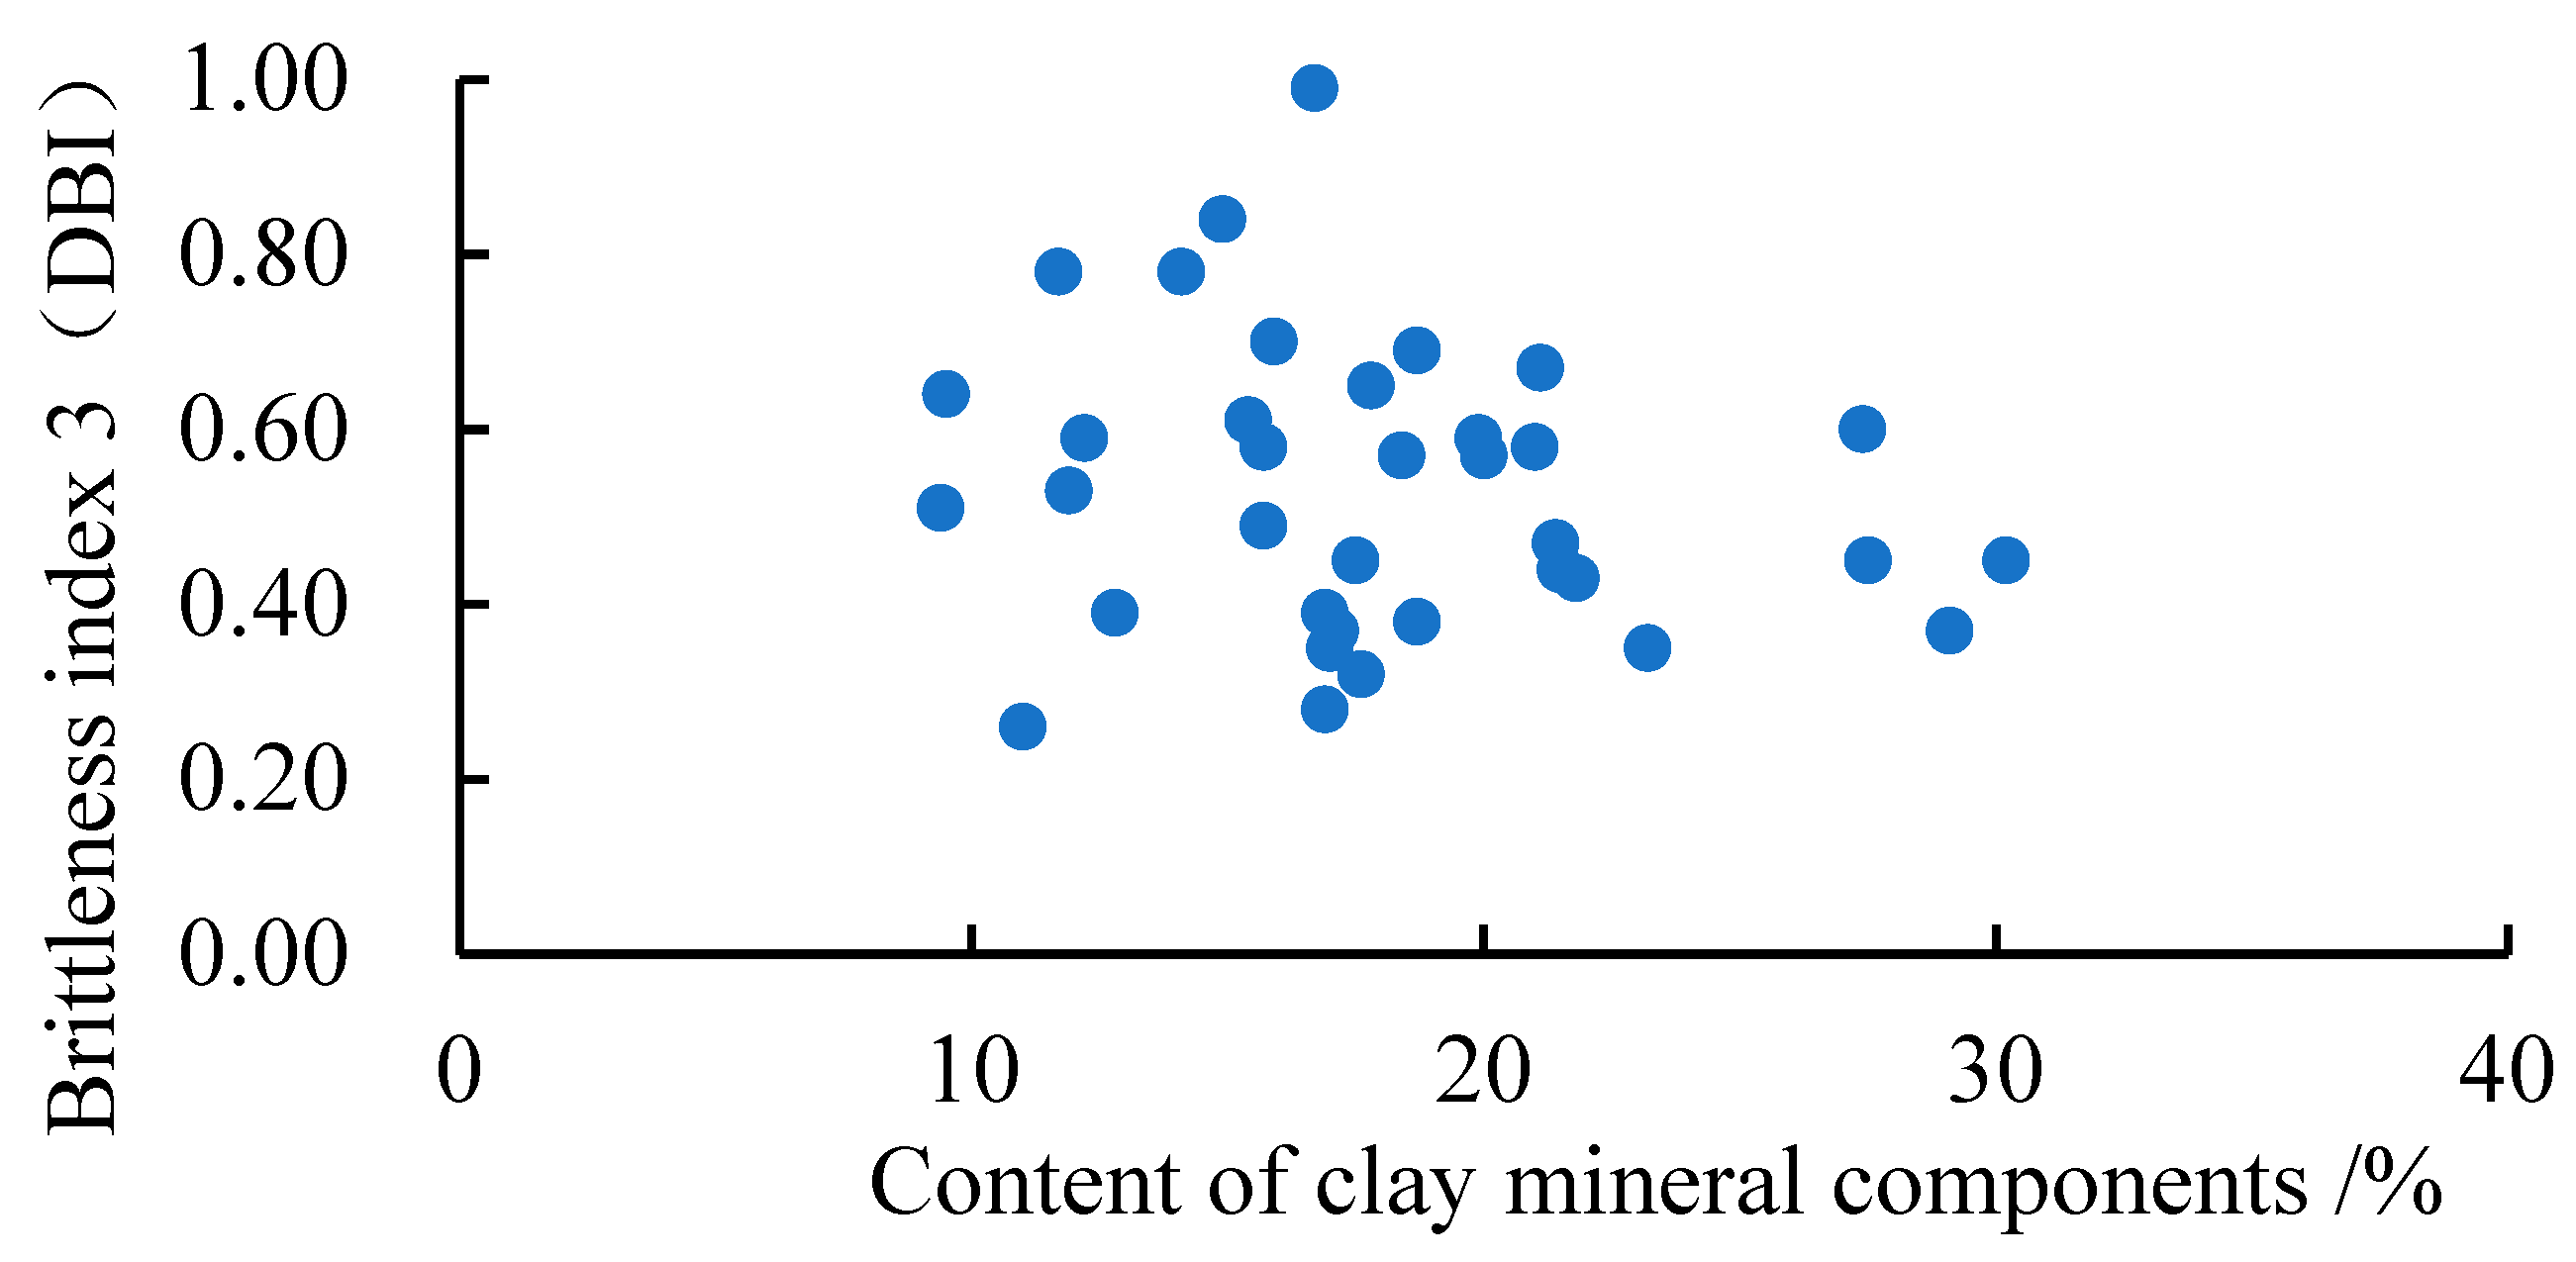
The influence of mineral components on brittle characteristics
Figure 10, Figure 11, Figure 12, Figure 13, Figure 14 and Figure 15 show the effects of quartz minerals, plagioclase minerals, potassium feldspar minerals, calcite minerals, dolomite minerals, and clay minerals on the brittleness index 3 (DBI). From the graph, it can be seen that the correlation between each parameter and the brittleness factor is relatively low. Among them, quartz minerals, plagioclase minerals, potassium feldspar minerals, and calcite minerals are positively correlated with the brittleness index 3 (DBI), clay minerals are negatively correlated with the brittleness index 3 (DBI), and the content of dolomite minerals is not correlated with the brittleness index 3 (DBI).
(2)
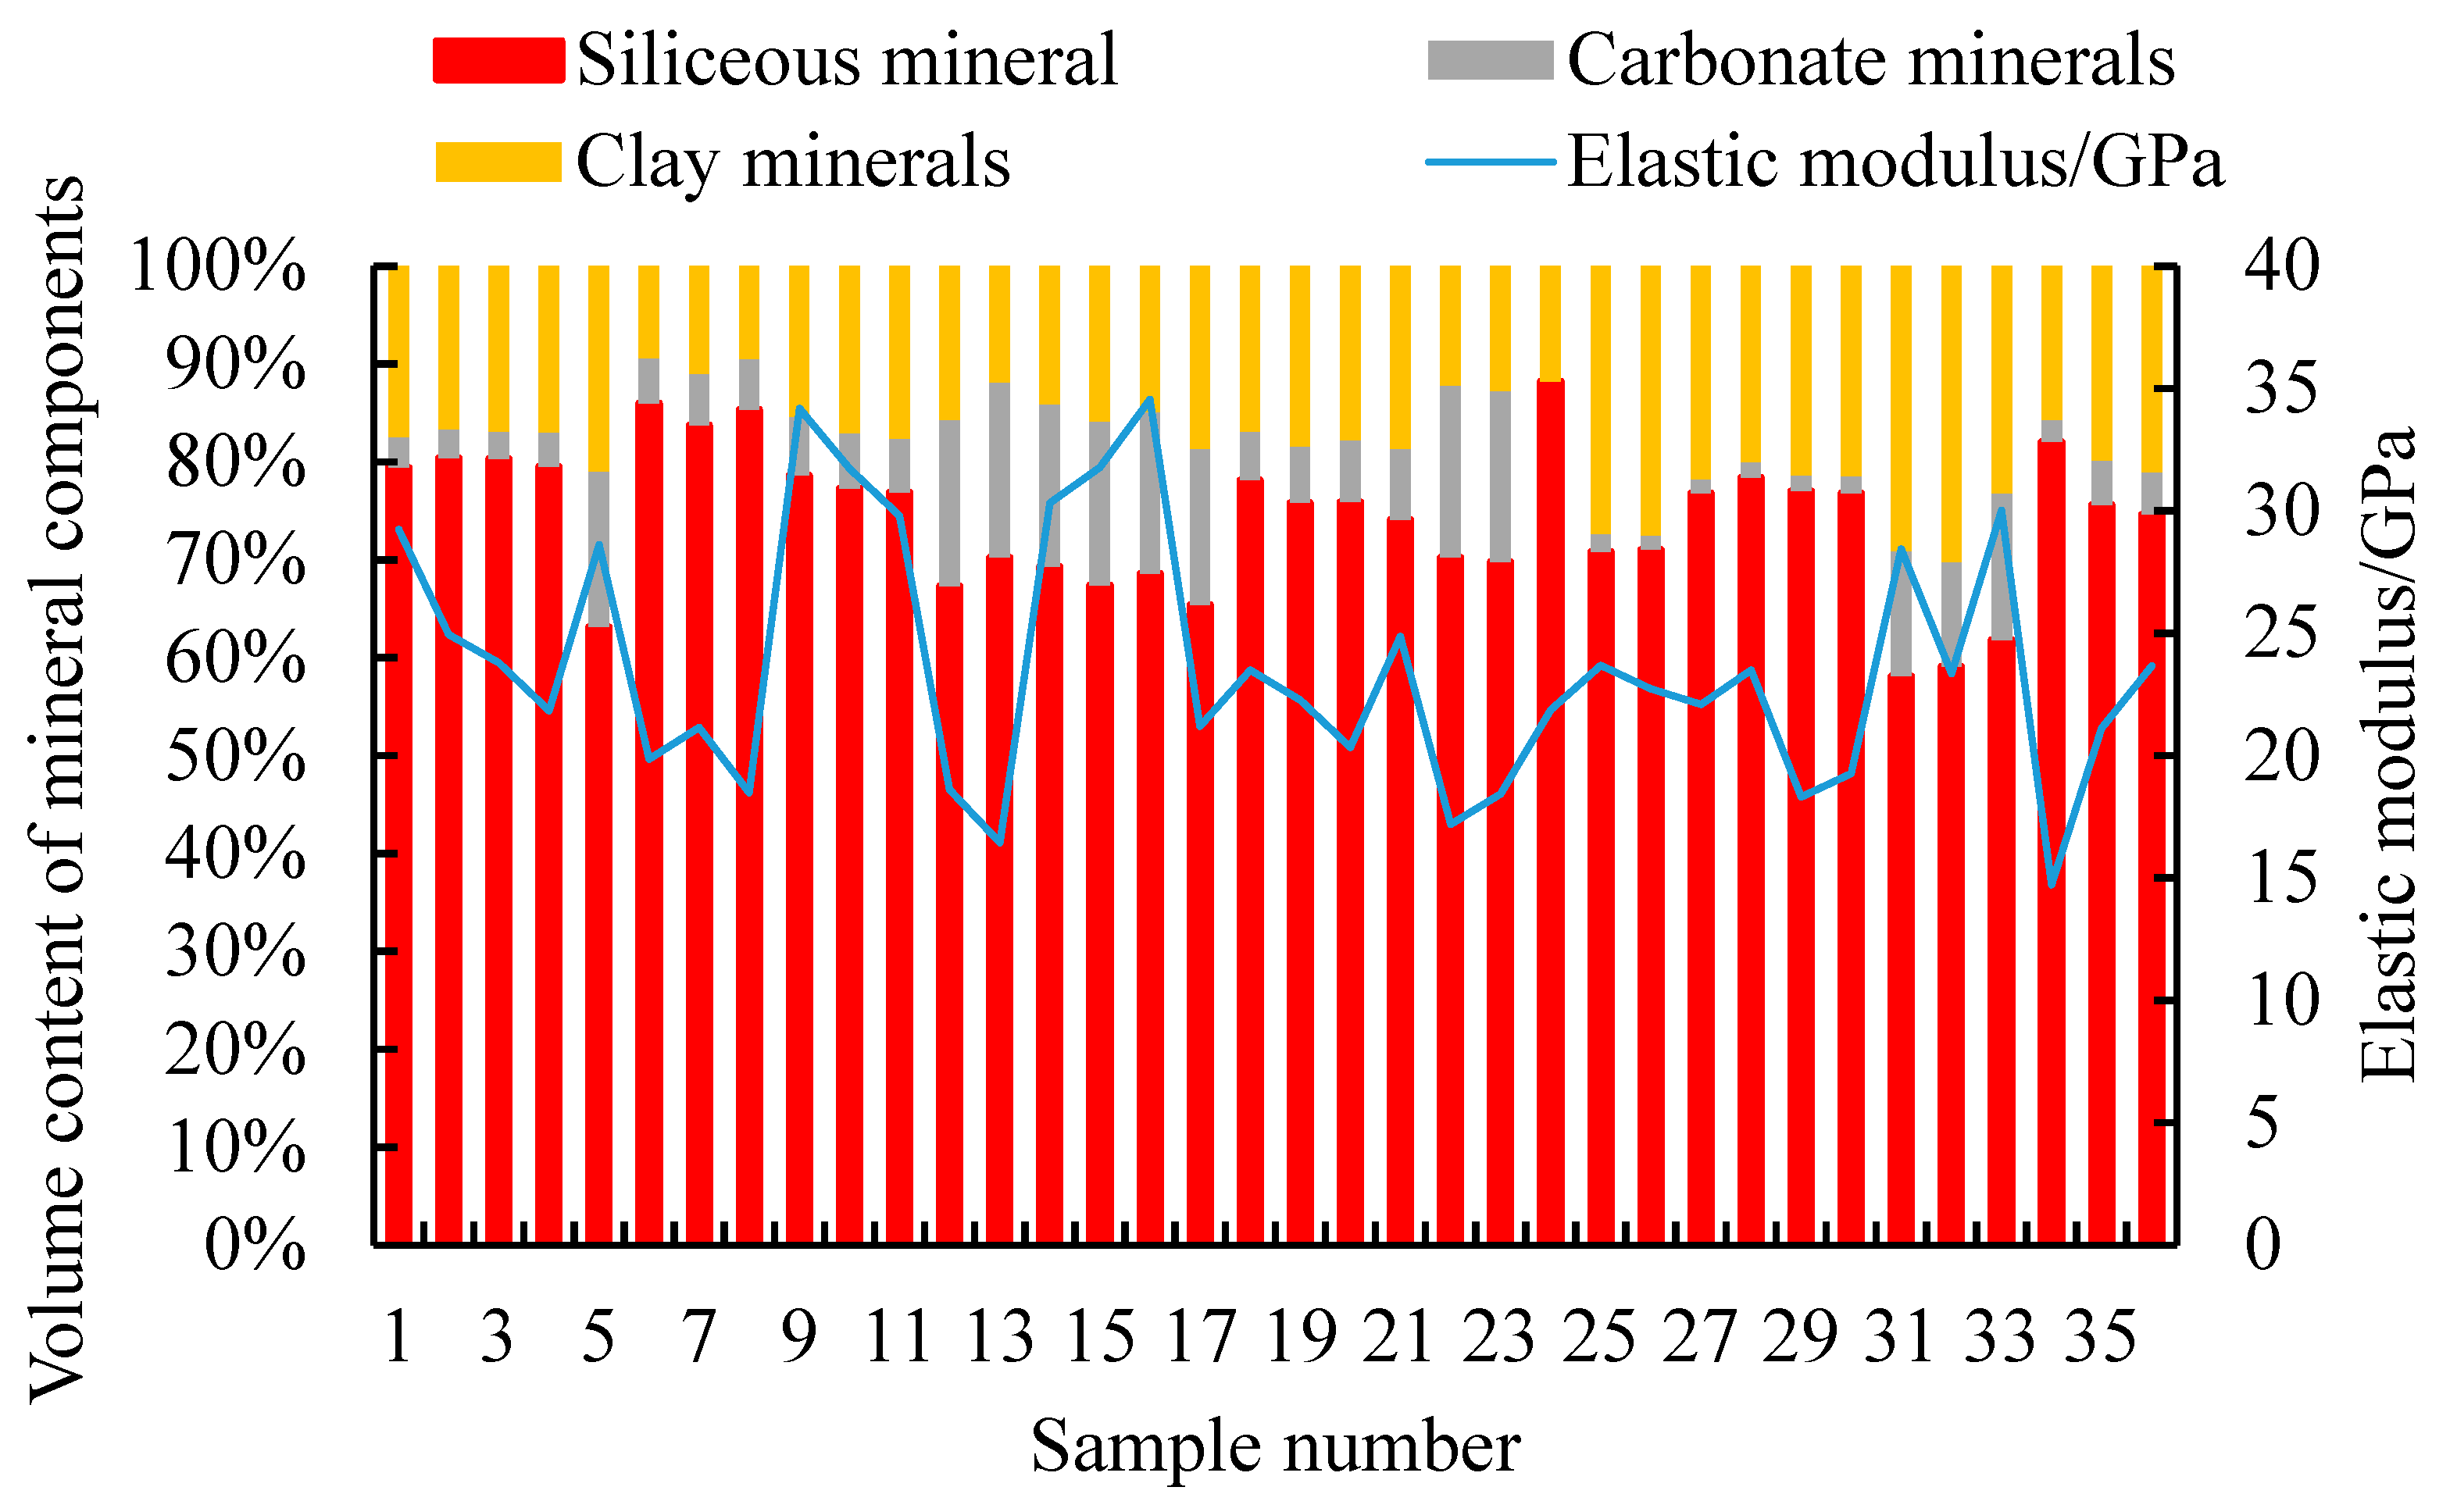
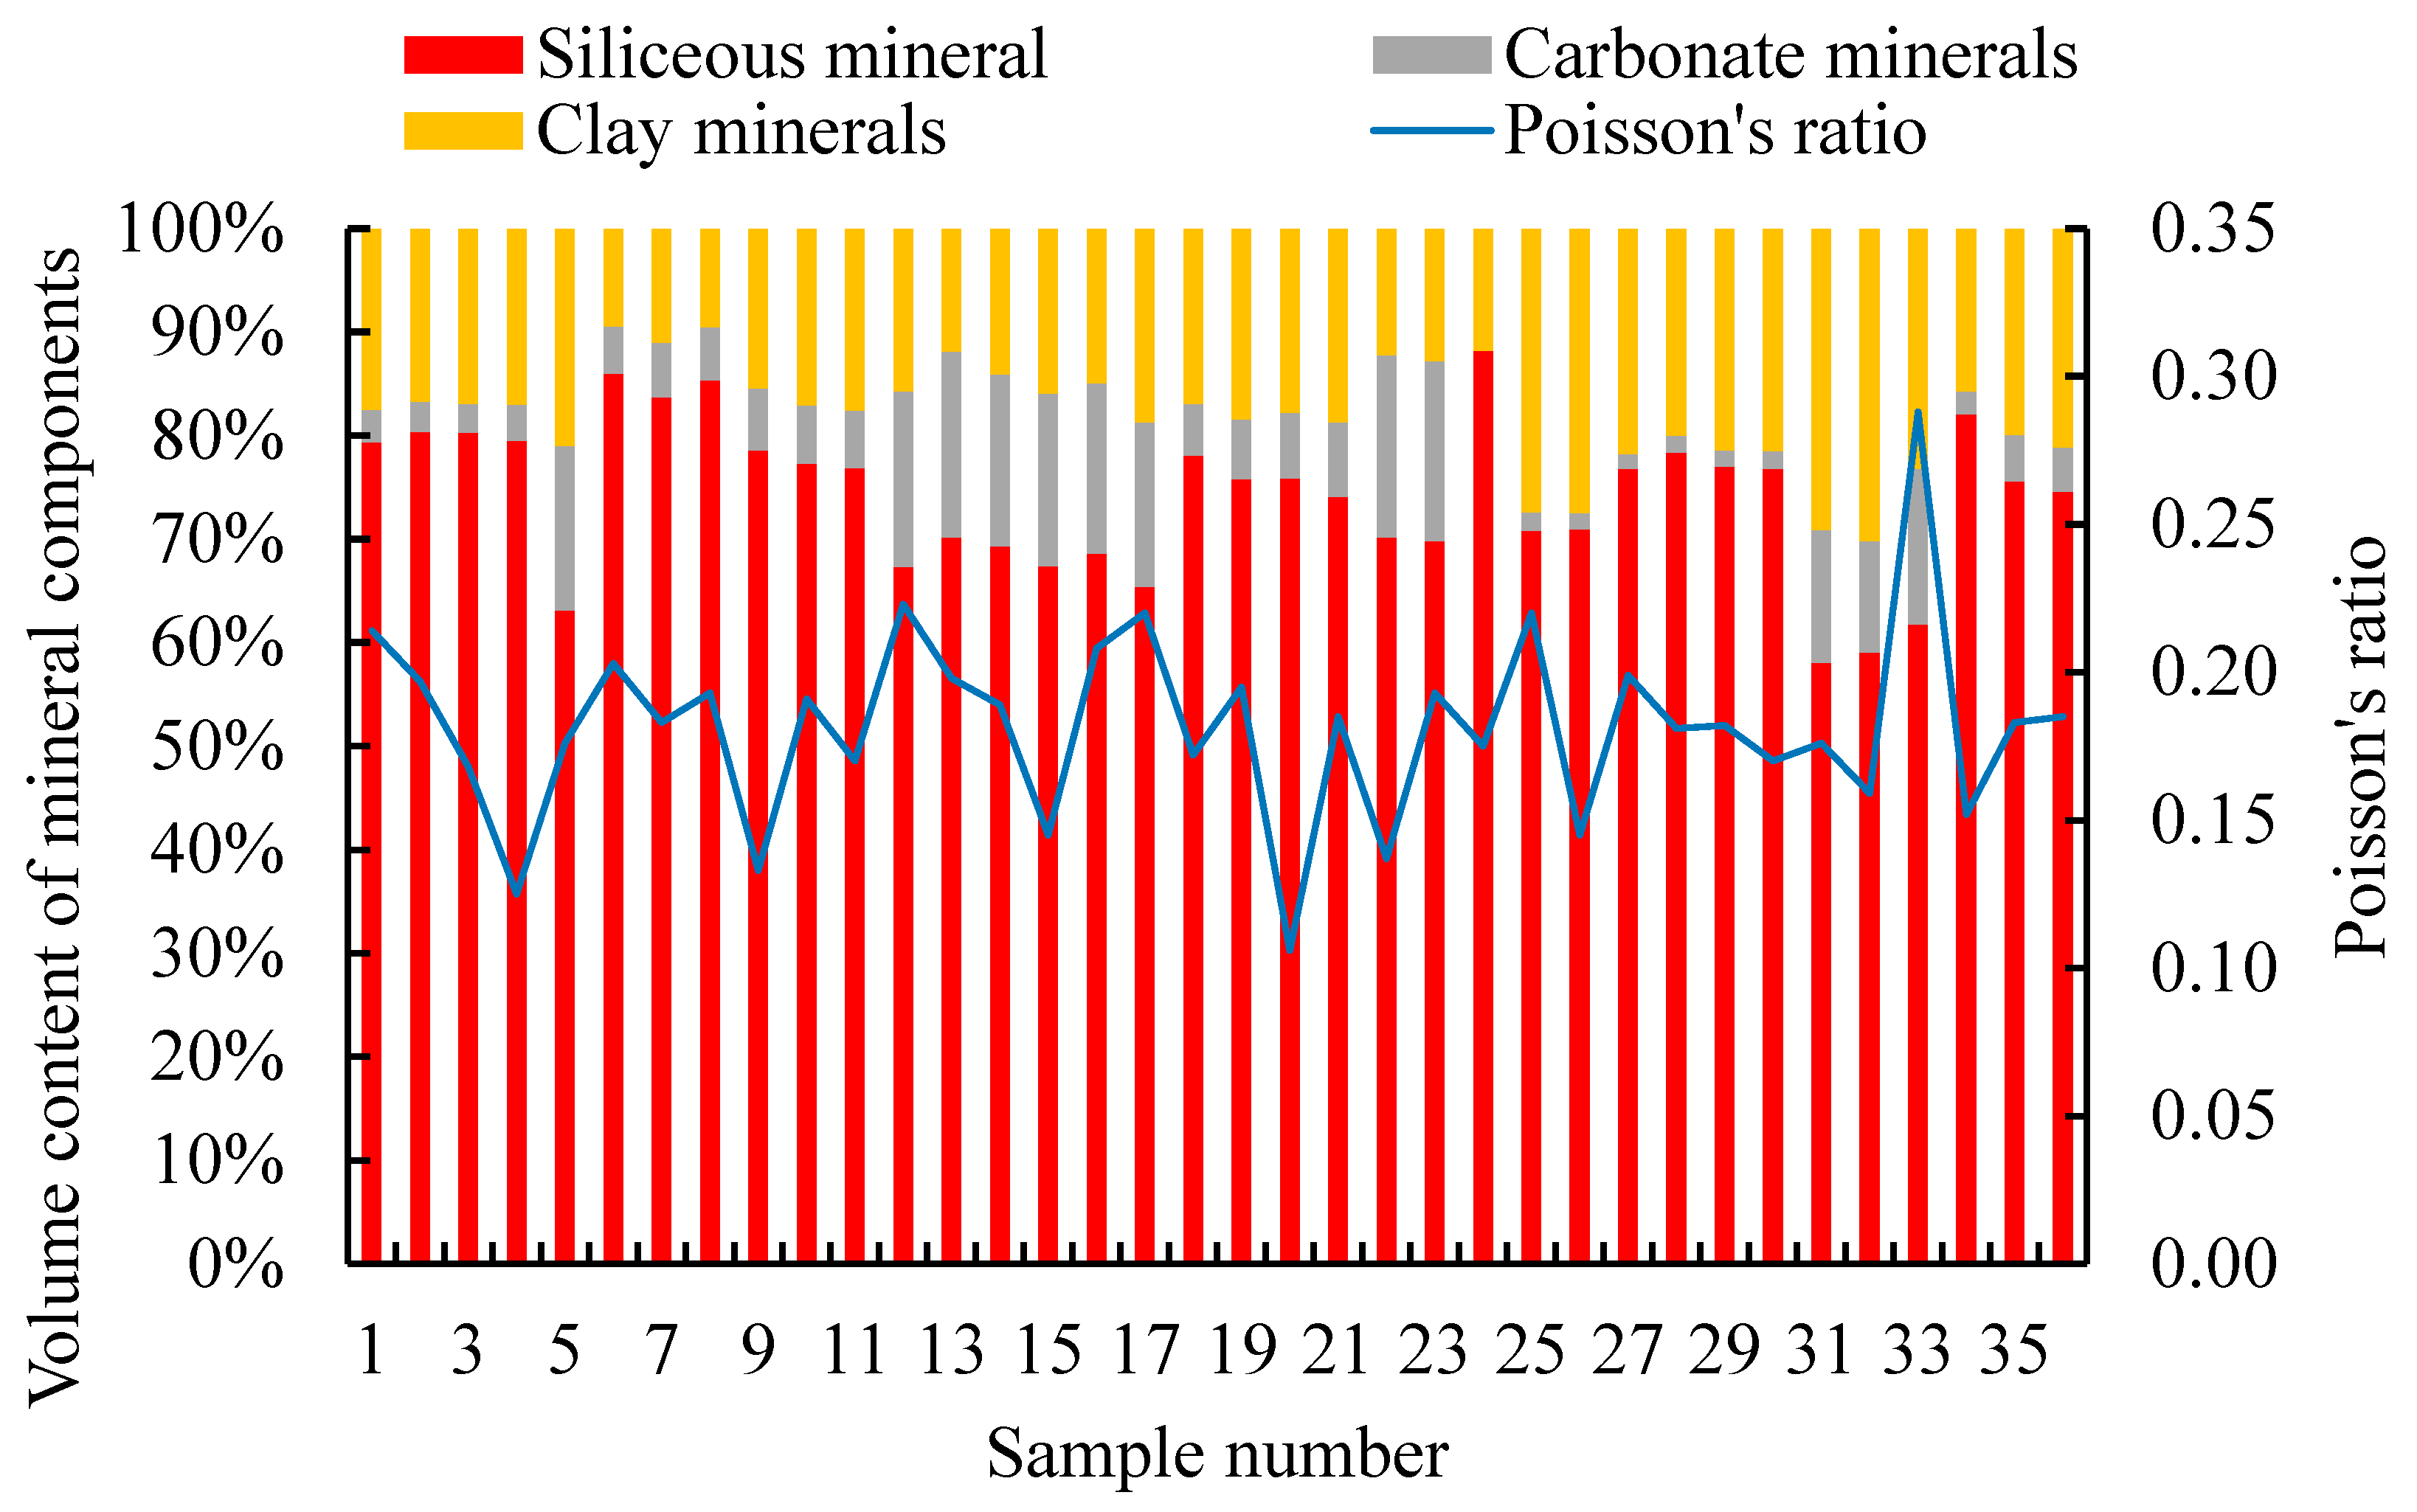
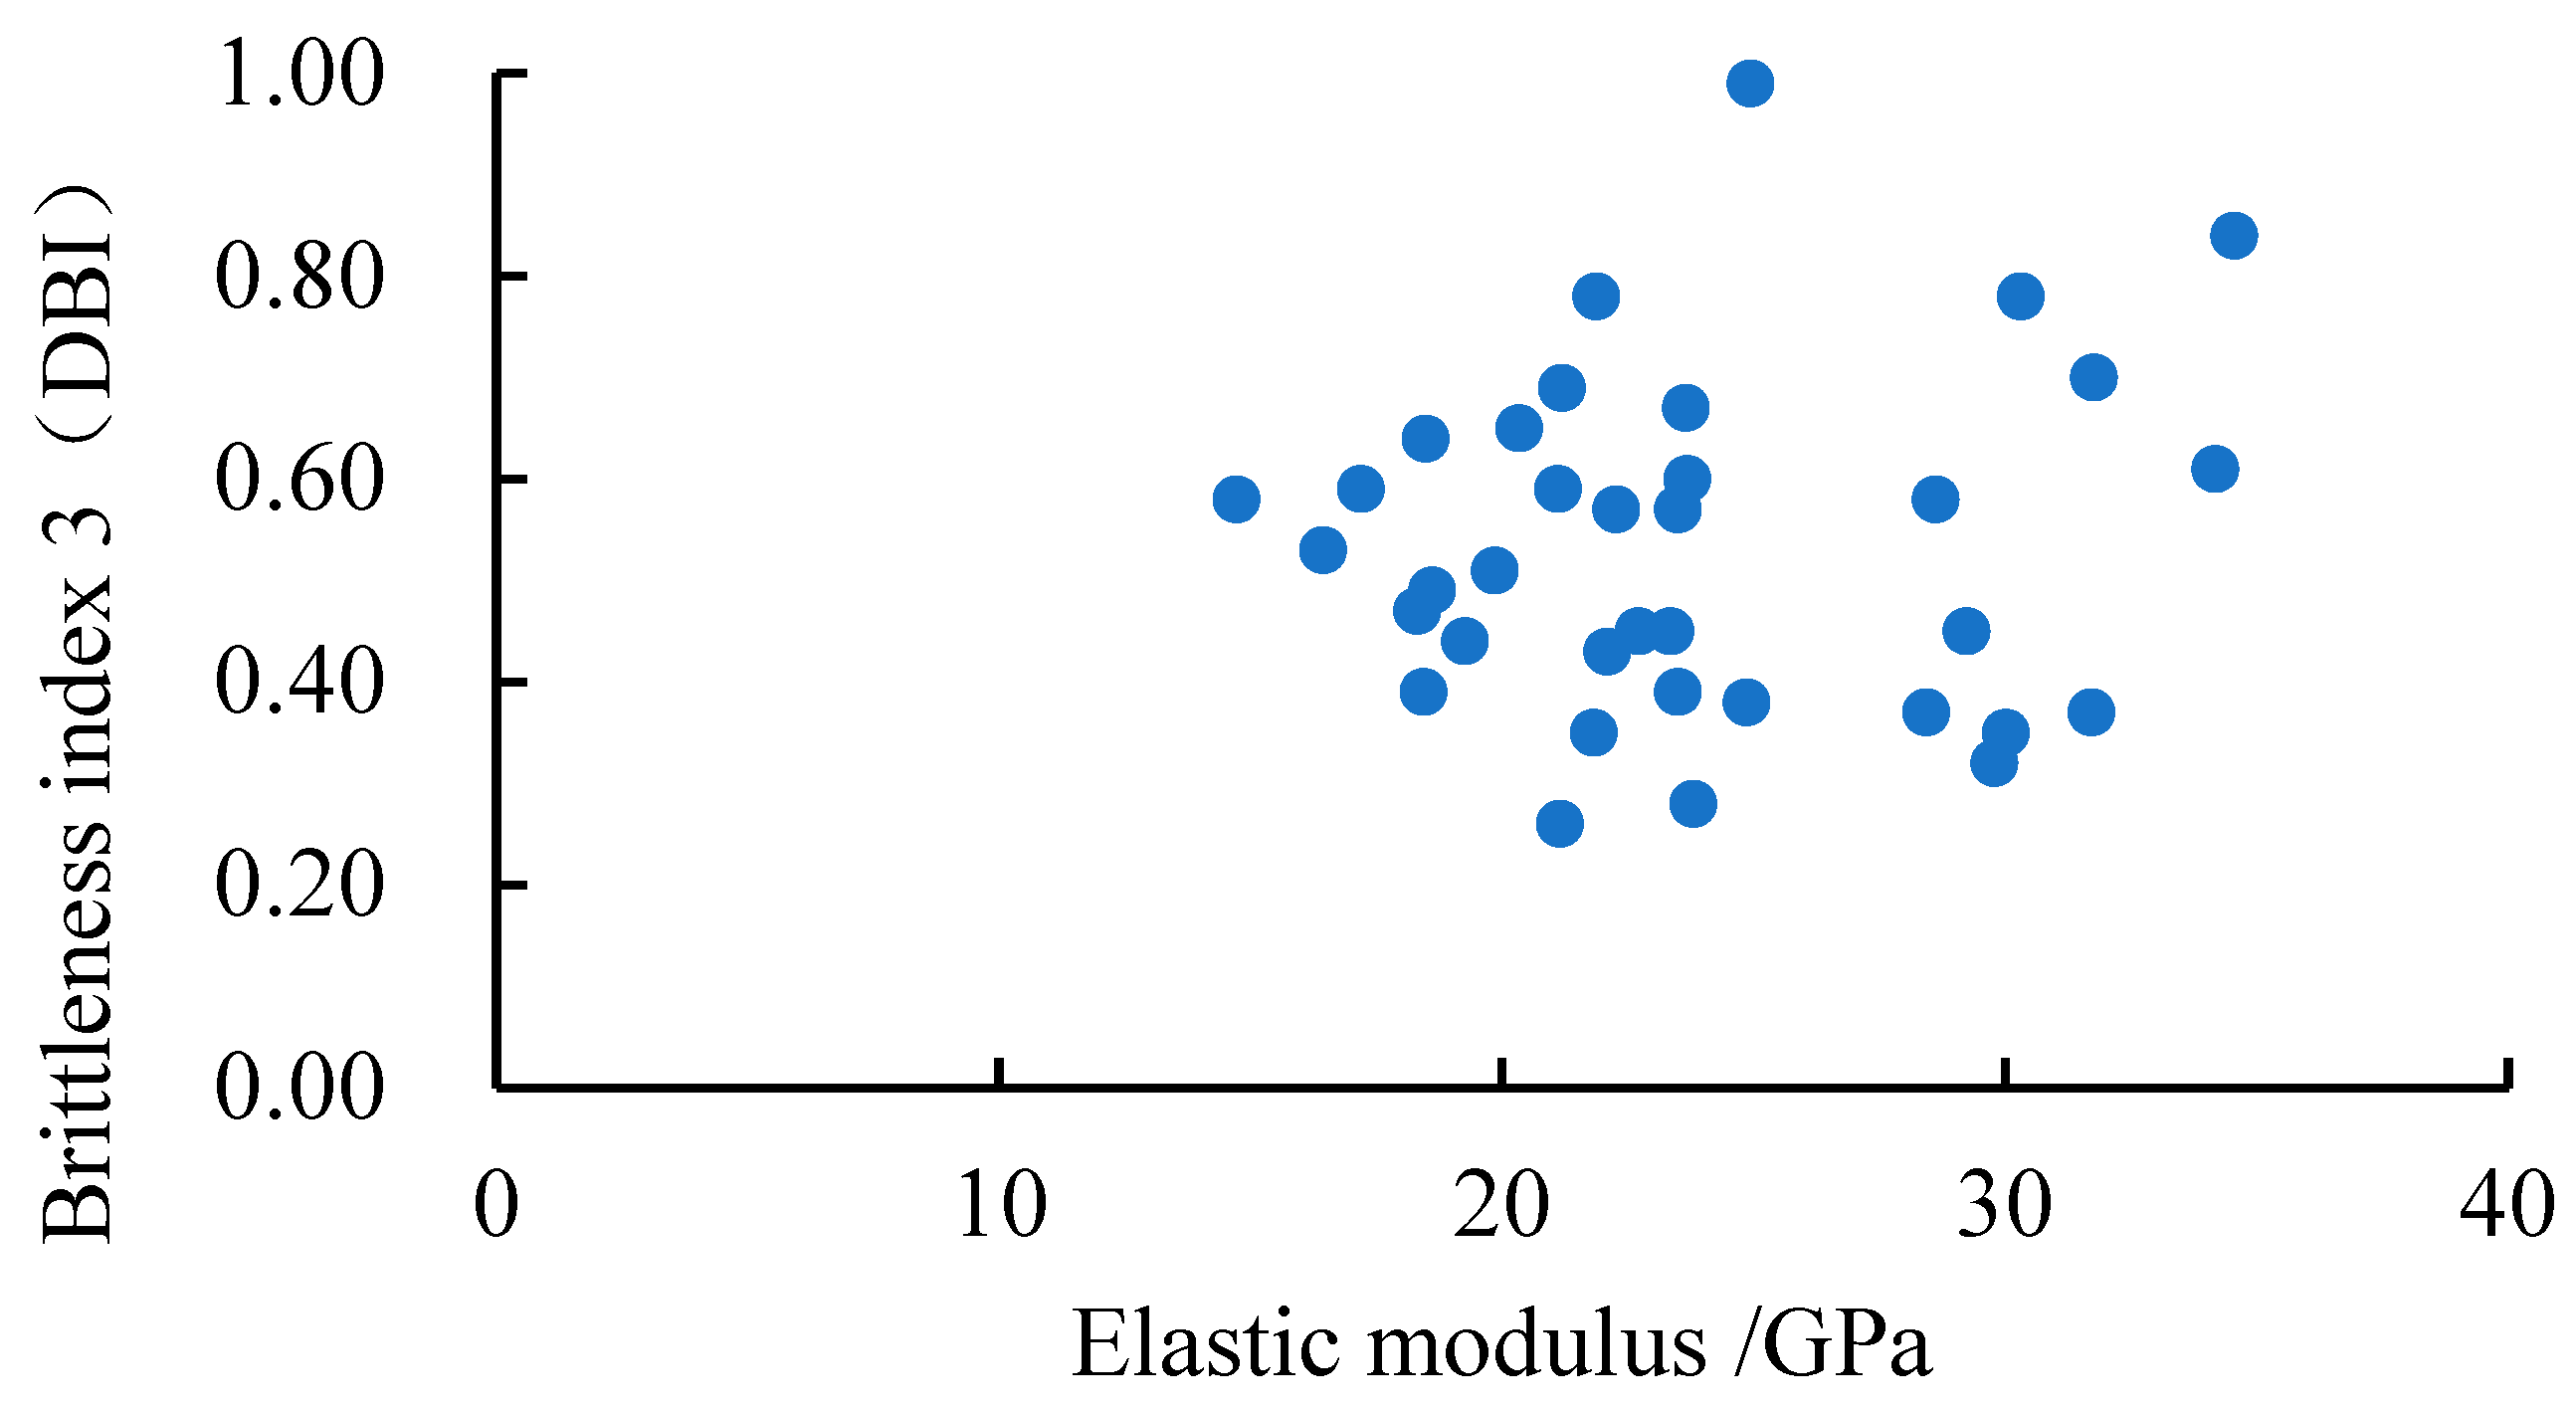
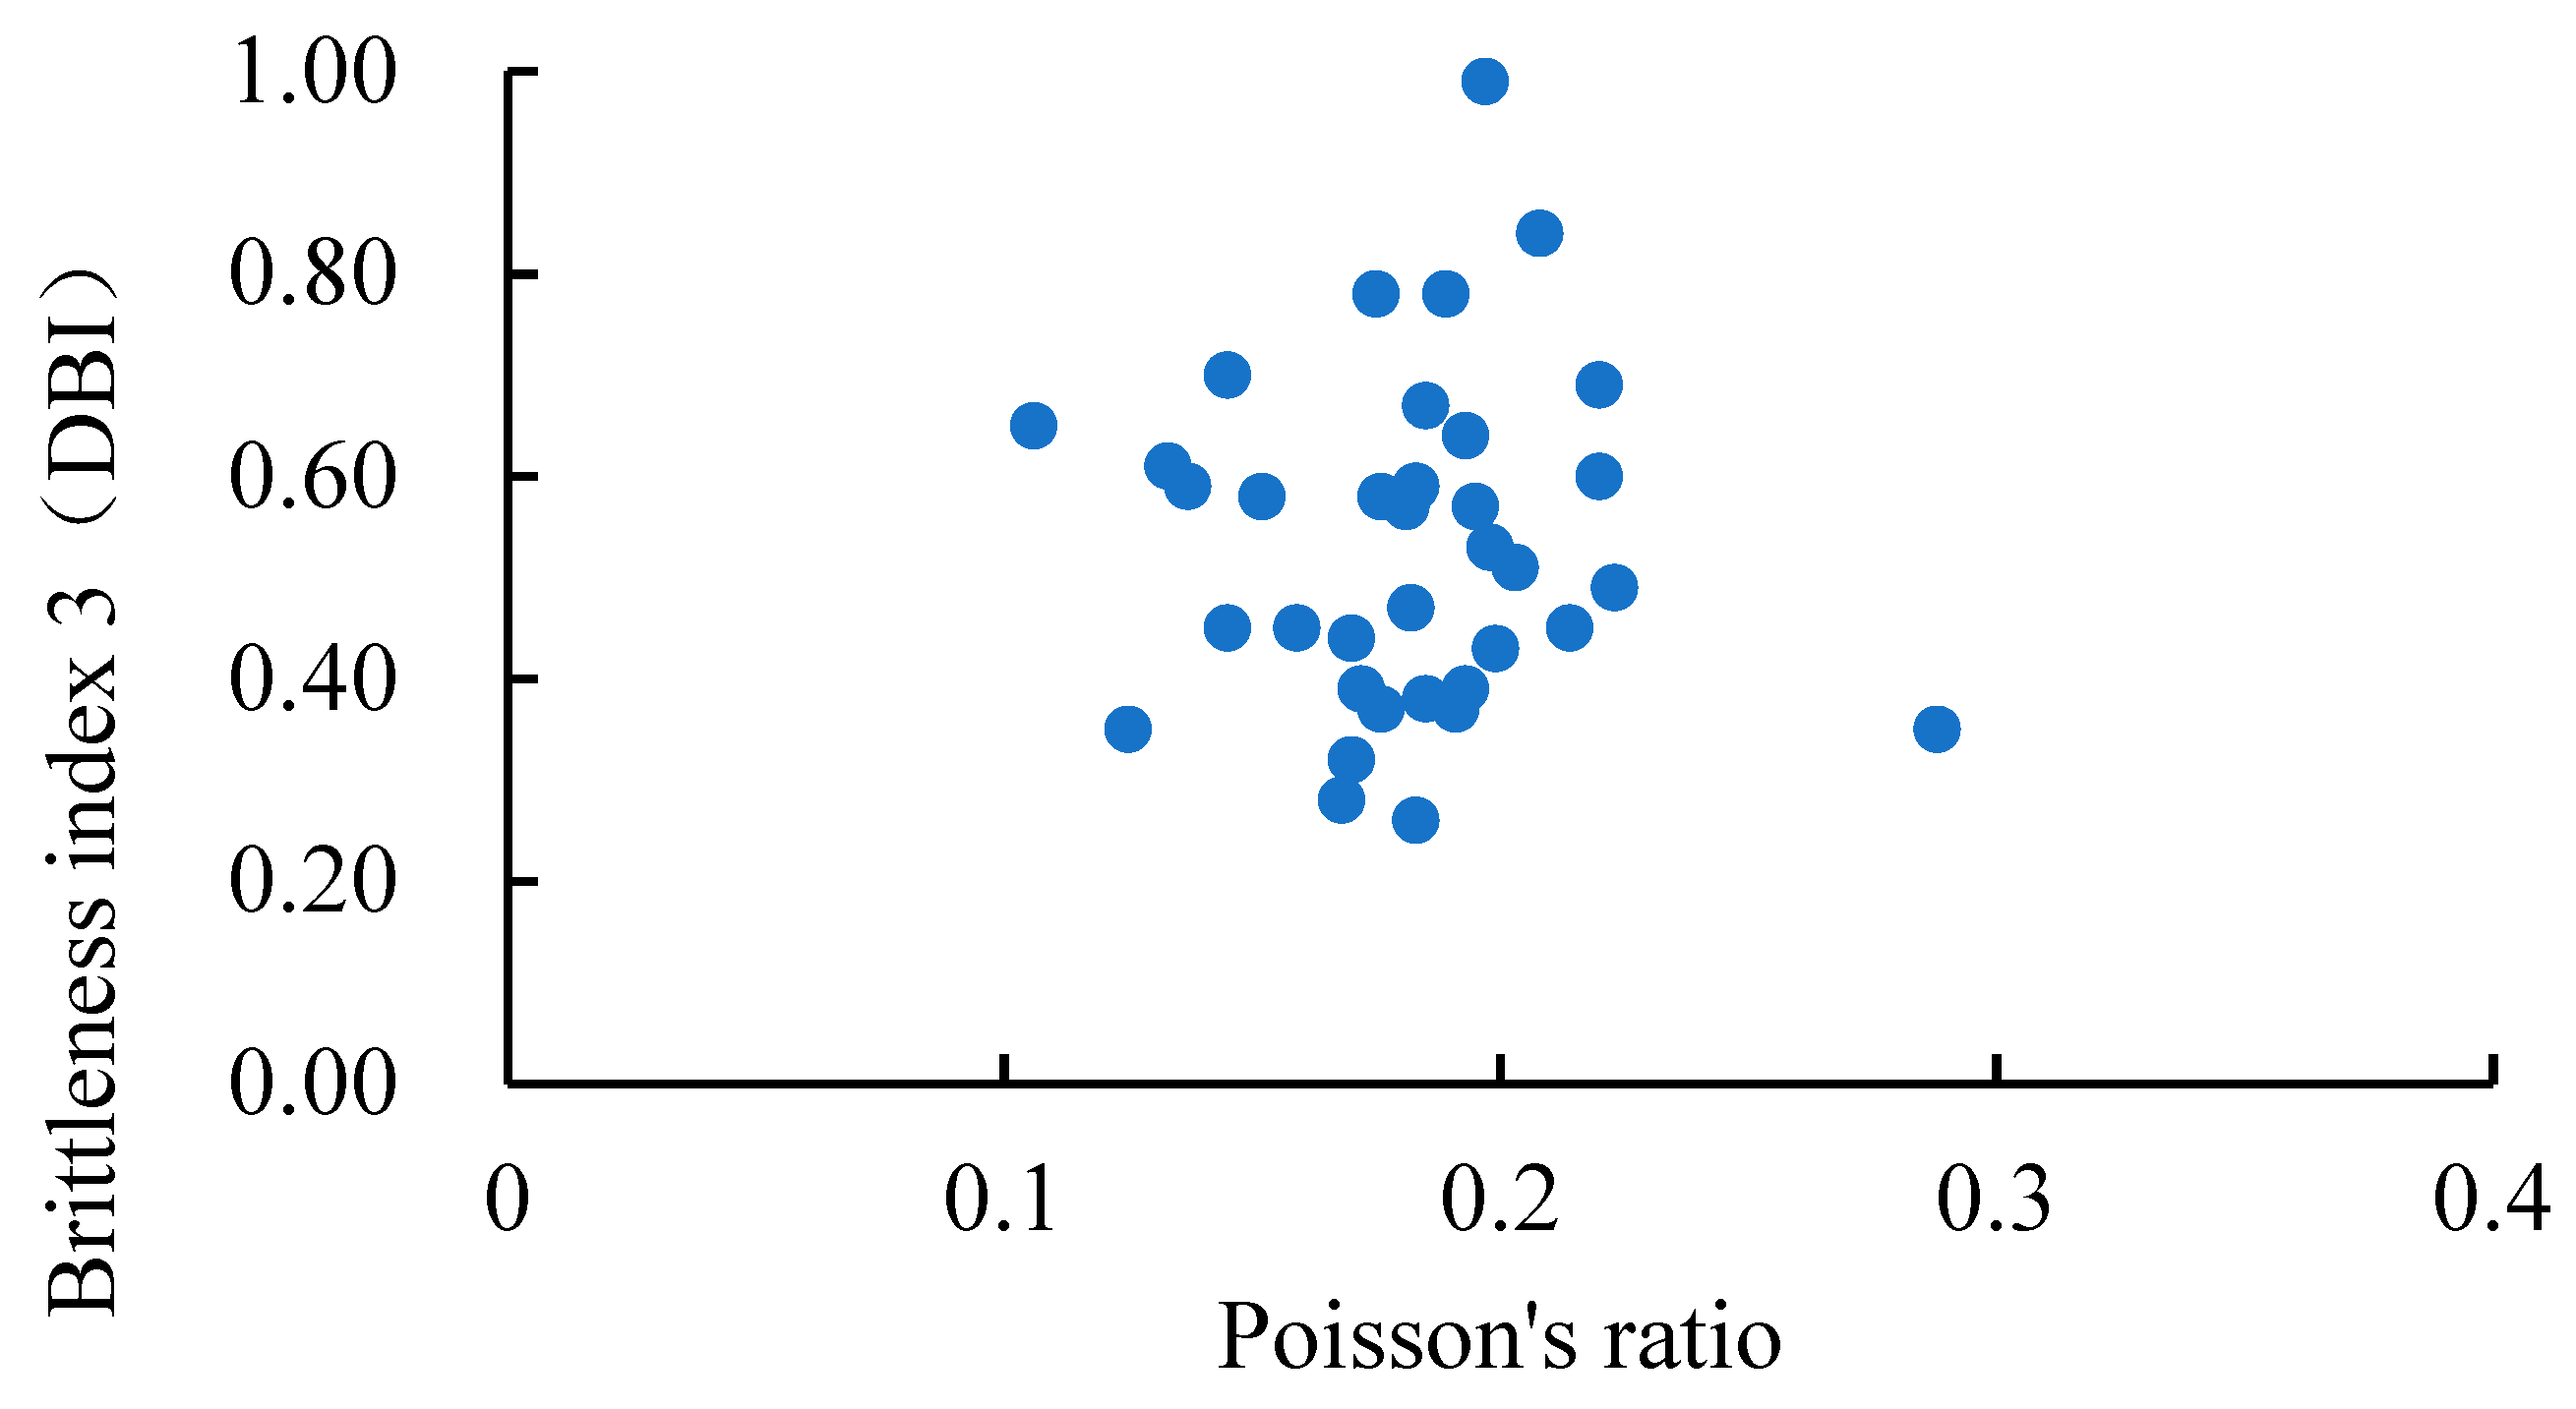
The influence of elastic modulus and Poisson’s ratio on brittle characteristics
Figure 16 and Figure 17 show the effects of elastic modulus and Poisson’s ratio on the brittleness index 3 (DBI). From the graph, it can be seen that the correlation between elastic modulus, Poisson’s ratio, and brittleness index 3 (DBI) is relatively low.

5. Conclusions

(1)
This article takes cores from the shale oil reservoir in the Yanchang Formation Chang 7 of Block Y in the northwest of the Ordos Basin. Thirty-six samples were tested using a three-axis rock mechanics servo testing system and X-ray diffractometer. The block contains seven minerals, including quartz and feldspar, with an average volume fraction of 22.6% for quartz minerals, 51.6% for feldspar, and 18% for clay minerals. Calcite, dolomite, and pyrite are only present in a few samples. When the confining pressure is 30 MPa, the elastic modulus of the Chang 7 shale in this block is 14.72~34.58 GPa, with an average value of 23.77 GPa. The Poisson’s ratio is 0.106~0.288, with an average value of 0.182. The differential stress is 100.8~260.1 MPa, with an average value of 164.36 MPa. The peak strain ranges from 0.57 to 1.21, with an average value of 0.91.
(2)
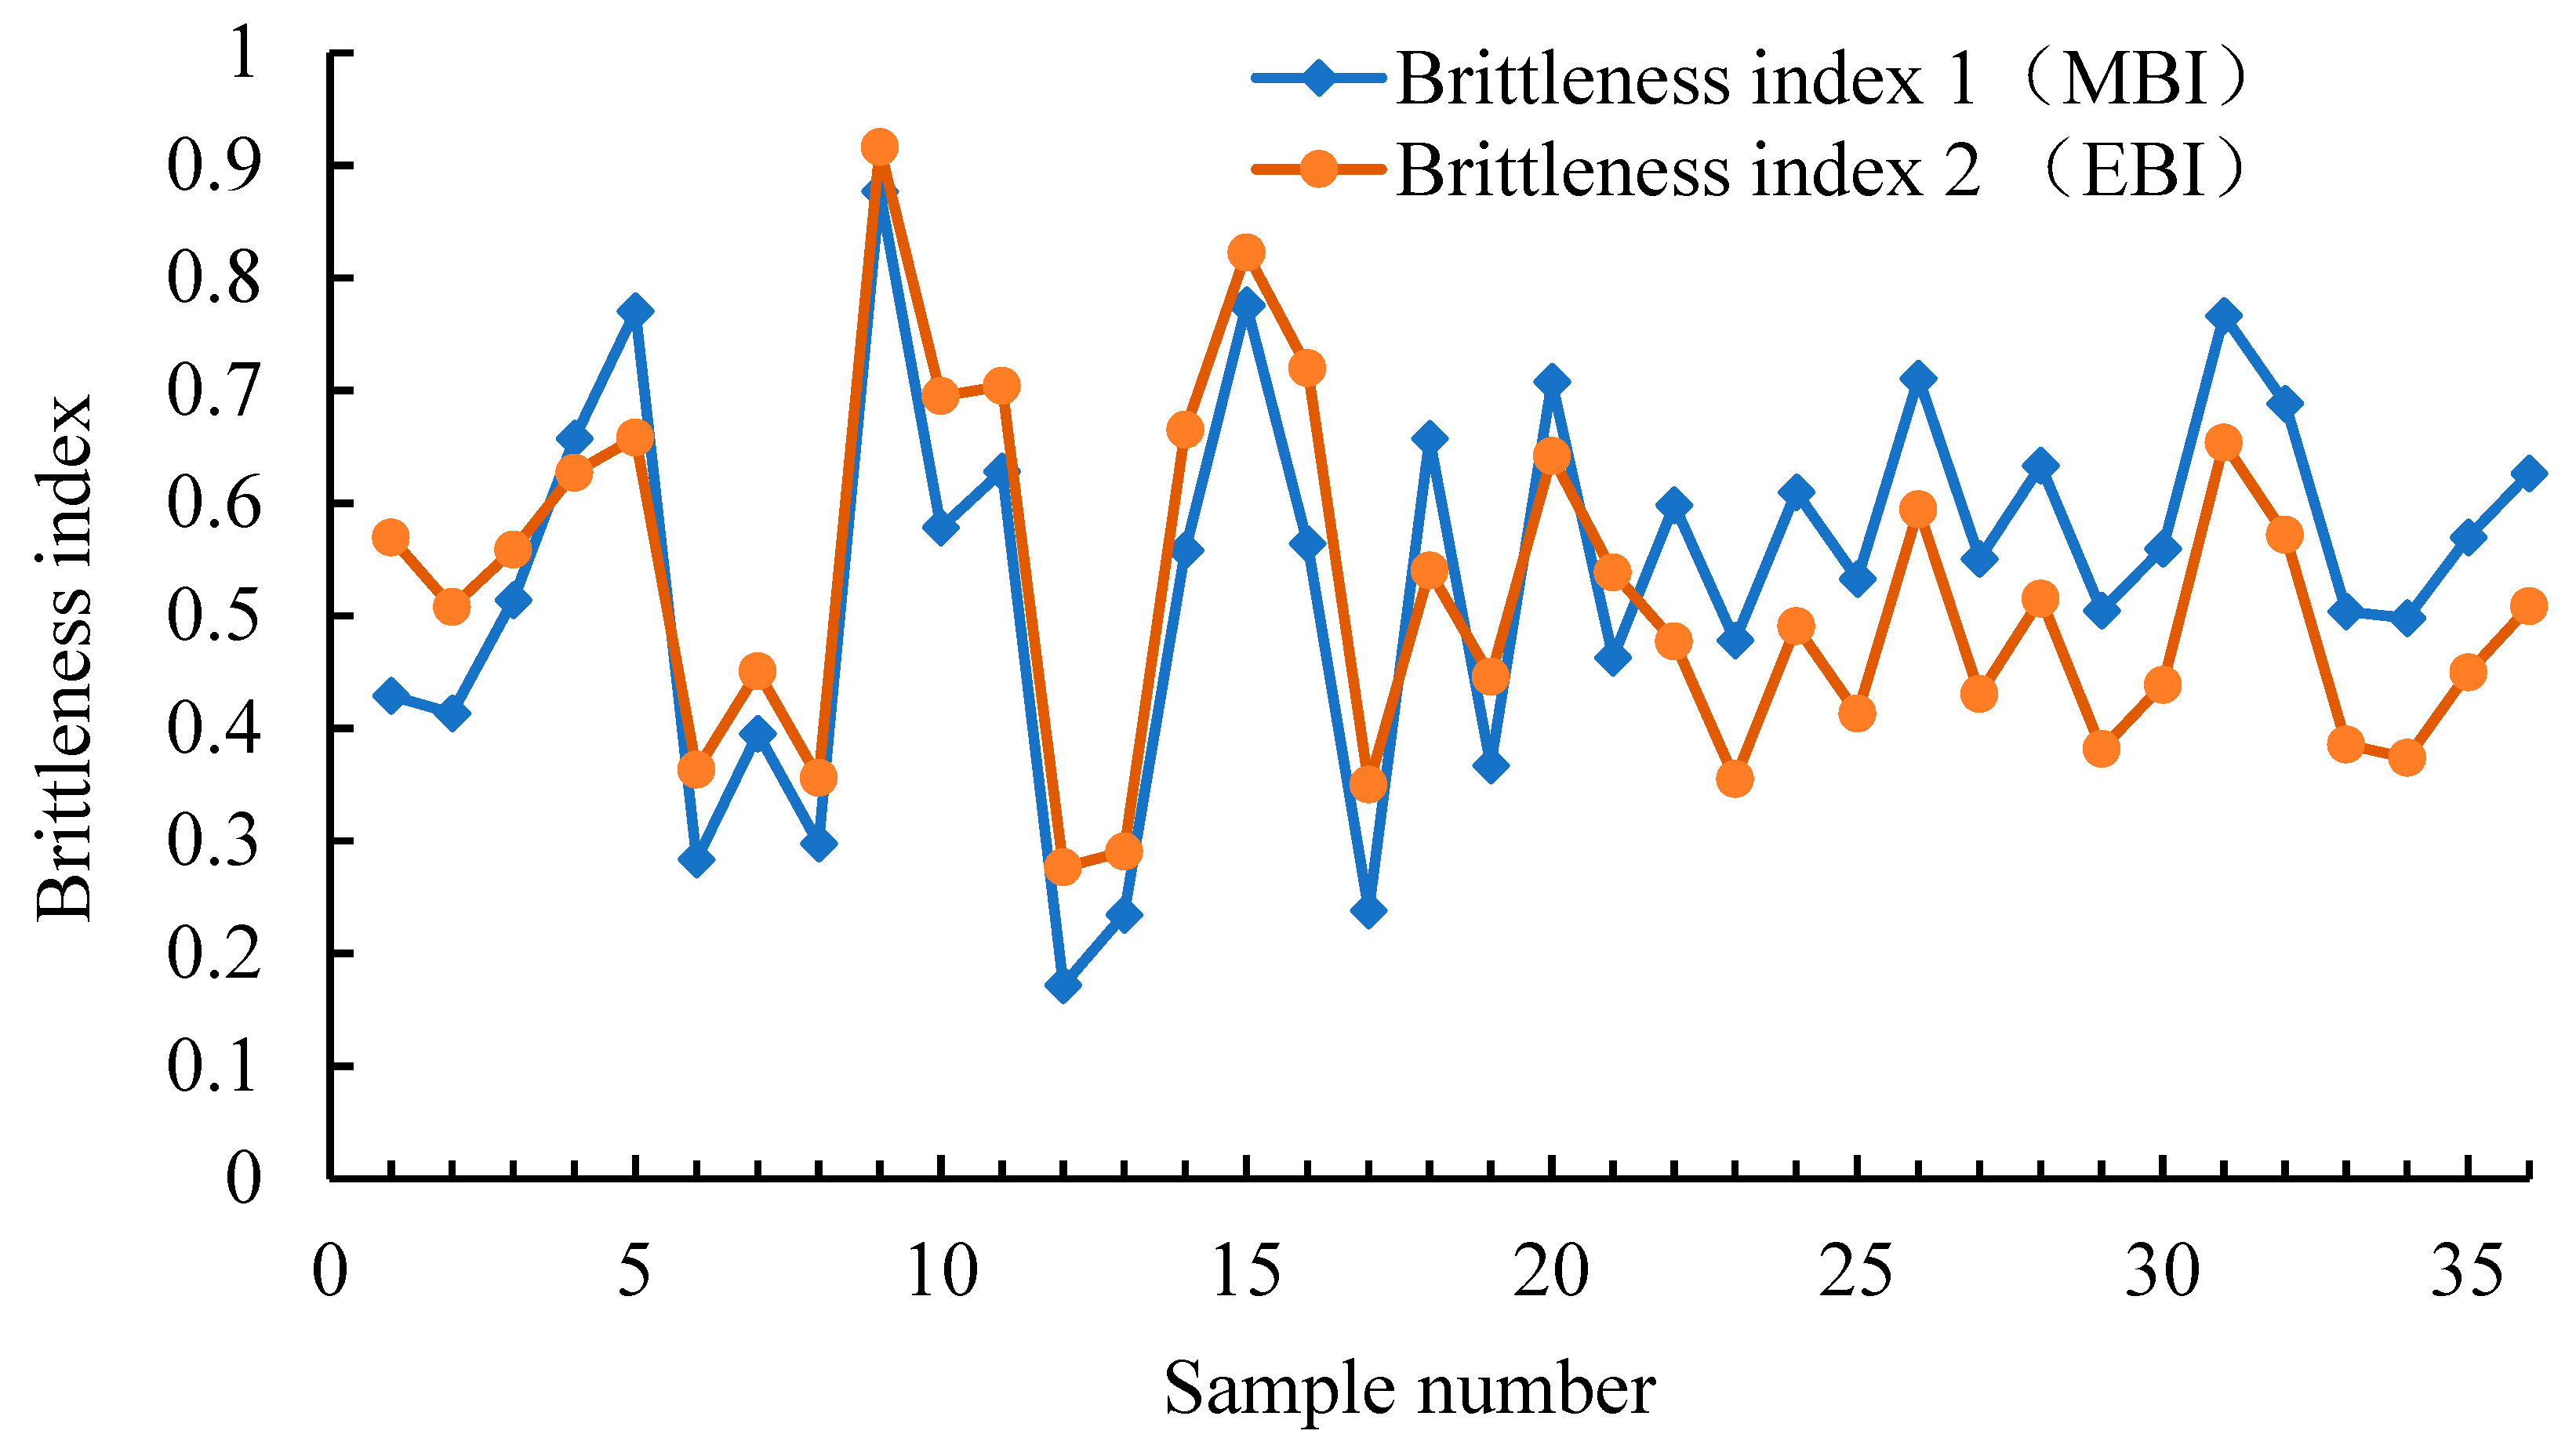
Based on indoor experimental test results, the average brittleness index 1 (MBI) of 36 experimental groups was calculated using the Jarvie mineral composition method, with a value of 0.5393. Using Rickman’s normalized Young’s modulus and average Poisson’s ratio, the brittleness index 2 (EBI) was calculated to evaluate the relative brittleness of rocks. The average value of 36 experimental groups was 0.5204. Generally, in the process of selecting layers and segments, values with a brittleness index greater than or equal to 0.4 are chosen.
(3)
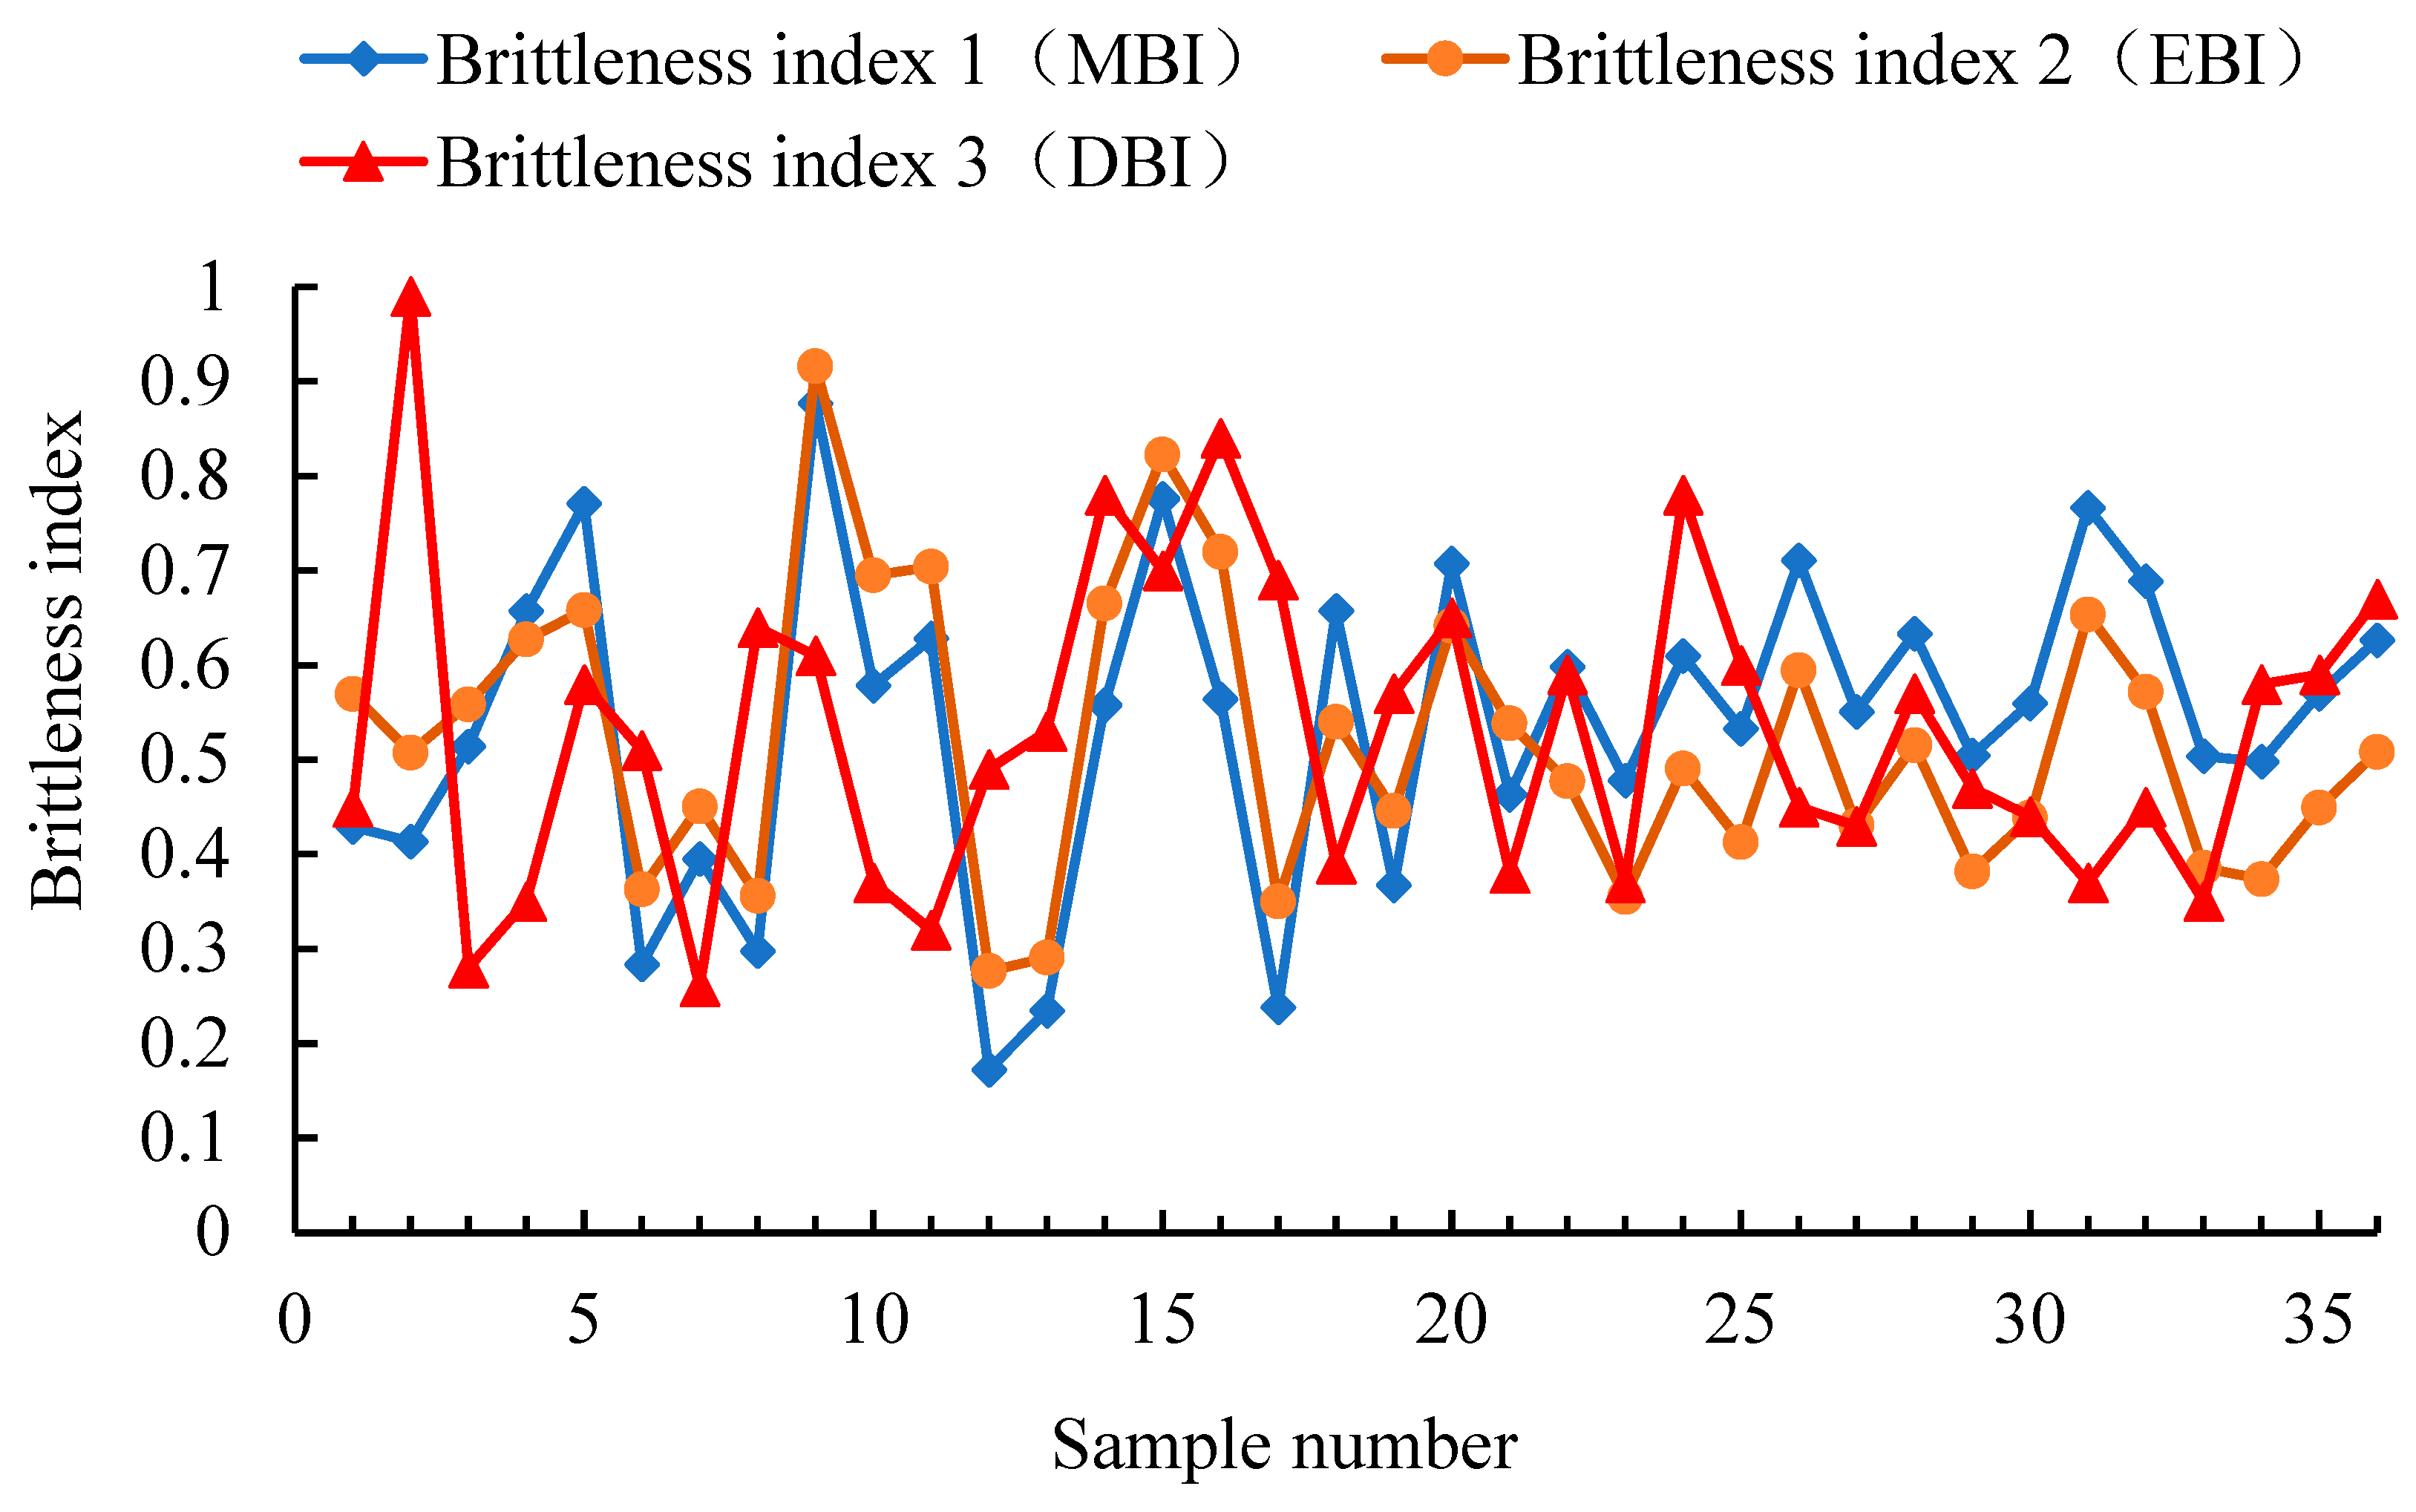
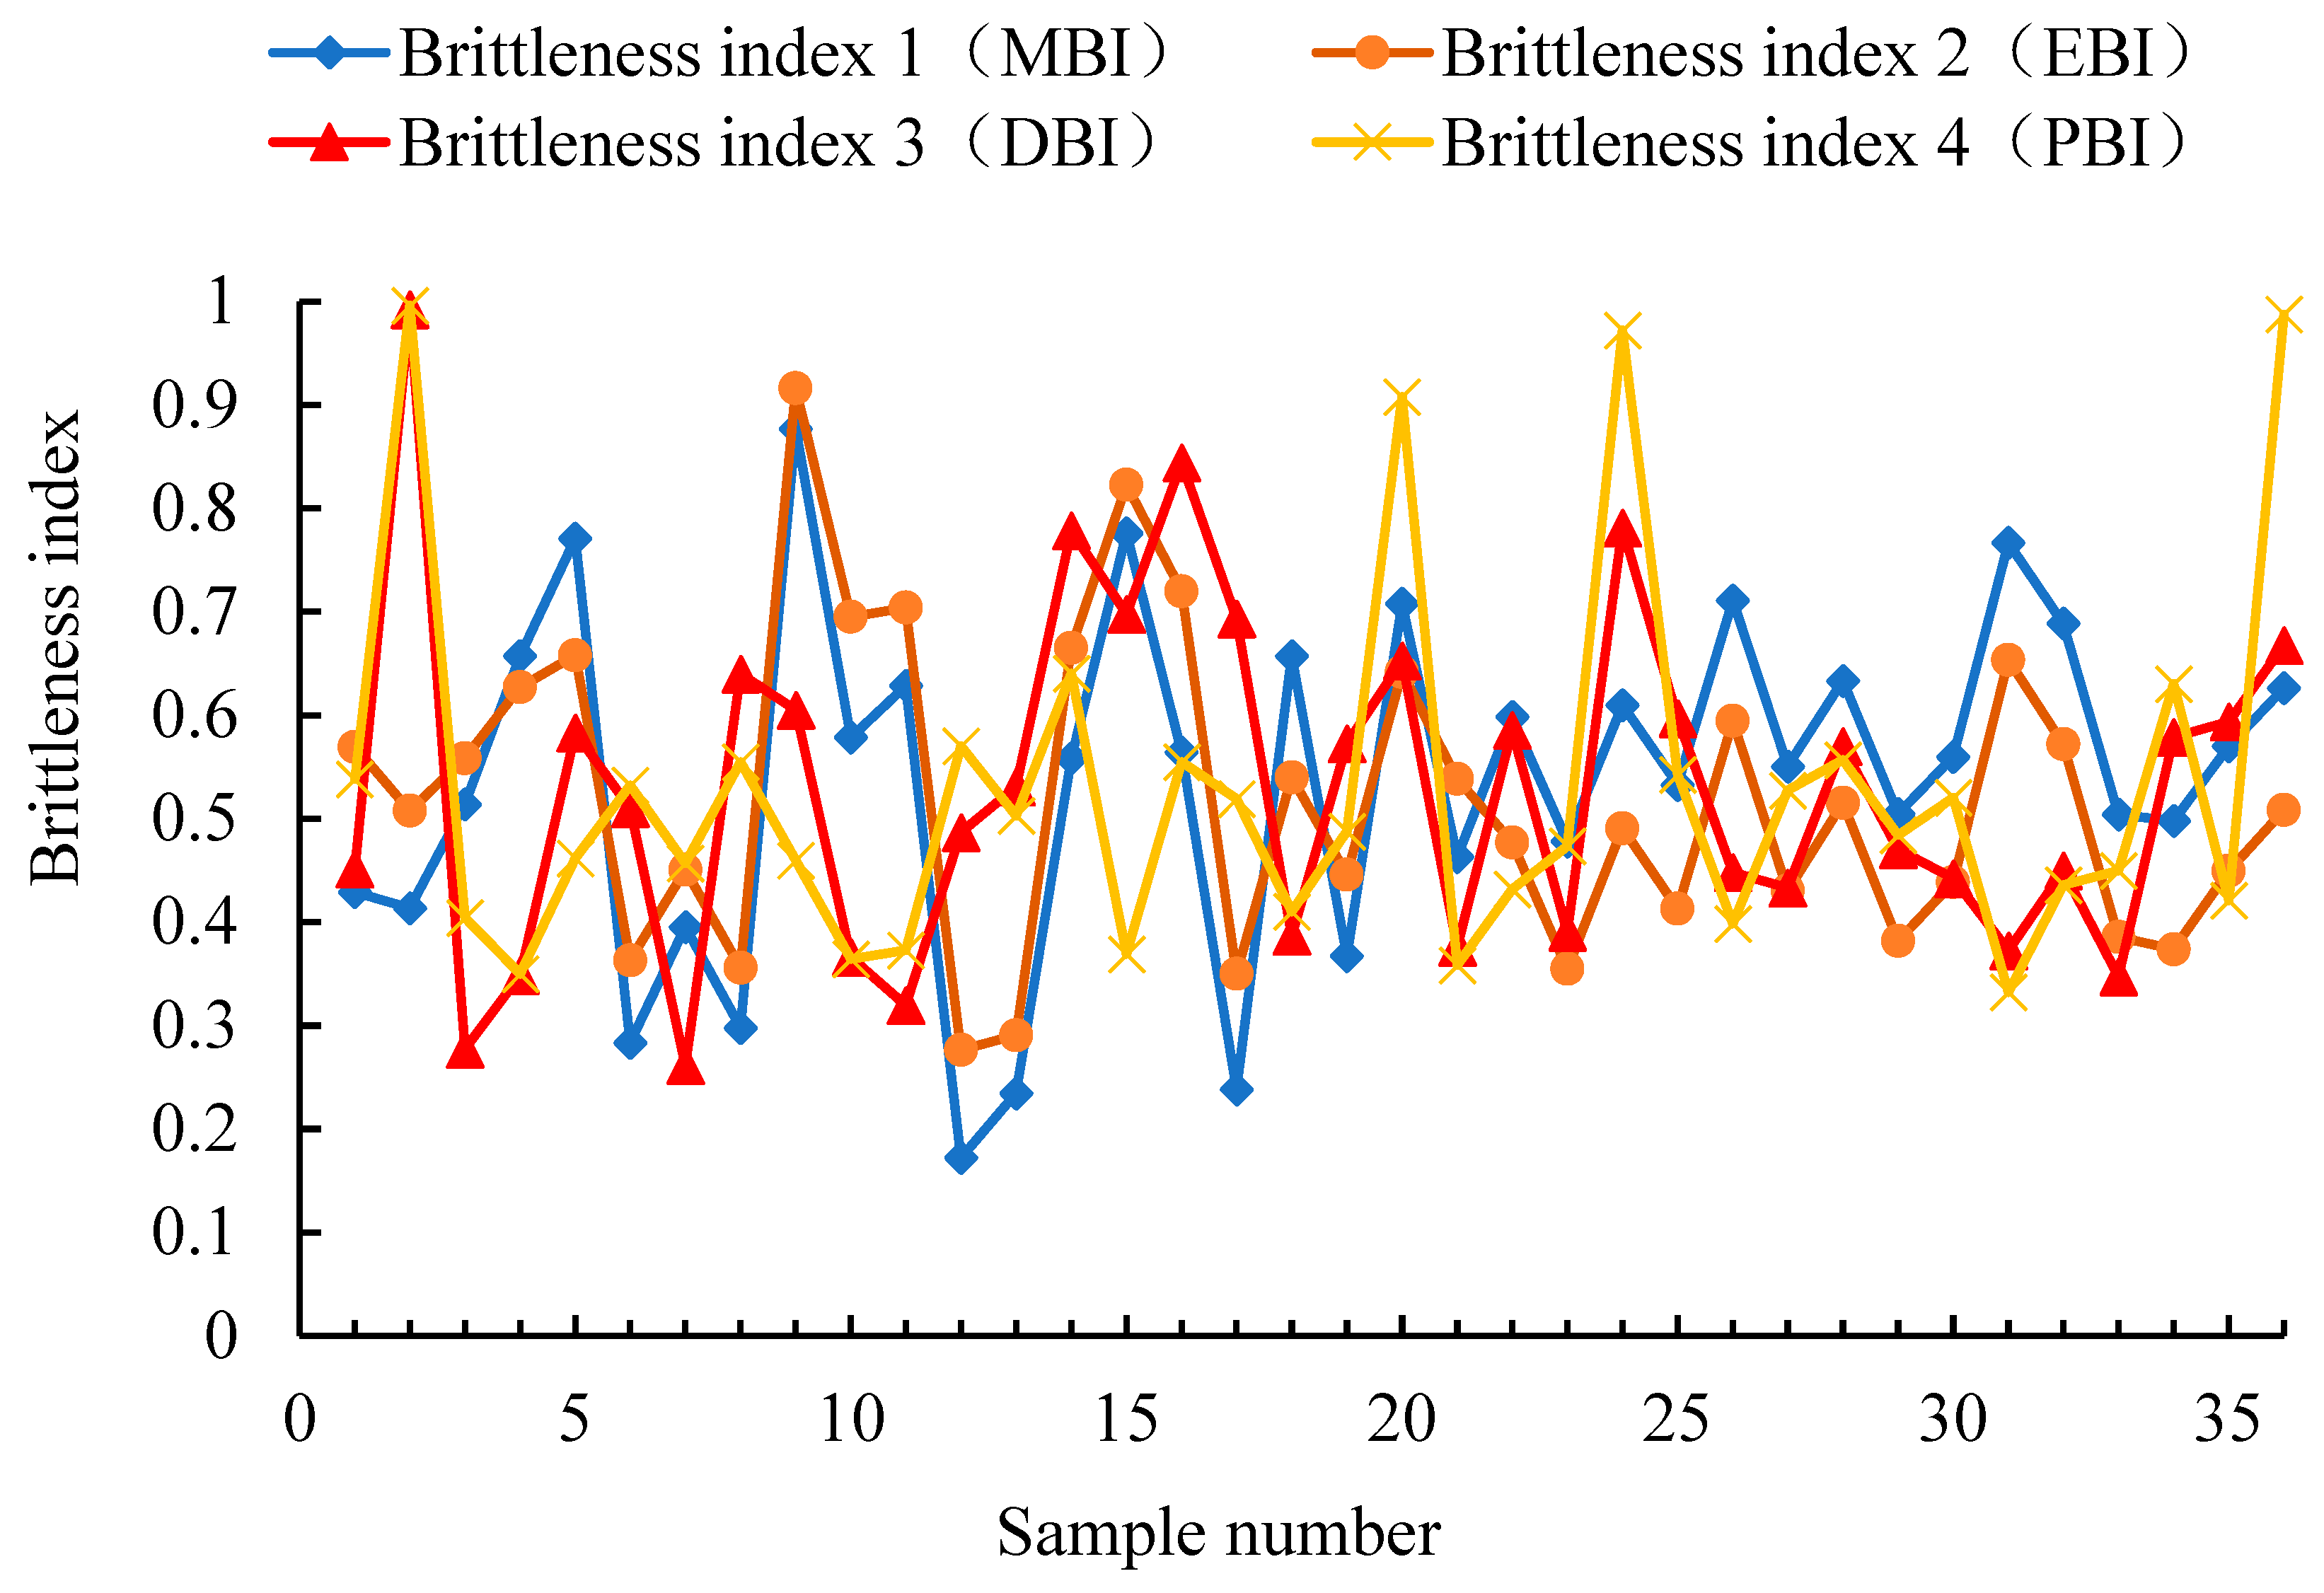
The intrinsic correlation between the elastic strain energy released during the loading process, the strain energy absorbed to the outside, and the three types of energy of fracture strain energy and rock brittleness were analyzed from the perspective of fracture mechanism. A brittle index 3 (DBI) model was established, and its feasibility was verified. The average value of 36 experimental groups can be calculated to be 0.5306, and the trend of the brittle index 3 (DBI) calculated using the energy method is basically the same as the trend calculated by the first two methods, indicating that the third method is feasible. Based on the relationship between peak stress (differential stress) and residual stress in the stress-strain curve, the brittleness index 4 (PBI) value was obtained, and the average value of 36 experimental groups was 0.5271.

Author Contributions

J.Z. and J.C. conceived and designed the experiments; J.X. and Z.L. performed the experiments; J.Z. wrote the paper; X.N., D.G., and J.L. revised the paper. All authors have read and agreed to the published version of the manuscript.

Funding

The authors would like to thank The National Natural Science Foundation of China project “Research on the evolution mechanism and effectiveness evaluation of dense cutting volume fracturing network in terrestrial shale oil reservoirs” (No. 52274040). And Scientific Research Program Funded by Shaanxi Provincial Education Department (Program No. 22JS030).

Data Availability Statement

The original contributions presented in the study are included in the article, further inquiries can be directed to the corresponding authors.

Acknowledgments

The authors gratefully thank the anonymous reviewers and editors for their critical comments and valuable suggestions, which were very helpful to improve the manuscript.

Conflicts of Interest

Author Junjie Lei was employed by Yanchang Oilfield Co., Ltd. The remaining authors declare that the research was conducted in the absence of any commercial or financial relationships that could be construed as a potential conflict of interest.

References

  1. Cao, H.; Wang, T.Y.; Bao, T.; Sun, P.H.; Zhang, Z.; Wu, J.J. Effective exploitation potential of shale gas from Lower Cambrian Niutitang Formation, Northwestern Hunan, China. Energies 2018, 11, 3373. [Google Scholar] [CrossRef]
  2. Shi, W.R.; Wang, X.Z.; Zhang, C.M.; Feng, A.G.; Huang, Z.S. Experimental study on gas content of adsorption and desorption in Fuling shale gas field. J. Pet. Sci. Eng. 2019, 180, 1069–1076. [Google Scholar] [CrossRef]
  3. Zou, C.N.; Dong, D.Z.; Wang, Y.M.; Li, X.J.; Huang, J.L.; Wang, S.F.; Guan, Q.H.; Zhang, C.C.; Wang, H.Y.; Liu, H.L.; et al. Shale gas in China: Characteristics, challenges and prospects (II). Pet. Explor. Dev. 2016, 43, 182–196. [Google Scholar] [CrossRef]
  4. Li, Y.X.; Qiao, D.W.; Jiang, W.L.; Zhang, C.H. Gas content of gas-bearing shale and its geological evaluation summary. Geol. Bull. China 2011, 30, 308–317. [Google Scholar]
  5. Glorioso, J.C.; Rattia, A. Unconventional reservoirs: Basic petrophysical concepts for shale gas. In Proceedings of the SPE/EAGE European Unconventional Resources Conference and Exhibition, Vienna, Austria, 20–22 March 2012. [Google Scholar]
  6. Zou, C.N.; Dong, D.Z.; Yang, Y.; Wang, Y.M.; Huang, J.L.; Wang, S.F.; Fu, C.X. Conditions of shale gas accumulation and exploration practices in China. Adv. Mater. Res. 2011, 31, 26–39. [Google Scholar]
  7. Shi, W.; Wang, X.; Shi, Y.; Feng, A.; Zou, Y.; Young, S. Application of Dipole Array Acoustic Logging in the Evaluation of Shale Gas Reservoirs. Energies 2019, 12, 3882. [Google Scholar] [CrossRef]
  8. Fu, J.; Li, S.; Guo, Q.; Guo, W.; Zhou, X.; Liu, J. The enrichment conditions and optimal selection of favorable areas for continental shale oil in the Ordos Basin. J. Pet. 2022, 43, 1702–1716. [Google Scholar]
  9. Zhu, J.; Forrest, J.; Xiong, H.; Kianinejad, A. Cluster spacing and well spacing optimizationusing multi-well simulation for the Lower Spraberry shale in Midland Basin. In Proceedings of the SPE Liquids-Rich Basins Conference, Midland, TX, USA, 13–14 September 2017. [Google Scholar]
  10. Lei, Q.; Guan, B.; Cai, B.; Wang, X.; Xu, Y.; Tong, Z.; Wang, H.; Fu, H.; Liu, Z.; Wang, Z. Theoretical research progress and development direction of volume transformation technology. Pet. Explor. Dev. 2018, 45, 874–887. [Google Scholar]
  11. Gao, Y. Study on Brittleness Evaluation and Main Control Factors of Tight Oil Reservoirs—Taking the Yanchang Formation of the Triassic in the Dongrengou Oil Area of Dingbian, Ordos Basin as an Example. Master’s Thesis, Northwestern University, Evanston, IL, USA, 2022. [Google Scholar]
  12. King, G. Thirty years of gas shale fracturing: What have we learned? In Proceedings of the Society of Petroleum Engineers (SPE) Annual Technical Conference and Exhibition, Florence, Italy, 19–22 September 2010. [Google Scholar]
  13. Zhou, J.; Huang, H.; Milind, D. A new physics-based modeling of multiple non-planar hydraulic fractures propagation. In Proceedings of the Unconventional Resources Technology Conference, San Antonio, TX, USA, 20–22 July 2015. [Google Scholar]
  14. Ersoy, A.; Waller, M.D. Textural characterization of rocks. Eng. Geol. 1995, 39, 123–136. [Google Scholar] [CrossRef]
  15. Aoudia, K.; Miskimins, J.L.; Harris, N.B.; Mnich, C.A. Statistical Analysis of the Effects of Mineralogy on Rock Mechanical Properties of the Woodford Shale and the Associated Impacts for Hydraulic Fracture Treatment Design. In Proceedings of the 44th U.S. Rock Mechanics Symposium and 5th U.S.-Canada Rock Mechanics Symposium, Salt Lake City, UT, 27–30 June 2010. [Google Scholar]
  16. Sierra, R.; Tran, M.H.; Abousleiman, Y.N.; Slatt, R.M. Woodford Shale Mechanical Properties and the Impacts of Lithofacies. In Proceedings of the 44th U.S. Rock Mechanics Symposium and 5th U.S.-Canada Rock Mechanics Symposium, Salt Lake City, UT, 27–30 June 2010. [Google Scholar]
  17. Jarvie, D.M.; Hill, R.J.; Ruble, T.E.; Pollastro, R.M. Unconventional shale-gas systems: The Mississippian Barnett Shale of north-central Texas as one model for thermogenic shale-gas assessment. AAPG Bull. 2007, 91, 475–499. [Google Scholar] [CrossRef]
  18. Rickman, R.; Mullen, M.; Petre, E.; Grieser, B.; Kundert, D. A practical use of shale petrophysics for stimulation design optimization: All shale Plays are not clones of the Barnett shale. In Proceedings of the SPE Annual Technical Conference and Exhibition, Denver, CO, USA, 21–24 September 2008. [Google Scholar]
  19. Heng, S.; Yang, C.H.; Li, Z.; Wang, L.; Hou, Z.K. Shale brittleness estimation based on energy dissipation. J. Cent. South Univ. (Nat. Sci. Ed.) 2016, 47, 577–585. [Google Scholar]
  20. Hucka, V.; Das, B. Brittleness determination of rocks by different methods. Int. J. Rock Mech. Min. Sci. Geomech. Abstr. 1974, 11, 389–392. [Google Scholar] [CrossRef]
  21. Aubertin, M.; Gill, D.E.; Simon, R. On the use of the brittleness index modified (BIM) to estimate the post-peak behavior of rocks. In Proceedings of the 1st North American Rock Mechanics Symposium, Austin, TX, USA, 1–3 June 1994. [Google Scholar]
  22. Bishop, A.W. Progressive failure with special reference to the mechanism causing it. Proc. Geotech. Conf. Oslo 1967, 2, 142–150. [Google Scholar]
  23. Hajiabdolmajid, V.; Kaiser, P. Brittleness of rock and stability assessment in hard rock tunneling. Tunn. Undergr. Space Technol. 2003, 18, 35–48. [Google Scholar] [CrossRef]
  24. Stavrogin, A.N.; Tarasov, B.G. Experimental Physics and Rock Mechanics; CRC Press: Boca Raton, FL, USA, 2001. [Google Scholar]
  25. Altindag, R. The evaluation of rock brittleness concept on rotary blast hold drills. J. S. Afr. Inst. Min. Metall. 2002, 102, 61–66. [Google Scholar]
  26. Honda, H.; Sanada, Y. Hardness of coal. Fuel 1956, 35, 451–461. [Google Scholar]
  27. Quinn, J.B.; Quinn, D.G. Indentation brittleness of ceramics: A fresh approach. J. Mater. Sci. 1997, 32, 4331–4346. [Google Scholar] [CrossRef]
  28. Lawn, B.; Marshall, D. Hardness, toughness, and brittleness: An indentation analysis. J. Am. Ceram. Soc. 1979, 62, 347–350. [Google Scholar] [CrossRef]
  29. GB/T 50266-2013; Standard for Test Methods of Engineering Rock Mass. China Planning Press: Beijing, China, 2013.
  30. SY/T 5163-1995; X-ray Diffraction Analysis Method for Relative Content of Clay Minerals in Sedimentary Rocks. China National Petroleum Corporation: Beijing, China, 1995.
  31. Ye, Y.; Tang, S.; Xi, Z. Brittleness Evaluation in Shale Gas Reservoirs and Its Influence on Fracability. Energies 2020, 13, 388. [Google Scholar] [CrossRef]
  32. Zheng, D.; Miska, S.; Ozbayoglu, E.; Zhang, J. Combined Experimental and Well Log Study of Anisotropic Strength of Shale. In Proceedings of the SPE Annual Technical Conference and Exhibition, San Antonio, TX, USA, 16–18 October 2023. [Google Scholar]
  33. Zheng, D.; Miska, S.; Ziaja, M.; Zhang, J. Study of anisotropic strength properties of shale. AGH Drill. Oil Gas 2019, 36, 93–112. [Google Scholar] [CrossRef]
  34. Zheng, D.; Ozbayoglu, E.; Miska, S.; Zhang, J. Experimental study of anisotropic strength properties of shale. In Proceedings of the 57th U.S. Rock Mechanics/Geomechanics Symposium, Atlanta, GA, USA, 25–28 June 2023. [Google Scholar]
  35. Rafieepour, S.; Zheng, D.; Miska, S.; Ozbayoglu, E.; Takach, N.; Yu, M.; Zhang, J. Combined Experimental and Well Log Evaluation of Anisotropic Mechanical Properties of Shales: An Application to Wellbore Stability in Bakken Formation. In Proceedings of the SPE Annual Technical Conference and Exhibition, Virtual, 24 October 2020. [Google Scholar]
  36. Peng, C.; Xiao, Y.; Fu, J.; Cao, Q.; Zhang, J.; Su, Y.; Zheng, D. Numerical validation of a novel cuttings bed impeller for extended reach horizontal wells. Pet. Res. 2024. [Google Scholar] [CrossRef]
  37. Wang, S. Research on the Main Controlling Factors of Brittleness in Tight Reservoirs and the Grading Evaluation of Compressibility. Ph.D. Thesis, Northeast Petroleum University, Daqing, China, 2021. [Google Scholar]
  38. Rahimzadeh, K.I.; Ameri, M.; Molladavoodi, H. Shale brittleness evaluation based on energy balance analysis of stress-strain curves. J. Pet. Sci. Eng. 2018, 167, 1–19. [Google Scholar] [CrossRef]
Figure 1. Volume Content of Mineral Components in 36 Core Samples of Block Y.
Energies 17 04201 g001
Figure 2. Triangle diagram of mineral composition volume content and rock classification for 36 core samples in Block Y.
Energies 17 04201 g002
Figure 3. Relationship between elastic modulus and Poisson’s ratio of reservoir in Block Y.
Energies 17 04201 g003
Figure 4. Relationship between elastic modulus and mineral composition of shale samples.
Energies 17 04201 g004
Figure 5. Relationship between Poisson’s ratio and mineral composition of shale samples.
Energies 17 04201 g005
Figure 6. Line chart of brittleness index 1 (MBI) calculated by whole rock analysis and brittleness index 2 (EBI) calculated by rock mechanics parameter method.
Energies 17 04201 g006
Figure 7. Characteristics of stress-strain curve under the mode of rock absorbing energy to the outside world.
Energies 17 04201 g007
Figure 8. Comparison between the brittle index 3 (DBI) calculated based on the drop modulus and the first two methods.
Energies 17 04201 g008
Figure 9. Comparison of brittleness index 4 (PBI) calculated based on peak strength and residual strength with the first three methods.
Energies 17 04201 g009
Figure 10. Relationship between Quartz Mineral Component Content and Brittleness Index 3 (DBI).
Energies 17 04201 g010
Figure 11. Relationship between mineral composition content of plagioclase and brittleness index 3 (DBI).
Energies 17 04201 g011
Figure 12. Relationship between the content of potassium feldspar mineral components and the brittleness index 3 (DBI).
Energies 17 04201 g012
Figure 13. Relationship between the content of calcite mineral components and the brittleness index 3 (DBI).
Energies 17 04201 g013
Figure 14. Relationship between mineral composition content and brittleness index 3 (DBI) of dolomite.
Energies 17 04201 g014
Figure 15. Relationship between clay mineral component content and brittleness index 3 (DBI).
Energies 17 04201 g015
Figure 16. Relationship between elastic modulus and brittleness index 3 (DBI).
Energies 17 04201 g016
Figure 17. Relationship between Poisson’s ratio and brittleness index 3 (DBI).
Energies 17 04201 g017
Table 1. Brittle evaluation methods of domestic and foreign scholars.
TypeDefinition of Brittleness IndexDescribeProposer
Mineral composition analysisB1 = Wqtz/Wtotal × 100%The ratio of quartz to total mineral content.Jarvie [17]
Mineral composition analysisB2 = (Wqtz + Wcarb)/WtotalThe ratio of brittle mineral content to total mineral content.Rickman et al. [18]
Rock mechanics parametersB3 = E + νNormalized elastic modulus and Poisson’s ratio.Rickman et al. [18]
Energy dissipation, stress-strain curveB4 = dWr/dWeThe ratio of the rupture energy consumed per unit volume to the elastic energy released internally.Heng et al. [19]
stress-strain curveB5 = Wr/WThe ratio of recoverable strain energy to total energy.Hucka and Das [20]
stress-strain curveB6 = εrThe ratio of recoverable strain εr to total strain ε.Hucka and Das [20]
stress-strain curveB7 = A2/A1A1 is the area under the diagonal line of the peak strength point with the slope of the deformation modulus, A2 is the area under the loading curve.Aubertin et al. [21]
stress-strain curveB8 = (τp − τr)/τpτp is Peak intensity, τr is Residual strength.Bishop [22]
stress-strain curveB9 = (εp − εr)/εpPeak strain εp and residual strain εr function.Hajiabdolmajid and Kaiser [23]
Energy dissipation, stress-strain curveB10 = dWr/dWe = (E − M)/MThe ratio of fracture damage energy after the peak of rock fracture to pre-peak elastic strain energy.Stavrogin and Tarasov [24]
Tensile strength and compressive strengthB11 = σcσt/2Uniaxial compressive strength σc and tensile strength σt The average value of the product.Altindag [25]
Tensile strength and compressive strengthB12 = σctThe ratio of Uniaxial compressive strength σc and tensile strength σt.Hucka and Das [20]
Hardness testingB13 = (Hm − H)/KH is the macroscopic hardness, and Hm is the microscopic hardness.Honda and Sanada [26]
Hardness and fracture testsB14 = H × E/KIC2H is the hardness coefficient, E is the Young’s modulus, and KIC is the fracture toughness.J.B.Quinn and G.D.Quinn [27]
Hardness and fracture testsB15 = H/KICH is the hardness coefficient, KIC is the fracture toughness.Lawn and Marshall [28]
Mohr stress circleB16 = sinφSine value of internal friction angle.Hucka and Das [20]
Mohr stress circleB17 = 45°+ φ/2The function of internal friction angle.Hucka and Das [20]
Table 2. Test results of shale mineral composition and triaxial mechanical parameters.
Sample NumberVolume Fraction of Mineral Components/w%Test Results of Triaxial Mechanical Parameters
QuartzPlagio-ClasePotassium FeldsparCalciteDolomitePyriteClay MineralsConfining Pressure/MPaElastic Modulus/GPaPoisson’s RatioDifferential Stress/MPaPeak Strain
S-120.948.69.92.30.8-17.53029.240.214194.40.78
S-219.349.311.81.81.1-16.73024.940.197195.51.01
S-317.851.211.31.90.9-16.93023.800.168173.90.82
S-418.950.110.52.60.9-17.03021.830.125121.20.57
S-525.850.39.74.6-0.29.43028.620.176170.50.75
S-626.646.910.05.2-0.311.03019.860.203159.91.08
S-726.148.210.85.1--9.53021.150.183161.00.97
S-828.544.95.20.65.4-15.43018.480.193154.31.04
S-926.246.24.90.55.1-17.13034.180.133190.80.64
S-1027.643.55.80.64.9-17.63031.720.191160.80.59
S-1120.341.85.22.914.1-15.73029.790.170181.90.63
S-1221.143.25.93.014.9-11.93018.610.223142.11.11
S-1319.842.76.82.813.8-14.13016.440.198137.81.14
S-1422.434.910.18.18.6-15.93030.320.189260.11.07
S-1523.635.69.47.39.2-14.93031.770.145204.00.73
S-1621.933.79.88.37.6-18.73034.560.208209.60.72
S-1715.952.57.45.8--18.43021.190.220162.91.08
S-1815.253.17.66.3--17.83023.500.172180.70.92
S-1916.350.96.97.2--18.73022.270.195182.90.98
S-2021.442.56.33.114.5-12.23020.340.106100.80.58
S-2122.341.85.73.613.8-12.83024.860.185171.80.85
S-2218.853.515.1--0.911.73017.190.137141.61.14
S-2322.337.810.7-1.8-27.43018.440.193141.71.03
S-2423.436.511.1-1.5-27.53021.870.175151.50.97
S-2519.843.613.4-1.4-21.83023.690.220152.60.90
S-2620.645.212.6-1.6-20.03022.720.145141.00.75
S-2719.238.719.11.6--21.43022.090.199176.11.21
S-2820.337.918.61.7--21.53023.500.181167.71.10
S-2930.919.67.61.910.9-29.13018.310.182142.81.15
S-3031.720.37.11.59.2-30.23019.260.170139.61.16
S-3131.821.79.62.813.1-21.03028.440.176157.40.65
S-3230.522.19.22.312.7-23.23023.350.159150.10.71
S-3318.252.211.40.61.60.315.73030.020.288158.50.81
S-3423.240.611.84.10.4-19.93014.720.152109.30.95
S-3522.942.812.44.50.5-16.93021.110.183177.21.11
S-3621.639.513.53.80.5-21.13023.660.185192.91.17
average22.69.841.8 18.0 23.770.182164.360.91
Table 3. Statistical Table of Clay Mineral Content in Block Y of M Oilfield.
Sample NumberClay Mineral Content/w%Illite/Montmorillonite Mixed Layer Ratio (%)
IlliteKaoliniteChloriteIllite/Montmorillonite Mixed LayerMontmorillonite Layer S%Illite Layer I%
S-1401020302080
S-2421218282080
S-344917302080
S-447615322080
S-541420352080
S-6351638112080
S-737144272080
S-839153792080
S-945718302080
S-1047420292080
S-1142621312080
S-1238827272080
S-13401023272080
S-1445924222080
S-1548525222080
S-1645428232080
S-1742730212080
S-1825165362080
S-1930154872080
S-2022135962080
S-2128185132080
S-2233947112080
S-23311045142080
S-2442921282080
S-2530841212080
S-26321035232080
S-27401030202080
S-2838933202080
S-29431525172080
S-30471328122080
S-3145522282080
S-3244623272080
S-33391019322080
S-34331335192080
S-35201060102080
S-36261450102080
average38103220
Table 4. Calculation of brittleness index based on shale reservoir rock mechanical parameters and whole rock analysis.
Sample NumberVolume Fraction of Mineral Components/w%Test Results of Triaxial Mechanical ParametersBrittleness Index 1
(MBI)
Brittleness Index 2
(EBI)
QuartzPlagio-ClasePotassium FeldsparCalciteDolomitePyriteClay MineralsElastic Modulus/GPaPoisson’s Ratio
S-120.948.69.92.30.8-17.529.240.2140.42900.5693
S-219.349.311.81.81.1-16.724.940.1970.41340.5076
S-317.851.211.31.90.9-16.923.800.1680.51390.5585
S-418.950.110.52.60.9-17.021.830.1250.65730.6270
S-525.850.39.74.6-0.29.428.620.1760.77080.6580
S-626.646.910.05.2-0.311.019.860.2030.28350.3631
S-726.148.210.85.1--9.521.150.1830.39530.4505
S-828.544.95.20.65.4-15.418.480.1930.29780.3558
S-926.246.24.90.55.1-17.134.180.1330.87690.9162
S-1027.643.55.80.64.9-17.631.720.1910.57840.6950
S-1120.341.85.22.914.1-15.729.790.1700.62830.7040
S-1221.143.25.93.014.9-11.918.610.2230.17220.2766
S-1319.842.76.82.813.8-14.116.440.1980.23450.2906
S-1422.434.910.18.18.6-15.930.320.1890.55820.6652
S-1523.635.69.47.39.2-14.931.770.1450.77590.8226
S-1621.933.79.88.37.6-18.734.560.2080.56410.7198
S-1715.952.57.45.8--18.421.190.2200.23810.3499
S-1815.253.17.66.3--17.823.500.1720.65730.5400
S-1916.350.96.97.2--18.722.270.1950.36710.4458
S-2021.442.56.33.114.5-12.220.340.1060.70780.6417
S-2122.341.85.73.613.8-12.824.860.1850.46300.5385
S-2218.853.515.1--0.911.717.190.1370.59830.4771
S-2322.337.810.7-1.8-27.418.440.1930.47810.3548
S-2423.436.511.1-1.5-27.521.870.1750.60980.4907
S-2519.843.613.4-1.4-21.823.690.2200.53280.4129
S-2620.645.212.6-1.6-20.022.720.1450.71090.5945
S-2719.238.719.11.6--21.422.090.1990.55060.4303
S-2820.337.918.61.7--21.523.500.1810.63330.5152
S-2930.919.67.61.910.9-29.118.310.1820.50460.3817
S-3031.720.37.11.59.2-30.219.260.1700.55980.4386
S-3131.821.79.62.813.1-21.028.440.1760.76650.6535
S-3230.522.19.22.312.7-23.223.350.1590.68860.5719
S-3318.252.211.40.61.60.315.730.020.2880.50380.3856
S-3423.240.611.84.10.4-19.914.720.1520.49790.3737
S-3522.942.812.44.50.5-16.921.110.1830.56990.4495
S-3621.639.513.53.80.5-21.123.660.1850.62640.5083
average22.69.841.8 18.023.770.1820.53930.5204
Table 5. Test results of triaxial mechanical parameters and brittleness index DBI of shale.
Sample NumberTest Results of Triaxial Mechanical Parameters
Confining Pressure/MPaElastic Modulus/GPaPoisson’s RatioDifferential Stress/MPaPeak StrainResidual Stress (MPa)Residual Elastic Modulus (MPa)Drop Modulus/GPaBrittleness Index 3
(DBI)
Brittleness Index 4
(PBI)
S-13029.240.214194.40.7889.8604.9−24.080.45160.5381
S-23024.940.197195.51.01//−32170.99230.9960
S-33023.800.168173.90.82103.6945.8−9.140.27750.4043
S-43021.830.125121.20.5778.8603.7−11.670.34840.3498
S-53028.620.176170.50.7591.81577.6−40.050.58320.4616
S-63019.860.203159.91.0874.8940.9−20.680.51010.5322
S-73021.150.183161.00.9787.4700.1−7.490.26150.4571
S-83018.480.193154.31.0468.7733.0−32.820.63980.5548
S-93034.180.133190.80.64103.11993.5−52.390.60520.4596
S-103031.720.191160.80.59102.21437.0−18.300.36590.3644
S-113029.790.170181.90.63114.1988.9−13.980.31940.3727
S-123018.610.223142.11.1161.1213.2−17.650.48680.5700
S-133016.440.198137.81.1468.5637.3−18.590.53070.5029
S-143030.320.189260.11.0793.6986.5−106.550.77850.6401
S-153031.770.145204.00.73128.7787.5−73.310.69770.3691
S-163034.560.208209.60.7293.31641.3−187.160.84410.5549
S-173021.190.220162.91.0878.3707.9−47.930.69340.5193
S-183023.500.172180.70.92106.61125.2−14.810.38660.4101
S-193022.270.195182.90.9893.7728.3−29.840.57260.4877
S-203020.340.106100.80.589.3781.7−38.200.65250.9077
S-213024.860.185171.80.85110.2575.1−14.980.37600.3586
S-223017.190.137141.61.1480.5522.5−24.290.58560.4315
S-233018.440.193141.71.0374.6453.2−11.800.39020.4735
S-243021.870.175151.50.97//−78.150.78130.9719
S-253023.690.220152.60.9069.8730.5−35.080.59690.5426
S-263022.720.145141.00.7584.8362.9−18.430.44790.3986
S-273022.090.199176.11.2183.21315.9−16.870.43300.5275
S-283023.500.181167.71.1074.3532.8−31.130.56980.5569
S-293018.310.182142.81.1573.7649.0−16.250.47020.4839
S-303019.260.170139.61.1667.0452.6−15.280.44240.5201
S-313028.440.176157.40.65105.11433.8−16.870.37230.3323
S-323023.350.159150.10.7184.7731.7−19.070.44960.4357
S-333030.020.288158.50.8187.2686.6−15.960.34710.4498
S-343014.720.152109.30.9540.42202.2−20.230.57880.6304
S-353021.110.183177.21.11102.6290.0−30.830.59360.4210
S-363023.660.185192.91.172.4529.6−47.520.66760.9876
average 23.770.182164.360.91 0.53060.5271
Disclaimer/Publisher’s Note: The statements, opinions and data contained in all publications are solely those of the individual author(s) and contributor(s) and not of MDPI and/or the editor(s). MDPI and/or the editor(s) disclaim responsibility for any injury to people or property resulting from any ideas, methods, instructions or products referred to in the content.

