Article

Driving Forces of Natural Gas Flow and Gas–Water Distribution Patterns in Tight Gas Reservoirs: A Case Study of NX Gas Field in the Offshore Xihu Depression, East China

1
Research Institute of Petroleum Exploration and Development CNOOC China Ltd., Shanghai Branch, Shanghai 200335, China
2
School of Earth Sciences and Engineering, Xi’an Shiyou University, Xi’an 710065, China
3
Shaanxi Key Lab of Petroleum Accumulation Geology, Xi’an Shiyou University, Xi’an 710065, China
*
Author to whom correspondence should be addressed.
Energies 2023, 16(16), 6028; https://doi.org/10.3390/en16166028
Submission received: 26 July 2023 / Revised: 10 August 2023 / Accepted: 15 August 2023 / Published: 17 August 2023

Abstract

:
The driving forces behind gas flow and migration, as well as the associated gas–water distribution patterns in tight gas reservoirs, are not only closely related to the formation mechanisms of “sweet spots”, but also serve as crucial geological foundations for the development of efficient modes and optimal well placement. In this work, three methods, namely, critical gas column height driven by buoyancy, critical pore throat radius driven by buoyancy, and gas–water distribution attitude, were used to quantitatively evaluate the critical conditions for buoyancy and overpressure to get gas flowing in the tight sandstone gas field. In light of the geological background, the driving forces of gas flow/migration and gas–water distribution patterns were comprehensively analyzed. On this basis of the origins of overpressure driving gas flow/migration were identified by using multiple empirical methods, the evolution of overpressure and characteristics of gas–water distribution driven by overpressure were studied by using PetroMod_2014 simulation software. The results show that the four main gas-bearing layers in the NX tight sandstone gas reservoir differ widely in gas flow/migration dynamics and gas–water distribution patterns. Gas accumulation in the H3b layer is influenced by both buoyancy and overpressure. Subsequently, buoyancy leads to the differentiation of gas from water based on density and the formation of edge water. Furthermore, the distribution area of the gas reservoir is determined by the presence of an anticline trap. In contrast, in H3a, H4b and H5a gas layers, buoyancy is not sufficient to overcome the capillary force to make the gas migrate during and after accumulation, and the driving force of gas flow is the overpressure formed by fluid volume expansion during hydrocarbon generation of Pinghu Formation source rocks. Because buoyancy is not the driving force of natural gas flow, H3a, H4b and H5a layers have gas and water in the same layer and produced together, and no boundary and bottom water, where the anticlinal trap does not control the distribution of gas and water, and gas source faults control the boundary of the gas reservoir. These understandings not only significantly expand the gas-bearing target of H3a, H4b and H5a gas layers delineated in the buoyancy driving pattern but also provide an important geological basis for the formulation of an efficient development plan by class and grade for the NX tight sandstone gas field.

1. Introduction

The efficient and large-scale development of natural gas, the cleanest fossil energy, is one of the important ways to achieve carbon peak and carbon neutrality. As a kind of crucial unconventional natural gas resource, the production of tight sandstone gas makes up now and will make up in the future a large proportion of the natural gas supply in China and the world [1]. For example, of the unconventional natural gas production in 2022, tight sandstone gas ranked first in China and second only to shale gas in North America. Current exploration and development experience shows that the “sweet spot” of a gas reservoir and its development mode are two key factors affecting the production of tight sandstone gas reservoirs [2,3,4,5]. Gas flow/migration dynamics and the gas–water distribution pattern in tight sandstone gas reservoirs not only control the formation and distribution of high-yield “sweet spots” but also are the important geological basis for selecting efficient development modes and deploying drilling campaigns [4,5,6,7,8].
A lot of research, exploration and development practices so far show that there are mainly three types of gas flow/migration driving forces in tight sandstone gas reservoirs, which result in the three corresponding gas–water accumulation and distribution patterns. (1) The continuous distribution model in deep basin/basin center: The concept of deep basin gas was first proposed by Masters (1979) [9], while basin-center gas was proposed by Rose et al. (1984) and Law (2002) [10,11]. The concept of “continuous accumulation” was first advanced by the US Geological Survey in the mid-1990s [12,13]. This concept holds that the main driving force of natural gas flow/migration is overpressure, and the natural gas driven by overpressure would be continuously distributed in the downdip direction of the formation, while the formation water would be distributed in the updip direction, forming a gas–water inverted distribution pattern of water above gas. (2) Formation model of conventional natural gas: Some researchers have recently suggested that gas reservoirs previously classified as deep basin gas or basin-center gas do not correspond to the actual geological conditions; instead, they should be categorized as conventional gas reservoirs, for example, the Great Green River Basin, the San Juan Basin in the Rocky Mountain region, and the Western Canada Basin [6]. This concept argues that buoyancy is one major driving force for gas flow/migration, and reservoirs formed under this driving force, with obvious edge and bottom water, are discontinuous in distribution and have boundaries strictly or relatively strictly controlled by conventional structural, stratigraphic-lithologic traps or composite traps. (3) Quasi-continuous model: After examining the formation and distribution of tight sandstone gas reservoirs across the world, Zhao et al. (2012,2013,2017,2019) found that many tight sandstone gas reservoirs represented neither a deep basin gas model nor a conventional gas reservoir model but “quasi-continuous gas accumulation” [7,14,15,16]. Quasi-continuous gas accumulation refers to a collection of gas reservoirs that are small- to medium-sized and positioned in close proximity to one another. These gas reservoirs exhibit a quasi-continuous distribution, where the flow of gas is driven by overpressure and molecular diffusion. The distribution of gas and water within these reservoirs is complex, lacking any noticeable edge or bottom water. Additionally, there is no evident gas–water inversion or clearly identifiable gas reservoir boundary. Among the above three types, in the environment with strong structural deformation, especially in the high-steep structural environment, such as typical areas of anticline trap, it is generally considered that the tight sandstone gas reservoir has many similarities and is analogous in development mode with the conventional gas reservoir except for tightness. However, the development practice of tight gas in recent years shows that some gas fields are not like this in actual geological conditions, for example, the Pinedale gas field in North America, which has an obvious anticline shape but a distribution of gas and water not mainly controlled by anticline [2,5].
Oil and gas exploration in the past 40 years has proved that the Xihu depression in the East China Sea Basin, as the largest Cenozoic sedimentary depression in China’s offshore areas, is rich in oil and gas resources and has huge exploration potential [17,18,19,20]. The NX tight sandstone gas field, discovered in 2014, is one of two gas fields with one hundred billion cubic meters of reserves in the central inversion structural belt of the Xihu depression. In terms of structural characteristics and trap type, the NX tight sandstone gas field is situated in a typical anticline with a closure height of more than 200 m [18,21,22]. Due to the high cost of offshore exploration and development, and limitations in drilling technology, etc., the unconventional oil and gas geological research for this gas field has been weak. The understanding of natural gas flow/migration dynamics and gas–water distribution patterns of the NX tight sandstone gas field in the exploration and earlier stages mainly referred to the geological understanding of the onshore tight sandstone gas reservoir in the zone with strong structural deformation. It was believed that the four main gas-bearing strata were controlled by conventional traps, buoyancy force made the natural gas separate from water to form a clear gas–water contact, the formation water exists in the form of edge water, and the scope of the gas reservoir was controlled by the distribution of spill point of the anticline trap. And, it was defined as a low permeability anticline gas reservoir on the whole [18,21,22]. It is worth noting that the geological significance of the low permeability reservoir here is quite different from that of the low permeability reservoir commonly known in the world. Internationally, the low-permeability oil and gas reservoir is equivalent to the tight oil and gas reservoir and belongs to an unconventional reservoir [6,11,23]. But, the low-permeability reservoir here refers to the conventional oil and gas reservoir with poor quality, and it is still a conventional reservoir in nature [15,22]. Therefore, according to this view, its development mode should still have little difference from that of a conventional oil and gas reservoir.
In order to efficiently develop the NX tight gas field, it is urgent that detailed research on the natural gas driving force and the distribution pattern of gas and water is conducted. Therefore, based on experimental data of mercury injections, relative permeability, and physical properties, etc., the quantitative evaluation results of buoyancy and overpressure driving the critical gas column height method, critical pore throat radius method, gas–water distribution attitude method, combined with the comprehensive analysis of drilling data and regional geological background, the driving forces of natural gas flow/migration and gas–water distribution patterns in the NX tight sandstone gas field have been figured out. The causes of overpressure have been identified by multiple empirical methods, and the evolution of overpressure and gas–water distribution characteristics under the effect of overpressure has been sorted out. The findings of this study can provide a geological foundation for the effective development and categorization of the NX tight sandstone gas field. Additionally, it can serve as a valuable reference for the efficient development of similar tight sandstone gas fields.

2. Geological Setting

The Xihu depression, located in the northeast region of the East China Sea shelf basin, in NNE strike, is about 400 km from north to south, about 100 km wide from east to west, and about 5.18 × 10⁴ km2 in area (Figure 1a). The formation and evolution of the Xihu depression were controlled by the subduction of the Pacific plate and the Philippine plate to the east of the Asian plate and can be divided into four stages: rift, depression, inversion, and regional subsidence [18,21,24,25,26,27]. During the rift stage from Paleocene to Eocene, under the effect of tensile stress, an array of NE-NNE normal fault systems developed, forming a series of graben or half-graben fault depressions; meanwhile, a series of fault-nose and fault-block structures, Eocene and strata below of huge thicknesses, deposited on the downthrown sides of the main faults (Figure 1c). The stress field in the Xihu depression changed from tensile to compressive after the Yuquan movement at the end of the Eocene. This change was particularly evident during the Longjing movement at the end of the Miocene, wherein the thrust reached its peak. Consequently, the stress experienced within the Xihu depression became noticeably intense and compressive. At the same time, as the northern Okinawa Trough opened earlier than the southern Okinawa Trough, the compressive stress on the Xihu depression was stronger in the north and weaker in the south [18,26,27]. As a result, the Xihu depression were relatively uplifted on the basis of the depression in the western, central and eastern parts and witnessed strong structural inversion, eventually forming the east–west zoning frame of the weak inversion structural belt in the western slope, the structural inversion belt in the center and the inversion fault-fold structural belt at the eastern margin [18,21,26,27]. Since the Pliocene, with the eastward migration of the early spreading part of the Okinawa Trough, the basin has entered the stage of regional subsidence, and thick Santan Formation and Donghai Group have deposited, gradually forming the present structural form [25,26,27]. The Xihu depression experienced fast sedimentary subsidence in the Cenozoic, where the sedimentary strata are up to 15,000 m thick, including from bottom to top Paleocene, Eocene Baoshi and Pinghu Formations, Oligocene Huagang Formation, Miocene Longjing, Yuquan and Liulang Formations, Pliocene Santan Formation and Quaternary Donghai Group (Figure 1b). Pinghu coal and coal measure mudstone are the main source rocks, and Eocene Pinghu sandstone and Oligocene Huagang sandstone act as reservoirs there [18].
The NX tight sandstone gas field, located in the central inversion structural belt of the Xihu depression, is an anticline (Figure 1a,c), with the closure height of each layer ranging from 232 to 285 m. Well X1 in the NX tight sandstone gas field was spudded on 9 March 2013 and completed on 13 May 2013. In this well, 513.5 m thick gas-bearing layers were identified from log comprehensive interpretation in Huagang Formation, and the daily output of natural gas was 54.48 × 10⁴ m3 through DST test (drill-stem test). After the success of Well X1, Well X2, Well X3 and Well X4 were drilled successively, and all of them tested industrial gas flow, announcing the discovery of the NX tight sandstone gas field. The natural gas of the NX gas field is distributed in the Huagang Formation, and the major gas-bearing strata are H3a, H3b, H4b and H5a, four layers in total. The H3a reservoir has a porosity of 6–11.8%, on average 8.1%, and a permeability of 0.1–0.6 mD, on average 0.37 mD; the H3b reservoir has a porosity of 6–20.6%, on average 11.09%, and a permeability of 0.2–261 mD, on average 17.77 mD; the H4b has a porosity of 6–8.9%, on average 7.21%, and a permeability of 0.2–0.571 mD, on average 0.272 mD; the H5a reservoir has a porosity of 6–9.5%, 7.4% on average, and a permeability of 0.201–0.857 mD and 0.367 mD on average. The gas-source rock correlation study shows that the natural gas in the NX gas field mainly comes from the deep Pinghu Formation source rocks, and the vertical transporting paths are faults [18].

3. Methods, Simulation Parameters, including 3D Modeling Boundary Conditions

3.1. Identification of Critical Conditions for Buoyancy-Overpressure Driving

Overpressure and buoyancy are the main driving forces of gas flow in reservoirs. When the reservoir is very poor in physical property, buoyancy cannot be the main driving force, while overpressure would drive gas to move, often resulting in the absence of a uniform gas–water interface and complex gas–water distribution [7,15,28]. Three identification methods were utilized in this study to determine the critical conditions for natural gas flow, which are driven by buoyancy and overpressure. The experimental data used in this section are provided by the Research Institute of Petroleum Exploration and Development CNOOC China Ltd., Shanghai Branch (Shanghai, China), such as the mercury injection, relative permeability experiment, pore-throat radius measurement, etc.

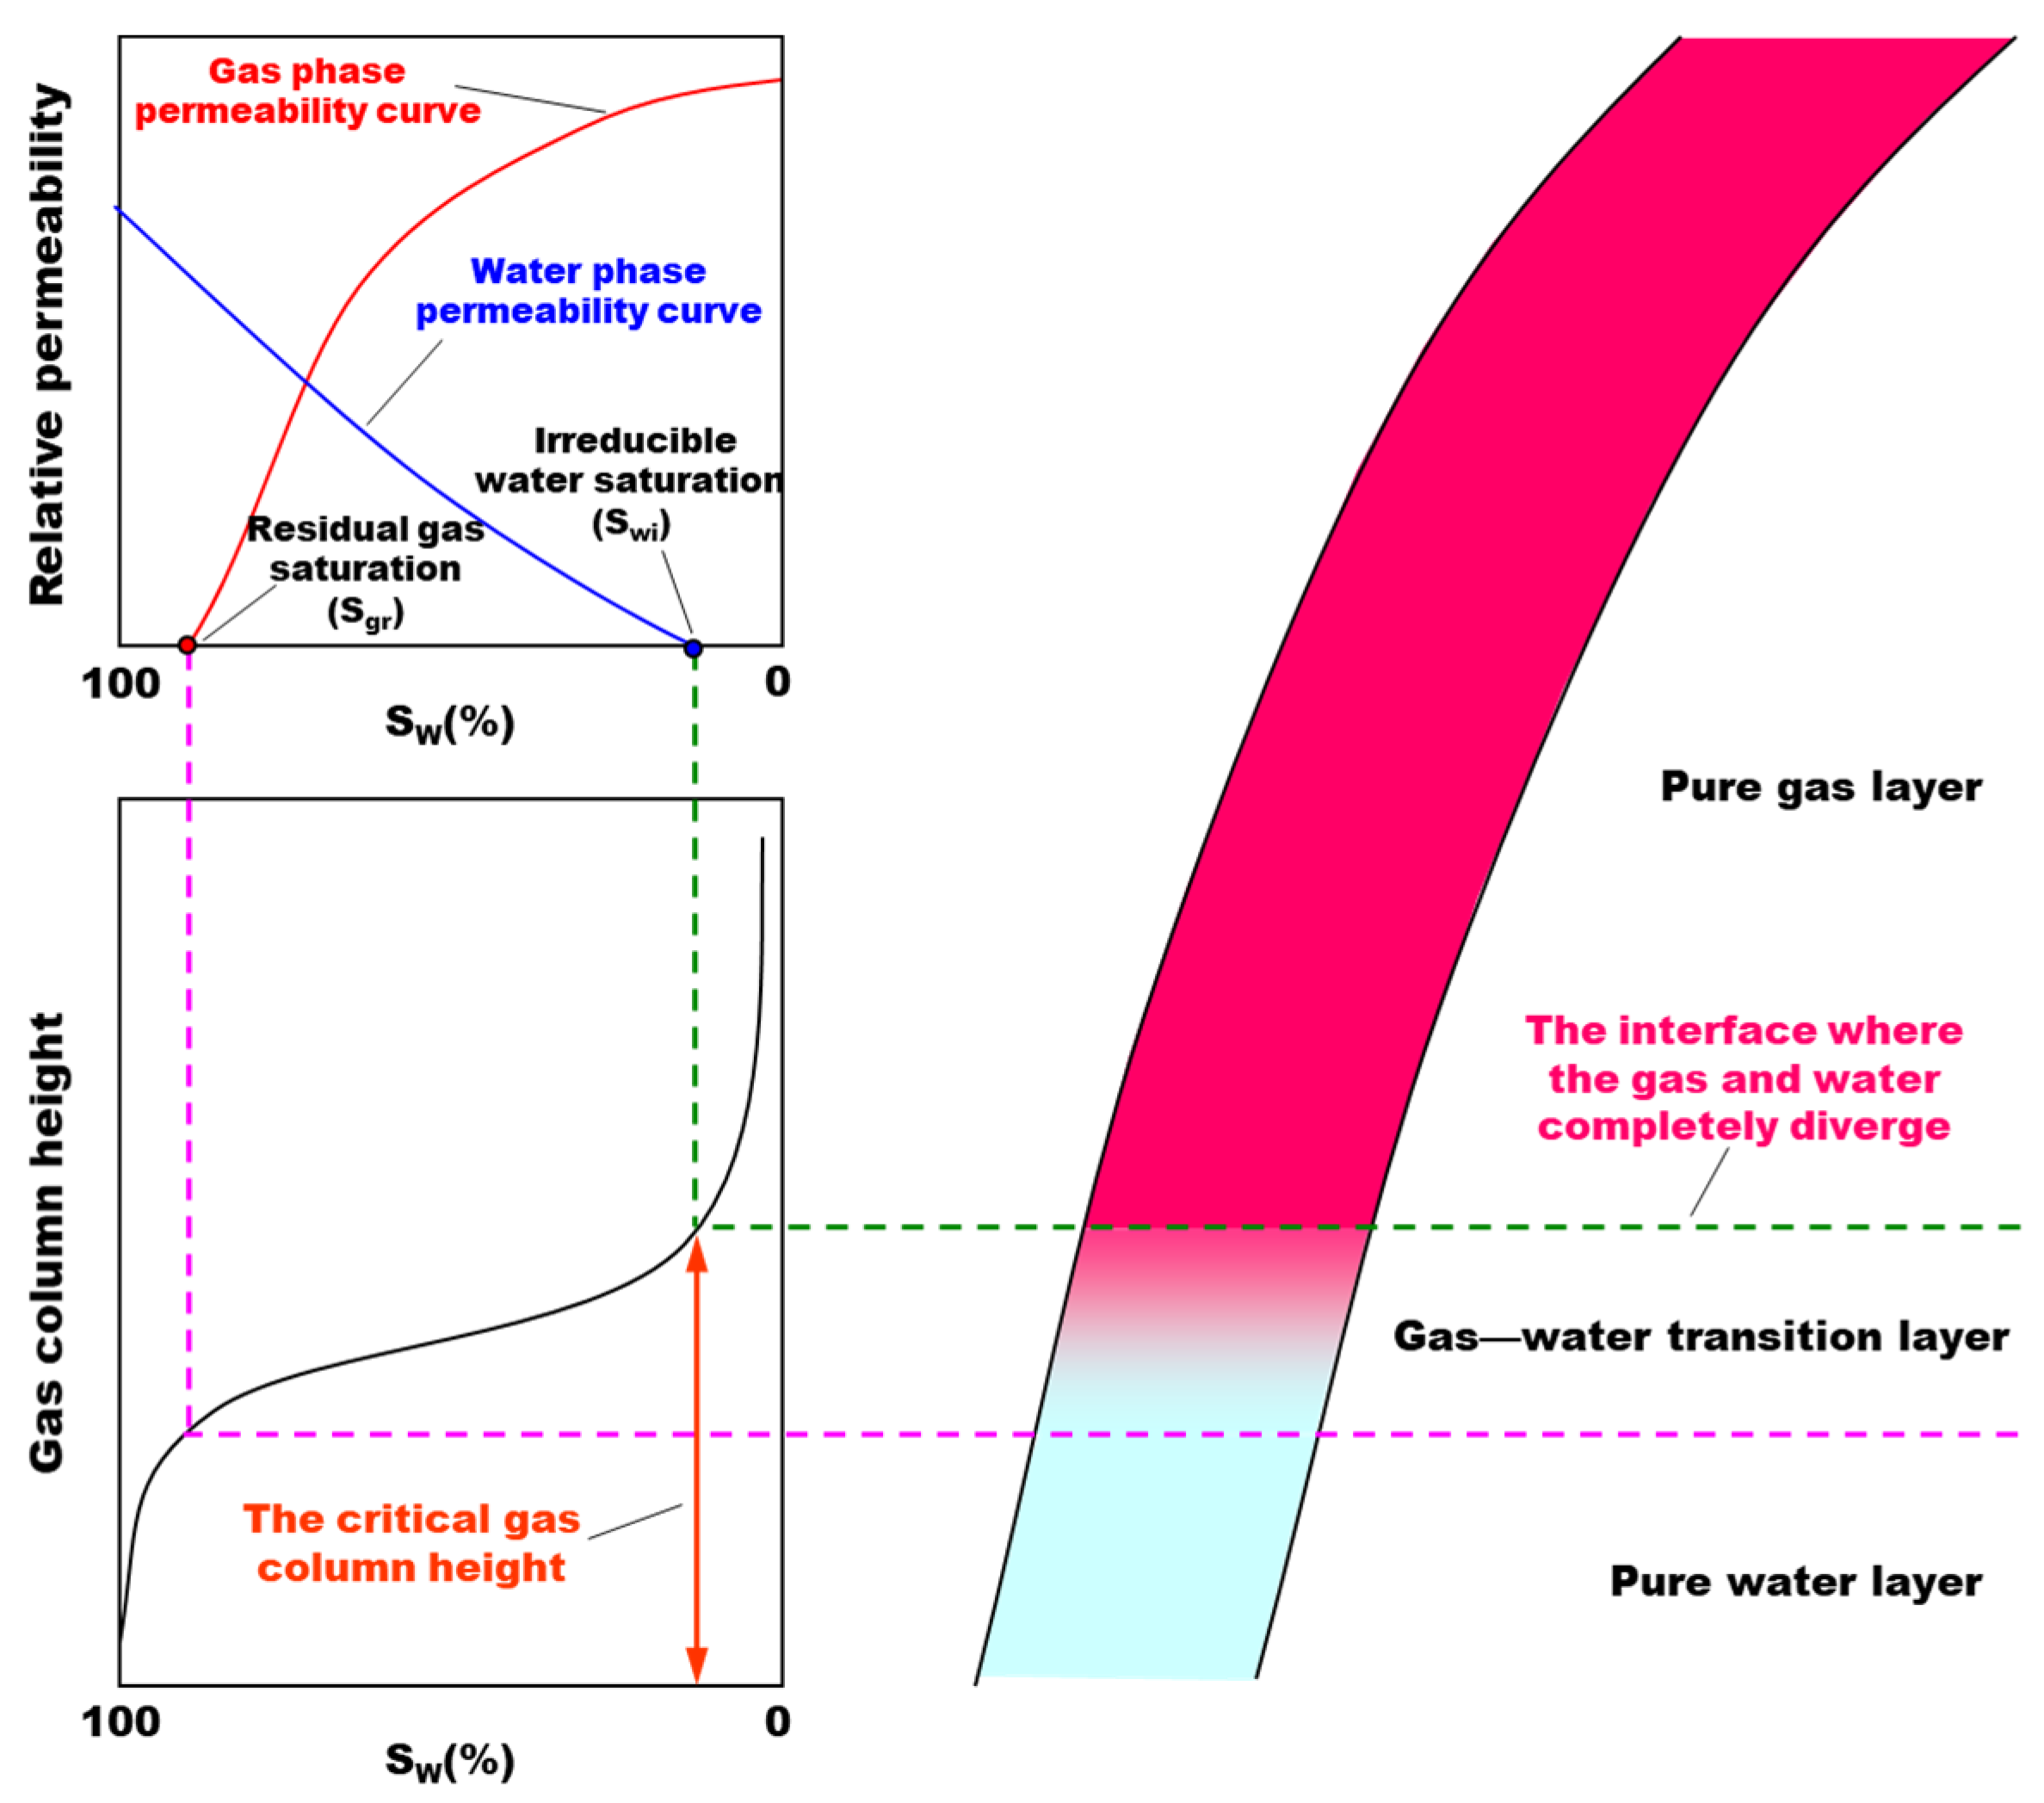
3.1.1. Critical Gas Column Height Analysis Based on Experiment Data

In the process of natural gas charging, the working principle of buoyancy is mainly displacing formation water upward by a gas column of a certain height, and the magnitude of buoyancy is positively correlated with the height of the gas column. In a trap, the closure height of the trap is the maximum height that the gas column can reach. Therefore, when the charging resistance is greater than the buoyancy produced by the gas column at the closure height of the trap, the buoyancy displacement is weak or absent, and the driving force is mainly overpressure.
According to this principle, the charging resistance (capillary force) can be determined first by using the mercury injection-relative permeability experiment. Previous researchers have applied the capillary force principle to determine the oil/gas saturation of reservoirs [29,30]. However, only a few researchers have attempted to apply this method to ascertain the height of the oil/gas column in reservoirs [31,32]. Nevertheless, a systematic summary and analysis of this method have not been conducted.
For tight sandstone reservoirs, the main resistance during the charging process is the capillary force, which is expressed as follows under laboratory conditions [33]:
P C L = 2 σ L cos θ L r
where   P C L is capillary pressure under laboratory conditions, MPa;   σ L is mercury–gas interfacial tension, mN/m;   θ L is mercury–gas wetting angle, 140°;   r   is wetting radius, μm.
It is not mercury (non-wetting phase) driving gas but gas (non-wetting phase) driving water in the reservoir. Under formation conditions, the capillary pressure to be overcome during the displacement of formation water by natural gas can be expressed as:
P C R = 2 σ R cos θ R r
where   P C R   is capillary pressure under formation conditions, MPa;   σ R   is gas–water interfacial tension, mN/m;   θ R is gas–water wetting angle, °, cos θ R = 1 ;   r   is wetting radius, μm.
Combining Equations (1) and (2), the capillary force under laboratory conditions is converted into the capillary force under formation conditions:
P C R = P C L σ R cos θ R σ L cos θ L
The meaning of each parameter in this Equation is consistent with that in Equations (1) and (2).
After determining the resistance, we need to work out the driving force needed to overcome the corresponding resistance. Here, it is assumed that all of the driving force comes from buoyancy. Then, the buoyancy generated by a gas column of a certain height can be expressed as:
P g r = H ρ w ρ g g 1000
where   P g r   is the buoyancy, MPa;   H   is the gas column height, m;   ρ w is the formation water density, G/cm3;   ρ g is the natural gas density, G/cm3;   g   is the acceleration of gravity, 9.8 m/s2.
Assuming   P C R = P g r , then by combining Equations (3) and (4), an expression for the height of the gas column required for the buoyancy force to overcome the corresponding capillary force is obtained:
H = P C L σ R cos θ R σ L cos θ L · 1000 ρ w ρ g g
where   H   is the air column height required for buoyancy to overcome the corresponding capillary force, m; the meanings of other parameters are consistent with those in Equations (1)–(4).
Since the capillary force obtained from the core sample is only the value of a certain point in the reservoir, in order to obtain the capillary force representing the whole formation, all the data obtained from individual cores must be integrated. In consideration of the heterogeneity of the hydrocarbon-bearing interval, in order to characterize the maximum capillary force that must be overcome to reach different water saturations inside the gas reservoir, a J S w   function is introduced here [33,34]:
J S w = P C L σ L cos θ L K ¯ ϕ ¯
where   J S w   is the function related to water saturation   S w , dimensionless;   S w is the water saturation, %;   K   ¯ is the geometric mean of permeability of all measuring points, 10−3 μm2;   ϕ   ¯ is the arithmetic mean of porosity of all samples, %; the meanings of other parameters are consistent with those in Equation (5).
In the experiment of gas displacement by mercury, if the corresponding mercury intakes under different displacement pressures are recorded, then the corresponding water saturation in the process of water displacement by gas can be calculated with the following Equation:
S W = 1 S H g
where   S H g   is the mercury saturation in the rock sample under a certain displacement pressure in the process of gas displacement by mercury, %;   S W is converted into water saturation under the influence of a certain charging force in the process of water displacement by gas under formation conditions, %.
The empirical relationship between the gas column height   H and the final water saturation   S W that can be reached after the buoyancy displacement of formation water by the gas column of this height can be obtained by combining Equations (5) and (7):
H = P C L σ R cos θ R σ L cos θ L · 1000 ρ w ρ g g = J S w σ R cos θ R 1000 ρ w ρ g g K ¯ ϕ ¯
The meaning of each parameter in the equation is consistent with that in Equations (5) and (6).
In order to figure out the gas–water distribution relationship, it is necessary to clarify the meaning of irreducible water saturation ( S w i ) and residual gas saturation ( S g r ). When the water saturation is as low as the irreducible water saturation, there is no movable water in the tight sandstone gas reservoir, and so the reservoir is deemed a pure gas producing area. When the water saturation is high up to 1 S g r , there is no mobile hydrocarbon in the tight sandstone reservoir, and the reservoir is taken as a pure water production area. It is easy to see that only when the charging force is strong enough that the natural gas completely displaces the movable water can the gas completely differentiate from water. That is to say, the buoyancy generated by a high enough gas column is needed to reduce water saturation to the irreducible water saturation level to bring about gas–water differentiation. The method for determining the relationship between gas column height and water saturation has been mentioned above. The irreducible water saturation can be obtained by a gas–water relative permeability experiment. Of course, in addition to the calculation according to Formula (8), we can also use the template method to judge the height of the gas column required for complete differentiation of gas and water (Figure 2).
Finally, we can determine the closure height of the trap from seismic data. When the closure height of the trap is greater than the minimum height of the gas column required by buoyancy to work, it is deemed that buoyancy has the ability to drive gas–water differentiation; when the closure height is less than the minimum height of the gas column required by buoyancy to work, it is considered that buoyancy does not have the ability to drive gas–water differentiation.

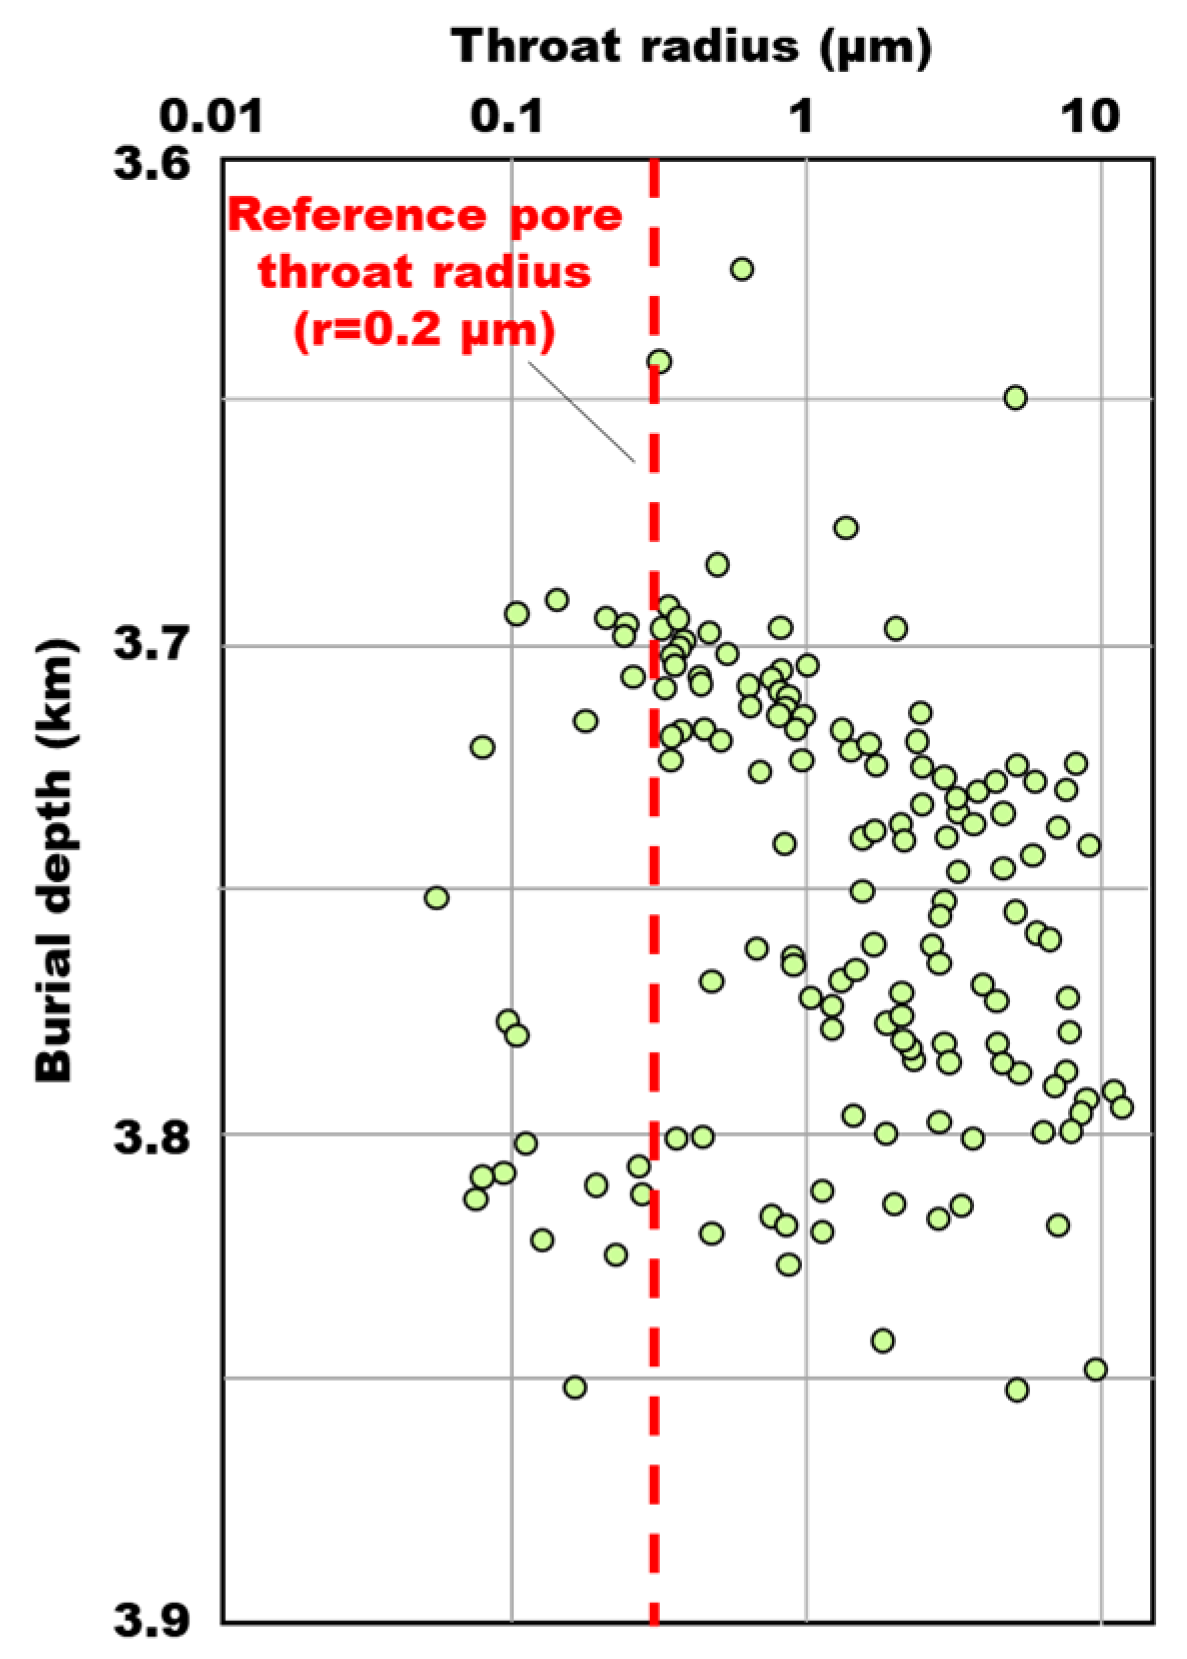
3.1.2. Critical Pore-Throat Radius Method

The gas–water boundary of the H3b gas reservoir has been revealed by some wells drilled in the study area, and it is confirmed too that buoyancy can drive the gas–water differentiation in the H3b gas reservoir. In this paper, it is considered that the dynamic conditions of natural gas charging in Huagang Formation are basically similar, and the key factor determining whether buoyancy works is the resistance condition, that is, reservoir capillary force. It is generally believed that the pore throat radius is an important parameter affecting the capillary force [30,31,32,33,34]. Therefore, the pore throat radius of the gas reservoir that has been confirmed with complete differentiation of gas and water under the action of buoyancy can be used as a benchmark to identify the gas–water distribution type of other intervals of the gas reservoir. When the average pore throat radius of an interval is greater than the benchmark pore throat radius, it is considered that buoyancy can drive the gas–water flow and differentiation. Conversely, when the average pore throat radius of a certain interval is less than the benchmark pore throat radius, it is deemed that buoyancy cannot make gas and water flow and differentiate [35].
Because of the strong heterogeneity of pore throat radius in the reservoir, the arithmetic average of pore throat radius of each sample from H3b sand layer was taken to determine the benchmark value. Meanwhile, considering the influence of probability, when defining the benchmark pore throat radius, it was stipulated that the samples with pore throat radius greater than or equal to this value should account for 90% of the total samples in this study (Figure 3). This proportion has no specific meaning but is a rough estimate made by the authors based on the distribution characteristics of outliers. Of course, if we want to set more stringent conditions for identifying complete differentiation of gas and water, this proportion can be decreased; conversely, the proportion can be increased. Moreover, based on the correlation between the driving force and resistance in achieving static equilibrium, it can be assumed that buoyancy equals capillary force. By combining Equations (2) and (4), Equation (9) is derived to calculate the minimum radius of the pore throat for gas–water separation:
r = 1000 2 σ R cos θ R H ρ w ρ g g
The meaning of each parameter in the equation is consistent with that in Equations (2) and (4). The minimum pore throat radius needed for differentiation of gas and water in H3b was calculated to be 0.2 μm, which is basically consistent with the limit of the benchmark pore throat radius estimated in this paper.

3.1.3. Gas–Water Distribution Attitude Method

For conventional gas reservoirs, the gas–water flow is controlled by buoyancy, and there is an obvious correlation between gas saturation and depth. Generally speaking, in a conventional gas reservoir, the closer to the top, the higher the gas saturation is. When buoyancy is not high enough to make gas and water flow and separate, natural gas, affected by many factors, would show complex distribution characteristics. In this case, the distribution of gas and water is likely to show a pattern opposite to that in the conventional gas reservoir. Therefore, according to the distribution characteristics of gas saturation on the profile, the attitude of gas–water distribution can be figured out, and then, whether buoyancy can make gas and water flow and differentiate can be told.
The gas saturation was calculated with the classical Archie model in this study [36]:
S w = a b R w R t ϕ m n
S g = 1 S w
where   S w   is the water saturation,%;   S g is the gas saturation,%;   R w is the formation water resistivity, the regional empirical value of 0.06 Ω was taken in this study, m;   R t is formation resistivity, Ω·m;   ϕ   is porosity, %;   m   is the cementation index, the regional empirical value of 2 was taken in this study;   n   is the saturation index, the regional empirical value of 2.1 was taken; a and b are empirical coefficients, 1 was taken for both.
As the study area has not been developed on a large scale yet, there are not enough data to support the study of gas and water distribution. Therefore, the gas filling degree was used to study the gas–water distribution characteristics, and its calculation formula is as follows:
D S F = 1 N Δ h n ϕ n S g n 1 N Δ h n ϕ n
where   D S F is the gas filling degree of sand layer, %;   h n is the thickness of the nth interval, m;   ϕ n is the porosity of the nth interval, %; and   S g n is the gas saturation of the Nth interval, %. It is generally believed that positive correlation between the filling degree and the altitude proves that there is gas–water differentiation driven by buoyancy; otherwise, the buoyancy effect is weak.

3.2. Simulation of Overpressure and Fluid Charging Process Driven by Overpressure

The overpressure and fluid charging process driven by overpressure was mainly analyzed by PetroMod_2014 simulation in this study. The main idea is to determine the basic parameters according to the relevant results of one-dimensional simulation and then restore the three-dimensional fluid dynamic field in conjunction with the results of three-dimensional seismic interpretation, so that the gas distribution characteristics controlled by charging forces can be figured out. This section mainly describes the key parameters used in the restoration process and determination methods for them.

3.2.1. Identification of Causes of Ancient and Modern Overpressure

Before reconstructing the paleodynamic field, the origin of overpressure should be analyzed first [37]. Zhao et al. (2017) summarized six empirical identification methods [38] for overpressure, and this work mainly adopted the results of overpressure genesis research in the Xihu depression by Hou et al. (2019) and Li et al. (2021) [17,20].

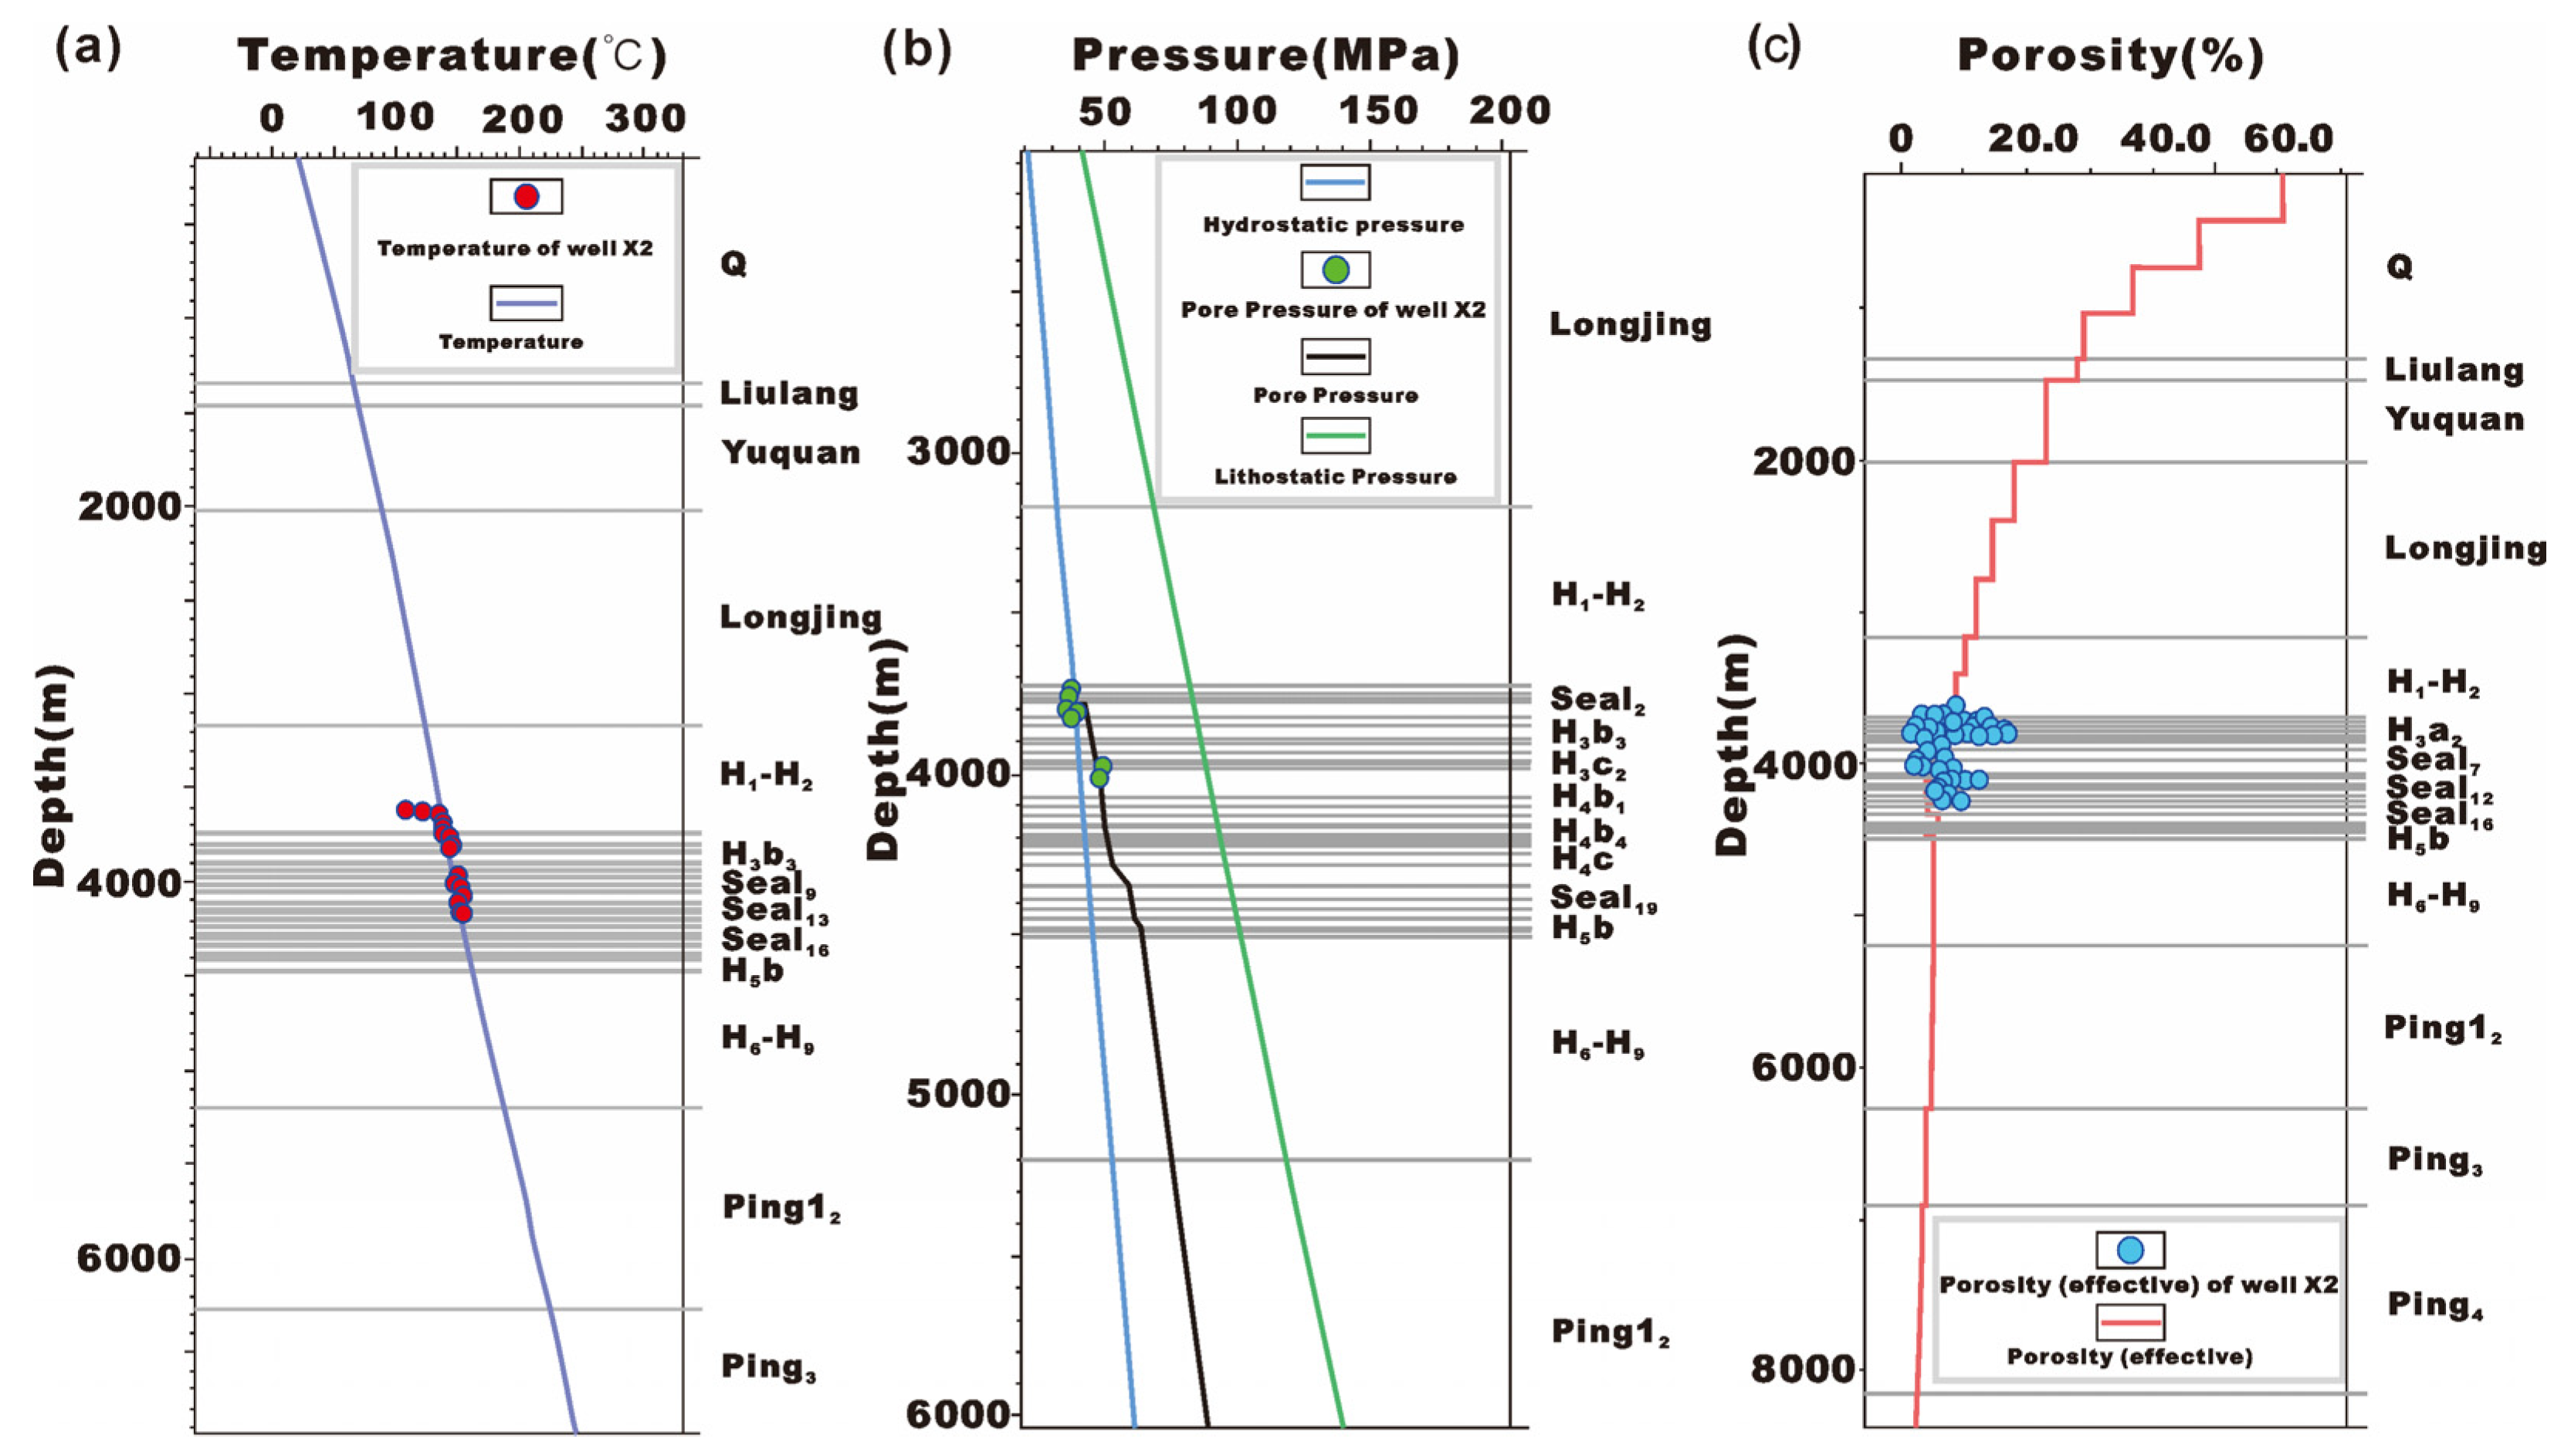
3.2.2. Determination of Main Simulation Parameters

The present depth range, formation time and lithology of each stratum are the most basic parameters that need to be determined in basin simulation. The burial depth and lithological composition of each interface currently can be obtained directly from drilling, logging and other data with ease. Researchers also have a clear understanding of the corresponding age of each interface [26,39], which will not be repeated here.
There are three main factors restricting the formation paleo-temperature in the software, namely, the upper boundary condition, the lower boundary condition and the rock thermal conductivity. The upper boundary condition refers to the paleosurface temperature. In this study, the user-defined relevant data at the corresponding latitude in PetroMod software was directly used. The lower boundary condition refers to the global heat flow value. The restoration result of Huagang Formation by Zhang (2009) [40], around 65 mW·m−2, was adopted. The thermal conductivity of the rock is mainly controlled by its lithology, and the laboratory test results of He (2004) [41] (Table 1) were referred to in this study.
The restoration of denudation thickness is directly related to the influence of tectonic evolution on the fluid dynamic field in the study area during the historical period. As the thickness of new sediments after denudation is much greater than the thickness of denuded strata in the study area, the compaction trend shows no abnormality, so it is difficult to obtain the denudation thickness with the most commonly used acoustic time difference method [42]. The denudation thickness reconstruction technology of the original thickness trend method of the stratum mainly based on 3D seismic data was adopted in this work. This method is based on the interpretation results of the seismic profile and comprehensively considers the seismic denudation origin, the thickness change rate of the reference layer and the extension trend of the target layer to restore the original stratum thickness of the target layer and obtain the denudation amount of the target layer (Figure 4). The location of the origin of seismic denudation was mainly identified based on the distribution of truncations in the seismic profile, and the selected reference layers were Pinghu Formation, the lower member of Huagang Formation and the upper member of Longjing Formation. The results show that there are three stages of denudation in the study area, corresponding to the Yuquan movement, the Huagang movement and the Longjing movement, respectively, which affect three interfaces, T30, T20 and T12. The last stage (Longjing movement) has the largest denudation thickness, during which the NX structural belt had a denudation thickness of 500–1000 m.
The above parameters were used to restore the evolution process of strata in Well X2, and a more detailed lithology setting was made for each layer of Huagang Formation in the restoration process. The current formation temperature, pressure and porosity were used to calibrate the restoration results. It can be seen from Figure 5 that the restoration results are very ideal, indicating that the selected values of the parameters are relatively reliable and can be used for a series of subsequent simulations.

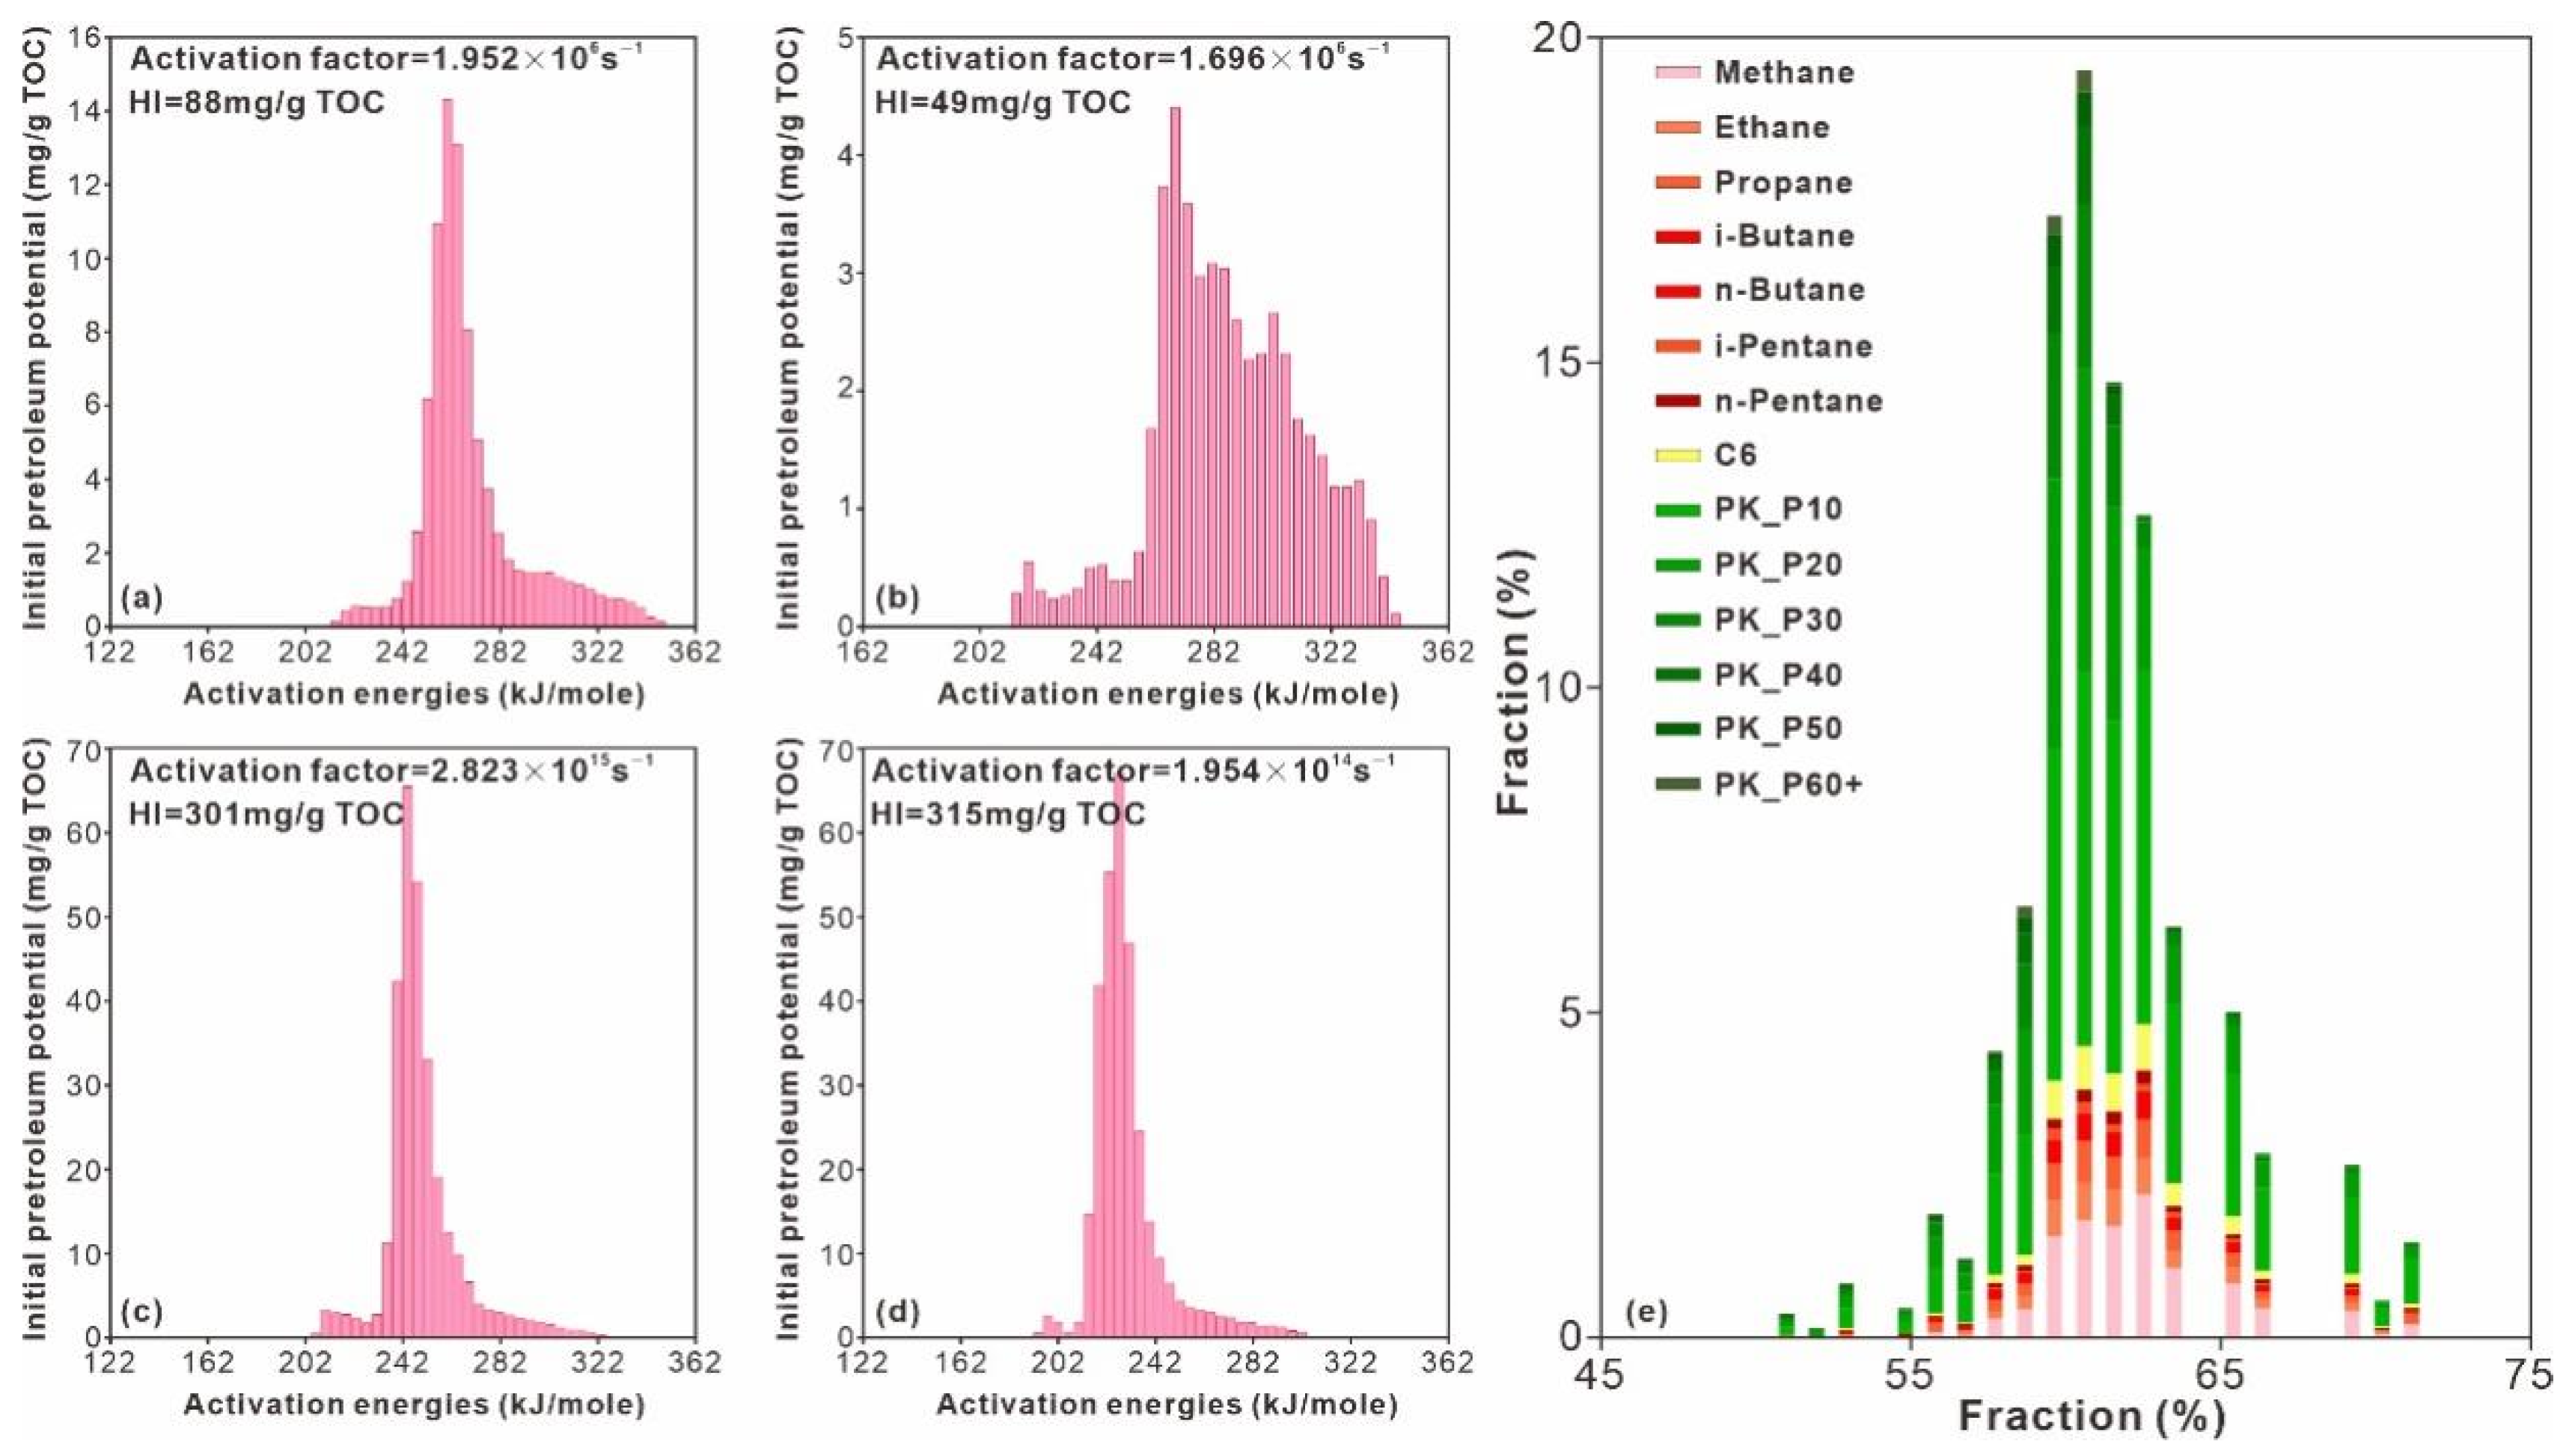
3.2.3. Selection of Hydrocarbon Generation Kinetic Model

Tissot et al. (1987) established a chemical kinetic model for thermal degradation of kerogen based on the understanding that the process of thermal degradation of kerogen into hydrocarbon should conform to the kinetic principle of chemical reaction and used it to calculate the amount of oil and gas generated [43]. According to the kinetic principle of primary cracking proposed by Espitalie et al. (1988) and Ungerer et al. (1990) [44,45], it is considered that primary cracking refers to the process of thermal degradation of kerogen into hydrocarbons. The thermal degradation of kerogen can be regarded as a series of parallel first-order reactions with different activation energies and frequency factors, which can be expressed by n parallel first-order reactions. Therefore, it is necessary to determine the activation energy distribution of each first-order reaction by means of pyrolysis. The previous activation energy distribution analysis results of the study area did not split the hydrocarbon components (Figure 6a–d), so they can only be used to understand the overall distribution. The Mu4-RC_TaranakiBasin_TII-III_4C_Crack model (Figure 6e), which is similar to the distribution of activation energy in the study area on the whole, was selected in this study. This model considering 11 components at the same time can reflect the generation process of hydrocarbons faithfully.

3.2.4. Selection of 3D Model

The 3D simulation of the fluid dynamic field can show the spatial distribution characteristics of key geological factors during reservoir formation more specifically, and the parameters involved were basically consistent with those selected in 1D simulation. The layer model was mainly established based on 3D seismic interpretation results (Figure 7a). In the fault model, several key faults connecting the source rock with the target layers were selected (Figure 7b). In the lithology setting, more detailed phase plane distribution settings were made for the target layers H3a, H4b and H5a according to the lithology inversion results (Figure 7c–e). In the setting of the denudation model, the denudation thickness caused by the most crucial Longjing movement was mainly considered (Figure 7f).

4. Results and Discussion

4.1. Closure Height and Maximum Gas Column Height of NX Gas Field Trap

The NX gas field is on an anticlinal structural trap, with the long axis in NNE-SSW strike of about 13 km long and the short axis in NW-SE strike of about 4 km wide. The main control fault of the gas field is F1 (Figure 8). The gas field is divided into east and west blocks by F1, and the main part is the west block located on the hanging wall of the reverse fault F1 (Figure 8).
Morphologically, the west block is wide in the south and narrow in the north, steep in the west and gentle in the east, and shows good structural inheritance (Figure 8). The strata in the upper section of the gas field display a slight dip angle and a less abrupt structural pattern in contrast to the lower section, which exhibits a greater dip angle and a steeper structural style. The southwest corner of the gas field is connected with the NXS anticline through a saddle, which is exactly the spill point controlling the trap area of the field. The target layers of the gas field decrease gradually in the trap area and height from shallow to deep, with trap areas ranging from 31. 75 km to 49. 83 km2 and trap amplitude ranging from 200 m to 285 m (Table 2).
The area and amplitude of the east block of the gas field are greatly affected by the extension length of the F1 master fault (Figure 8). The fault does not cut through the strata of H3 and above to completely separate the east and west blocks, and the east and west blocks have a uniform lowest trap line. In the strata of H4b and below, the fault extends far to the north on the plane, making the east block a relatively independent fault-nose structure controlled by it. The H4 and H5 in this block have a trap area of 15.10–19.04 km2 and a trap height of 260–310 m (Table 2).

4.2. Main Driving Forces of Gas Flow/Migration

4.2.1. Critical Conditions for and Strength of Buoyancy Action

The average irreducible water saturation of H3b is 46% according to the identification results of the mercury injection gas–water relative permeability experiment. The critical gas column height for buoyancy to work at this water saturation is 226 m according to the calculation (Figure 9). As the trap closure height of H3b is 232 m, greater than the critical gas column height for buoyancy to drive gas–water differentiation, so it is reckoned that buoyancy has driven gas and water flow to form edge and bottom water in this member. This result is consistent with the finding from drilling in the exploration stage.
The H3a, H4b and H5a have an average irreducible water saturation of 55%, 48% and 55%, respectively. Through calculation, their corresponding critical air column heights for buoyancy to drive gas–water flow are, respectively 452 m, 551 m and 523 m. But, the closure heights of the traps in the three members are 280 m, 255 m and 265 m, respectively, which fall short of the minimum height required for buoyancy to work (Figure 9).
According to the pore throat distribution characteristics (Figure 10), the pore throats in H3a are 0.02–0.4 μm in radius, and about 70% of the samples from this member have a pore throat radius greater than the lower limit 0.2 μm of the pore throat radius of H3b for buoyancy to drive gas–water flow, so buoyancy is very likely to drive gas and water flow in this member. In contrast, the pore throat radii of H4b and H5a are in the range of 0.01–0.04 μm and 0.01–0.03 μm, respectively, and only 20% and 5% of the samples from them have pore throat radii larger than the lower limit of 0.2 μm of the pore throat radius of H3b. In this case, it is almost impossible to drive gas and water to flow by buoyancy alone.

4.2.2. Gas–Water Distribution Pattern in Current Gas Reservoir

As the result of gas flow driven by the main driving force, the present gas–water distribution characteristics can be used to deduce the type of main driving force. In terms of natural gas distribution characteristics, H3, H4 and H5 have multiple gas layers. Among the four wells drilled so far, X1 and X4 are located at relatively high structural positions, while X3 is located at a lower structural position. The altitudes of the top interface of the studied gas reservoir revealed by the four wells from high to low are Well X4 > Well X1 > Well X2 > Well X3 (Figure 11). It can be seen from the gas saturation from logging interpretation, the gas-rich degree of H3a is hardly controlled by the anticline, and there are still intervals with gas saturation more than 50% in Well X3. The gas saturation of H3b shows the characteristics of higher in the upper part and lower in the lower part, and specifically the gas saturation of H3b in Well X1 and X4 can reach more than 60%, while that of H3b in Well X3 is less than 40%. The H4a at the high point of the structure has higher gas saturation, practically 50–60% in Well X4, but less than 50% in Well X1, which is also at a relatively high position of the structure. H5a has lower gas saturation in some intervals at the high point of the structure, concretely, only 40–50% in Well X4, but more than 55% in Well X3.
In this study, the relationships between the gas filling degree of H3a, H3b, H4b and H5a and their top elevations were compared (Figure 11). It can be seen that there is no obvious correlation between the gas filling degree and the structural height in the three sets of sand bodies, except for H3b, and there is even a certain degree of negative correlation between them in H5a.

4.2.3. Main Driving Forces of Natural Gas Flow and Gas–Water Distribution Patterns

By comparing and analyzing the characteristics of typical tight sandstone gas fields in North America and China [7,28,46], it can be seen that there are at least two driving forces of natural gas and gas–water distribution patterns in the NX gas field:
(1)
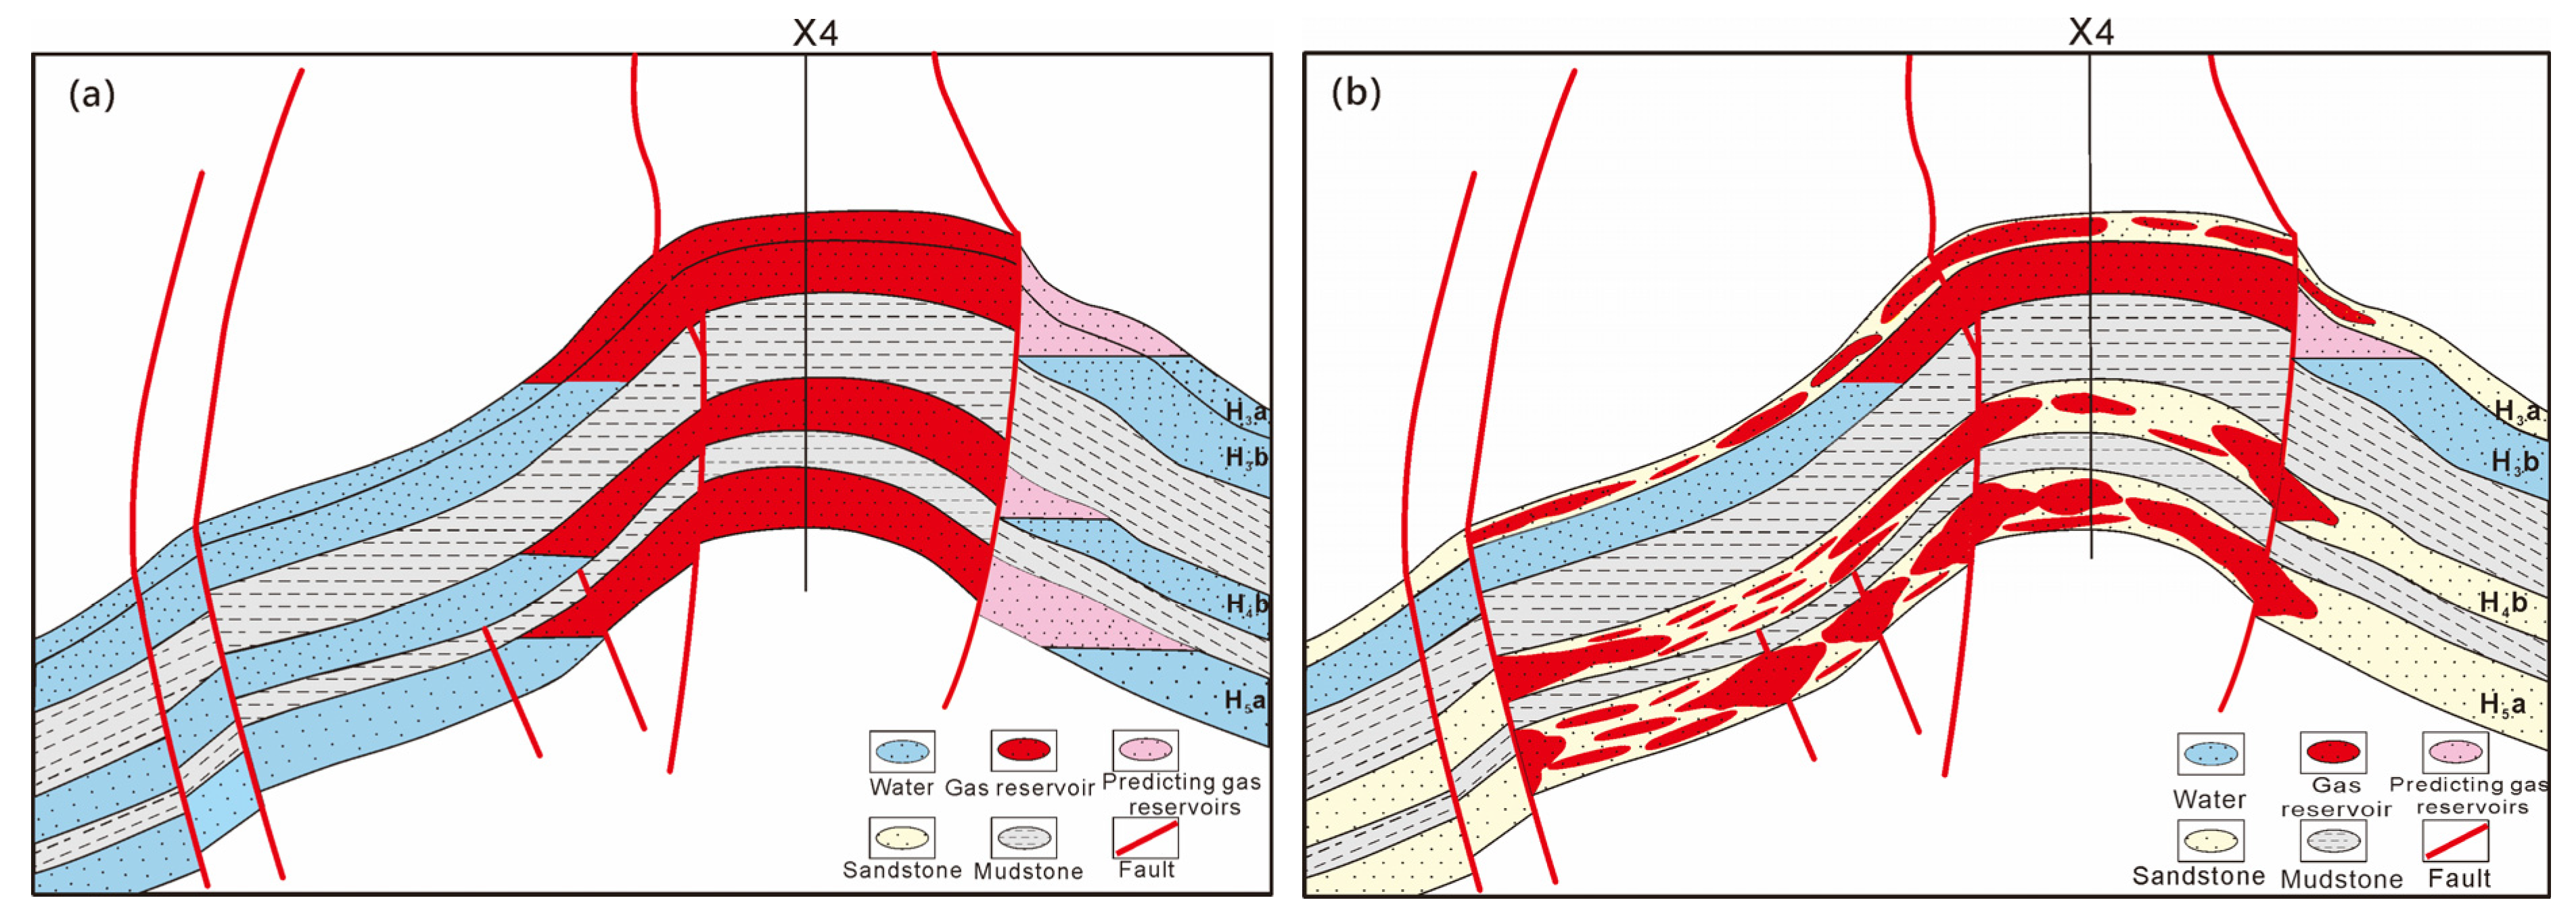
H3b conventional low permeability gas reservoir with edge water driven by overpressure and buoyancy:
H3b is deemed a conventional low permeability reservoir through analysis in this work. This member, with better physical properties, larger pore throat radius and better sorting, has lower capillary pressure resisting gas charging. Therefore, the continuous gas column height needed for buoyancy to drive gas–water differentiation in H3b is smaller, and H3b has gas–water differentiation under the effect of buoyancy. This is also proved by the gas–water interface revealed by drilling data in Well X3. It is worth noting that many previous research results also show that overpressure is also an important driving force for gas migration and flow at the critical moment of reservoir formation [17,18,20]. Hence, it is concluded that H3b has the characteristics of dual driving forces: overpressure during reservoir formation (Figure 5b and Figure 12c) and buoyancy after reservoir formation, and its gas–water distribution pattern with clear gas–water interface and formation water in the form of edge water is the result of buoyancy driving.
(2)
Distribution pattern of gas and water in the same layer in H3a, H4b and H5a driven by overpressure:
H3a, H4b and H5a are all ultra-low permeability and tight sandstone gas reservoirs characterized by poor physical properties, small pore throat radius, poor sorting and strong heterogeneity (Figure 3 and Figure 10). In these three sets of sand bodies, the resistances (capillary forces) to be overcome by the gas column are also larger, so longer continuous gas columns are needed to overcome the resistances. The lower limit of the continuous gas column height is 450–550 m, but the current trap heights in them are far below this, so it is hardly possible for buoyancy to work (Table 2, Figure 9). The production test results of these gas reservoirs generally show the characteristics of gas and water existing in and discharging from the same reservoir together. This is highly consistent with gas–water distribution patterns driven by overpressure of typical tight sandstone gas fields in North America and China found by predecessors, indicating that overpressure is the main driving force of this type of gas reservoir.
As ultra-low permeability sandstone has poor physical properties, the flow of natural gas in it needs to overcome large resistance, so sufficient and strong driving force is especially important. Overpressure, as an important driving force for the formation of “sweet spots”, has many causes, among which the most important one must be the volume expansion of fluids caused by hydrocarbon generation of source rock. The systematic studies of Hou et al. (2019) [17] and Li et al. (2021) [20] showed that the overpressure in the Xihu depression was mainly caused by volume expansion and pressurization due to hydrocarbon generation and conduction in the process of hydrocarbon migration. Taking the volume expansion and pressurization due to hydrocarbon generation and conduction in the process of oil and gas migration as the basic geological model, the gas–water distribution pattern driven by overpressure was simulated.

4.3. Simulation of the Formation and Evolution of the Dynamic Field and Gas–Water Distribution Characteristics Driven by It

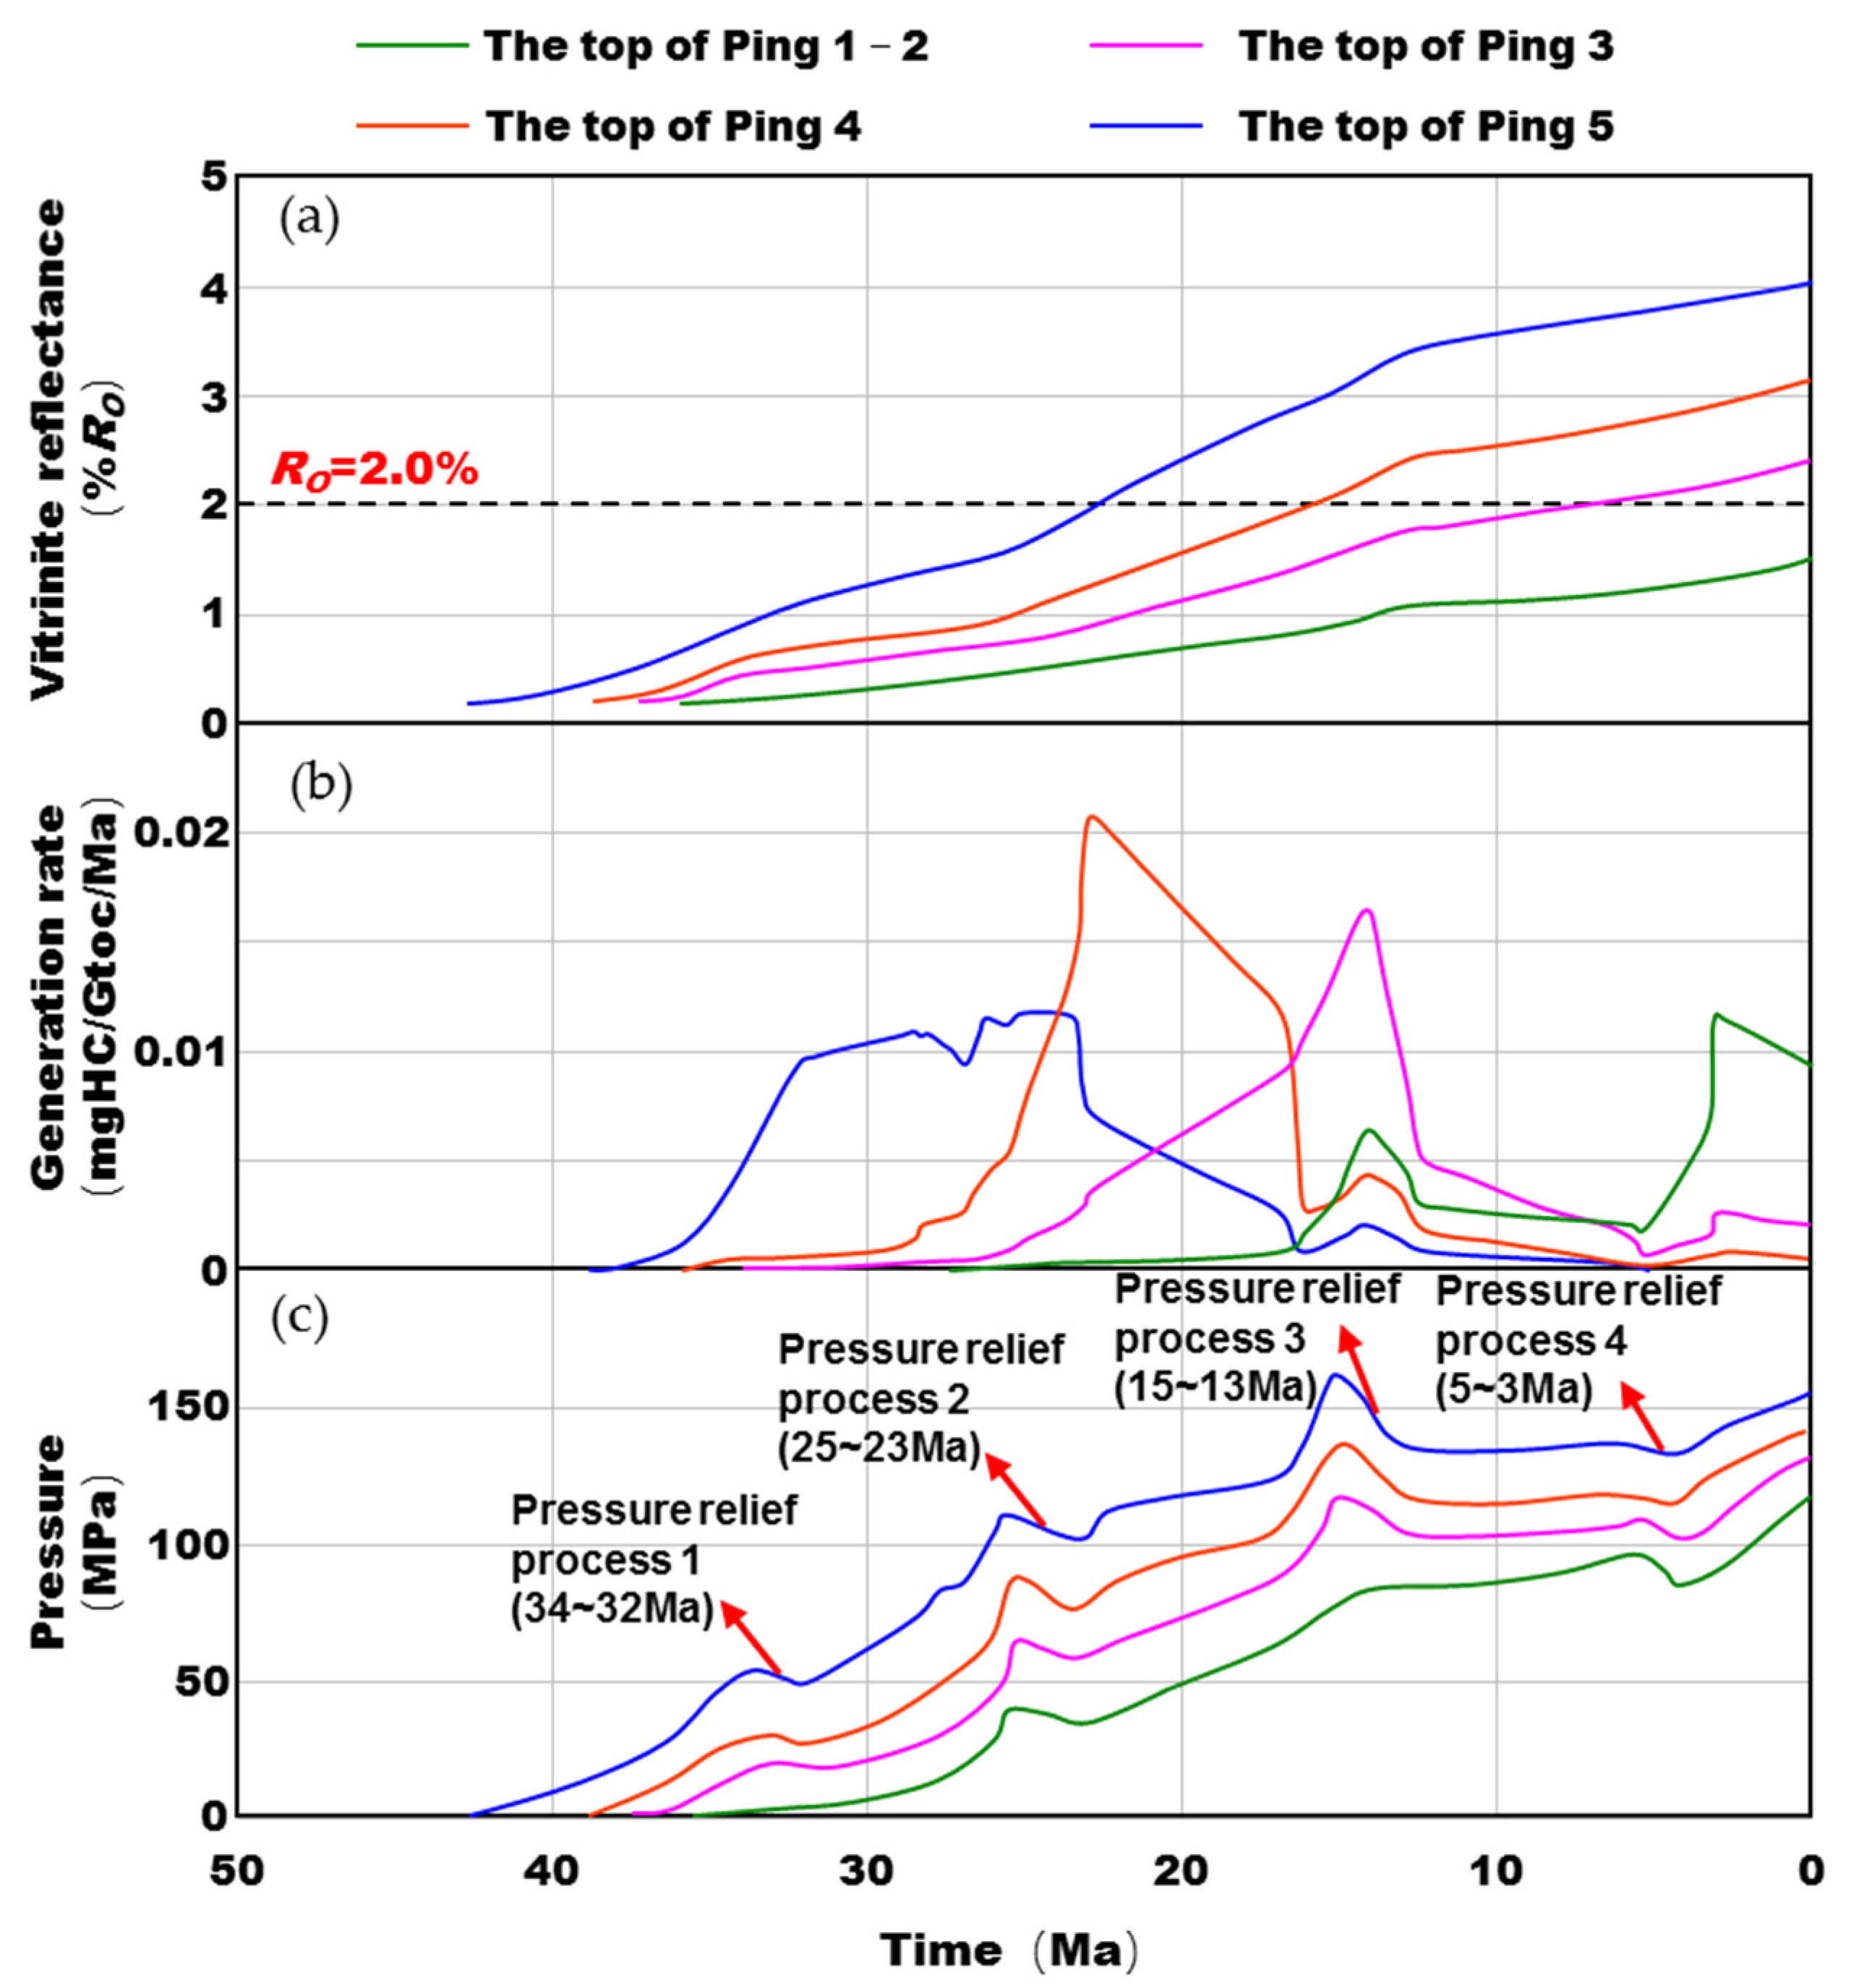
4.3.1. Formation and Evolution Process of Overpressure

The quality and thermal evolution degree of source rock determine its volume expansion quantity [20,37] due to hydrocarbon generation. The restoration results in this study show that the source rocks in some deeper layers of Pinghu Formation in the study area had reached the maturity RO (RO is organic matter vitrinite reflectance, and RO value greater than 2.0% indicates that the source rock is in the stage of abundant gas generation) of 2. 0% around 25 Ma, and then with the increase in burial depth and formation temperature, most of the source rocks in Pinghu Formation have reached the maturity RO = 2% successively, so they have been generating gas continuously. Up to now, only the top part of Member 1 of Pinghu Formation (Ping 1 in short) has not reached the RO of 2.0% (Figure 12a).
Due to the constraints of the hydrocarbon generation dynamic model, the source rocks of different maturities have some differences in hydrocarbon generation (Figure 12a). According to the restoration results of gas generation intensity, there are mainly four obvious gas generation peak stages (Figure 12b). The first stage is about 36–28 Ma, and the main gas-generating interval was the Ping5 member; the second stage is about 26–19 Ma, and the main gas-generating interval was the Ping4 member; the third stage is about 17–12 Ma, and main gas-generating intervals were the Ping1, Ping2 and Ping3 members; the stage 4 roughly corresponds to 5–0 Ma, and the main gas-generating intervals are Ping1, Ping2 and Ping3 members (Figure 12b).
In accordance with the hydrocarbon generation stages, the paleo-pressure reconstruction results of Pinghu Formation source rocks show that there are four stages of obvious pressure relief in the study area, corresponding to four stages of large-scale fluid activities, namely, Stage 1 from 34 Ma to 32 Ma, Stage 2 from 25 Ma to 23 Ma, Stage 3 from 15 Ma to 13 Ma, and Stage 4 from 5 Ma to 3 Ma (Figure 12c).

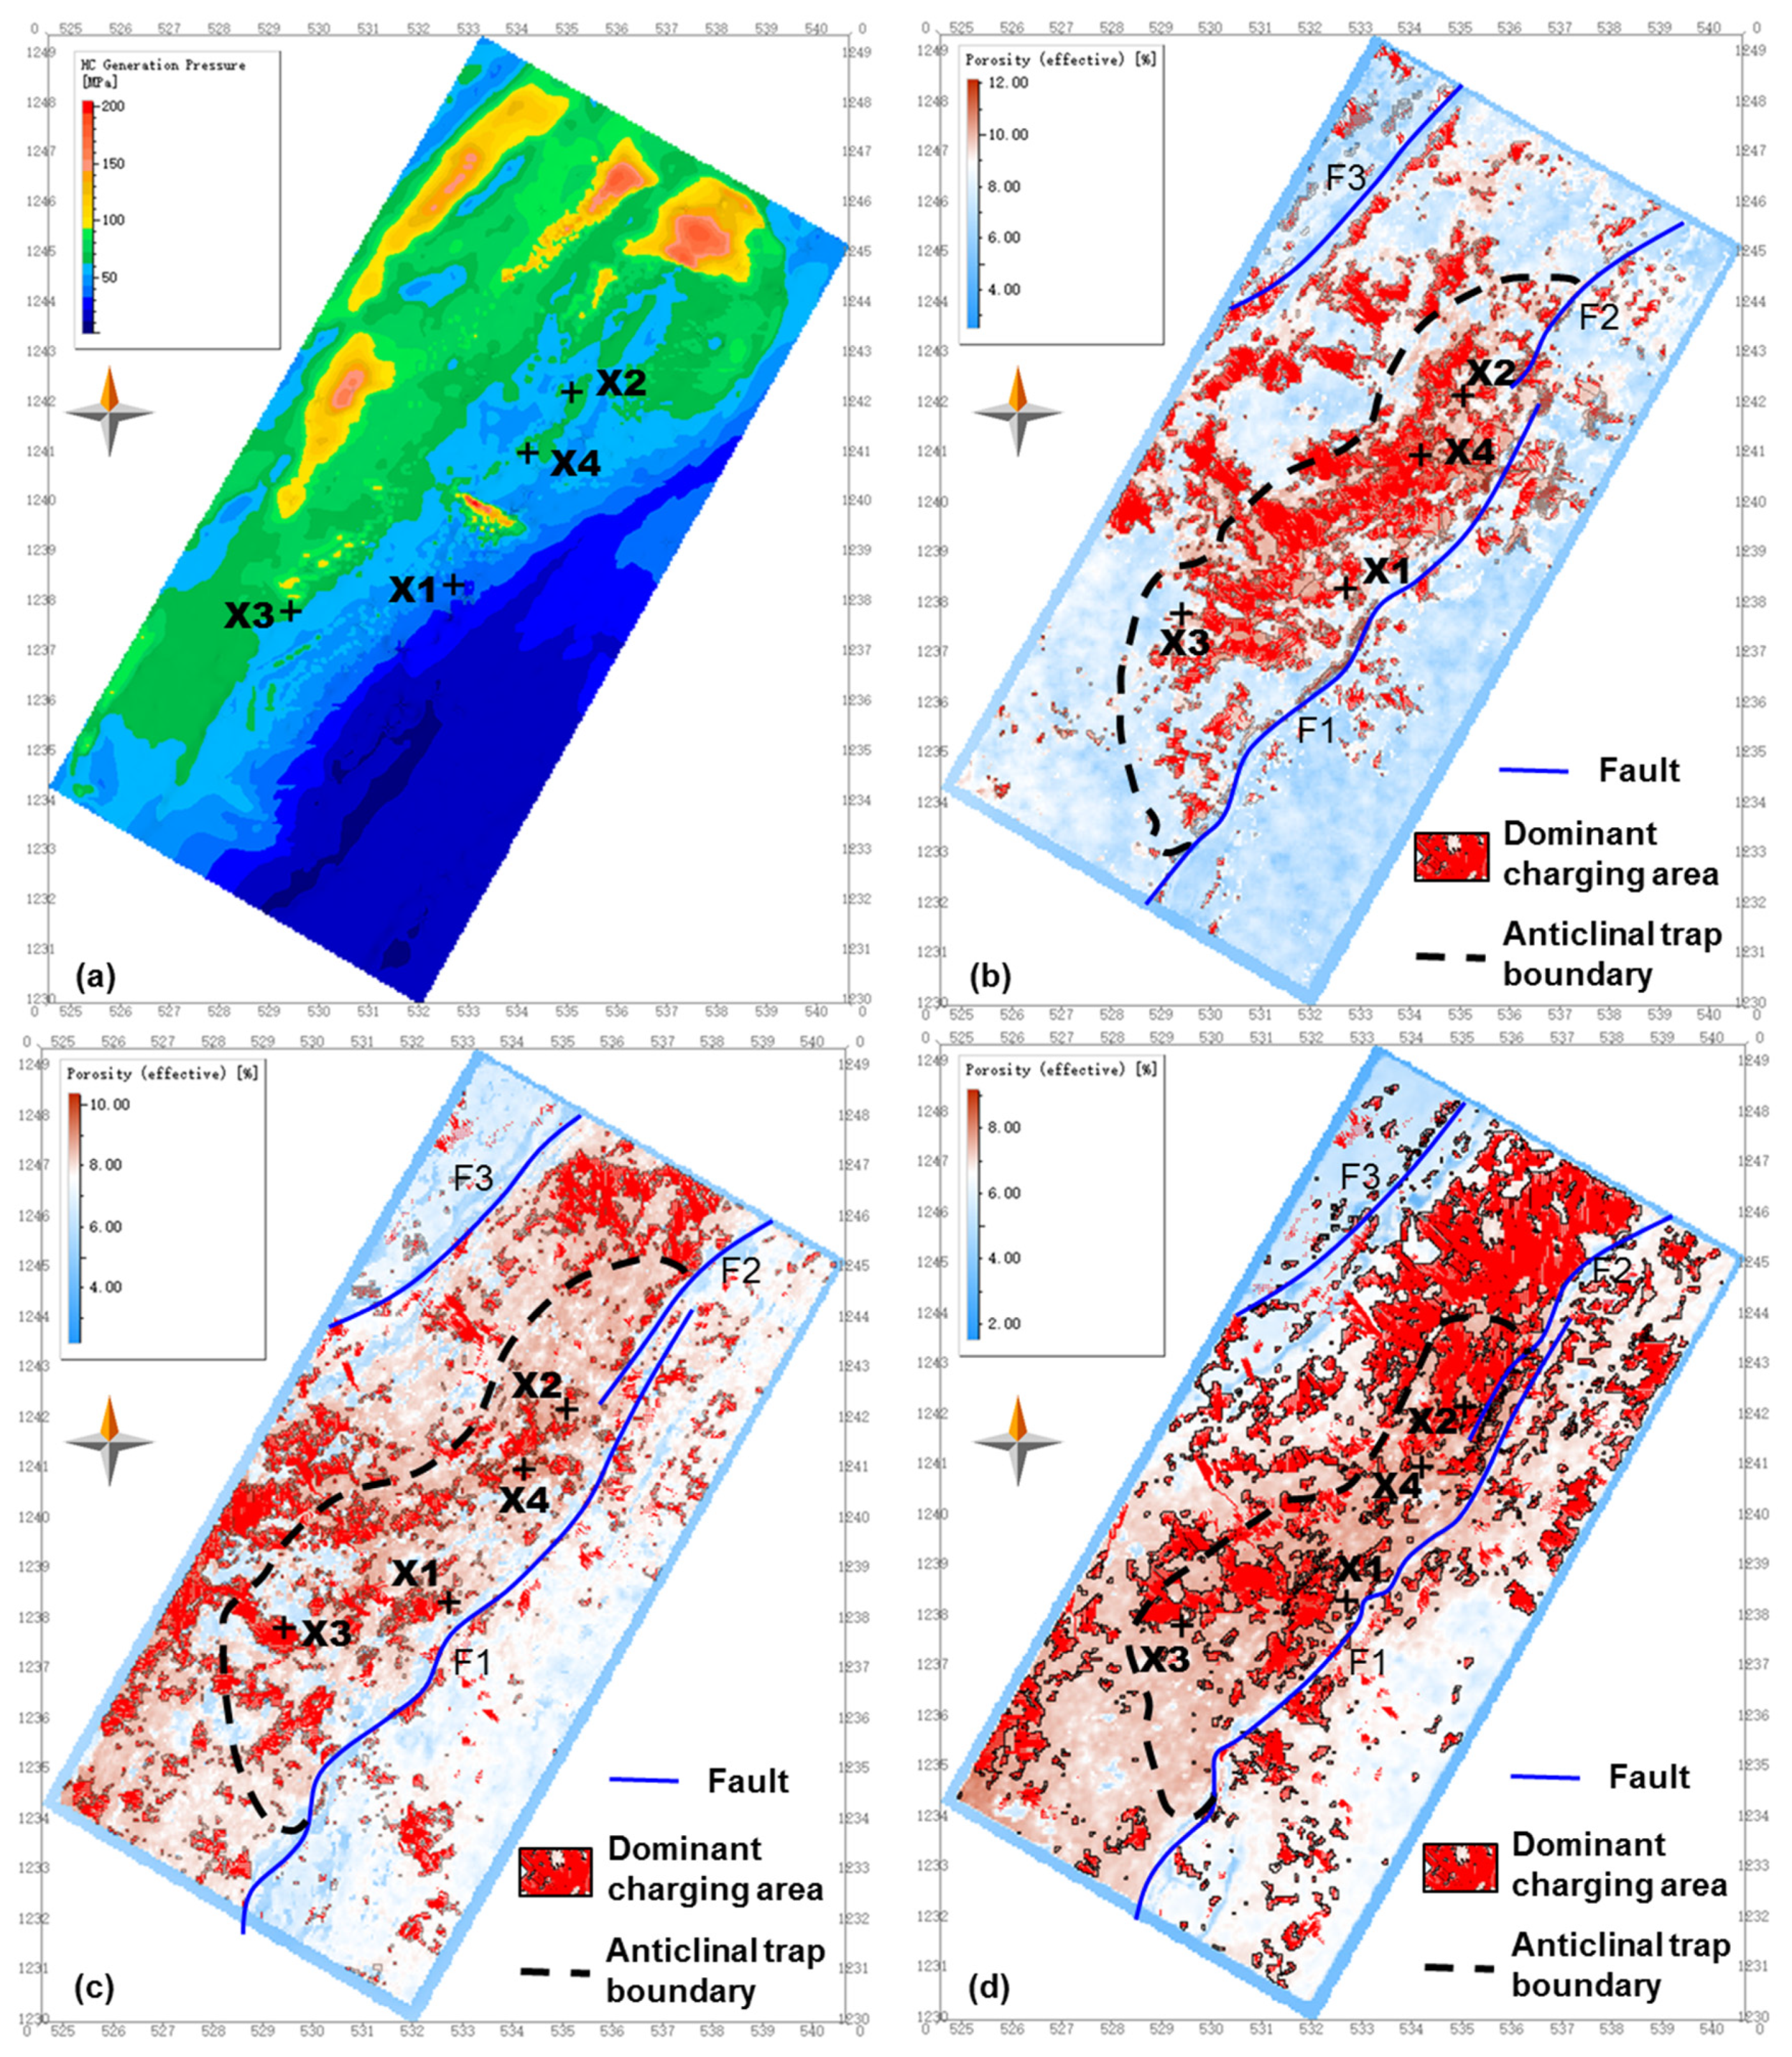
4.3.2. Distribution of Favorable Natural Gas Accumulation Zones Driven by Overpressure

Based on the homogenization temperature data of inclusions and previous studies, it is generally considered that the formation of the NX gas reservoir began around 5.3 Ma [18]. Therefore, the hydrocarbon generation pressurization amount of Pinghu Formation source rock at around 5.3 Ma was selected to express the strength of the charging force (Figure 13a). The results show that the dynamic conditions were strong in the northwest and weak in the southeast during hydrocarbon accumulation. Based on this result, basin modeling software was used to predict the favorable charging zone in the reservoir-forming period.
The favorable accumulation zone in H3a occurs in the high part of the current structure and is basically distributed along the secondary faults inside the NX gas field (Figure 13b). This is consistent with the previous understanding on gas–water distribution type. It is worth noting that there are also some favorable accumulation zones in the northwest of the study area beyond the scope of the anticlinal trap, which exceed the gas-bearing area delineated according to conventional structural gas reservoirs in the exploration stage. This also suggests that the natural gas in the H3a gas reservoir is not controlled by the structure, and the natural gas is mainly distributed in areas with strong charging forces, which is closely related to the gas source faults and distribution of conductive overpressure.
Similar to H3a, the favorable gas accumulation zone in H4b is not limited within the anticlinal trap, and there are still possible gas-rich “sweet spots” outside the spill point (Figure 13c). The favorable accumulation zones in H5a are large in area on the whole and show a trend of gradual decrease in area from north to south (Figure 13d). Compared with H3a and H4b, H5a is vertically closer to the source rock interval and has the advantage of “favorable location”. Therefore, its natural gas charging dynamics is stronger, and its sand bodies need not be very good in physical properties to form the gas reservoir. Under this dynamic control condition, together with several faults supplying hydrocarbon at the same time in the northern part of the study area, the favorable accumulation zone in it has a large area and the characteristic of continuous distribution and seems not controlled by the anticlinal trap.

4.4. Geological Significance of Exploration and Development

The results of this study are of great significance for the exploration and development of the NX gas field. Firstly, the differences of gas driving forces and accumulation zone distribution in the four major gas layers have been clarified; the distribution pattern of gas and water in the same layer driven by overpressure in H3a, H4b and H5a proposed, on the one hand, makes the gas-bearing area and resources of these three layers increase significantly, thus expanding the exploration and development potential (Figure 13b–d), and on the other hand, points out the direction for the search of gas-rich sweet spots; that is, the gas source fault and overpressure distribution are two important factors controlling the formation and distribution of sweet spots (Figure 14). Secondly, the research results provide an important geological basis for the efficient development of the NX gas field by class and grade. The H3b reservoir is better in quality and similar to conventional gas reservoirs in gas–water distribution pattern, so its development mode can also refer to that of conventional gas fields in the study area. But, H3a, H4b and H5a are typical tight sandstone gas reservoirs. By comparing with the effective development cases of ultra-low permeability and tight sandstone gas reservoirs in the world, measures such as dense well pattern, combination of vertical well/directional well and horizontal well, gas production rate of less than 2%, production allocation of less than 1/4 of open flow capacity, early water prevention and late overall water control are conducive to its long-term and efficient development.

5. Conclusions

(1)
In this paper, the critical conditions of buoyancy-overpressure drive and identification methods for main driving forces in low permeability-tight sandstone gas reservoirs, including critical gas column height method, critical pore throat radius method, gas–water distribution attitude method and geological comprehensive analysis method, are summarized systematically.
(2)
The four major gas-bearing layers in the NX tight sandstone gas reservoir have obvious differences in gas flow/migration dynamics. The natural gas in H3b gas reservoir was driven by both buoyancy and overpressure during accumulation and by buoyancy after accumulation. In H3a, H4b and H5a gas layers, buoyancy is not enough to overcome the capillary force to make the gas migrate during and after gas accumulation and reservoir formation, and the driving force of gas flow is the overpressure caused by fluid volume expansion due to source rock hydrocarbon generation.
(3)
Gas–water distribution patterns formed by the two driving forces have been proposed. In the H3b conventional low permeability gas reservoir, the gas-edge water distribution pattern is driven by overpressure and buoyancy, and the anticlinal trap controls distribution area of the gas reservoir. In H3a, H4b and H5a reservoirs, gas and water are in the same layer driven by overpressure. As buoyancy is not the driving force of gas flow, gas and water exist in the same reservoir and are produced together. These reservoirs have no edge and bottom water, an anticline trap not controlling the gas and water distribution, and gas source faults controlling the boundary of gas reservoir.
(4)
The understandings from this study not only significantly expand the gas-bearing area of H3a, H4b and H5a gas reservoirs delineated in the buoyancy driving pattern but also provide an important geological basis for the formulation of efficient development plans for NX tight sandstone gas fields by class and grade.

Author Contributions

Conceptualization, J.L.; Data curation, D.D., B.L., W.L., Z.X., Z.D. and C.X.; Formal analysis, B.L. and W.L.; Funding acquisition, X.H.; Investigation, D.D. and X.S.; Methodology, X.H., J.L. and D.D.; Software, B.L., W.L. and Z.X.; Validation, X.S. and Z.X.; Writing—original draft, J.L. and X.S.; Writing—review and editing, X.H. and J.L. All authors have read and agreed to the published version of the manuscript.

Funding

This research was funded by the Scientific Research and Technology Major Project of CNOOC China Ltd. (No. CNOOC-KJ135ZDXM39SH03).

Data Availability Statement

The data relevant with this study can be accessed by contacting the corresponding author upon reasonable request and the permission of CNOOC China Ltd., Shanghai Branch.

Conflicts of Interest

The authors declare no conflict of interest.

References

  1. Jia, A.; Cheng, G.; Chen, W.; LI, Y. Forecast of natural gas supply and demand in China under the background of “Dual Carbon Targets”. Pet. Explor. Dev. 2023, 50, 431–440. [Google Scholar] [CrossRef]
  2. Law, B.E.; Spencer, C.W.; Longman, M.W.; Kneller, S.R.; Meyer, T.S.; Chapin, M.A. The Pinedale gas field: A sweet spot in a regionally pervasive basin-centered gas accumulation, Green River and Hoback Basins, Wyoming. In Pinedale Field: Case Study of a Giant Tight Gas Sandstone Reservoir; AAPG Memoir: Houston, TX, USA, 2014; Volume 107, pp. 37–59. [Google Scholar]
  3. Wang, R.; Liu, K.; Shi, W.; Qin, S.; Zhang, W.; Qi, R.; Xu, L. Reservoir Densification, Pressure Evolution, and Natural Gas Accumulation in the Upper Paleozoic Tight Sandstones in the North Ordos Basin, China. Energies 2022, 15, 1990. [Google Scholar] [CrossRef]
  4. Wu, W.; Zhao, J.; Wei, X.; Wang, Y.; Zhang, J.; Wu, H.; Li, J. Evaluation of gas-rich “sweet-spot” and controlling factors of gas–water distribution in tight sandstone gas provinces: An example from the Permian He8 Member in Sulige Gas Province, central Ordos Basin, Northern China. J. Asian Earth Sci. 2022, 227, 105098. [Google Scholar] [CrossRef]
  5. Nelson, P.H.; Longman, M.W.; Kneller, S.R.; Meyer, T.S.; Chapin, M.A. Fluid production characteristics in Pinedale and Jonah Fields. In Pinedale Field: Case Study of a Giant Tight Gas Sandstone Reservoir; AAPG Memoir: Houston, TX, USA, 2014; Volume 107, pp. 533–547. [Google Scholar]
  6. Shanley, K.W.; Cluff, R.M.; Robinson, J.W. Factors controlling prolific gas production from low-permeability sandstone reservoirs: Implications for resource assessment, prospect development, and risk analysis. AAPG Bull. 2004, 88, 1083–1121. [Google Scholar] [CrossRef]
  7. Zhao, J.; Li, J.; Cao, Q.; Bai, Y.; Wu, W.; Ma, Y. Quasi-continuous hydrocarbon accumulation: An alternative model for the formation of large tight oil and gas accumulations. J. Pet. Sci. Eng. 2019, 174, 25–39. [Google Scholar] [CrossRef]
  8. Wang, J.; Zhang, C.; Li, J.; Li, Y.; Li, X.; Liu, P.; Lu, J. Tight sandstone gas reservoirs in the Sulige Gas Field: Development understandings and stable-production proposals. Nat. Gas Ind. 2021, 41, 100–110. [Google Scholar]
  9. Masters, J.A. Deep Basin gas trap, western Canada. AAPG Bull. 1979, 63, 152–181. [Google Scholar]
  10. Rose, P.R.; Everett, J.R. Possible basin centered gas accumulation, Roton Basin, Southern Clorado. Oil Gas J. 1984, 82, 190–197. [Google Scholar]
  11. Law, B.E. Basin-Centered Gas Systems. AAPG Bull. 2002, 86, 1891–1919. [Google Scholar]
  12. Schmoker, J.W. Resource-Assessment Perspectives for Unconventional Gas Systems. AAPG Bull. 2002, 86, 1993–1999. [Google Scholar]
  13. Schmoker, J.W. Method for assessing continuous-type (unconventional) hydrocarbon accumulations. In National Assessment of United States Oil and Gas Resources—Results, Methodology, and Supporting Data; Gautier, D.L., Dolton, G.L., Takahashi, K.I., Varnes, K.L., Eds.; U.S. Geologic Survey Digital Data Series DDS-30 (CD-ROM); U.S. Geological Survey: Reston, VA, USA, 1995. [Google Scholar]
  14. Zhao, J.; Cao, Q.; Bai, Y.; Er, C.; Li, J.; Wu, W.; Shen, W. Petroleum accumulation: From the continuous to discontinuous. Pet. Res. 2017, 2, 131–145. [Google Scholar] [CrossRef]
  15. Zhao, J.; Fu, J.; Yao, J.; Liu, X.; Wang, H.; Cao, Q.; Wang, X.; Ma, Y.; Fan, Y. Quasi-continuous accumulation model of large tight sandstone gas field in Ordos Basin. Acta Pet. Sin. 2012, 33, 37–52. [Google Scholar]
  16. Zhao, J.; Li, J.; Cao, Q.; Bai, Y.; Er, C.; Wang, X.; Xiao, H.; Wu, W. Hydrocarbon accumulation patterns of large tight oil and gas fields. Oil Gas Geol. 2013, 34, 573–583. [Google Scholar]
  17. Hou, Z.; Zhang, S.; Li, J.; Zhao, J.; Liu, Y.; Tian, L.; Zhong, X.; Chen, M.; Xu, Z. Genetic mechanism of overpressures in the west slope of central Xihu sag. Acta Pet. Sin. 2019, 40, 1059–1068+1124. [Google Scholar]
  18. Liu, J.; Zhang, S. Natural gas migration and accumulation patterns in the central-north Xihu Sag, East China Sea Basin. Nat. Gas Geosci. 2021, 32, 1163–1176. [Google Scholar]
  19. Zhou, X. Geological understanding and innovation in Xihu sag and breakthroughs in oil and gas exploration. China Offshore Oil Gas 2020, 32, 1–12. [Google Scholar]
  20. Li, J.; Zhao, J.; Hou, Z.; Zhang, S.; Chen, M. Origins of overpressure in the central Xihu depression of the East China Sea shelf basin. AAPG Bull. 2021, 105, 1627–1659. [Google Scholar] [CrossRef]
  21. Zou, W.; Yu, Y.; Liu, J.; Jiang, Y.; Tang, X.; Chen, S.; Yu, L. Main controlling factors of the central inversional structure belt and the development of Ningbo anticline in Xihu sag, East Sea Basin. Acta Pet. Sin. 2021, 42, 176–185. [Google Scholar]
  22. Liu, J.; Zou, W.; Li, N.; Qin, J.; Liu, Y. Hydrocarbon accumulation control mechanism of reservoir-conservation coupling and its large and medium-sized field exploration practice in Xihu sag, East China Sea basin. China Offshore Oil Gas 2019, 31, 11–19. [Google Scholar]
  23. Shanley, K.W.; Cluff, R.M. The evolution of pore-scale fluid-saturation in low-permeability sandstone reservoirs. AAPG Bull. 2015, 99, 1957–1990. [Google Scholar] [CrossRef]
  24. Song, X.; Chu, C.; Rui, Z. Structural Framework and Evolution of Xihu Sag in East China Sea Basin. Geol. J. China Univ. 2010, 16, 86–93. [Google Scholar]
  25. Zheng, Q.; Zhou, Z.; Cai, L.; Lu, Y.; Cao, Q. Meso-Cenozoic tectonic setting and evolution of East China Sea shelf basin. Oil Gas Geol. 2005, 26, 197–201. [Google Scholar]
  26. Zhou, X.; Jiang, Y.; Tang, X. Tectonic setting, prototype basin evolution and exploration enlightenment of Xihu sag in East China Sea basin. China Offshore Oil Gas 2019, 31, 1–10. [Google Scholar]
  27. Guo, Z.; Liu, C.; Tian, J. Structural characteristics and main controlling factors of inversion structures in Xihu Depression in Donghai Basin. Earth Sci. Front. 2015, 22, 059–067. [Google Scholar]
  28. Zhao, J.; Cao, Q.; Bai, Y.; Er, C.; Li, J.; Wu, W.; Shen, W. Petroleum accumulation from continuous to discontinuous: Concept, classification and distribution. Acta Pet. Sin. 2016, 37, 145–159. [Google Scholar]
  29. Tiab, D.; Donaldson, E.C. Petrophysics: Theory and Practice of Measuring Reservoir Rock and Fluid Transport, 3rd ed.; Gulf Professional Publishing: Houston, TX, USA; Elsevier: Amsterdam, The Netherlands, 2012. [Google Scholar]
  30. Shi, B.; Wu, W. Geology of Oil and Gas Field; China University of Petroleum Press: Qingdao, China, 2022. [Google Scholar]
  31. Chen, T.; Jia, A.; He, D.; Ji, L.; Shao, H. Gas and water distribution regularity for tight sandstone reservoirs of Xujiahe Formation in central Sichuan basin. Geol. Sci. Technol. Inf. 2014, 33, 66–71. [Google Scholar]
  32. Guo, Z.; Li, B.; Zhang, L.; Li, X.; Kong, H. Dissussion on minimum closure for low-amplitude structural nature gas pool: A case study from Sanhu area in the Qaidam basin. Chin. J. Geol. 2008, 43, 34–49. [Google Scholar]
  33. Leverett, M.C.; Members of AIME. Capillary behavior in porous solids. In Proceedings of the Tulsa Meeting, Houston, TX, USA, October 1940. [Google Scholar]
  34. Rose, W.; Bruce, W.A. Evaluation of capillary character in petroleum reservoir rocks. Trans. AIME 1949, 186, 127–142. [Google Scholar] [CrossRef]
  35. Cao, Q.; Zhao, J.; Liu, X.; Hu, A.; Fan, L.; Wang, H. Determination of physical property limits for the gas accumulation in tight sandstone reservoirs in the eastern Ordos Basin. Acta Pet. Sin. 2013, 34, 1040–1048. [Google Scholar]
  36. Archie, G.E. The electrical resistivity log as an aid in determining some reservoir characteristics. Trans. AIME 1942, 146, 54–62. [Google Scholar] [CrossRef]
  37. Xu, Z.; Liu, Z.; Zhao, J.; He, Y.; Ma, X.; Li, J.; Zhao, Z. Introducing novel correction methods to calculate sedimentary basin overpressure and its application predicting pressure value and origin. Energies 2023, 16, 5416. [Google Scholar] [CrossRef]
  38. Zhao, J.; Li, J.; Xu, Z. Advances in the origin of overpressures in sedimentary basins. Acta Pet. Sin. 2017, 38, 973–998. [Google Scholar] [CrossRef]
  39. Shen, W.; Yu, Z.; Diao, H.; Zhang, T. Simulation of heat flow evolution history in Xihu sag and its significance for hydrocarbon accumulation. China Offshore Oil Gas 2020, 32, 42–53. [Google Scholar]
  40. Zhang, Y. Thermal history reconstruction of TWT-2 well in Xihu Depression, the East China Sea. Offshore Oil 2009, 29, 44–47. [Google Scholar]
  41. He, J. Tectono-Thermal History of Xihu Depression, East China Sea. Ph.D. Thesis, TongJi University, Shanghai, China, 2004. [Google Scholar]
  42. Cao, Q.; Ye, J.; Wang, W. Methods and progress of thickness restoration of strata denudation in sedimentary basins. China Pet. Explor. 2007, 12, 41–46. [Google Scholar]
  43. Tissot, B.P.; Pelet, R.; Ungerer, P. Thermal history of sedimentary basins, maturation indices, and kinetics of oil and gas generation. AAPG Bull. 1987, 71, 1445–1466. [Google Scholar]
  44. Espitalié, J.; Ungerer, P.; Irwin, I.; Marquis, F. Primary cracking of kerogens. Experimenting and modelling C1, C2–C5, C6–C15 and C15+ classes of hydrocarbons formed. Org. Geochem. 1988, 13, 893–899. [Google Scholar] [CrossRef]
  45. Ungerer, P.; Burrus, J.; Doligez, B.; Chenet, P.Y.; Bessis, F. Basin evaluation by integrated two-dimensional modeling of heat transfer, fluid flow, hydrocarbon generation, and migration. AAPG Bull. 1990, 74, 309–335. [Google Scholar]
  46. Li, J.; Zhao, J.; Fan, Y.; Cao, Q.; Wang, Q.; Hu, W. Gas migration mechanism of quasi-continuous accumulation in the Upper Paleozoic of Ordos Basin. Oil Gas Geol. 2013, 34, 592–600. [Google Scholar]
Figure 1. Location (a), generalized stratigraphy (b) and cross section (c) of the NX gas field in the offshore Xihu depression. Form = Formation, DH = Donghai Group, BS = Baoshi Formation.
Energies 16 06028 g001
Figure 2. Schematic diagram of critical gas column height identification for gas–water differentiation.
Energies 16 06028 g002
Figure 3. Distribution and reference pore throat radius of H3b throat radius with depth.
Energies 16 06028 g003
Figure 4. Interpretation results of seismic profile and denudation thickness recovery results of well X2.
Energies 16 06028 g004
Figure 5. Calibration of simulation results of temperature (a), pressure (b) and porosity (c) in well X2.
Energies 16 06028 g005
Figure 6. Hydrocarbon generation dynamic model of typical wells and study area in Xihu depression. (a) is sample 1: dark gray mudstone of Member 3 of Pinghu Formation; (b) is sample 2: dark gray mudstone of Member 2 of Pinghu Formation; (c) is sample: Black mudstone of the lower part of Huagang Formation; (d) is sample 4: black coal from Member 3 of Pinghu Formation; (e) is the frequency distribution of hydrocarbon reaction activation energy of each component of Mu4-RC_TaranakiBasin_TII-III_4C_Crack model.
Energies 16 06028 g006
Figure 7. Schematic diagram of 3D simulation geometry model of NX gas field. (a) is the layer model; (b) is the faults model; (c) is the H3a lithology model; (d) is the H4b lithologic model; (e) is the H5a lithology model; (f) is the denudation model.
Energies 16 06028 g007
Figure 8. The topographic elevation contour lines and trap distribution map for the NX gas field are shown.
Energies 16 06028 g008
Figure 9. Determination of the lower limit of closure height based on the buoyancy action of different levels of phase infiltration and mercury injection.
Energies 16 06028 g009
Figure 10. Frequency distribution of median pore throat radius in target interval. (a) is the frequency distribution diagram of H3a median pore throat radius; (b) is the frequency distribution diagram of H4b median pore throat radius; (c) is the frequency distribution diagram of H5a median pore throat radius.
Energies 16 06028 g010
Figure 11. Relationship between H3a, H3b, H4b and H5a top surface elevation and gas filling degree in Wells X1, X2, X3 and X4 of NX gas field. (a) is H3a; (b) is H3b; (c) is H4b; (d) is H5a.
Energies 16 06028 g011
Figure 12. Results of thermal evolution and paleo-pressure recovery of Pinghu Formation source rocks in well X1. (a) is the maturity evolution; (b) is the evolution of hydrocarbon generation intensity; (c) is the pressure evolution.
Energies 16 06028 g012
Figure 13. Dynamic conditions and recovery results of dominant charging area in the main accumulation period (5.3 Ma) of the NX gas field. (a) is the hydrocarbon generation and pressurization of Pinghu Formation during reservoir formation; (b) is the H3a effective porosity distribution and dominant charging area during reservoir forming period; (c) is the H4b effective porosity distribution and dominant charging area during reservoir forming period; (d) is the H5a effective porosity distribution and dominant charging area during reservoir forming period.
Energies 16 06028 g013
Figure 14. The gas distribution patterns under different driving forces and gas–water distribution styles. (a) is the gas reservoir distribution pattern under the condition that gas–water can be completely differentiated by buoyancy alone; (b) is the gas reservoir distribution pattern under the condition that gas–water can be driven by buoyancy and overpressure.
Energies 16 06028 g014
Table 1. Lithology and thermal conductivity values of different formations in Xihu depression.
FormationMain LithologyThermal Conductivity (w/mk)
Santan Formation + Quaternary SystemSandstone and mudstone1.365
Liulang FormationSandstone and mudstone1.841
Longjing Formation + Yuquan FormationSandstone and mudstone1.910
Huagang FormationSandstone, siltstone and mudstone2.468
Pinghu FormationSandstone, siltstone and mudstone2.636
Paleocene + Middle-Lower EoceneSandstone, siltstone and mudstone1.357
Table 2. Evaluation of trap elements in the study area.
HorizonTrap Area (km2)Buried Depth of High PointLowest Trap LineClosure Height
Time (ms)Depth (m)Time (ms)Depth (m)Time (ms)Depth (m)
West BlockEast BlockWest BlockEast BlockWest BlockEast BlockWest BlockEast BlockWest BlockEast BlockWest BlockEast BlockWest BlockEast Block
H3a43.492665351527853770120255
H3b42.652705357528153807110232
H4b41.3515.1028152910387040902945
H5a37.4815.5029203010410543103045303041504350130120280260
Disclaimer/Publisher’s Note: The statements, opinions and data contained in all publications are solely those of the individual author(s) and contributor(s) and not of MDPI and/or the editor(s). MDPI and/or the editor(s) disclaim responsibility for any injury to people or property resulting from any ideas, methods, instructions or products referred to in the content.

