Abstract
Small wind turbines operating in low wind speed regions have not had any significant success. In addition, small wind speed regions occupy a large area of the world, so they represent a potential area for installing small wind turbines in the future. In this paper, a method to design an efficient airfoil for small wind turbines in low wind speed conditions using XFLR5 and CFD simulations is implemented. Because the impact of the airflow on the blade surface under low Re number conditions can change suddenly for small geometries, designing the airfoil shape to optimize the aerodynamic performance is essential. The tuning of the key geometric parameters using inversion techniques for better aerodynamic performance is presented in this study. A two-dimensional model was used to consider the airflow on the airfoil surface with differences in the angle of attack. The original S1010 airfoil was used to design a new airfoil for increasing the aerodynamic efficiency by using V6.57 XFLR5 software. Subsequently, the new VAST-EPU-S1010 airfoil model was adjusted to the maximum thickness and the maximum thickness position. It was simulated in low wind speed conditions of 4–6 m/s by a computational fluid dynamics simulation. The lift coefficient, drag coefficient, and CL/CD coefficient ratio were evaluated under the effect of the angle of attack and the maximum thickness by using the k-ε model. The simulation results show that the VAST-EPU-S1010 airfoil achieved the greatest aerodynamic efficiency at an angle of attack of 3°, a maximum thickness of 8%, and a maximum thickness position of 20.32%. The maximum value of CL/CD of the new airfoil at 6 m/s was higher than at 4 m/s by about 6.25%.
1. Introduction
Wind energy is one of the most developed renewable energy sources. Areas with medium and high wind speeds have been exploited in most of the convenient locations. Specifically, according to the report of the GWEC organization, the onshore installed wind power capacity is about 68.8 GW, and the offshore wind power capacity has gone beyond 8.8 GW in 2022 [1]. This growth has increased by 9% compared with in 2021.
The IEC61400-1 standard is divided into four wind class categories and corresponds to four different wind turbine technologies [2]. Type 1 is suitable for areas with high wind speeds above 10 m/s, type 2 is suitable for average wind speeds of 8.5 m/s or more, type 3 is suitable for low wind speeds of 7, 5 m/s or more, and category 4 is according to actual requirements. However, the areas of low wind speed with a very large area in the world have not yet been exploited. Therefore, to effectively exploit the wind energy in low wind speed areas, more research is needed to come up with reasonable and high-efficiency wind turbine blades.
In previous studies, high-power wind turbine blades in low wind speed regions are often designed based on the wind turbine blades in a high wind speed region [3,4,5]. The research results on wind turbines in low wind speed regions at the NREL have shown several criteria, such as longer blades, taller towers, and modern control methods [6]. The purpose of designing this wind turbine technology is to increase the output of electricity produced and reduce the investment rate. However, this also leads to an increase in the blade mass and affects the aerodynamic efficiency of the entire wind turbine. A longer blade will increase the blade’s mass, which requires a corresponding increase in the nominal speed to ensure the turbine’s operating efficiency is maintained. Even though the mass does not directly affect the value of the power factor, it does indirectly affect it through its relationship with the structure of the blade. The longer the blade, the larger and more rounded the parts near the rotor center point. For more circular and symmetrical blade sections, the value of the axial induction factor (a) will be smaller. This leads to a decrease in the value of the power factor according to the blade element momentum (BEM) theory, as shown in the following Formula (1) [7]:
where: a is the axial induction factor and U1 and U2 are, respectively, the free wind velocity and the wind velocity hitting the front of the blade (the rotor’s plane), m/s.
In fact, to ensure structural strength, the blade sections near the center must be rounder and larger as the blade length increases. This will cause the total mass of the blade to increase accordingly. Therefore, we have explained in this paper that the increased mass may affect the Cp of the turbine. In such a case, to keep the value of Cp from decreasing, it is necessary to design so that the nominal wind speed increases accordingly. However, for areas with low wind speeds, this turbine must operate at wind speeds lower than the nominal wind speed. Then, the rotation speed of the rotor will be decreased and lead to a corresponding decrease in the aerodynamic efficiency of the turbine.
To fully design a wind turbine blade, aerodynamic design and blade load design are required. Aerodynamic design is influenced by the outer shape of the wind turbine blade. Most aerodynamic design goals are to maximize the ability to harness the energy in the wind to maximize the power output of the wind turbine. The airfoil load design depends on the internal structure of the airfoil and takes into account characteristics such as durability, stable operation, and vibration [8,9]. Different methods of designing and simulating wind turbine blades, such as the finite element method (FEM), -OpenFAST software [10], and Qblade [11], were studied. Specifically, to reduce the wind turbine blade weight and to analyze the blade load, the authors used a combination of OpenFAST software and the particle swarm optimization (PSO) algorithm [12]. Another study used the BEM and FEM theories and a multi-target genetic algorithm to get the maximum power output and minimum blade mass [13].
Blade models operating in low wind speed regions will often have a flow separation from the wind turbine blade’s upper surface. This flow separation is due to an adverse pressure differential across the blade surface as a result of the influence of the blade thickness. When wind blows across the blade surface, it creates interactions and flow separation on the blade surface at low wind speeds or creates wake effects behind the blade at high wind speeds. This is a physical interaction phenomenon between the fluid flow and the surface of a solid object. When the wind speed is high, the incoming flow will dominate the flow that hits the surface and is bounced back. Therefore, there is no flow separation phenomenon right on the blade surface. On the contrary, when the incoming flow and reverse flow have approximately the same magnitude, they will interact to create vortices right on the blade surface, causing the phenomenon of flow separation to appear. Flow separation can occur on the blade surface even under low and high Reynolds number conditions. This phenomenon can be divided into two cases: a laminar separated shear layer and a turbulent separated shear layer. Under low Reynolds number conditions, the first case will dominate and form a wide wake region at the upper, rear part of the blade. The laminar boundary layer separation phenomenon reduces lift force and increases drag force, leading to a decrease in the wind energy extraction efficiency of the blade [14,15]. According to [14], the authors have tested the NACA 0025 airfoil model experimentally with a chord of 0.3 m and Reynolds numbers of 55,000, 100,000, and 150,000. The obtained results show that the laminar flow separation phenomenon occurs when the Reynolds value is 55,000 and the turbulent flow separation phenomenon begins to appear when the Reynolds value is 150,000. Some similar results are also published in [15].
For a fixed low wind speed value region, this phenomenon will only depend on the thickness and curvature of the blade pattern. In this study, we propose a method to change the thickness and curvature of the airfoil pattern, then to determine which airfoil pattern is least affected by this laminar flow separation phenomenon. From there, the airfoil model with the best aerodynamic performance in a wind speed range of 4–6 m/s was determined. Several studies have shown the effect of the blade thickness on the aerodynamic performance. A sample of 18% thicker wind turbine blades operating in a Re coefficient region from 2 × 10⁵ to 3 × 10⁵ showed a higher efficiency than the original blade model in low wind speed conditions [16]. Another study showed that when the maximum thickness was increased to 28.5%, the power factor did not change and the starting torque was better (i.e., the starting wind speed decreased [17,18]). However, when the thickness of the wind turbine blades exceeds the permissible limit, it will cause difficult starting torque due to the large drag coefficient, particularly in a low angle of attack (AOA) region. On the other hand, the NACA 2412 airfoil works well in low wind speed conditions with a maximum camber of 0.02 times and a maximum thickness of 0.12 times the chord [19,20]. The vortex generator mounted on the surface of the wind turbine blade was tapered and eliminated the delamination bubble at the higher angle of attack [21].
The thickness of the wind turbine blades in low wind speed conditions is designed to be thinner to reduce adverse pressure differentials [22,23]. Some original blade models operating in low wind speed areas have launched, including specific applications of those airfoils in different areas. Specifically, NREL introduced seven blade pattern sequences with 23 different models for horizontal axis wind turbines [24]. The Delft University of Technology (DUT) wind turbine blade models have chord thicknesses ranging from 15 to 40% [25]. Three series of Risø blade samples were presented and tested in wind tunnels for wind turbines of several hundred kilowatts to megawatts [26]. For small wind turbines, the Re coefficient is usually less than 5 × 10⁵ [27,28]. Research on airfoils of the form SG6040–SG6043 at a Re coefficient from 1 × 10⁵ to 5 × 10⁵ also showed a good performance [29]. Some optimization studies to calculate the shape of wind turbine blades focus on increasing the radius of the tip and reducing the curvature of the wind turbine blades [30,31,32]. An important issue with wind turbine blades operating at low wind speeds is having a good starting torque [5,33]. Other research from the NACA 2412 showed that the lift increased at various angles of attack [34]. Thus, to optimize the aerodynamics and structure of the wind turbine blade model at low wind speeds, it is necessary to consider parameters such as the chord, torsion, tip radius, and thickness. For small wind turbines, the aerodynamic design parameters and wind turbine blade structure are considered to be variables [35]. The chord and torsion angle are considered as variables to maximize the power of small wind turbines. The starting wind speed and power output are the objective functions [36].
By 2022, Vietnam had many large wind power projects with a total capacity of 4667 MW in operation. These systems focus on exploiting areas with good wind speeds, and the wind turbines are all imported. With the best-rated wind energy potential in Southeast Asia, Vietnam has many opportunities to develop wind energy on both large and small scales. However, research on wind turbine blade models operating in low wind areas in Vietnam is completely lacking.
This paper present a method to design an optimal blade model suitable for low wind speeds as a basis for designing wind turbine blades suitable for Vietnam’s wind conditions, using XFLR5 and computational fluid dynamics (CFD) simulation tools. The CFD simulation has been widely used to analyze the influence of airflow on the blade model and the entire blade of a wind turbine [34]. This method can accurately simulate boundary layers on the whole airfoil. The publicized original airfoils were considered and selected from famous organizations [37,38]. The shape of the original S1010 airfoil will be adjusted to design a new airfoil for increasing the aerodynamic efficiency by using the V6.57 XFLR5 software. Then, the new airfoil is simulated in a low wind speed region to estimate the aerodynamic performance of the airfoil. The focused parameters for improving the aerodynamic performance are the maximum thickness, maximum thickness position, maximum curvature, and maximum curvature position. The results of this study help to better understand the new airfoil design method and improve the blade performance in low wind speeds. From there, it is possible to build a complete wind turbine blade with a high aerodynamic efficiency for further studies.
This paper is organized into four sections. Section 2 presents the methodology, explaining the techniques used in the research. Section 3 describes the application of the methodology and results, providing detailed insights and analysis. Section 4 offers a comparison of the results with existing studies, followed by a discussion of the findings. Finally, Section 5 concludes this paper, summarizing the key outcomes and implications of the research.
2. Methodology
This section details the comprehensive methodology employed for designing a wind turbine blade model using the XFLR5 and CFD simulation tools, based on Ansys Fluent-2023 student version. The methodology encompasses several crucial steps, each aimed at optimizing the aerodynamic performance of the blade under low wind speed conditions:
- Step 1: Selection of airfoil models.The initial step involved selecting suitable airfoil models that have been proven to perform effectively in low wind speed conditions, typically ranging from 4 m/s to 6 m/s. This selection was based on a thorough review of the existing literature and previous studies that identified the airfoil models capable of stable operation under such conditions. The data on the original airfoil samples were sourced from website [36]. The blade models were selected from the original blade models that operate stably in low wind speed conditions from 4 m/s to 6 m/s.
- Step 2: Modify the airfoil model using XFLR5 software.Once the airfoil model was selected, the next step was to import the original airfoil data into the XFLR5 software. This software is adapt at analyzing the aerodynamic properties of airfoils, particularly at low Reynolds numbers. The process of data importation was followed by reverse engineering to adjust the key geometric parameters. Specifically, the parameters of maximum thickness and the position of maximum thickness were modified. These adjustments aimed to enhance the lift-to-drag ratio (CL/CD), thereby improving the overall aerodynamic efficiency of the airfoil. This step was critical in tailoring the airfoil geometry to better suit the operational requirements of low wind speed conditions.The XFLR5 software was used to analyze the wind turbine blade at a low Re number. The lift coefficient, drag coefficient, and lift/thrust coefficient ratio were evaluated with different angles of attacks at a low Re number.When the number of panels had been determined, XFLR5 calculated the velocity and the AoA values on the surface of each panel, thereby determining the values of vortex strength (), lift force (L), and drag force (D) over the entire surface of the airfoil. The characteristic values, such as the pressure coefficient (Cp), lift coefficient (CL), and drag coefficient (CD), of the airfoil were determined as in Equations (2)–(5):where: c is the chord of the airfoil [m]; ρ is the density of air [kg/m3].The formula for calculating the Reynolds number to the flow velocity at any position in the model is given as follows:
- Step 3: Model selection and evaluation using computational fluid dynamics (CFD).The modified airfoil model was then built and analyzed using a CFD simulation. Initially, the new airfoil models were created by changing the MT and MC (MT is the maximum thickness and MC is the maximum camber of the airfoil) characteristics based on the S1010 model. Then, all the samples were analyzed based on the CFD model. This model helps determine the interaction processes of the incoming flow with each position on the surface of the blade samples. This entire calculation process was based on equations such as the conservation of mass, conservation of energy, and conservation of momentum. This system of equations is commonly known as the Navier–Stokes system of equations. Solving these conservation equations is based on the Reynolds-Averaged Navier–Stokes (RANS) method. The accuracy and convergence of this method depends largely on the selection of the model parameters such as the mesh size, the thickness of the first mesh layer in contact with the airfoil surface, the number of mesh layers, and the size of the space surrounding the airfoil pattern. The RANS equations for the wind velocity variable are defined in Cartesian coordinates as in the following equation system (6):where: is the density of the air, kg/m3; is the dynamic viscosity of the air, Pa.s; and is the Reynolds stresses. Once the wind speed at each point was determined according to the system of Equation (6), the lift forces L and drag forces D of the corresponding airfoil model were also calculated. From there, the values of the lift coefficient CL and drag coefficient CD of the airfoil model were also found based on Formulas (1) and (2). The k-ε turbulence model was employed to simulate the airflow around the airfoil. The turbulence model used in this study was the Realizable k-ε Turbulence Model, as shown in Equation (7):where: andS is the scalar measure of the deformation.The values σk, σε, C1ε, C3ε, C1, and C2 are constants.The simulation results, including the lift coefficient (CL), drag coefficient (CD), and the lift-to-drag ratio (CL/CD), were compared with those of the original airfoil to evaluate the improvements in low wind speed conditions from 4 m/s to 6m/s.
- Step 4: Final model selection.The final step in the methodology was the detailed design of the airfoil, incorporating the dimensions that would optimize its aerodynamic performance. These dimensions were selected based on the simulation results and aimed at maximizing the efficiency of the wind turbine blade. The design specifications were meticulously chosen to ensure that the blade could harness low wind speeds effectively, thereby enhancing the overall performance of the wind turbine.
3. Application and Results
Much previous research has published suitable wind turbine blades in low wind speed conditions [24,25,26,36,37,38,39]. In this paper, the S1010 airfoil was specifically chosen due to its demonstrated stability and favorable aerodynamic characteristics in low wind speed environments, as shown in Figure 1. The parameters of the maximum thickness and maximum thickness position were analyzed to obtain a better CL/CD ratio.
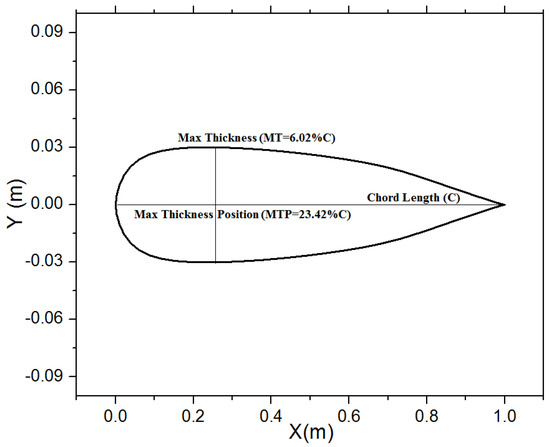
Figure 1.
Two-dimensional design of S1010 airfoil.
To determine the reliability of the CFD model in this paper, the NACA64A010 and S1210 airfoils were used [40]. NACA64A010 is a symmetrical airfoil, similar to S1010 and analyzed under the Reynolds number of 203,100. Some effects of the mesh characteristics on the simulation results were also determined as in [41].
Similarly, S1210 is an asymmetrical airfoil, similar to VAST-EPU-S1010 and analyzed under the Reynolds number of 204,100 [40].
A comparison of the results obtained from the CFD model and previously published experiments is shown in Figure 2 and Figure 3. The deviation between the results is very small, which proves that the CFD model used in this study has an acceptable accuracy.
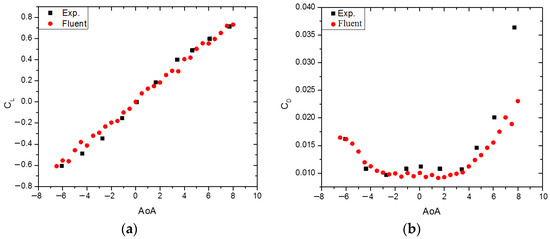
Figure 2.
CL and CD coefficients of NACA64A010 according to the angle of attack: (a) CL coefficient; and (b) CD coefficient.
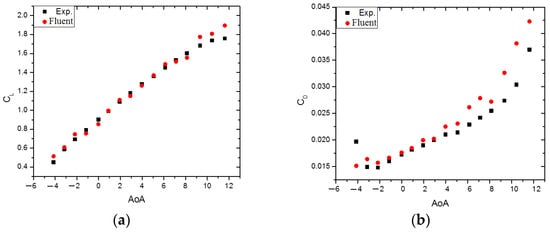
Figure 3.
CL and CD coefficients of S1210 according to the angle of attack: (a) CL coefficient; and (b) CD coefficient.
The S1010 airfoil was analyzed using XFLR5 with a wind speed of 5 m/s and an AoA that ranged from an AoA = −10° to AoA = 15°. The results show that the (CL/CD)max = 47.62 at an AoA = 5°, as shown in Figure 4.
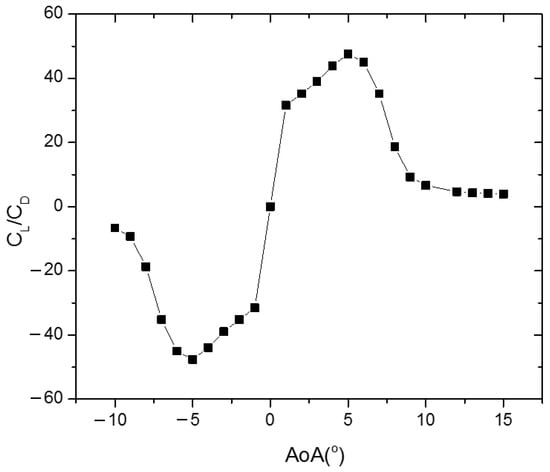
Figure 4.
CL/CD coefficient of S1010 changes with AoA at wind speed of 5 m/s.
The parameters of the S1010 airfoil model were adjusted to create new models. There were eight new airfoil models surveyed and named based on the maximum thickness (MT) and maximum camber (MC) values, respectively: S86.5, S68, S87.5, S69.5, S8.6, S67.5, S810, and S612.5, as shown in Figure 5. The analysis results show that the airfoil with a MT = 8 and MC = 6.5 has the largest (CL/CD)max value. From here, this airfoil model was selected to build a more accurate analysis model using the CFD method, and the name of the selected model was VAST-EPU-S1010. A new VAST-EPU-S1010 airfoil model was proposed, as shown in Figure 6. The new airfoil had changed maximum thickness, maximum thickness position, maximum camber, and maximum camber position values. The parameters of the S1010 and VAST-EPU-S1010 airfoils are listed in Table 1. For the airfoil models with symmetrical layouts, the wind interaction process on the top and bottom sides of the airfoil model was almost the same. From there, the lift and drag forces were approximately the same, leading to the CL/CD ratio of model S1010 (symmetrical) having a small value. In contrast, for the asymmetric airfoil models, the wind interaction process at the two surfaces was very different. For the lower surface, due to the appropriate curvature, large lifting forces from the vortices were created, helping the CL/CD ratio of these models to increase sharply. Therefore, when designing with different wind speed value regions, finding an airfoil model with the appropriate curvature is very necessary and can bring great benefits in the efficiency of wind energy exploitation.
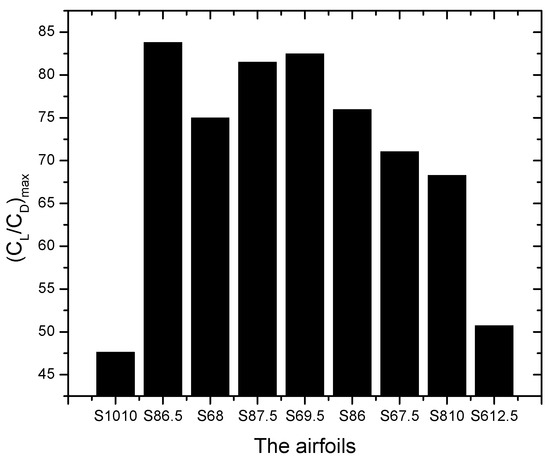
Figure 5.
The (CL/CD)max coefficient depends on the different airfoil models.
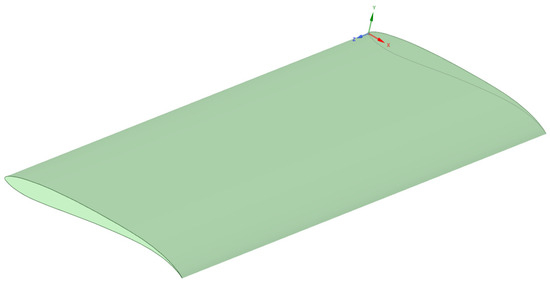
Figure 6.
Three-dimensional design of VAST-EPU-S1010 airfoil.

Table 1.
Airfoil model parameters of S1010 and VAST-EPU-S1010.
4. Comparison Results and Discussion
In this section, the efficiency performance of the new airfoil model VAST-EPU-S1010 are evaluated and compared with the original airfoil S1010 under the impacts of various factors. Specifically, the effects of low wind speed conditions, variations in the angle of attack (AoA), and changes in the airfoil thickness are the focus. These simulations aim to provide a comprehensive understanding of how these parameters influence the aerodynamic performance and overall efficiency of the new wind turbine blade model.
The CFD simulation software, Ansys Fluent-2023 student version, was used to simulate the split flows on the surface of the airfoil. The airfoil was built in a two-dimensional model using the SpaceClaim graphics software, it’s belong to Ansys Fluent-2023 student version. The distance from the inlet layer to the tip of the airfoil was 6m, and the distance from the endpoint of the airfoil to the outlet layer was 18 m. The boundary conditions included the inlet surface, the outlet surface, the airfoil’s surface, and the model’s symmetry surface, as shown in Figure 7.
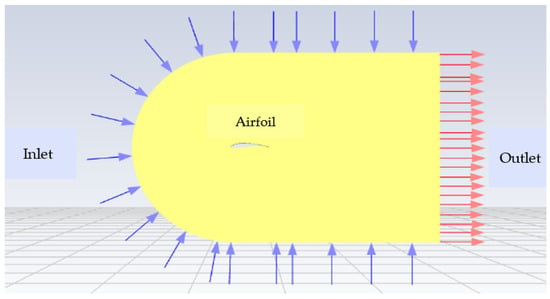
Figure 7.
Computational domain around VAST-EPU-S1010 airfoil.
The models were meshed with a combination of triangular and quadrangular grids, with an average mesh size of 0.03 m. The boundary condition layer surrounding the airfoil was divided into a quadrangular grid, with the size of the first mesh layer adjacent to the surface of the airfoil being 0.005 m. The total number of these boundary condition classes was five layers, and each layer had a difference of 1.1 times, as exhibited in Figure 8.
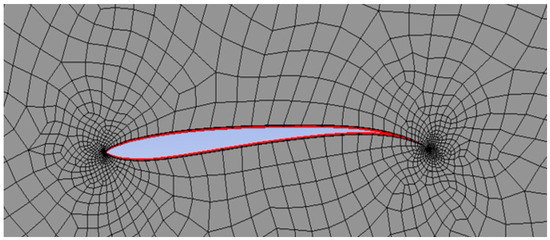
Figure 8.
Mesh around VAST-EPU-S1010 airfoil.
The total number of the meshes of the models built in this paper was approximately 300,000 meshes, and the mesh quality of each model was 0.95 or more. This value ensures the convergence of the models. The details of the comparison results are presented in the next subsections.
4.1. Airfoil Performance in Low Wind Speed Regions
To evaluate the effect of wind speed on aerodynamic performance, the lift coefficient (CL), drag coefficient (CD), lift/drag coefficient ratio, and the relationship between the lift and drag coefficient were considered when the AoA varied from −10° to 15°. The analysis parameters of the Ansys Fluent software, 2023 student version, for the two airfoils were the same, only changing the wind speed from 4–6 m/s. The comparison results are shown in Figure 9.
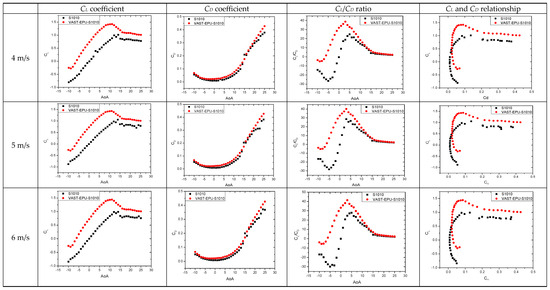
Figure 9.
Effect of AoA on CL and CD coefficients and CL/CD ratio at various speeds.
From Figure 9, it can be seen that the lift coefficient CL reaches the maximum values of 1.422, 1.433, and 1.442 with wind speeds of 4–6 m/s at the angle of attack of 11°. The tendency of the lift coefficient is to increase rapidly from −9° to 11°, then decrease in the range of 11° to 15°, and finally decrease slightly at the remaining angles of attack. The simulation results indicate that the maximum lift coefficient for the new airfoil, VAST-EPU-S1010, is 35.7% to 45.5% higher than that of the original S1010 airfoil. The value of the drag coefficient CD decreases gradually in the range of the AoA from −10° to 0°, increases slightly for the angle of attack from 0° to 5°, and finally increases rapidly at the higher angles of attack. Clearly, the flow separation phenomenon has created a large difference between the two airfoil designs. The S1010 airfoil model has two symmetrical faces, so the flow separation phenomenon on both faces has the same magnitude but opposite directions. This does not contribute to the increase in the lift force. In contrast, the VAST-EPU-S1010 model has two different curvatures, and the upper surface tends to be flat and only curves heavily at the ends. This prevents the flow from separating from the upper surface layer. The lower surface has a large curvature and is concave at the tip of the airfoil and curved high at the tail of the airfoil, helping the incoming wind flow stream to stick close to the surface, increasing the value of the lift force and reducing the value of the drag force.
The relationship figures between the CL and CD coefficients in the simulation results show that the new airfoil has a higher value than the original airfoil. To provide a more comprehensive comparison, Figure 10 consolidates the new airfoil’s CL/CD ratio values at wind speeds of 4, 5, and 6 m/s. The optimal value of the aerodynamic efficiency are the maximum CL/CD ratio values of 38.74, 40.14, and 41.32 at an AoA of 3° with wind speeds of 4, 5, and 6 m/s, respectively. These maximum CL/CD values do not differ much. This clearly shows that the flow separation phenomenon for wind speeds in the range of 4–6 m/s almost do not change for the same airfoil design.
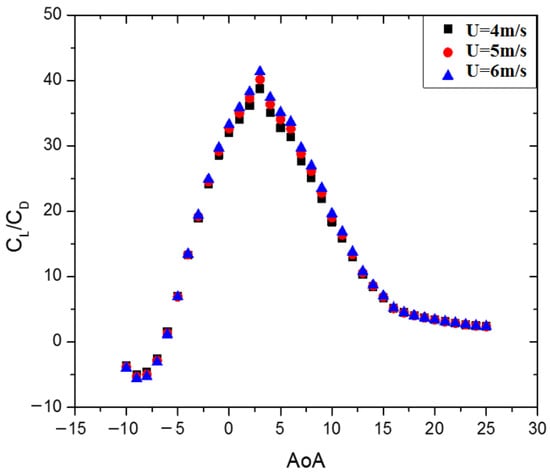
Figure 10.
Effect of the wind speed on the maximum CL/CD ratio values.
4.2. Effect of Angle of Attack on the Airfoil Performance
To understand more about the effect of the AoA on the performance of the airfoil, the velocity contours and velocity vectors around the airfoil are evaluated in this section. The simulation results for the velocity contours and the velocity vectors are shown in Figure 11 and Figure 12 for the angles of attack of −5°, 0°, 5°, 10°, and 15°. The CL and CD depend on the Reynolds number, but they also depend on the thickness, the curvature of the airfoil pattern, and the angle of attack during actual operation. In this study, our main purpose is to provide a method and to find an airfoil design with the most suitable thickness and curvature parameters for the wind speed region of 4–6 m/s and then to give the quantitative comparison values. The results show that the same airfoil design operating at a wind speed of 6m/s will have a 6% higher efficiency than at a wind speed of 4 m/s. This result can also contribute to the actual control and operation of these turbines.
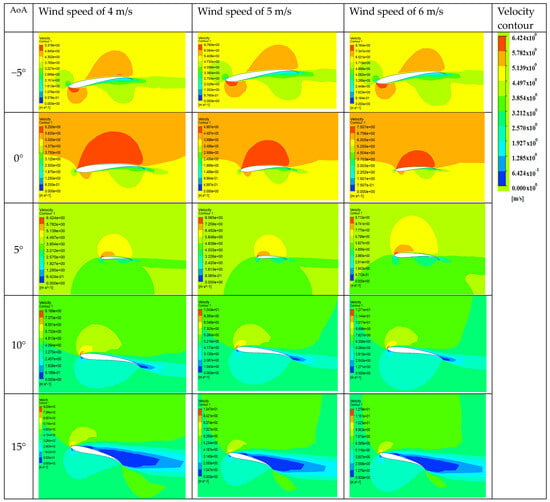
Figure 11.
Velocity contour comparative analysis of the impact of the angle of attack (AoA) at various speeds.
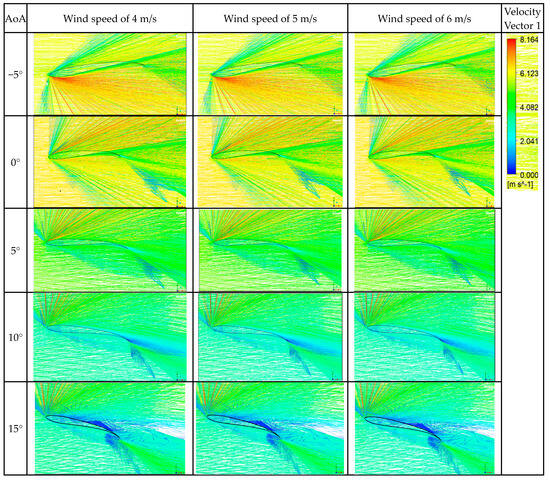
Figure 12.
Velocity vector comparative analysis of the impact of the angle of attack (AoA) at various speeds.
At the angle of attack of −5°, the airfoil edge underside and the tail upper side have a high velocity, which is indicated by the orange color. At the angle of attack of 0°, around the maximum CL/CD ratio value, the red and orange colors can be seen covering the entire upper surface of the airfoil, which means that the aerodynamic efficiency is great within this AoA region. The angle of attack of 5° shows that around the upper surface of the airfoil, the yellow color covers most of the surface, the orange color occupies about 40% of the upper surface area, and very little of the red color remains at the tip of the airfoil. The angle of attack of 10° exhibits the beginning of the zero-velocity region on the underside of the edge of the airfoil and the tail of the upper side of the airfoil. At an angle of attack of 10°, a delamination layer begins to appear on the surface of the airfoil at the tail. When the AoA is 15°, the area of the flow velocity equal to 0 extends to almost the entire upper surface of the airfoil at the angle of attack of 15°.
It can be seen that, when the airfoil rotates to change the angle of attack, the wind velocity passing over the upper surface of the airfoil will move faster than the wind velocity moving along the lower edge of the airfoil. The increased velocity at the upper curvature creates a corresponding pressure drop in that region. The appearance of vortices at the lower curvature of the airfoil leads to a higher pressure below, as seen in Figure 11. Thus, the range of the angle of attack from 0 to 5 degrees is the area where the airfoil operates with the best performance. If the angle of attack goes beyond this range, the aerodynamic efficiency is reduced due to the reduction in lift and the increase in drag.
In Figure 12, the direction of the vector and the magnitude of the velocity are shown in colors from blue to red. At a 0° angle of attack, the red and orange velocity vectors account for a large proportion; at other angles of attack, this number of vectors is significantly reduced as the angle of attack is higher. At the 10° angle of attack, velocity vectors with different directions appear at the tail end of the airfoil. Seen more clearly with a 15° angle of attack, the magnitude and direction of the velocity vector form vortices on the surface of the airfoil. This phenomenon occurs at a high angle of attack because the friction force of the airflow with the surface of the airfoil increases significantly against the inertia force of the wind. Furthermore, with a larger angle of attack (see where the angle of attack is 10 degrees), gradually wider separation layers appear, due to increased vortices on the upper airfoil. Thereby, the airfoil performance is reduced.
With the above simulation results, it can be seen that, when increasing the larger angle of the AoA, the delamination layer begins to appear gradually from the tail of the airfoil. The direction and magnitude of the eddies are expressed as the velocity vectors. The higher the angle of attack, the more turbulent the eddies on the surface of the airfoil. This phenomenon will cause significant drag on the airfoil.
4.3. Effect of Thickness on the Airfoil Performance
In this section, the CL/CD ratio, which indicates the effect of the thickness on the airfoil performance, is evaluated at the optimal angle of attack of 3° at wind speeds of 4–6 m/s. The simulation results are shown in Table 2.

Table 2.
CL/CD ratio value at AoA = 3°, according to different blade thicknesses.
At a wind speed of 4 m/s, the maximum value of the CL/CD ratio reaches 38.739 at a maximum thickness of 8%. Similarly, at wind speeds of 5 m/s and 6 m/s, the maximum values of the CL/CD ratio are 40.141 and 41.323 at the maximum thickness of 8%, respectively, as shown in Figure 13. Figure 14 illustrates the velocity contour changing with the thicknesses varying from 6 to 9%
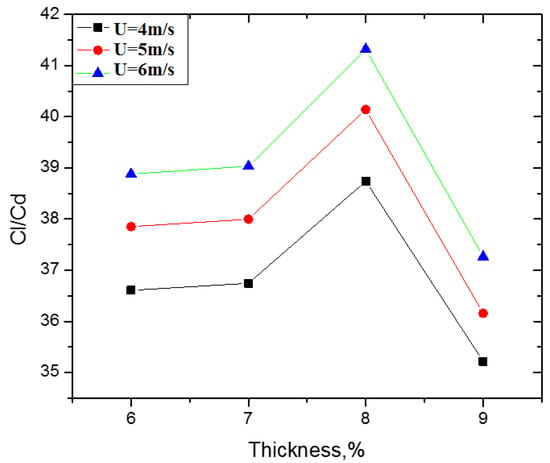
Figure 13.
Optimal value of CL/CD ratio at the AoA = 3°, according to different maximum thicknesses.
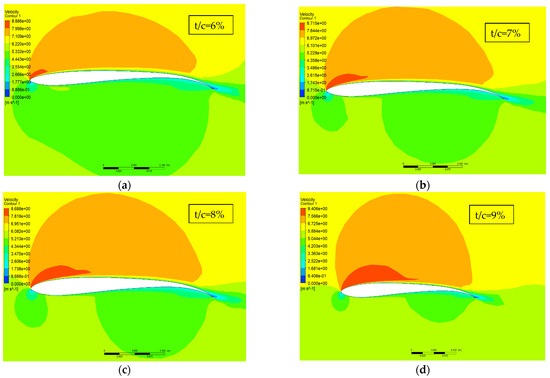
Figure 14.
Velocity contour with thicknesses varying from 6–9%: (a) t/c = 6%; (b) t/c = 7%; (c) t/c = 8%; and (d) t/c = 9%.
From Figure 14, it can be seen that, as the blade thickness increases, the surface velocity increases, represented by the red and orange areas. The simulated results at the optimal angle of attack of 3° and a wind speed of 6 m/s for airfoil with thickness, t/c, of 6% and 7% show a smaller velocity contour on the upper surface compared to airfoils with thicknesses of 8% and 9% This is due to the effect of the airfoil thickness caused when the airflow impacts the airfoil’s leading edge. For an airfoil with a thickness t/c of 8%, the suction surface has a velocity contour with a larger green area, so the performance of an airfoil thickness of 8% is higher than that of 9%. Looking at the figure, the difference in the upper and lower surface pressures at the maximum thickness of 8% is higher than at other thicknesses, resulting in the highest aerodynamic efficiency of the airfoil model.
In summary, the flow separation phenomenon for low wind speed regions has little difference for the same airfoil design. However, this phenomenon has a big change for airfoil designs with a different thickness curvature and when the wind comes with different attack angles. The obtained results show that the airfoil design with a maximum thickness of 8%, a maximum thickness position of 20%, and an attack angle of 3° will give the best wind energy exploitation efficiency, suitable for designing small capacity wind turbines operating at nominal wind speeds in the range of 4–6 m/s.
5. Conclusions
In this paper, a new wind turbine blade model, VAST-EPU-S1010, redesigned based on the original blade model S1010, was created considering the maximum thickness and maximum thickness position. The performance of the new airfoil was simulated by using CFD under low wind speeds conditions. The lift coefficient, drag coefficient, and lift/drag ratio were evaluated under the influence of different angles of attack from -10° to 15°. Some of the results are summarized as follows:
- The new VAST-EPU-S1010 airfoil was redesigned and simulated in low wind speed conditions of 4–6 m/s. The maximum value of the lift/drag ratio of the new airfoil increased from 35.7% to 45.5% compared to the original airfoil model. The maximum value of CL/CD was 41.32 at a wind speed of 6 m/s. Furthermore, the wind speed also affected the CL/CD ratio, with the maximum value of CL/CD at 6 m/s being higher than at 4 m/s by about 6.25%.
- At a low wind speed, the influence of the angle of attack from −5°–15° was also simulated and evaluated. The results show that the airfoil efficiency around the optimal angle of attack of 3° was the highest and that the airfoil efficiency decreased as the angle of attack increased. From an angle of attack of 10° or more, the tail of the airfoil appeared as a separate layer and the velocity vector moved in different directions. The higher the angle of attack, the earlier the separation layer appeared and occupied a larger surface area of the airfoil.
- Thickness also affects the aerodynamic performance of the airfoil. The new VAST-EPU-S1010 airfoil model was optimized at a maximum thickness of 8% and a maximum thickness position of 20.32%.
The performance of the VAST-EPU-S1010 airfoil, improved through redesigning the shape of the original airfoil, showed increases in aerodynamic performance. The improved CL, CD, and CL/CD ratios were demonstrated through the simulation results due to the changes in the airfoil’s shape. The changes in the shape of the airfoil were the maximum thickness, the maximum thickness position, the maximum camber, and the maximum camber position. The airfoil shape was aerodynamically studied and exhibited improved aerodynamic performance in low wind speed regions of 4–6 m/s.
Future work: With the above simulation results, it can be seen that there is still a lot of opportunity to improve the efficiency of the wind turbine and reduce the starting wind speed for the wind turbine in low wind speed conditions. With increasingly modern simulation tools and the application of artificial intelligence algorithms, the ability to optimize the blade pattern and the entire wind turbine blade will increase. Soon, an optimal design method for wind turbine blades will be developed to improve the power production efficiency in low wind speed conditions. The method will apply a combination of artificial intelligence tools to select the optimal parameters of the chord, thickness, and airfoil length. The simulation results will be compared with the original airfoil and the complete design of the wind turbine blade using the new airfoil. In addition, after a simulation with positive results, as above, real airfoils should be fabricated and tested in the wind tunnel to further evaluate the actual results.
Author Contributions
Conceptualization, D.V.T., N.T.T.H. and Q.T.T.; methodology, T.P. and N.H.D.; validation, L.Q.S., L.T.T.H. and C.T.T.H.; writing—original draft preparation, L.Q.S., D.V.T., N.H.D. and C.T.T.H.; and writing—review and editing, L.Q.S., N.H.D. and Q.T.T. All authors have read and agreed to the published version of the manuscript.
Funding
This research was funded by the Vietnam Academy of Science and Technology (VAST), Code VAST07.01/22-23.
Data Availability Statement
All data are presented in this paper.
Acknowledgments
This work was supported by the Institute of Science and Technology for Energy and Environment (ISTEE), which belongs to the Vietnam Academy of Science and Technology (VAST).
Conflicts of Interest
The authors declare no conflicts of interest.
References
- GWEC. Global Wind Report 2023; GWEC: Brussels, Belgium, 2023; 120p. [Google Scholar]
- IEC 61400-1; International Standard. Wind Turbines—Part 1: Design Requirements. Version 3. IEC: Geneva, Switzerland, 2005.
- Singh Ronit, K.; Rafiuddin Ahmed, M. Blade design and performance testing of a small wind turbine rotor for low wind speed applications. Renew. Energy 2013, 50, 812–819. [Google Scholar] [CrossRef]
- Clifton-Smith, M.; Wood, D.; Wright, A. Optimising wind turbine design for operation in low wind speed environments. Wind Energy Syst. 2011, 13, 366–387. [Google Scholar]
- Wright, A.K.; Wood, D.H. The starting and low wind speed behavior of a small horizontal axis wind turbine. J. Wind Eng. Ind. Aerodyn. 2004, 92, 1265–1279. [Google Scholar] [CrossRef]
- Cohen, J.; Schweizer, T.; Laxson, A.; Butterfield, S.; Schreck, S.; Fingersh, L.; Veers, P.; Ashwill, T. Technology Improvement Opportunities for Low Wind Speed Turbines and Implications for Cost of Energy Reduction; Technical Report NREL/TP-500-41036; National Renewable Energy Laboratory: Golden, CO, USA, 2008. [Google Scholar]
- Manwell, J.; McGowan, J.; Rogers, A. Wind Energy Explained: Theory, Design, and Application, 2nd ed.; John Wiley & Sons Ltd.: Hoboken, NJ, USA, 2009; ISBN 978-0-470-01500-1. [Google Scholar]
- Xudong, W.; Shen, W.-Z.; Zhu, W.-J.; Sørensen, J.-N.; Jin, C. Shape optimization of wind turbine blades. Wind Energy 2009, 12, 781–803. [Google Scholar] [CrossRef]
- Maalawi, K.Y.; Negm, H.M. Optimal frequency design of wind turbine blades. J. Wind Eng. Ind. Aerodyn. 2002, 90, 961–986. [Google Scholar] [CrossRef]
- National Renewable Energy Laboratory. 2023. OpenFAST Documentation. Available online: https://openfast.readthedocs.io/en/main/ (accessed on 15 August 2023).
- Marten, D. The QBlade Software. 2023. Available online: https://qblade.org/ (accessed on 15 August 2023).
- Liao, C.C.; Zhao, X.L.; Xu, J.Z. Blade layers optimization of wind turbines using FAST and improved PSO. Renew. Energy 2012, 42, 227–233. [Google Scholar] [CrossRef]
- Zhu, J.; Cai, X.; Gu, R. Aerodynamic and structural integrated optimization design of horizontal-axis wind turbine blades. Energies 2016, 9, 66. [Google Scholar] [CrossRef]
- Yarusevych, S.; Sullivan, P.E.; Kawall, J.G. On vortex shedding from an airfoil in low-Reynolds-number flows. J. Fluid Mech. 2009, 632, 245–271. [Google Scholar] [CrossRef]
- Jones, G.; Santer, M.; Debiasi, M.; Papadakis, G. Control of flow separation around an airfoil at low Reynolds numbers using periodic surface morphing. J. Fluids Struct. 2018, 76, 536–557. [Google Scholar] [CrossRef]
- Healy, J. The influence of blade camber on the output of vertical-axis wind turbines. Wind Eng. 1978, 2, 146–155. [Google Scholar]
- Batista, N.; Melício, R.; Marias, J.; Catalão, J. Self-start evaluation in lift-type vertical axis wind turbines: Methodology and computational tool applied to asymmetrical airfoils. In Proceedings of the Power Engineering, Energy and Electrical Drives (POWERENG), 2011 International Conference, Malaga, Spain, 11–13 May 2011; pp. 1–6. [Google Scholar]
- Alam, M.; Iqbal, M. A low cut-in speed marine current turbine. J. Ocean Technol. 2010, 5, 49–61. [Google Scholar]
- Sogukpinar, H. The effects of NACA 0012 airfoil modification on aerodynamic performance improvement and obtaining high lift coefficient and post-stallairfoil. AIP Conf. Proc. 2018, 1935, 020001. [Google Scholar]
- Saxena, E.S.; Kumar, M.R. Design of NACA 2412 and its Analysis at Different Angle of Attacks, Reynolds Numbers, and a wind tunnel test. Int. J. Eng. Res. Gen. Sci. 2015, 3, 193–200. [Google Scholar]
- Lissaman, P.B.S. Low-Reynolds-number airfoils. Annu. Rev. Fluid Mech. 1983, 15, 223–239. [Google Scholar] [CrossRef]
- Clausen, P.D.; Wood, D.H. Research and development issues for small wind turbines. Renew. Energy 1999, 16, 922–927. [Google Scholar] [CrossRef]
- Giguere, P.; Selig, M.S. Low reynolds number airfoils for small horizontal axis wind turbines. Wind Eng. 1997, 21, 379. [Google Scholar]
- Tangler, J.L.; Somers, D.M. NREL Airfoil Families for HAWTs; National Renewable Energy Lab.: Golden, CO, USA, 1995. [Google Scholar]
- Timmer, W.A.; Van Rooij, R. Summary of the Delft University wind turbine dedicated airfoils. J. Sol. Energy Eng. 2003, 125, 488–496. [Google Scholar] [CrossRef]
- Fuglsang, P.; Bak, C.; Gaunaa, M.; Antoniou, I. Design and verification of the Risø-B1 airfoil family for wind turbines. J. Sol. Energy Eng. 2004, 126, 1002–1010. [Google Scholar] [CrossRef]
- Miley, S.J. A Catalog of Low Reynolds Number Airfoil Data for Wind Turbine Applications; Department of Aerospace Engineering Texas A&M University: College Station, TX, USA, 1982. [Google Scholar]
- Elizondo, J.; Martinez, J.; Probst, O. Experimental study of a small wind turbine for low- and medium-wind regimes. Int. J. Energy Res. 2009, 33, 309–326. [Google Scholar] [CrossRef]
- Giguere, P.; Selig, M.S. New airfoils for small horizontal axis wind turbines. ASME J. Sol. Energy Eng. 1998, 120, 108–114. [Google Scholar] [CrossRef]
- Anderson, J.D. Fundamentals of Aerodynamics, 3rd ed.; McGraw Hill: New York, NY, USA, 2001. [Google Scholar]
- McGranahan, B.D.; Selig, M.S. Aerodynamic Tests of Six Airfoils for Use on Small Wind Turbines; University of Illinois at Urbana-Champaign: Urbana, IL, USA, 2004. [Google Scholar]
- Henriques, J.C.C.; Silva, M.; Estanqueiro, A.I.; Gato, L.M.C. Design of a new urban wind turbine airfoil using a pressure-load inverse method. Renew. Energy 2009, 34, 2728–2734. [Google Scholar] [CrossRef]
- Ozgener, O.; Ozgener, L. Exergy and reliability analysis of wind turbine systems: A case study. Renew. Sustain. Energy Rev. 2007, 11, 1811–1826. [Google Scholar] [CrossRef]
- Venkatesan, S.P.; Kumar, V.P.; Kumar, M.S.; Kumar, S. Computational analysis of aerodynamic characteristics of dimple airfoil NACA 2412 at various angles of attack. Idea 2018, 46, 10. [Google Scholar]
- Dal Monte, A.; De Betta, S.; Castelli, M.R. Proposal for a coupled aerodynamic–structural wind turbine blade optimization. Compos. Struct. 2017, 159, 144–156. [Google Scholar] [CrossRef]
- Pourrajabian, A.; Ebrahimi, R.; Mirzaei, M. Applying micro scales of horizontal axis wind turbines for operation in low wind speed regions. J. Energy Convers. Manag. 2014, 87, 119–127. [Google Scholar] [CrossRef]
- Available online: http://airfoiltools.com/airfoil/details?airfoil=s1010-il (accessed on 15 August 2023).
- Grasso, F. ECN Airfoils for Large Offshore Wind Turbines Design and Wind Tunnel Testing. Wind Energy 2017, 2016, 2015. [Google Scholar]
- Li, X.; Yang, K.; Bai, J.; Xu, J. A method to evaluate the overall performance of the CAS-W1 airfoils for wind turbines. J. Renew. Sustain. Energy 2013, 5, 063118. [Google Scholar] [CrossRef]
- Selig, M.S.; Guglielmo, J.J.; Broeren, A.P.; Giguere, P. Summary of Low-Speed Airfoil Data; SoarTech Publications: Ann Arbor, MI, USA, 1995; Volume 1. [Google Scholar]
- Thin, D.V.; Duc, N.H.; Sang, L.Q. Aerodynamic Analysis of NACA64A010 Airfoil Using XFLR5 and ANSYS Fluent. GMSARN Int. J. 2024, 18, 258–266. [Google Scholar]
Disclaimer/Publisher’s Note: The statements, opinions and data contained in all publications are solely those of the individual author(s) and contributor(s) and not of MDPI and/or the editor(s). MDPI and/or the editor(s) disclaim responsibility for any injury to people or property resulting from any ideas, methods, instructions or products referred to in the content. |
© 2024 by the authors. Licensee MDPI, Basel, Switzerland. This article is an open access article distributed under the terms and conditions of the Creative Commons Attribution (CC BY) license (https://creativecommons.org/licenses/by/4.0/).
