1. Introduction
As global climate change intensifies, preventing environmental disasters caused by rising global temperatures has become an urgent priority [
1,
2]. Reducing CO
2 emissions is crucial for combating climate change, air pollution, and global warming. The International Energy Agency (IEA) global energy assessment report underscores this view, emphasizing the critical role of renewable energy technologies in reducing greenhouse gas emissions. Among these technologies, photovoltaic (PV) power generation stands out as a clean and sustainable energy source, attracting widespread attention due to its significant environmental and economic benefits [
3]. Although other renewable energy technologies also contribute to the development of renewable energy, PV power generation offers unique advantages in terms of investment costs, returns, applicability, and energy output [
4,
5,
6,
7,
8].
However, investment in PV projects is characterized by high uncertainty and complexity. Traditional investment evaluation methods, such as net present value (NPV) analysis, while providing a static assessment of investment returns, fail to fully capture the investment flexibility and future uncertainties of PV projects at different points in time [
9,
10]. Therefore, the deferral option model, as a real options approach, offers a more scientific and flexible tool for investment decision making [
11,
12,
13].
Environmental, social, and governance (ESG) factors are becoming increasingly important for corporate development due to their financial, legal, reputational, and strategic implications. ESG factors not only impact a company’s long-term sustainability but also directly relate to its reputation, legal risks, and market competitiveness [
14,
15]. For PV project investments, incorporating ESG factors into the evaluation system enhances the environmental benefits and social acceptance of the projects. Additionally, it can significantly reduce the risks and costs associated with the projects, thereby increasing their overall value [
16,
17].
Although considerable research has focused on the application of real options models in renewable energy investments, studies that systematically incorporate ESG factors into deferral option models remain relatively scarce. The existing research predominantly concentrates on the quantification of environmental benefits, while comprehensive consideration of social and governance factors remains insufficient [
18]. Furthermore, how to quantify and integrate these multidimensional ESG factors into the deferral option model remains an unresolved issue [
19,
20]. Therefore, this study aims to fill this research gap by constructing a deferral option model that includes ESG factors, providing more comprehensive and scientific support for investment decisions in PV projects.
The objectives of this study are threefold: firstly, to analyze the investment value of PV projects under uncertainty using the real options approach, thereby providing investors with a more scientific basis for decision making; secondly, to broaden the dimensions of investment decisions by incorporating ESG factors, promoting the optimal allocation of PV projects under both economic and social benefits; and thirdly, to provide theoretical support for policy-makers, encouraging PV projects to achieve economic growth while maximizing their social and environmental benefits, thereby contributing to the realization of global sustainable development goals.
The contributions of this study include the following aspects:
Enhancing project value by integrating ESG factors: The environmental benefits achieved through carbon reduction, social benefits from job creation, and governance benefits supported by favorable policies collectively improve the project’s value.
Optimizing investment timing: Utilizing Monte Carlo simulation and the Least Squares Monte Carlo method, the model identifies January 2024 as the optimal investment timing, thereby maximizing the project’s economic returns.
Policy impact: This study underscores the importance of establishing stricter carbon trading markets and policy incentives to promote the widespread adoption and sustainable development of renewable energy projects.
In the following sections, we review the relevant literature, present the methodology, discuss the empirical analysis, provide policy recommendations, and conclude the paper.
2. Literature Review
Real options theory originated from financial options pricing models, particularly the Black–Scholes model, which views investment decisions as option operations, providing flexibility for investors in uncertain environments [
21]. Myers (1977) first introduced the concept of real options, applying it to capital budgeting and corporate investment decisions [
22]. Dixit and Pindyck (1994) systematically elaborated on the theoretical foundations and application methods of real options, establishing a seminal work in this field [
17]. In the renewable energy sector, real options models have been widely used to evaluate project investments [
23]. The uncertainties in investment decisions primarily stem from market price fluctuations, technological advancements, and policy changes [
9]. Trigeorgis (1996) highlighted that real options models can effectively capture these uncertainties, offering investors a more flexible decision-making basis [
24]. Recently, Liu et al. (2021) and Martins et al. (2018) applied real options models to evaluate investment decisions in wind and PV projects, respectively, demonstrating the efficacy of this model in the renewable energy domain [
25,
26].
ESG encompasses three factors: environmental, social, and governance. Environmental factors (E) include carbon emissions, resource use efficiency, and environmental impact [
12]. Social factors (S) involve labor relations, community impact, and health and safety [
15]. Governance factors (G) cover corporate governance structures, transparency, and regulatory compliance [
16]. Porter and van der Linde (1995) argued that good environmental management can improve resource use efficiency, thereby enhancing corporate competitiveness [
14]. Freeman’s (1984) stakeholder theory suggests that corporate social responsibility activities help improve reputation and market value. Shleifer and Vishny (1997) noted that good corporate governance can reduce agency costs and policy risks. Research by Eccles, Ioannou, and Serafeim (2014) found that companies considering ESG factors perform better financially in the long term compared to those that do not. Furthermore, the comprehensive consideration of ESG factors can enhance a company’s long-term sustainability and directly impact its financial performance and market competitiveness [
12].
As a crucial component of renewable energy investments, PV projects face significant challenges due to high initial investment costs and uncertainties in long-term returns. Swanson (2006) noted that the development of PV technology and market price fluctuations are critical factors influencing PV project investments [
27]. Huang et al. (2012), through empirical research, found that the investment return of PV projects is closely related to government subsidies and carbon reduction policies [
28]. Balibrea-Iniesta et al. (2020) suggested that real options models can effectively evaluate the investment value of PV projects, providing investors with more scientific decision support [
29]. Wang et al. (2022) indicated that the economic viability of PV projects varies significantly across different market environments, and that government policies and market incentives play a crucial role in investment decisions [
11].
Although there has been extensive research on the application of real options models in renewable energy investments, studies that systematically incorporate ESG factors into deferral option models remain scarce. Fuss et al. (2012) proposed that incorporating carbon reduction benefits into real options models can more accurately assess the investment value of renewable energy projects [
30]. Wang et al. (2022) highlighted the significant variation in the economic viability of PV projects across different market environments and emphasized the crucial role of government policies and market incentives in investment decisions [
9].
This study aims to address the following key question: how can ESG factors be scientifically integrated into the deferral option model for PV project investments in an uncertain market environment, and how does this integration impact investment decisions? This research question has several essential aspects: Firstly, traditional investment evaluation methods, such as NPV analysis, provide a static assessment of investment returns but fail to capture the investment flexibility and future uncertainties of PV projects at different points in time. Integrating ESG factors into the evaluation system not only enhances the environmental benefits and social acceptance of the projects but also significantly reduces the risks and costs associated with the projects, thereby increasing the overall value. Secondly, PV project investments are characterized by high uncertainty and complexity, primarily due to market price fluctuations, technological advancements, and policy changes. The real options model introduces the deferral option, providing investors with flexibility and scientific decision-making tools in uncertain environments. Thirdly, while considerable research has focused on the application of real options models in renewable energy investments, the systematic incorporation of ESG factors into deferral option models remains scarce. Quantifying and integrating these multidimensional ESG factors into the deferral option model is still an unresolved issue. Finally, this study empirically validates the effectiveness of the deferral option model that includes ESG factors, investigates the specific impacts of ESG factors on the value and risk of PV projects, and proposes corresponding policy recommendations based on the research findings.
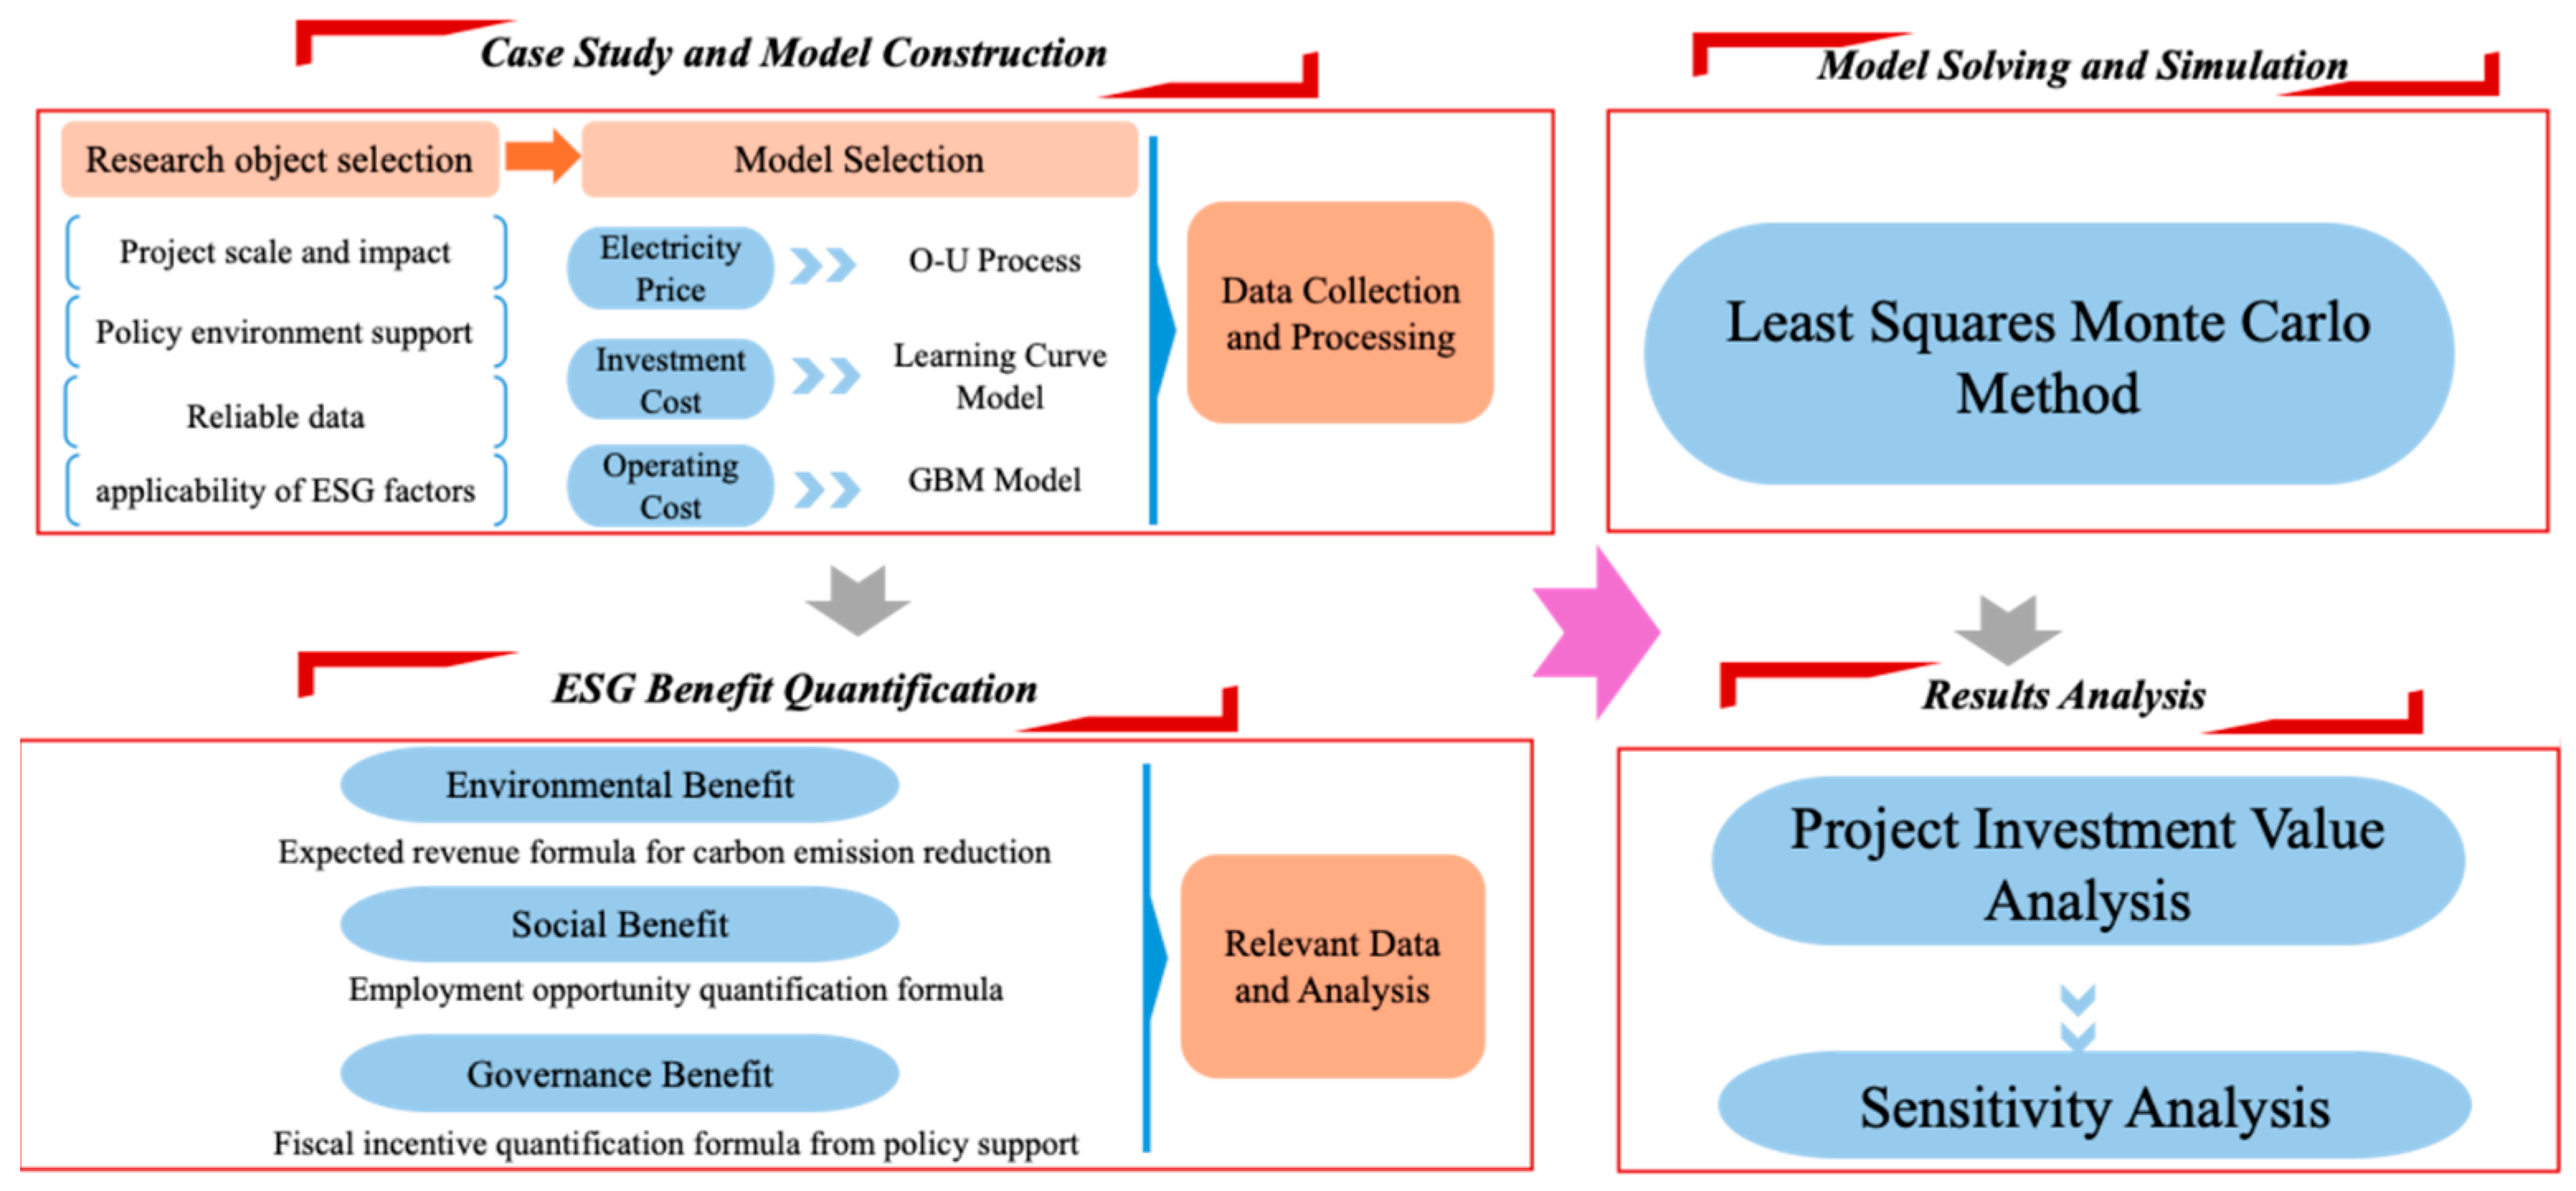
Figure 1 illustrates the research logic framework of this study, showcasing the entire process from selecting research subjects, choosing models, data collection and processing, quantifying environmental–social–governance benefits, model solving, and simulation, to result analysis. Through this systematic analysis framework, the study can scientifically quantify and integrate ESG factors, providing more comprehensive and scientific support for investment decisions in PV projects.
In summary, this research not only fills the theoretical gap in systematically incorporating ESG factors into the real options model but also provides scientific evaluation tools and policy recommendations for PV project investment decisions in practice. This has significant implications for promoting sustainable investment decisions and policy formulation in renewable energy projects.
3. Case Analysis and Model Construction
This section introduces the deferral option model used to evaluate PV project investments. To accurately reflect the uncertainty and flexibility in investment decisions, this study employs various mathematical and economic models, integrating ESG factors to provide a comprehensive and scientific evaluation framework for PV project investments. The following content elucidates the model with a specific case study. The selection of Jidian Co., Ltd.’s PV project (Room 108, Weifang Wanhai New Energy Technology Co., Ltd., Xincheng Street, Weifang High-tech Zone, Shandong Province.) as the case study subject is based on the following characteristics and reasons:
Jidian Co., Ltd.’s PV project is large-scale, achieving grid connection in 2023 with an expected annual average generation of 1491.3 h. The project has a cumulative installed capacity of 1500 MW, divided into three phases: the first phase of 230 MW has already achieved grid connection, the second phase of 850 MW is expected to connect by December 2024, and the third phase of 420 MW is anticipated to connect by 2025. This project’s scale and implementation provide a representative case with abundant data and lessons learned, offering valuable insights for similar projects.
- 2.
Policy environment support
Shandong Province, a major economic and energy hub in China, has a well-established electricity market trading mechanism and a supportive policy environment for renewable energy. This favorable policy and market condition facilitates the implementation of PV projects and helps study the impact of policies on PV project investment decisions.
- 3.
Detailed and reliable data
As a pioneer in PV project development, Jidian Co., Ltd. provides detailed and reliable data, including generation hours, cost structure, and policy support, which form a solid foundation for model construction and validation, ensuring the accuracy and reliability of the research results.
- 4.
Applicability of ESG factors
Another important reason for selecting this project is its outstanding performance in the ESG aspects. The PV project itself has significant environmental benefits, such as reducing carbon emissions and improving air quality, which positively contribute to society and the environment. Additionally, the project has created numerous job opportunities during its implementation, enhancing social benefits. In terms of governance, Jidian Co., Ltd. has shown excellent performance in project management and policy compliance, meeting high governance standards.
In summary, this study focuses on incorporating ESG factors into the deferral option model for PV project investments. By studying the PV project of Jidian Co., Ltd., we can comprehensively evaluate the impact of ESG factors on investment decisions, revealing their role in enhancing the project’s economic benefits and sustainable development. This research is crucial for promoting scientific investment decisions and policy formulation for PV projects.
3.1. Model Selection
3.1.1. Electricity Price
Under the policy context of renewable energy parity grid access, electricity prices are primarily influenced by supply and demand fluctuations in the electricity spot market. To describe the dynamic changes in electricity prices, this paper employs the O-U process [
31,
32,
33]. The mean reversion model is a reasonable choice for describing electricity price changes for the following reasons: Firstly, price fluctuations in the electricity spot market are mainly driven by supply and demand relationships. Although short-term supply and demand imbalances may lead to significant price fluctuations, market mechanisms typically drive prices back to an equilibrium level. This reversion behavior is the core characteristic of the mean reversion model. Therefore, the mean reversion model can effectively reflect the dynamics of supply and demand balance in the electricity market. Secondly, the mean reversion model captures the long-term mean trend in electricity prices. Over the long term, electricity prices tend to fluctuate around a relatively stable level, which reflects the market’s long-term equilibrium price. The O-U process describes this reversion trend through its mean reversion term. Additionally, electricity prices are influenced by various short-term random factors, such as weather changes, equipment failures, and sudden demand spikes. The O-U process incorporates a stochastic term to describe these short-term random fluctuations, thereby providing a more comprehensive and realistic model of electricity price dynamics.
3.1.2. Investment Costs
The existing research has demonstrated that advancements in PV technology align with the learning curve model. Therefore, this study employs the Learning-by-Doing (LBD) curve model to describe the trend in changes in the unit investment cost of PV projects [
9,
10,
11]. The learning curve model indicates that as production scale expands and cumulative production increases, unit production costs tend to decrease—a trend validated in the development of PV technology. Additionally, increased production scale brings significant economies of scale, which help distribute fixed costs and reduce unit production costs. The accumulation of production experience and process improvements also reduces energy and material consumption during production, thereby enhancing production efficiency. Furthermore, supply chain optimization lowers logistics and inventory costs.
The LBD curve model, based on actual production data, accurately reflects the pattern of declining unit costs with increasing cumulative production. This model not only has a solid theoretical foundation but is also supported by empirical data. Using the LBD curve model allows for a scientific assessment of the economic feasibility and investment return rate of PV projects, providing reliable predictions and decision-making support for businesses and investors. Therefore, this study selects the LBD curve model to describe the changes in the unit investment cost of PV projects, providing a robust foundation and reliable predictive tool for the research.
3.1.3. Operating Costs
During the operational phase of a PV project, the main components of O&M (operations and maintenance) costs include inverter replacement, regular maintenance, and module cleaning. These operational costs exhibit an average growth trend over time and fluctuate due to market conditions, technological changes, and other uncertain factors, typically demonstrating continuity and randomness. This paper uses the geometric Brownian motion (GBM) model to describe the changes in per-megawatt costs during the operational phase [
26,
27,
28,
29] for the following reasons: Firstly, the GBM model can describe the average growth trend in costs, accurately reflecting the long-term growth characteristics of PV O&M costs over time. Secondly, the GBM model includes a stochastic term that can simulate the impact of uncertain factors such as market conditions and technological changes on costs, making the model more realistic. The GBM model simultaneously considers the continuity and randomness of cost changes, capturing actual cost fluctuations through a continuous-time process and a stochastic term. Moreover, the GBM model has a simple yet effective mathematical form that is easy to apply in practice. This makes the GBM model highly operable in practical applications, allowing for efficient numerical calculations and analysisp [
34,
35,
36,
37].
3.1.4. ESG Benefits
To comprehensively assess the environmental, social, and governance benefits of PV projects, this study employs the expected benefit model. This choice is primarily based on the following reasons: Firstly, the benefits of PV projects in terms of environmental, social, and governance aspects exhibit varying degrees of uncertainty and involve multidimensional contributions. The expected benefit model can quantify benefits under uncertainty and convert them into monetary values, facilitating comparison and comprehensive evaluation. This provides more scientific data support for decision making. Secondly, the model can incorporate the characteristics of policies and market mechanisms, accurately reflecting the project’s adaptability and competitiveness in different environments. Finally, the expected benefit model offers the flexibility for dynamic adjustment and optimization, ensuring the timeliness of the evaluation results. It supports the dual objectives of economic returns and sustainable development, providing a comprehensive value assessment and decision-making basis.
3.2. Model Construction and Data Analysis
3.2.1. Electricity Price
The mean-reversion process of electricity prices is represented as follows:
where
is the electricity price at time
,
is the speed of mean reversion,
is the long-term mean,
is the volatility of the electricity price, and
is the standard Brownian motion.
In the case study in this paper, all the power generation enterprises, including PV projects in Shandong Province, are required to trade through the Shandong Electric Power Trading Center. Therefore, this study organizes and analyzes the monthly data from the Shandong electricity spot market since December 2021.
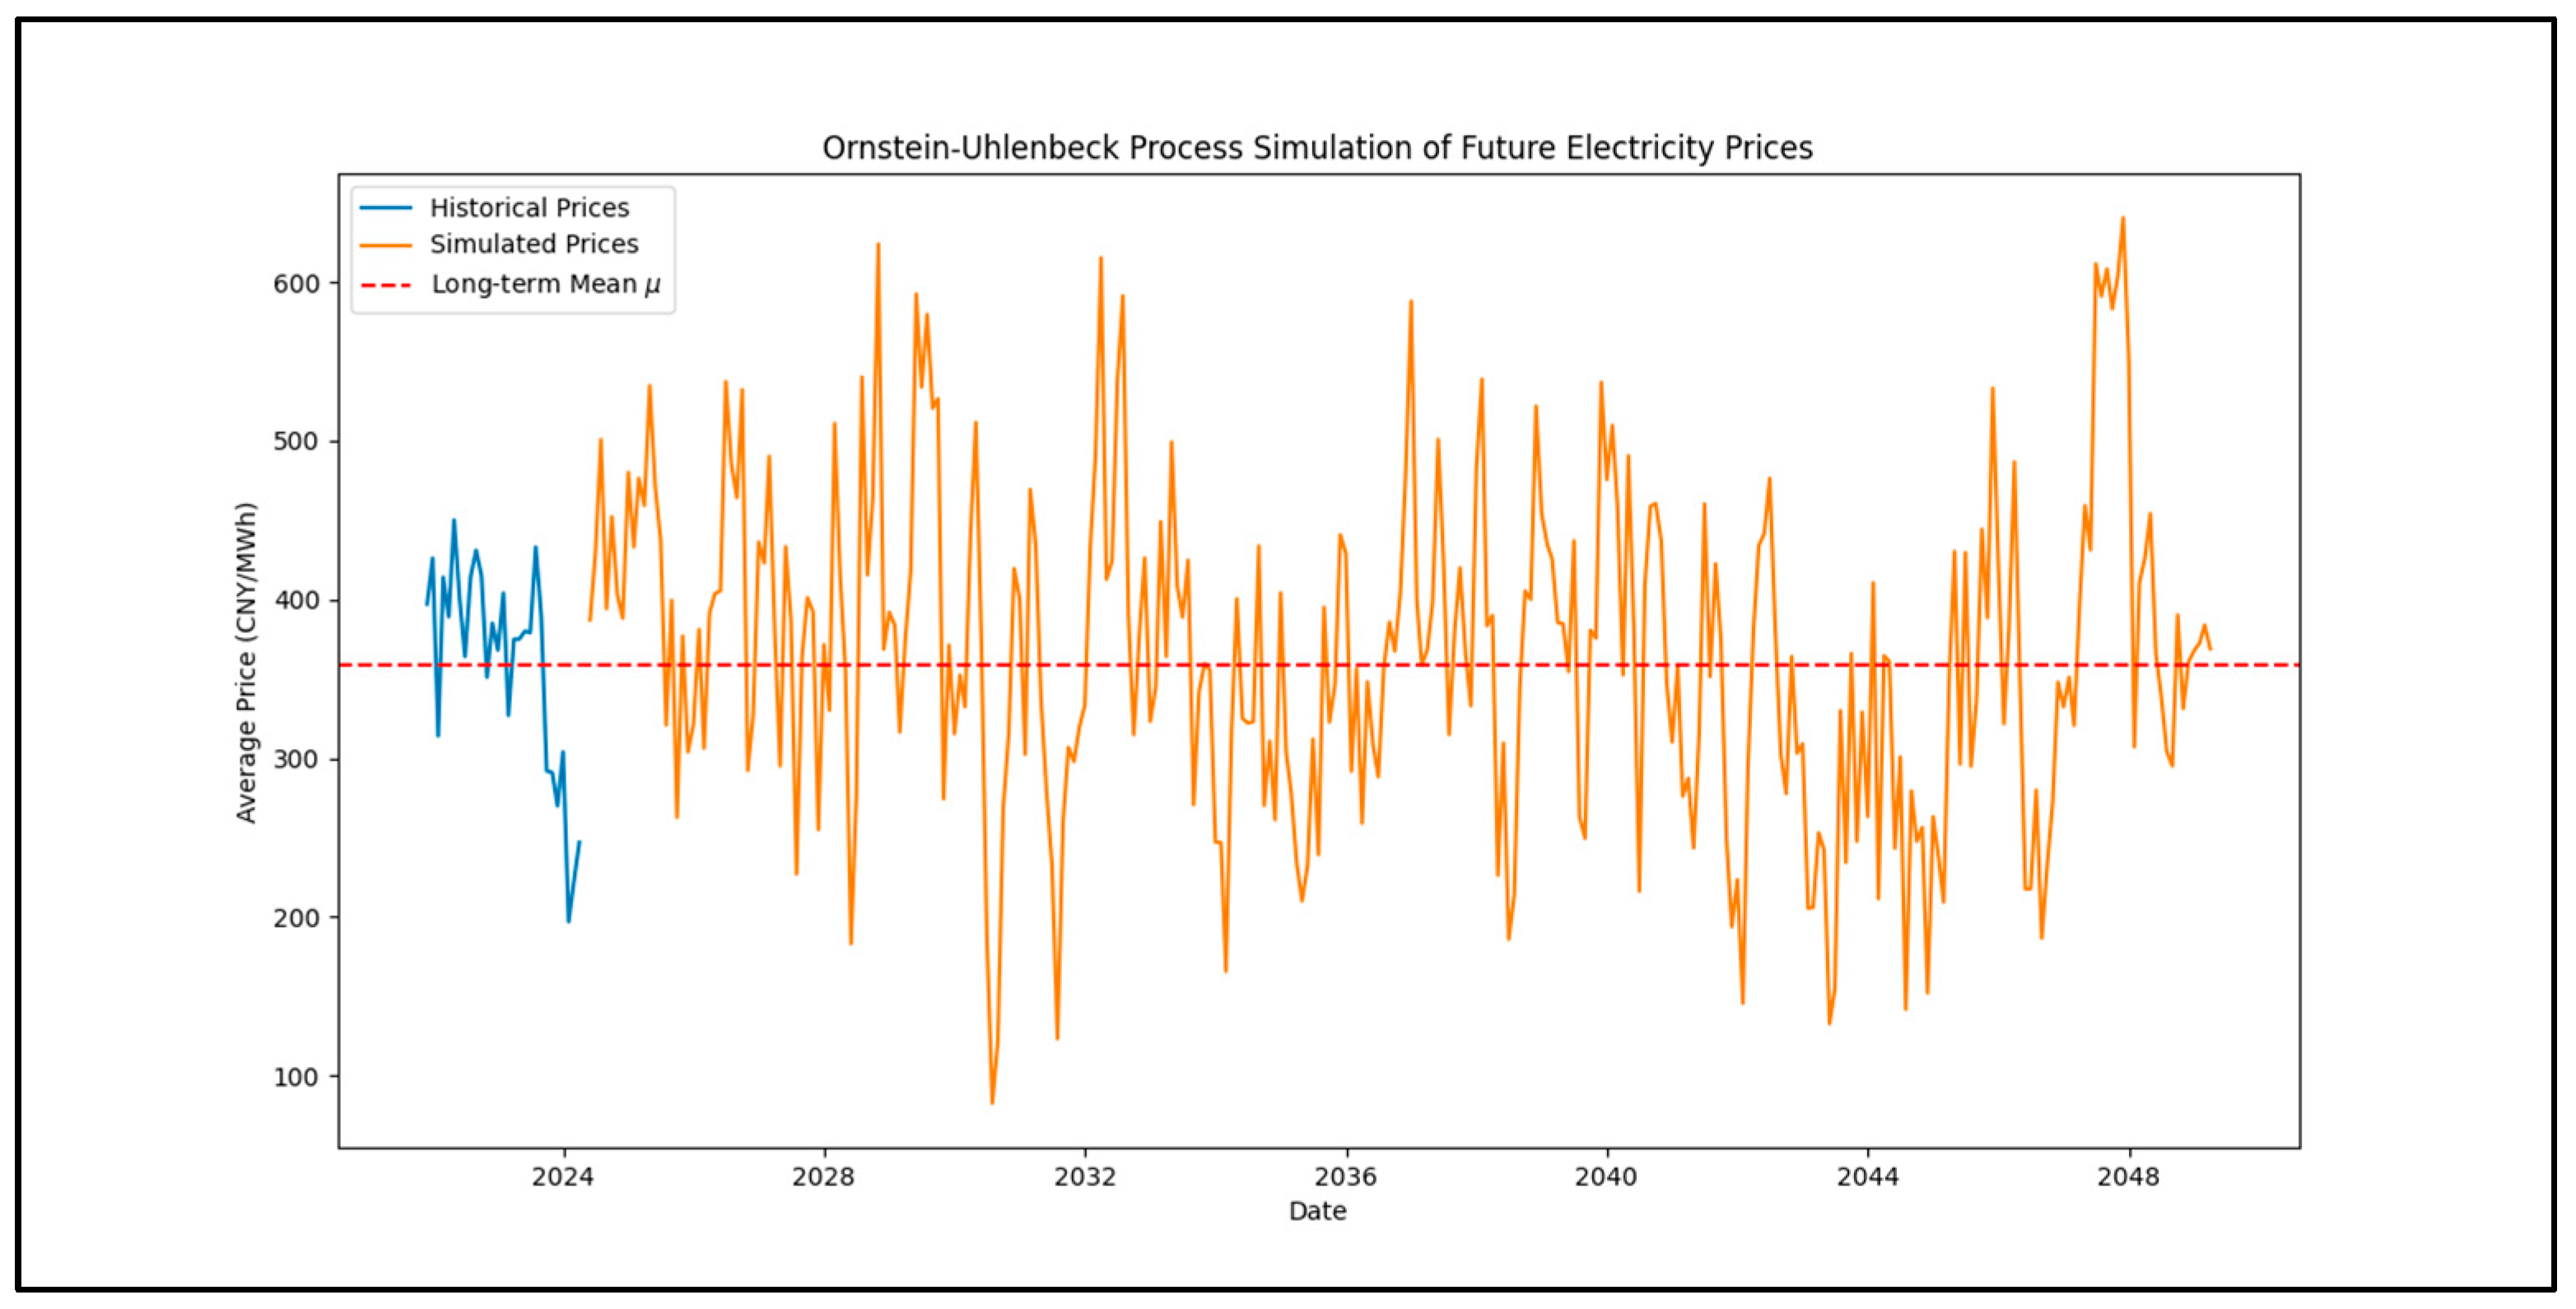
Using Python 3.11, we computed and simulated the parameters of the O-U process and the monthly changes in electricity prices over the 25-year operation period of the PV project. Based on historical data, the parameters are set as follows: , , and These parameters were calculated using the following formulas: , , , , where
Figure 2 illustrates the monthly changes in the electricity prices over the 25-year operation period of the PV project, with the blue line representing the historical data and the orange line representing the data simulated using the O-U process.
3.2.2. Investment Costs
This study adopts the LBD curve model to describe the trend in changes in the unit investment cost of PV projects. The learning curve model effectively reflects the impact of technological progress and economies of scale on costs. Its mathematical representation is as follows:
where
is the unit investment cost of the PV project at time
,
is the initial benchmark investment cost,
is the installed capacity at time
,
is the initial benchmark installed capacity, and
is the learning rate coefficient.
The investment cost data for this study is based on the latest data from the International Renewable Energy Agency (IRENA). In 2023, the average investment cost for PV projects is approximately 883,000 $/MW. According to the learning curve model, the unit cost of PV components decreases by an average of 20% for every doubling of cumulative production.
By applying the learning curve model, we can effectively assess the economic feasibility and investment return rate of PV projects, providing reliable predictions and decision-making support for businesses and investors. This model enables a scientific evaluation of cost trends influenced by technological improvements and production scaling, forming a robust foundation for the research.
3.2.3. Operating Costs
This study employs the GBM model to describe the changes in the operating costs of photovoltaic PV projects. The GBM model captures the stochastic nature of cost fluctuations. Its mathematical representation is as follows:
where
is the per-megawatt operating cost at time
,
is the average growth rate of per-megawatt operating costs,
is the volatility of the per-megawatt operating costs, and
is a standard Brownian motion.
Due to the lack of detailed information on the operating phase of the project studied, this paper uses the Daheng Energy PV project as a reference to estimate the per-megawatt monthly operating costs during the operating phase. By analyzing the historical operating data of the Daheng Energy PV project, the relevant parameters were obtained.
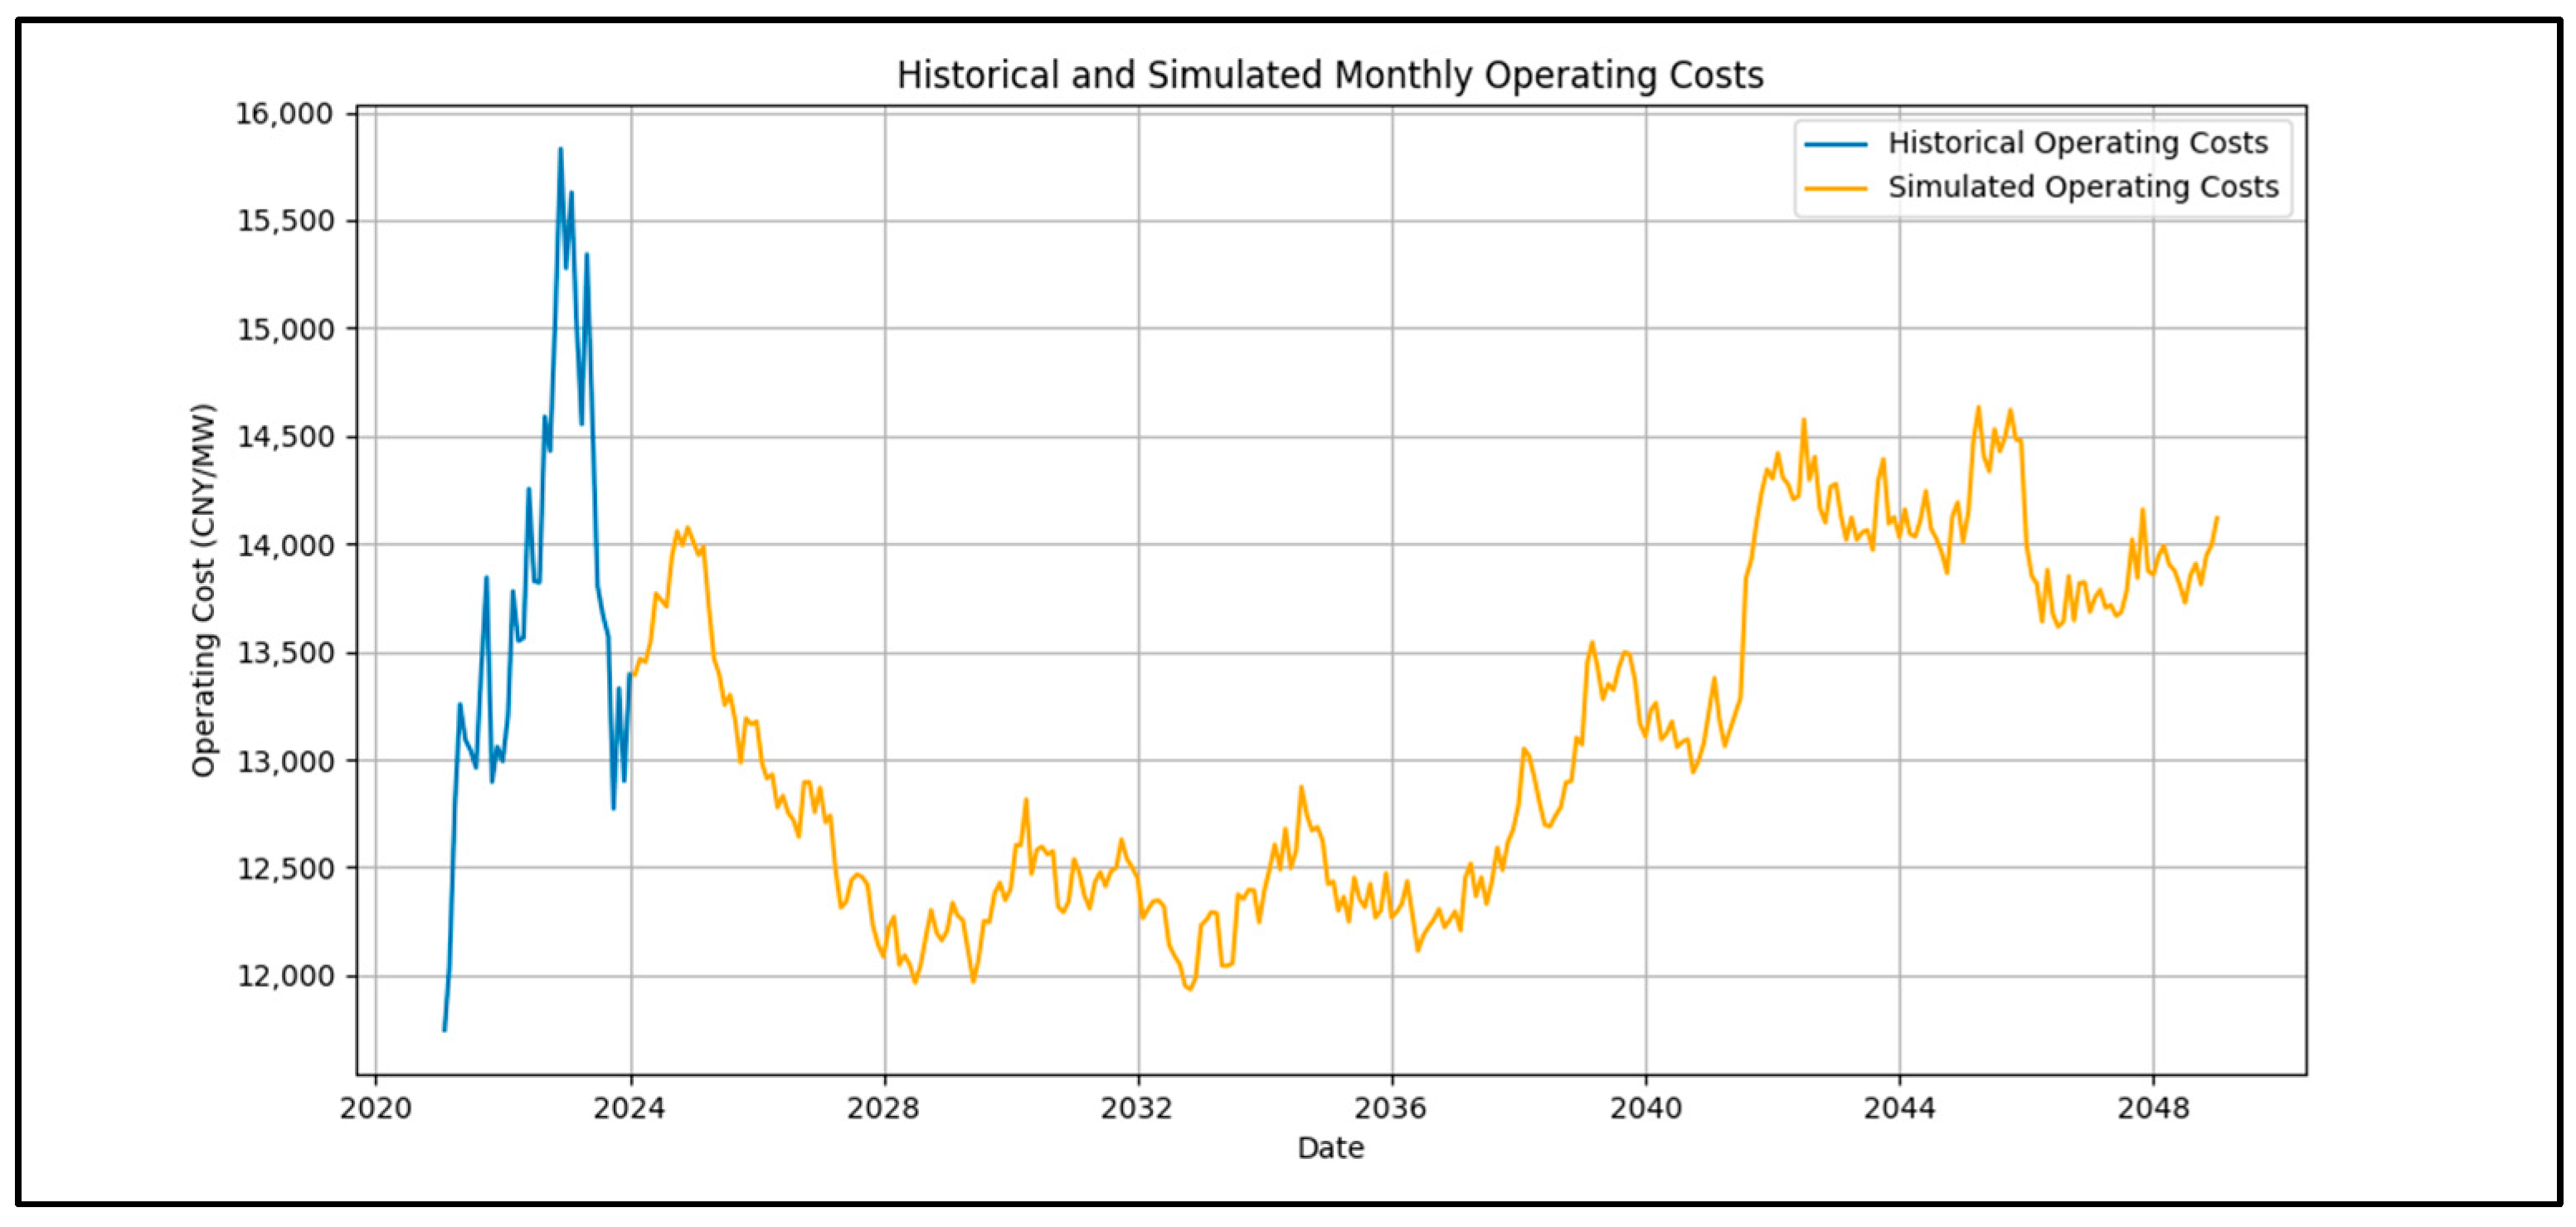
Using the GBM model, this study simulates the monthly changes in the operating costs over the 25-year operation period of the PV project. Based on the data from the Daheng Energy PV project, the parameters are determined as follows: the average growth rate
, and the volatility
is 0.03646.
Figure 3 illustrates the monthly changes in the operating costs over the 25-year operation period of the PV project, with the blue line representing the historical data and the orange line representing the data simulated using the GBM model.
By incorporating the GBM model, this study captures the dynamic nature of operating costs, providing a more comprehensive understanding of the financial aspects involved in the long-term operation of PV projects.
3.2.4. Quantification of Environmental Benefits
The primary environmental benefit of PV projects is the reduction in carbon emissions. PV projects can reduce greenhouse gas emissions, thereby generating revenue from carbon emission trading [
30]. Therefore, the expected benefit quantification formula for environmental benefits is as follows:
where
is the carbon reduction benefit at time
,
is the carbon reduction per unit of electricity generated,
is the monthly generation hours per megawatt of PV, and
is the carbon trading price.
According to information disclosed by the International Energy Agency (IEA), each MWh of PV electricity can reduce approximately 0.6 tons of CO
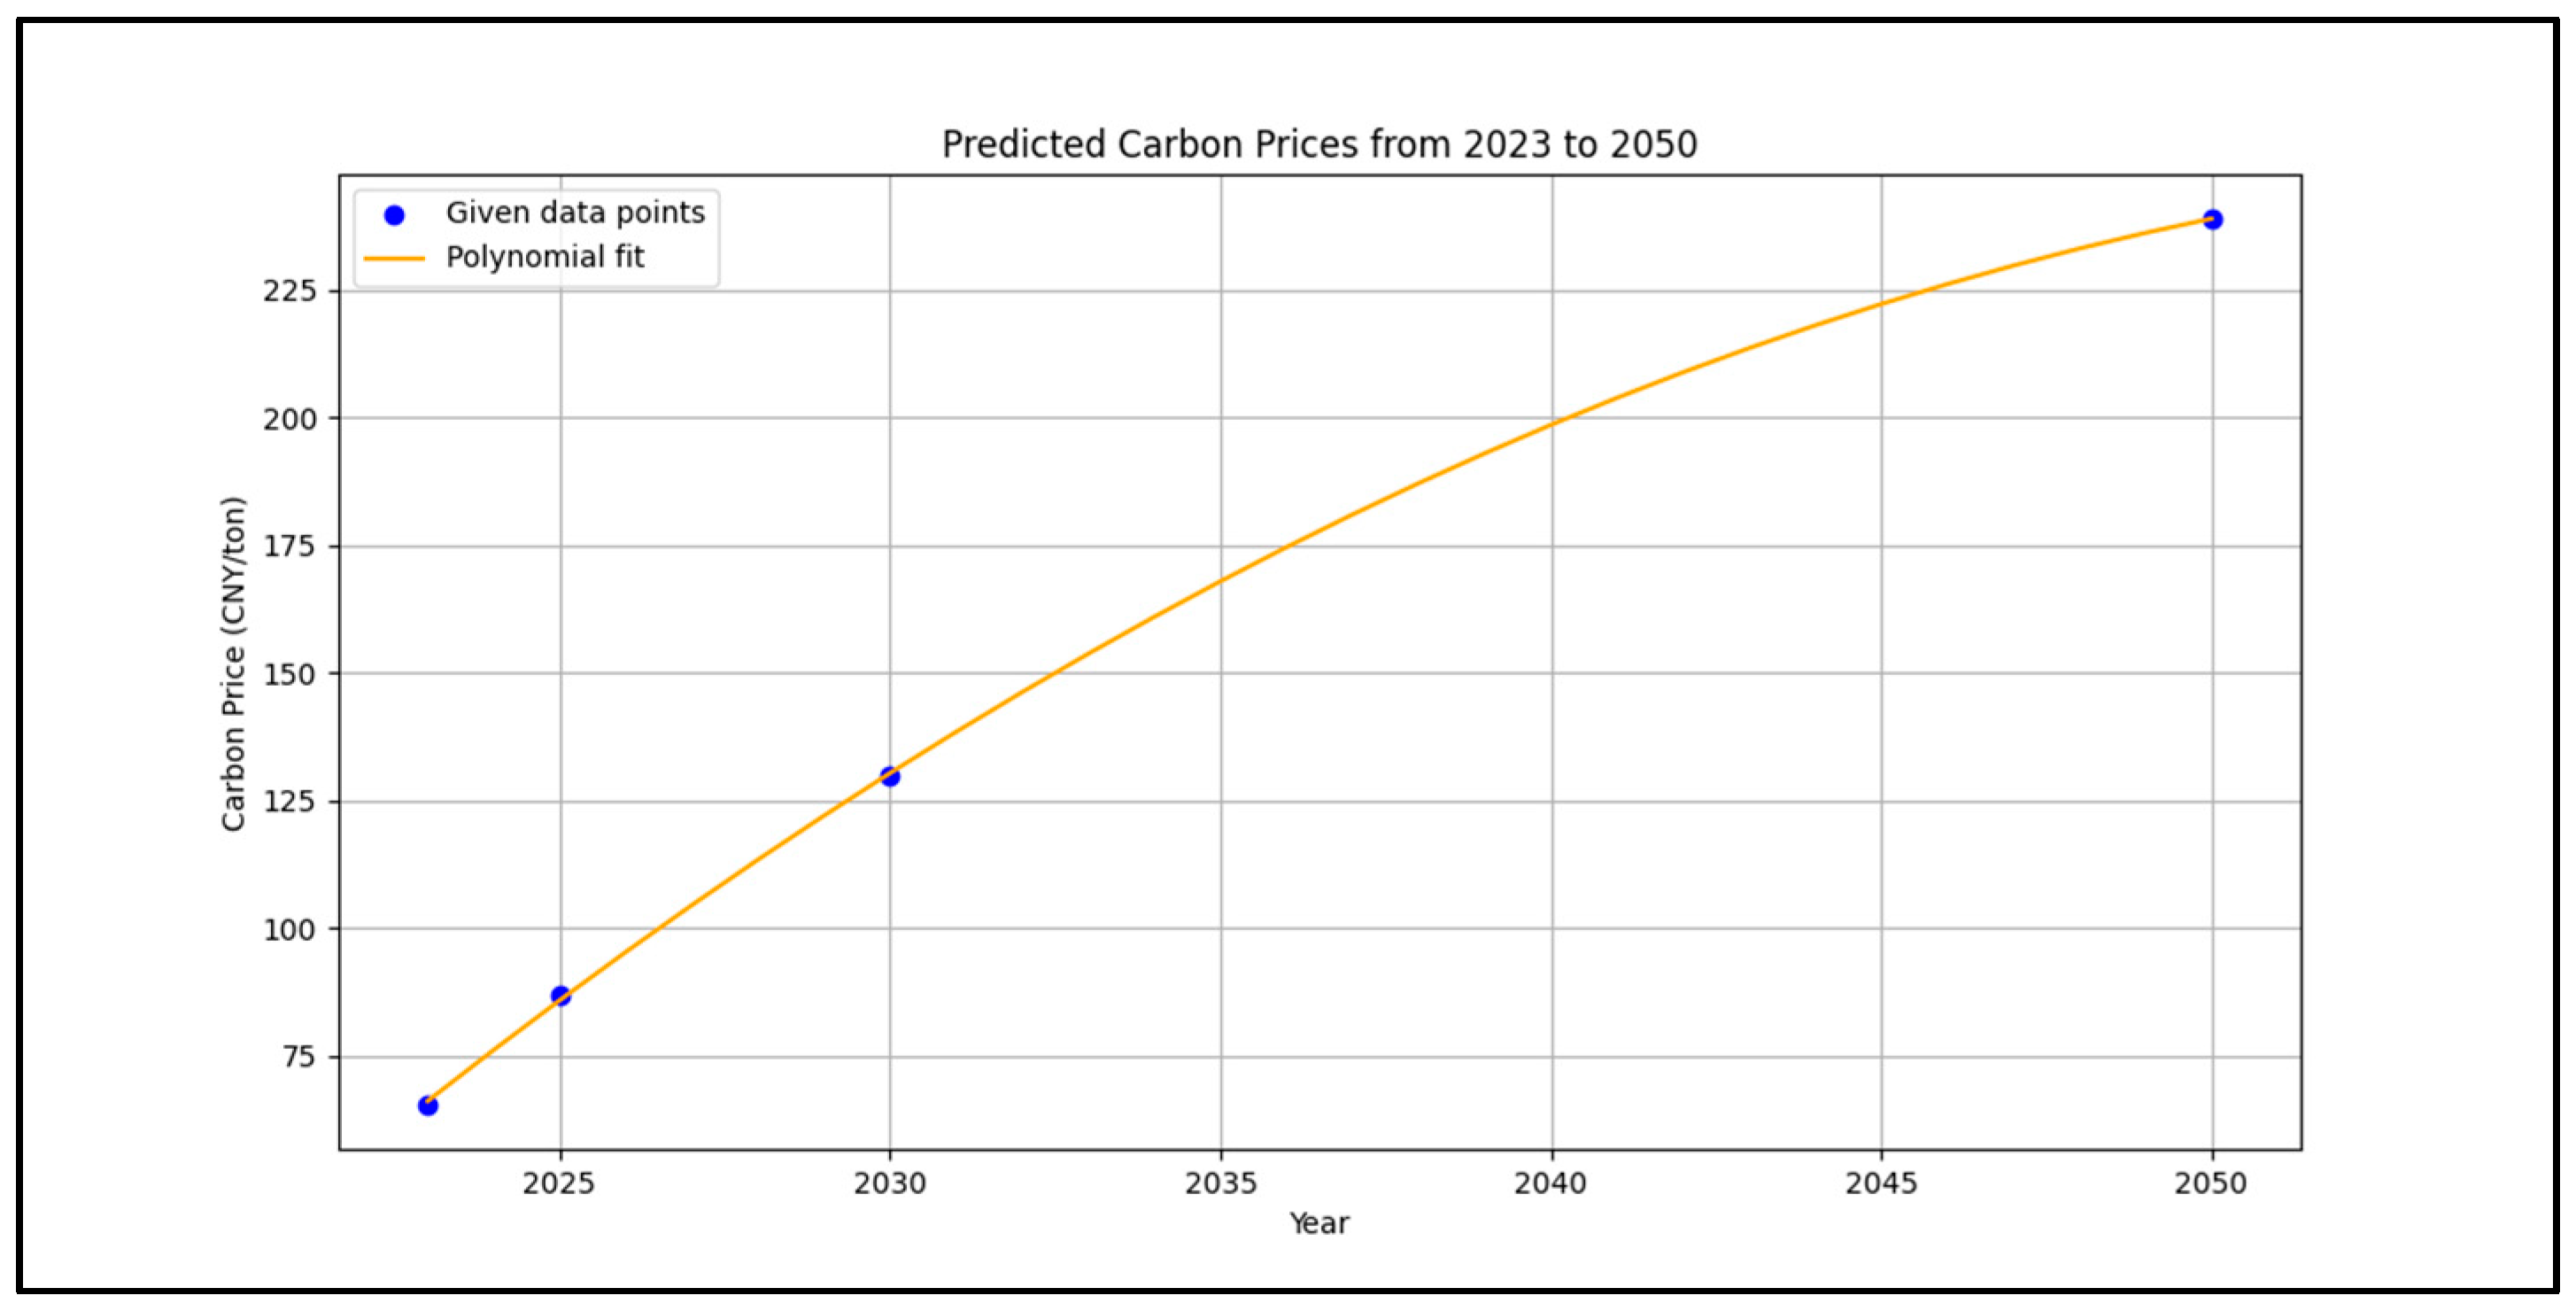
2, with an average monthly generation of 124.3 h per megawatt. The carbon trading price is based on forecasts from the Fudan University Center for Sustainable Development, as shown in
Figure 4.
Using the above formula and case data, the carbon reduction benefits of the PV project at different time points can be quantified. The carbon reduction per unit of electricity generated is 0.6 tons of CO2 per MWh, and the monthly generation hours per megawatt is 124.3 h. By applying the carbon trading price predictions from Fudan University, the carbon reduction benefits for different periods can be calculated.
By integrating these parameters, the study effectively quantifies the environmental benefits of the PV project, providing a comprehensive assessment of its contribution to carbon emission reduction and the associated financial gains from carbon trading. This quantification supports more informed decision making and policy formulation to enhance the environmental and economic viability of PV projects.
3.2.5. Social Benefit Quantification Model
The social benefits of renewable energy projects primarily manifest in job creation [
20], air quality improvement [
38], and enhanced public health [
19]. In this study, job creation is used to measure the social benefits of PV projects. The quantification formula is as follows:
where
is the monetary value of social benefits at time
,
is the number of jobs created per megawatt of PV projects at time
, and
is the average wage per person.
According to the research data from the International Renewable Energy Agency (IRENA), each megawatt of PV power generation projects creates approximately 1.8 to 2 direct jobs. This study uses the upper estimate of 2 jobs per megawatt. Based on data from the Shandong Provincial Bureau of Statistics, the average annual salary in Shandong Province in 2022 was CNY 66,000, equivalent to a monthly wage of CNY 5500. The average annual wage growth rate of approximately 4.94%. The monthly average wage for the future year is calculated as follows: By substituting the installed capacity and average wage at different times into the formula, the predicted social benefits of the PV project during its operation period can be obtained.
By quantifying the social benefits in terms of job creation, this study provides a tangible measure of the positive impact of PV projects on local economies and communities. This approach supports the comprehensive evaluation of renewable energy projects, considering both economic and social dimensions.
3.2.6. Governance Benefit Quantification
Governance benefits mainly include the impact of project management transparency [
12], regulatory compliance [
39], and policy support [
18] on project value. This study primarily considers the additional financial incentives brought about by policy support. The quantification formula is as follows:
where
is the monetary value of governance benefits at time
, and
is the tax incentives received at time
.
In Shandong Province, PV enterprises recognized as high-tech enterprises have their corporate income tax rate reduced from the standard 25% to 15%, resulting in a tax incentive of 10%. Using the above formula and data, the governance benefits of the PV project at different time points can be calculated.
3.3. Project Valuation
The monthly cash flow during the operational phase of the PV project is expressed as follows:
where
represents the operation and maintenance costs in month
; the revenue from electricity sales in month
is given by the following:
- 2.
NPV
Decision-makers can choose to invest in the PV project at any time
within the project’s effective period (
,
being the latest investment opportunity) at a total cost of
. Assuming the investment is made instantaneously and is irreversible, the net present value of the project at time
can be expressed as follows:
where
is the risk-free monthly interest rate (
, with
being the risk-free annual interest rate, set at 3% in this paper),
is the total operation time of the PV project,
, and
denotes the expected value.
- 3.
Considering option value
When considering uncertainty and managerial flexibility, using the NPV method for investment decisions may undervalue the project’s investment worth. Real options theory defines the project’s value as the sum of NPV and the flexible economic value under uncertain conditions, which is as follows:
where
is the expanded value of the project under real options theory, and
is the value of the project’s option to delay investment, i.e., the option value.
- 4.
Total project value
During the project’s effective period, decision-makers can maximize the project value by selecting the optimal investment timing:
where
is the maximum investment value of the project,
is the optimal investment timing, and
is the investment value at the optimal investment timing.
4. Model Solution
Since decision-makers can exercise the option at any time during the project’s effective period, the model can be solved using methods for American options. American options do not have an analytical solution and must be solved using numerical methods. The traditional numerical pricing methods include the binomial tree method, the finite difference method, and Monte Carlo simulation. The binomial tree method, proposed by Cox, Ross, and Rubinstein [
40], constructs a discrete price tree and calculates possible price changes at each node to estimate the option value. However, the computational complexity of the binomial tree method increases rapidly with the number of time steps, making it difficult to extend to high-dimensional problems and unsuitable for path-dependent options and complex real options models. The finite difference method, proposed by Schwartz [
41], discretizes the partial differential equations of option pricing and solves the discretized equations to estimate the option value. However, the finite difference method has high computational complexity and is challenging to apply to high-dimensional problems and path-dependent options. Monte Carlo simulation generates a large number of random price paths and calculates the average option value over these paths to estimate the option value. Due to its simplicity and ease of use, Monte Carlo simulation is widely applied in option pricing, although it still suffers from slow convergence and high computational demands.
The Least Squares Monte Carlo (LSMC) method combines Monte Carlo simulation and regression techniques by introducing the least squares method to estimate the conditional expectation of continuing to hold the option. By comparing the immediate payoff from exercising the option with the conditional expectation of continued payoff, it determines whether to exercise the option at the current moment, thus finding the optimal investment timing for the American option along that path [
42]. The specific steps are as follows:
Step 1: Path Simulation: Discretize Equations (1) and (3), and generate
M paths through Monte Carlo simulation. The sample paths are (
). Each path has
N time steps, which is the number of decision points per path, where
. The simulation process of
and
is represented as follows:
where
and
are standard normal random variables.
Step 2: Benefit Calculation: Use Equations (2) and (4)–(6) to determine the unit investment cost , the quantified environmental benefits , the quantified social benefits , and the quantified governance benefits at time .
Step 3: NPV Calculation: Calculate the expected net present value at each decision point along the M paths within using Equation (9).
Step 4: Investment Opportunity Valuation: Starting from and proceeding backward, for any path , if no investment has occurred on this path before time and , then choose to invest immediately. Mark the value at time on path as , and mark immediate investment as . If no investment has occurred on this path before time and , then choose to delay the investment. Mark the value at time on path as , and mark delayed investment as .
Step 5: Optimal Timing Selection: For any investment timing
within the effective investment period, use the least squares method to compare the immediate investment value with the delayed investment value, and then choose the timing
that maximizes the investment value.
If the immediate investment value is greater than the delayed investment value, mark it as ; if the immediate investment value is less than or equal to the delayed investment value, mark it as .
Step 6: Recursive Solution: The above recursive process is carried out backward until the optimal investment decision is found for all
N decision points on the
M paths. The final investment value is the average of all the paths.
By following these steps, the LSMC method provides a robust framework for solving the real options model, allowing for the consideration of uncertainty and managerial flexibility, thus determining the optimal investment timing and maximizing the project’s investment value.
5. Simulation Results Analysis
5.1. Project Investment Value Analysis
To more accurately simulate the changes in the electricity prices and operating costs for the PV project over the next 25 years, this paper employs the Monte Carlo simulation method, generating 5000 simulated paths and recording the changes in the electricity prices and operating costs for each path.
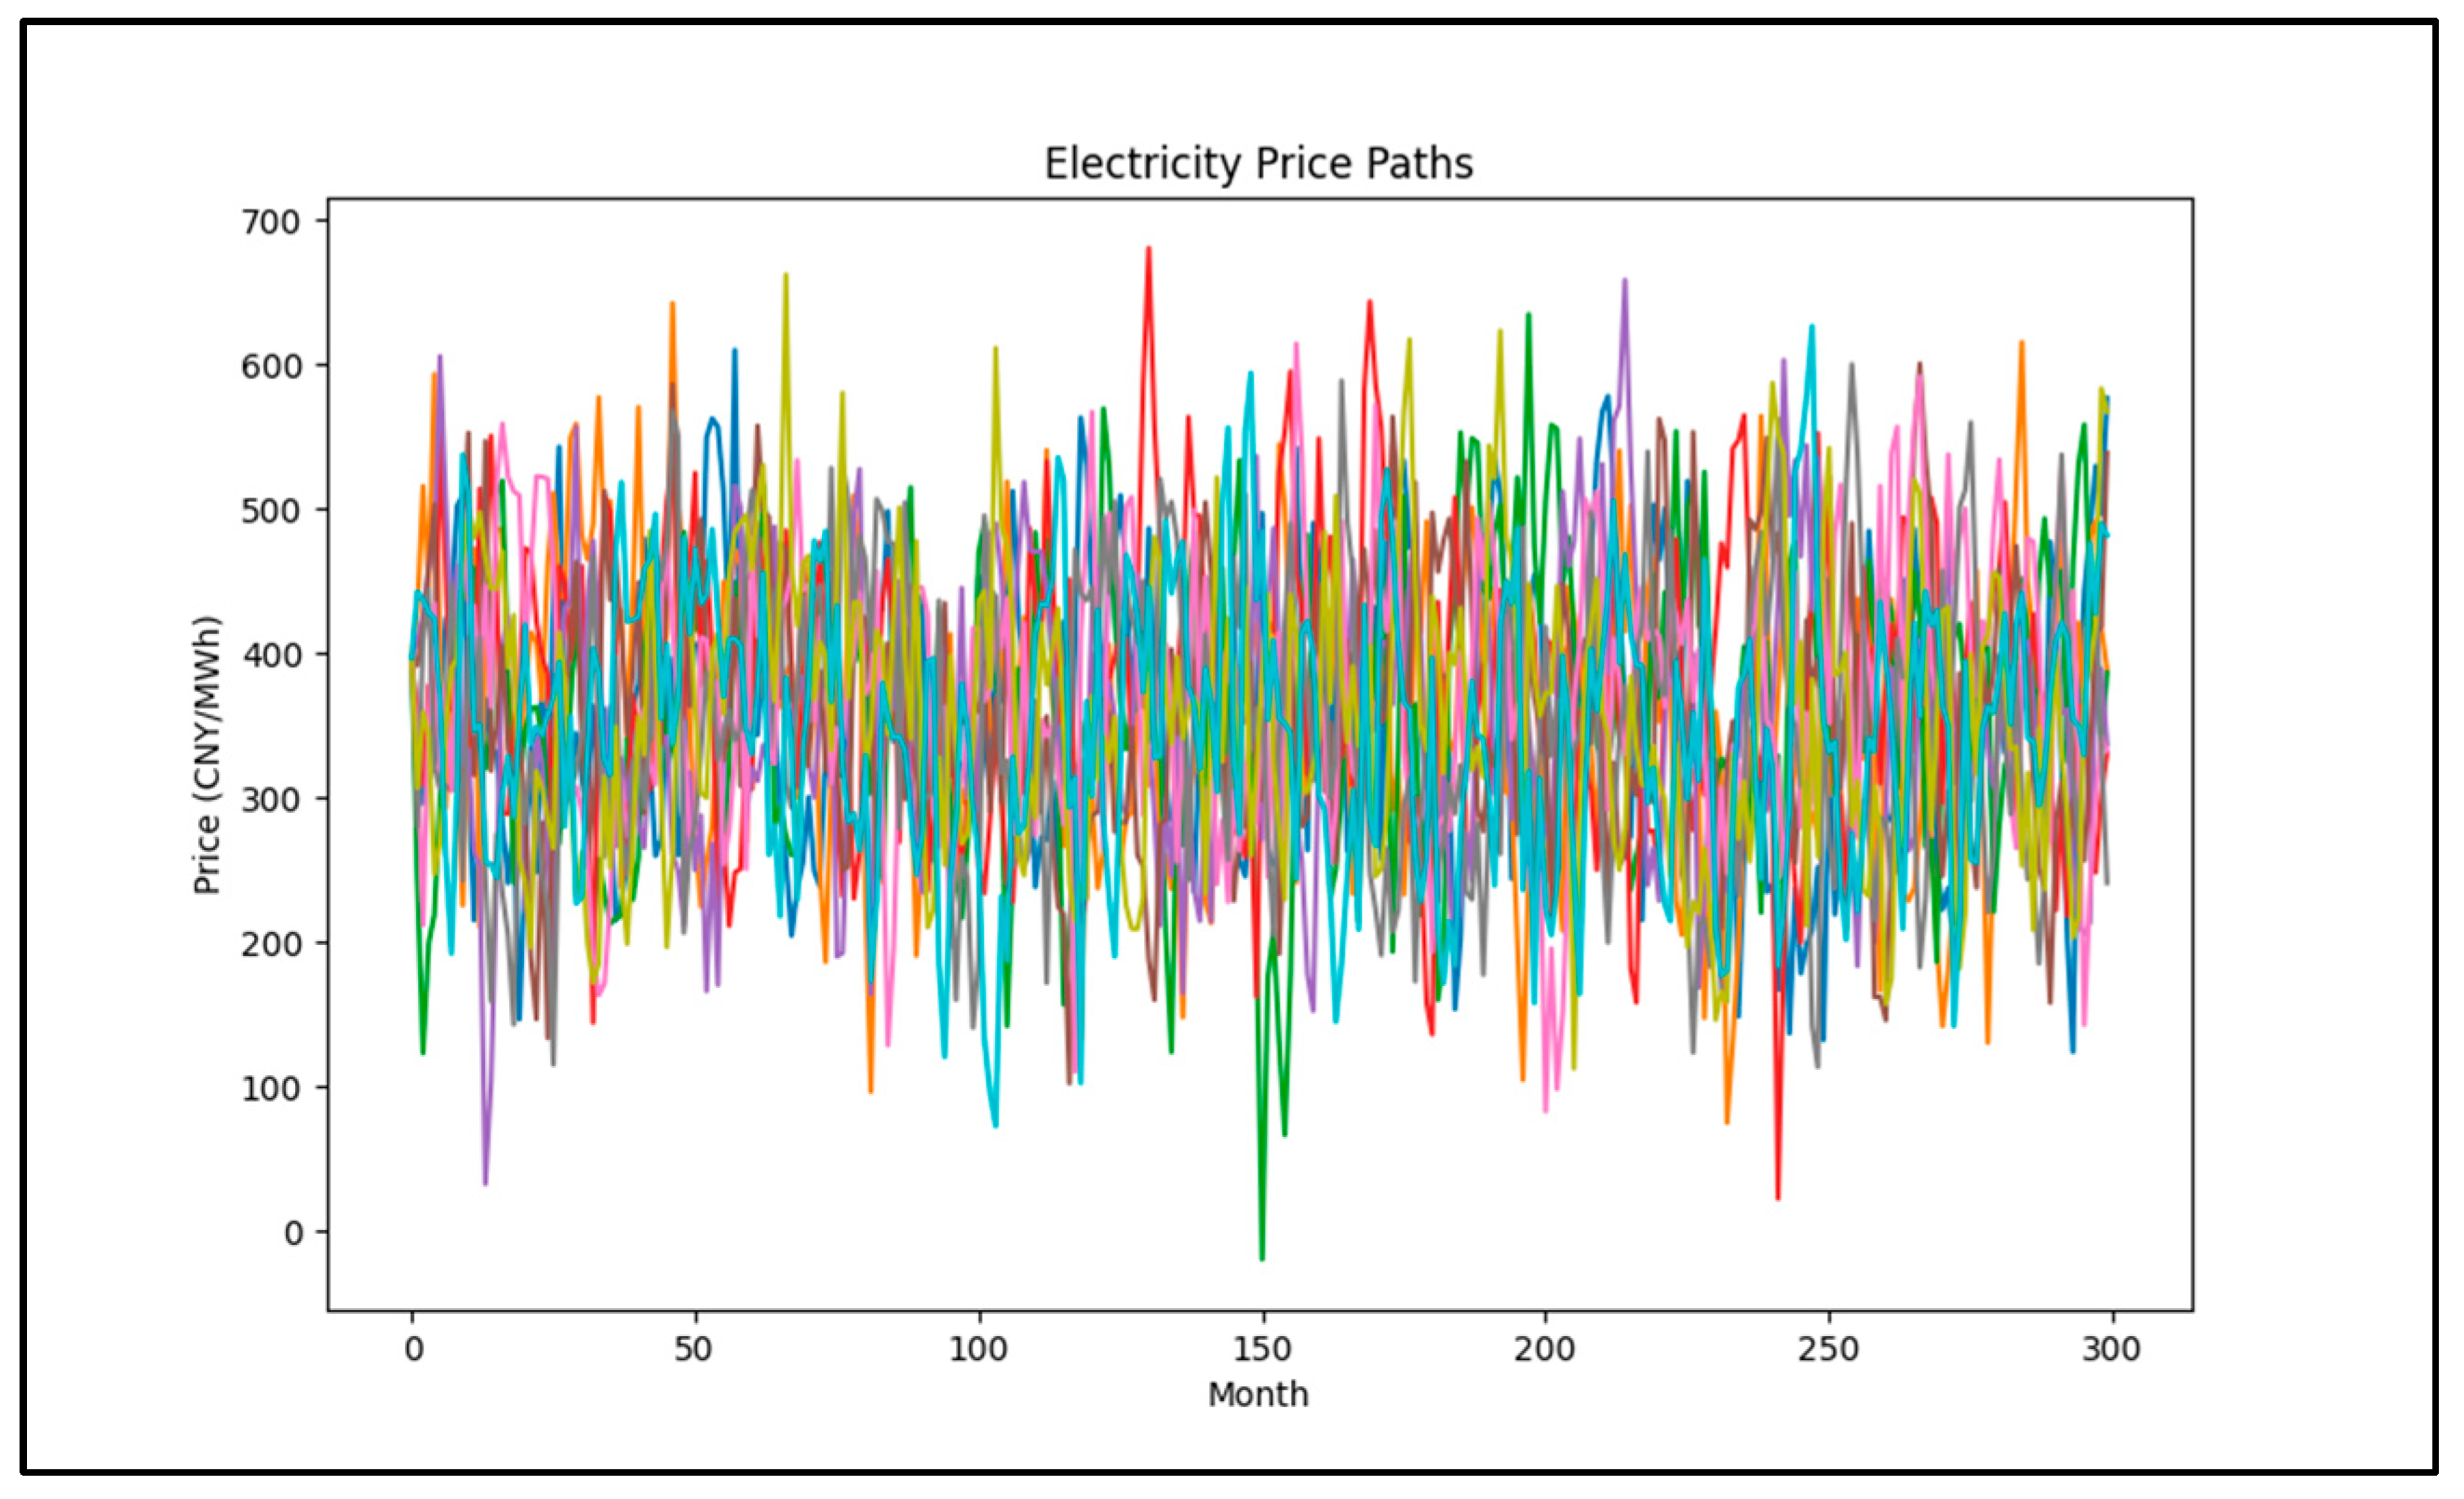
Figure 5 shows the simulation results for some of the electricity price paths. From the simulation results, it can be observed that the electricity prices exhibit significant volatility over the next 25 years, with the mean stabilizing around 358.72 CNY/MWh.
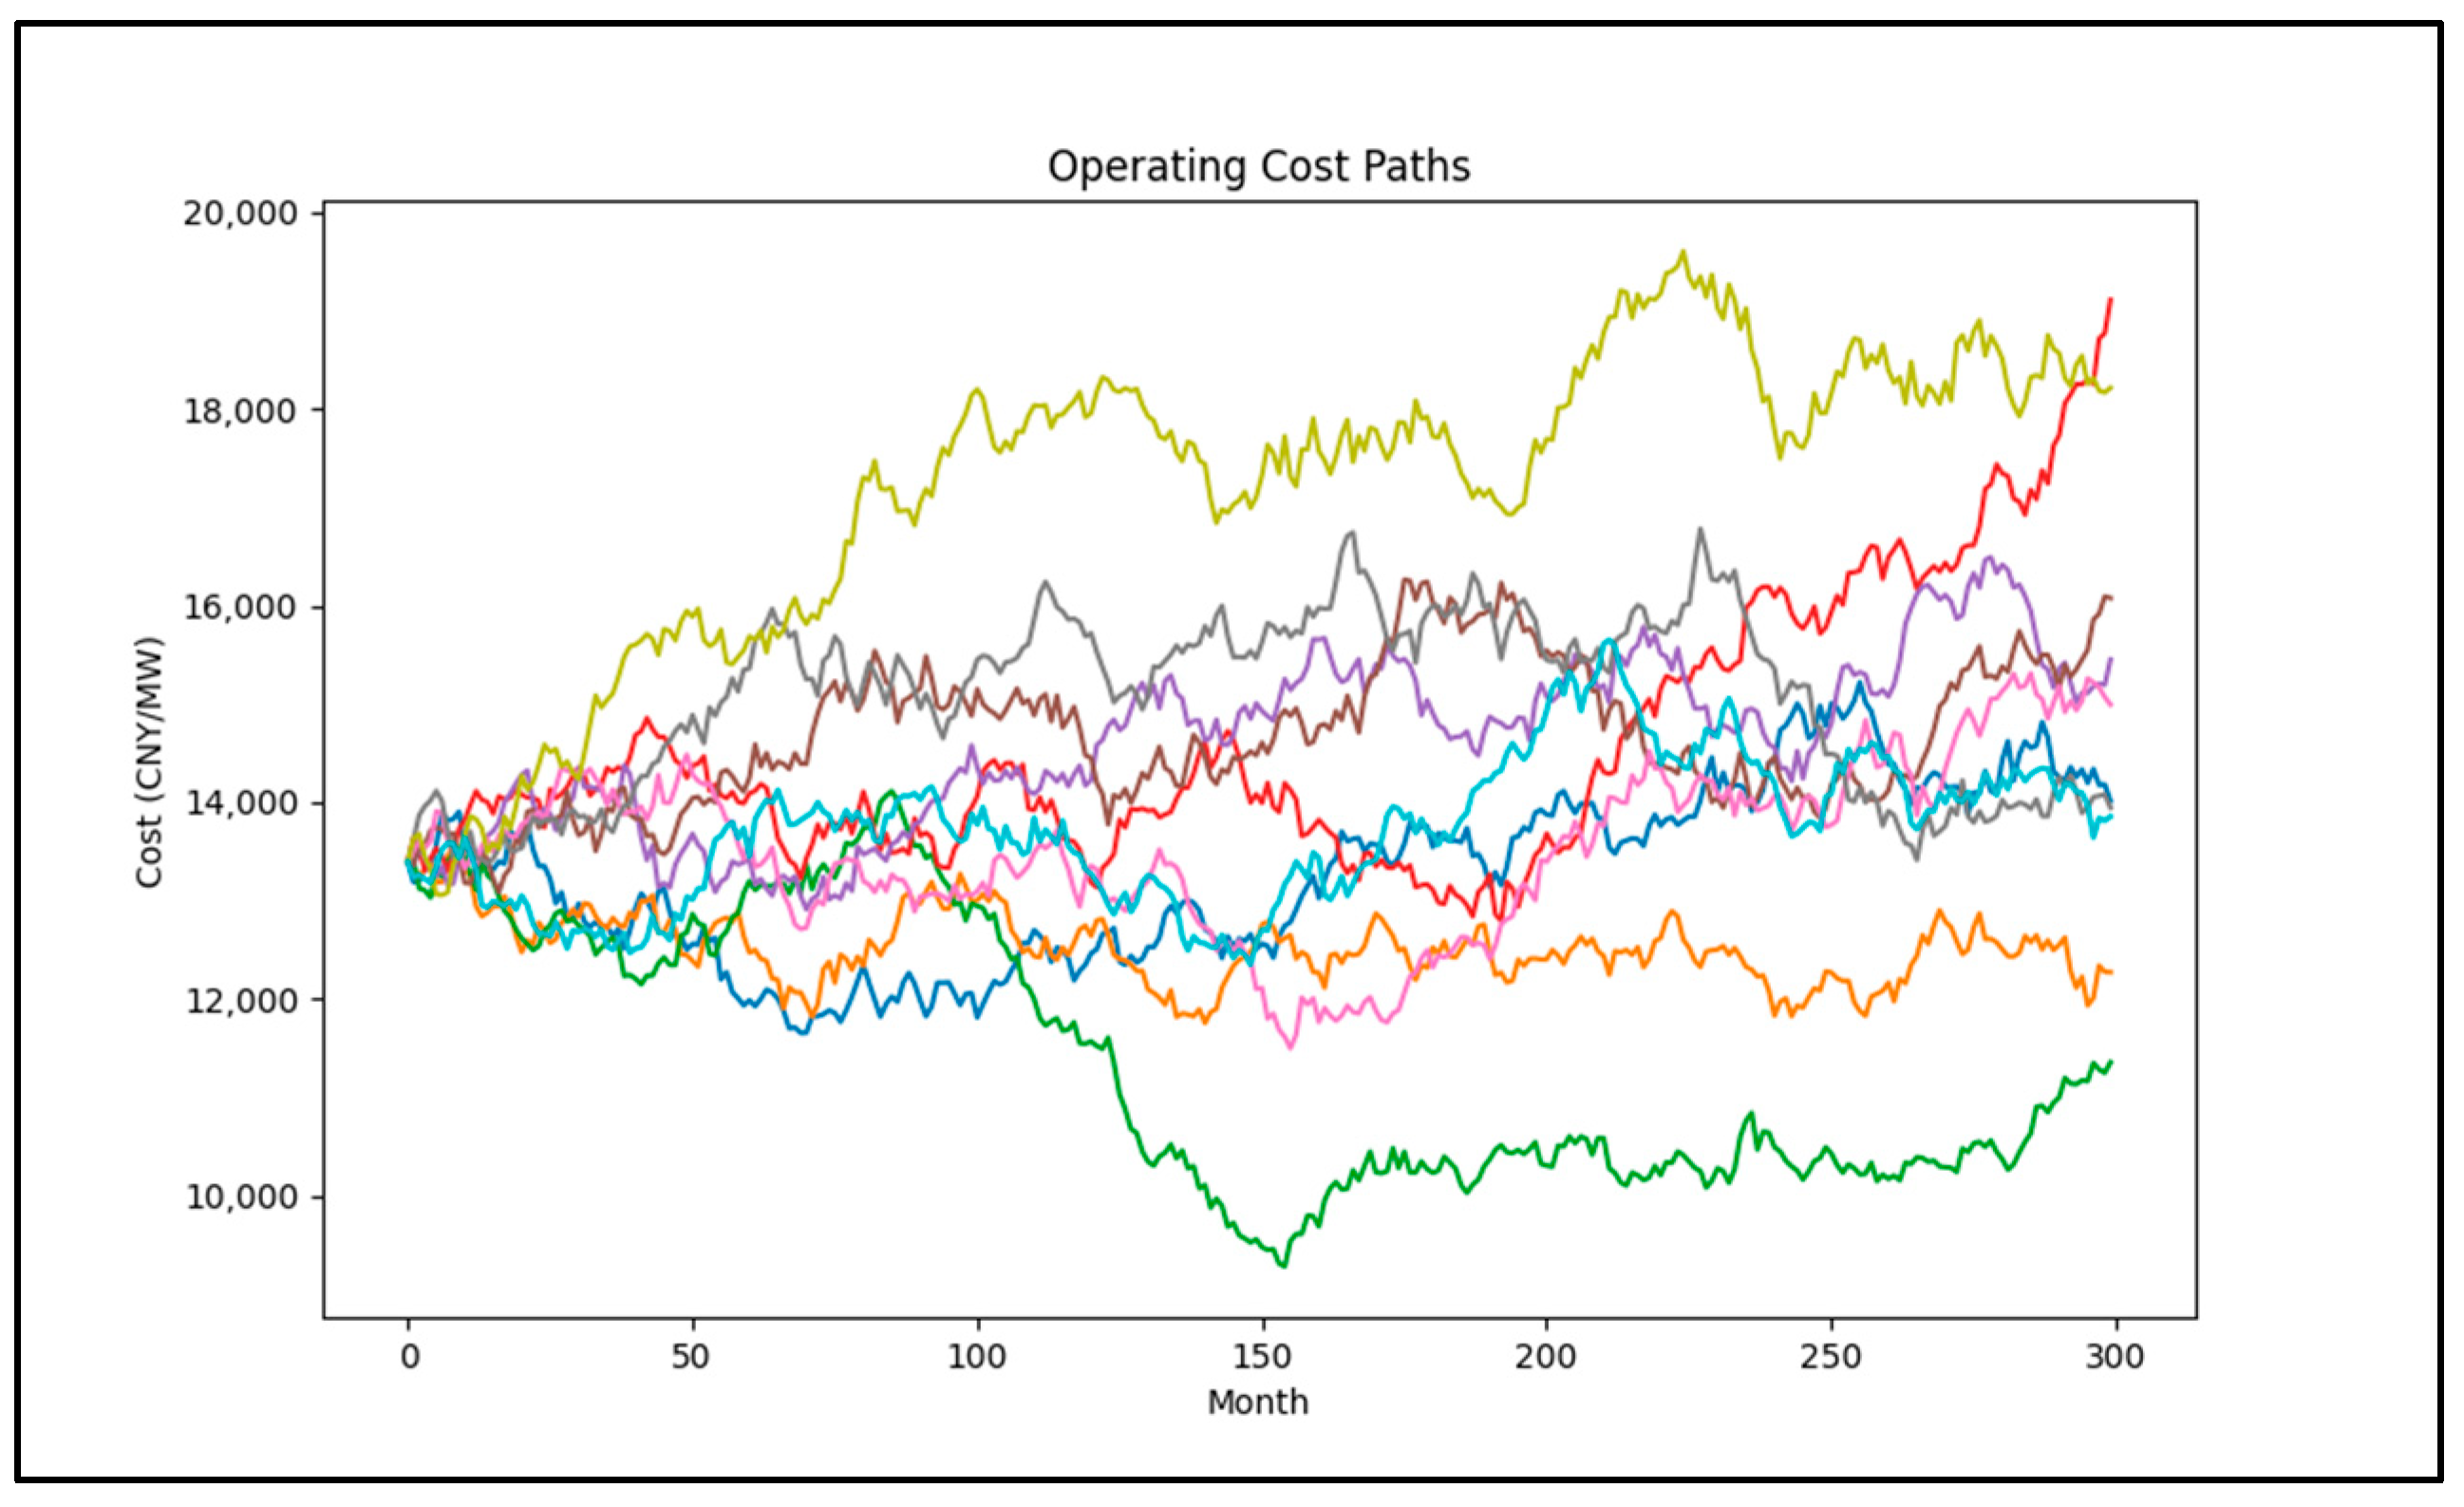
Figure 6 shows the simulation results for some of the operating cost paths. From the simulation results, it can be observed that the operating costs show an increasing trend over the next 25 years, but also with certain volatility.
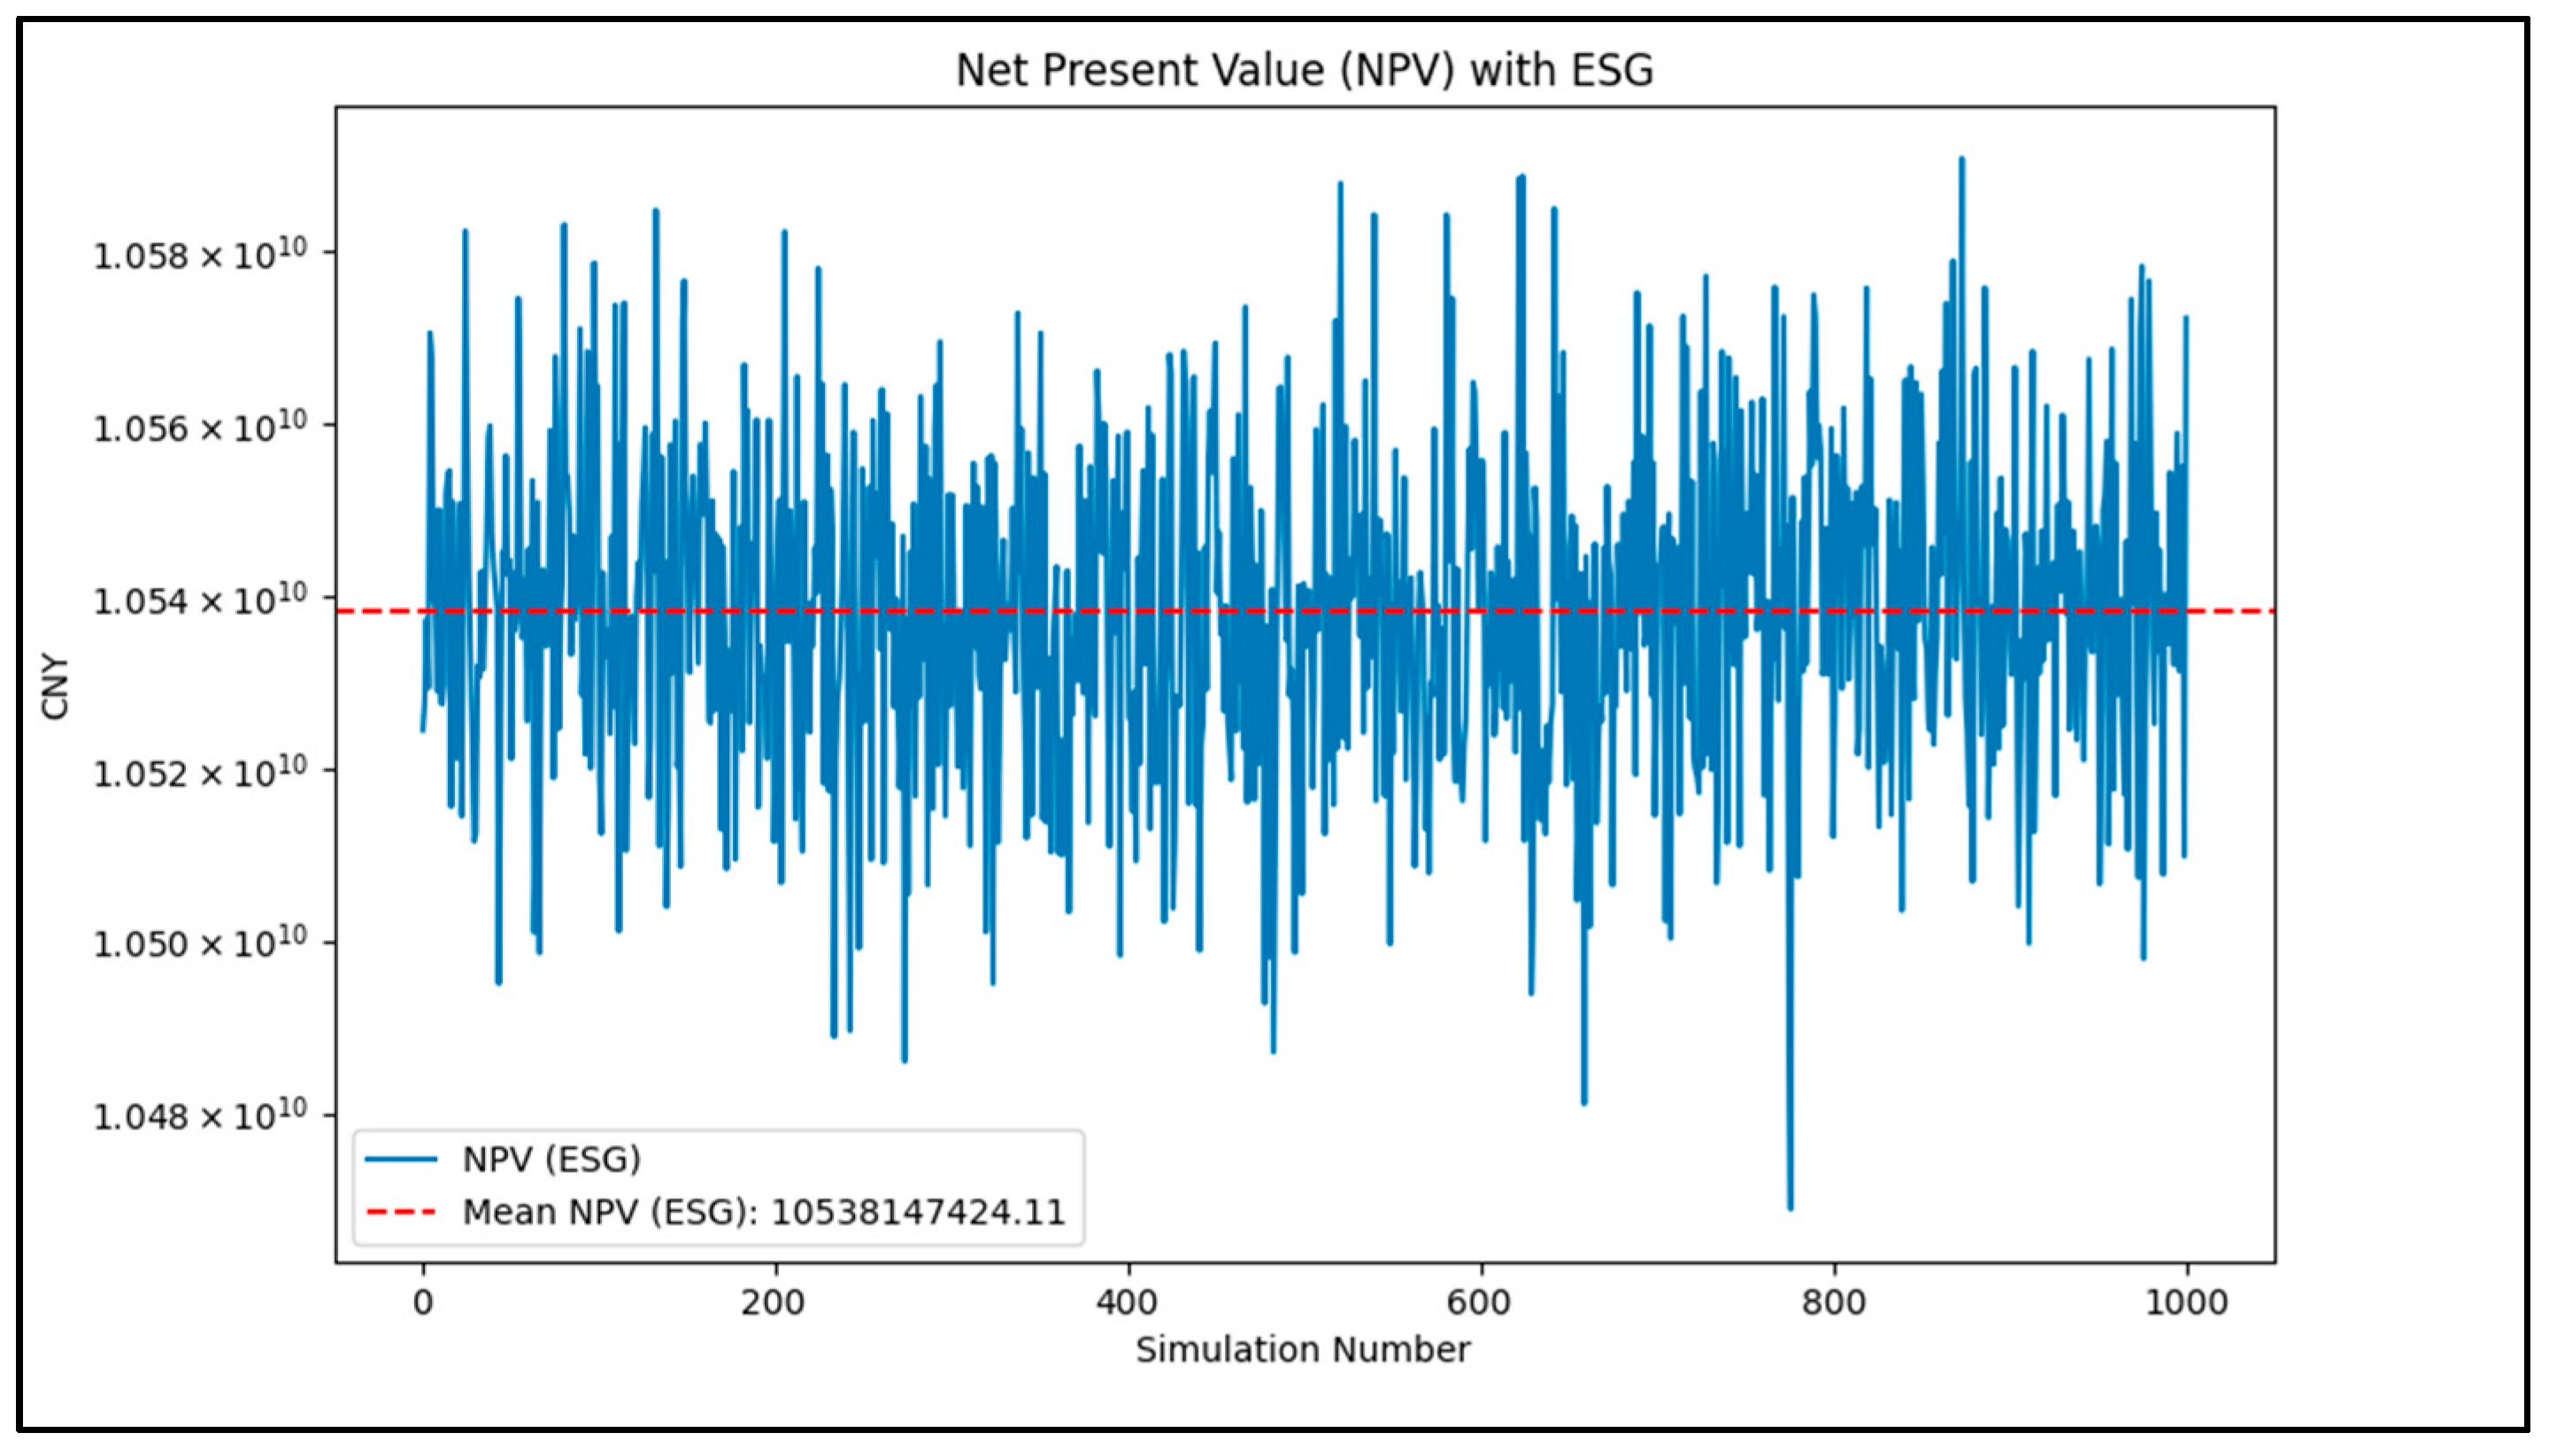
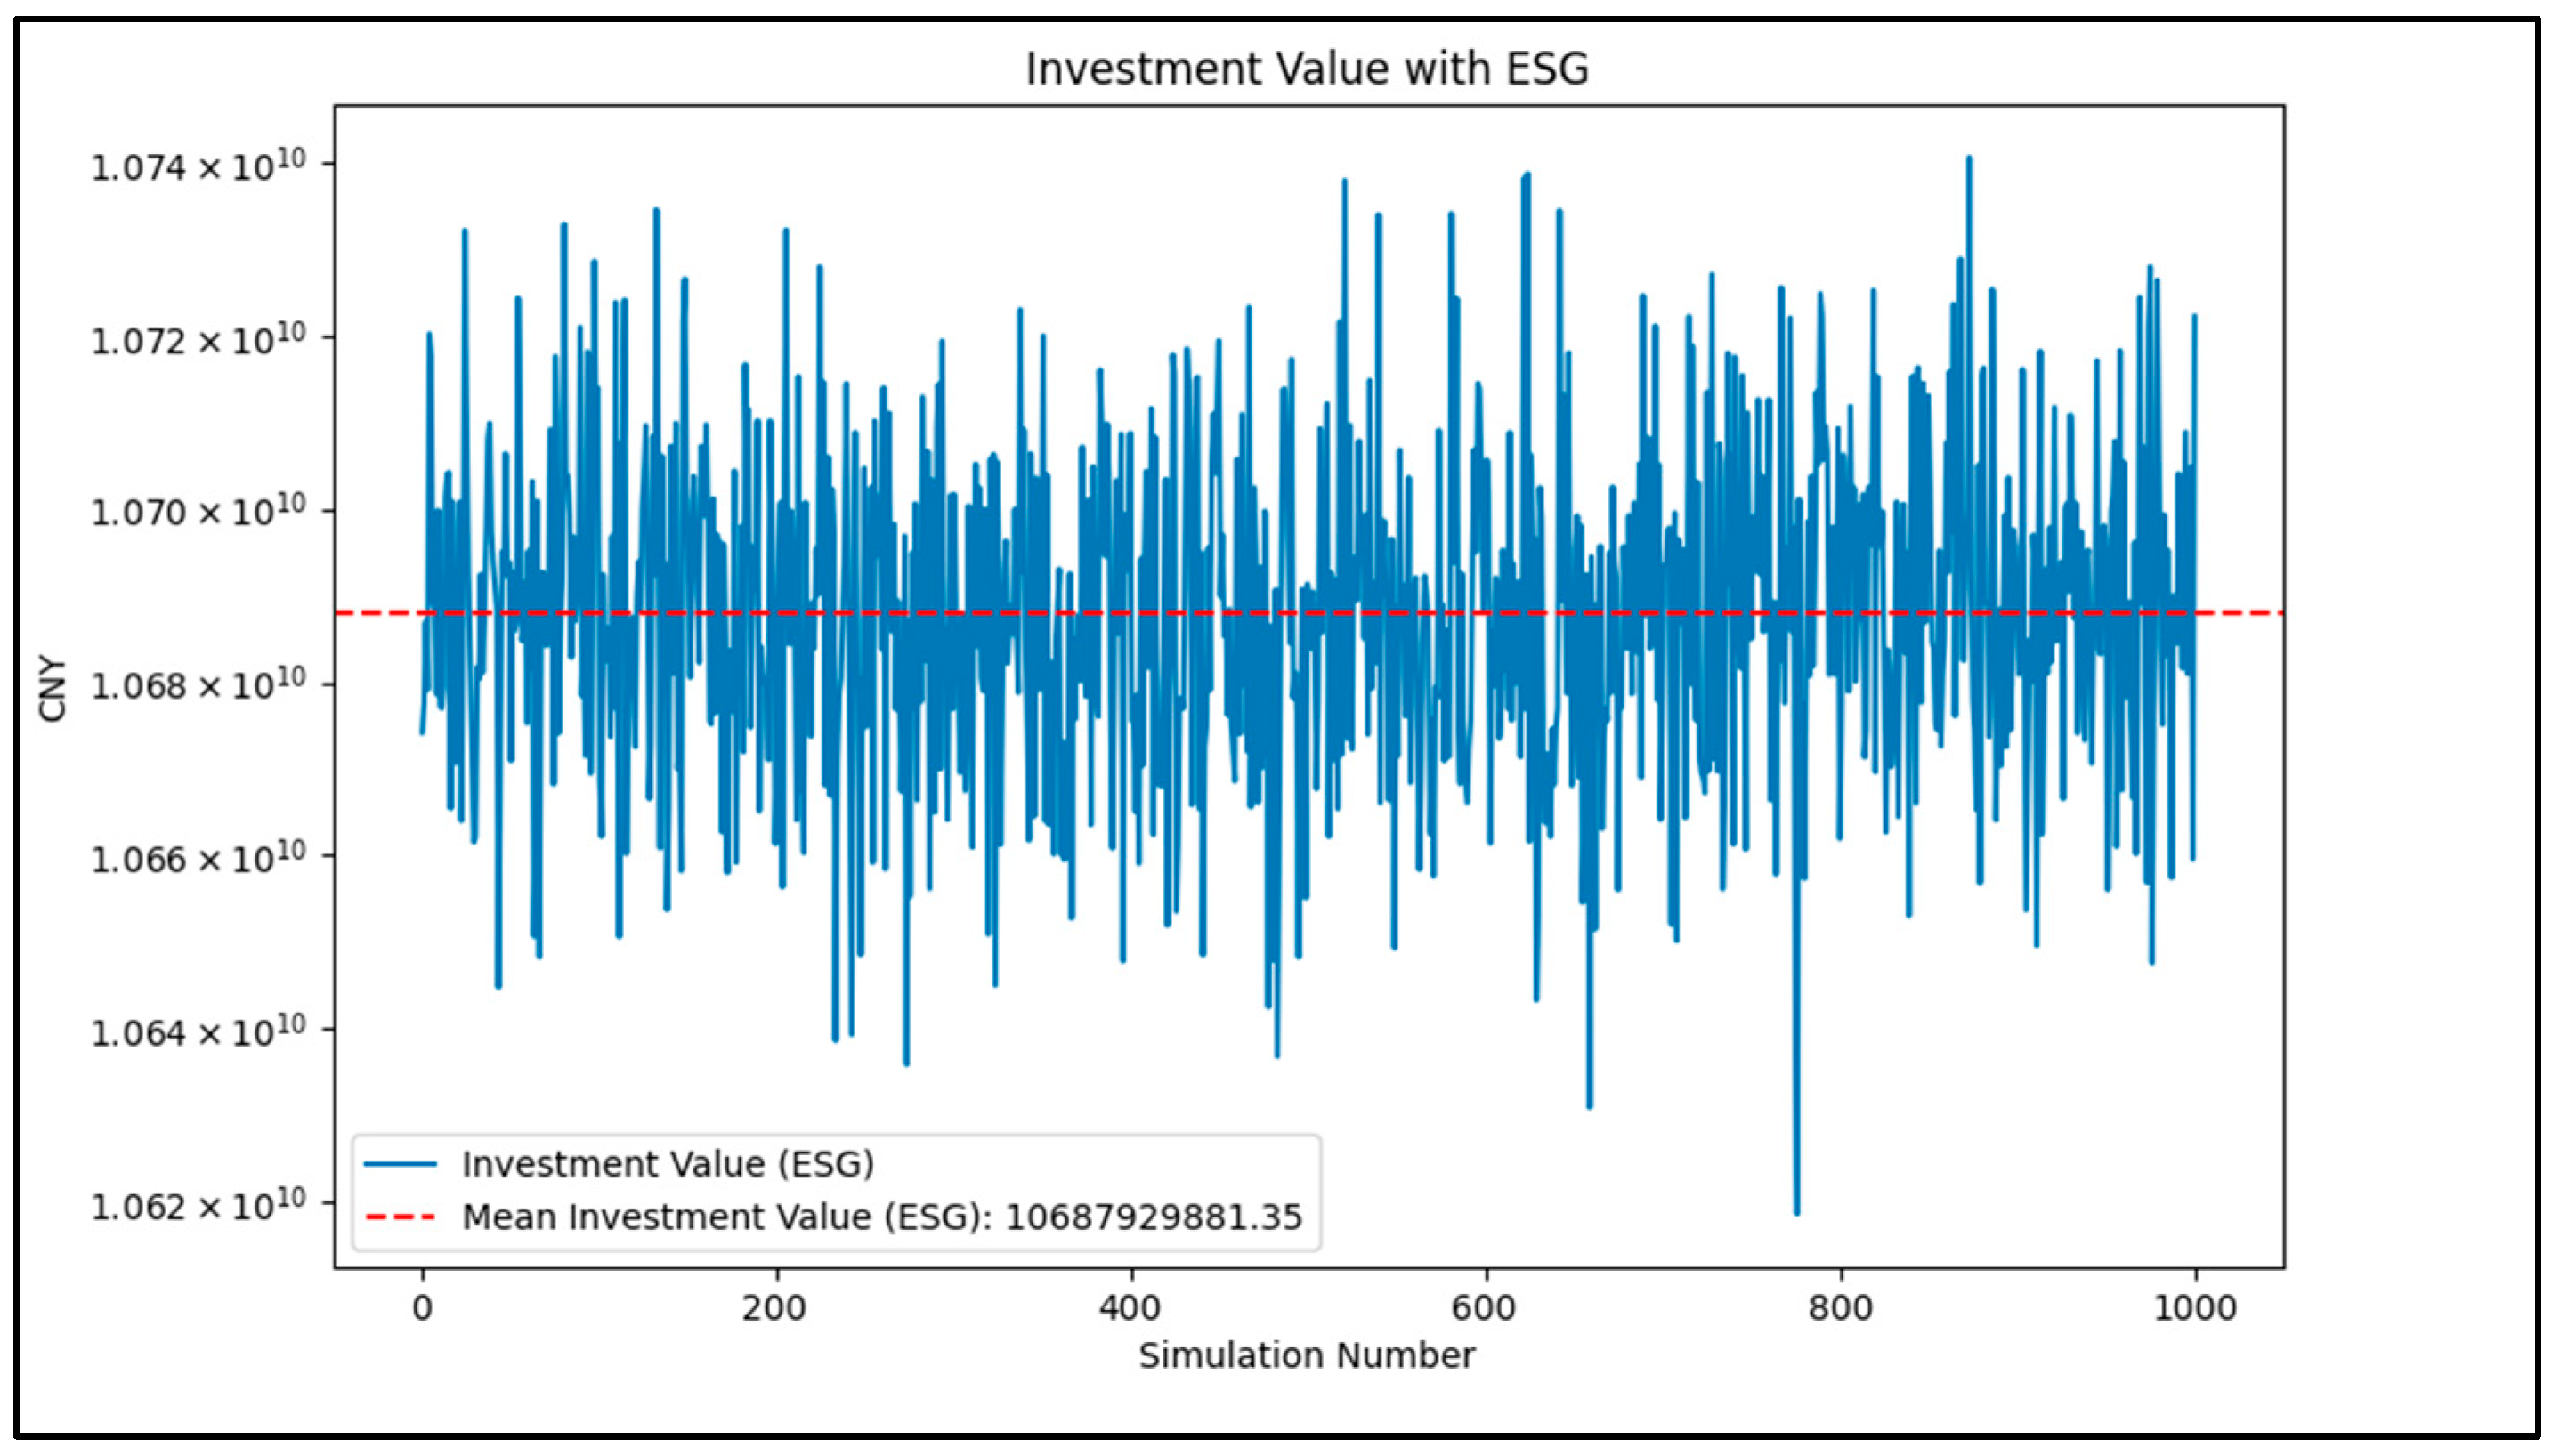
Due to the inherent randomness of the LSMC simulation, this study performs 1000 simulations of the investment value model with the same parameter settings. Each simulation is based on the results of 5000 simulated paths using the LSMC method.
Figure 7 shows the value of the PV project calculated using the NPV method, with the average NPV being CNY 10.54 billion. The results indicate that the project has a significant positive NPV, suggesting that investing in this project under the current conditions can bring substantial economic returns to investors. When using the Real Options Valuation (ROV) method, the average investment value (IV) of the project is CNY 10.69 billion (
Figure 8). The IV not only considers the project’s NPV but also includes the value of the real option (RO) present in the project (
Figure 9).
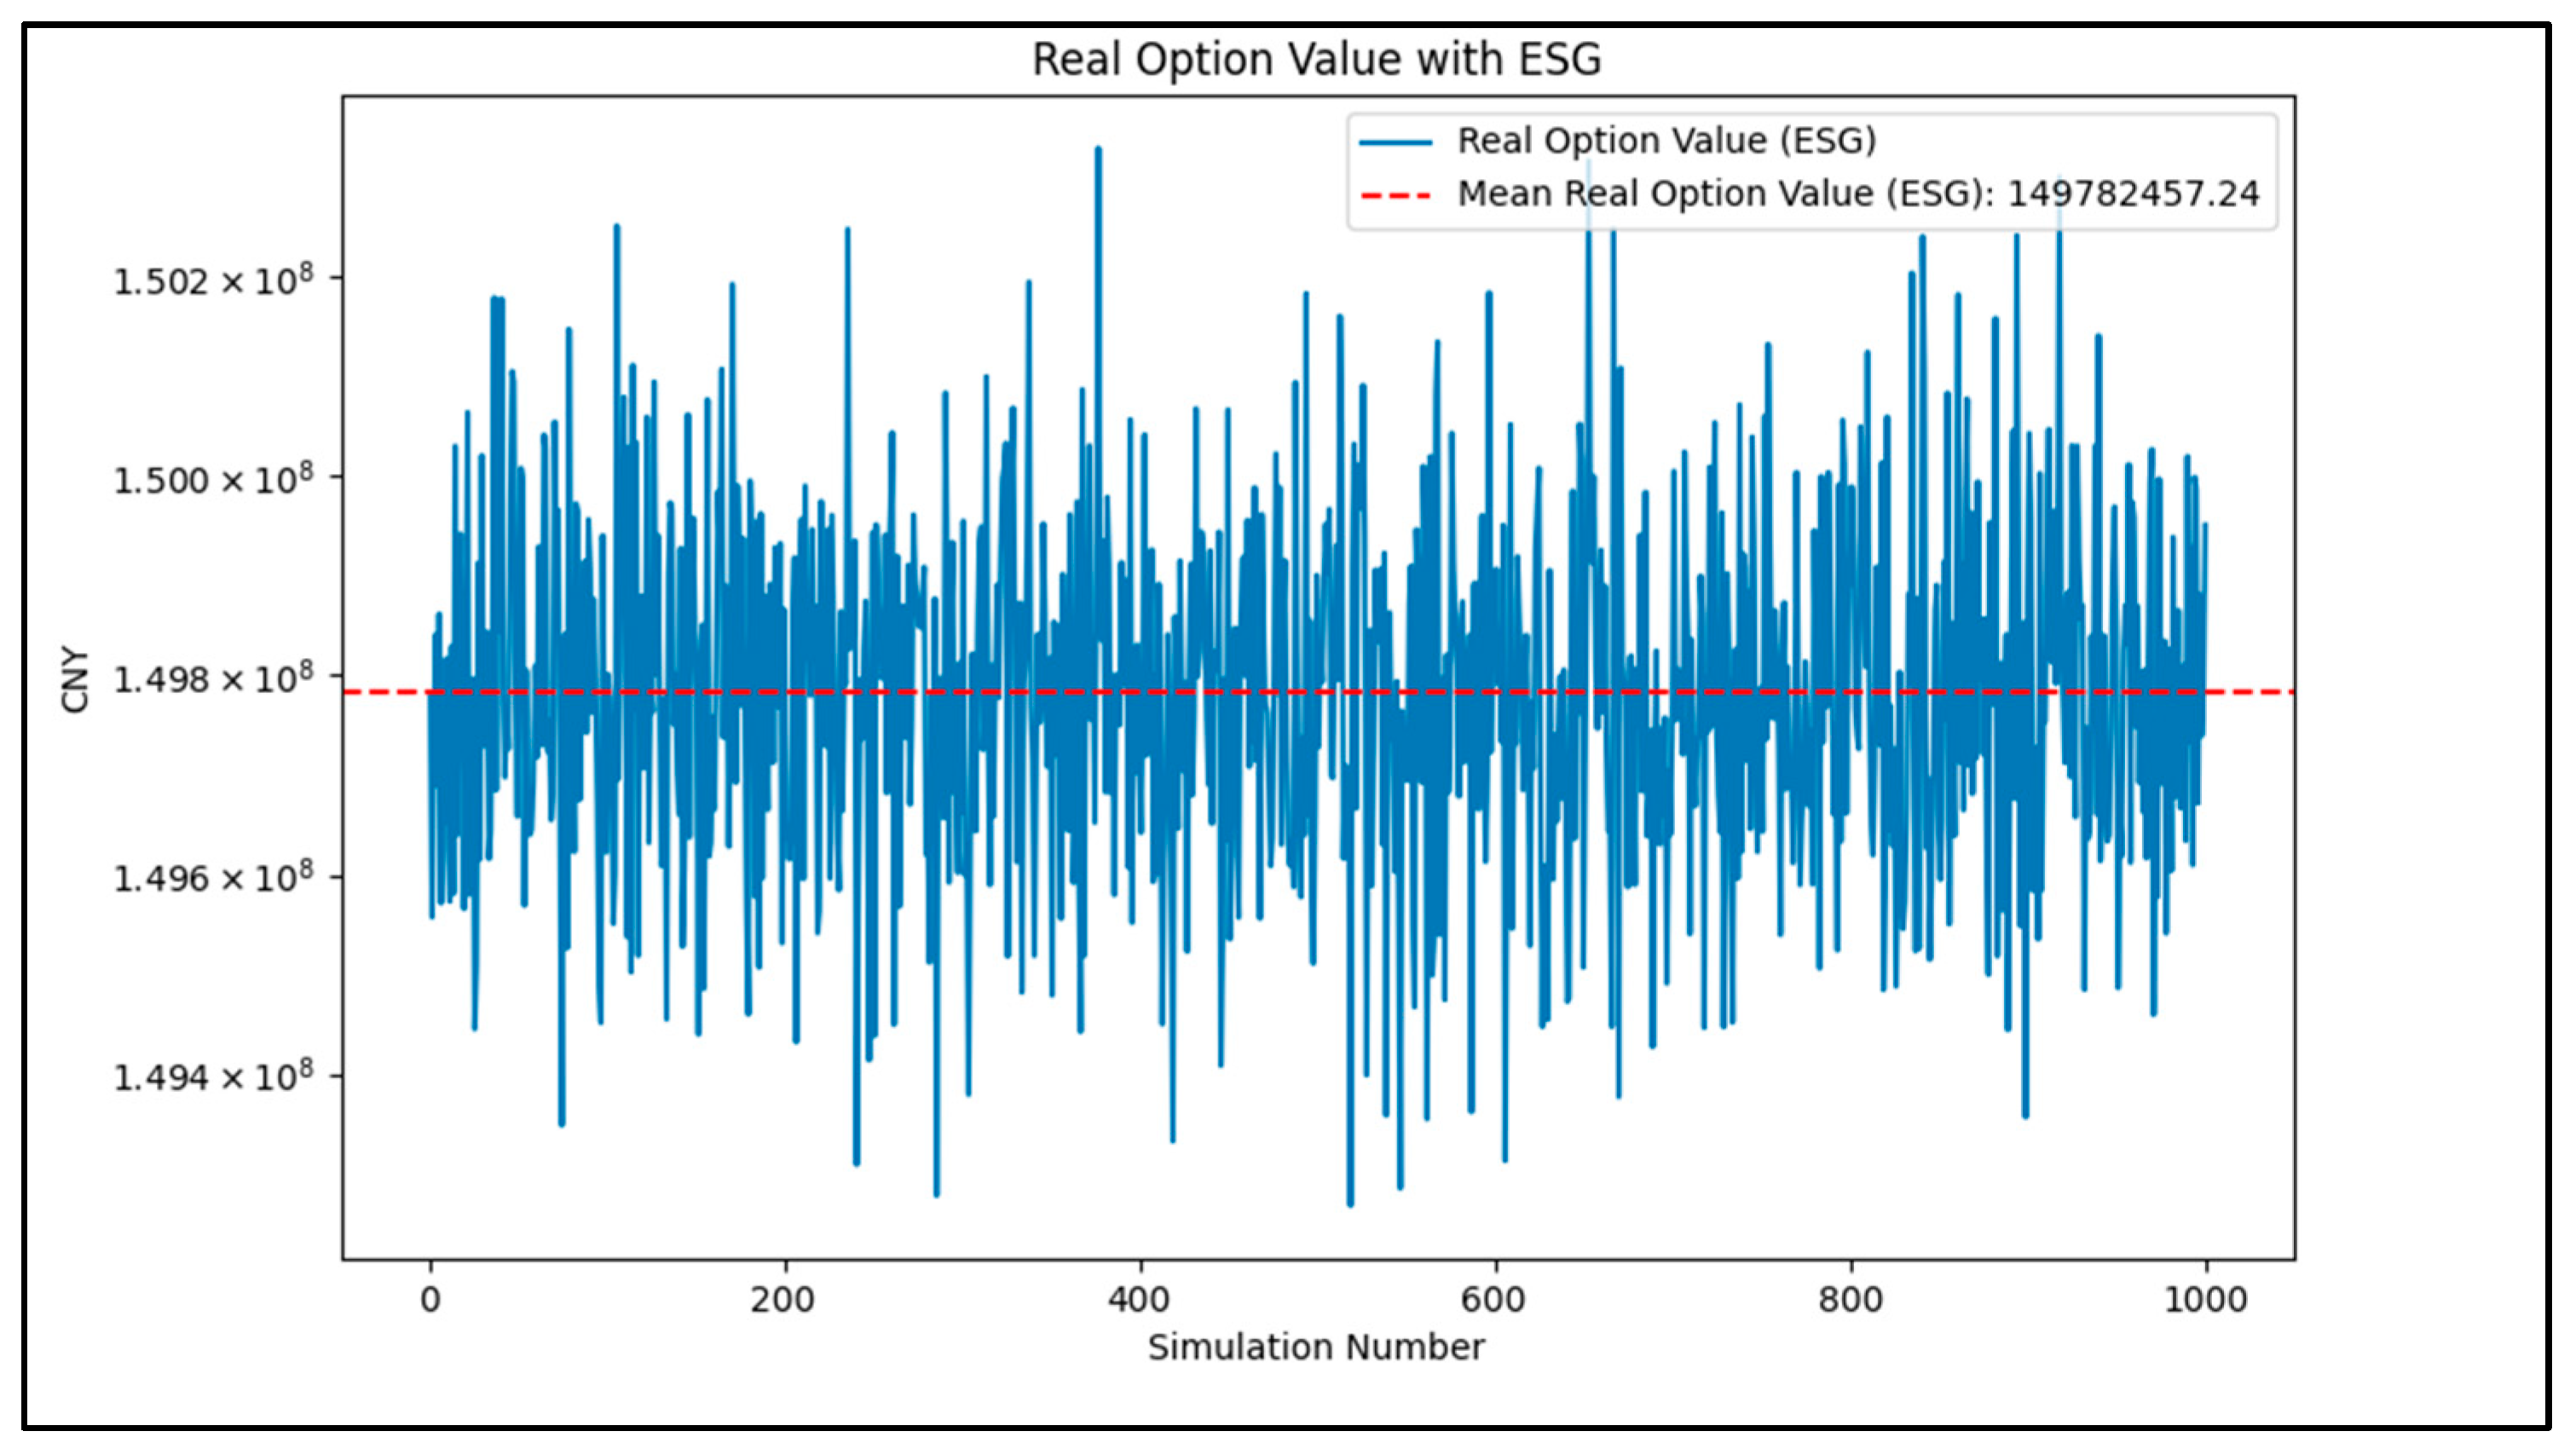
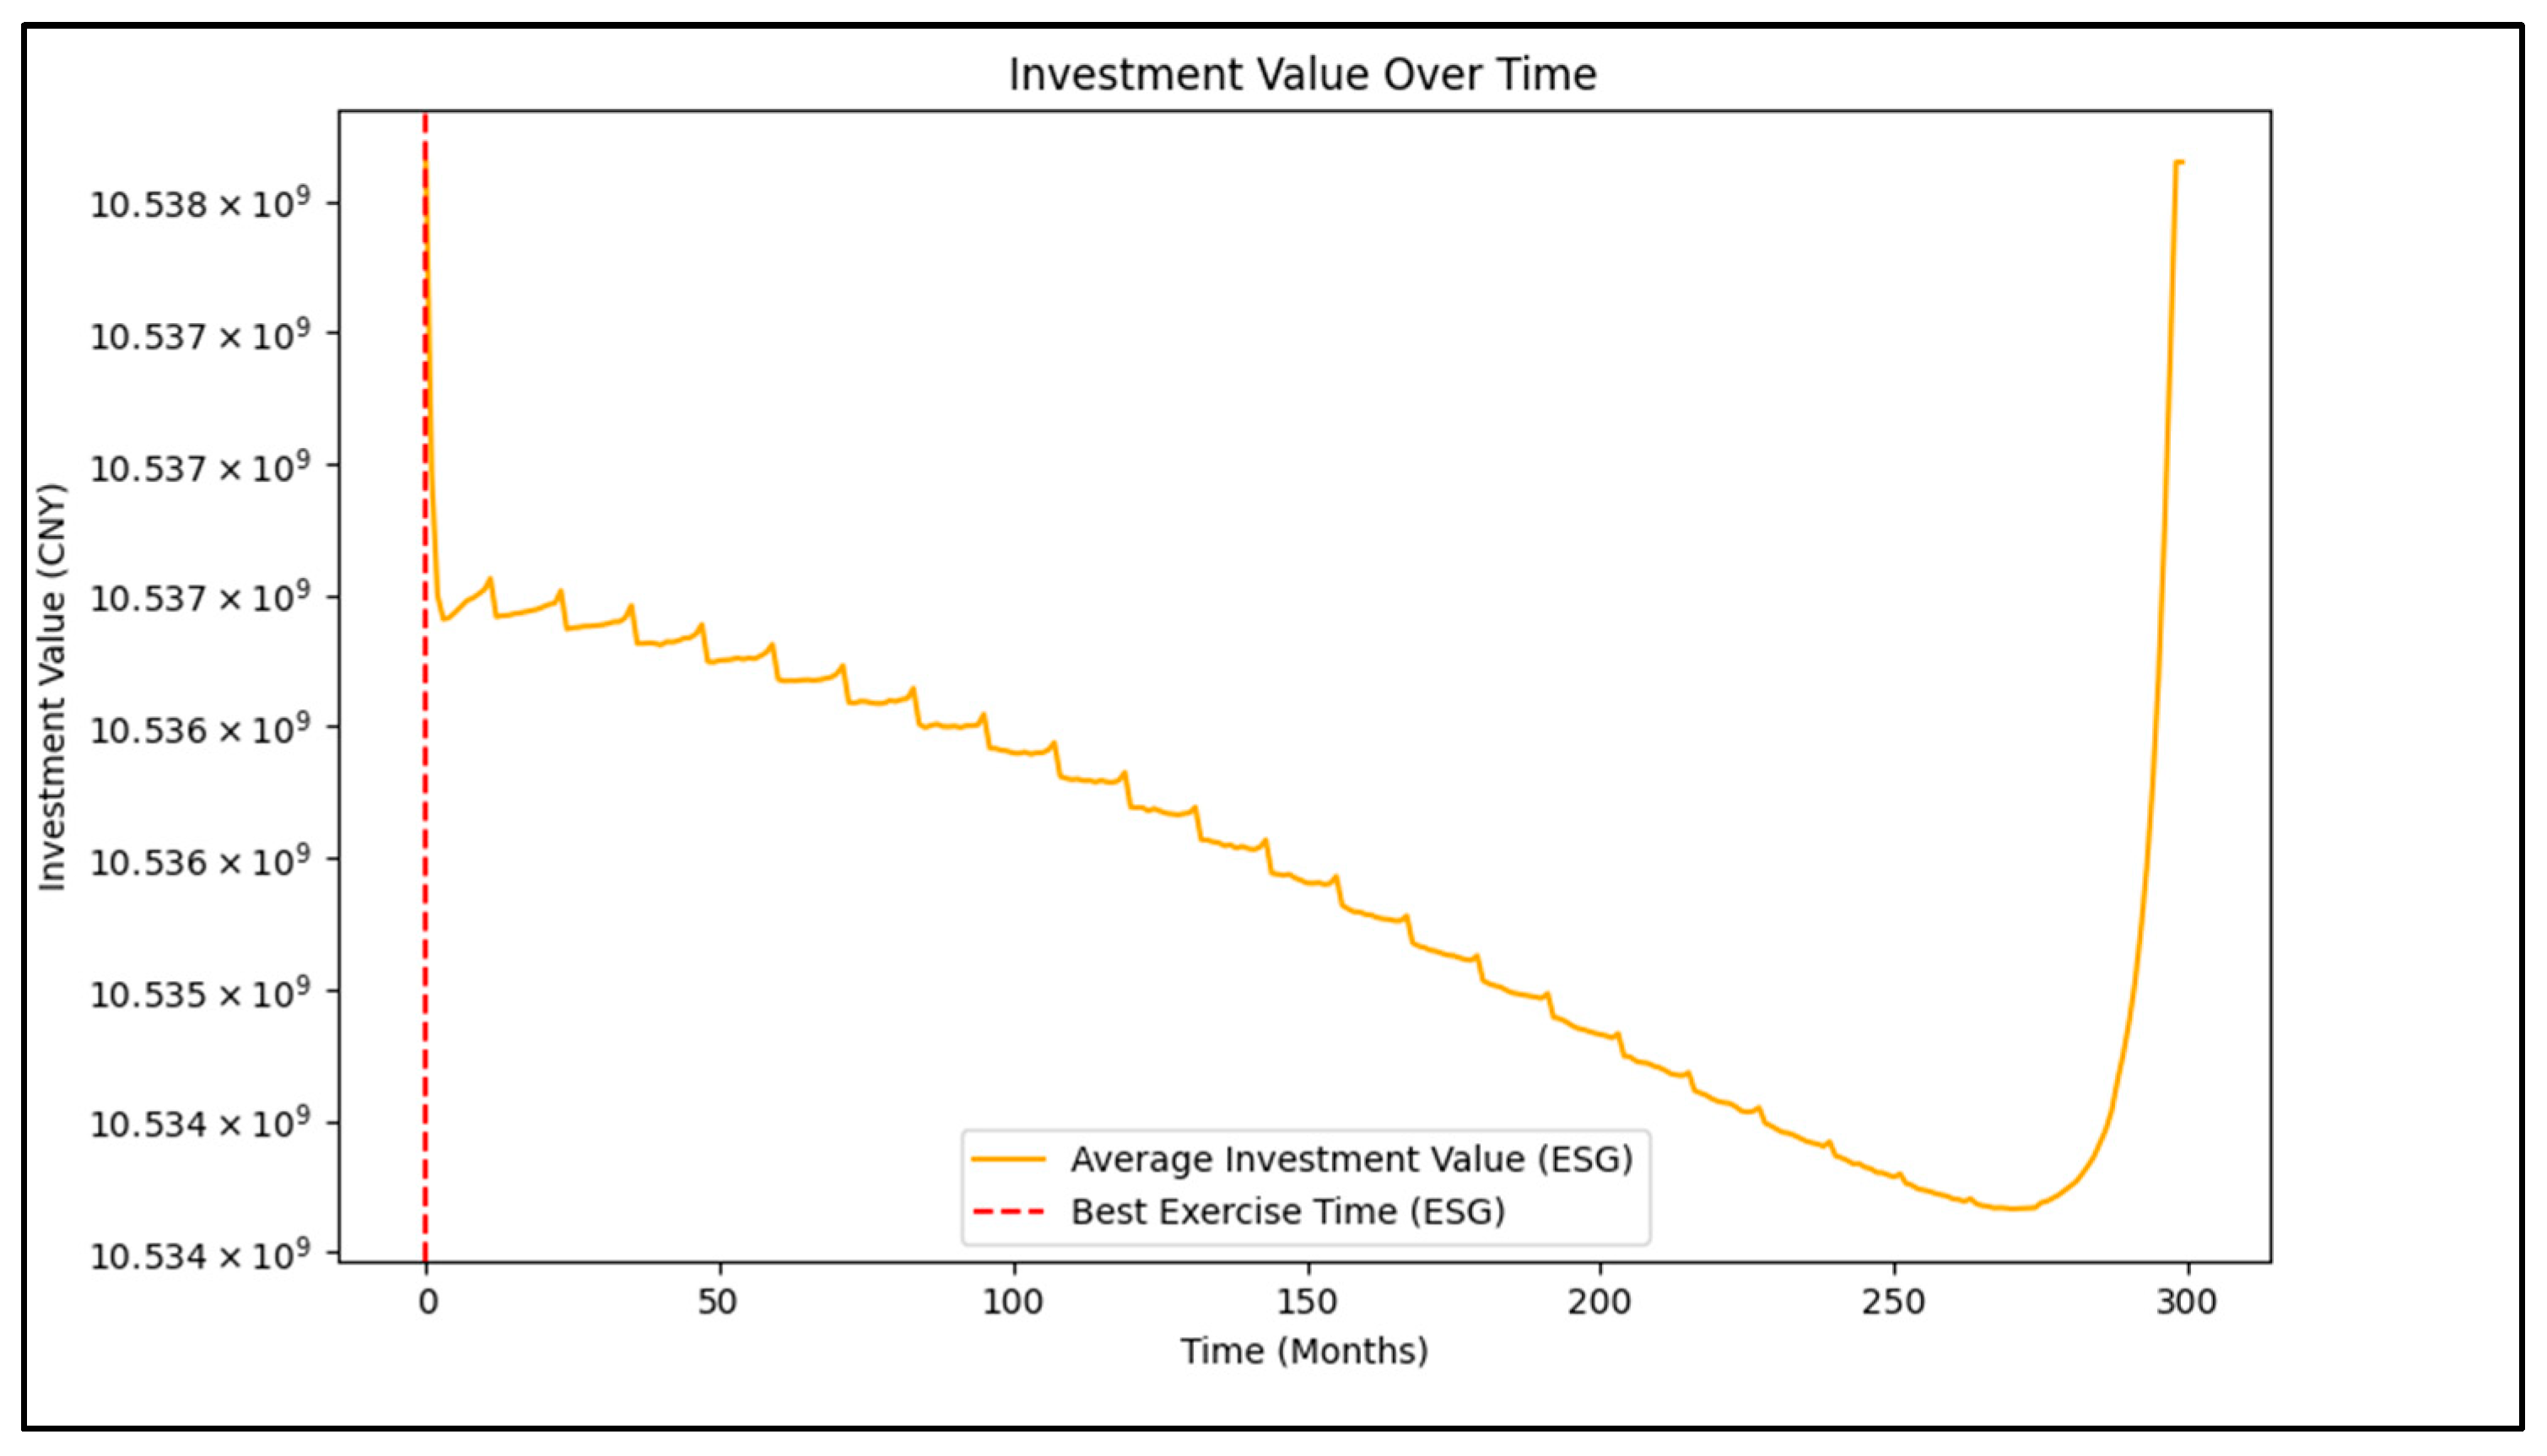
Figure 10 illustrates the simulated optimal investment timing. The simulation results indicate that the best time to exercise the option is January 2024, meaning that among all the simulated paths, the average investment value is highest at this point. If investment flexibility exists under the current market conditions, investors should exercise their investment decision in January 2024. Since the real option value (average ROV is CNY 150 million) is relatively low compared to the project’s overall investment value, it suggests that the flexibility of delaying the investment does not significantly increase the project value. Therefore, early investment can lock in the current high returns.
5.2. The Impact of ESG Factors on the Investment Value of Photovoltaic Projects
ESG factors play an increasingly important role in modern investment decisions. ESG factors not only affect a company’s social responsibility and sustainability but also significantly influence its financial performance and investment decisions.
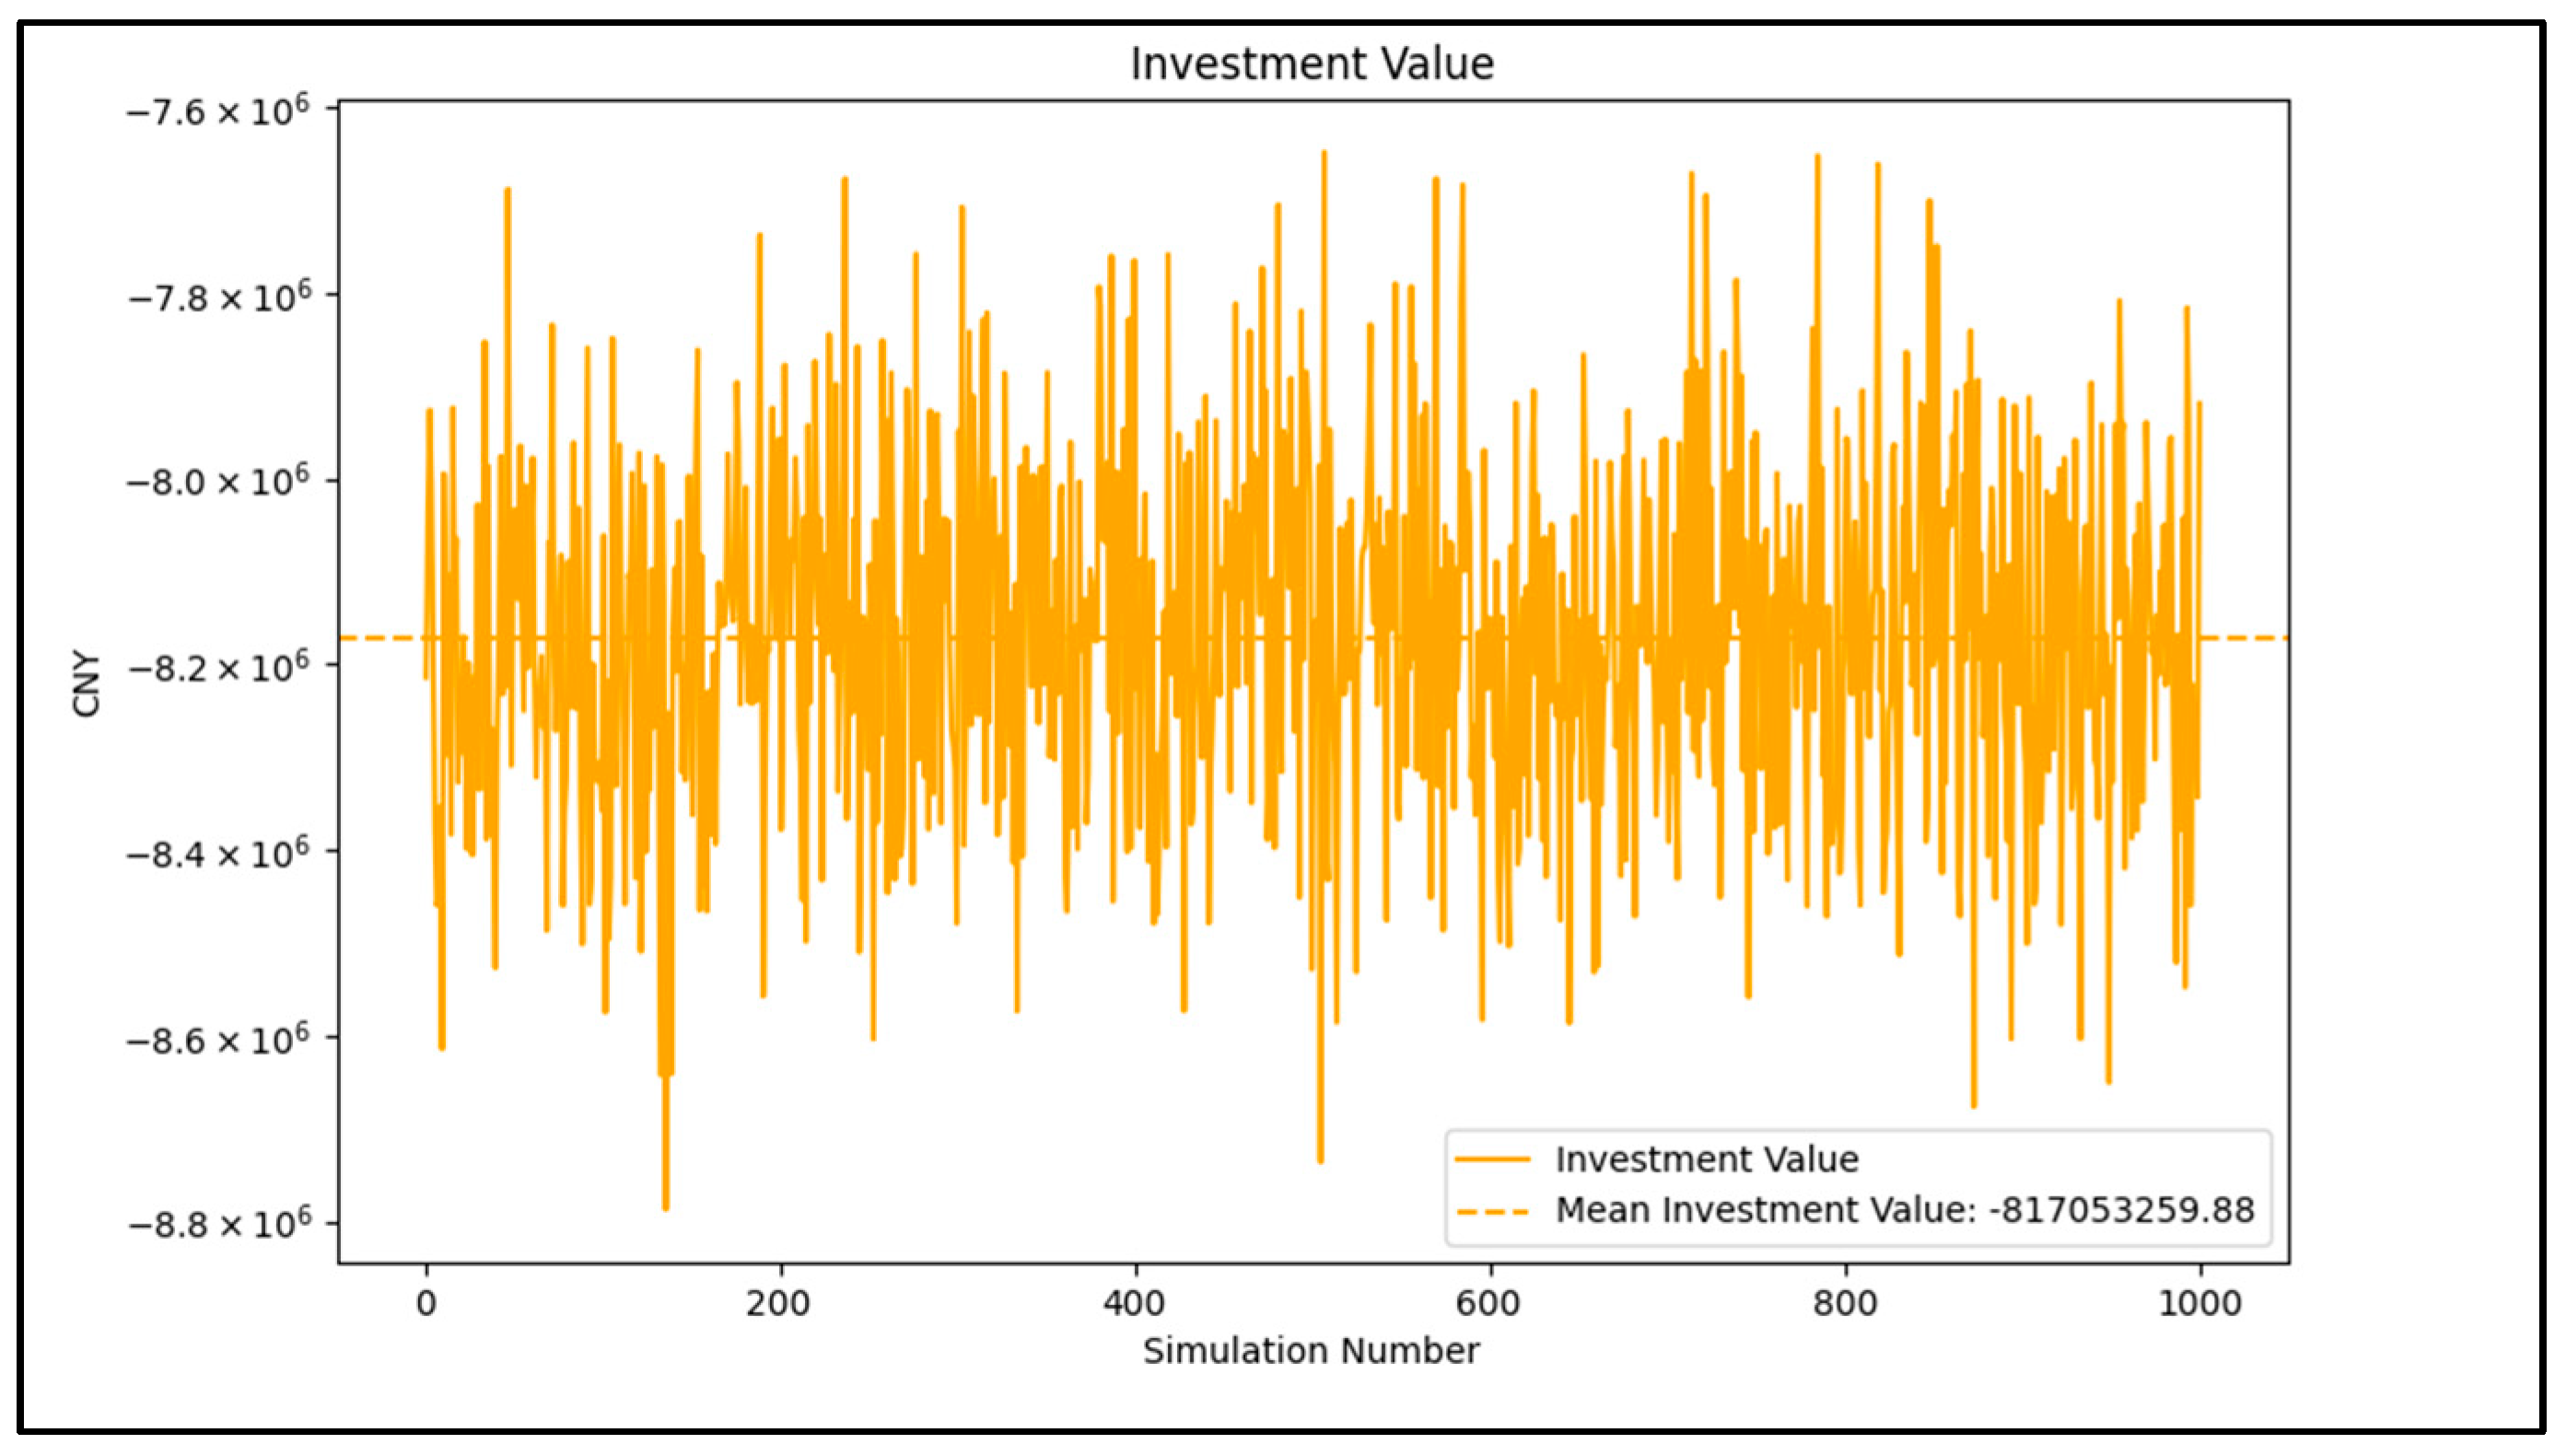
Figure 11 shows the investment value of the PV project without considering the ESG factors. In the absence of the ESG factors, the project’s average investment value is CNY −817,650,237. This negative NPV indicates that the expected cash flows are insufficient to cover the project’s investment and operating costs, making the project economically unviable without the support of the ESG factors, and posing significant economic risks to investors.
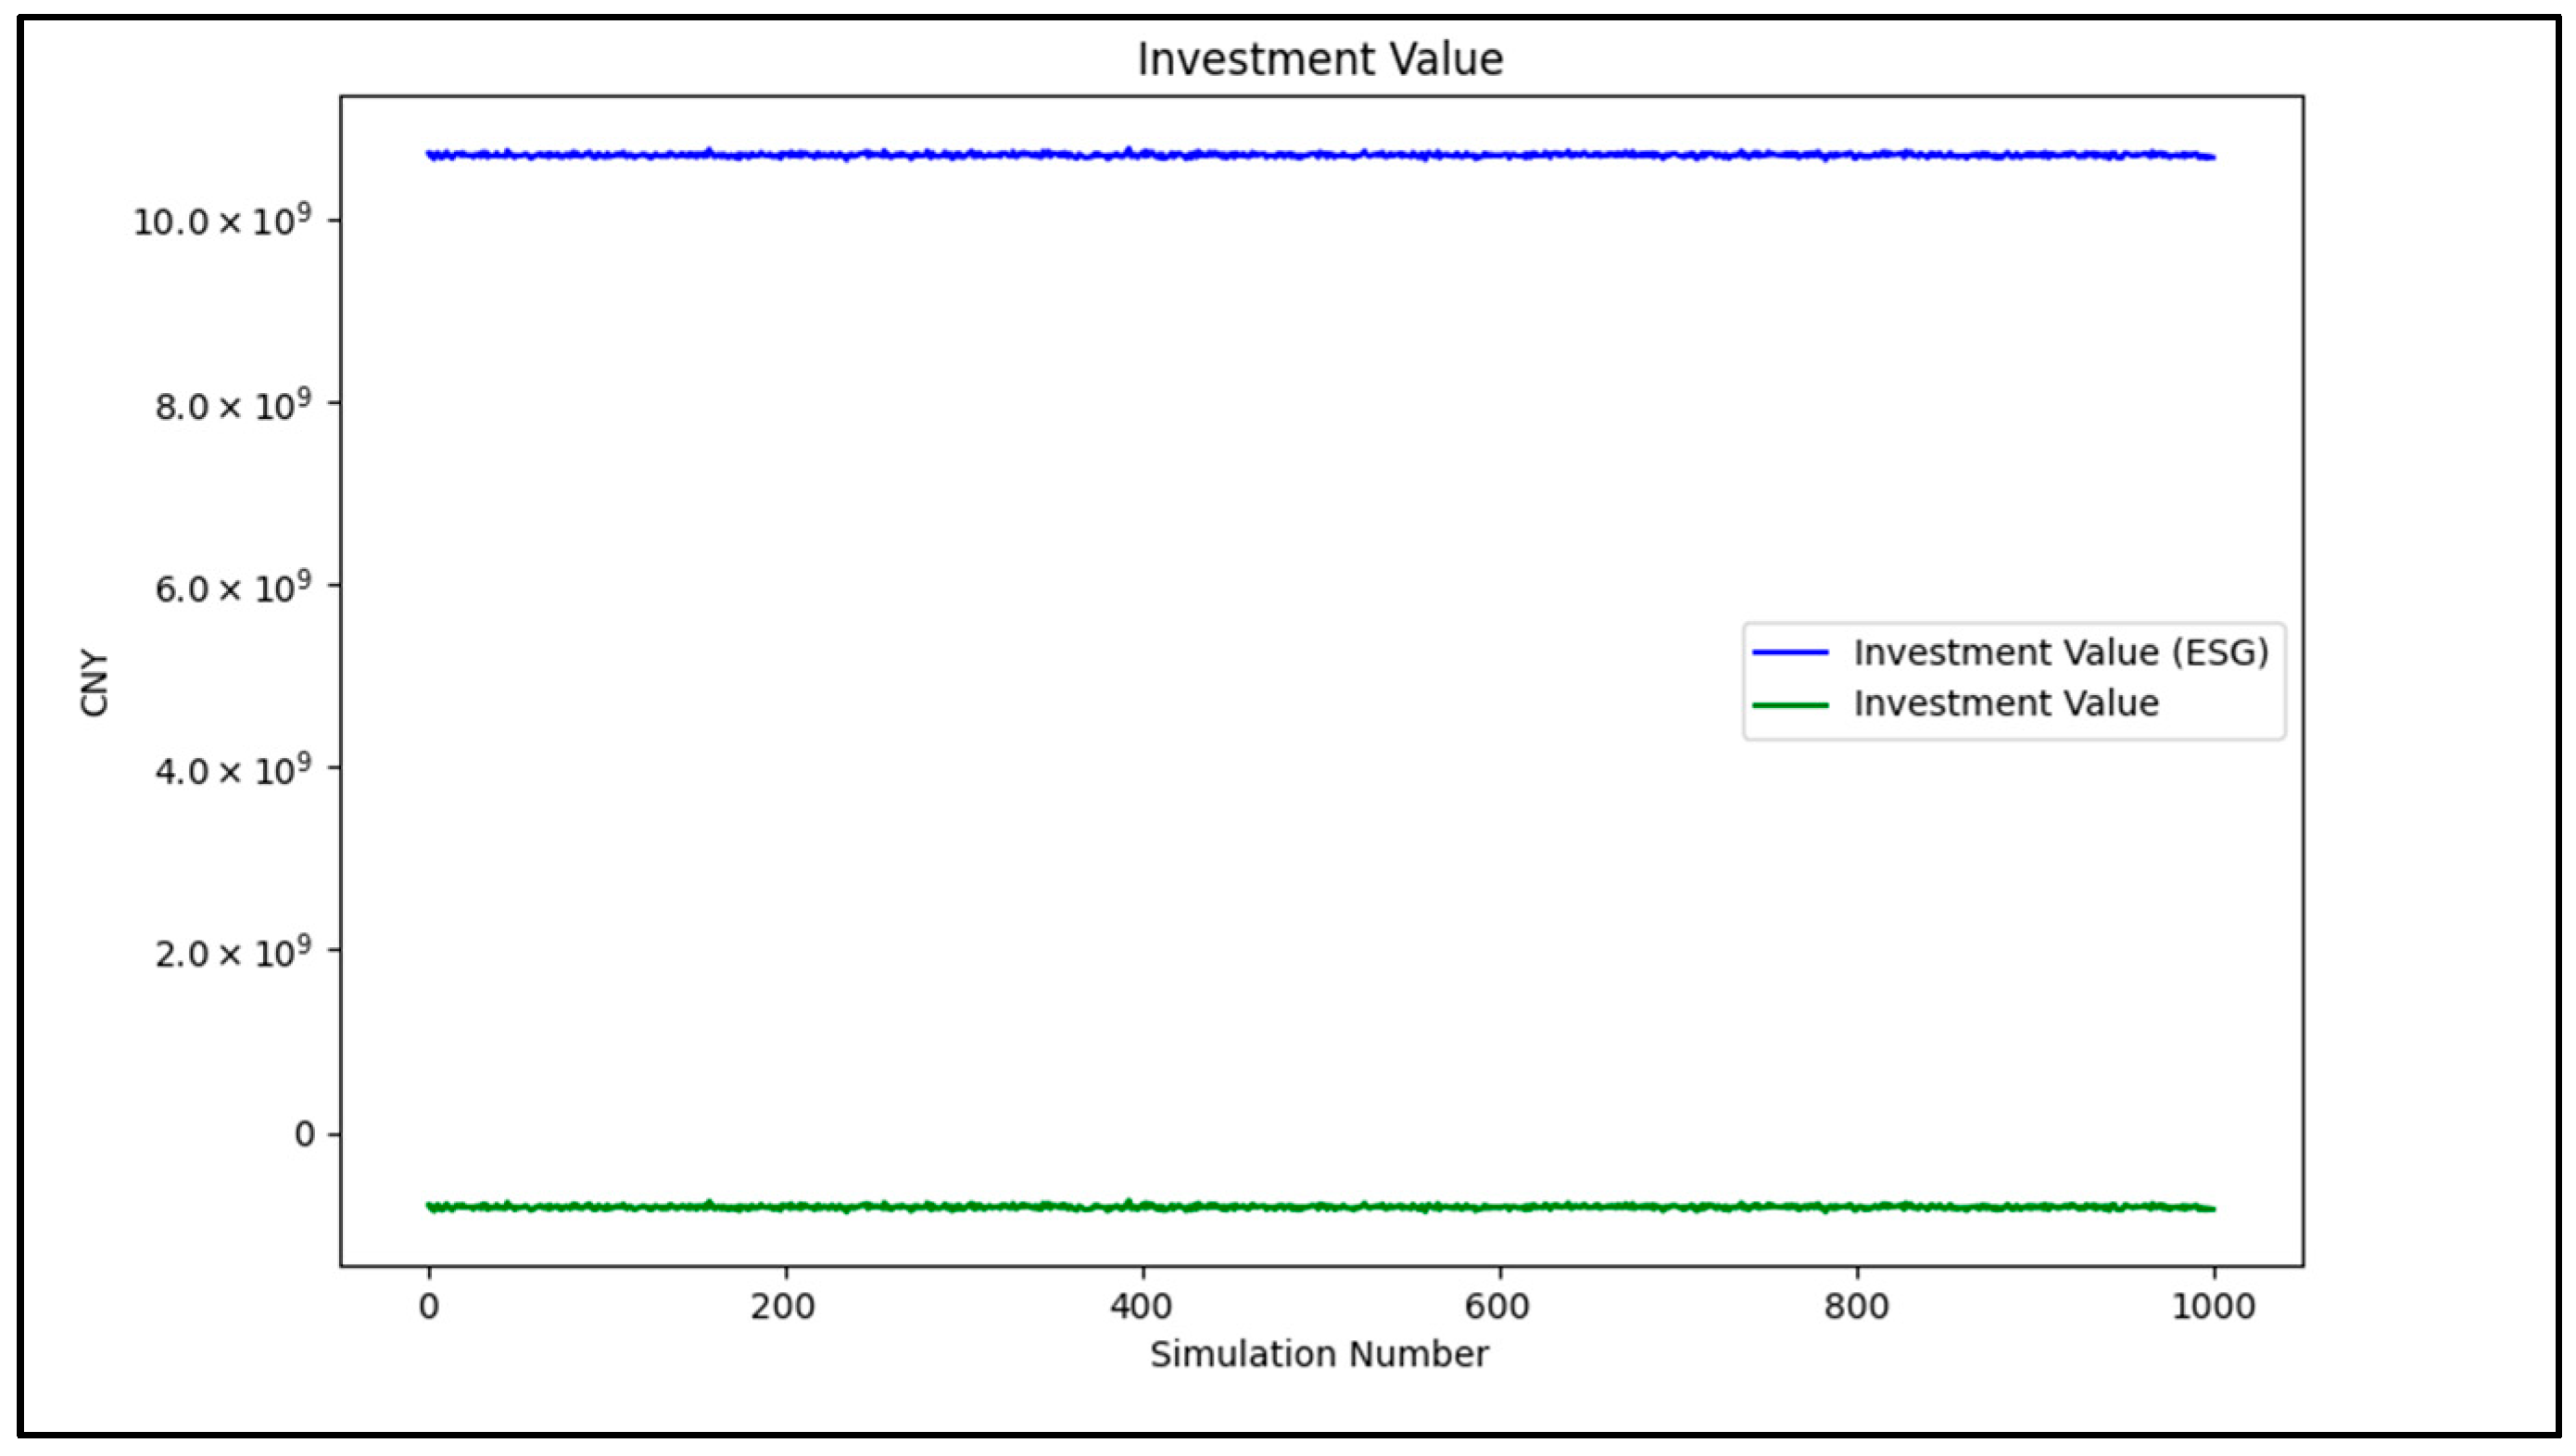
Figure 12 compares the project’s investment value with and without considering the ESG factors across 1000 simulation experiments. When the ESG factors are considered, the project exhibits a significant positive investment value. Specifically, the ESG factors enhance the project’s investment value in the following ways:
Environmental Benefits: The PV project significantly increases cash flow through carbon reduction. With the global emphasis on carbon reduction, the rising carbon trading prices further enhance the project’s environmental benefits, resulting in significant economic gains from environmental aspects [
43,
44].
Social Benefits: The PV project excels in job creation, greatly enhancing the monetary value of social benefits. By increasing employment opportunities, the project not only promotes local economic development but also gains broader social support, thereby improving the overall social benefits of the project.
Governance Benefits: Tax incentives from policy support significantly boost the project’s investment value. These tax incentives provide crucial financial support during the project’s operational phase, enhancing the project’s economic viability and ensuring stable operation within the policy framework.
In summary, the significant enhancement of the PV project’s investment value due to ESG factors underscores the importance of sustainable development. It demonstrates that considering ESG factors can bring higher economic returns to investors in the current economic environment. For policy-makers, further strengthening support for renewable energy projects, especially in terms of environmental protection, social responsibility, and governance transparency, will help promote sustainable economic development.
5.3. Sensitivity Analysis
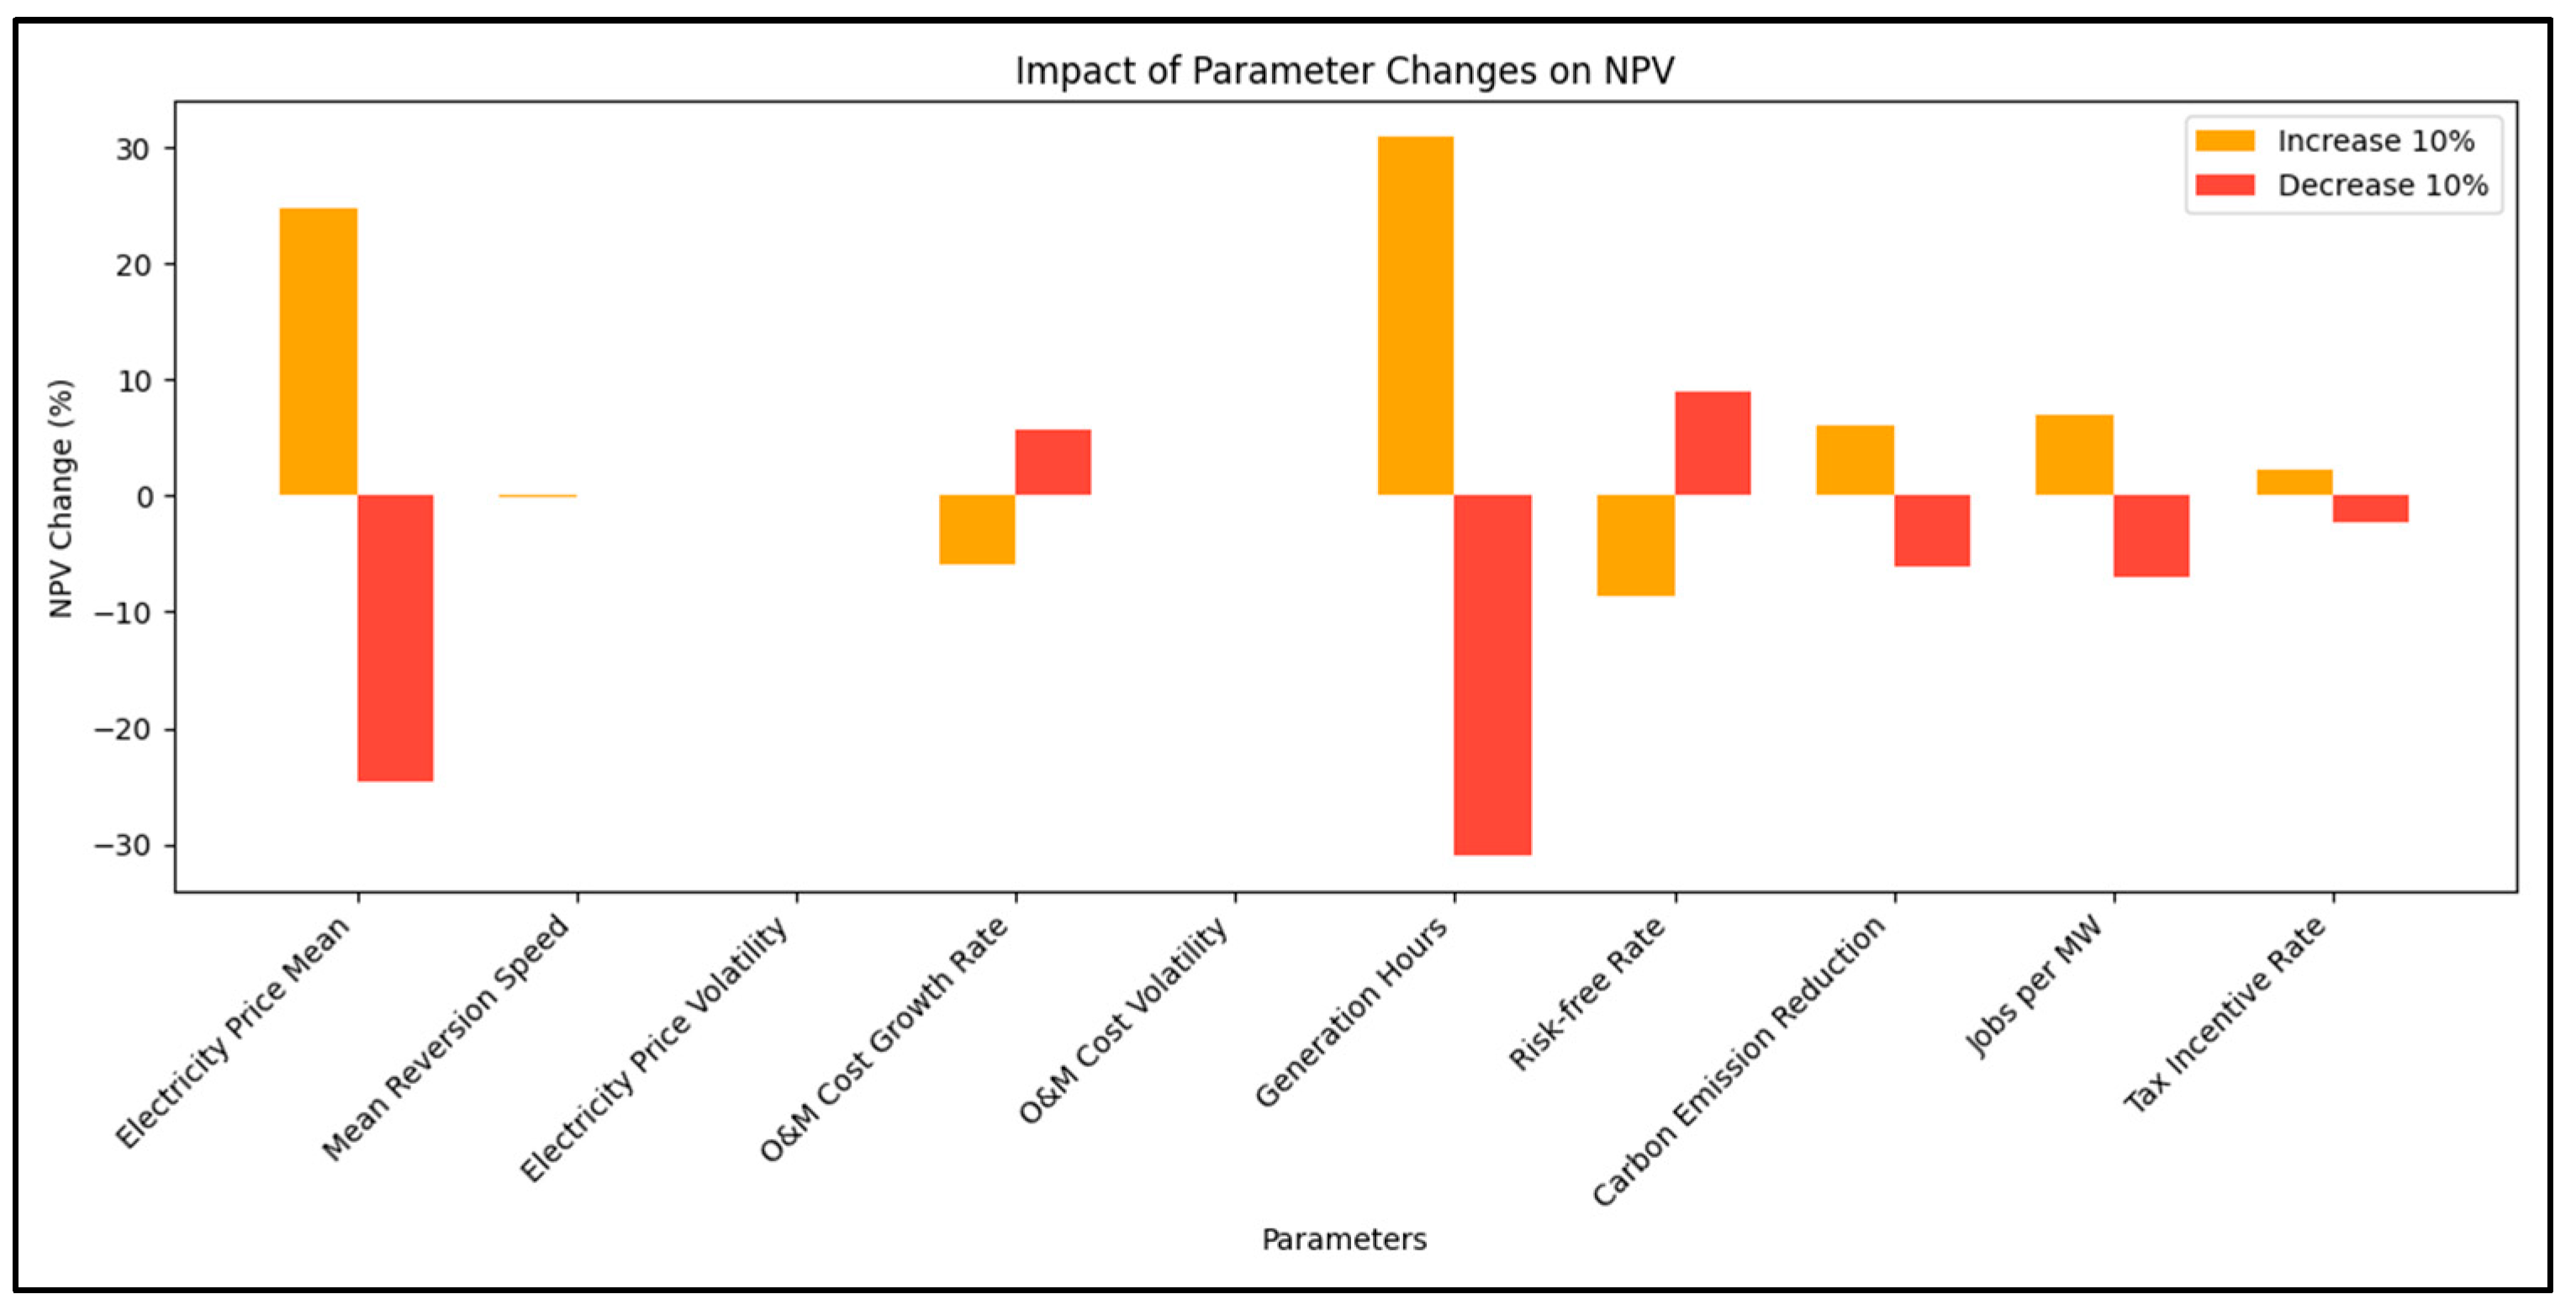
Figure 13 illustrates the impact of a 10% variation in key parameters on the project’s NPV. From the analysis, it is evident that the mean electricity price, generation hours, risk-free interest rate, and operating cost growth rate have the most significant impact on the project’s NPV. The NPV is highly sensitive to changes in the mean electricity price. A 10% increase in the mean electricity price results in a 24.76% increase in NPV, while a 10% decrease leads to a 24.63% decrease. This high sensitivity indicates that the economic benefits of the PV project are largely dependent on market electricity price fluctuations. Changes in the generation hours significantly impact the NPV. A 10% increase in the generation hours results in a 30.85% increase in NPV, whereas a 10% decrease results in a 30.88% decrease. This reflects that the revenue of the PV project is directly linked to the amount of electricity generated, making generation hours a crucial factor in the project’s economic performance. Variations in the risk-free interest rate also significantly affect the NPV. A 10% increase in the interest rate leads to an 8.69% decrease in NPV, while a 10% decrease in the interest rate results in a 9.04% increase in NPV. This is because a higher discount rate reduces the present value of future cash flows, thereby lowering the NPV. The NPV is also sensitive to changes in the operating cost growth rate. A 10% increase in the growth rate results in a 5.88% decrease in NPV, while a 10% decrease leads to a 5.67% increase in NPV. Higher growth rates directly increase the long-term operating costs of the project, thereby reducing the net cash flow and overall project value.
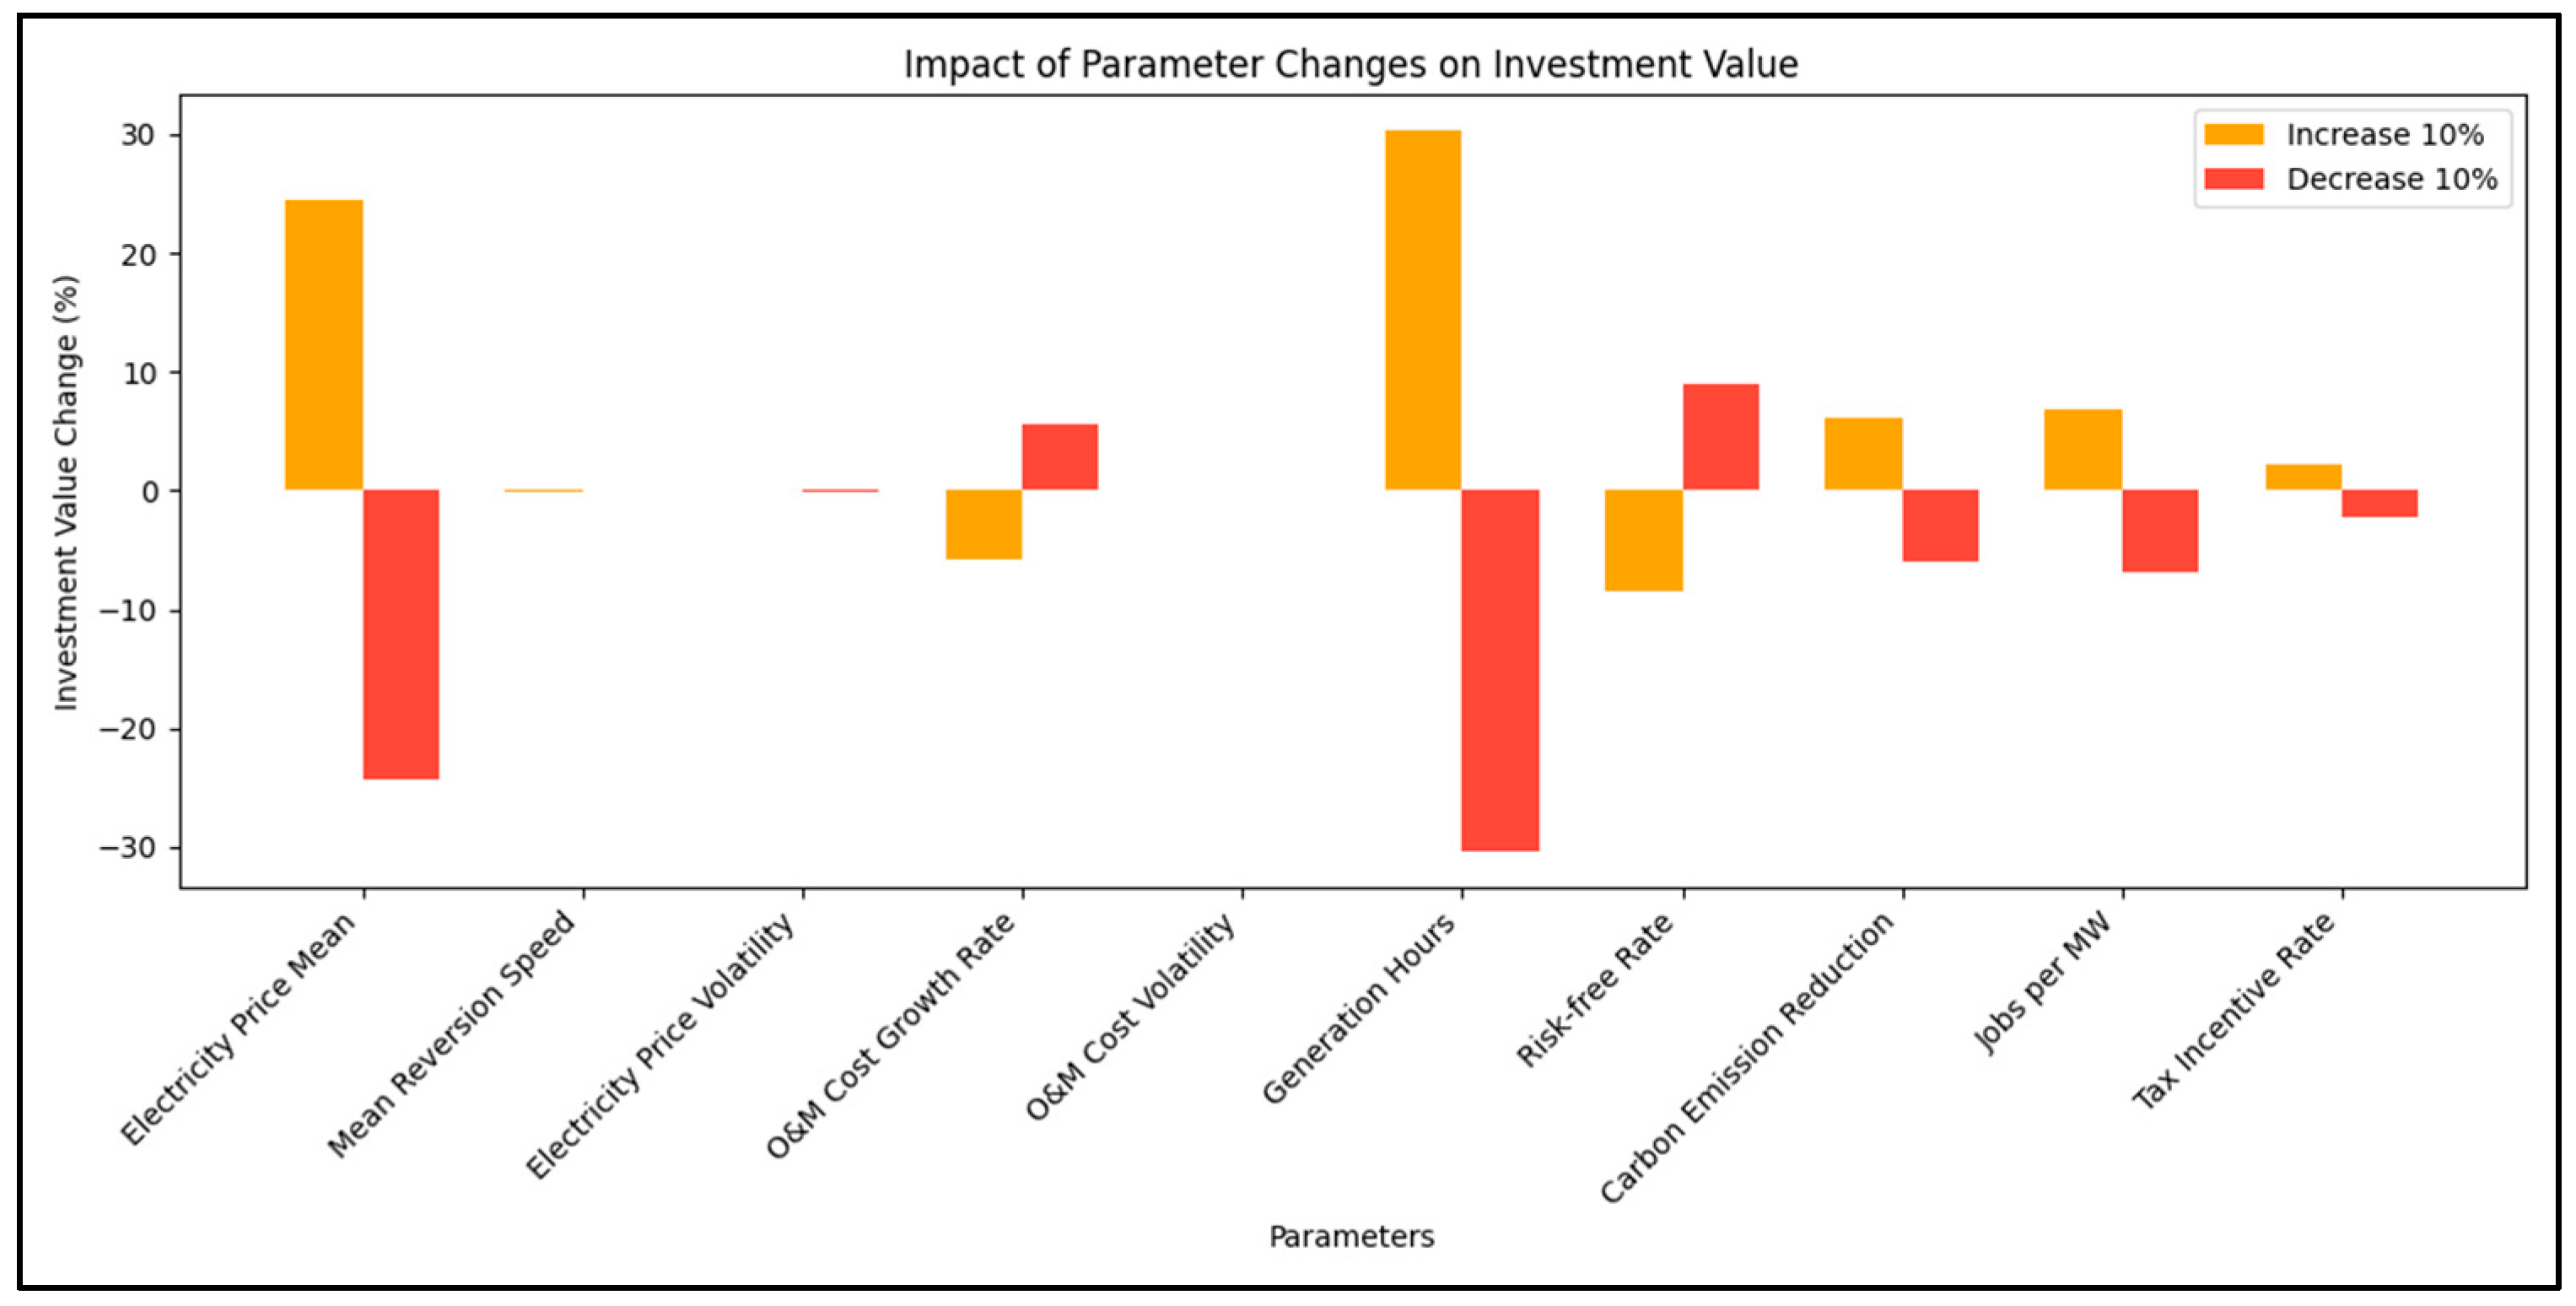
Figure 14 shows the impact of a 10% variation in parameters on the project’s investment value. The key parameters affecting the investment value are the mean electricity price, generation hours, risk-free interest rate, and operating cost growth rate. The change in the mean electricity price significantly impacts the investment value. A 10% increase results in a 24.41% increase in the investment value, while a 10% decrease leads to a 24.28% decrease. This indicates that market electricity prices directly determine the cash inflows of the PV project, thereby affecting its economic benefits. Changes in generation hours also have a substantial impact on the investment value. A 10% increase in generation hours results in a 30.27% increase in the investment value, whereas a 10% decrease results in a 30.30% decrease. This highlights that generation efficiency directly influences the project’s revenue level. Variations in the risk-free interest rate significantly affect the investment value. A 10% increase in the interest rate leads to an 8.54% decrease in the investment value, while a 10% decrease results in an 8.89% increase. This is because the discount rate of future cash flows directly influences the present value of the project’s cash inflows. The change in the operating cost growth rate also importantly impacts the investment value. A 10% increase in the growth rate results in a 5.77% decrease in investment value, while a 10% decrease leads to a 5.57% increase. Higher growth rates increase future operating expenses, reducing the project’s total investment value.
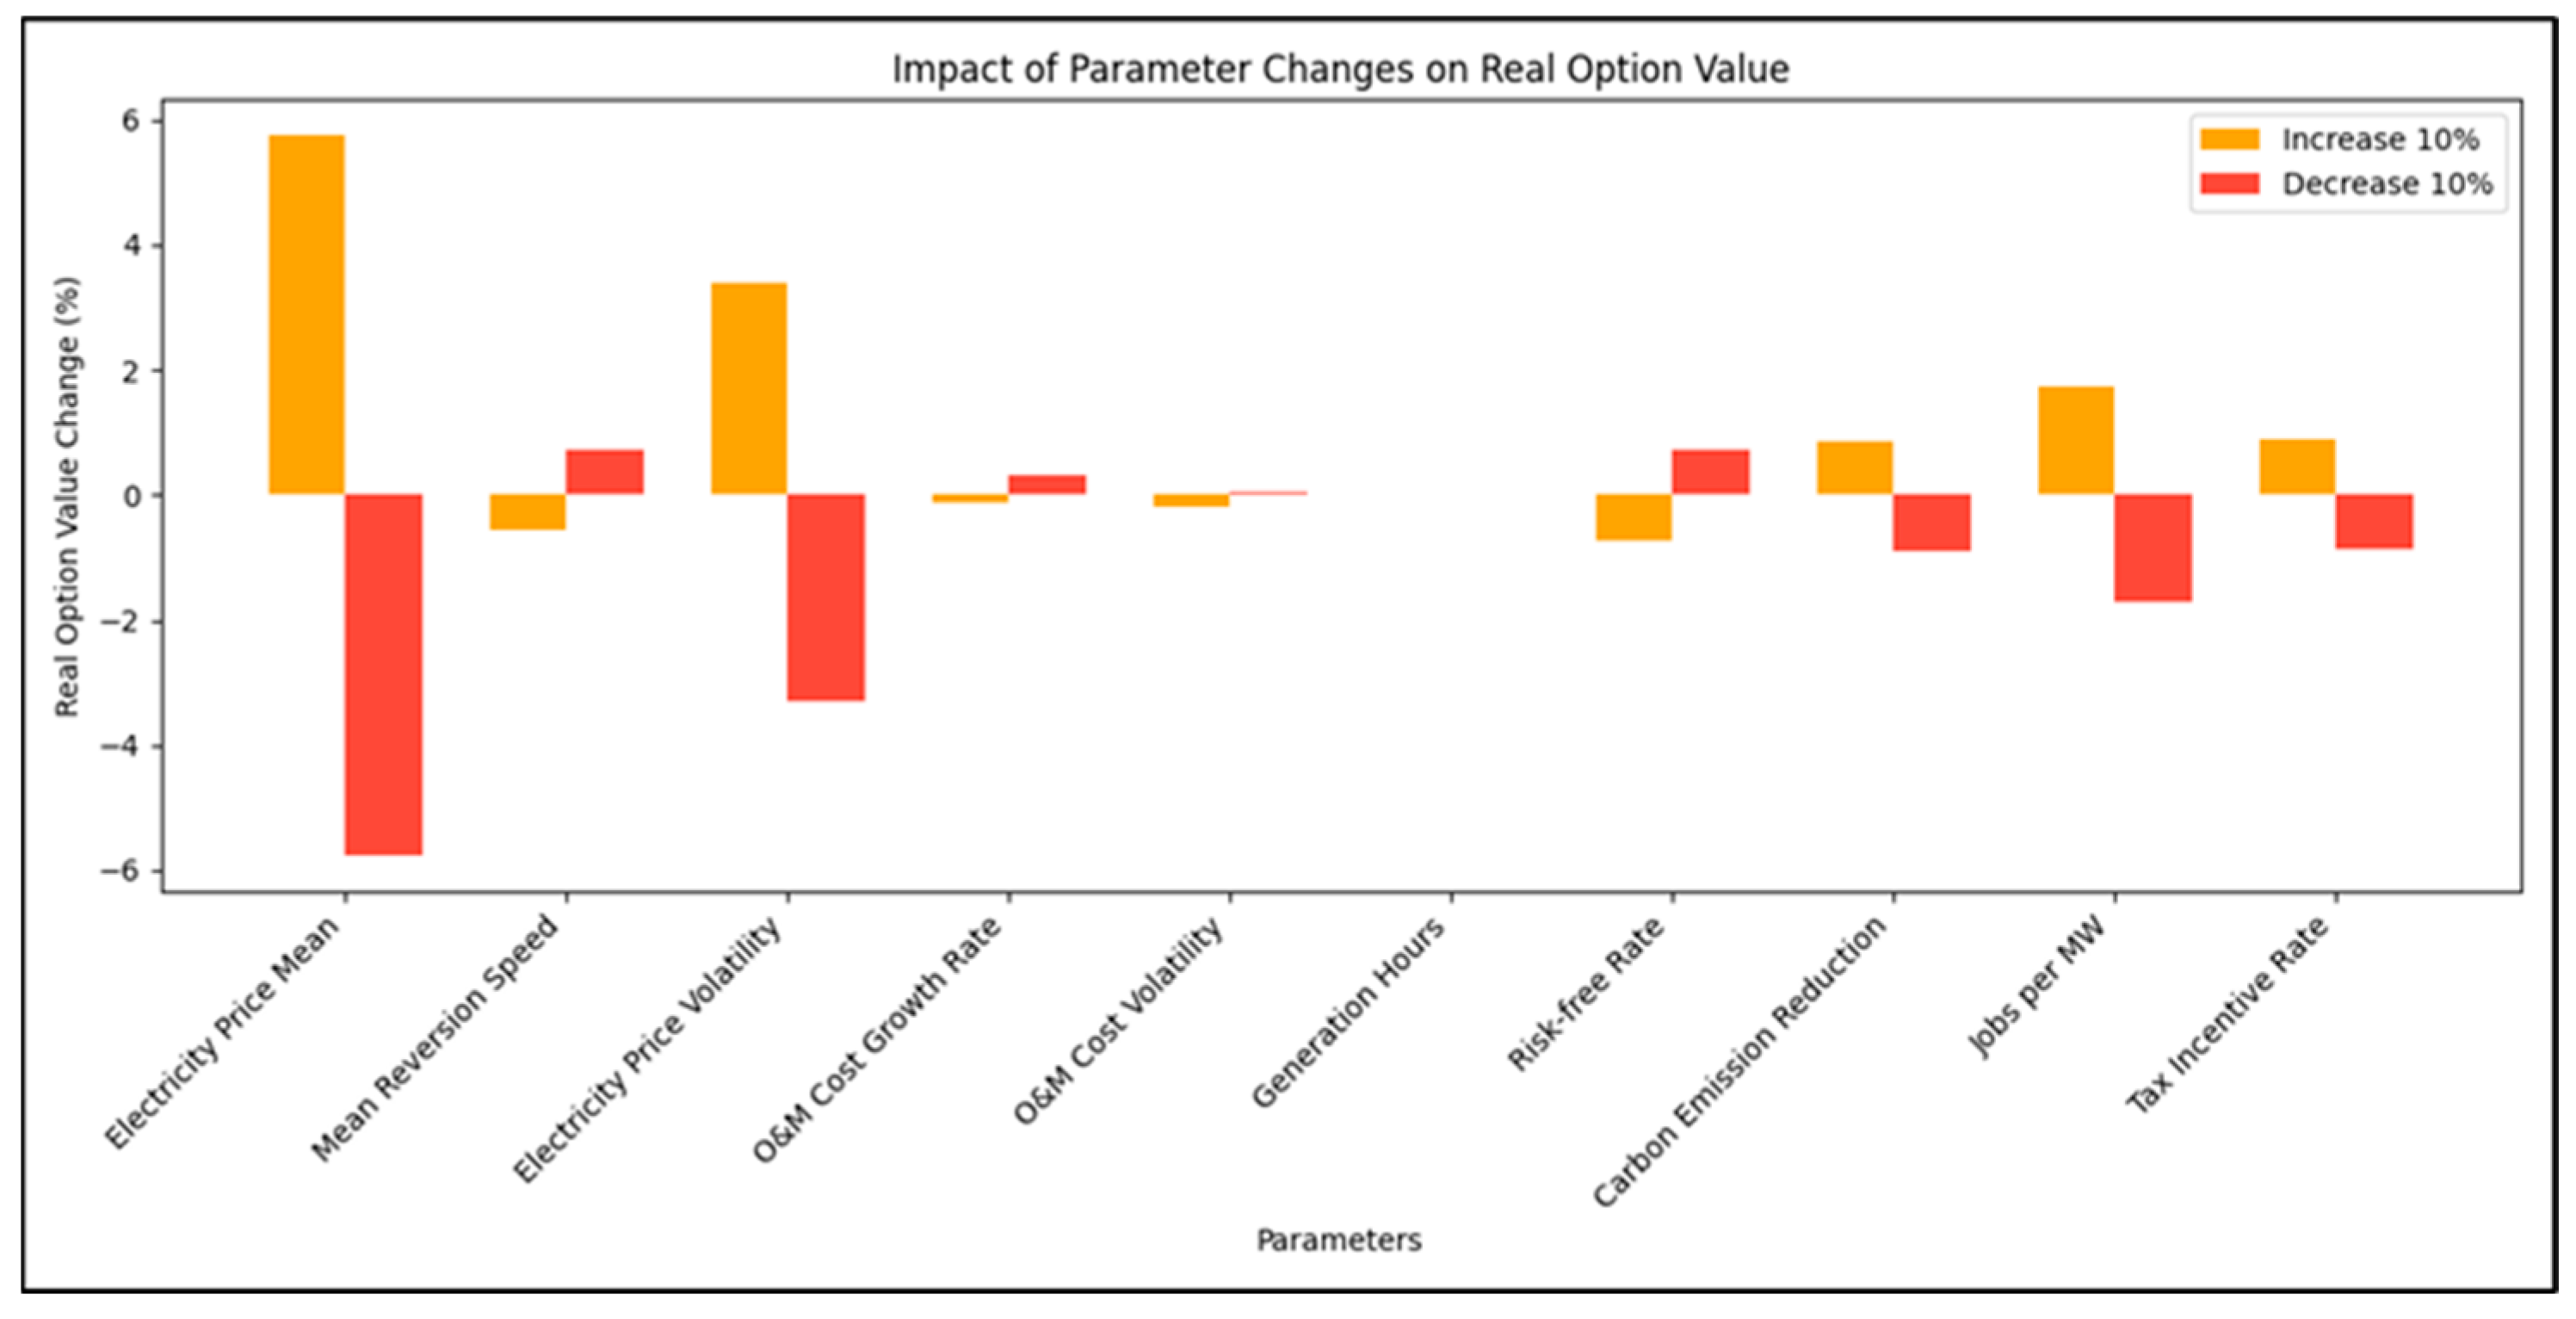
Figure 15 shows the impact of a 10% variation in key parameters on the project’s delayed option value. The key parameters affecting the delayed option value are the electricity price volatility, mean electricity price, and mean reversion speed. The electricity price volatility significantly impacts the delayed option value. A 10% increase in the electricity price volatility results in a 3.39% increase in the delayed option value, while a 10% decrease leads to a 3.30% decrease. This indicates that the flexibility of delaying investment is more valuable when market uncertainty increases. The change in the mean electricity price also importantly affects the delayed option value. An increase of 10% in the mean electricity price results in a 5.74% increase in the delayed option value, while a 10% decrease results in a 5.75% decrease. A higher mean electricity price increases the potential returns, making delayed investment more attractive. The variation in the mean reversion speed also affects the delayed option value. A 10% increase in mean reversion speed results in a 0.57% decrease in the delayed option value, while a 10% decrease results in a 0.73% increase. A slower mean reversion speed extends the duration of high-price windows, thereby enhancing the option value.
6. Conclusions
This paper develops an innovative deferral option model incorporating ESG factors to evaluate PV project investments. Through comprehensive empirical analysis, this study systematically examines the impact of ESG factors on investment decisions for PV projects, offering significant contributions to the literature and practical insights for the industry.
Comprehensive Integration of ESG Factors: This study systematically quantifies and integrates ESG benefits into a deferral option model for PV projects. Traditional methods like NPV fail to capture managerial flexibility and the multi-dimensional impacts of ESG factors. The model provides a holistic evaluation framework, reflecting the true value of PV investments in a dynamic environment. It demonstrates that sustainable practices enhance investment value, leading to superior financial performance and societal benefits.
Enhanced Investment Decision-Making Framework: The deferral option model embraces real options theory, offering a more accurate assessment of the economic viability of PV projects under uncertainty. This advancement is particularly valuable in the renewable energy sector, where conditions are volatile. The model captures managerial flexibility, enabling more informed and strategic investment decisions.
Empirical Validation with Practical Relevance: The analysis of a PV project in Shandong Province validates the model’s effectiveness. Incorporating ESG factors enhances economic viability and aligns with sustainability goals. The environmental, social, and governance benefits collectively improve the project’s value, offering actionable insights for investors and policy-makers.
Strategic Policy Implications: The findings highlight the need for robust policies supporting renewable energy investments. Policy-makers should focus on enhancing carbon trading markets, incentivizing job creation, and promoting corporate governance transparency. These measures foster a favorable investment climate and drive the adoption of sustainable energy solutions.
Contribution to Academic Literature: This research bridges the gap between financial performance and sustainability in PV project investments. The integration of ESG factors into the deferral option model offers a comprehensive approach to investment evaluation and lays the groundwork for future research in renewable energy investments.
Methodological Rigor and Robustness: The application of the LSMC method demonstrates methodological rigor, optimizing investment timing decisions. Empirical validation with real-world data enhances the model’s credibility and reliability, making it a valuable tool for researchers and practitioners.
In conclusion, this study significantly contributes to renewable energy investment by integrating ESG factors into the deferral option model for PV projects. The framework provides a nuanced approach to evaluating economic viability and sustainability. By highlighting the value added by ESG considerations, this research advances academic understanding and offers practical insights and policy recommendations to drive sustainable energy practices. Future research should explore the broader applicability of the model across different renewable energy projects and refine methodologies to capture the dynamic nature of investment decisions in this sector.
7. Future Research Directions
To advance this research, future studies could focus on several key areas: integrating ESG metrics into models for other renewable energy projects like wind, hydroelectric, and biomass to understand the model’s adaptability; examining how changing policy environments, including regulatory shifts and carbon pricing, impact investments; enhancing models with advanced simulation techniques and machine learning for optimized investment timing and strategy; conducting cross-country analyses to highlight regional practices and challenges; incorporating stakeholder analysis and multi-criteria decision making to capture diverse interests in projects; and performing longitudinal studies to assess the long-term effects of ESG factors on financial performance and sustainability. Addressing these areas will refine evaluation frameworks, deepen ESG impact understanding, and support the renewable energy sector’s sustainable growth.
