Article

Using Advanced Metering Infrastructure Data from MV/LV Substations to Minimize Reactive Energy Supply Cost to Final Consumers

Institute of Electric Power Engineering, Poznan University of Technology, 60-965 Poznan, Poland
*
Author to whom correspondence should be addressed.
Energies 2024, 17(16), 4116; https://doi.org/10.3390/en17164116
Submission received: 12 July 2024 / Revised: 10 August 2024 / Accepted: 13 August 2024 / Published: 19 August 2024
(This article belongs to the Section F3: Power Electronics)

Abstract

:
This article presents an original methodology to determine the optimal level of reactive energy transmission to low-voltage consumers supplied from MV/LV substations that guarantees the lowest total costs of reactive energy transmission through the DSO network and its generation in receiving installations within the reactive power compensation process. The average value of the optimal factor tgφ to be maintained by customers depends on the efficiency of the network, the characteristics of the load, and the market costs of energy losses due to the transmission of reactive energy through the network that are covered by the DSO and the costs of reactive energy generation in receiving installations. The results presented for real MV/LV substations operating in the Polish distribution network demonstrate the application of annual measurements of active and reactive energy consumed and generated registered by AMI systems to calculate the optimal reactive power compensation level. They can be applied to verify the permissible levels of reactive energy compensation applied by the DSOs until now within the yearly tariffs for customers.

1. Introduction

The level of network losses in distribution networks determines the efficiency of an electricity supply to consumers and a reduction in network losses is one of the basic tasks of distribution system operators (DSOs) responsible for the electricity supply while maintaining energy-quality parameters and enabling uninterrupted network operation. Losses in the distribution network occur at all voltage levels, but the highest share of losses is recorded at the low-voltage level because of the transfer of significant amounts of energy at high current levels. The methods of calculating network losses are discussed in [1], the monitoring of these losses is presented in [2], and the parameters of the power network needed to calculate the losses are given in [3] for Polish networks. Many receivers that use magnetic or electric fields in their operation, apart from active energy, consume or generate also reactive energy, which oscillates in the network causing additional losses.
Fundamental harmonic reactive energy flows are reflected by the power factor that has a value below 1, which is also influenced by the possible nonlinearity of the current or voltage sine waves that could affect the quality of the electricity available from the network. Future trends in reactive power demand in distribution networks are described in [4]. In [5], some typical profiles of residential customer consumption are presented, and the power factors and reactive power consumption of these types of customer are discussed in [6]. Significant changes in electricity consumption occurred recently in households that generally operate about a dozen commonly used devices, according to the case of Poland in 2018 [7]. The main technological changes in the operation of household receivers, influencing the flow of reactive energy in supply networks, include replacing incandescent lighting with electroluminescent and diode light sources, which usually have low-capacitive power factors, and their load current contains a high level of harmonics; therefore, they often require the use of power factor correction. Correction measures for LEDs are presented in [8] and for heat pumps in [9]. Furthermore, the increasing share of receivers such as television sets, monitors, and computers also causes a higher-capacitive energy flow, as they often use nonlinear electronic power supplies, although they are often required to provide reactive power control and regulation to prevent excessive voltage disturbances [10] and limit harmonic injections [11] using appropriate corrective circuits [12]. Other changes that influence reactive power flow include the introduction of electric power supplies that control motor drive operations to improve their efficiency, the widespread use of heat pumps with various types of compressor drives, and an increased load of electric-car chargers for which reactive power consumption occurs at the level of tgφ = 0.4 [13]. Furthermore, significant reactive power generation is caused by the growing number of electricity consumers who use inverters to feed the energy produced to the grid, which is analyzed in [14] for microgrids and is limited by some network codes presented in [15]. The problem of reactive power flow in networks with an important share of distributed generation networks has been discussed in [16] for the case of an Internet supply via a solar system and in [17] for the case of electric vehicles with power storage. Reactive power compensation is analyzed for the case of future battery power dispatch in [18] and for the case of the presence of hybrid systems in [19] and generally in the presence of distributed resources in [20]. The reduction in loss in the compensation process using inverters is presented in [21] and for the case of photovoltaic (PV) systems in [22]. The technical and economic feasibility problems of reactive power compensation circuits are discussed in [23]. The application of fuzzy methods to improve reactive power compensation in the case of distributed solar and wind generators is presented in [24]. Special tasks of reactive power compensation in the case of a three-phase grid-connected photovoltaic system are reported in [25]. Reactive power compensation in the presence of a high share of prosumers is analyzed in [26] and a strategy to optimize reactive energy management in microgrids in the presence of hybrid power sources in [27]. The described changes contribute to the change in the type of reactive power load of low-voltage networks from inductive to capacitive and to increased consumption of distorted currents and therefore to an increased level of network losses [28].
DSOs implement numerous investment, modernization, and operational measures to reduce network losses [29]. Furthermore, DSOs are constantly implementing an advanced metering infrastructure (AMI) that enables real-time measurements of active and reactive power consumption or generation profiles [30]. The efficient measures to minimize the levels of reactive energy flows in the grid are presented in [31] by appropriate pricing of its consumption, in [32] by preparing an adequate tariff system, and in [33] by setting the permissible values of the tgφ factor calculated for the settlement periods of electricity [33]. Furthermore, a reduction in network losses is also possible by appropriate reactive power flow control to achieve minimal operating costs [34] and maximize network efficiency [35], which can be carried out by reactive power generators [36] taking into account voltage regulation [37] or compensating devices such as inverters [38] or traditional capacitor banks [39]. Algorithms for reactive power control with the aim of achieving optimal conditions of distribution network operation are discussed in [40] and taking into account especially the regulation of voltage in [41]. Problems of voltage instabilities that occur during reactive power compensation are treated in [42] and possibilities to enhance voltage stability are presented in [43]. In [44], the support of voltage by forced flows of reactive power is discussed, which prevents voltage instabilities in distribution networks. Reactive energy generation or consumption by distributed generation or residential appliances can also be used by DSOs as ancillary power services to compensate for excessive reactive power flows. The market for reactive power ancillary services is presented in [45]. The possibilities of providing such services through distributed generators are discussed in [46]. The review of the procurement trends for relative power is presented in [47]. The use of distributed photovoltaics to correct the power factor in distribution feeders is presented in [48] and with the special application of residential appliances in [49]. The problem of sharing active power and reactive power compensation tasks within a grid with PV resources is recognized in [50]. Numerous changes in the network configuration and its operating conditions during longer periods of time influence the reactive power flows. In [51], this problem is considered as a consequence of network retrofitting. The authors of [52] propose a long-term analysis of network operation to optimize the operation of customer compensation devices using the equivalent resistances of the network based on the active yearly losses registered within the network areas that supply the considered load group.
The purpose of the presented paper, which is the development of the method presented in [52], is to demonstrate a methodology to determine the optimal levels of reactive energy flows in low-voltage networks based on AMI system measurements, including the following original solutions:
  • minimizing the total costs of active energy losses due to reactive energy flows in the distribution network and simultaneously the costs of compensation of reactive energy consumption carried by consumers;
  • determining the optimal level of customer factors tgφ in the case of reactive energy consumption and generation which may further serve as a basis for DSO tariff decisions;
  • use of long-term power flow measurements registered in the basic period of settlement of the electricity market via AMI for customers, as well as by AMI balance meters in the MV/LV substations that supply these customers, to determine the network and load parameters necessary to calculate the optimal tgφ factor according to the methodology presented.
In addition to the presented introduction, Section 2 describes the measures of reactive energy flow control in Polish distribution networks. In Section 3, the proposed novel methodology for determining the optimal reactive energy flow level using AMI measurements is presented. Section 4 constitutes a case study of the determination of the optimal reactive energy level for sample MV/LV substations and connected consumers supplied from the Polish distribution network and presents the consequences of such reactive energy flows in terms of voltage quality. The discussion of the results obtained is presented in Section 5, and the whole study is concluded in Section 6. The analyses presented in this article were supported by the association of Polish DSOs and concern low-voltage distribution networks.

2. Reactive Energy Flow Control in Polish Distribution Networks

Reactive power flows to commercial and industrial customers are limited by introducing tariff regulations to supply electricity at an appropriate quality level defined in [53,54]. The restrictions in force in Poland on the use of reactive energy by consumers in the network [55] relate to the permissible value of the tgφ factor, which is determined for reactive energy consumption as a ratio of reactive to active energy flow within the customer settlement period based on the data of electricity meters as follows:
t g φ c = E r c i E a i 0.4
where Eai—active energy consumption, Erci—reactive energy consumption (inductive reactive energy), i—billing period.
Reactive energy generation is forbidden, so
E r g i = 0.0
where Ergi—reactive energy generation (capacitive reactive energy).
Commercial and industrial customers are fined for penalties according to tariff regulations in the case of any kvarh exported to the network.
The value of 0.4 in (1) results from the necessity to limit active energy losses when transmitting excessive amounts of inductive reactive energy and to limit associated voltage drops. The value of 0.0 in (2) is due to the fact that the DSO should be able to effectively control the voltage level in the network, which would be difficult in the case of capacitive reactive energy flows. Maintaining the permissible voltage levels is one of the most significant tasks for the DSO, and it should be fulfilled while implementing efficiency measures such as the minimization of energy supply costs to consumers, which is analyzed below.

3. Determining the Optimal Level of Reactive Energy Compensation for Consumers Based on AMI Measurements

Further analysis conducted is based on the following assumptions:
  • data from smart meters are available, allowing for the balance of active energy flow at the voltage levels of the distribution network for the period of determining the optimal compensation parameters;
  • equivalent resistances for calculating active energy losses due to the flow of the current of receivers are determined based on annual energy losses, maximum loads, and load characteristics reflecting their changes over time for parts of the distribution network supplying the receivers according to [52];
  • the optimal parameters of the compensation devices for tariff purposes in the case of many receivers connected to the LV network can be calculated as averages for all receivers supplied from the MV/LV station, without taking into account their individual location within the LV network.

3.1. Network Losses in Supply Cables Due to Reactive Power Flow

For the purposes of determining an optimal reactive energy compensation level, the case of a load supply from an MV/LV substation connected to this substation with a low- voltage power line with known parameters will be considered. The increase in power losses dPa(r)LV) due to the flow of reactive current Ir forced by the phase voltage value Uph at the consumer network connection point is described by Equation (3). The sign of the reactive current is assumed to be positive for the consumption of reactive energy from the network (inductive current) and negative for the feeding of reactive energy into the network (capacitive current). The power losses are influenced by the parameters of the supply cable line, that is, the unit resistance R0 and the unit susceptance ωC0, forcing the capacitive current flow of the cable and its length l.
d ( P a r L V ) / d l = 3 ( ± I r U p h ω C 0 l ) 2 R 0 d l
The total active power losses along the entire length of the supply line are determined as follows:
P a r L V = 3 0 l c a b ( ± I r U p h ω C 0 l ) 2 R 0 d l = 3 I r 2 R 0 l ± 3 I r U p h ω C 0 R 0 l 2 + U p h 2 ω 2 C 0 2 l 3 R 0
Substituting the reactive load current with the instantaneous reactive power Q(t) divided by the rated voltage Un, that is,
I r = Q ( t ) 3 U n
the power losses may be calculated as a function of the reactive power consumed by the receiver:
P a r L V = Q 2 t U n 2 R 0 l ± Q t ω C 0 R 0 l 2 + U n 2 ω 2 C 0 2 l 3 R 0 3

3.2. Influence of Reactive Load Power Compensation

For the purpose of this analysis, it is assumed that the load tgφ(t), variable in time, is grater then tgφ, which is the value set in the compensator used in the customer’s installation in the analyzed period, so a constant ratio of reactive to active power is maintained:
t g φ t = t g φ = c o n s t
Therefore, the value of the reactive power flowing from the network due to the compensator operation can be calculated as follows:
Q t = P t · t g φ t = P t · t g φ
The annual active energy losses Ea(r)LV at the low-voltage (LV) level due to the flow of reactive energy through the resistance of the line Rc = R0l having line capacitance Cc = C0l can be calculated by integrating the power losses given by relationship (6) for the period of year Ta:
E a r L V = 0 T a P a r L V t d t = R c U n 2 0 T a P 2 t t g 2 φ d t ± ω C c R c 0 T a P t t g φ d t + U n 2 ω 2 C c 2 R c T a 3
The value of the annual active energy consumed by the load with the maximum power Pp is reflected by the value of the maximum load utilization time Tp:
0 T a P t d t = E a = P p T p
and the peak loss time τp reflects the value of annual losses in the supply lines at peak active power:
τ p = 1 P p 2 0 T a P 2 t d t
Taking into account that the LV current flows through the equivalent resistance Req(MV+HV) of the network at higher- (HV) and medium-voltage (MV) levels, the losses in the distribution system can be calculated as follows:
E a r Σ = P p 2 U n 2 t g 2 φ ( R c + R e q M V + H V ) τ p ± P p t g φ ( R c + R e q M V + H V ) ω C c T p + + U n 2 ω 2 C c 2 R c 3 + R e q M V + H V T a
To satisfy the constant value of the tgφ factor according to Equation (8), the instantaneous reactive power of the compensation devices can be described as follows:
Q c o m p t = Q c u s t t P t t g φ
The annual reactive energy produced by the compensation devices Ea comp is the difference between the annual reactive energy of the receiver Ear cust and the reactive energy supplied from the grid with the value of the tgφ set at the compensator controller:
E a c o m p = 0 T a Q c u s t t d t t g φ 0 T a P t d t = E a r c u s t P p T p t g φ

3.3. Optimal Compensation Granting Minimum Costs for the Network Operator and Customer

Assuming the costs of the losses of the grid covered by the DSO at the average market prices Cmp and the costs of the reactive energy generation of compensators as their levelized cost of reactive energy (LCOEr) value, the total cost of losses due to the flow of reactive energy in the grid and its generation in the compensation devices is determined by the following equation:
K s u m = E a r Σ · C m p + L C O E r · ( E a r c u s t P p T p t g φ )
By calculating the derivative of the costs after tgφ taking into account the equation for Ea(r (13) and equating it to zero:
2 P p 2 U n 2 t g φ ( R c + R e q ) τ p C m p ± P p ( R c + R e q ( M V + H V ) ) ω C c T p C m p L C O E r · P p T p = 0
the optimal value tgφ may be determined as follows:
t g φ o p t = T p [ L C O E r ± R c + R e q ( M V + H V ) ω C c C m p ] U n 2 2 P p τ p R c + R e q ( M V + H V ) C m p
The graphical interpretation of the annual cost Equation (15), which allows the determination of the optimal value of the tgφopt coefficient, is presented in Figure 1.
Optimization is carried out for a series circuit consisting of the equivalent resistance of the high- and medium-voltage network with the value Req(MV+HV) = 0.0022 Ω and the resistance of the low-voltage circuit Rc = 0.05 Ω determined for an aluminum cable with a cross section of 120 mm2 and a length of 200 m. Req(MV+HV) is the equivalent resistance of a fragment of the 110 kV network with an HV/MV transformer and a fragment of the medium-voltage network with an MV/LV transformer supplying the considered load. This resistivity was determined based on the annual active energy losses recorded at the high-voltage and medium-voltage levels in the network covering the fragment of the network mentioned above for the Polish distribution network that supplies mixed urban and rural areas based on [52] in a manner analogous to the method of determining the equivalent resistance of the LV network presented in this article using the dependence of (22) to (30). The low-voltage cable supplies a consumer with peak power Pp = 150 kW, peak power usage time Tp = 3400 h, and maximum loss duration time τp = 1660 h and tgφp = 1.0. The cost of generating reactive power in the compensator is LCOEr = 0.001 EUR/kvarh and the cost of active energy losses in the network Cmp = 61.36 EUR/MWh. The terms of Equation (15) that contain the cable susceptance of ωC = 0.000048 S can be neglected in practical calculations.
The optimal value of tgφopt is proportional to the levelized costs of reactive energy generation in receiving installations, that is, LCOEr, which can be determined as a result of market analyses of the investment expenditures on reactive energy compensation devices and the costs of using these devices during their operation period:
L C O E r = Q R P C · K j R P C + k ( W l · E a i R P C · S d v a r + K m i ) 1 + r i k E a i E + R P C ( 1 + r ) i
where LCOEr—levelized cost of reactive energy generation in a reactive power compensator, QRPC—rated reactive power of the compensator (RPC), KjRPC—unit investment expenditure for the reactive power compensator, EaiRPC—reactive energy generated in the compensator in the i-th year, Wl—active energy losses per unit of reactive energy generated [Wh/kvarh], Sdvar—variable component of the distribution fee in the tariff group in which the consumer is settled, Kmi—annual maintenance costs of the compensator, k—years of the reactive power compensator operation resulting from the period of its tax depreciation, r—assumed discount rate.
According to the results of LCOEr analyses carried out in Poland in 2018, controlled capacitor banks (CCBs) with a nominal capacity of 20–200 kvar, for the compensation of inductive reactive energy, are characterized with an LCOEr in the range of 0.002–0.00025 EUR/kvarh. For the cheapest capacitive reactive energy compensators, which turned out to be static var generators (SVGs) capable of bidirectional compensation, for the capacity of 20–100 kvar, the LCOEr values were in the range of 0.006–0.003 EUR/kvar.
The value of tgφopt also depends on the total equivalent resistance of the high- and medium-voltage network supply path Req and the resistance Rc of the line that supplies the receiver. Due to the low value of susceptance ωC of the supply line for low-voltage cables and overhead lines, it can be assumed that
L C O E r R c + R e q ω C c C m p
which leads to the simplification of Relationship (17) in the following form:
t g φ o p t = T p L C O E r U n 2 2 P p τ p R c + R e q C m p
In the case of supplying a single consumer with a dedicated supply line, the values of Pp, Tp, and τp can be determined based on the data recorded by its smart meter. The remaining elements of (20) depend on the type of compensator used, the parameters of the supply system, and the average price of electricity on the market.
The MV/LV substation usually supplies several groups of consumers connected to the low-voltage network using power lines of various lengths and types, which are loaded in a variable daily and seasonal manner. The composition of customer groups is also changing as a result of connecting new customers and migrating existing ones. Moreover, in the case of the presence of distributed generation sources in the low-voltage network, their active energy generation and its possible export to a higher voltage level should be taken into account. In the case of numerous consumers supplied from a transformer substation, Relationship (20) cannot be applied directly to each of them because the individual losses caused by the supply of a given consumer in the network cannot be determined. The following analysis describes how the relationships presented can be applied to determine the optimal tgφopt factor for consumers supplied from the MV/LV substation based on the practically available data.

3.4. Calculation of Compensation Parameters for the LV Supply Area Based on Data Registered in a Smart Metering System

In Poland, as a result of the amendment to the Energy Law Act [56], the implementation of smart metering systems was forced on DSOs in the scope of balancing meters at MV/LV stations by 2026, and by 2028, it is expected to cover 80% of customer meters. The growing number of smart metering installations [30] encourages the use of recorded measurements to determine the optimal level of reactive energy compensation.
In this subsection, the data that can be obtained from intelligent measurement systems will be used to determine the optimal value of the tgφopt coefficient defined by Relationship (20) for the case of supplying the LV network from an MV/LV station with many customers. Relationship (20) allows one to determine the optimal compensation parameters with a known resistance of the low-voltage circuit connecting the customer to the grid, and in Section 3.3, it was determined as Rc based on the known parameters of the connecting line. Therefore, this relationship does not allow one to determine the optimal compensation conditions taking into account all customers supplied from a given station. Based on the last of the assumptions presented at the beginning of Section 3, in this subsection, the equivalent resistance of the low-voltage circuit ReLV, causing the same active energy losses in a year occurring in real low-voltage circuits supplied from an MV/LV station and calculated using data registered in the AMI system, is determined. The value of this resistance ReLV will be used as a replacement for Rc in Relationship (20) to determine the optimal conditions for the compensation of all customers supplied from the MV/LV station, assuming equal values of the optimal compensation coefficient for all customers if their individual tgφcust coefficient exceeds the determined optimal value. The optimal value of the tgφopt coefficient determined in this way satisfies the features of a value that can be included in the tariffs for a given supply area.
To use Relationship (20) to calculate the optimal value of tgφopt, the individual factors appearing in Relationship (20) will be determined using the hourly values registered in the AMI system.
The losses occurring during the energy flow from the grid to consumers can be determined as the difference between the annual active energy fed into the grid measured by the balancing meter Eaa(+)st, registering the energy inflow on the low-voltage side of the transformer in the MV/LV substation and the sum of annual energy values ∑Eaa(+)cust consumed by the consumers supplied from the given substation. The losses occurring during the energy flow from the prosumers or energy generators to the grid are determined as the difference between the annual active energy generated at various points in the low-voltage grid ∑Eaa(−)cust and the annual active energy transferred to the higher-voltage-level grid measured by the balancing meter Eaa(−)st. Total losses ΔEaaLV may be determined as
E a a L V = E a a + s t i E a a + c u s t + i E a a c u s t E a a s t
The energy losses measured in the low-voltage grid during a year can be used as a basis to determine the equivalent resistance of the low-voltage grid, which can also be used to determine the optimal levels of reactive energy transmission to consumers in the low-voltage grid, ensuring the minimum costs of reactive energy supply to receiving installations, in accordance with Relationship (20). To determine the equivalent resistance of the low-voltage network ReLV, the value of the network loss factor ρLV should be determined first according to the following relationship:
ρ L V = E a a L V i E a a + c u s t
In case of a group of consumers supplied from an MV/LV substation, simultaneous consumption of reactive energy (inductive load) and its generation (capacitive load) often occurs within the basic electricity market settlement period of 1 h. It is assumed that in any shortest period of time considered, the reactive energy used may be either inductive or capacitive, and the total transmission losses are the result of summing up the losses in consecutive periods of consumption or generation of reactive energy in the period of the basic market settlement. The same applies to the active energy of consumers, which can be consumed or generated at any time. Thus, the apparent powers, being the result of summing the registered energy flows to customers during the basic period of market settlements of 1 h, can be calculated according to the following relationship:
S h c u s t L V 2 T b = i E h a + i 2 + i E h a i 2 + i E h r i n d i 2 + i E h r c a p i 2
where ShcustLV is the apparent power of the summed energy flows to the customers considered in the above relation as average power divided by 1 h; Eha+i, Ehai—active energy consumed and generated in 1 h values, Ehrind i, Ehrcap i—reactive energy consumed (inductive) and reactive energy generated (capacitive) values registered in the basic market settlement period of Tb, Tb—the basic period of settlement of the electricity market which is 1 h, i—individual customers supplied from the MV/LV substation.
Active energy losses in the LV network can be expressed as a function of peak hourly apparent power in the year Sp cust LV based on AMI-registered measurements:
S p c u s t L V 2 = m a x h ( S h c u s t L V 2 ) ,
the equivalent duration of peak losses τeq cust LV, being the result of total energy flows to the customers:
τ e q c u s t L V = 1 S p c u s t L V 2 0 T a S e q 2 t d t = h S h c u s t L V 2 / S p c u s t L V 2 ,
and the equivalent network resistance ReLV, as follows:
Δ E a a L V = 3 I p 2 R e L V τ e q c u s t L V = S p c u s t L V 2 U n 2 R e L V τ e q c u s t L V
where Ip is the maximum current resulting from the LV intake of the Sp cust LV at nominal voltage Un.
Active energy supplied to consumers during the year can be determined using their total peak power Pp cust LV and the value of the maximum load utilization time Tpcust LV according to the following relationship:
h i E h a i = P p c u s t L V · T p c u s t L V
where the peak active power of the consumers Pp cust LV and the peak load utilization time Tp cust LV can also be determined on the basis of the recorded measurements according to the following relationships:
T p c u s t L V = h i E h a i / P p c u s t L V
P p c u s t L V = m a x h i E h a i
The transformation of Equation (22) using (26) and (27) allows the determination of ReLV according to the following relationship:
R e L V = ρ L V · T p c u s t · U n 2 · P p c u s t L V S p c u s t L V 2 · τ e q c u s t L V
The equivalent resistance value obtained, reflecting the actual losses registered in a year in the LV network, can be used to determine the optimal value of tgφopt defined by Relationship (20). Assume that
R c = R e L V
considering the parameters of the common distribution networks for which
R e L V R e q ( M V + H V )
Then, the value of Req (MV+HV) can be neglected in (20), and with further simplifications using (32), the following equation, independent of the voltage value, can be obtained:
t g φ o p t   a p p r o x = L C O E r · S p c u s t L V 2 · τ e q c u s t L V 2 · P p c u s t L V 2 · τ p · ρ L V · C m p
where τp defined by (11) can be calculated based on the AMI measurements according to (25) but for the values of active energy per hour.
Equations (20) and (33) were derived with the assumption that the compensation of the reactive inductive and capacitive energy over tgφ to the value of tgφopt is carried out continuously so that the load has a steady tgφopt in the time period considered. In practical cases, taking into account (23), it could be necessary to use customer compensators capable of compensating for both types of reactive energy. These compensators are significantly more expensive than compensators based on a controlled capacitor bank, which can result in high optimal values of tgφopt factors and increased losses in the network due to inductive reactive energy flows. The decisions to be taken in view of this fact are discussed in the next section with examples of two sample MV/LV substations based on the recorded AMI measurements.

4. Analysis of Optimal Reactive Energy Compensation Levels for MV/LV Substations Based on AMI Measurements

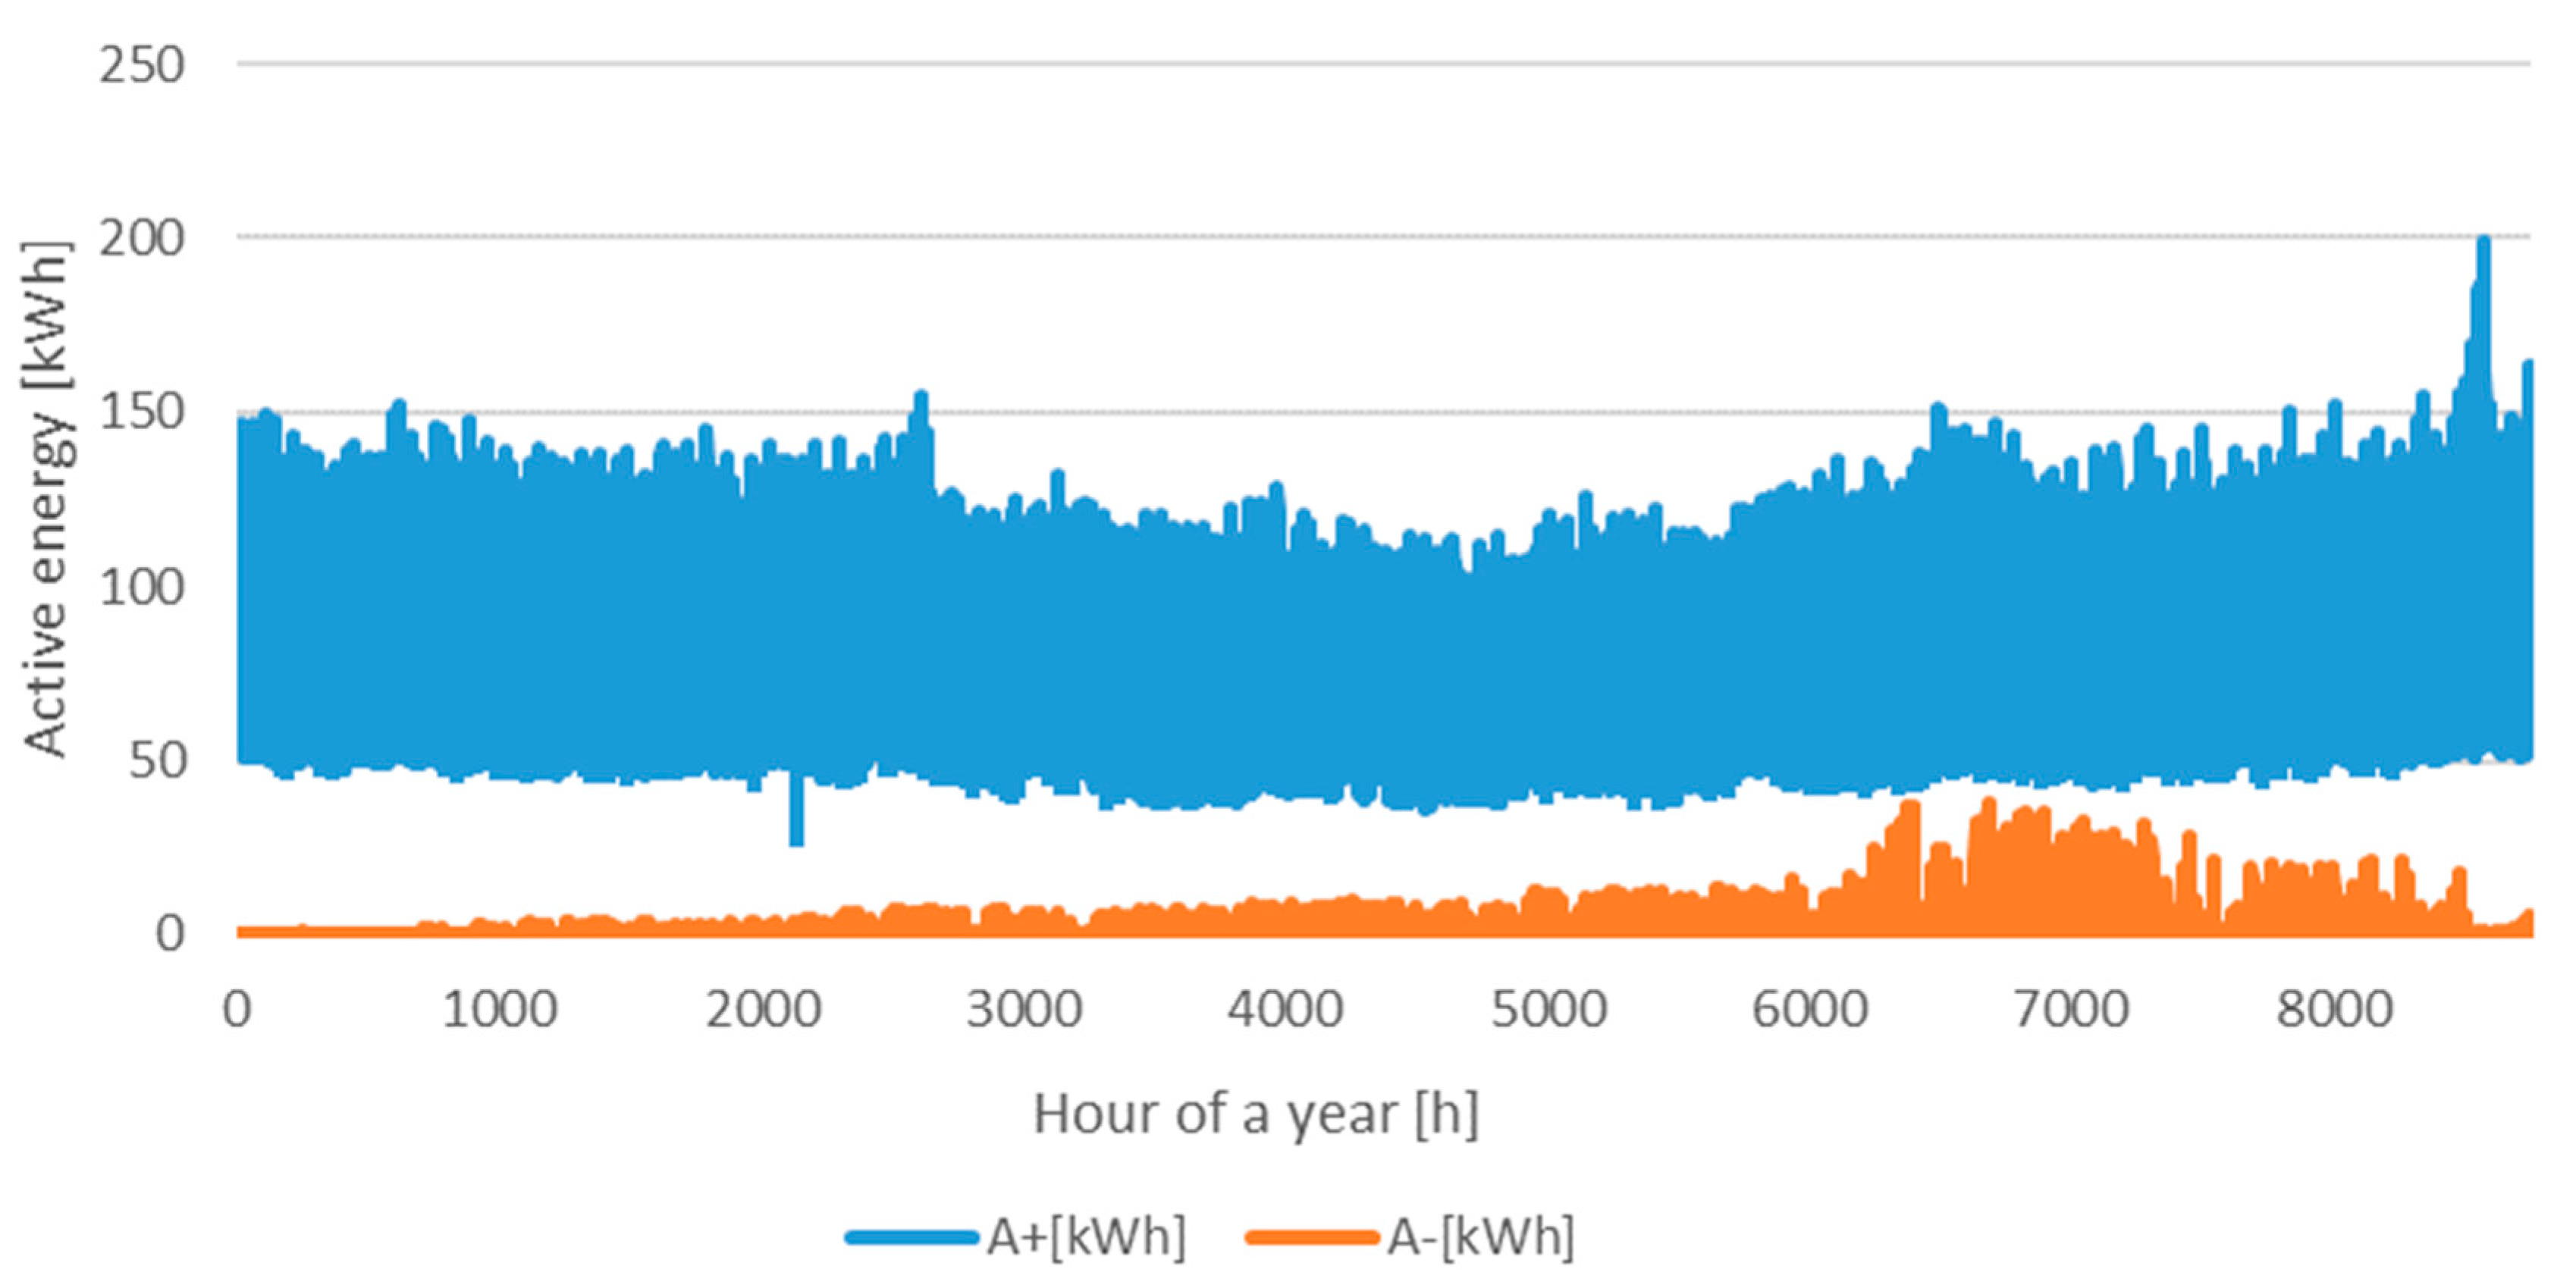
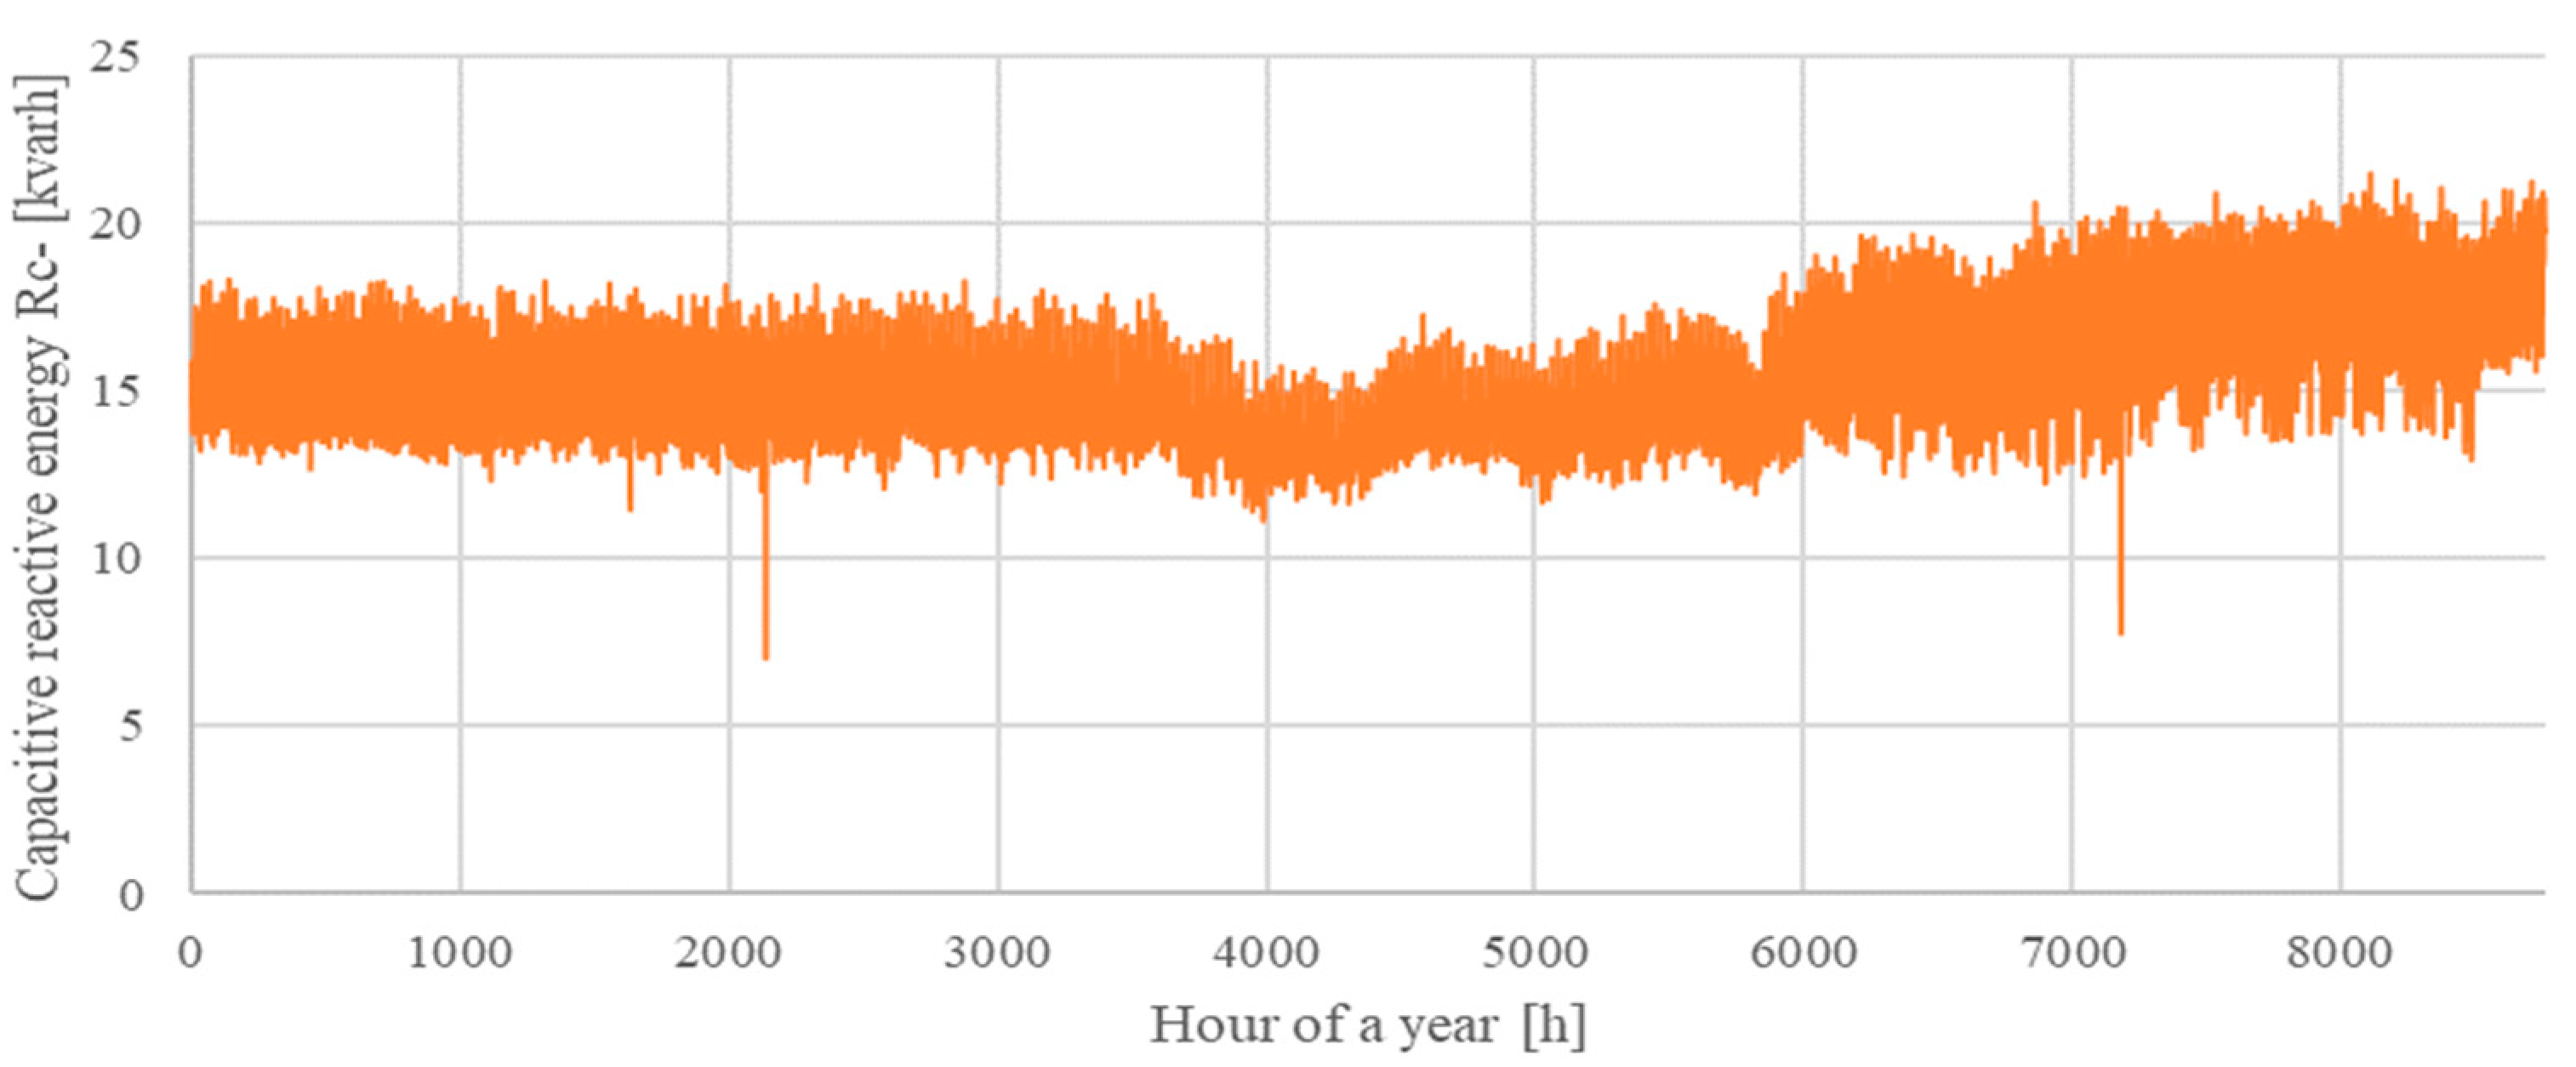
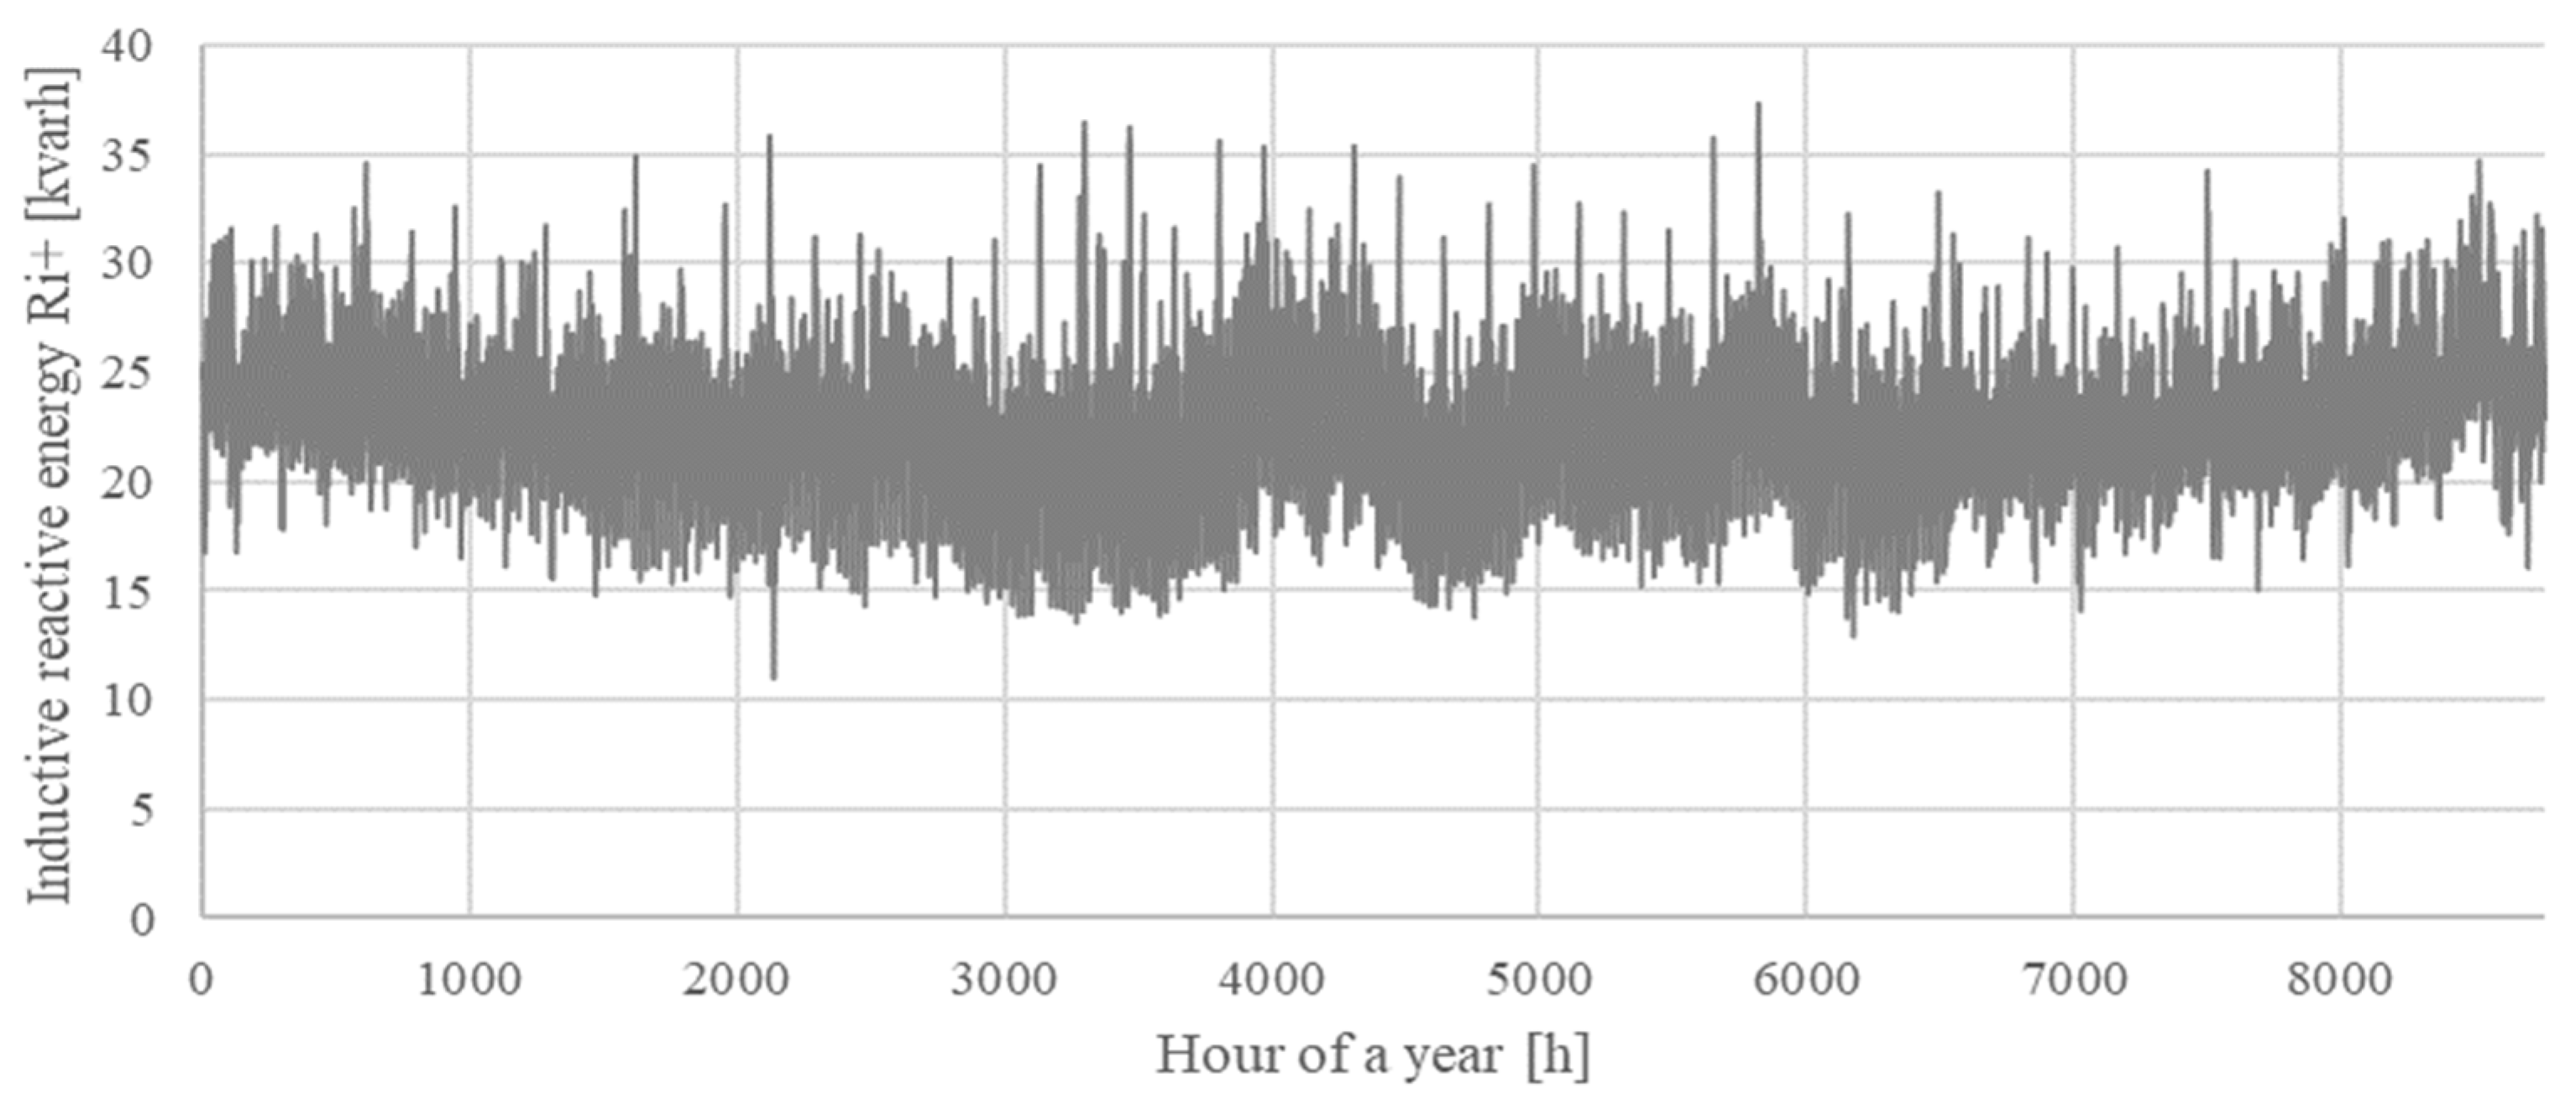
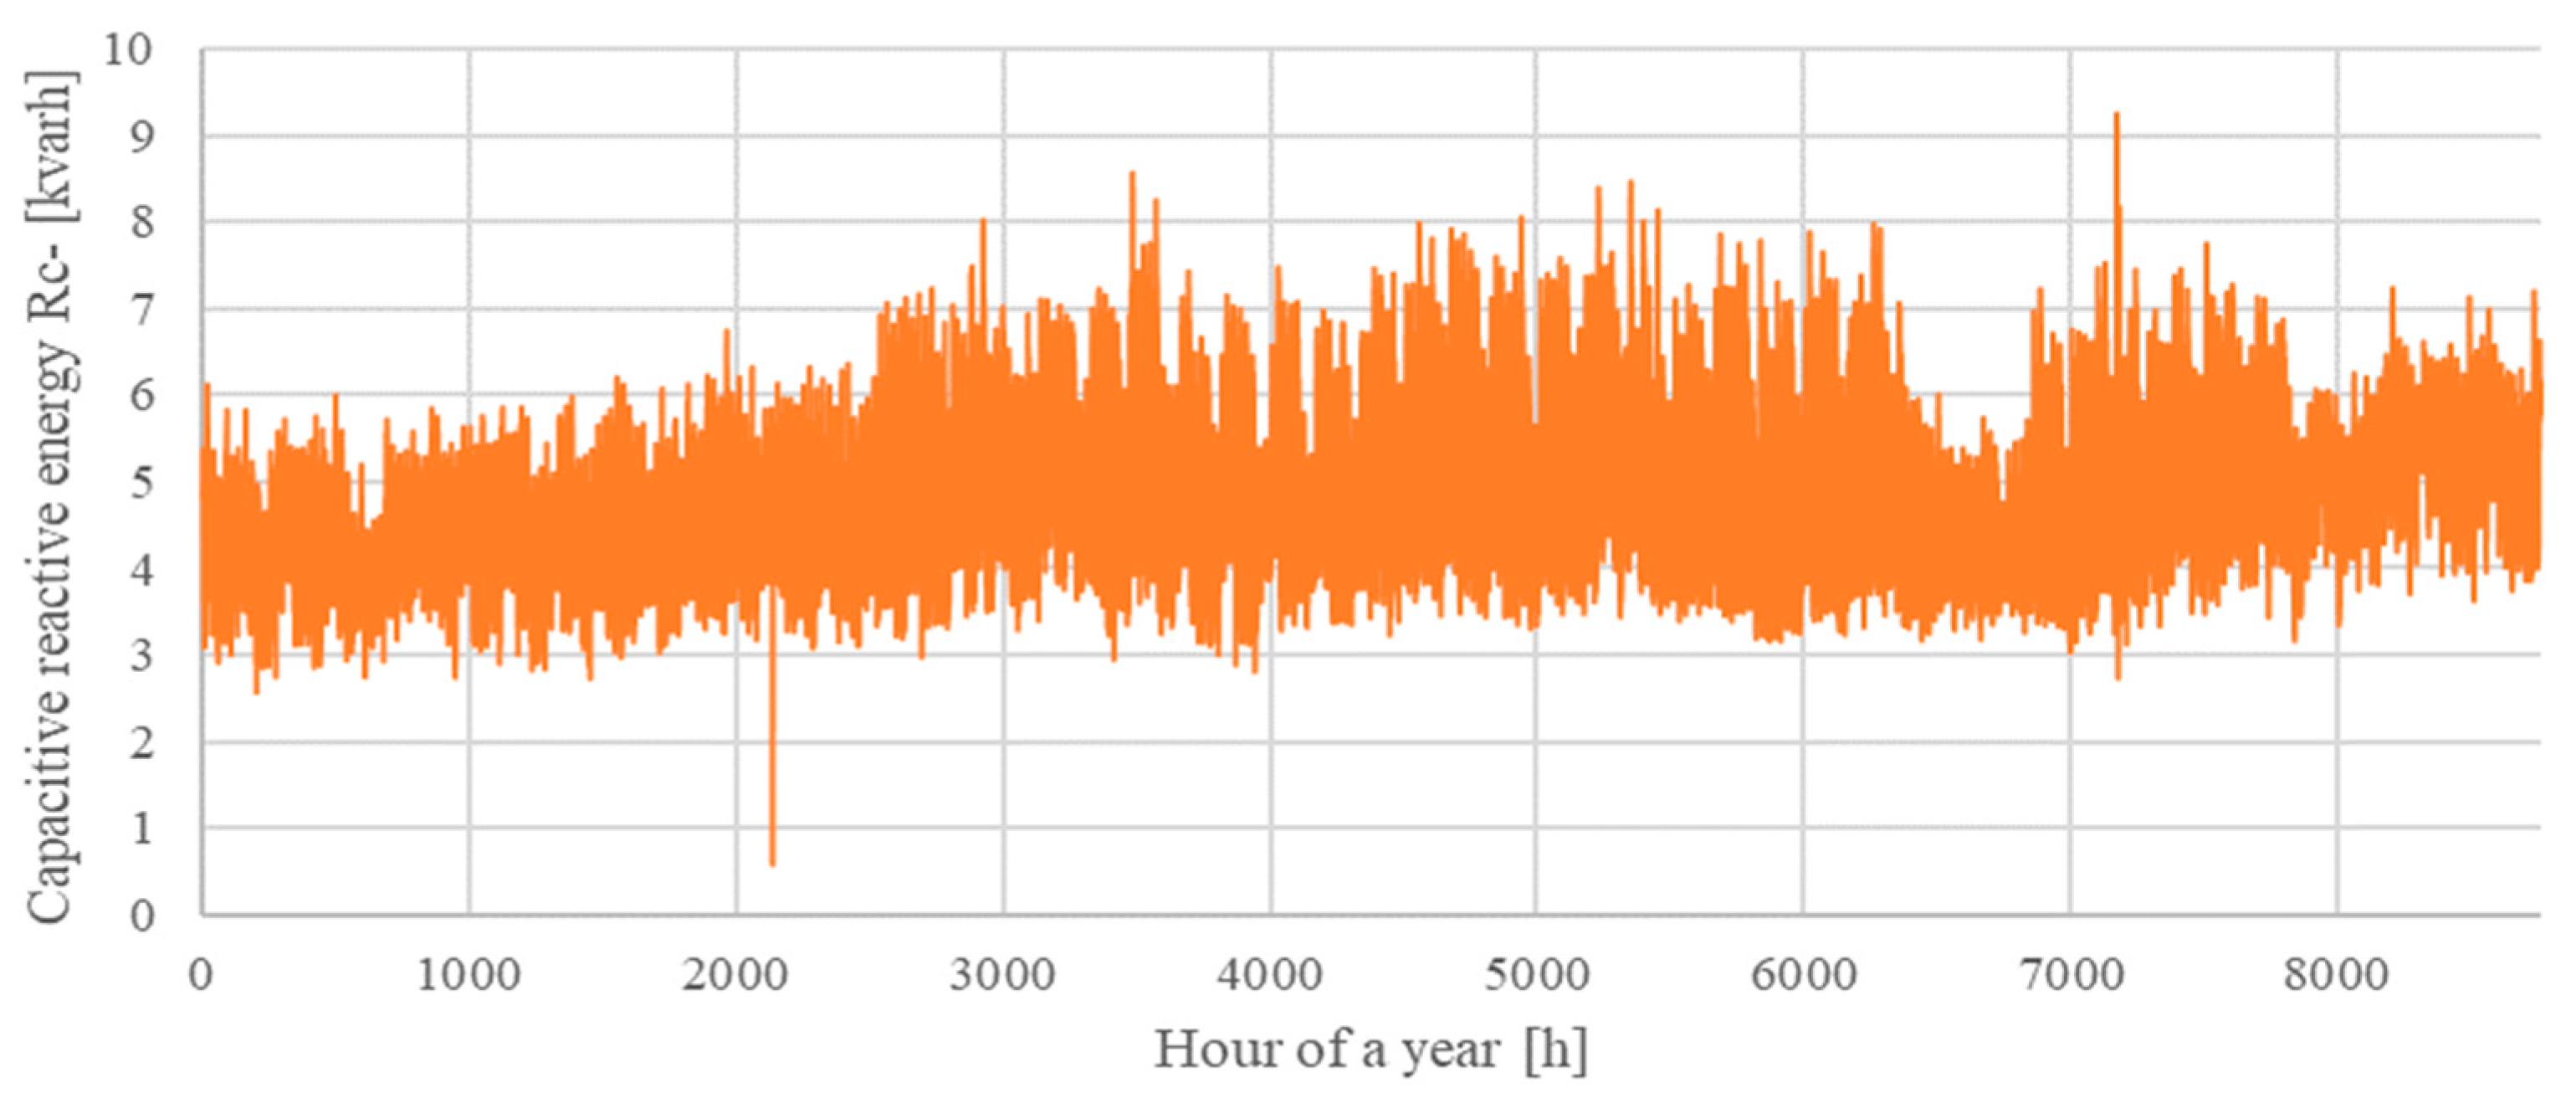
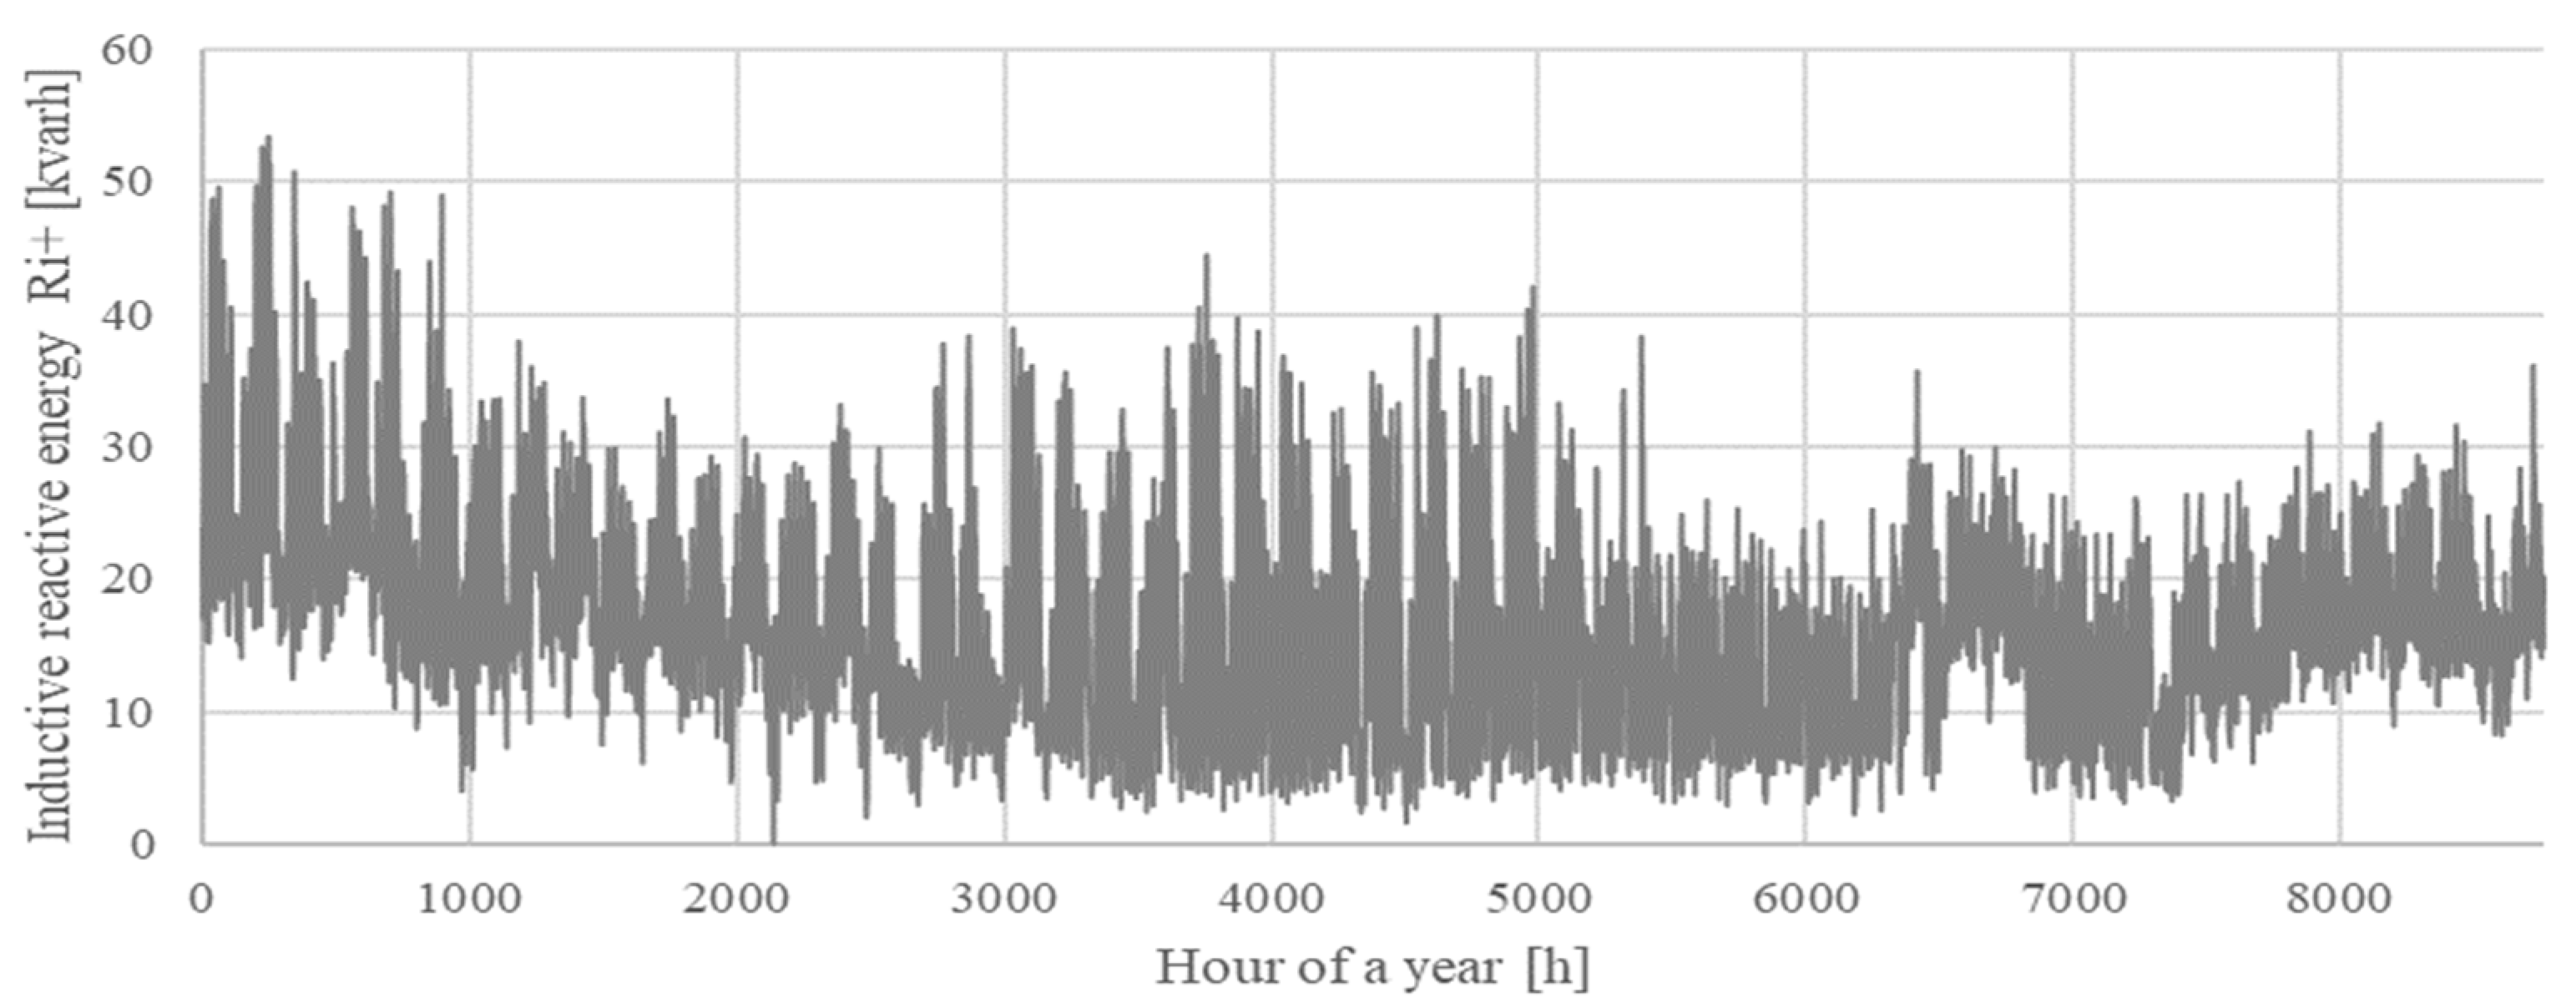
Data recorded by advanced measurement systems at two sample MV/LV substations will be analyzed to determine the optimal values of consumers’ tgφopt. Substation S1 supplies customers in the urban area using a low-voltage cable network with a predominant cable cross section of 120 mm2 Al and a total length of 5.1 km. The S1 substation is equipped with an MV/LV transformer with a capacity of 400 kVA. The summed consumption of active energy in this network during the year and the summed generation of active energy generated in prosumer installations in this period are shown in Figure 2. The summed flows of the consumed inductive and capacitive reactive energy in the receiving installations of the network supplied by the S1 substation are shown, respectively, in Figure 3 and Figure 4.
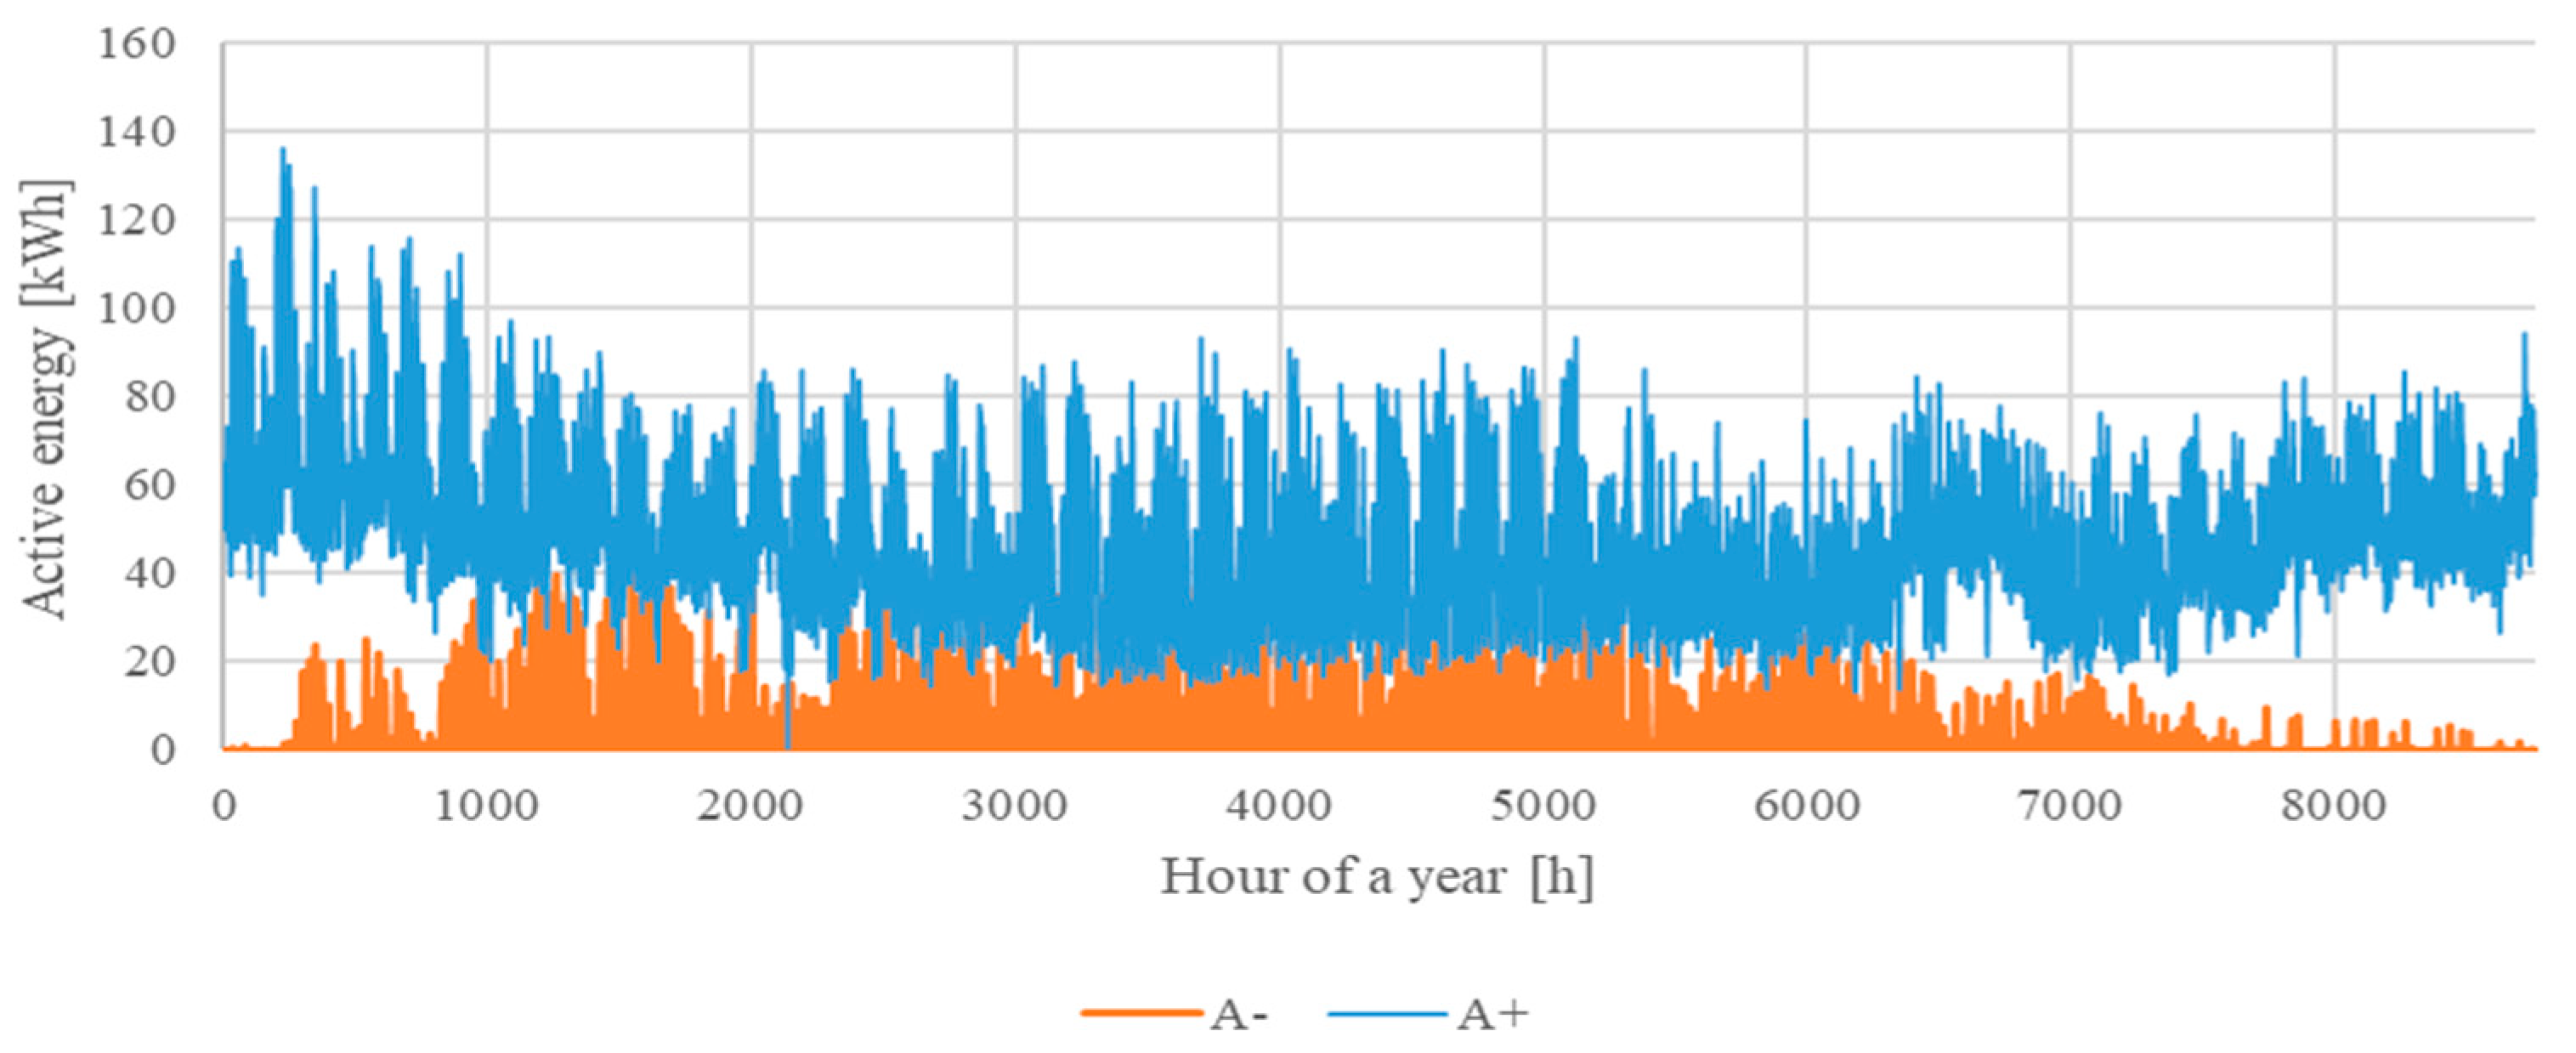
Substation S2 is equipped with a 160 kVA transformer and supplies the residential area and commercial/industrial consumers in the rural area with an overhead line network that has an overall length of 2.9 km with a dominant overhead line cross section of 70 mm2 Al. The consumption of active energy by network consumers and the generation of active energy by consumers during the year are shown in Figure 5. The total flow of inductive and capacitive reactive energy summed for the receiving installations of the network supplied by the S2 substation is shown during the year in Figure 6 and Figure 7.
Table 1 presents the technical data of the substations, the values of the annual active energy flows registered by the balancing meters, the summed energy registered in the smart meters of consumers, and the difference in the active energy balance ΔEaaLV determined according to Relationship (21), which enables the determination of the low-voltage network loss factor according to Relationship (22).
To determine the optimal compensation levels for customers supplied from substations S1 and S2, the equivalent resistances of LV networks ReqLV were determined for these facilities according to Relationship (30), and the equivalent resistances of medium- and high-voltage networks Req(MV+HV) were assumed for urban networks (S1) and for rural networks (S2) according to the data in Table 1 and Table 2. Table 2 also presents the assumed operation costs LCOEr of SVG compensators for capacitive energy compensation and of CCB compensators for inductive reactive energy compensation.
The market price of energy is assumed at the level of 61.36 EUR/MWh specified in [57] for 2019, which is also the year of data collection from substations and market studies of the costs of the use of compensators.
As can be seen from the analysis of Figure 3 and Figure 4, as well as Figure 6 and Figure 7, the reactive energy consumption during the year is not constant and varies from the maximum to the minimum value and also reaches zero in certain periods. This means that there are periods in which inductive or capacitive energy consumption compensation could be needed and other periods when compensation is not required due to zero or small reactive energy flows from the grid. Relationship (20) was derived assuming that the tgφ coefficient of the analyzed load remains at a level higher than the optimal value for the whole analyzed period. However, in practical considerations, it should be taken into account that the reactive energy compensation should therefore be continued only in certain load states of limited durations.
The energy losses due to the flow of reactive energy to consumers in the time periods when the compensation is active and not within the whole year are the sum of the two components considered below, provided the optimal compensation level in both areas is maintained:
E a = R e n U n 2 · ( t g 2 φ o p t g 0 T a g P 2 t d t + t g 2 φ o p t c 0 T a c P 2 t d t )
where Tag—period of reactive energy generation at a level higher than the optimal tgφoptg value, Tac—period of reactive energy consumption by customers at a level higher than the optimal tgφopt c value.
For such cases, the calculation of the optimal values of tgφopt should be performed separately for the consumption and generation of reactive energy. In the case of reactive energy consumption, the optimal tgφopt c is expressed by Relationship (20) transformed into (35), substituting ReLV (30) as the equivalent resistance and Tpc, Ppc, and τpc calculated for the period of Tac, which is the duration of the energy consumption of a reactive load greater than or equal to the chosen value of tgφic:
t g φ o p t c = U n 2 2 R e L V P p c T p c τ p c L C O E r c C m p
The relationship for tgφopt g can be obtained in a similar way for the duration Tac in which the reactive energy generation of the load is greater than or equal to the chosen value of tgφig.
Compensation is active only in the case of load tgφig being smaller than tgφopt g for reactive power generation and only if load tgφic is greater than tgφopt c for reactive power consumption.
For each period value of Tac or Tag, including all measurement periods with tgφ greater than the chosen value of tg ic and smaller than tgφ ig, the resultant optimal values of tgφopt c and tgφopt g can be calculated. As these results depend on the ratio Tpipi, it is difficult to find the value that globally minimizes the total cost of losses. It can be achieved in an iterative way by comparing the compensation cost for various values of tgφopti. The AMI system registers load energy measurements every 15 min or every 1 h, so we have a finite number of measurements to consider.
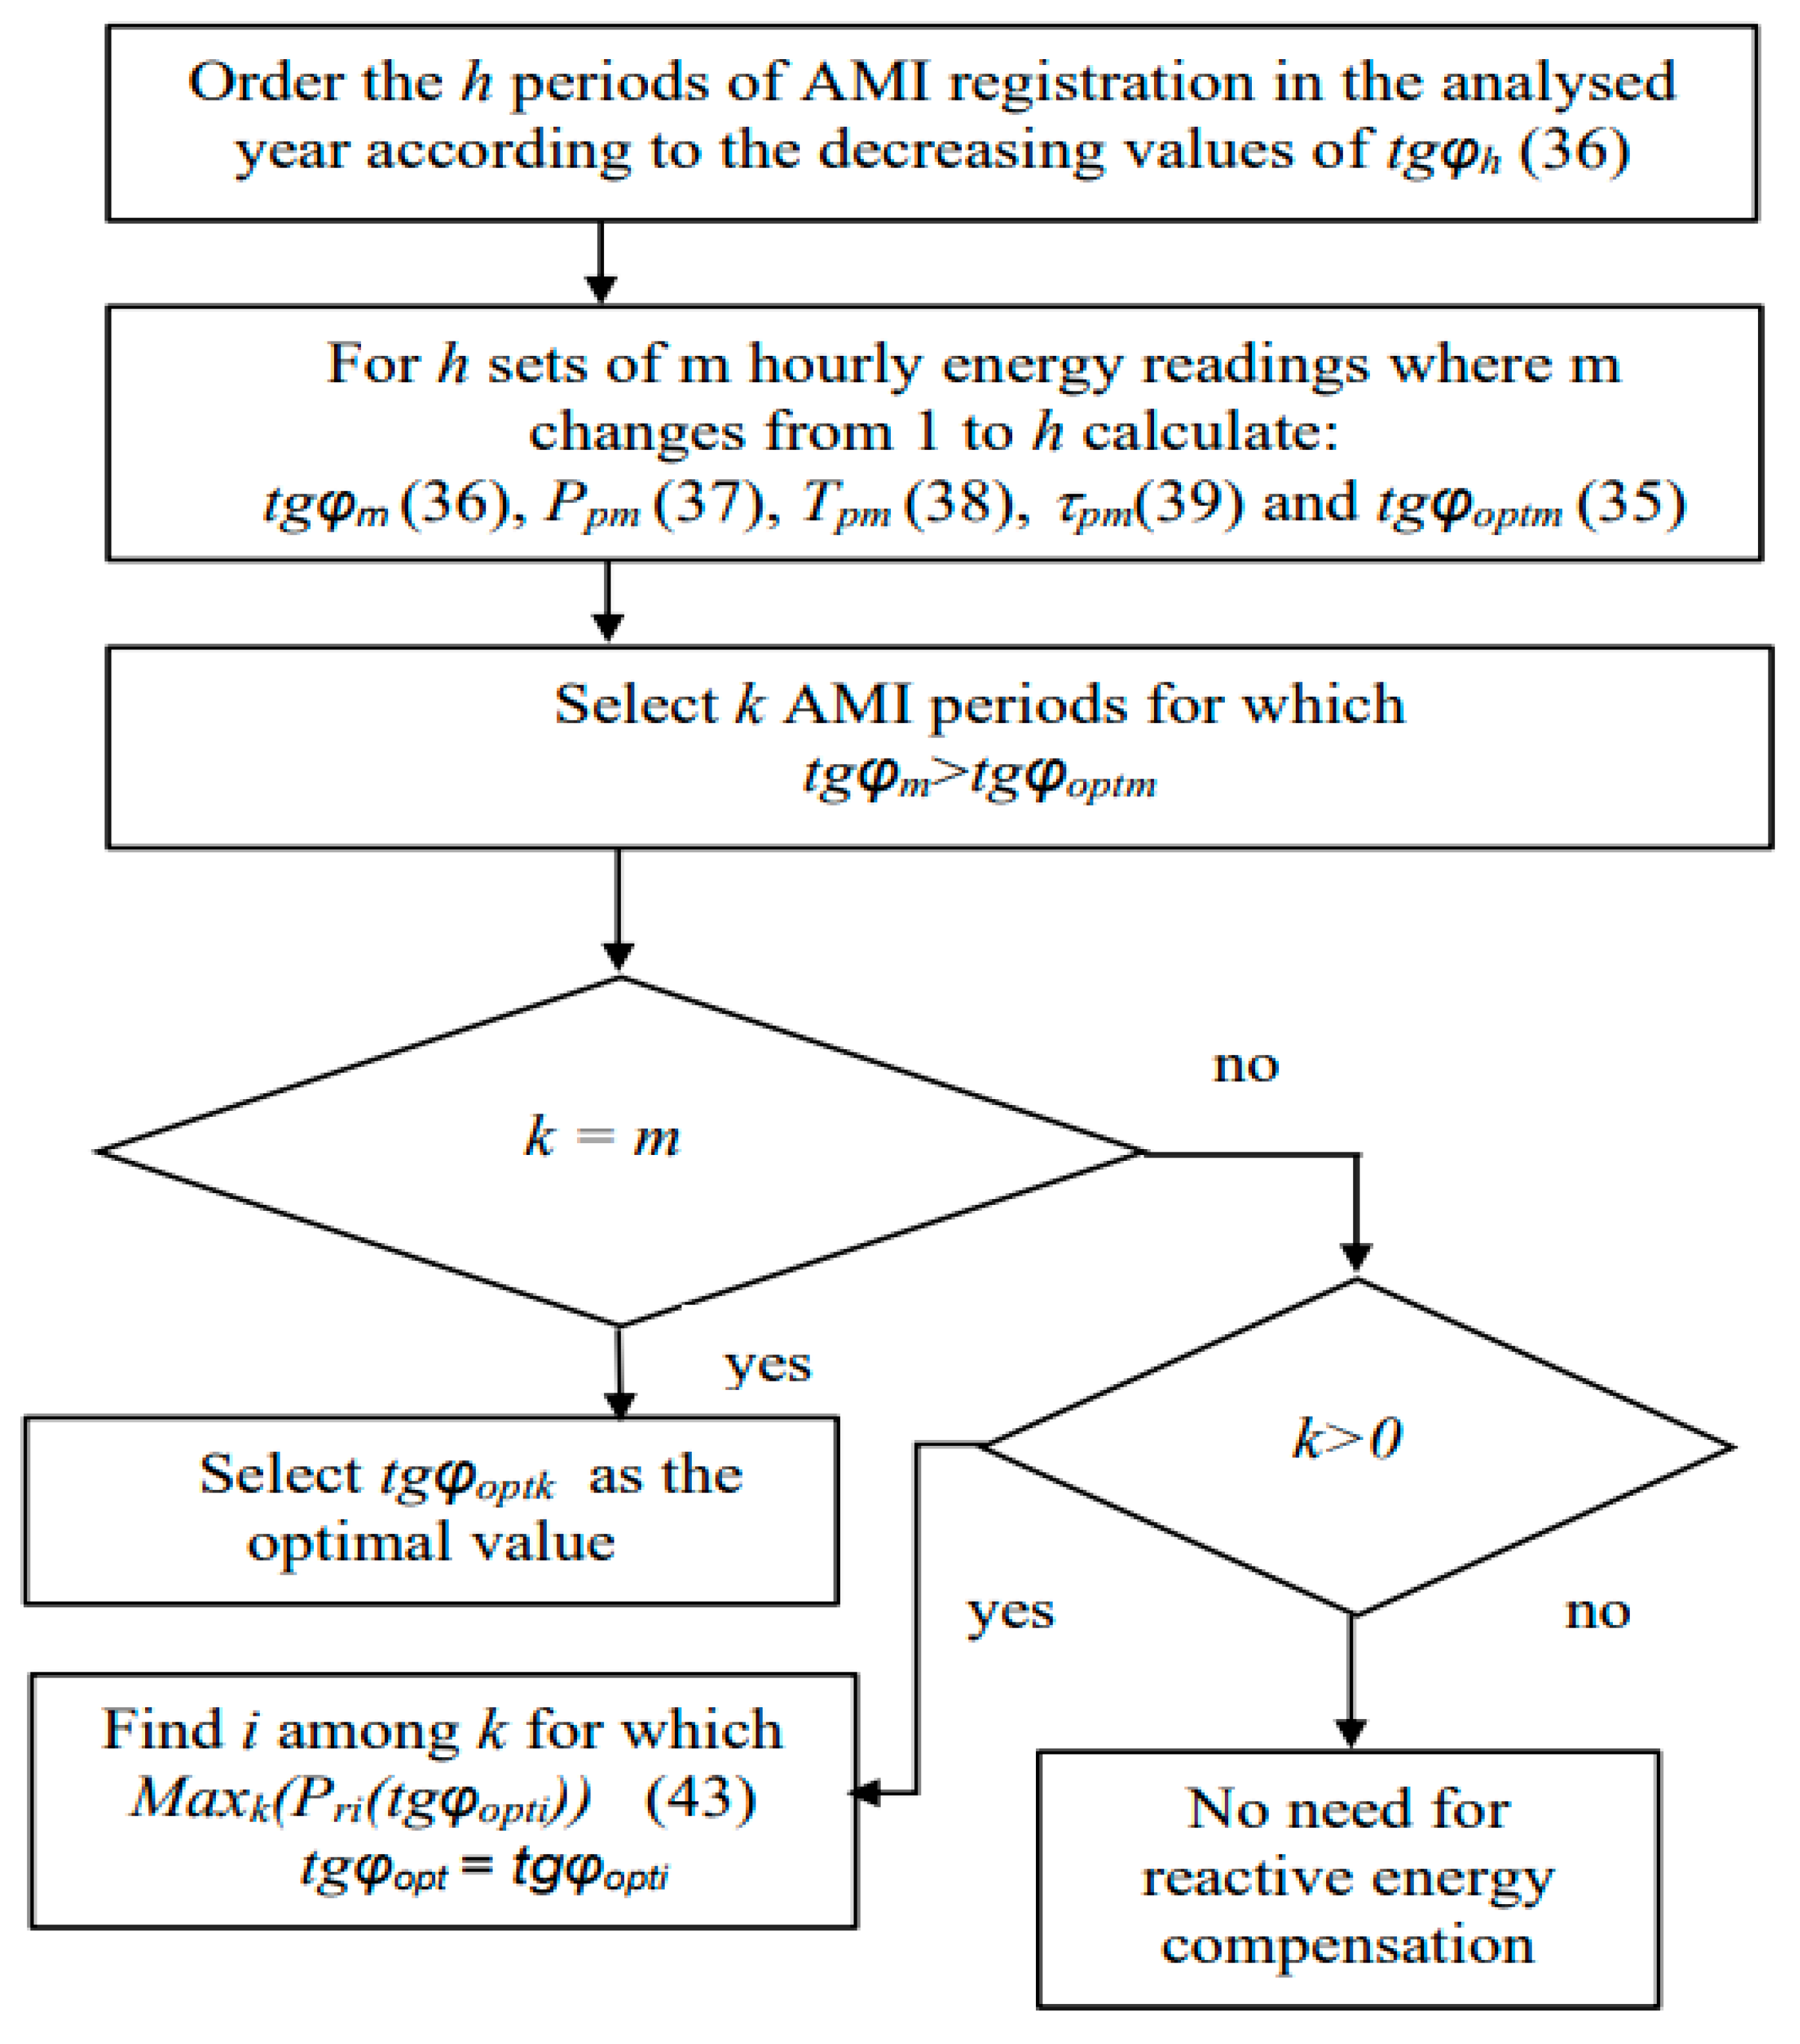
The optimal value to which the load tgφ should be compensated can be determined according to the algorithm presented in Figure 8, which aims to find such a value of tgφopt within the sets of ‘h’ AMI measurement periods arranged in descending order of tgφi. The practical operation of this algorithm is demonstrated in the examples of two MV/LV substations, with the results shown in Figure 9, Figure 10, Figure 11 and Figure 12.
In the algorithm, the hourly tgφh values are calculated based on the summed energy flows of n consumers supplied from the substation for every AMI-registered period according to
E h a = 1 n E h a i     E h r = 1 n E h r i     t g φ h = E h r / E h a
and the set of registered measurements, for the case of reactive energy consumption, is arranged in descending order of tgφh.
Then, the values of tgφoptm are calculated using (35) based on parameters calculated according to (37)–(39), for successive sets of m AMI measurement periods with decreasing values of tgφh:
P p m = m a x m ( E h a / T h )
T p m = 1 m E h a / P p m
τ m = 1 m ( E h a 2 / T h 2 ) / P p m 2
In the third step, k subset of periods is selected from the m set for which the following condition is satisfied:
t g φ m > t g φ o p t   m
If Condition (40) is satisfied for all sets of m, it means that in the whole period analyzed (year), the compensation should be active, and then tgφopt can be determined for the set of m with the lowest tgφh value. If there are no sets that meet Condition (40), the compensation is not required due to higher costs when applying the compensation than in the case of its absence.
In the case of a selected subset of k, the choice should be made among the k optimal tgφopti values calculated based on a different number of registered measurements. The choice of a globally optimal value among these tgφopti is based on the highest profit resulting from compensation compared to the lack of compensation, which depends on the shape of the annual load curve. The maximum profit Pri (43) should be selected as the value that results in the maximum difference between the costs of losses KEri nC caused by the transmission of reactive energy without compensation (41) and the costs of losses in the case of the transmission of reactive energy and its generation in the customers’ compensators KEri(tgφopti) expressed by (42):
K E r i n C = C m p R e q U n 2 1 i E r h 2
K E r i t g φ o p t i = C m p R e q U n 2 P p i 2 τ p i t g 2 φ o p t i + L C O E r ( 1 i E r h P p i T p i t g φ o p t i )
P r i = K E r i n C K E r i ( t g φ o p t i )
The compensator setting tgφoptcomp is the value of tgφopti that maximizes the Prki profit (43). The compensator operation time Tacomp can be determined as the sum of m measurement periods in the optimal set:
t g φ o p t c o m p = t g φ o p t i
T a c o m p = 1 m T h
The presented method allows us to determine the optimal values of tgφopt for both the consumption and the generation of reactive energy of the supplied customers, and the result obtained depends on the relationship between the market price of energy Cmp to cover DSO losses and the operating cost LCOEr of the compensator used, as well as the mutual relationship of the characteristic values Tp, τp, and Pp of the summed load.
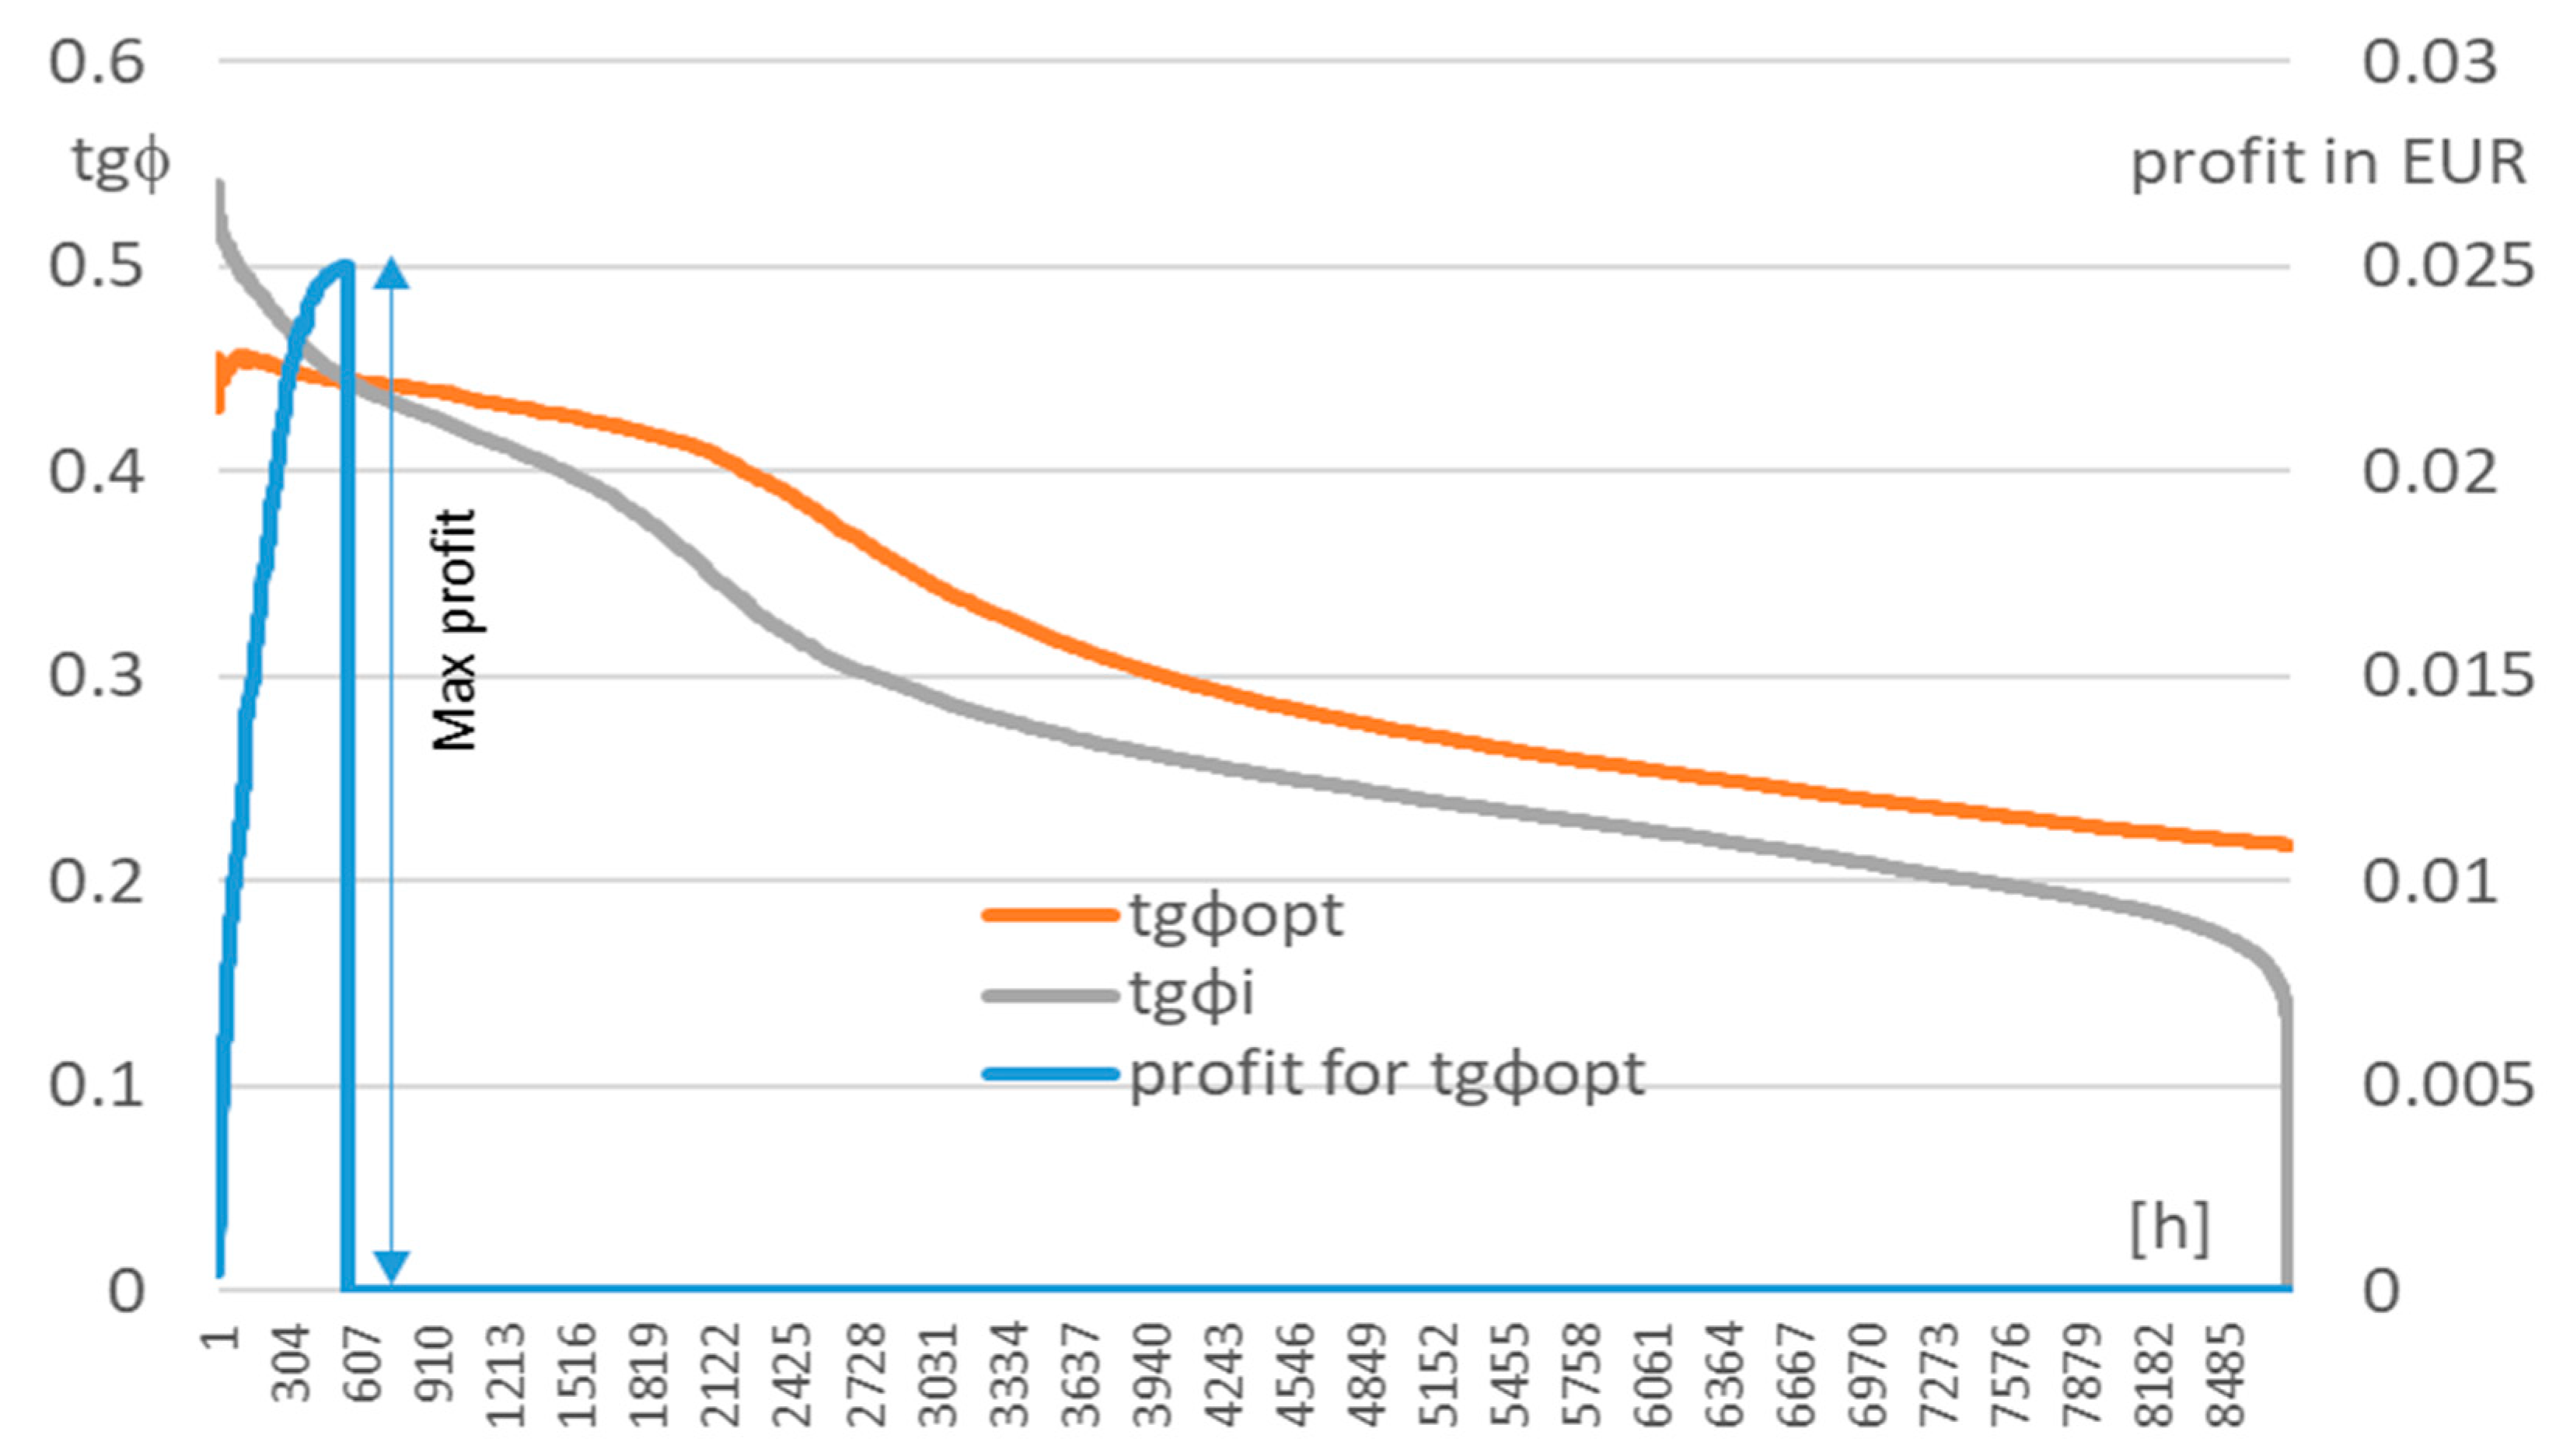
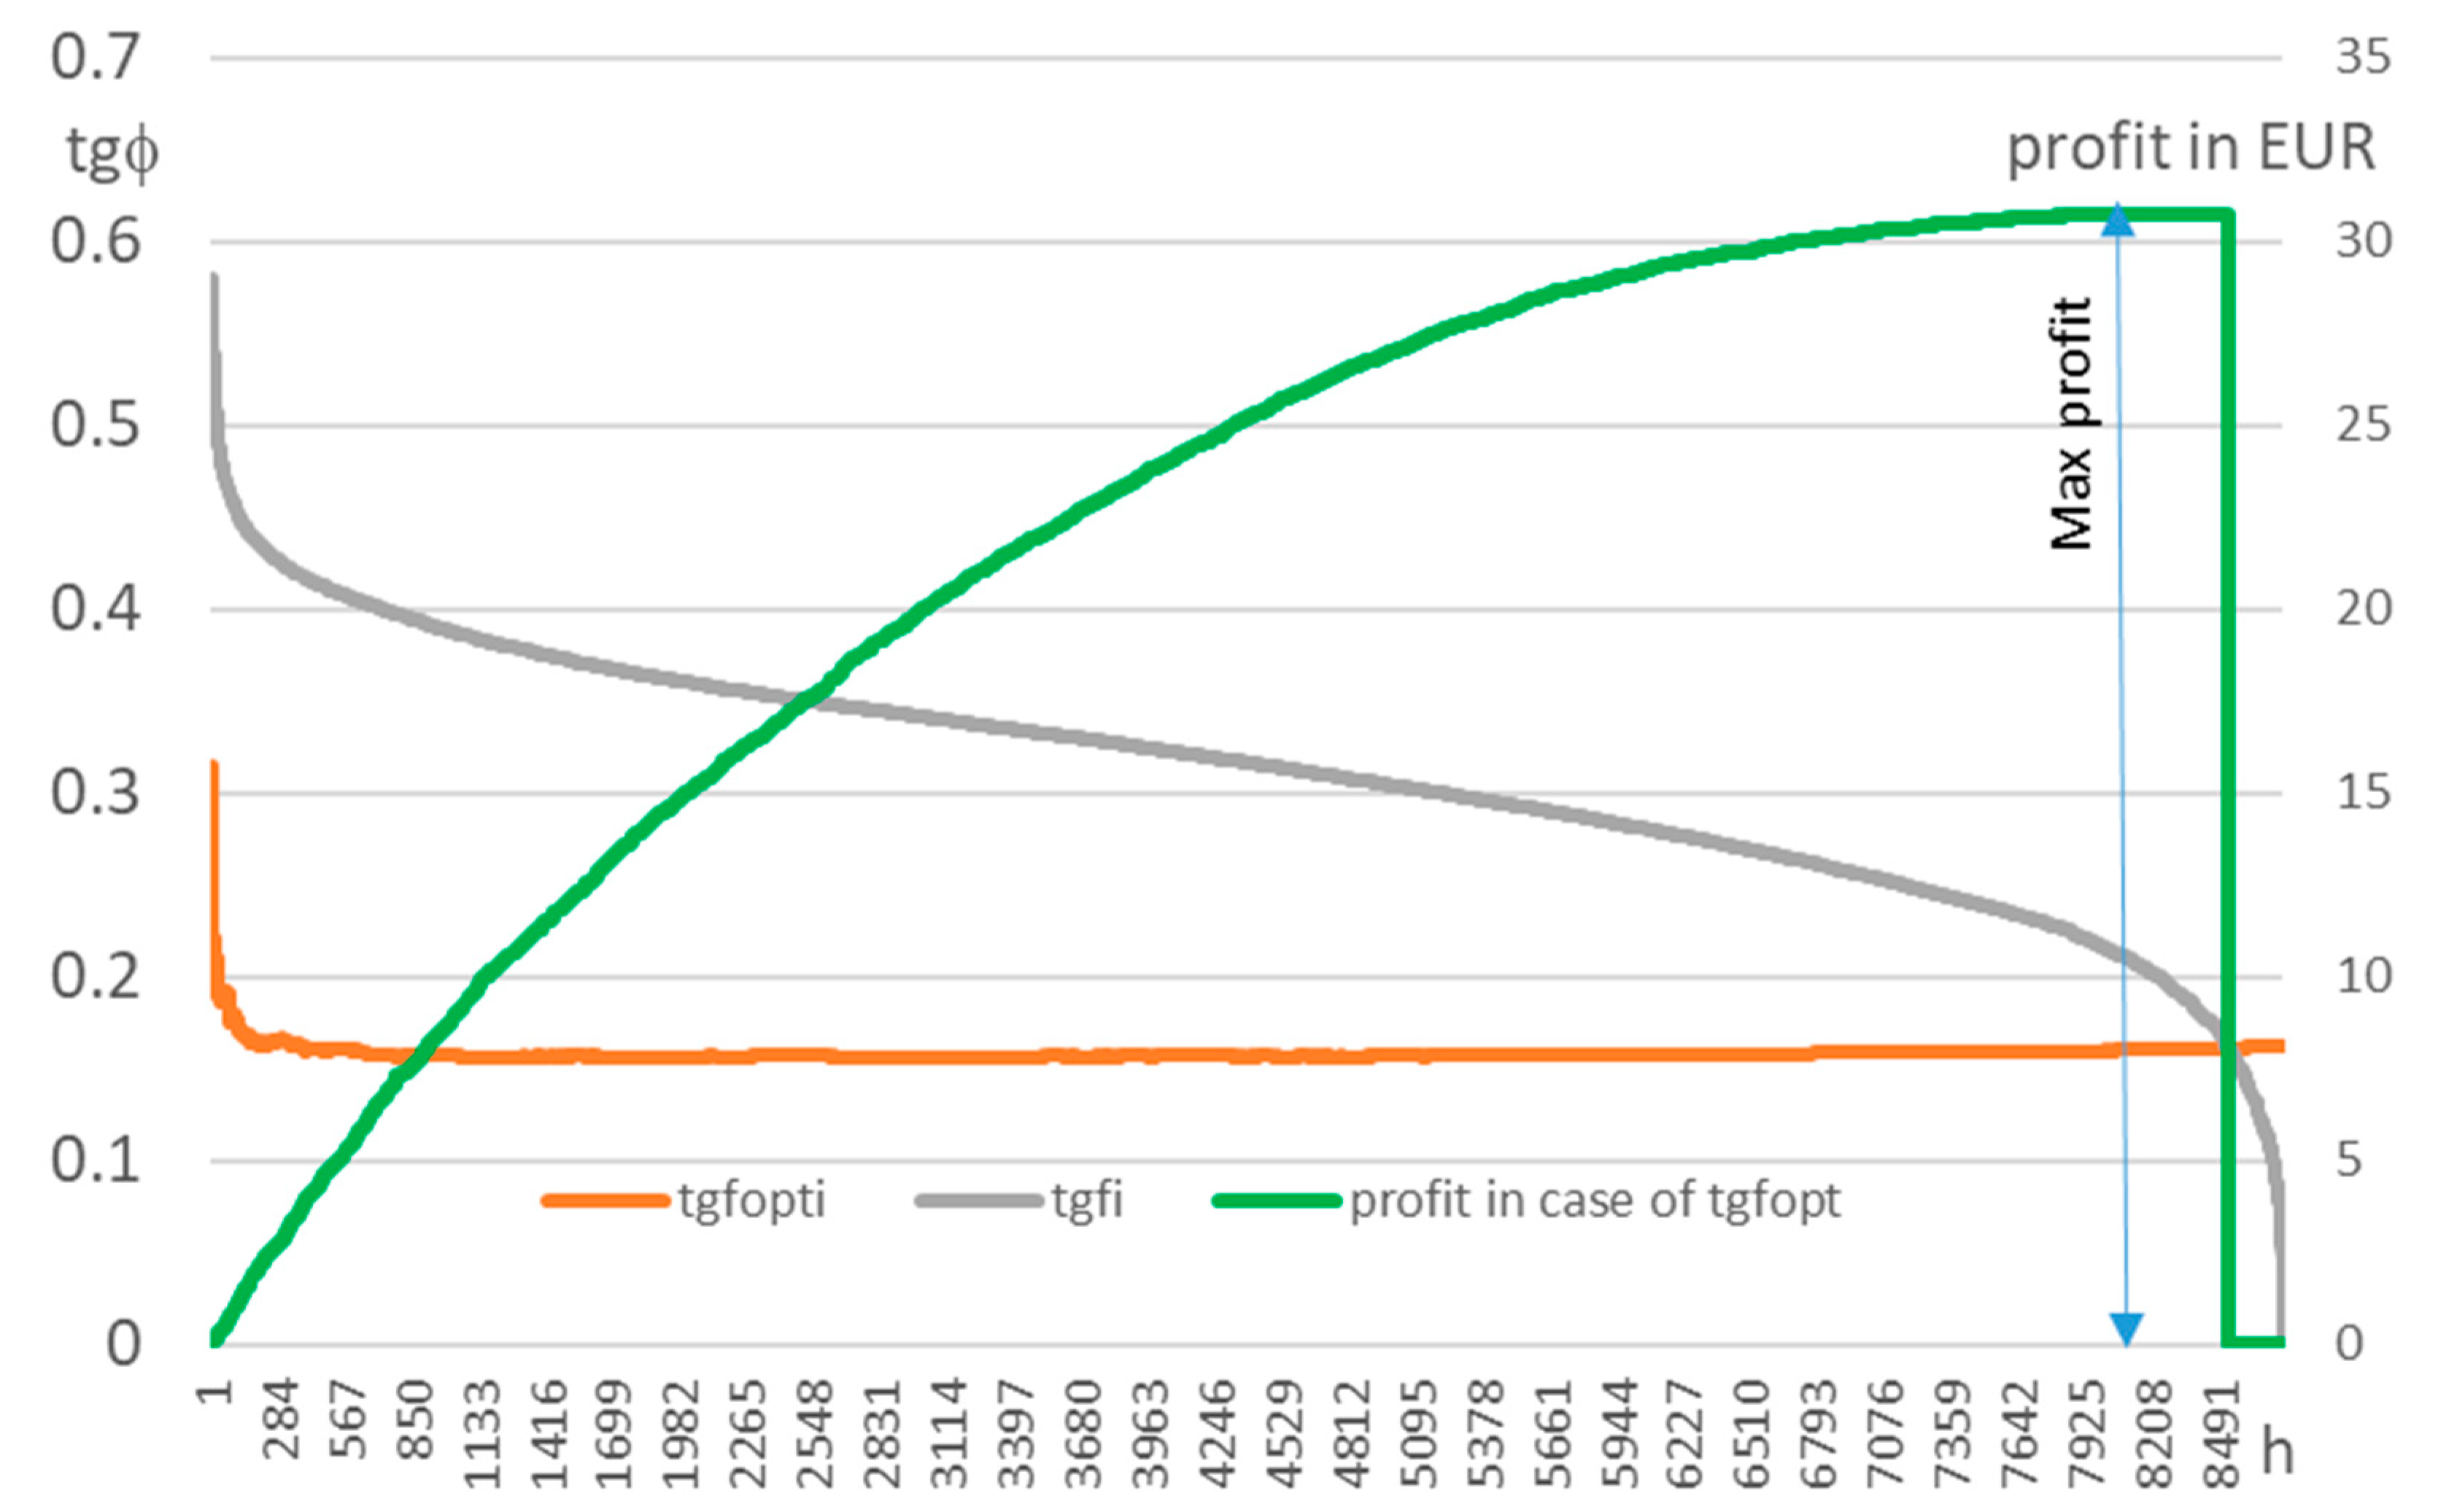
Optimal values of tgφopt are determined for substations S1 and S2 according to the algorithm depicted in Figure 8 for the area of reactive energy consumption, and the results are presented in Figure 9 and Figure 10. The periodic values of tgφi(h) are presented in descending order with the associated tgφopti(h) values for data sets that cover measurement periods of 1 to 8760. The point of intersection of the tgφi(h) and tgφopti(h) curves defines the possible compensation area where tgφi > tgφopti. The curve Pr(tgφopti) allows one to determine the optimal value of the compensator setting slightly different from the mentioned intersection points, which are presented in Figure 9 and Figure 10.
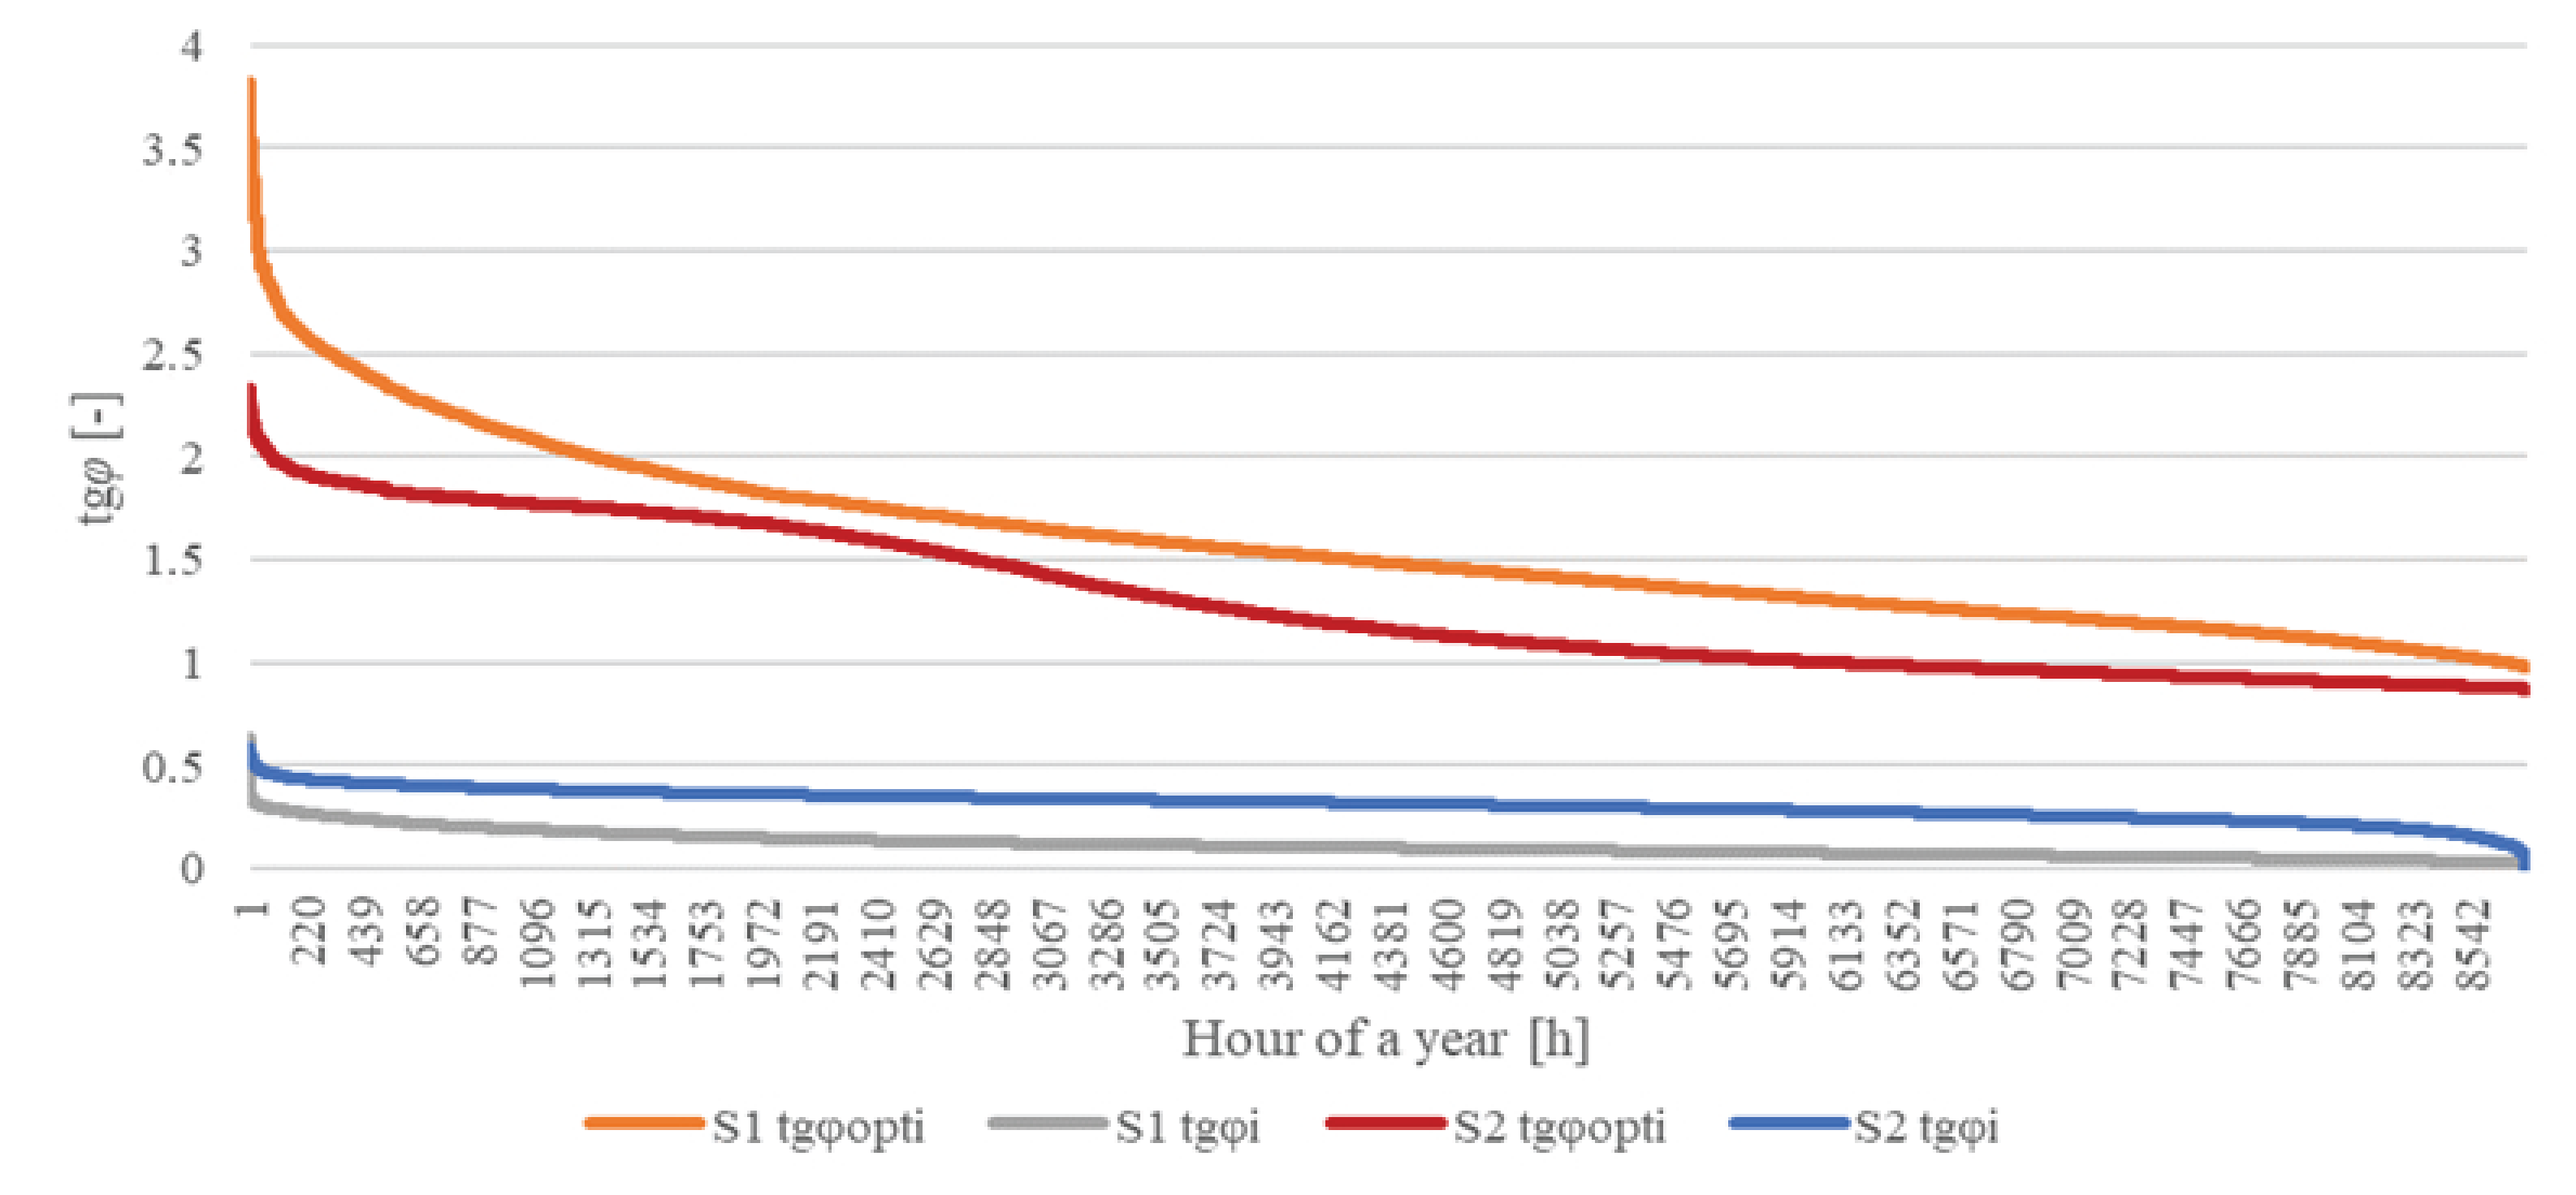
The case of reactive energy generation to the grid (capacitive load) is presented in Figure 11 and also shows the tgφi(h) values in descending order based on the AMI-registered data and the associated optimal tgφopti(h) factors calculated for the sets of data starting with the highest periodic tgφ(h) and ending with tgφi(h). These curves do not intersect.
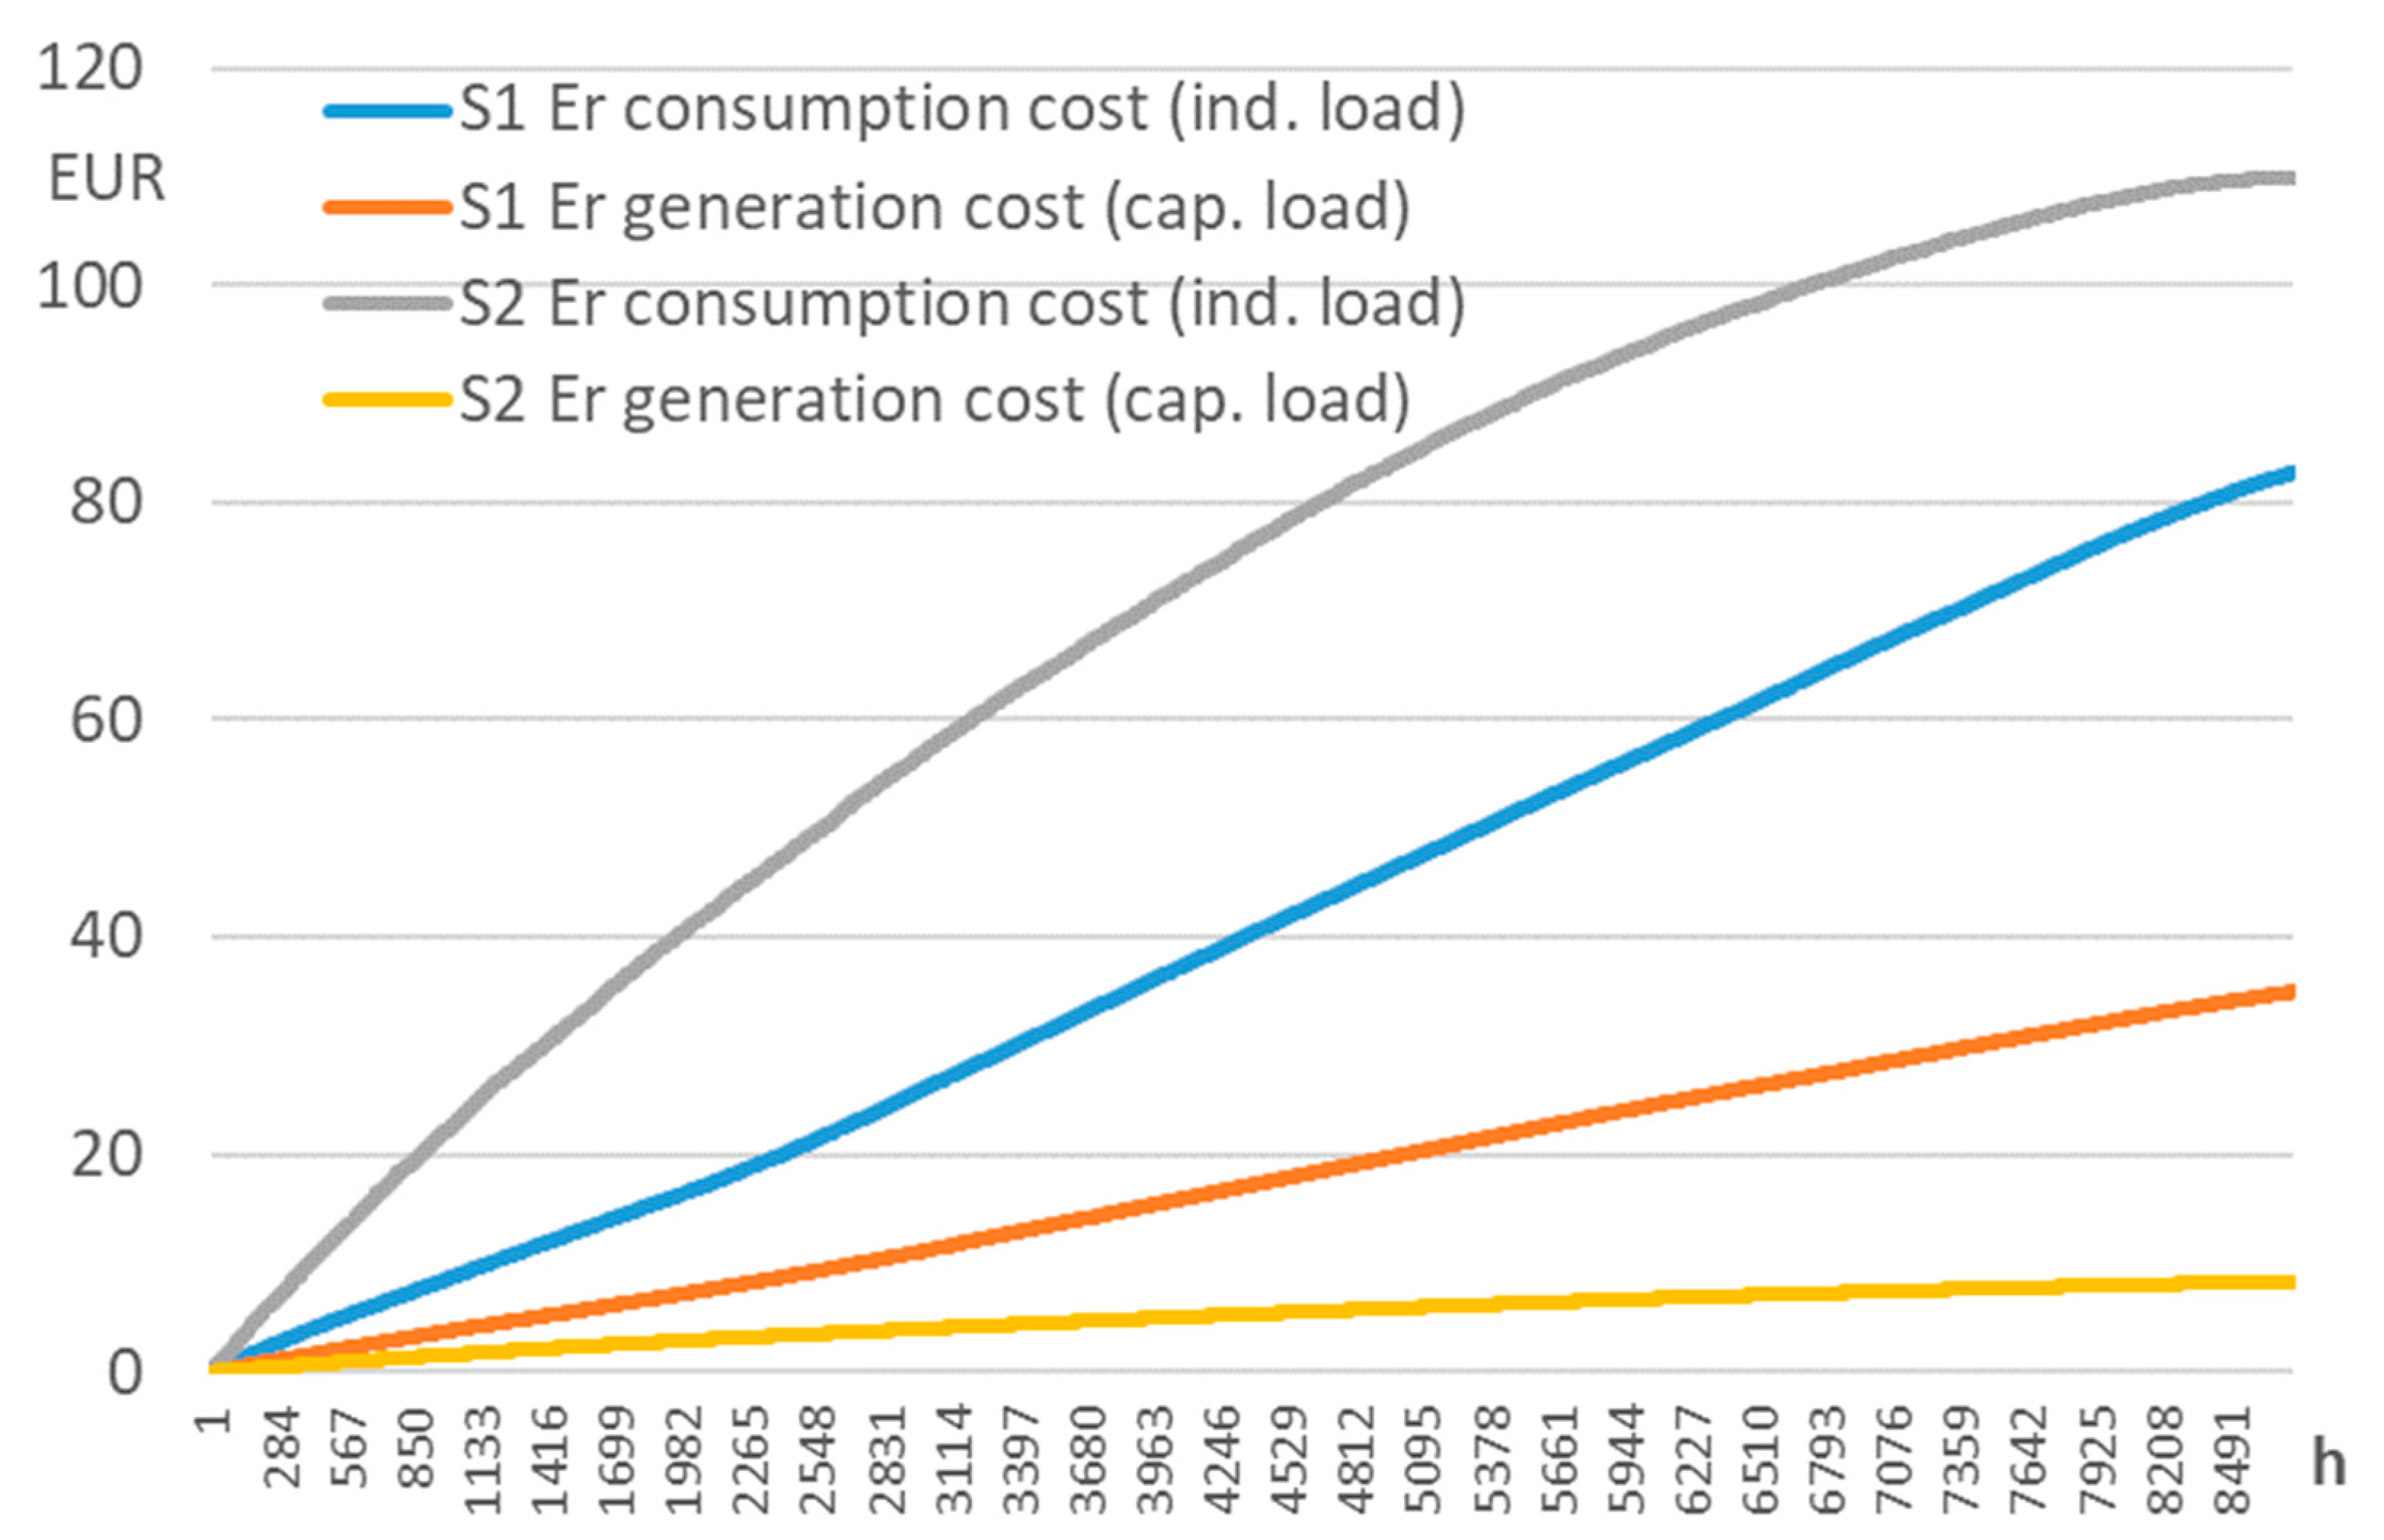
The aggregated cost of losses due to reactive energy flow in substations S1 and S2 without compensation is presented in Figure 12. The costs associated with reactive energy generation for the S2 substation are small due to the much lower volume of capacitive reactive energy transmitted to customers of the S2 substation than in the case of the S1 substation. For the S1 substation, the costs are significantly higher; however, the compensation of these reactive energy flows is still not profitable due to the high operating costs of capacitive energy compensators. The high costs of capacitive energy compensators, causing a lack of profitability of the compensation process, may serve as a justification for certain additional fees for introducing reactive energy into the grid, partially compensating significant losses of the DSO.
The above-presented original methodology for determining the optimal value of the tgφopt coefficient allows for practical use of data recorded by AMI systems for determining the optimal operating conditions of low-voltage networks in terms of losses caused by reactive energy flows.
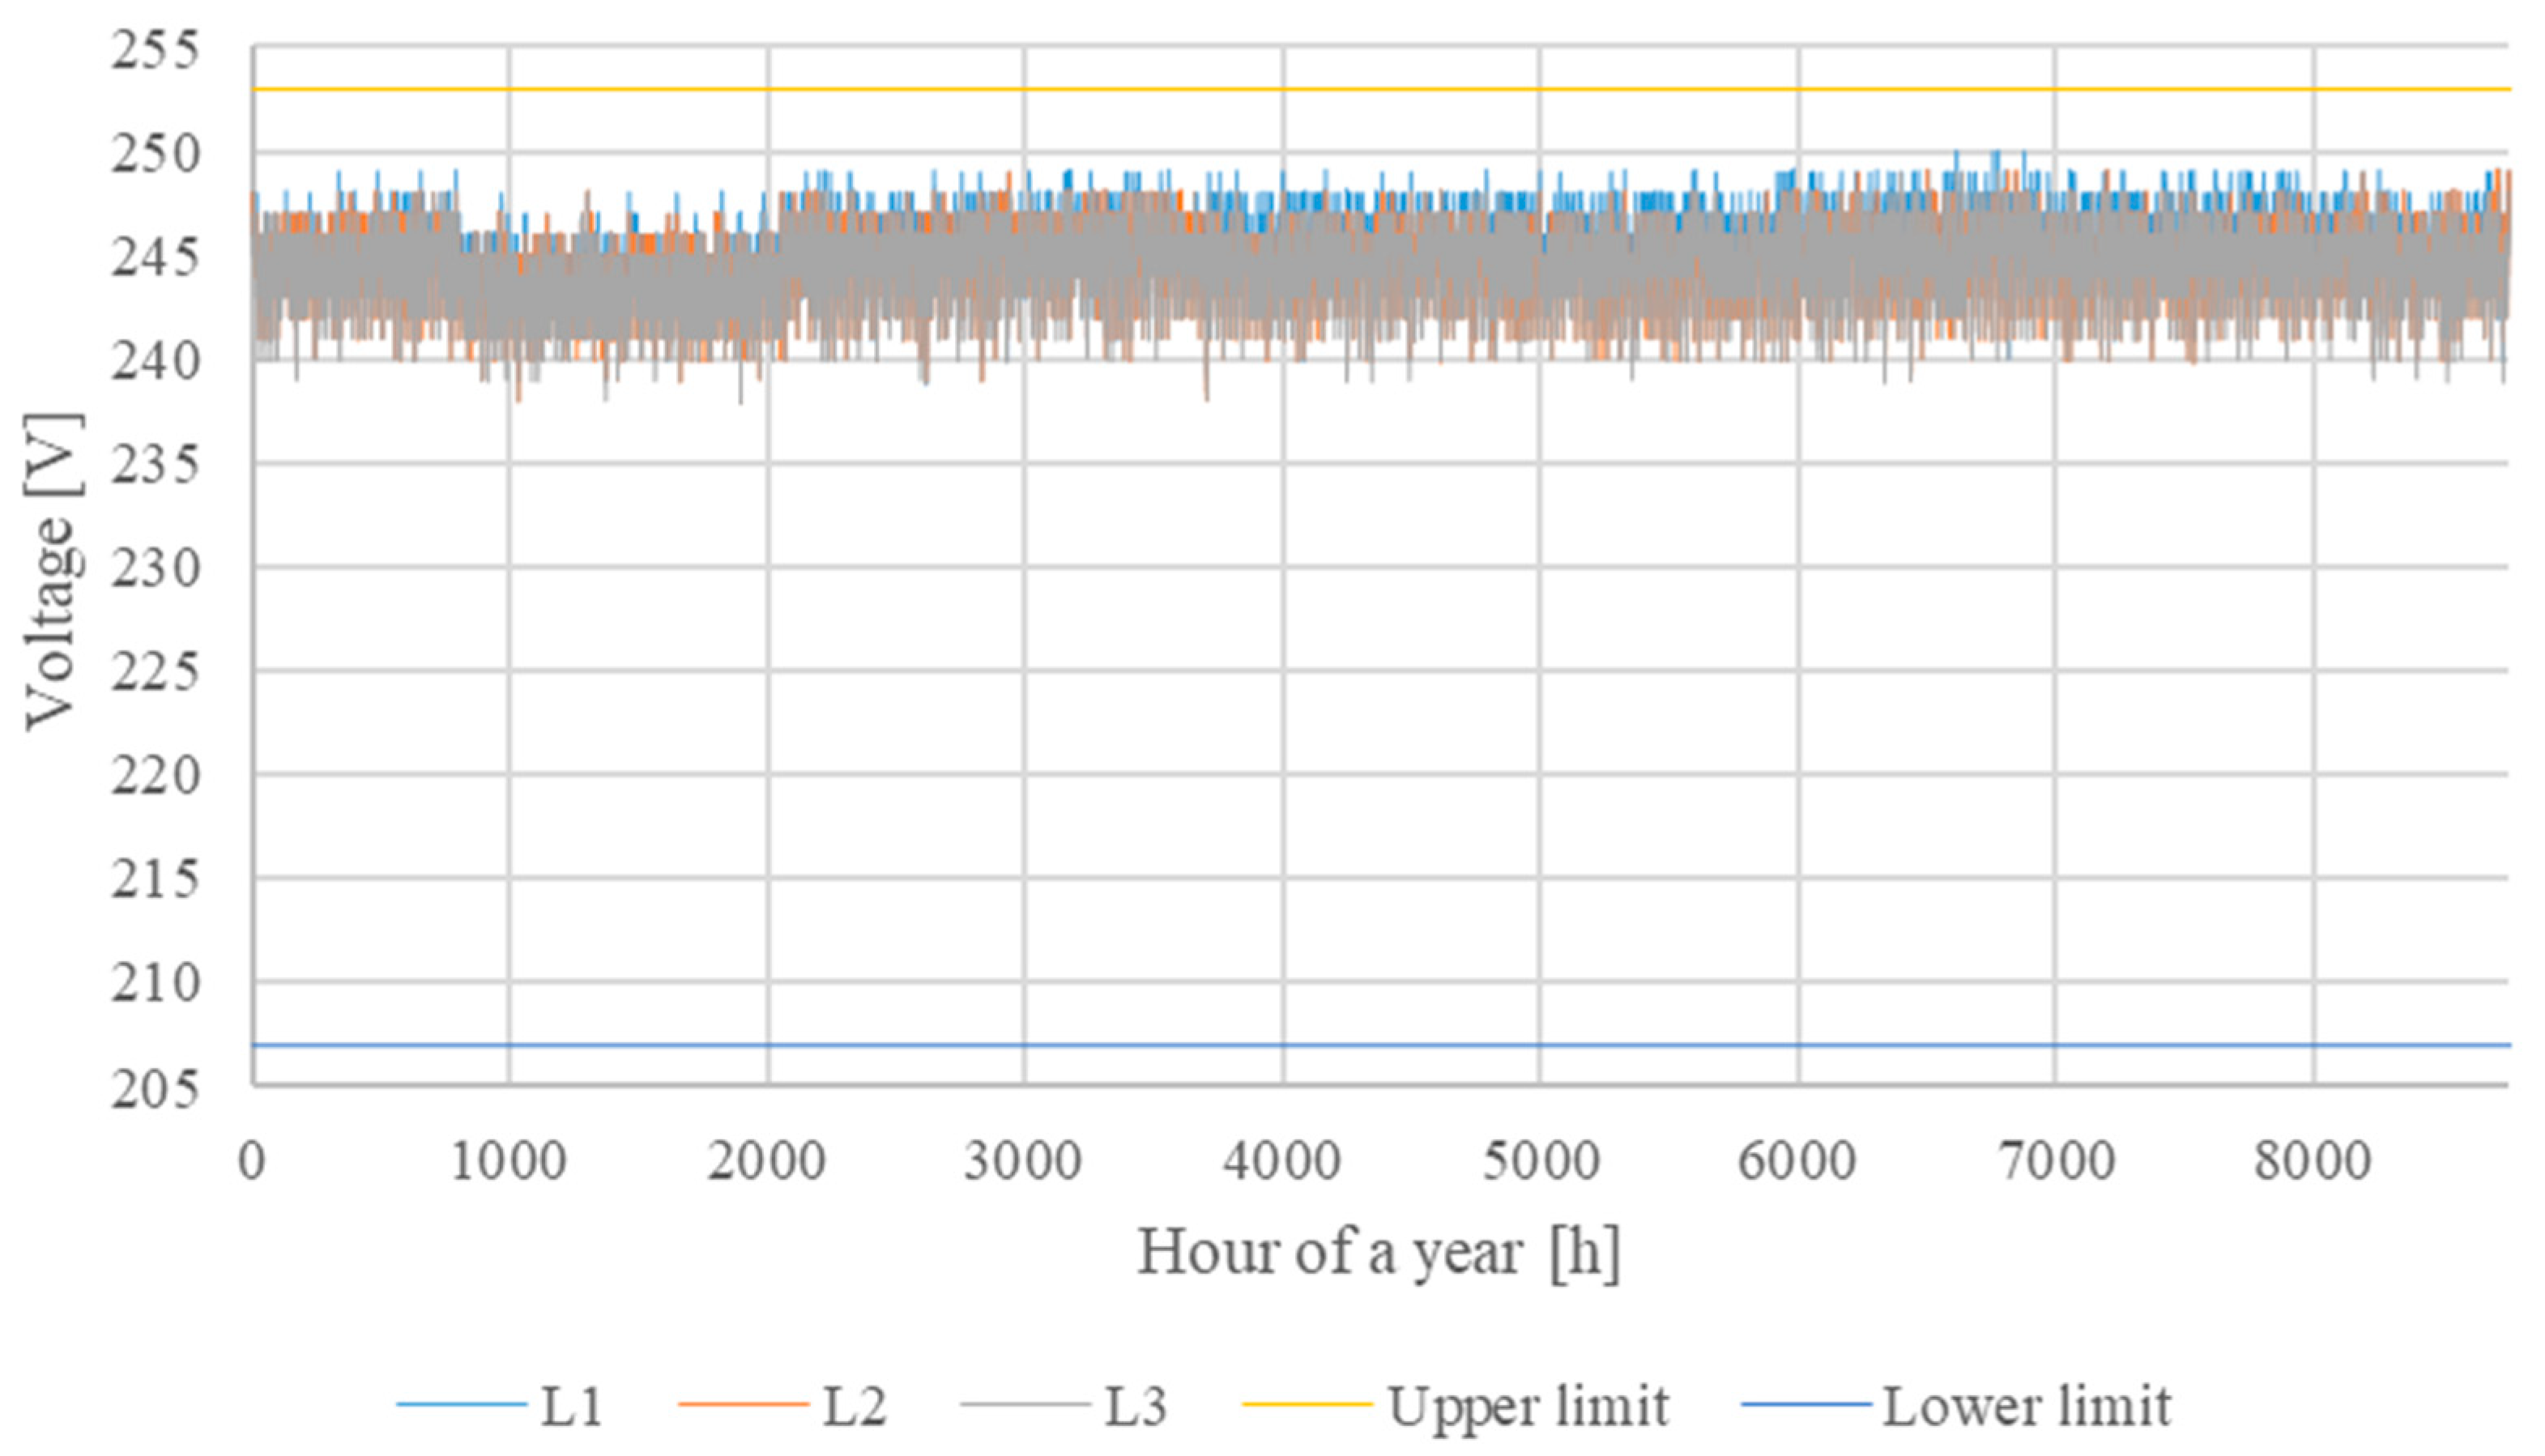
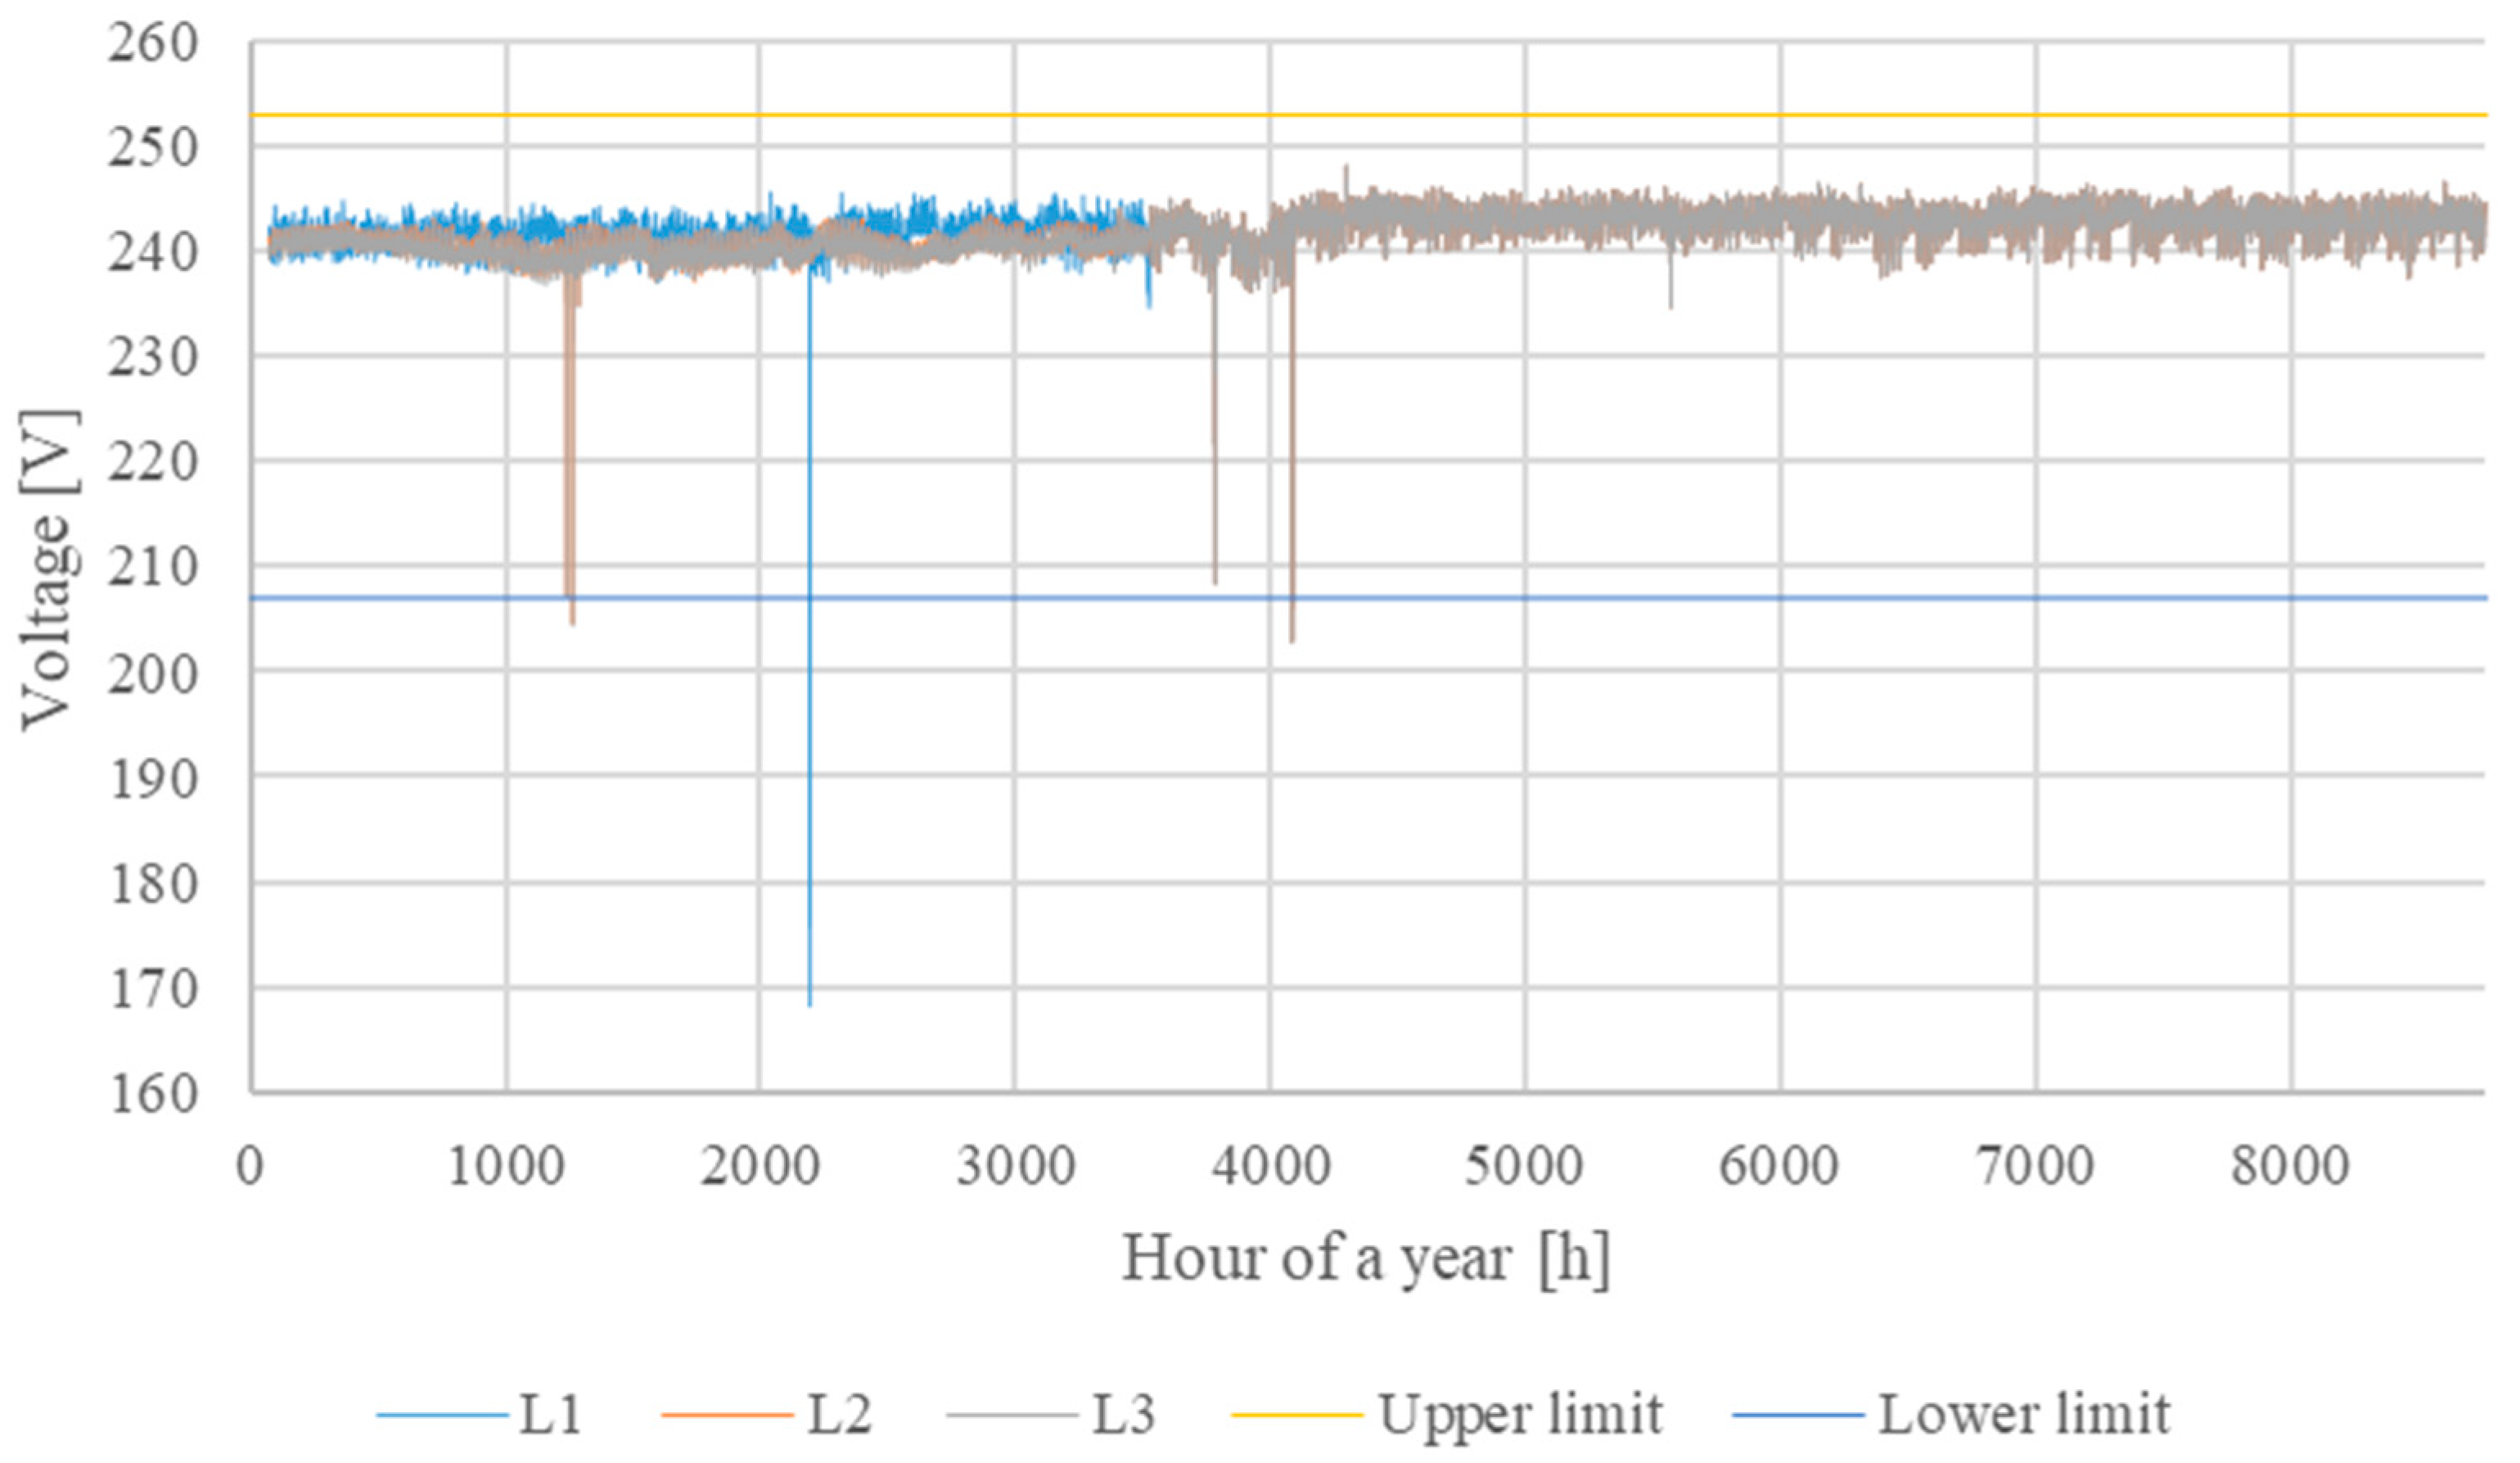
The voltage level at the busbars of the MV/LV substations was also examined. The variation of voltage level in the busbars of the MV/LV substations is presented in Figure 13 and Figure 14 for the substations S1 and S2, respectively. For a period of a year, the voltage values in all three phases did not exceed the permissible limits of ±10% Un [53]. At the S1 substation, the maximum voltage reached 250 V, while the minimum measured voltage value was equal to 238 V. At the S2 substation, the maximum voltage value was 248 V, with a minimum of 168 V, as can be seen in Figure 14. The crossings of lower voltage limit values in Figure 14 were recorded as voltage sags, apparently due to external faults, not related to the reactive energy flow. When omitting the fault voltage values, the minimum voltage in the considered period was equal to 228 V, as shown in Figure 14.

5. Discussion of Results

Compensation of reactive energy consumption or generation should be carried out for measurement periods for which tgφitgφopti. For the remaining periods, compensation at levels tgφi < tgφopti is less profitable or even unprofitable in relation to the lack of compensation.
For the S1 substation, characterized by a lower equivalent resistance Req than the S2 substation, the compensation of the reactive energy consumed is profitable only for high levels of tgφi, and the optimal value is tgφopt = 0.419. The optimal value is not at the point of the intersection of the tgφi(h) and tgφopti(h) curves which falls at the 554/555 period counting from the highest tgφi value but about 30 periods earlier for a set of registered measurements containing 532 periods of the highest tgφi(h) values. With such equivalent resistances and the relationship Cmp/LCOEr, it is relatively more profitable to supply reactive energy from the grid than to produce it in receiving installations because of relatively low active energy losses resulting from the transmission of reactive energy through the grid. Compensation at high tgφopt values, although profitable, makes low profits due to the limited time it takes to use compensating devices during the year and the small cost reduction resulting from the small reduction in reactive energy supplied by the network.
In the case of the S2 substation, the high equivalent resistance of the power grid creates favorable conditions for the production of reactive energy used by consumers in their installations because its transmission through the grid causes significant losses of active energy. Therefore, it is profitable to compensate for reactive energy flows at lower optimal levels, as evidenced by the value of tgφopt = 0.158 for the S2 substation. The long operation period of the compensating devices in this case and the low level of tgφopt allow a significant increase in profits due to reactive energy compensation in relation to the S1 substation. In the case of S2, the point of the intersection of the curves tgφi(h) and tgφopti(h) falls between the 8529/8530 period counting the highest value of tgφi, and the highest profit that indicates the optimal value is observed for a set of measurement periods shorter than 280 periods. The optimal value of tgφopt is stable for a wide set of measurement periods with a size of 8000 periods, and stable profits can be expected for a set of measurement periods that cover from 7500 to 8500 measurement periods with the highest tgφopti(h) values.
In the case of reactive energy generation in receiving circuits, the values of optimal tgφopti(h) coefficients are significantly higher than the values of tgφi(h). These curves do not intersect, and therefore there are no AMI-registered data sets for which compensation would be profitable. Therefore, the compensation of capacitive reactive energy leads to greater losses, taking into account the costs of losses in the network and the costs of using compensation devices, than in the case of lack of compensation, which is due to the significantly higher costs of using capacitive energy compensators (SVGs) than inductive energy compensators (CCBs).
In summary, taking into account Equation (35) and the results presented for the two analyzed substations, the factors that have the greatest impact on the range of reactive energy compensation and profit, i.e., the value of the optimal tgφopt coefficient, are the equivalent resistance ReqLV of the supply network and the ratio of the price of energy losses in the network to the costs of reactive energy generation in the compensator circuits Cmp/LCOEr. The optimal value of tgφopt is also influenced by the supplied load characteristics expressed by the factor Tp/(2Pp*τp), and the conclusion concerning this last influence can be formulated later only based on a larger amount of MV/LV investigated.
This last conclusion is the original one and could be formulated as a consequence of the detailed analysis of losses and not only reactive power flows as is usually performed in reactive power compensation studies.
The optimal value determined for tgφopt is an approximate value of the value that consumers should maintain to ensure the minimum costs of reactive energy supply to their installations throughout the year. The approach to minimize the expenses of both the DSO and the consumer seems reasonable, as it can be assumed that all costs of energy distribution are borne by the consumers, and therefore the reduction in the total losses cost during reactive energy transmission in the network through the installation of compensators by consumers also brings benefits to them. This conclusion ensures that customer interest should be carefully considered and provides the original basis on which the cost of losses should be divided among DSOs and their customers.
Clearly, consumers with a natural factor tgφcust < tgφopt do not need to use reactive energy compensation devices because they do not increase network losses due to reactive energy consumption in relation to consumers maintaining their tgφcust factor at the optimal level by using compensating devices.
Optimal tgφopt values reach higher values with the use of a bidirectional SVG compensator at the level that exceeds 1.0 for S1 and 0.9 for S2. Such high optimal values would not lead to the need to perform reactive energy compensation for consumers who have a natural value of the tgφcust factor at a lower level. With such high optimal tgφopt factors, the limitation of reactive energy flows due to their compensation would be insignificant, and therefore the costs of the DSO could be relatively high, especially in the case of uncompensated reactive energy consumption, as can be seen in Figure 12. In such cases, it would be advisable to consider the optimal tgφopt values of tgφopt allowed only in terms of inductive energy consumption and use CCB compensators with moderate LCOEr, leaving the generation of reactive energy uncompensated. This is the meaningful original conclusion taking into account the strong legal limitation concerning the generation of reactive energy mentioned in Section 2. Its application seems to be justified and practical in low-voltage networks where the reactive power flows do not influence the voltage level due to the very low reactance of power lines, and some level of reactive power generation should be allowed.
For low-voltage networks characterized by low values of the equivalent reactance of distribution lines in relation to their resistance, the impact of reactive energy transmission on the voltage level at consumers is not significant. Even at the highest levels of the tgφ factors analyzed in this article, there is no risk of exceeding the acceptable voltage levels at the consumer connection points defined in [53] as ±10% for 95% of the week. Threats should rather be sought in the transmission of significant active energy from prosumers to MV/LV stations, which may increase the prosumer’s voltage, which in turn may block the operation of customer inverters. Forcing reactive power consumption to a limited extent may be helpful in such cases but, however, leads to greater energy losses in the grid.

6. Conclusions

The advanced metering infrastructure enables the optimization of the operation of the LV network supplied from the transformer substation by determining the optimal level of the tgφ factor to ensure the lowest costs of reactive energy supply to consumers. The level of the optimal tgφopt factor is associated with the equivalent resistance of the LV network that supplies the substation load, calculated on the basis of the low-voltage network loss factor. The uniform level of tgφopt results from averaging the conditions of the electricity supply to consumers. This averaging favors consumers connected using network portions with greater resistance, to which the inflow of reactive energy causes higher network losses, compared to consumers connected using network portions with lower resistance. However, the relationships introduced within this article allow the calculation of the optimal level of compensation of the customer’s group supplied by separate feeders based on the resistance of the feeder, which can also be used further for the differentiation of the optimal tgφ values for various groups of customers. The average results presented in this document on the level of tgφopt may constitute the basis for decisions on the applicable level of reactive energy compensation in low-voltage grids for consumers, proposed by the DSO and approved by the regulatory authorities in the DSO tariff approval process.
The original methodology presented is an alternative to determining the permissible values of the tgφ coefficient using computer methods of power flow in the distribution network. The available data recorded by intelligent measurement systems, installed at different voltage levels, can be used to verify calculations based on detailed modeling of network elements and load variability during the year.
The widespread use of receivers equipped with power electronic systems that control energy consumption causes an increase in capacitive reactive energy flows in the network. Compensation of capacitive reactive energy flows requires the use of more expensive compensation devices in consumer installations, resulting in two- to three-times higher absolute values of optimal tgφopt factors, compared to inductive energy consumption. Capacitive energy flows can jeopardize the DSO strategy to limit network losses in the event of an important injection of reactive energy into some point of the network. Preventive actions can include increasing the consumption of reactive inductive energy by inverters used in solar or wind distributed generators. The costs of such activities and the feasibility of their use by DSOs may constitute a further stage of the research to optimize reactive energy flows in the low-voltage grid.

Author Contributions

Conceptualization, J.A. and A.W.; methodology, J.A.; software, A.W.; validation, J.A. and J.L.; formal analysis, J.A. and J.L.; investigation, J.A. and A.W.; resources, J.A. and A.W.; data curation, A.W.; writing—original draft preparation, J.A. and A.W.; writing—review and editing, J.L.; visualization, J.A. and A.W.; supervision, J.L.; project administration, J.A.; funding acquisition, J.A. and A.W. All authors have read and agreed to the published version of the manuscript.

Funding

This research is co-funded by the European Union under Horizon Europe FP4—Rail4EARTH project “Sustainable and green rail systems” (GA 101101917) and co-funded by the Polish Ministry of Science and Higher Education (former Ministry of Education and Science) under the “International Co-Financed Projects” (Projekty Międzynarodowe Współfinansowane) programme (Agreement No. 5400/HE/2023/2) and also by the Polish Power Transmission and Distribution Association (PTPiREE), grant number 0711/2020/4466 and the Institute of Electric Power Engineering of Poznan University of Technology, grant number 0711/SBAD/4514.

Data Availability Statement

The datasets presented in this article are not readily available because the reasearch founders limited such access as the data contain the commercially sensitive informations.

Conflicts of Interest

The authors declare no conflict of interest.

Glossary

List of abbreviations used within the paper is presented below:
AMIadvanced metering infrastructure
CCBcontrolled capacitor bank
DSOdistribution system operator
HVhigh voltage
MVmedium voltage
LVlow voltage
PVphotovoltaic
RPCreactive power compensator
SVGstatic var generator

References

  1. Sorokin, A.; Rebennack, S.; Pardalos, P.M.; Iliadis, N.A.; Pereira, M.V.F. (Eds.) Handbook of Networks in Power Systems I; Springer: Berlin/Heidelberg, Germany, 2012. [Google Scholar] [CrossRef]
  2. Blinov, I.; Zaitsev, I.O.; Kuchanskyy, V.V. Problems, Methods and Means of Monitoring Power Losses in Overhead Transmission Lines. Stud. Syst. Decis. Control. 2020, 298, 123–136. [Google Scholar] [CrossRef]
  3. Kulczycki, J. Straty Energii Elektrycznej w Sieciach Dystrybucyjnych. (Electricity Losses in Distribution Networks); PTPiREE: Poznań, Poland, 2009. [Google Scholar]
  4. Kaloudas, C.G.; Ochoa, L.F.; Marshall, B.; Majithia, S.; Fletcher, I. Assessing the Future Trends of Reactive Power Demand of Distribution Networks. IEEE Trans. Power Syst. 2017, 32, 4278–4288. [Google Scholar] [CrossRef]
  5. Dong, M.; Meira, P.C.M.; Xu, W.; Chung, C.Y. Non-intrusive signature extraction for major residential loads. IEEE Trans. Smart Grid 2013, 4, 1421–1430. [Google Scholar] [CrossRef]
  6. Anderson, H.C.; al Hadi, A.; Jones, E.S.; Ionel, D.M. Power Factor and Reactive Power in US Residences—Survey and EnergyPlus Modeling. In Proceedings of the 10th IEEE International Conference on Renewable Energy Research and Applications, ICRERA 2021, Istanbul, Turkey, 26–29 September 2021; pp. 418–422. [Google Scholar] [CrossRef]
  7. Statistics Poland. Energy Consumption in Households in 2018; Statistics Poland: Warsaw, Poland, 2019. [Google Scholar]
  8. Commission Regulation (EU) 2019/2020 of 1 October 2019 laying down ecodesign requirements for light sources and separate control gears pursuant to Directive 2009/125/EC of the European Parliament and of the Council and repealing Commission Regulations (EC) No 244/2009, (EC) No 245/2009 and (EU) No 1194/2012 Text with EEA relevance. n.d. Off. J. Eur. Union. 2019, 315, 209–240.
  9. Winder, S. Nonisolated Power Factor Correction Circuits. In Power Supplies for LED Driving; Elsevier: Amsterdam, The Netherlands, 2017; pp. 155–187. [Google Scholar] [CrossRef]
  10. Heffernan, W.J.B.; Watson, N.R.; Watson, J.D. Heat-pump performance: Voltage dip/sag, under-voltage and over-voltage. J. Eng. 2014, 2014, 640–657. [Google Scholar] [CrossRef]
  11. IEC 61000-3-2:2018/AMD1:2020 Electromagnetic Compatibility (EMC)—Part 3-2: Limits—Limits for Harmonic Current Emissions (Equipment Input Current ≤16 A per Phase) n.d. Available online: https://webstore.iec.ch/publication/63492 (accessed on 16 July 2022).
  12. Batarseh, I.; Wei, H. Power Factor Correction Circuits. In Power Electronics Handbook; Elsevier Inc.: Amsterdam, The Netherlands, 2011. [Google Scholar] [CrossRef]
  13. Cortezzi, F.C.M.; da Silva Jota, P.R. Residential Load Curve Analysis during Electric Vehicle Charging. J. Power Energy Eng. 2017, 5, 49–61. [Google Scholar] [CrossRef]
  14. Gayatri, M.T.L.; Parimi, A.M.; Pavan Kumar, A.V. A review of reactive power compensation techniques in microgrids. Renew. Sustain. Energy Rev. 2018, 81, 1030–1036. [Google Scholar] [CrossRef]
  15. Sarkar, M.N.I.; Meegahapola, L.G.; Datta, M. Reactive power management in renewable rich power grids: A review of grid-codes, renewable generators, support devices, control strategies and optimization Algorithms. IEEE Access 2018, 6, 41458–41489. [Google Scholar] [CrossRef]
  16. Pothirasan, N.; Rajasekaran, M.P.; Muneeswaran, V. Real time reactive power compensation for battery/photovoltaic hybrid power source for internet of hybrid electric vehicle system. Cogn. Syst. Res. 2018, 52, 473–488. [Google Scholar] [CrossRef]
  17. Golshannavaz, S. Cooperation of electric vehicle and energy storage in reactive power compensation: An optimal home energy management system considering PV presence. Sustain. Cities Soc. 2018, 39, 317–325. [Google Scholar] [CrossRef]
  18. Montoya, O.D.; Gil-González, W. Dynamic active and reactive power compensation in distribution networks with batteries: A day-ahead economic dispatch approach. Comput. Electr. Eng. 2020, 85, 106710. [Google Scholar] [CrossRef]
  19. Guchhait, P.K.; Banerjee, A.; Mukherjee, V. Comparative study using soft computing techniques for the reactive power compensation of a hybrid power system model. Ain Shams Eng. J. 2020, 11, 87–98. [Google Scholar] [CrossRef]
  20. Águila Téllez, A.; López, G.; Isaac, I.; González, J.W. Optimal reactive power compensation in electrical distribution systems with distributed resources. Heliyon 2018, 4, e00746. [Google Scholar] [CrossRef]
  21. Vlahinić, S.; Franković, D.; Komen, V.; Antonić, A. Reactive Power Compensation with PV Inverters for System Loss Reduction. Energies 2019, 12, 4062. [Google Scholar] [CrossRef]
  22. Li, H.; Wen, C.; Chao, K.-H.; Li, L.-L. Research on Inverter Integrated Reactive Power Control Strategy in the Grid-Connected PV Systems. Energies 2017, 10, 912. [Google Scholar] [CrossRef]
  23. Arnold, G.; Valov, B.; Reimann, T.; Stetz, T.; Braun, M. Optimal Reactive Power Supply in Distribution Networks—Technological and Economic Assessment for PV-Systems. In Proceedings of the 24th European Photovoltaic Solar Energy Conference, Hamburg, Germany, 21–25 September 2009; pp. 3872–3881. [Google Scholar] [CrossRef]
  24. Rezaei, F.; Esmaeili, S. Decentralized reactive power control of distributed PV and wind power generation units using an optimized fuzzy-based method. International J. Electr. Power Energy Syst. 2017, 87, 27–42. [Google Scholar] [CrossRef]
  25. Layate, Z.; Bahi, T.; Abadlia, I.; Bouzeria, H.; Lekhchine, S. Reactive power compensation control for three phase grid-connected photovoltaic generator. Int. J. Hydrogen Energy 2015, 40, 12619–12626. [Google Scholar] [CrossRef]
  26. Schultis, D.L.; Ilo, A.; Schirmer, C. Overall performance evaluation of reactive power control strategies in low voltage grids with high prosumer share. Electr. Power Syst. Res. 2019, 168, 336–349. [Google Scholar] [CrossRef]
  27. Hamrouni, N.; Younsi, S.; Jraidi, M. A Flexible Active and Reactive Power Control Strategy of a LV Grid Connected PV System. Energy Procedia 2019, 162, 325–338. [Google Scholar] [CrossRef]
  28. Jakušenoks, A.; Laizāns, A. Impact of household electric energy usage trends on electrical power supply net power factor. Res. Rural. Dev. 2015, 1. Available online: https://losses.ukpowernetworks.co.uk/losses/static/pdfs/strategies-for-reducing-losses-in-distribution-networks.d1b2a6f.pdf (accessed on 28 November 2021).
  29. Strbac, G.; Djapic, P.; Pudjianto, D.; Konstantelos, I.; Moreira, R. Strategies for Reducing Losses in Distribution Networks; Imperial College London: London, UK, 2018. [Google Scholar]
  30. Benchmarking Smart Metering Deployment in the EU-28—Publications Office of the EU n.d. Available online: https://op.europa.eu/en/publication-detail/-/publication/b397ef73-698f-11ea-b735-01aa75ed71a1/language-en (accessed on 28 November 2021).
  31. Tufon, C.; Isemonger, A.; Kirby, B.; Kueck, J.; Li, F. A tariff for reactive power. In Proceedings of the 2009 IEEE/PES Power Systems Conference and Exposition, PSCE 2009, Seattle, WA, USA, 15–18 March 2009. [Google Scholar] [CrossRef]
  32. Raap, M.; Raesaar, P.; Tiigimägi, E. Reactive power pricing in distribution networks. Oil Shale 2011, 28, 223–239. [Google Scholar] [CrossRef]
  33. Wilczyński, A.; Bućko, P. Reactive Energy Billing in Operator Tariffs in Poland. Acta Energetica 2015, 4–9. [Google Scholar] [CrossRef]
  34. Kolenc, M.; Papič, I.; Blažič, B. Coordinated reactive power control to achieve minimal operating costs. Int. J. Electr. Power Energy Syst. 2014, 63, 1000–1007. [Google Scholar] [CrossRef]
  35. Coman, C.M.; Florescu, A.; Oancea, C.D. Improving the Efficiency and Sustainability of Power Systems Using Distributed Power Factor Correction Methods. Sustainability 2020, 12, 3134. [Google Scholar] [CrossRef]
  36. Mahdavi Tabatabei, N.; Jafari Aghbolaghi, A.; Bizon, N.; Blaabjerg, F. Reactive Power Control in AC Power Systems; Springer International Publishing: Cham, Switzerland, 2017. [Google Scholar] [CrossRef]
  37. Sauer, P.W. Reactive Power and Voltage Control Issues in Electric Power Systems. In Applied Mathematics for Restructured Electric Power Systems; Springer: Berlin/Heidelberg, Germany, 2005; pp. 11–24. [Google Scholar] [CrossRef]
  38. Gandhi, O.; Rodríguez-Gallegos, C.; Reindl, T.; Srinivasan, D. Competitiveness of PV Inverter as a Reactive Power Compensator considering Inverter Lifetime Reduction. Energy Procedia 2018, 150, 74–82. [Google Scholar] [CrossRef]
  39. Bisanovic, S.; Hajro, M.; Samardzic, M. One approach for reactive power control of capacitor banks in distribution and industrial networks. Int. J. Electr. Power Energy Syst. 2014, 60, 67–73. [Google Scholar] [CrossRef]
  40. Ahmadi, H.; Martí, J.R.; Dommel, H.W. A Framework for Volt-VAR Optimization in Distribution Systems. IEEE Trans. Smart Grid 2015, 6, 1473–1483. [Google Scholar] [CrossRef]
  41. Stanelyte, D.; Radziukynas, V. Review of Voltage and Reactive Power Control Algorithms in Electrical Distribution Networks. Energies 2019, 13, 58. [Google Scholar] [CrossRef]
  42. Amiel, I.; Rajput, S.; Averbukh, M. Capacitive reactive power compensation to prevent voltage instabilities in distribution lines. Int. J. Electr. Power Energy Syst. 2021, 131, 107043. [Google Scholar] [CrossRef]
  43. Yang, C.F.; Lai, G.G.; Lee, C.H.; Su, C.T.; Chang, G.W. Optimal setting of reactive compensation devices with an improved voltage stability index for voltage stability enhancement. Int. J. Electr. Power Energy Syst. 2012, 37, 50–57. [Google Scholar] [CrossRef]
  44. Molina-García, Á.; Mastromauro, R.A.; García-Sánchez, T.; Pugliese, S.; Liserre, M.; Stasi, S. Reactive Power Flow Control for PV Inverters Voltage Support in LV Distribution Networks. IEEE Trans. Smart Grid 2017, 8, 447–456. [Google Scholar] [CrossRef]
  45. Jay, D.; Swarup, K.S. A comprehensive survey on reactive power ancillary service markets. Renew. Sustain. Energy Rev. 2021, 144, 110967. [Google Scholar] [CrossRef]
  46. Braun, M. Provision of Ancillary Services by Distributed Generators: Technological and Economic Perspective; Kassel University Press GmbH: Kassel, Germany, 2009. [Google Scholar]
  47. Anaya, K.L.; Pollitt, M.G. Reactive power procurement: A review of current trends. Appl. Energy 2020, 270, 114939. [Google Scholar] [CrossRef]
  48. Albuquerque, F.L.; Moraes, A.J.; Guimarães, G.C.; Sanhueza, S.M.R.; Vaz, A.R. Photovoltaic solar system connected to the electric power grid operating as active power generator and reactive power compensator. Solar Energy 2010, 84, 1310–1317. [Google Scholar] [CrossRef]
  49. Reiman, A.P.; Somani, A.; Alam, M.J.E.; Wang, P.; Wu, D.; Kalsi, K. Power factor correction in feeders with distributed photovoltaics using residential appliances as virtual batteries. IEEE Access 2019, 7, 99115–99122. [Google Scholar] [CrossRef]
  50. Prasad, V.; Jayasree, P.R.; Sruthy, V. Active Power Sharing and Reactive Power Compensation in a Grid-tied Photovoltaic System. Mater. Today Proc. 2018, 5, 1537–1544. [Google Scholar] [CrossRef]
  51. Baghban-Novin, S.; Mahzouni-Sani, M.; Hamidi, A.; Golshannavaz, S.; Nazarpour, D.; Siano, P. Investigating the impacts of feeder reforming and distributed generation on reactive power demand of distribution networks. Sustain. Energy Grids Netw. 2020, 22, 100350. [Google Scholar] [CrossRef]
  52. Andruszkiewicz, J.; Lorenc, J.; Weychan, A. Determination of the Optimal Level of Reactive Power Compensation That Minimizes the Costs of Losses in Distribution Networks. Energies 2024, 17, 150. [Google Scholar] [CrossRef]
  53. European Norm EN 50160; Voltage Characteristics of Electricity Supplied by Public Distribution Systems. CENELEC: Brussels, Belgium, 1999.
  54. Rozporządzenie Ministra Gospodarki z Dnia 4 Maja 2007 r. w Sprawie Szczegółowych Warunków Funkcjonowania Systemu Elektroenergetycznego n.d. (Regulation of the Minister of Economy of 4 May 2007 on Detailed Conditions for the Operation of the Electricity System). Available online: https://isap.sejm.gov.pl/isap.nsf/DocDetails.xsp?id=wdu20070930623 (accessed on 13 July 2022).
  55. Rozporządzenie Ministra Energii z Dnia 6 Marca 2019 r. w Sprawie Szczegółowych Zasad Kształtowania i Kalkulacji Taryf Oraz Rozliczeń w Obrocie Energią Elektryczną n.d. (Regulation of the Minister of Energy of 6 March 2019 on Detailed Principles for Shaping and Calculating Tariffs and Settlements in Electricity Trading). Available online: https://isap.sejm.gov.pl/isap.nsf/DocDetails.xsp?id=WDU20190000503 (accessed on 13 July 2022).
  56. Ustawa z 10 Kwietnia 1997 r.—Prawo Energetyczne—Tekst Jednolity (Act of 10 April 1997—Energy Law—Consolidated Text). Available online: https://isap.sejm.gov.pl/isap.nsf/DocDetails.xsp?id=WDU20220001385 (accessed on 15 March 2024).
  57. ARE. Statystyka Elektroenergetyki Polskiej (Statistics of the Polish Power Industry) 2019; ARE: Warszawa, Poland, 2020. [Google Scholar]
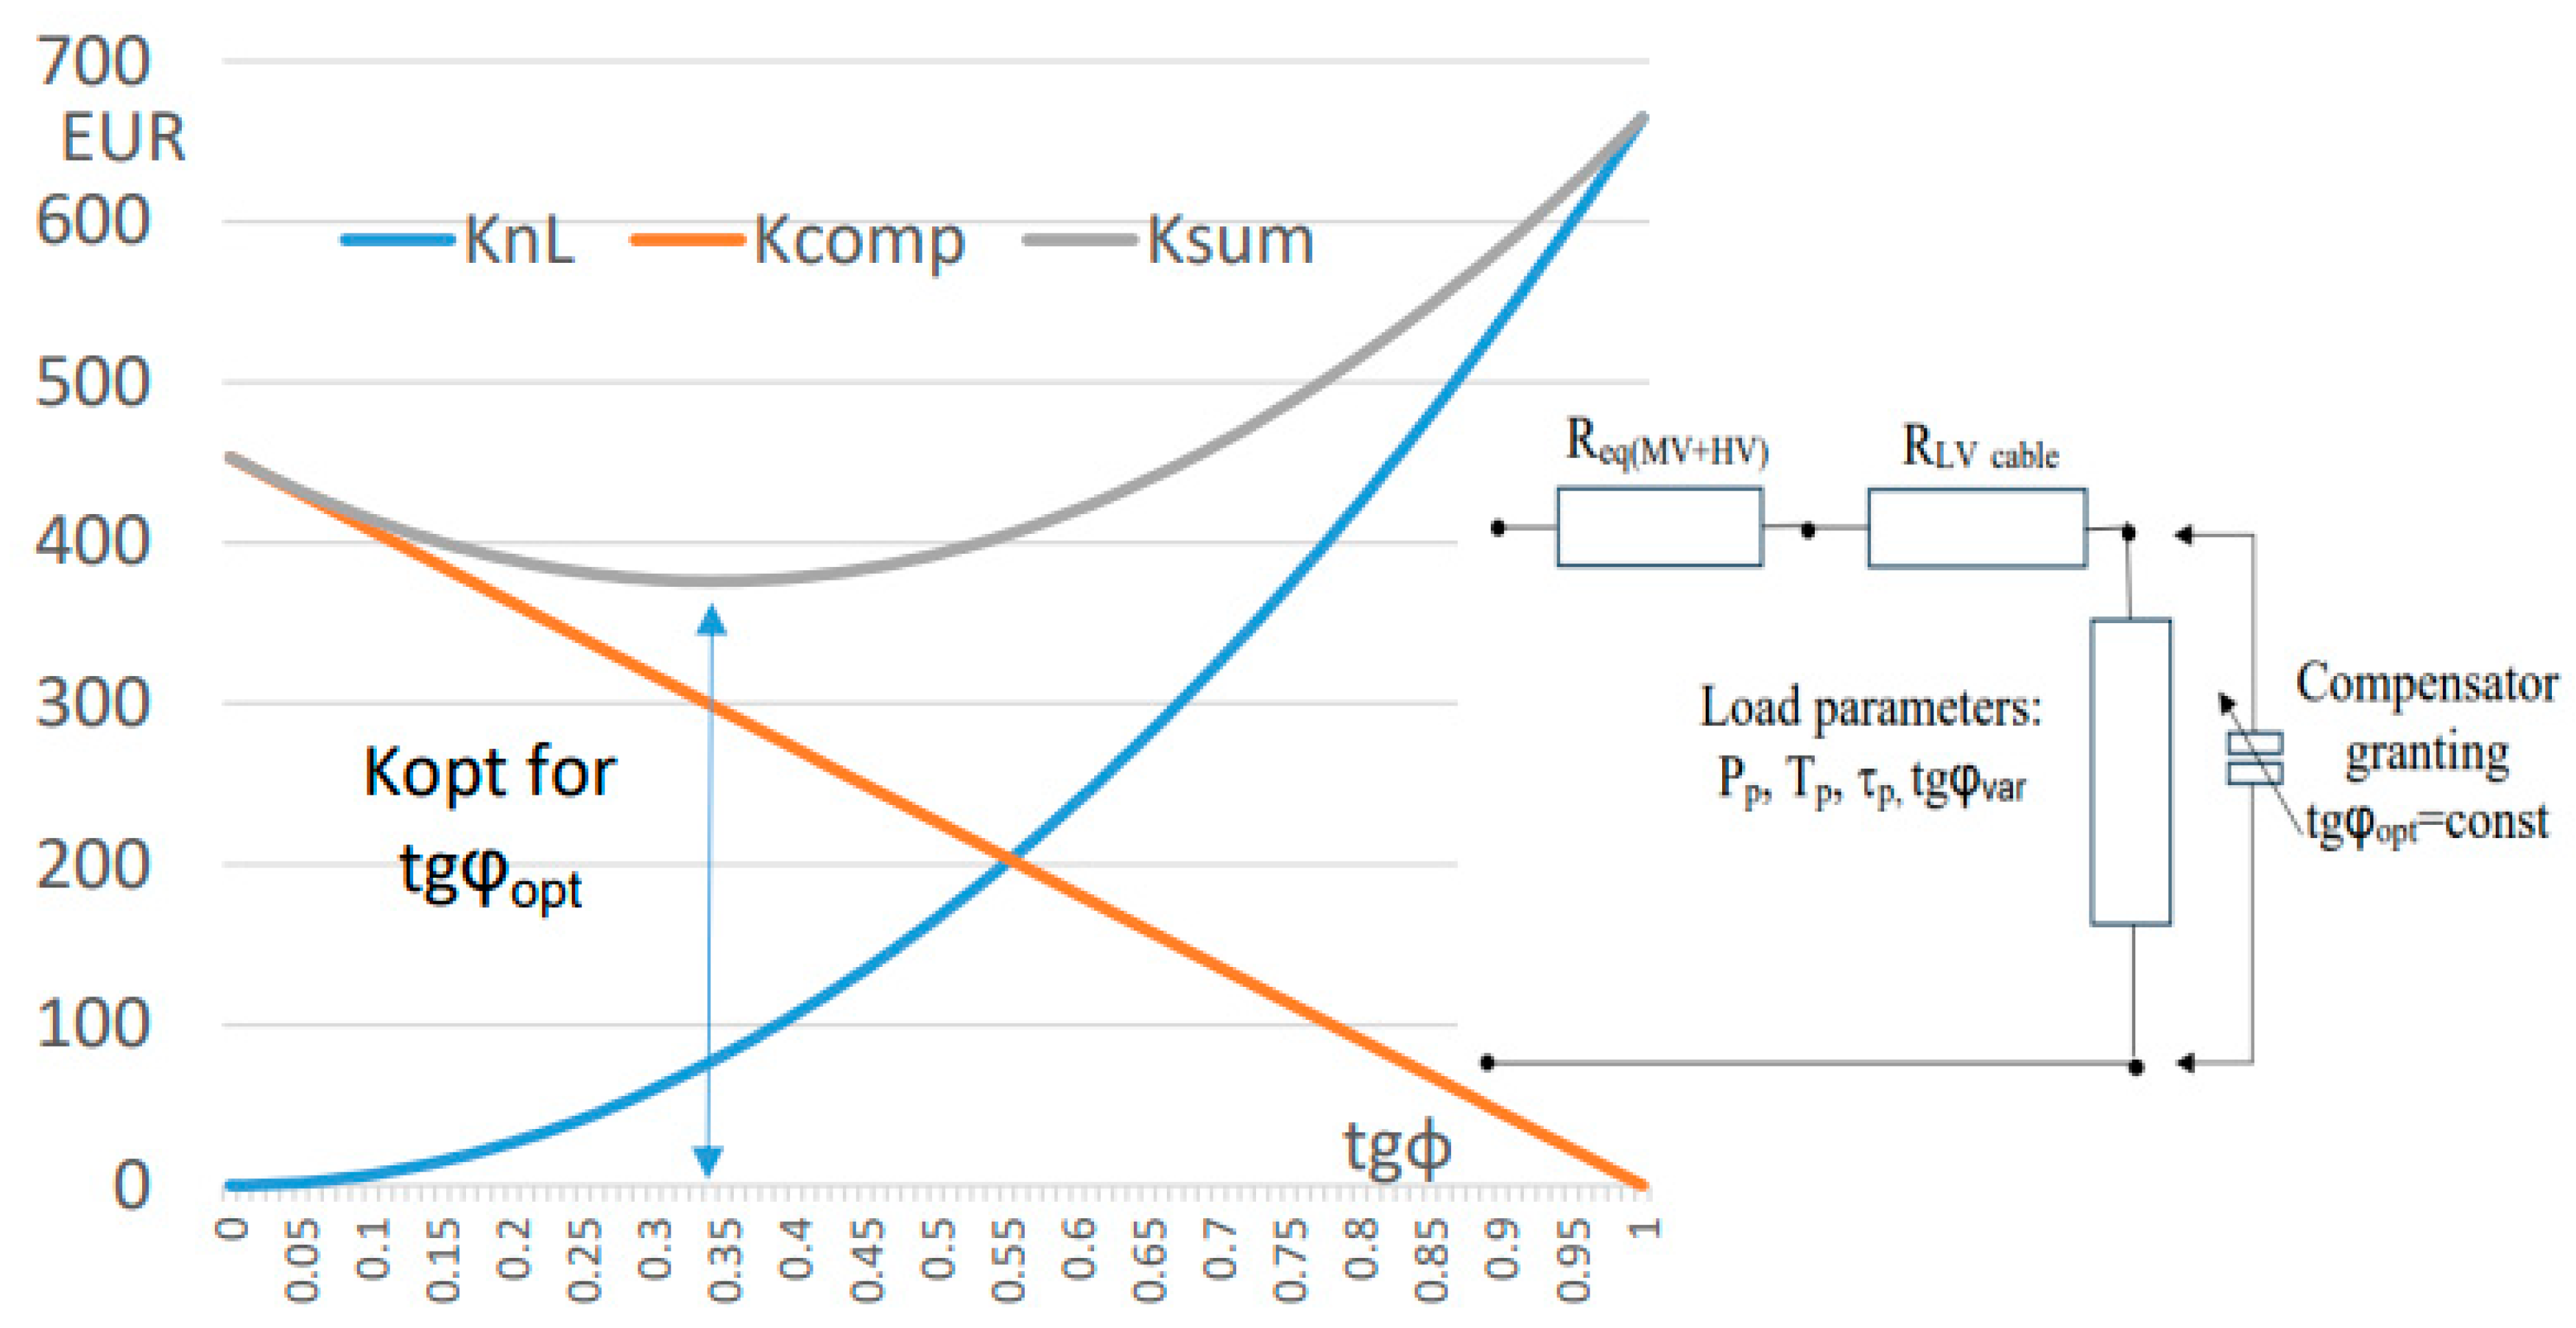
Figure 1. Annual total costs Ksum including annual losses in the network KnL and annual costs of reactive energy generation Kcomp by the consumer with changes in the compensation coefficient tgφ.
Energies 17 04116 g001
Figure 2. Profile of the active energy consumption (A+) and generation (A−) of consumers of the S1 substation.
Energies 17 04116 g002
Figure 3. Capacitive reactive energy generated by consumers of the S1 substation.
Energies 17 04116 g003
Figure 4. Inductive reactive energy consumed by the consumers of the S1 substation.
Energies 17 04116 g004
Figure 5. Profile of the active energy consumption (A+) and generation (A−) of the consumers of the S2 substation.
Energies 17 04116 g005
Figure 6. Capacitive reactive energy generated by consumers of the S2 substation.
Energies 17 04116 g006
Figure 7. Inductive reactive energy consumed by consumers of the S2 substation.
Energies 17 04116 g007
Figure 8. Algorithm for the search of the tgφopt value.
Energies 17 04116 g008
Figure 9. Periodic values of tgφi(h) for load reactive energy consumption in descending order and the corresponding values of tgφopt i(h) calculated for sets of periods with tgφktgφi together with the compensation profit for tgφi(h) > tgφopt i(h) for the S1 substation. Optimal compensator setting tgφopt = 0.419.
Energies 17 04116 g009
Figure 10. Periodic values of tgφi(h) for reactive energy consumption in descending order and the corresponding values of tgφopt i(h) calculated for period sets with tgφk(h) ≥ tgφi(h) together with the compensation profit for tgφi(h) > tgφopt i(h) for the S2 substation. Optimal compensator setting tgφopt = 0.158.
Energies 17 04116 g010
Figure 11. Periodic values of tgφi(h) in descending order for reactive energy generation and the corresponding tgφopt i(h) values of tgφopt i(h) for the sets of periods with tgφk(h) ≥ tgφi(h).
Energies 17 04116 g011
Figure 12. The aggregated cost of losses due to reactive energy flow in substations S1 and S2 without compensation.
Energies 17 04116 g012
Figure 13. Three-phase voltage levels in the busbars of the S1 substation throughout the year.
Energies 17 04116 g013
Figure 14. Three-phase voltage levels in the busbars of the S2 substation throughout the year.
Energies 17 04116 g014
Table 1. Data from low-voltage substations and the LV network analyzed, as well as the results of active energy flows recorded in this network for a year.
MV/LV SubstationS1S2
Sn tr MV/LV [kVA]400160
LV networkurbanrural
ConductorscableOHL
Dominant cross section [mm2]120/15070
LV network length [km]5.12.9
Eaa(+)st [kWh]767,191.4394,352.8
Eaa(+) cust [kWh]761,398.3412,540.9
Eaa(−)st [kWh]0.02542.8
Eaa(−)cust [kWh]15,946.937,199.2
ΔEaaLV [kWh]21,740.016,468.3
ρLV [%]2.863.99
Earind cust [kvarh]200,706.8141,963.8
Earcap cust [kvarh]130,845.642,173.3
Table 2. Electric energy market price, levelized costs of reactive energy generation in consumers, substations’ peak loss time τp, peak load utilization time Tp based on energy flows recorded in the AMI system, and the network equivalent resistance value ReLV for the networks supplied from S1 and S2 substations.
MV/LV SubstationS1S2
Cmp [EUR/MWh]61.3661.36
Sp cust LV [kVAh/h]202.0145.9
Pp cust LV [kWh/h]199.0136.96
Tp cust LV [h]38263032
τeq custLV [h]20231391
τp [h]19171417
ReLV [Ω]0.04310.0970
Req(HV+MV) [Ω]0.00280.0047
SVG LCOEr [EUR/kvarh]0.0030.003
CCB LCOEr [EUR/kvarh]0.0010.001
Disclaimer/Publisher’s Note: The statements, opinions and data contained in all publications are solely those of the individual author(s) and contributor(s) and not of MDPI and/or the editor(s). MDPI and/or the editor(s) disclaim responsibility for any injury to people or property resulting from any ideas, methods, instructions or products referred to in the content.