Article

Vehicle Acceleration and Speed as Factors Determining Energy Consumption in Electric Vehicles

by
Edward Kozłowski
1,*,
Piotr Wiśniowski
2,
Maciej Gis
2,
Magdalena Zimakowska-Laskowska
2 and
Anna Borucka
3
1
Faculty of Management, Lublin University of Technology, 20-618 Lublin, Poland
2
Environment Protection Centre, Motor Transport Institute, 03-301 Warsaw, Poland
3
Faculty of Security, Logistics and Management, Military University of Technology, 00-908 Warsaw, Poland
*
Author to whom correspondence should be addressed.
Energies 2024, 17(16), 4051; https://doi.org/10.3390/en17164051
Submission received: 10 July 2024 / Revised: 1 August 2024 / Accepted: 8 August 2024 / Published: 15 August 2024

Abstract

:
Energy consumption in electric vehicles is a key element of their operation, determining energy efficiency and one of its main indicators, i.e., range. Therefore, in this article, mathematical models were developed to evaluate the impact of selected factors on energy consumption in electric vehicles. The phenomenon of energy recuperation was also examined. The study used data from mileage measurements of the electric vehicle (EV) driving on a motorway and in built-up areas. The results obtained showed a strong correlation between acceleration, vehicle speed, battery power, and energy consumption. In urban conditions, engine RPM and vehicle speed had an additional impact on energy consumption. Findings from this study can be used to optimize vehicle acceleration control modules to increase their range, develop eco-driving styles for EV drivers, and better understand the energy efficiency factors of EVs.

1. Introduction

The vision of dwindling non-renewable energy resources and growing ecological awareness have resulted in intensified efforts to switch to greener technologies [1,2]. In the face of global challenges related to climate change and the growing demand for more sustainable energy sources, electric vehicles (EVs) are gaining importance as an alternative to traditional combustion vehicles. Electric vehicles not only contribute to reducing greenhouse gas emissions but also offer benefits related to lower operating costs and reduced air pollution in the cities [3]. Over the last decade, the global stock of electric vehicles has grown significantly. In 2020, over 10 million electric vehicles were registered worldwide [4,5,6]. One of the key problems faced by potential buyers of such vehicles is concern about the range and insufficient charging infrastructure [7,8]. Therefore, effective energy management in electric vehicles is crucial to maximize the vehicle’s range and at the same time minimize operating costs. As battery technology and charging infrastructure develop, more and more consumers and companies are choosing to switch to electric vehicles. However, to fully exploit the potential of EVs, it is crucial to comprehend the factors that impact their energy efficiency. Therefore, the issue of optimizing energy consumption is becoming more and more important from both an economic and ecological perspective. In addition to equipping electric vehicle models with larger batteries, one way to alleviate these constraints is to adapt driving style and optimize routes suited to EVs. In other words, the range of EVs can be increased by minimizing energy consumption through eco-driving and route selection. Understanding how the operational characteristics of different road types affect energy consumption can be a practical and beneficial factor in optimizing routes for energy-based electric vehicles. Knowing how much energy EVs consume under varying traffic conditions is a prerequisite for range optimization. The arrangements for an economical driving style can be directly implemented by drivers and then used in vehicle navigation to determine the most economical and ecological route [1].
Over the past few years, significant efforts have been made to minimize the energy consumption of electric vehicles. Existing research in this area can be broadly divided into three categories. The first is research focused on key elements of electric vehicles such as the battery, motor, converter, etc. This research often focuses on the design and testing of the battery management system and the improvement and development of the electric motor or inverter [8]. The second category includes research on energy management strategies in electric vehicles [9]. The third is the possibility of improving driving style in terms of acceleration of electric vehicles. Driving dynamics, including vehicle acceleration and speed, are one of the key aspects influencing energy consumption in vehicles [9]. While speed is directly related to aerodynamic drag and rolling resistance, acceleration affects the instantaneous energy demand, which is important in the context of urban cycles, where very frequent changes in speed take place. The analysis and evaluation of the impact of these parameters is therefore crucial for optimizing energy management strategies in EVs and for designing more efficient drive systems, which is why such a need was the genesis of this study.
The article is structured as follows. After the introduction, a broad review of the literature was made, showing the existing research gap and emphasizing the novelty of the research. Then, the research assumptions were described, including the characteristics of the measurement process and the measurement equipment used. Then, mathematical models were proposed describing the dependence of the instantaneous energy consumption/recovery on selected factors, including vehicle speed and acceleration, engine revolutions, and battery power. Then, the obtained research results were discussed, the analyses were summarized, and final conclusions were drawn.

Description of the Research Problem

The literature review shows that many factors can influence the energy consumption of electric vehicles. They can be categorized into three primary types: driver behavior, vehicle characteristics, and driving conditions [10,11,12]. So far, most of the literature in this area has focused on vehicles with conventional internal combustion engines (ICEV) [13,14]. Researchers have shown that road conditions, traffic intensity, driver demographics (e.g., age and gender), and car weight influence driver behavior [1]. For instance, Faria et al. [15] evaluated the potential for fuel savings in internal combustion engine vehicles by considering driving style, road type, and road gradient factors. They found that the most significant fuel savings occurred on secondary and collector roads with a speed limit of 50 km/h (31 mph). However, the study did not address the energy consumption of electric vehicles. Researchers examined the variation in urban driving patterns and determined that the street type had the most significant effect on the driving style of internal combustion engine vehicles [1]. Moreover, this study showed that the average speed value differs significantly with the type of roads on which the vehicle travels. Jensen [16,17] conducted a comparable study, analyzing various driving patterns and the emissions of internal combustion engine vehicles on different road types. The study concluded that speed is the primary factor affecting emissions, while variations in road speed do not account for fuel consumption differences. The research also found that fuel consumption was slightly higher on expressways than on motorways.
Literature data show that the findings regarding energy consumption of ICEVs do not apply to EVs. Therefore, the energy consumption of an EV in relation to the speed is fundamentally different from that of an ICEV. According to the Galvin model, the minimum energy consumption in EVs is at 60 km/h, after which it increases exponentially [18]. These findings were later confirmed by Fiori et al. [19] and Liu et al. [20] and show that EVs achieve the highest efficiency at lower speeds, which is completely different from ICEVs. Speed and its changes vary significantly depending on the type of roads. Therefore, road type is expected to be an important factor in the energy consumption evaluation analysis of EVs [18,19,20]. In ICEVs, frequent braking and acceleration significantly increase fuel consumption compared to maintaining a constant speed, e.g., while driving on a motorway [15]. This effect may be different in electric vehicles due to the possibility of charging the batteries during deceleration [21]. Moreover, EV performance is more sensitive to ambient temperature than ICEV. At low temperatures, energy consumption in EVs increases due to higher battery storage losses [22,23,24] and internal resistance [25]. Therefore, it is important to thoroughly understand the various factors that can influence the energy consumption of electric vehicles. Selected scientific publications initiated this process using different research methods. For example, Faria et al. examined the impact of the air conditioning system (i.e., off, on, cooling, heating on), driving style (i.e., aggressive, moderate), and the degree of urbanization of the area (i.e., urban, rural) on energy consumption [23,26,27]. In the study, they demonstrated the negative impact of aggressive driving behavior and quantified the relationship between energy consumption and driving conditions. Franke et al. [28] confirmed these findings by examining the impact of adopting an eco-driving style on the efficiency of EVs. The authors found that economic driving significantly reduced the energy consumption of EVs [28]. Kurien et al. modelled the energy consumption of EVs using acceleration and inclination as input parameters in MATLAB Simulink [29]. The results show that the EV performance decreases with speed and increasing slope. In other words, steep slope angles and travelling at high speeds have been found to significantly limit the achievable range of electric vehicles.
While research on combustion engine vehicles shows that energy consumption increases with speed and acceleration [1,9], there is limited investigation into how driver-related factors affect energy use in electric vehicles. Yao et al. [21] gathered data from Beijing’s road network to estimate energy consumption and emission rates for electric vehicles, finding that energy use was notably higher on major thoroughfares than on other road types. Wu et al. [30] posited that city driving consumes more energy than highway driving, but their study did not account for driving style and categorized trips broadly. Additionally, Bingham et al. [31] discovered that aggressive driving could boost average energy consumption by 30% or more and that managing traffic to reduce rapid acceleration and deceleration could further save energy and extend the range. However, Bingham et al. did not explore the link between road type and energy consumption in their study [31]. Fetene et al. [32] researched road types, but their findings showed no significant difference in consumption rates between on- and off-motorway driving, though this was based on a single measurement. This highlights a gap in the literature regarding the impact of road type on electric vehicle efficiency. Although previous studies suggest that driving style and road type significantly affect energy consumption, precise conclusions still need to be made. Accurate knowledge of energy efficiency for various road sections is essential for modelling and planning energy-optimal routes. Electric vehicle drivers often choose routes they believe will lower energy consumption [32], but this behavior needs more scientific validation. Most existing studies rely on simulations, and real traffic condition studies are scarce. Currently, only manufacturer-provided energy consumption and range figures from laboratory tests are available, which are presumed to differ from real-world consumption [33,34]. Eco-driving typically promotes reducing the use of both the accelerator and brake pedals [22,35,36], a recommendation supported by research. For instance, Pelkmans et al. identified acceleration as the primary factor affecting fuel consumption [37], while Yan noted that variations in energy consumption were mainly due to different accelerator pedal usage [38]. How the accelerator is used impacts acceleration; thus, reaching the optimal speed significantly influences energy consumption. Laboratory tests comparing energy consumption across electric vehicles, hybrids, and internal combustion engines (ICEs) in city and motorway driving conditions reveal that electric vehicles generally perform better than ICEs and hybrids at lower speeds and in intermittent urban settings but less so on highways [1,12]. Knowles et al. [10] observed similar results with real-world trips, finding that electric vehicles performed better on interrupted city routes than motorways, mainly due to their regenerative braking system (RBS). This system converts some of the vehicle’s kinetic energy back into electrical energy during deceleration, then stores it in the battery [11,18,25,39,40]. However, it’s important to note that more aggressive driving styles, characterized by rapid acceleration and braking, can increase energy consumption, which challenges this notion [18]. The driving efficiency also depends on the balance between energy recovery during deceleration and energy consumption during acceleration. Since energy recovery is typically less than energy consumption, there is a point where erratic, slower driving becomes less efficient compared to faster, steadier driving. Few studies address how vehicle speed [23] and acceleration [4,23] significantly impact energy consumption. Therefore, there is currently a gap in the literature regarding the identification and evaluation of EV energy consumption in real driving conditions. Investigating this relationship was the aim of this article. It was assumed that the impact of acceleration and speed on energy consumption in electric vehicles is significant and its modelling is possible. The research used data from the electric vehicle, which was moving both on a motorway and in built-up areas. The analysis was aimed at assessing the consumption and recuperation of electricity depending on the type of driving cycle. Based on data on the distance travelled and vehicle speed in various cycles, a detailed analysis of the dependence of instantaneous energy consumption and recovery (Instantaneous Energy Consumption, IEC) on factors such as vehicle acceleration and speed, but also motor speed, battery power, and battery current was carried out [25]. Appropriate mathematical models were proposed for this purpose, and the research results and limitations of the method used were presented.
2. Materials and Methods

2.1. Subject of the Research

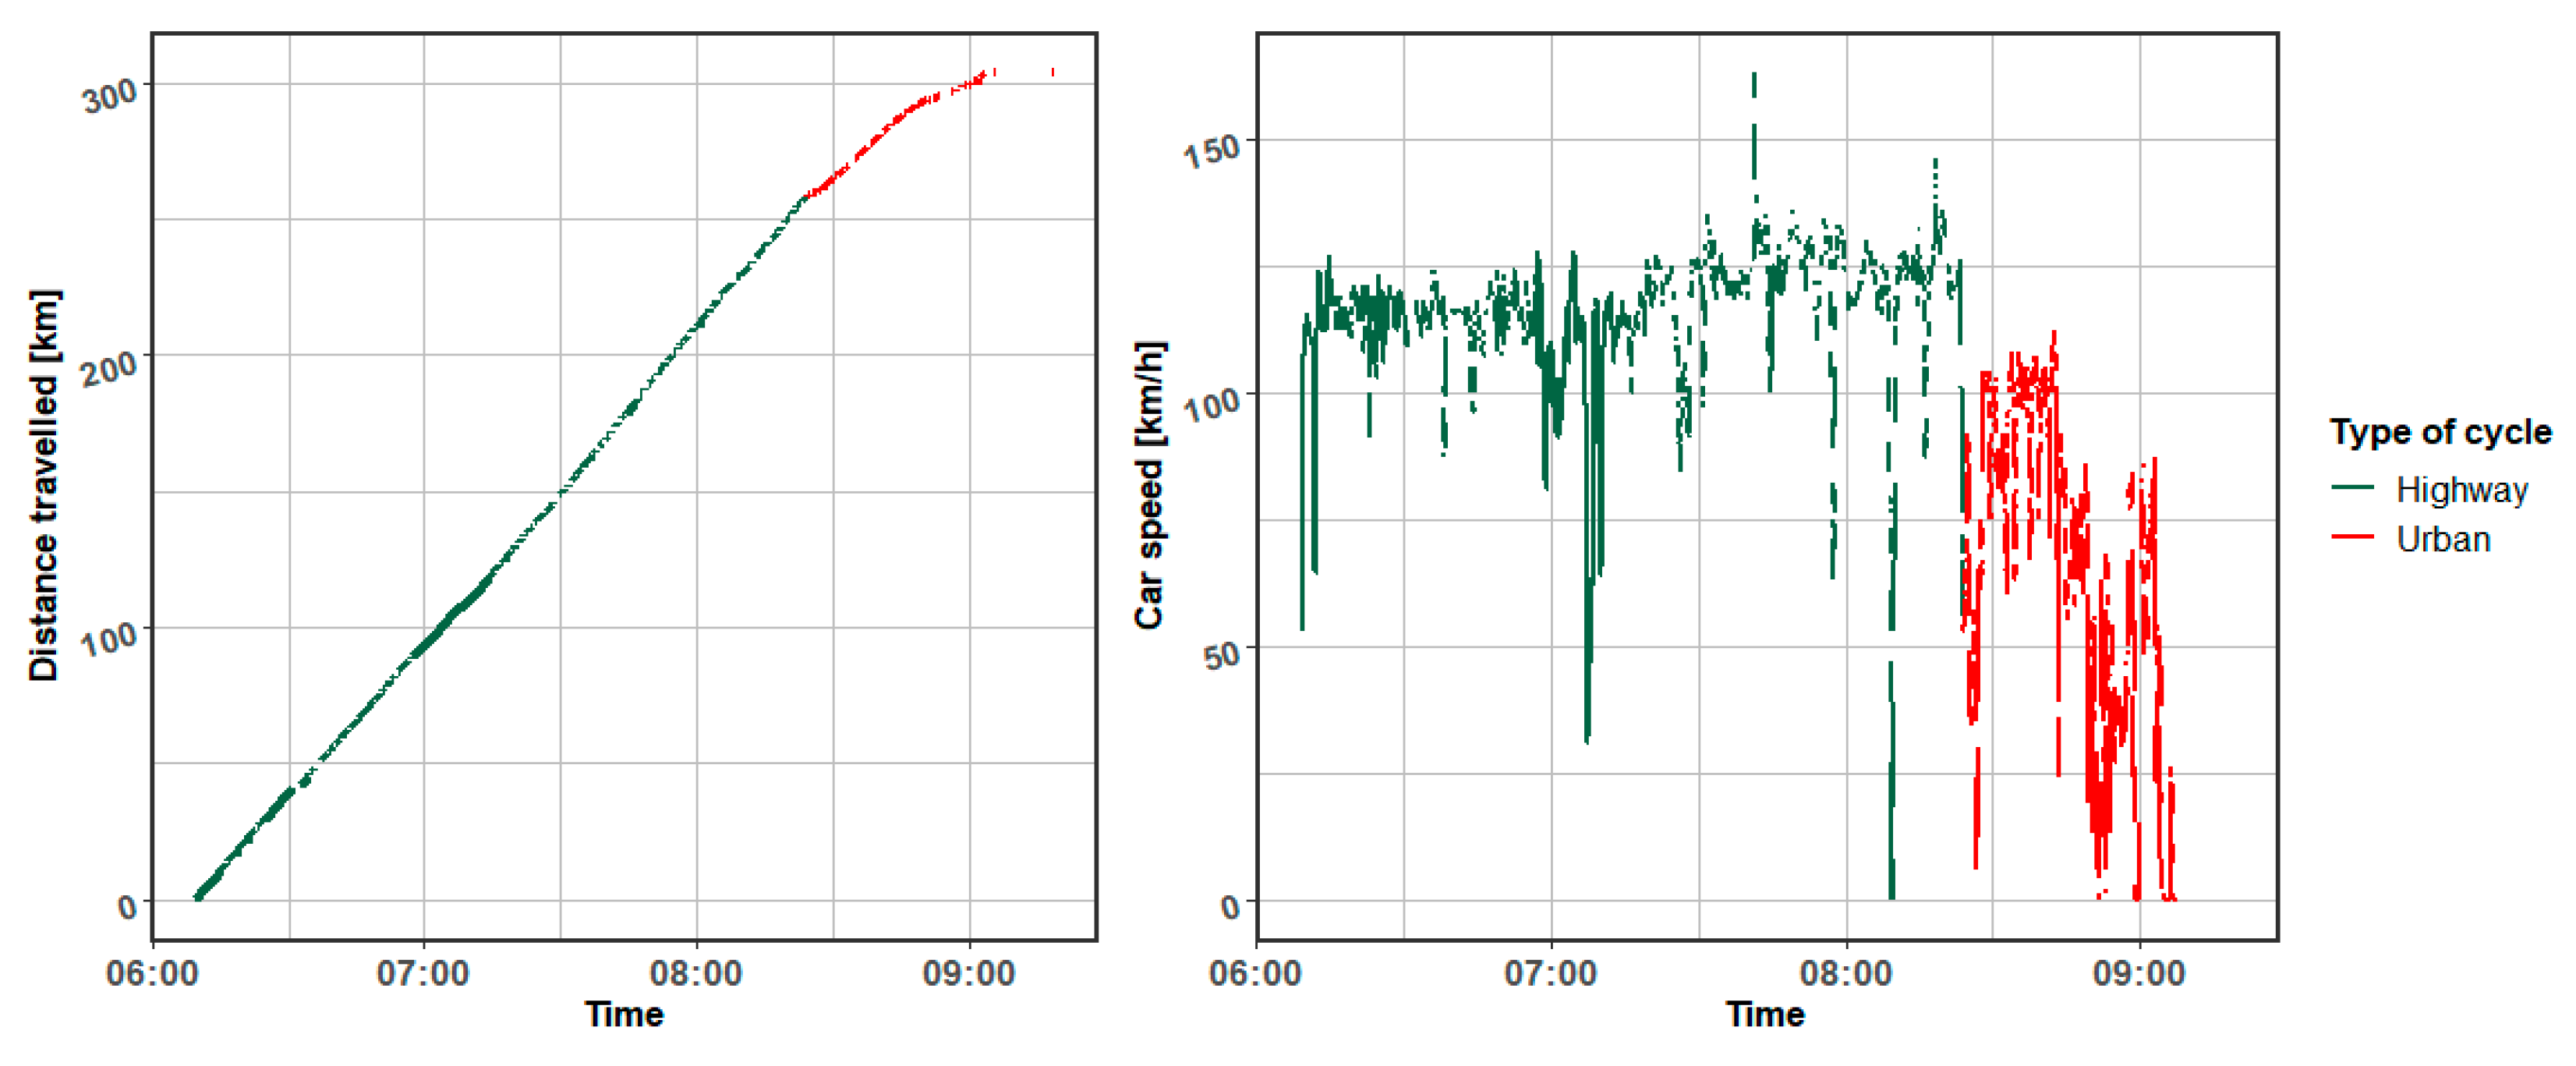
The study was conducted using the electric vehicle, which was driving on a motorway and in built-up areas. The aim of the analysis was to assess the consumption and recuperation of electricity in an electric car depending on the type of cycle in which the vehicle operates. Figure 1 shows both the distance covered and the vehicle speeds achieved in individual cycles.
The research was carried out on a measurement route in urban and extra-urban traffic. The measurement route was from Warsaw to Poznań, Poland. A significant part of the route led through the motorway that cuts through the city of Łódź. The specificity of this direction and the construction works carried out on the road forced a partial urban driving character. Individual sections of the measurement route were appropriately classified depending on their type by determining the vehicle’s speed and acceleration characteristics.

2.2. Measuring Equipment

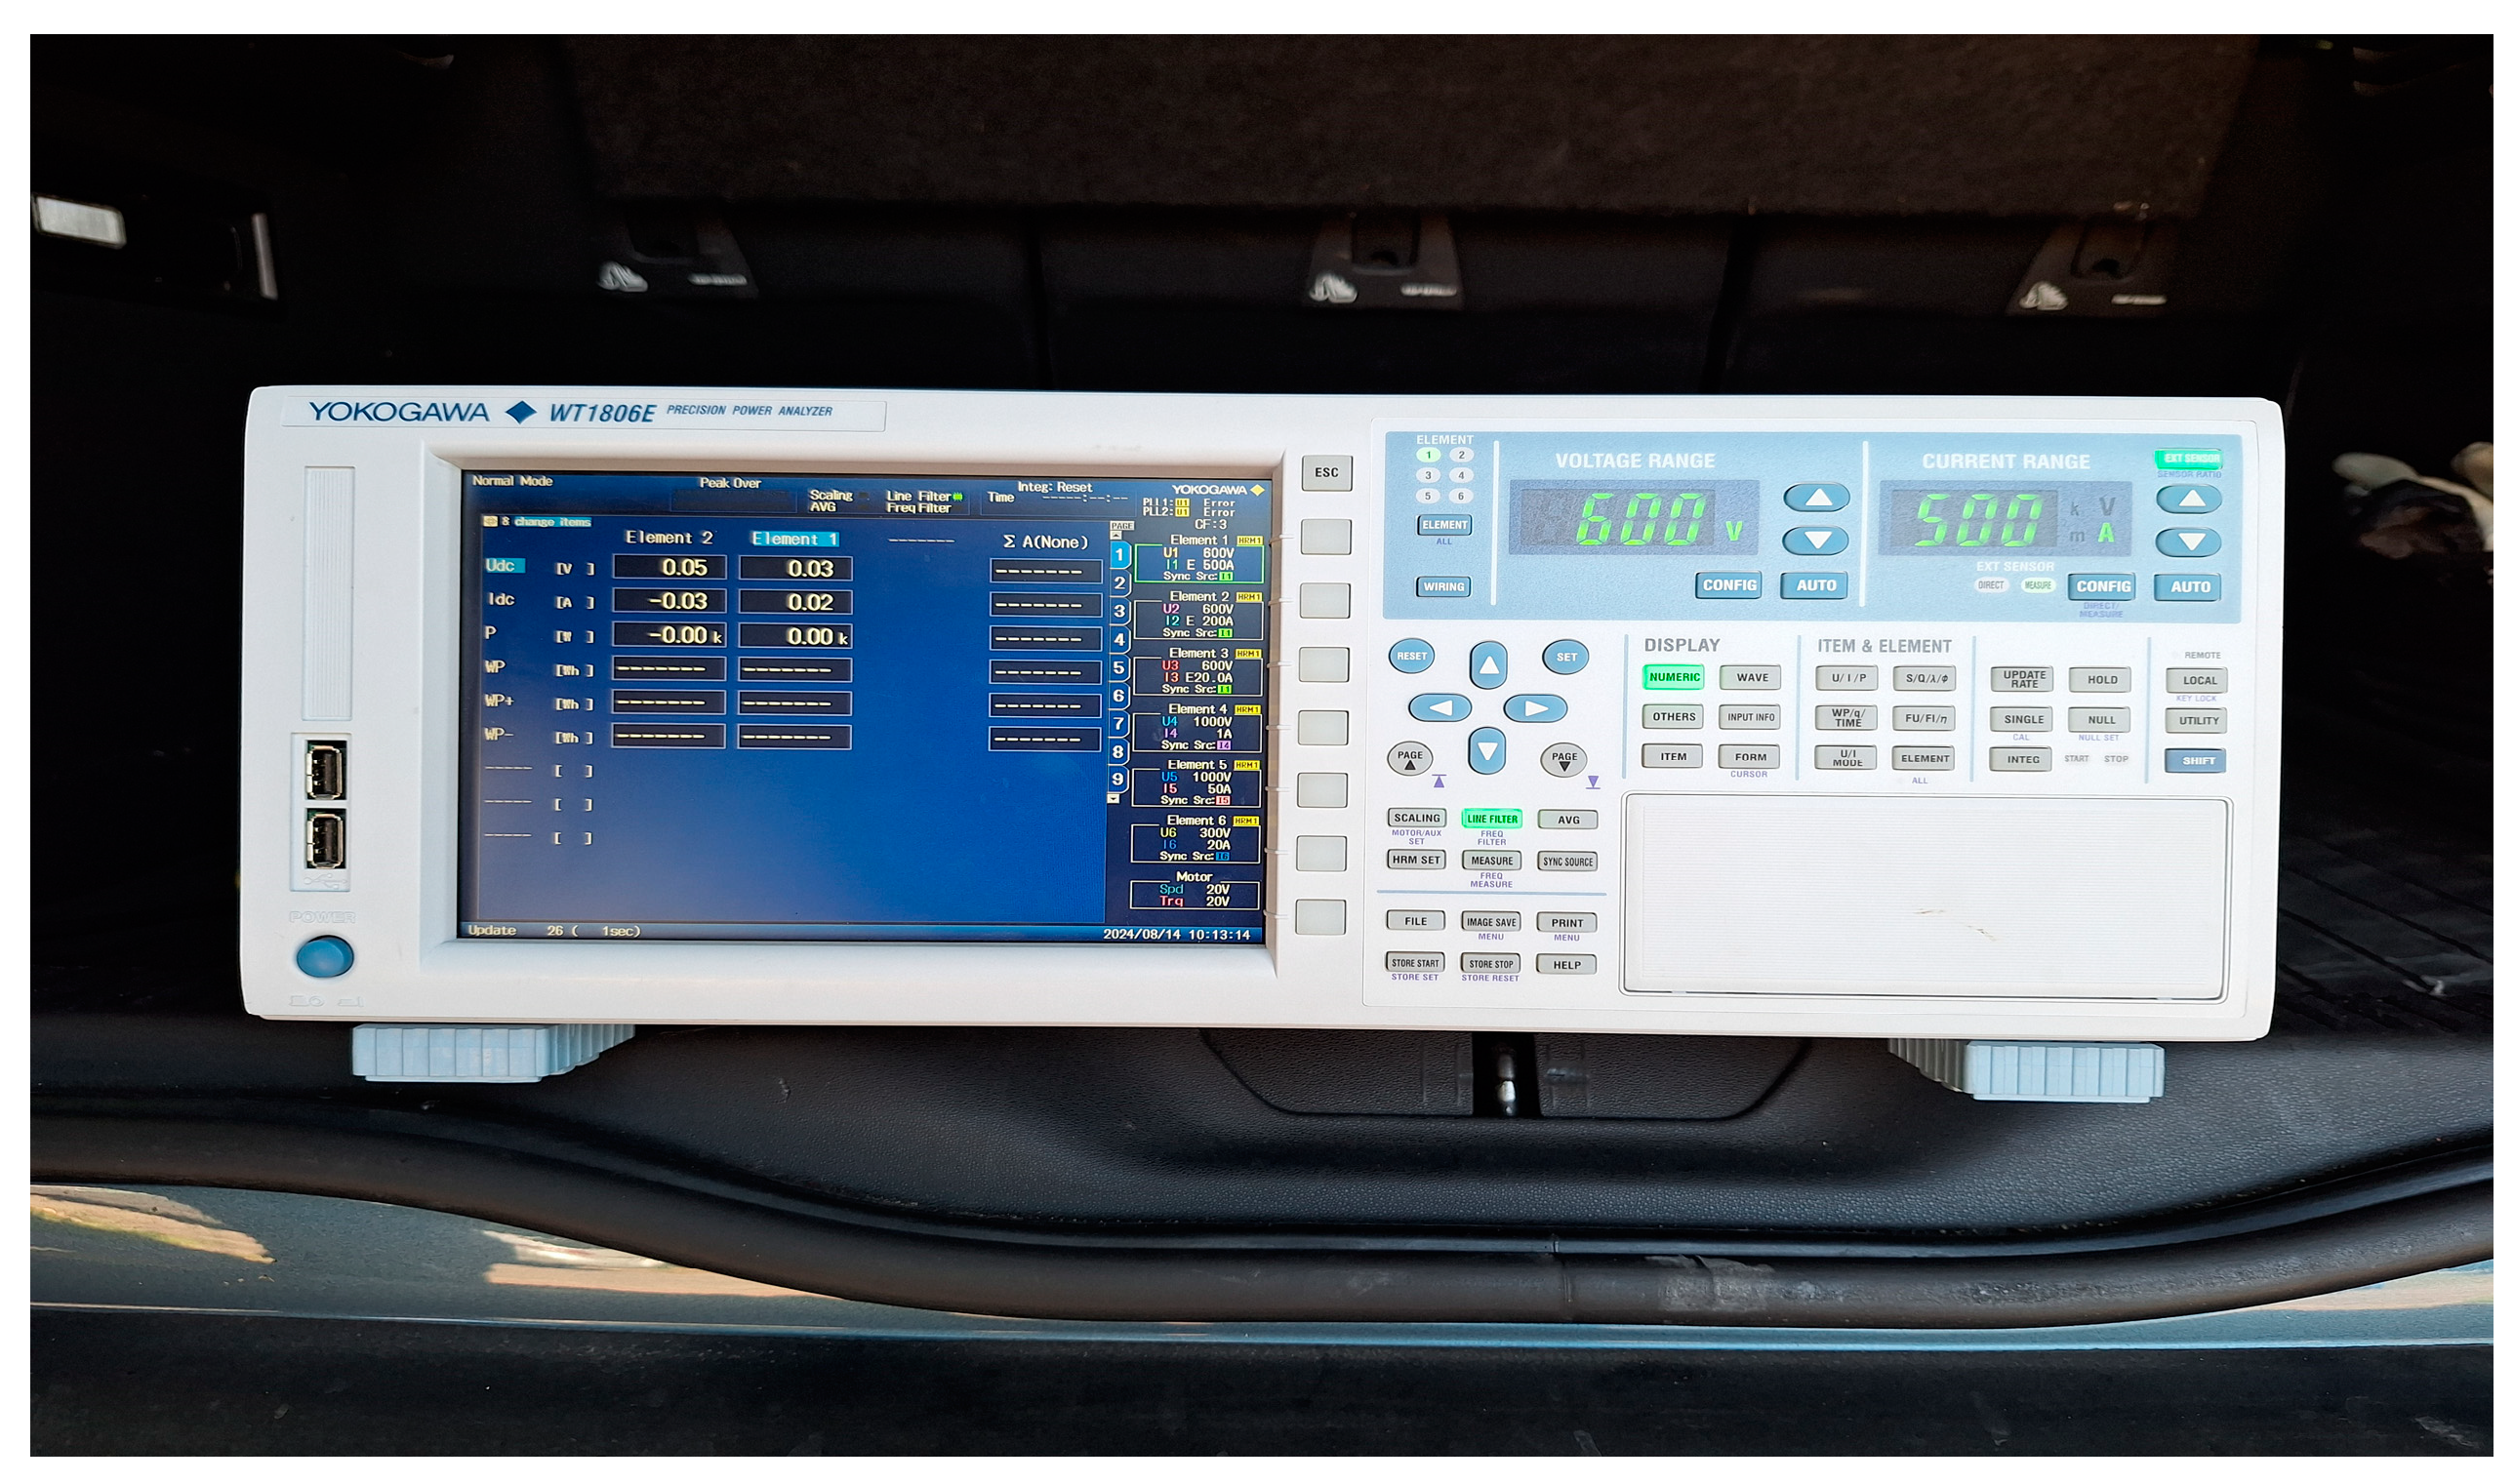
Specialized testing equipment was utilized to assess the electric vehicle. The YOKOGAWA WT1806E device (The manufacturer of the Yokogawa advanced power analyzer is the Yokogawa company. It was purchased from a Yokogawa representative in Poland. The address of this company is as follows: 15 Janowskiego str, 02-784 Warsaw, Poland) (Figure 2) is a sophisticated six-channel power analyzer designed to measure various parameters, including power and energy consumption, whether drawn from or returned to the batteries and subassemblies of electric and hybrid vehicles. One of its notable features is the voltage measurement range, which spans from 0 to 1000 V, allowing it to accommodate a wide range of applications. Additionally, the device supports current measurements with six channels: three channels can measure currents from 0 to 5 A, and the other three channels can measure currents from 0 to 50 A, providing flexibility for different testing scenarios. The YOKOGAWA WT1806E boasts a basic accuracy of no less than 0.05% of the reading plus 0.05% of the measurement range, ensuring precise and reliable measurements. It also features a measurement update frequency for voltage, current, and power of at least 1 ms, which allows for rapid and continuous monitoring of these parameters. Furthermore, the device has a high sampling rate of 2 mega samples per second (Msa/s) with a 16-bit converter, which enhances its ability to capture detailed and accurate data during testing. This combination of features makes the YOKOGAWA WT1806E an essential tool for the thorough evaluation of electric and hybrid vehicle components.
The vehicle’s speed and operational parameters were recorded using the Carchip Pro OBD recorder, manufactured by Davis Instruments Corp (Figure 3). The device is a recorder of vehicle and engine operating parameters. It allows them to be recorded as a function of time and distance travelled.
In addition to its other features, the device operates within a temperature range of −40 to 85 degrees Celsius. When connected to a vehicle, it requires a power supply of 9 to 16 volts and consumes 80 milliamps with the engine running and 17 milliamps with the engine off. It is also self-powered by a built-in battery, which can last up to five years without charging and between ten and fifteen years under normal use. The device has 512 kilobytes of built-in memory and can record vehicle data for a maximum of 300 h, depending on the frequency of data recording. The date and time accuracies are within ±2 s per day. For vehicle communication, it uses a 16-pin OBDII socket.

3. Results

3.1. Analysis of Energy Consumption and Recovery

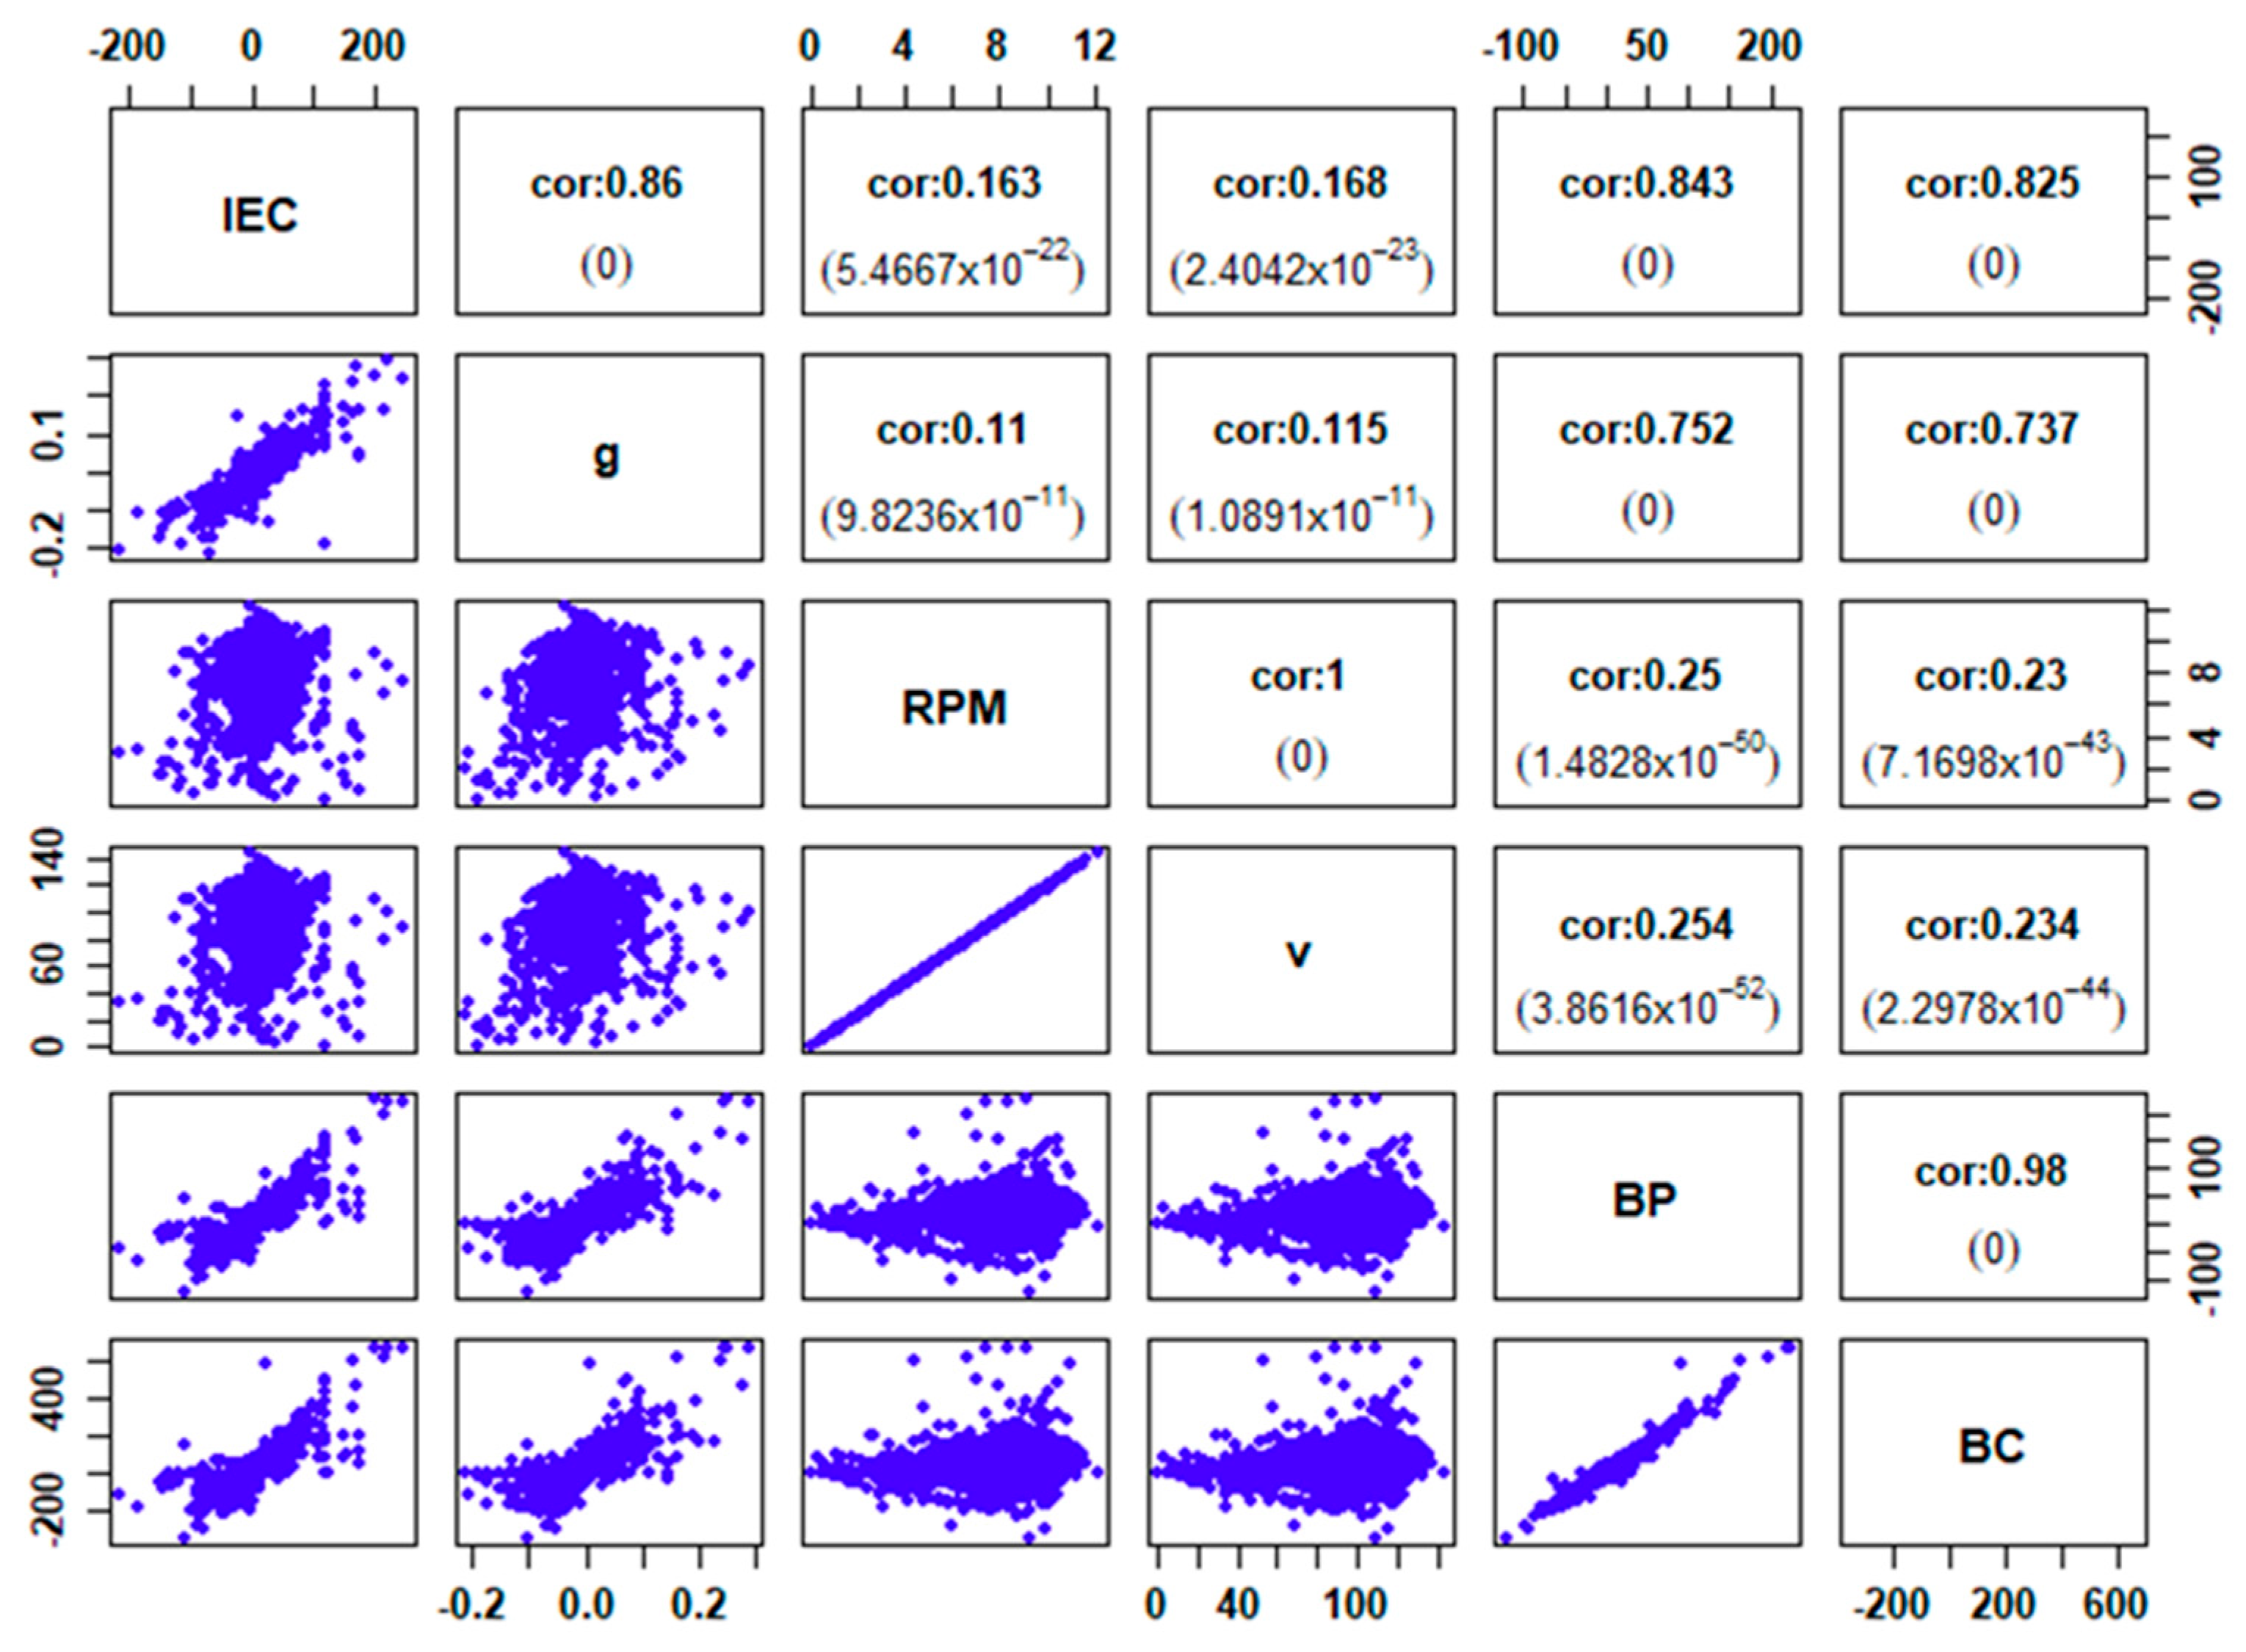
The dependence of instantaneous energy (recovery) consumption (IEC) on vehicle acceleration (g), engine speed (revolutions per minute RPM), vehicle speed (v, km/h), battery power (BP—battery power, kW), and battery current (BC—battery current, A) was analyzed. Figure 4 shows the correlation between the analyzed features. First, the correlation [41,42,43] between the features was examined, i.e., the correlation coefficient was determined and significance was tested. Let { x i , y i } 1 i n be a sequence of realization of X and Y features. The correlation coefficient we calculate by the formula
r = i = 1 n x i x y i y i = 1 n x i x 2 i = 1 n y i y 2 ,
where x , y denote means of features. Using a test, we examine the significance of the relationship between variables X and Y. At a significance level α ∈ (0, 1), we define the null hypothesis:
H 0 : r = 0 (no significant correlation between the variables), while the alternative hypothesis:
H 1 : r 0 (there is a significant correlation relationship between the variables).
The test statistic is equal
T = r 1 r 2 n 2    
has t-distribution with n − 2 degrees of freedom. Figure 4 shows the scatter plot (below the diagonal), the values of the correlation coefficient, and the value of the test statistic between the variables in parentheses (above the diagonal). We can see that for each pair of variables, the null hypothesis should be rejected in favor of the alternative hypothesis (p value < 0.05), so there are significant relationships between the variables. A particularly strong correlation is visible between BP and BC, between RPM and v.

3.2. Model of the Influence of Selected Factors on Instantaneous Energy Consumption

The linear dependence [42,43,44,45] of the instantaneous energy consumption on other factors is presented in the equation.
I E C = θ 0 + θ 1 g + θ 2 r p m + θ 3 v + θ 4 B P + θ 5 B C + ε ,
where ε is a random variable representing the influence of other factors that were not included in the model. We assume ε∼N (0, σ2). Based on n observations, the least squares method was used to estimate the structural parameters in model (3). Introducing explanatory variables that are highly correlated with each other into linear models can result in a catalytic effect. Therefore, we also verify the impact of each variable, verifying the impact of each factor on the instantaneous energy consumption. Variables that have a non-significant impact on the explanation of ICE from the model will be removed. Therefore, a null hypothesis was created at the significance level of α = 0.05 for each structural parameter [41,42,44,45]
H 0 : θ i = 0 (the influence of the i -th factor is insignificant on the instantaneous energy consumption), with respect to the alternative hypothesis.
H 1 : θ i 0 (the i-th factor significantly affects the instantaneous energy consumption).
For j = 0 ,   1 ,   ,   k statistics
t i = θ i S θ i ,
has a Student’s t-distribution with n k 1 degrees of freedom (in Equation (1) we have 5 predictors, k = 5), θ i —assessment of the structural parameter, and S θ i standard deviation of this parameter. A test probability is determined for each parameter
p i = 2 P T > t i ,
where T is a random variable with Student’s t-distribution with n k 1 degrees of freedom. If p i α then at the α significance level, the null hypothesis H 0 is rejected in favour of H 1 ; therefore, the structural parameter is significantly different from zero and the predictor has a significant impact on explaining the dependent variable. In the case under consideration, this is the instantaneous energy consumption. The results of the structural parameter significance analysis are presented in Table 1.
At the significance level of 0.05, there are no grounds to reject the null hypothesis H 0   for battery current (A); therefore, battery current (A) does not have a significant impact on the instantaneous energy consumption (since the BP and BC features are highly correlated, only one of these features should be selected for the model). Using stepwise regression and analyzing the Akaike index [44,46], the BC feature was removed from Equation (1). After removing the BC feature from Equation (1), values of structural parameters, standard deviations of these parameters, values of the t-statistics, and the test probability are presented in the Table 2.
Following the modification of the model, each of the structural parameters differs significantly from zero, so the value of vehicle acceleration, engine RPM, vehicle speed, and battery power significantly affect the instantaneous energy consumption. The value of the determination coefficient R 2 is 0.8289, which is a satisfactory result and proves that the model fits the empirical data well.
The significance of the multiple correlation coefficient was also examined. The null hypothesis assumes:
H 0 : R = 0 (multiple correlation coefficient is insignificantly different from zero), with respect to the alternative hypothesis:
H 1 : R 0 (the multiple correlation coefficient is significantly different from zero).
Test statistic:
F = R 2 1 R 2 n k 1 k ,
has a Fischer distribution with (k, nk − 1) degrees of freedom. In the analyzed case, the value of the F statistic is 4196.556 for (4, 3466) degrees of freedom. The test probability is equal to 0. Therefore, at the significance level of 0.05, we reject the null hypothesis in favour of the alternative hypothesis; the multiple correlation coefficient is significantly different from zero.
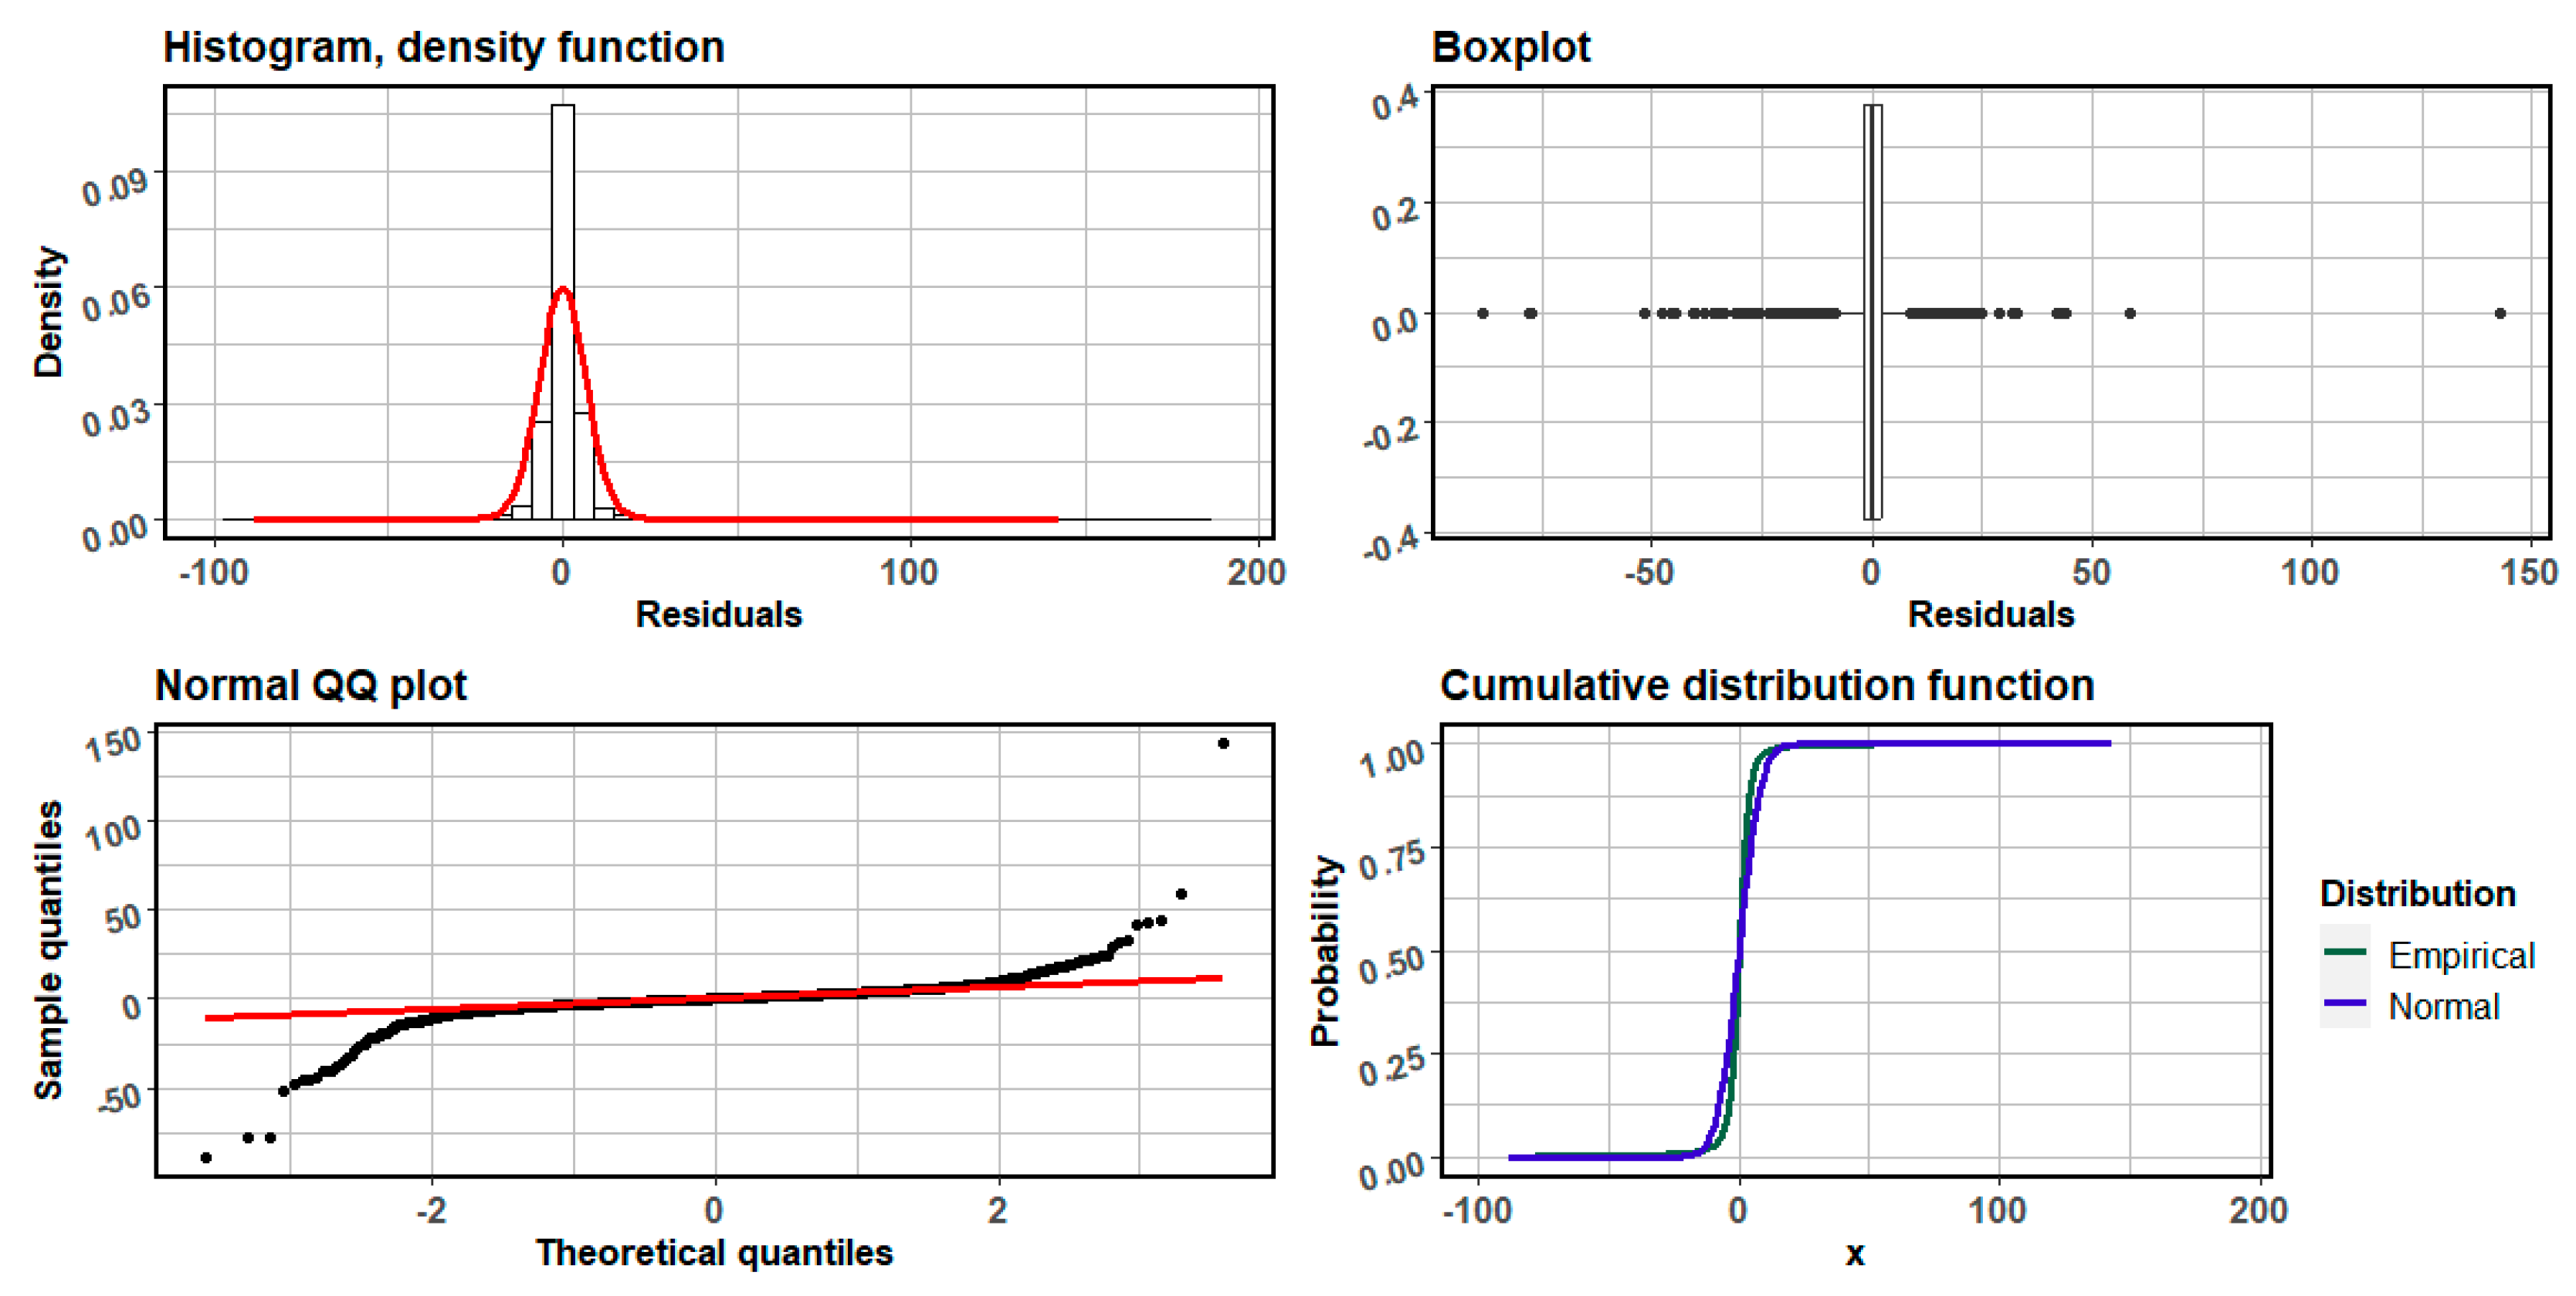
The residuals were also analyzed, and their distribution was compared with the normal distribution [46,46]. Figure 5 shows a matrix of diagnostic plots for residuals of the model describing the linear dependence of IEC on g, v, rpm, and BP. From the density function plot we see a symmetric distribution of residuals (red curve) with respect to zero, while from the boxplot we find a lot of outlier realizations. Analysis of a quantile–quantile (QQ) plot (empirical and theoretical quantiles against a straight line (red) connecting quantiles of order 0.25 and 0.75) suggests the presence of heavy tails (too many extreme positive and negative residuals) in the time series of residuals. From the figure showing the distributions, we can also see the differences between the empirical (black curve) and theoretical cumulative distribution functions (CDF) (blue curve). The above graphs suggest that the postulate of normality of the distribution of residuals is not met.
Table 3 shows the statistical tests results regarding the residuals distribution.
In addition, tests for the normality [42,46,47] of the distribution of the residuals were carried out. At the significance level of α = 0.05, we define the null hypothesis:
H 0 : ε N 0 , σ 2 (the residuals are drawn from a population with a normal distribution), with respect to the alternative hypothesis.
H 1 : ε N 0 , σ 2 (the distribution of the residuals differs significantly from a normal distribution).
The Shapiro–Wilk test statistic is based on the analysis of differences between elements symmetric with respect to the median in an ordered time series. The Cramér–von Mises test statistic is based on determining the expected value of the squares of the differences between the theoretical and empirical distributions, while the Anderson–Darling test statistic is similar to the Cramér–von Mises statistic and additionally takes into account the weighting function. The test statistic for the Jarque–Bera and D’Agostino tests uses the values of the asymmetry and kurtosis coefficients. The result of each test (see Table 3) is the same and dictates to reject the null hypothesis regarding the residuals distribution normality—the residuals in the model do not meet the postulate of distribution normality. Since the intensity of extreme values is higher than in the normal distribution, it can be concluded that there are additional factors influencing both energy consumption and recuperation that were not taken into account in the model.
It is also worth emphasizing that the energy consumption of the electric motor depends on the torque and rotational speed. At higher rotational speeds, if the torque is low, energy consumption may be relatively low compared to lower rotational speed and high torque.
P m = M · ω ,
where:
  • Pm—mechanical power supplied by the motor [W]
  • M—torque [Nm]
  • ω—angular velocity [rad/s]
P e l = M · 2 π · R P M 60 η ,
where:
  • Pel—electrical power consumption by the motor
  • η—motor efficiency
This confirms the hypothesis that developing the correct operating pattern of the electric motor in relation to the driving style allows for a significant reduction in electricity consumption.

3.3. Analysis of Energy Consumption and Recuperation Depending on Driving Mode

In accordance with the algorithm presented above, the study was carried out divided into driving on motorways and in built-up areas. The dependence of instantaneous energy consumption/recovery/(IEC) on vehicle acceleration (g), engine speed (RPM), vehicle speed (v, km/h), and battery power (BP—battery power, kW) was again analyzed. As a result of the previous analysis, the BC variable was omitted due to its high correlation with the BP variable.
The linear dependence of the instantaneous energy consumption on other factors is presented by the equation:
I E C = θ 0 + θ 1 g + θ 2 r p m + θ 3 v + θ 4 B P + ε ,

3.3.1. Motorway Driving

For motorway driving, the results of estimating the structural parameters (according to Equation (9)) are presented in Table 4.
At the significance level of 0.05, there are no grounds to reject the null hypothesis H 0 for the factors: engine speed and vehicle speed, while vehicle acceleration and battery power have a significant impact on energy consumption and recuperation.
The value of the determination coefficient R 2 is 0.9056, while the value of the F statistic is 7302.902 for (4, 3044) degrees of freedom. The test probability is equal to 0. Therefore, at the significance level of 0.05, we reject the null hypothesis in favour of the alternative hypothesis—the multiple correlation coefficient is significantly different from zero and matching of the model with the empirical data is high.
The residuals were also analyzed and compared to the normal distribution.
Figure 6 shows a matrix of diagnostic plots for residuals of the linear model. Analyzing the density function plot, we see a symmetric distribution of residuals (red curve) with respect to zero, and from the boxplot we have a lot of outliers. The QQ plot suggests the presence of heavy tails (below and above QQ line in red), and from the CDF plot we can see the differences between the empirical (black curve) and theoretical distribution functions (blue curve). The graphs above suggest that the normality of the residuals has not been met. The non-normality of the distribution of the residuals has been confirmed by statistical tests, the results of which are presented in Table 5.
For each test, we reject the null hypothesis that the residuals are drawn from a population with a normal distribution. The tests based on the analysis of differences between elements symmetric with respect to the median in an ordered time series (Shapiro–Wilk test), the expected value of the squares of the differences between the theoretical and empirical distributions (Cramér–von Mises and Anderson–Darling tests), and the asymmetry and kurtosis coefficients (Jarque–Bera and D’Agostino tests) confirm that the residuals in the model do not meet the distribution normality postulate.

3.3.2. Driving in the Built-Up Areas

For driving in built-up areas, the results of estimating the structural parameters of Equation (9) are presented in Table 6.
At the significance level of 0.05 for each predictor, we reject the null hypothesis H 0 o in favour of the alternative hypothesis; therefore, the characteristics of vehicle acceleration, engine revolutions, vehicle speed and battery power have a significant impact on energy consumption and recuperation. The value of the determination coefficient R 2 is 0.7214, and the value of the F statistic is 269.998 for (4, 417) degrees of freedom. The test probability is equal to 0. Therefore, at the significance level of 0.05, we reject the null hypothesis in favour of the alternative hypothesis, the multiple correlation coefficient is significantly different from zero, and the result of the determination coefficient is sufficiently high.
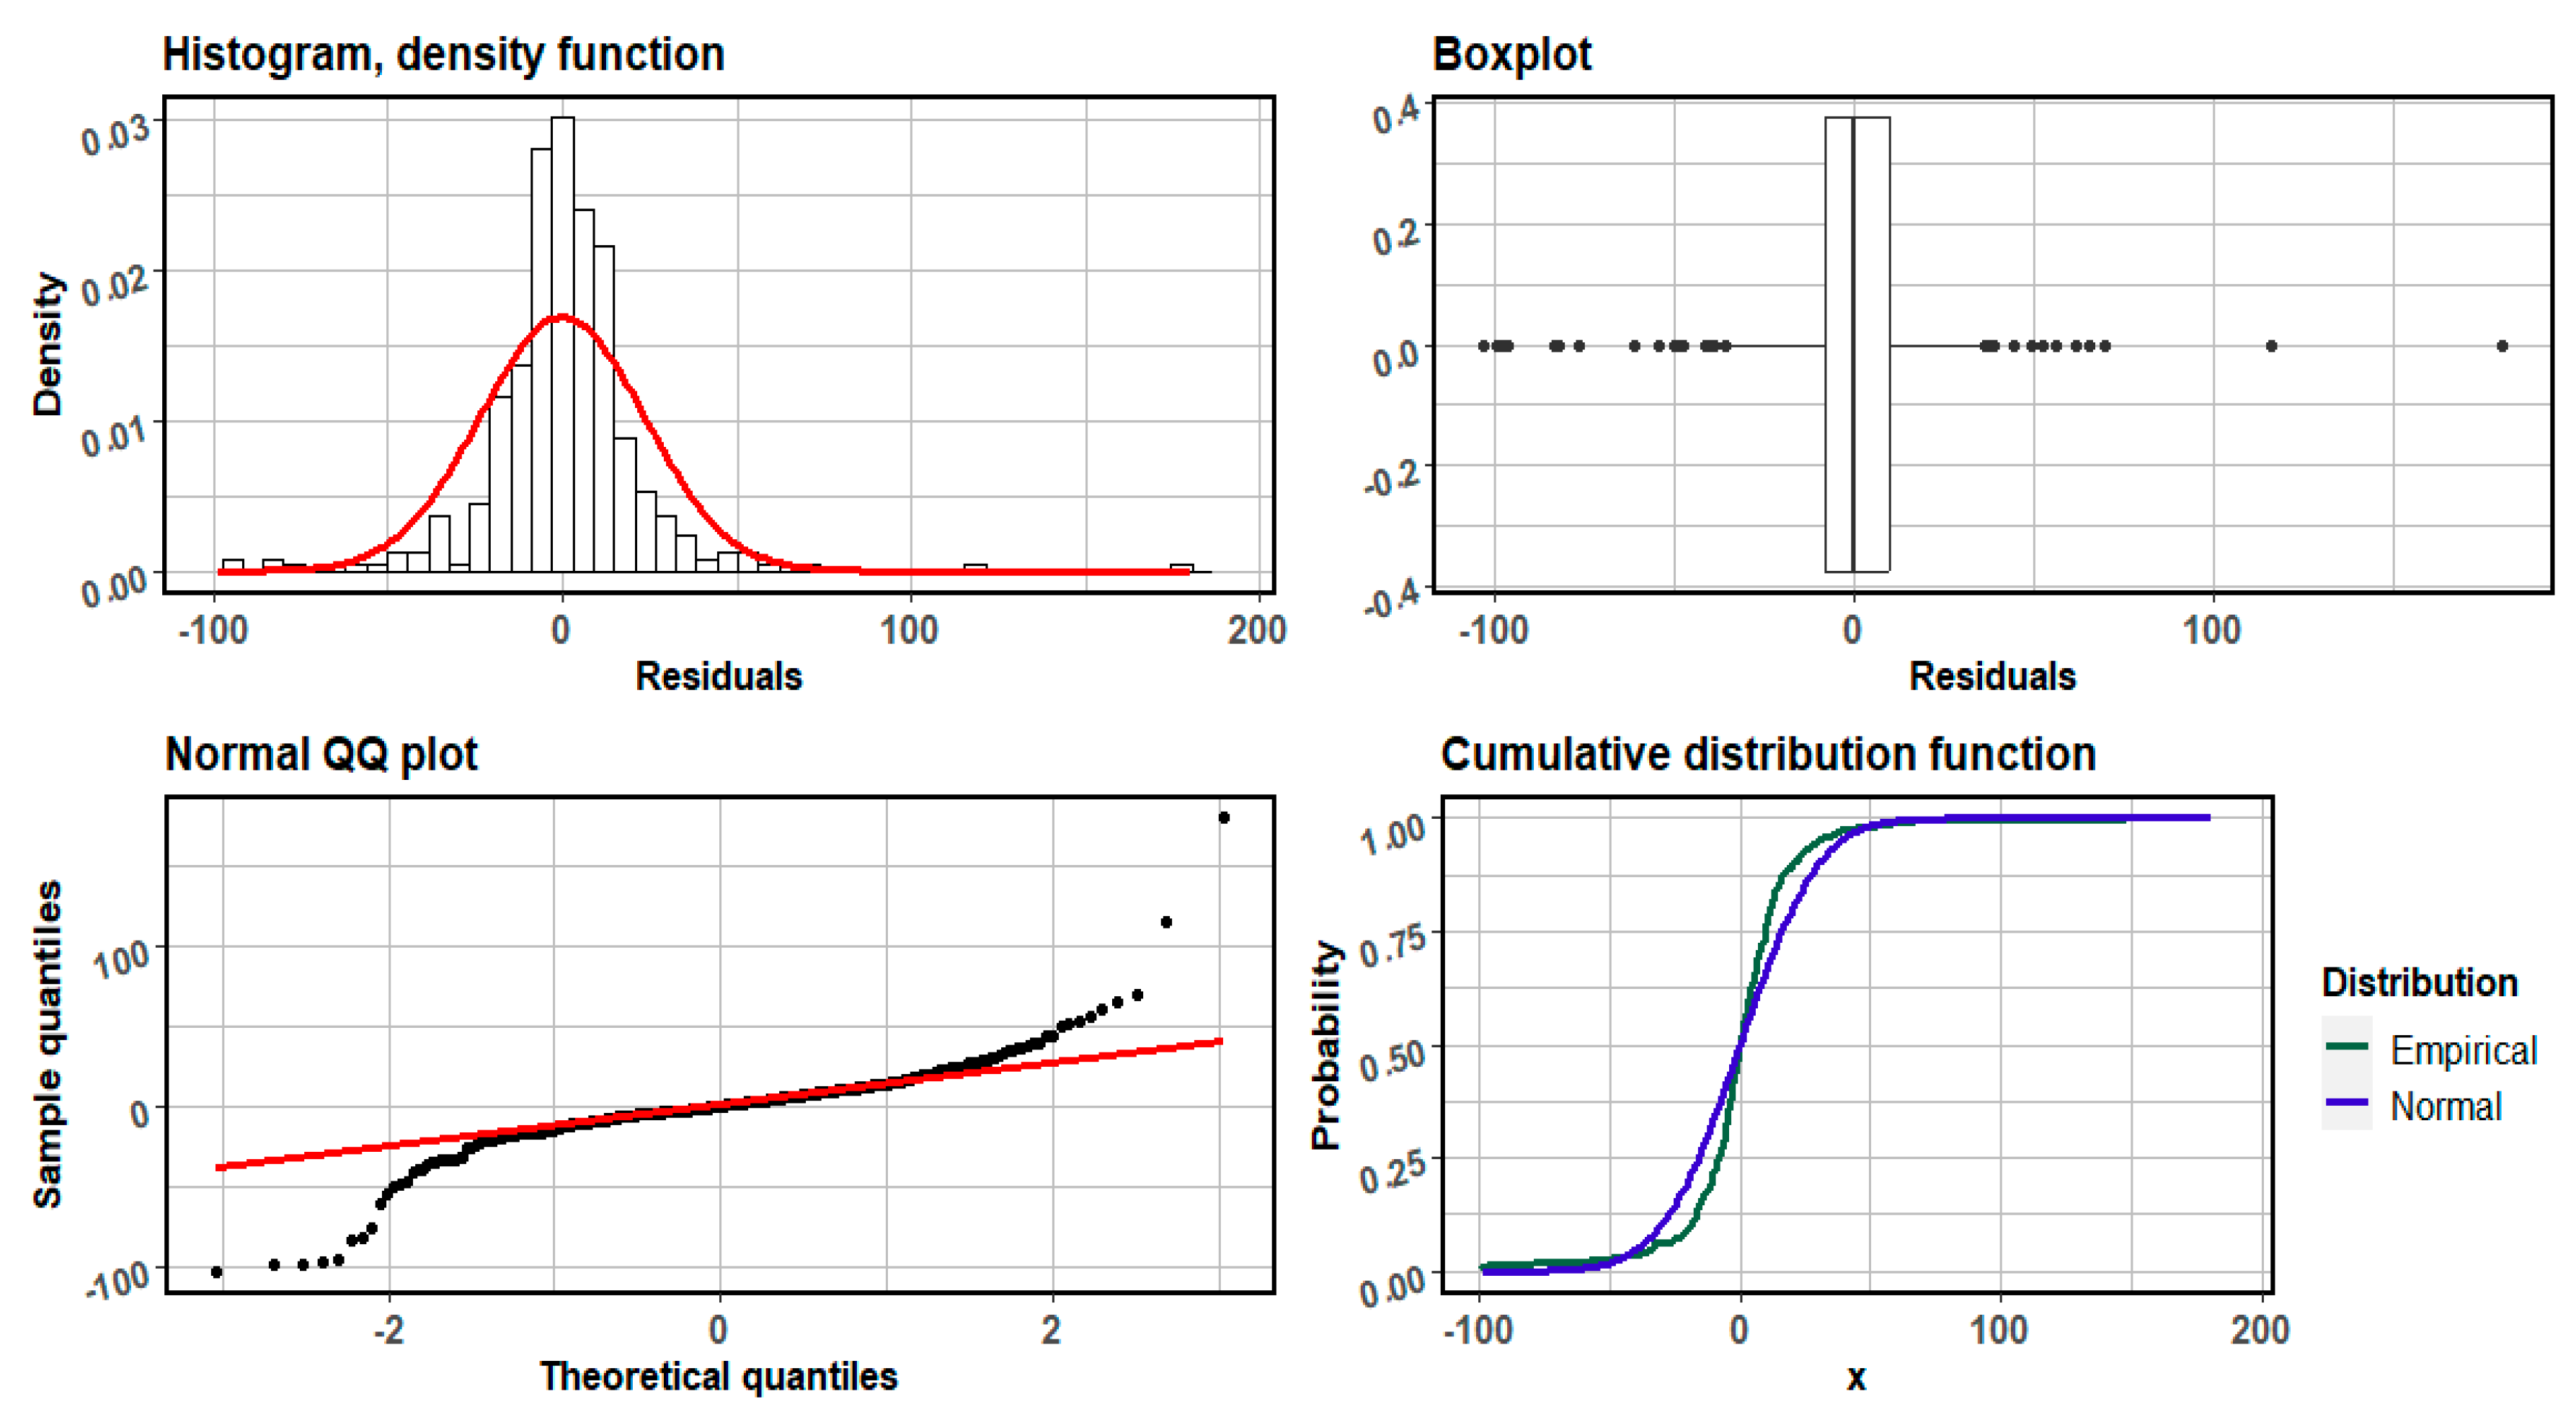
The residuals were also analyzed and compared to the normal distribution. Based on the matrix of diagnostic plots for residuals of the linear model (see Figure 7), we see that the density function (red) is symmetric about zero, but on the boxplot, we have a lot of outliers. From the QQ plot we can see the existence of heavy tails (below and above QQ line in red), and from the CDF plot we can see the differences between the empirical (black curve) and theoretical distribution functions (blue curve). The diagnostic plots presented in Figure 7 suggest that the normality postulate of the residuals is not met.
This is also confirmed by the results of statistical tests examining the distribution of residuals.
For tests related to the analysis of differences between elements symmetric with respect to the median in an ordered time series (Shapiro–Wilk test), the expected value of the squares of the differences between the theoretical and empirical distributions (Cramér–von Mises and Anderson–Darling tests), and the asymmetry and kurtosis coefficients (Jarque–Bera and D’Agostino tests), whose results are presented in Table 7, we conclude that the null hypothesis regarding the residuals distribution normality should be rejected. The residuals in the model do not also meet the distribution normality postulate. The occurrence of heavy tails (outliers) may be due to the influence of additional factors on instantaneous energy consumption or recording delays by equipment.

4. Discussion and Conclusions

The linear dependence of energy consumption and recuperation on vehicle acceleration, motor speed, vehicle speed, battery power, and battery current was analyzed, obtaining the following results:
  • It turns out that vehicle acceleration, motor RPM, vehicle speed, and battery power have a significant impact on energy consumption and recuperation. Battery current is strongly correlated with battery power; therefore, by analyzing the AIC index and using stepwise regression, the battery current was removed from the linear model to better determine the IEC’s dependence on vehicle acceleration and speed, revolutions per minutes, and battery power.
  • The residuals in linear models do not meet the normality distribution postulate, so there are additional factors influencing energy consumption and recuperation while driving.
  • In the motorway mode, vehicle acceleration and battery power have a significant impact on energy consumption and recuperation.
  • Unlike the motorway mode, in built-up areas, engine speed and vehicle speed also have a significant impact on energy consumption and recuperation.
The literature mainly focuses on single parameters related to energy or battery consumption, often omitting detailed analysis of the impact of acceleration on energy consumption. This study extends previous studies by analyzing different acceleration curves and their impact on energy consumption and battery life. It also considers the impact of the number of accelerations and their trends on energy consumption and battery life. The results confirm the known relationships between acceleration, speed, battery power, and energy consumption in electric vehicles. The research conducted by [47] also showed the significant impact of these parameters on energy efficiency. Moreover, removing the battery current from the model, based on AIC analysis, is consistent with the approach used in other studies [48], emphasizing the importance of battery power as the main factor influencing energy consumption. Vehicle acceleration, engine RPM, speed, and battery power significantly impact energy consumption and recovery. Due to the strong correlation between battery current and power, the current was excluded from the linear model using the AIC index and stepwise regression. This exclusion improved the model’s ability to determine the effects of vehicle acceleration, speed, rpm, and battery power on energy consumption and energy recovery.
Failure to meet the assumption of normal distribution of residuals indicates the complexity of the problem and the need to consider nonlinear factors (e.g., recording delays). Studies [49] emphasize the influence of road conditions, such as slope and air resistance, on the energy consumption of electric vehicles. Additionally, the driver’s driving style, which is difficult to measure objectively, can significantly affect the results [50]. Moreover, it is worth noting that the residuals of linear models do not meet the postulate of normal distribution, which indicates that additional factors influence energy consumption and energy recovery during driving, which are not included in the current model.
The differences in the importance of parameters depending on the driving mode are intuitive and confirm the results of other studies [51]. The authors of these studies emphasize the importance of rolling resistance in urban conditions and air resistance on the highway. The analysis of the impact of different acceleration curves on energy consumption is an essential contribution to the research on electric vehicles. These results align with the trend of research on driving profile optimization [47,48,49,50,51], which emphasizes the importance of gentle acceleration and braking to increase the vehicle range. In highway mode, vehicle acceleration and battery power are the main factors influencing energy consumption and energy recovery. In built-up areas, engine and vehicle speed also significantly impact energy consumption and recovery, in contrast to highway mode. It is worth emphasizing that depending on the driving mode, the presented models can be used to predict energy consumption and energy recovery.
The obtained results have important practical implications. They can be used to develop energy management systems in electric vehicles that optimize energy consumption depending on driving conditions. Furthermore, the results can contribute to developing new eco-driving strategies that consider acceleration and vehicle speed. The results serve as a theoretical basis for optimizing acceleration values. The study confirms that vehicle speed is strongly correlated with vehicle range. The study’s conclusions can be used for future research on optimizing vehicle acceleration control modules to increase range. Furthermore, these results can facilitate the effective implementation and optimization of eco-driving strategies, thus increasing the achievable range. The research, therefore, contributes to a better understanding of the efficiency factors of electric vehicles (EVs) and supports the transition to low-emission transport systems.

Author Contributions

Conceptualization, P.W. and M.G.; methodology, P.W., E.K., M.Z.-L. and A.B.; software, E.K. and A.B.; investigation, P.W., E.K., M.G, M.Z.-L. and A.B.; data curation, P.W. and M.G.; writing—original draft preparation, P.W., E.K., M.Z.-L. and A.B.; writing—review and editing, P.W., E.K., M.Z.-L. and A.B.; visualization, P.W., E.K., M.G. and A.B. All authors have read and agreed to the published version of the manuscript.

Funding

This research received no external funding.

Data Availability Statement

The original contributions presented in the study are included in the article, further inquiries can be directed to the corresponding author.

Conflicts of Interest

Authors P.W., M.G. and M.Z.-L. were employed by the company MTI. The remaining authors declare that the research was conducted in the absence of any commercial or financial relationships that could be construed as a potential conflict of interest.

References

  1. Jonas, T.; Wilde, T.; Hunter, C.D.; Macht, G.A.; Aifadopoulou, G. The Impact of Road Types on the Energy Consumption of Electric Vehicles. J. Adv. Transp. 2022, 2022, 1436385. [Google Scholar] [CrossRef]
  2. Andrych-Zalewska, M.; Chlopek, Z.; Pielecha, J.; Merkisz, J. Investigation of exhaust emissions from the gasoline engine of a light duty vehicle in the Real Driving Emissions test. Eksploat. Niezawodn. Maint. Reliab. 2023, 25, 165880. [Google Scholar] [CrossRef]
  3. Li, L.; Liu, Q. Study on the influence of acceleration curve on electric vehicle energy consumption and battery life. IOP Conf. Ser. Earth Environ. Sci. 2020, 512, 012106. [Google Scholar] [CrossRef]
  4. IEA. Global EV Data Explorer. 2021. Available online: https://www.iea.org/articles/global-ev-data-explorer (accessed on 28 June 2024).
  5. Liao, P.; Tang, T.-Q.; Liu, R.; Huang, H.-J. An eco-driving strategy for electric vehicle based on the powertrain. Appl. Energy 2021, 302, 117583. [Google Scholar] [CrossRef]
  6. Guo, D.; Zhou, C. Potential performance analysis and future trend prediction of electric vehicle with V2G/V2H/V2B capability. AIMS Energy 2016, 4, 331–346. [Google Scholar] [CrossRef]
  7. Dua, R.; White, K.; Lindland, R. Understanding potential for battery electric vehicle adoption using large-scale consumer profile data. Energy Rep. 2019, 5, 515–524. [Google Scholar] [CrossRef]
  8. Li, L.; Liu, Q. Acceleration curve optimization for electric vehicle based on energy consumption and battery life. Energy 2019, 169, 1039–1053. [Google Scholar] [CrossRef]
  9. Graba, M.; Bieniek, A.; Prażnowski, K.; Hennek, K.; Mamala, J.; Burdzik, R.; Śmieja, M. Analysis of energy efficiency and dynamics during car acceleration. Eksploat. Niezawodn. Maint. Reliab. 2023, 25, 17. [Google Scholar] [CrossRef]
  10. Kusalaphirom, T.; Satiennam, T.; Satiennam, W. Factors Influencing the Real-World Electricity Consumption of Electric Motorcycles. Energies 2023, 16, 6369. [Google Scholar] [CrossRef]
  11. Wiśniowski, P.; Gis, M. Comparative analysis of the electric vehicle charging costs using DC and AC charging stations throughout the country, based on own research. In Research Methods and Solutions to Current Transport Problems: Proceedings of the International Scientific Conference Transport of the 21st Century, Ryn, Poland, 9–12 June 2019; Springer: Berlin/Heidelberg, Germany, 2019; Volume 15, p. 15. [Google Scholar] [CrossRef]
  12. Wiśniowski, P.; Ślęzak, M.; Niewczas, A.; Szczepański, T. Method for synthesizing the laboratory exhaust emission test from car engines based on road tests. IOP Conf. Ser. Mater. Sci. Eng. 2018, 421, 042080. [Google Scholar] [CrossRef]
  13. Brundell-Freij, K.; Ericsson, E. Influence of street characteristics, driver category and car performance on urban driving patterns. Transp. Res. Part D Transp. Environ. 2005, 10, 213–229. [Google Scholar] [CrossRef]
  14. Puchalski, A.; Komorska, I.; Ślęzak, M.; Wiśniowski, P. Multifractal analysis vehicle’s in-use speed profile for application in driving cycles. Eksploat. Niezawodn. Maint. Reliab. 2018, 20, 177–181. [Google Scholar] [CrossRef]
  15. Faria, M.V.; Duarte, G.O.; Varella, R.A.; Farias, T.L.; Baptista, P.C. How do road grade, road type and driving aggressiveness impact vehicle fuel consumption? Assessing potential fuel savings in Lisbon, Portugal. Transp. Res. Part D Transp. Environ. 2019, 72, 148–161. [Google Scholar] [CrossRef]
  16. Jensen, S.S. Driving patterns and emissions from different types of roads. Sci. Total Environ. 1995, 169, 123–128. [Google Scholar] [CrossRef]
  17. Ericsson, E. Variability in urban driving patterns. Transp. Res. Part D Transp. Environ. 2000, 5, 337–354. [Google Scholar] [CrossRef]
  18. Galvin, R. Energy consumption effects of speed and acceleration in electric vehicles: Laboratory case studies and implications for drivers and policymakers. Transp. Res. Part D Transp. Environ. 2017, 53, 234–248. [Google Scholar] [CrossRef]
  19. Fiori, C.; Arcidiacono, V.; Fontaras, G.; Makridis, M.; Mattas, K.; Marzano, V.; Thiel, C.; Ciuffo, B. The effect of electrified mobility on the relationship between traffic conditions and energy consumption. Transp. Res. Part D Transp. Environ. 2019, 67, 275–290. [Google Scholar] [CrossRef]
  20. Liu, Q.; Wang, W.; Hua, X. Path planning method for electric vehicles based on freeway network. J. Adv. Transp. 2021, 16, 3030050. [Google Scholar] [CrossRef]
  21. Yao, E.; Yang, Z.; Song, Y.; Zuo, T. Comparison of electric vehicle’s energy consumption factors for different road types. Discret. Dyn. Nat. Soc. 2013, 7, 328757. [Google Scholar] [CrossRef]
  22. Zhang, Y.; Yuan, W.; Fu, R.; Wang, C. Design of an Energy-Saving Driving Strategy for Electric Buses. IEEE Access 2019, 7, 157693–157706. [Google Scholar] [CrossRef]
  23. Gis, M.; Wiśniowski, P.; Bednarski, M. Efficiency of electric vehicle interior heating systems at low ambient temperatures. Open Eng. 2021, 11, 499–507. [Google Scholar] [CrossRef]
  24. Burzyński, D. Useful energy prediction model of a Lithium-ion cell operating on various duty cycles. Eksploat. Niezawodn. Maint. Reliab. 2022, 24, 317–329. [Google Scholar] [CrossRef]
  25. Kenessova, P.; Kaverin, V.; Tatkeyeva, G. Variable-speed drive with series-excited motors in dynamic braking mode. Eksploat. Niezawodn. Maint. Reliab. 2023, 25, 9. [Google Scholar] [CrossRef]
  26. Iora, P.; Tribioli, L. Effect of ambient temperature on electric vehicles’ energy consumption and range: Model definition and sensitivity analysis based on nissan Leaf data. World Electr. Veh. J. 2019, 10, 2. [Google Scholar] [CrossRef]
  27. Faria, R.; Marques, P.; Moura, P.; Freire, F.; Delgado, J.; de Almeida, A.T. Impact of the electricity mix and use profile in the life-cycle assessment of electric vehicles. Renew. Sustain. Energy Rev. 2013, 24, 271–287. [Google Scholar] [CrossRef]
  28. Franke, T.; Cocron, P.; Krems, J.F.; Bühler, F.; Neumann, I. Eco-driving strategies in battery electric vehicle use—How do drivers adapt over time? IET Intell. Transp. Syst. 2015, 9, 746–753. [Google Scholar] [CrossRef]
  29. Kurien, C.; Srivastava, A.K.; Molere, E. Indirect carbon emissions and energy consumption model for electric vehicles: Indian scenario. Integr. Environ. Assess. Manag. 2020, 16, 998–1007. [Google Scholar] [CrossRef]
  30. Wu, X.; Freese, D.; Cabrera, A.; Kitch, W.A. Electric vehicles’ energy consumption measurement and estimation. Transp. Res. Part D Transp. Environ. 2015, 34, 52–67. [Google Scholar] [CrossRef]
  31. Bingham, C.; Walsh, C.; Carroll, S. Impact of driving characteristics on electric vehicle energy consumption and range. IET Intell. Transp. Syst. 2012, 6, 29–35. [Google Scholar] [CrossRef]
  32. Fetene, G.M.; Kaplan, S.; Mabit, S.L.; Jensen, A.F.; Prato, C.G. Harnessing big data for estimating the energy consumption and driving range of electric vehicles. Transp. Res. Part D Transp. Environ. 2017, 54, 1–11. [Google Scholar] [CrossRef]
  33. Ashkrof, P.; Homem de Almeida Correia, G.; van Arem, B. Analysis of the effect of changing needs on battery electric vehicle drivers’ route choice behaviour: A case study in The Netherlands. Transp. Res. Part D Transp. Environ. 2020, 78, 102206. [Google Scholar] [CrossRef]
  34. Degraeuwe, B.; Weiss, M. Does the New European Driving Cycle (NEDC) really fail to capture the NOX emissions of diesel cars in Europe? Environ. Pollut. 2017, 222, 234–241. [Google Scholar] [CrossRef]
  35. Weiss, M.; Zerfass, A.; Helmers, E. Fully electric and plug-in hybrid cars—An analysis of learning rates, user costs, and costs for mitigating CO2 and air pollutant emissions. J. Clean. Prod. 2019, 212, 1478–1489. [Google Scholar] [CrossRef]
  36. Günther, M.; Rauh, N.; Krems, J.F. Conducting a study to investigate eco-driving strategies with battery electric vehicles—A multiple method approach. Transp. Res. Procedia 2017, 25, 2242–2256. [Google Scholar] [CrossRef]
  37. Pelkmans, L.; Keukeleere, D.; Bruneel, H.; Lenaers, G. Influence of vehicle test cycle characteristics on fuel consumption and emissions of city buses. SAE Trans. 2001, 110, 1388–1398. [Google Scholar]
  38. Zhang, Z.; Ye, B.; Wang, S.; Ma, Y. Analysis and estimation of energy consumption of electric buses using real-world data. Transp. Res. Part D Transp. Environ. 2024, 126, 104017. [Google Scholar] [CrossRef]
  39. Knowles, M.; Scott, H.; Baglee, D. The effect of driving style on electric vehicle performance, economy and perception. Int. J. Electr. Hybrid Veh. 2012, 4, 228–247. [Google Scholar] [CrossRef]
  40. Sawczuk, W.; Merkisz-Guranowska, A.; Rilo Cañás, A.; Kołodziejski, S. New approach to brake pad wear modelling based on test stand friction-mechanical investigations. Eksploat. Niezawodn. Maint. Reliab. 2022, 24, 3. [Google Scholar] [CrossRef]
  41. Borucka, A.; Kozłowski, E. Mathematical Evaluation of Passenger and Freight Rail Transport as Viewed Through the COVID-19 Pandemic and the War in Ukraine Situation. Adv. Sci. Technol. Res. J. 2024, 18, 238–249. [Google Scholar] [CrossRef]
  42. Borucka, A.; Kozłowski, E. Selected polynomial identification techniques to evaluate maritime transport trends around COVID-19. Sci. J. Silesian Univ. Technol. Ser. Transp. 2023, 120, 51–68. [Google Scholar] [CrossRef]
  43. Wehrens, R. Chemometrics with r; Springer: Berlin/Heidelberg, Germany, 2011. [Google Scholar]
  44. Xin, X.G.; Yan, S. Linear Regression Analysis; World Scientific Publishing Company: Singapore, 2009. [Google Scholar]
  45. Hastie, T.; Tibshirani, R.; Friedman, J. The Elements of Statistical Learning; Springer: New York, NY, USA, 2009. [Google Scholar]
  46. James, G.; Witten, D.; Hastie, T.; Tibshirani, R. An Introduction to Statistical Learning; Springer: Berlin/Heidelberg, Germany, 2013. [Google Scholar]
  47. Gołębiewski, W.; Lisowski, M. Theoretical analysis of electric vehicle energy consumption according to different driving cycles . IOP Conf. Ser. Mater. Sci. Eng. 2018, 421, 022010. [Google Scholar] [CrossRef]
  48. Valle, J.A.D.; Viera, J.C.; Ansean, D.; Branas, C.; Luque, P.; Mantaras, D.A.; Pulido, Y.F. Design and validation of a tool for prognosis of the energy consumption and performance in electric vehicles. Transp. Res. Proc. 2018, 33, 35–42. [Google Scholar] [CrossRef]
  49. Liu, Q.; Zhang, Z.; Zhang, J. Research on the interaction between energy consumption and power battery life during electric vehicle acceleration. Sci. Rep. 2024, 14, 157. [Google Scholar] [CrossRef] [PubMed]
  50. Zhang, J.; Wang, Z.; Liu, P.; Zhang, Z. Energy consumption analysis and prediction of electric vehicles based on real-world driving data. Appl. Energy 2020, 275, 115408. [Google Scholar] [CrossRef]
  51. Kim, Y.; Lee, I.; Kang, S. Eco Assist Techniques through Real-time Monitoring of BEV Energy Usage Efficiency. Sensors 2015, 15, 14946–14959. [Google Scholar] [CrossRef]
Figure 1. Distance travelled and mileage of the car.
Energies 17 04051 g001
Figure 2. Yokogawa WT1806E power analyzer.
Energies 17 04051 g002
Figure 3. Vehicle operating parameters recorder.
Energies 17 04051 g003
Figure 4. Correlation between features.
Energies 17 04051 g004
Figure 5. Residuals analysis.
Energies 17 04051 g005
Figure 6. Residuals analysis for linear model in motorway mode.
Energies 17 04051 g006
Figure 7. Residuals analysis for linear model in urban mode.
Energies 17 04051 g007
Table 1. Estimates of structural parameters, standard deviations, values of t-statistics and probability of H 0 hypothesis.
i θ i S θ i t i p i
08.0990.9548.4900.000000
1405.8818.70946.6040.000000
2−22.0504.851−4.5460.000006
31.8480.4094.5220.000006
40.6070.04513.6340.000000
5−0.0180.015−1.1990.230506
Table 2. Estimates of structural parameters, standard deviations, values of t-statistics, and probability of H 0 hypothesis.
i θ i S θ i t i p i
08.0090.9518.4220 × 100
1406.0558.70846.6280 × 100
2−21.7624.845−4.4917 × 10⁻⁶
31.8240.4084.4698 × 10−6
40.5560.01341.2730 × 100
Table 3. Outcomes of normality tests for residuals of linear model.
TestStatisticsp Value
Shapiro–Wilk normality test0.5772.83 × 10−68
Anderson–Darling test330.8283.7 × 10−24
Cramér–von Mises test61.6867.37 × 10−10
Lilliefors (Kolmogorov–Smirnov) test0.1990
Jarque–Bera test696,355.4360
D’Agostino Omnibus test1806.1590
Table 4. Estimates of structural parameters, standard deviations, values of t-statistics, and probability of H 0   hypothesis for linear model in motorway mode.
i θ i S θ i t i p i
06.1880.8637.1690.000000
1399.2467.60052.5350.000000
23.6473.3101.1020.270573
3−0.3040.279−1.0920.274813
40.5320.01149.9420.000000
Table 5. Results of normality tests of residuals for linear model in motorway mode.
TestStatisticsp Value
Shapiro–Wilk normality test0.6285.29 × 10−63
Anderson–Darling test198.3373.7 × 10−24
Cramér–von Mises test34.8187.37 × 10−10
Lilliefors (Kolmogorov–Smirnov) test0.1597.76 × 10−215
Jarque–Bera test1,300,228.7340
D’Agostino Omnibus test1745.4950
Table 6. Estimates of structural parameters, standard deviations, values of t-statistics and probability of H 0 hypothesis for linear model in urban mode.
i θ i S θ i t i p i
016.0363.7424.2862.3 × 10−5
1388.30929.29713.2540.0 × 100
2−140.12027.669−5.0641.0 × 10−6
311.7352.3345.0291.0 × 10−6
40.6550.06010.9990.0 × 100
Table 7. Results of normality tests of residuals for linear model in urban mode.
TestStatisticsp Value
Shapiro–Wilk normality test0.8275.14 × 10−21
Anderson–Darling test16.1803.7 × 10−24
Cramér–von Mises test2.8147.37 × 10−10
Lilliefors (Kolmogorov–Smirnov) test0.1336.39 × 10−20
Jarque–Bera test2761.8470
D’Agostino Omnibus test133.1560
Disclaimer/Publisher’s Note: The statements, opinions and data contained in all publications are solely those of the individual author(s) and contributor(s) and not of MDPI and/or the editor(s). MDPI and/or the editor(s) disclaim responsibility for any injury to people or property resulting from any ideas, methods, instructions or products referred to in the content.