Modeling the Optimal Transition of an Urban Neighborhood towards an Energy Community and a Positive Energy District
Abstract
1. Introduction
2. Materials and Methods
2.1. Case Study
- Installing insulation materials, thermal break windows, and LED lighting to decrease building energy consumption.
- Installing photovoltaic panels, solar thermal panels, and heat pumps to increase renewable energy generation.
- Integrating thermal energy storage and batteries to maximize self-consumption.
- Adopting a new low-temperature geothermal district heating and cooling network to maximize the integration of thermal renewable energy at a neighborhood level.
- Installing electric vehicle charging stations to support clean mobility.
- Developing energy management systems for building and district optimization.
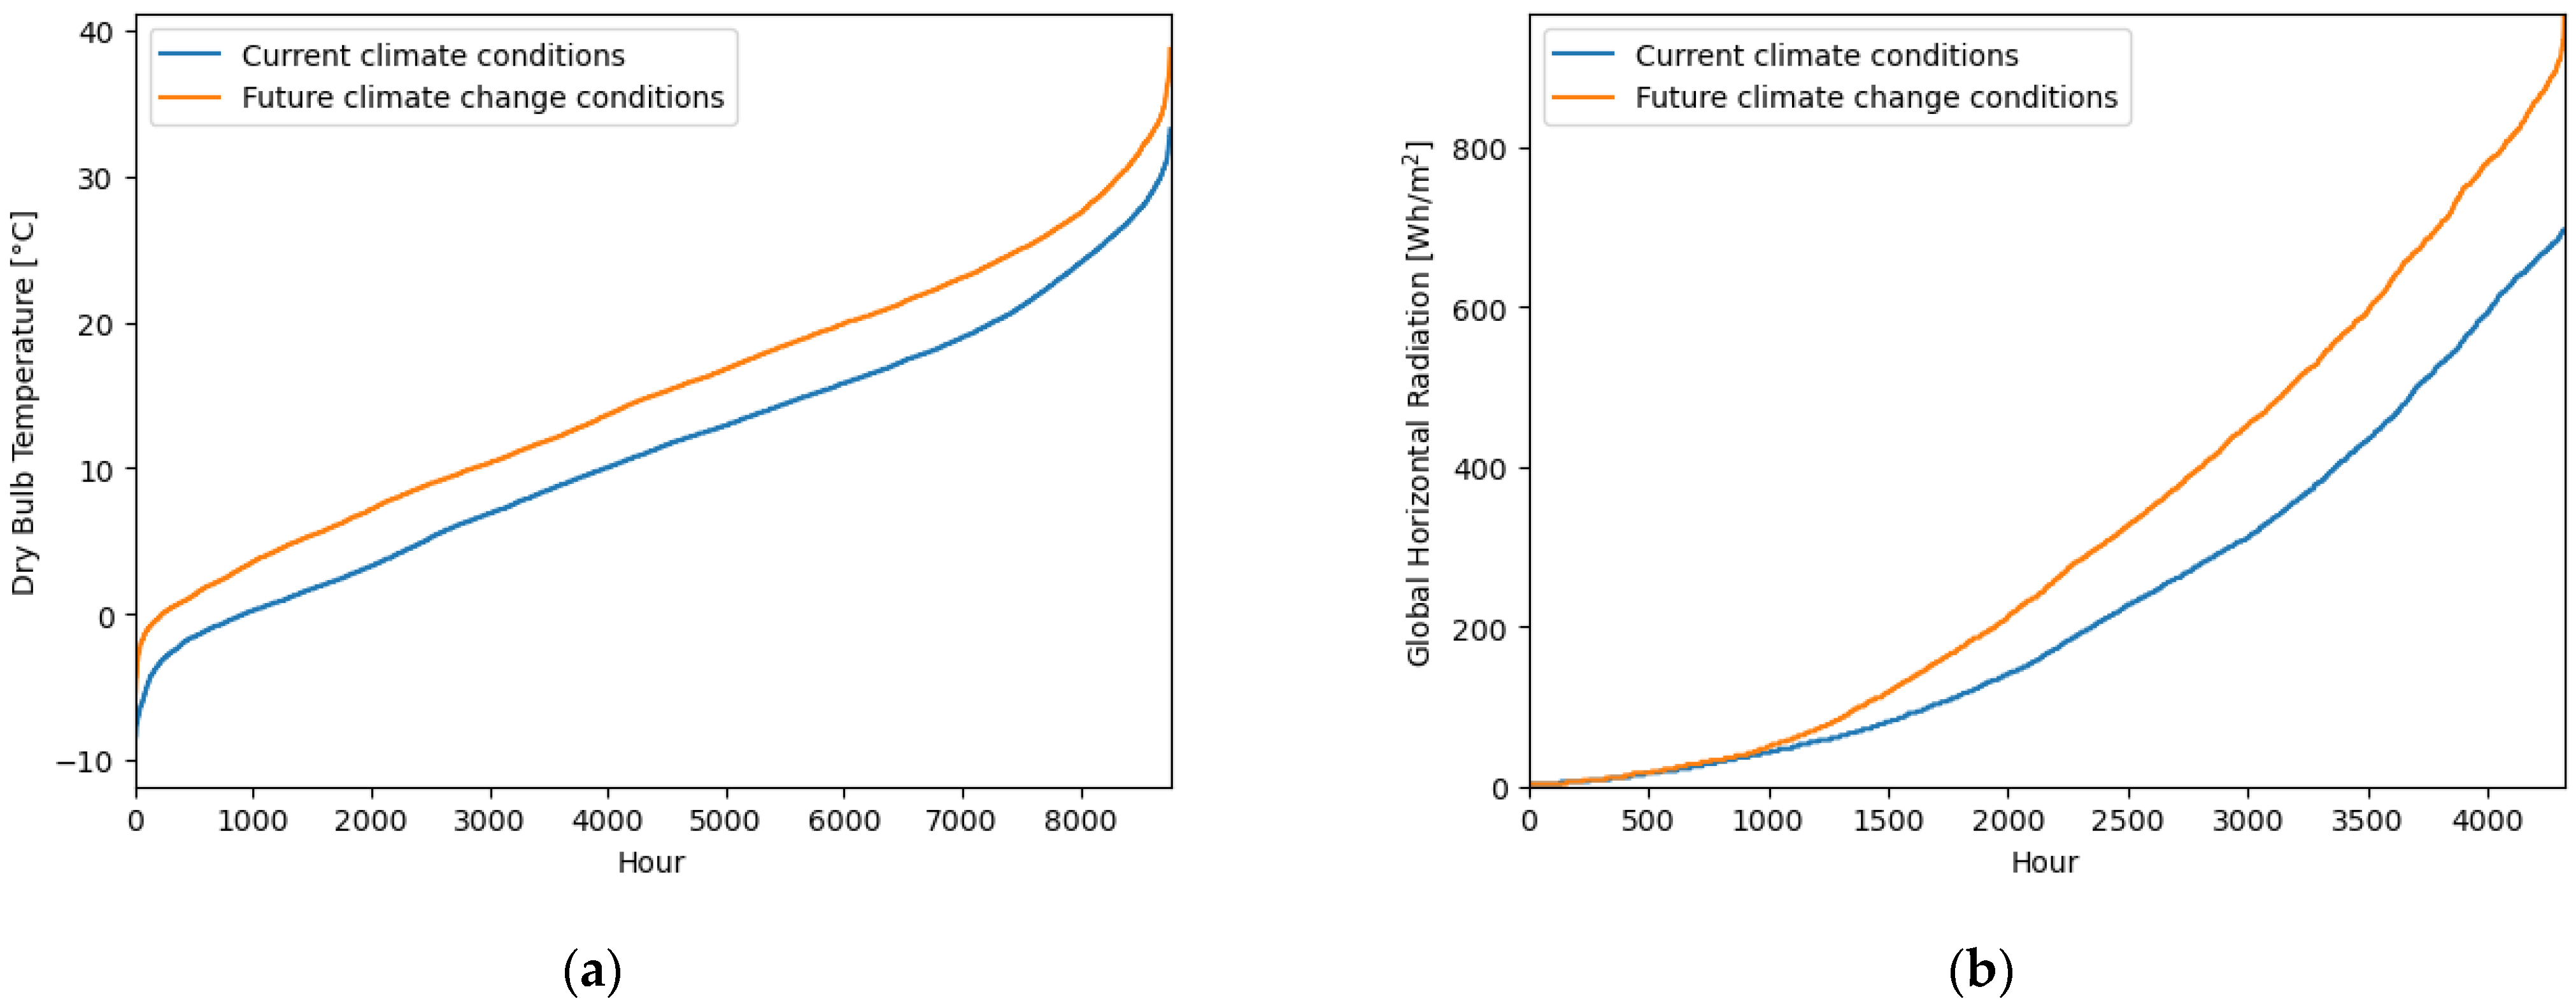
2.2. Climate Scenarios
2.3. Umi Model
- Double glazing window: U value of 3.159 W m−2 K−1 and solar heat gain coefficient equal to 0.601.
- Triple glazing window: U value of 1.507 W m−2 K−1 and solar heat gain coefficient equal to 0.418.
2.4. EnergyPLAN + MOEA Model
3. Results and Discussion
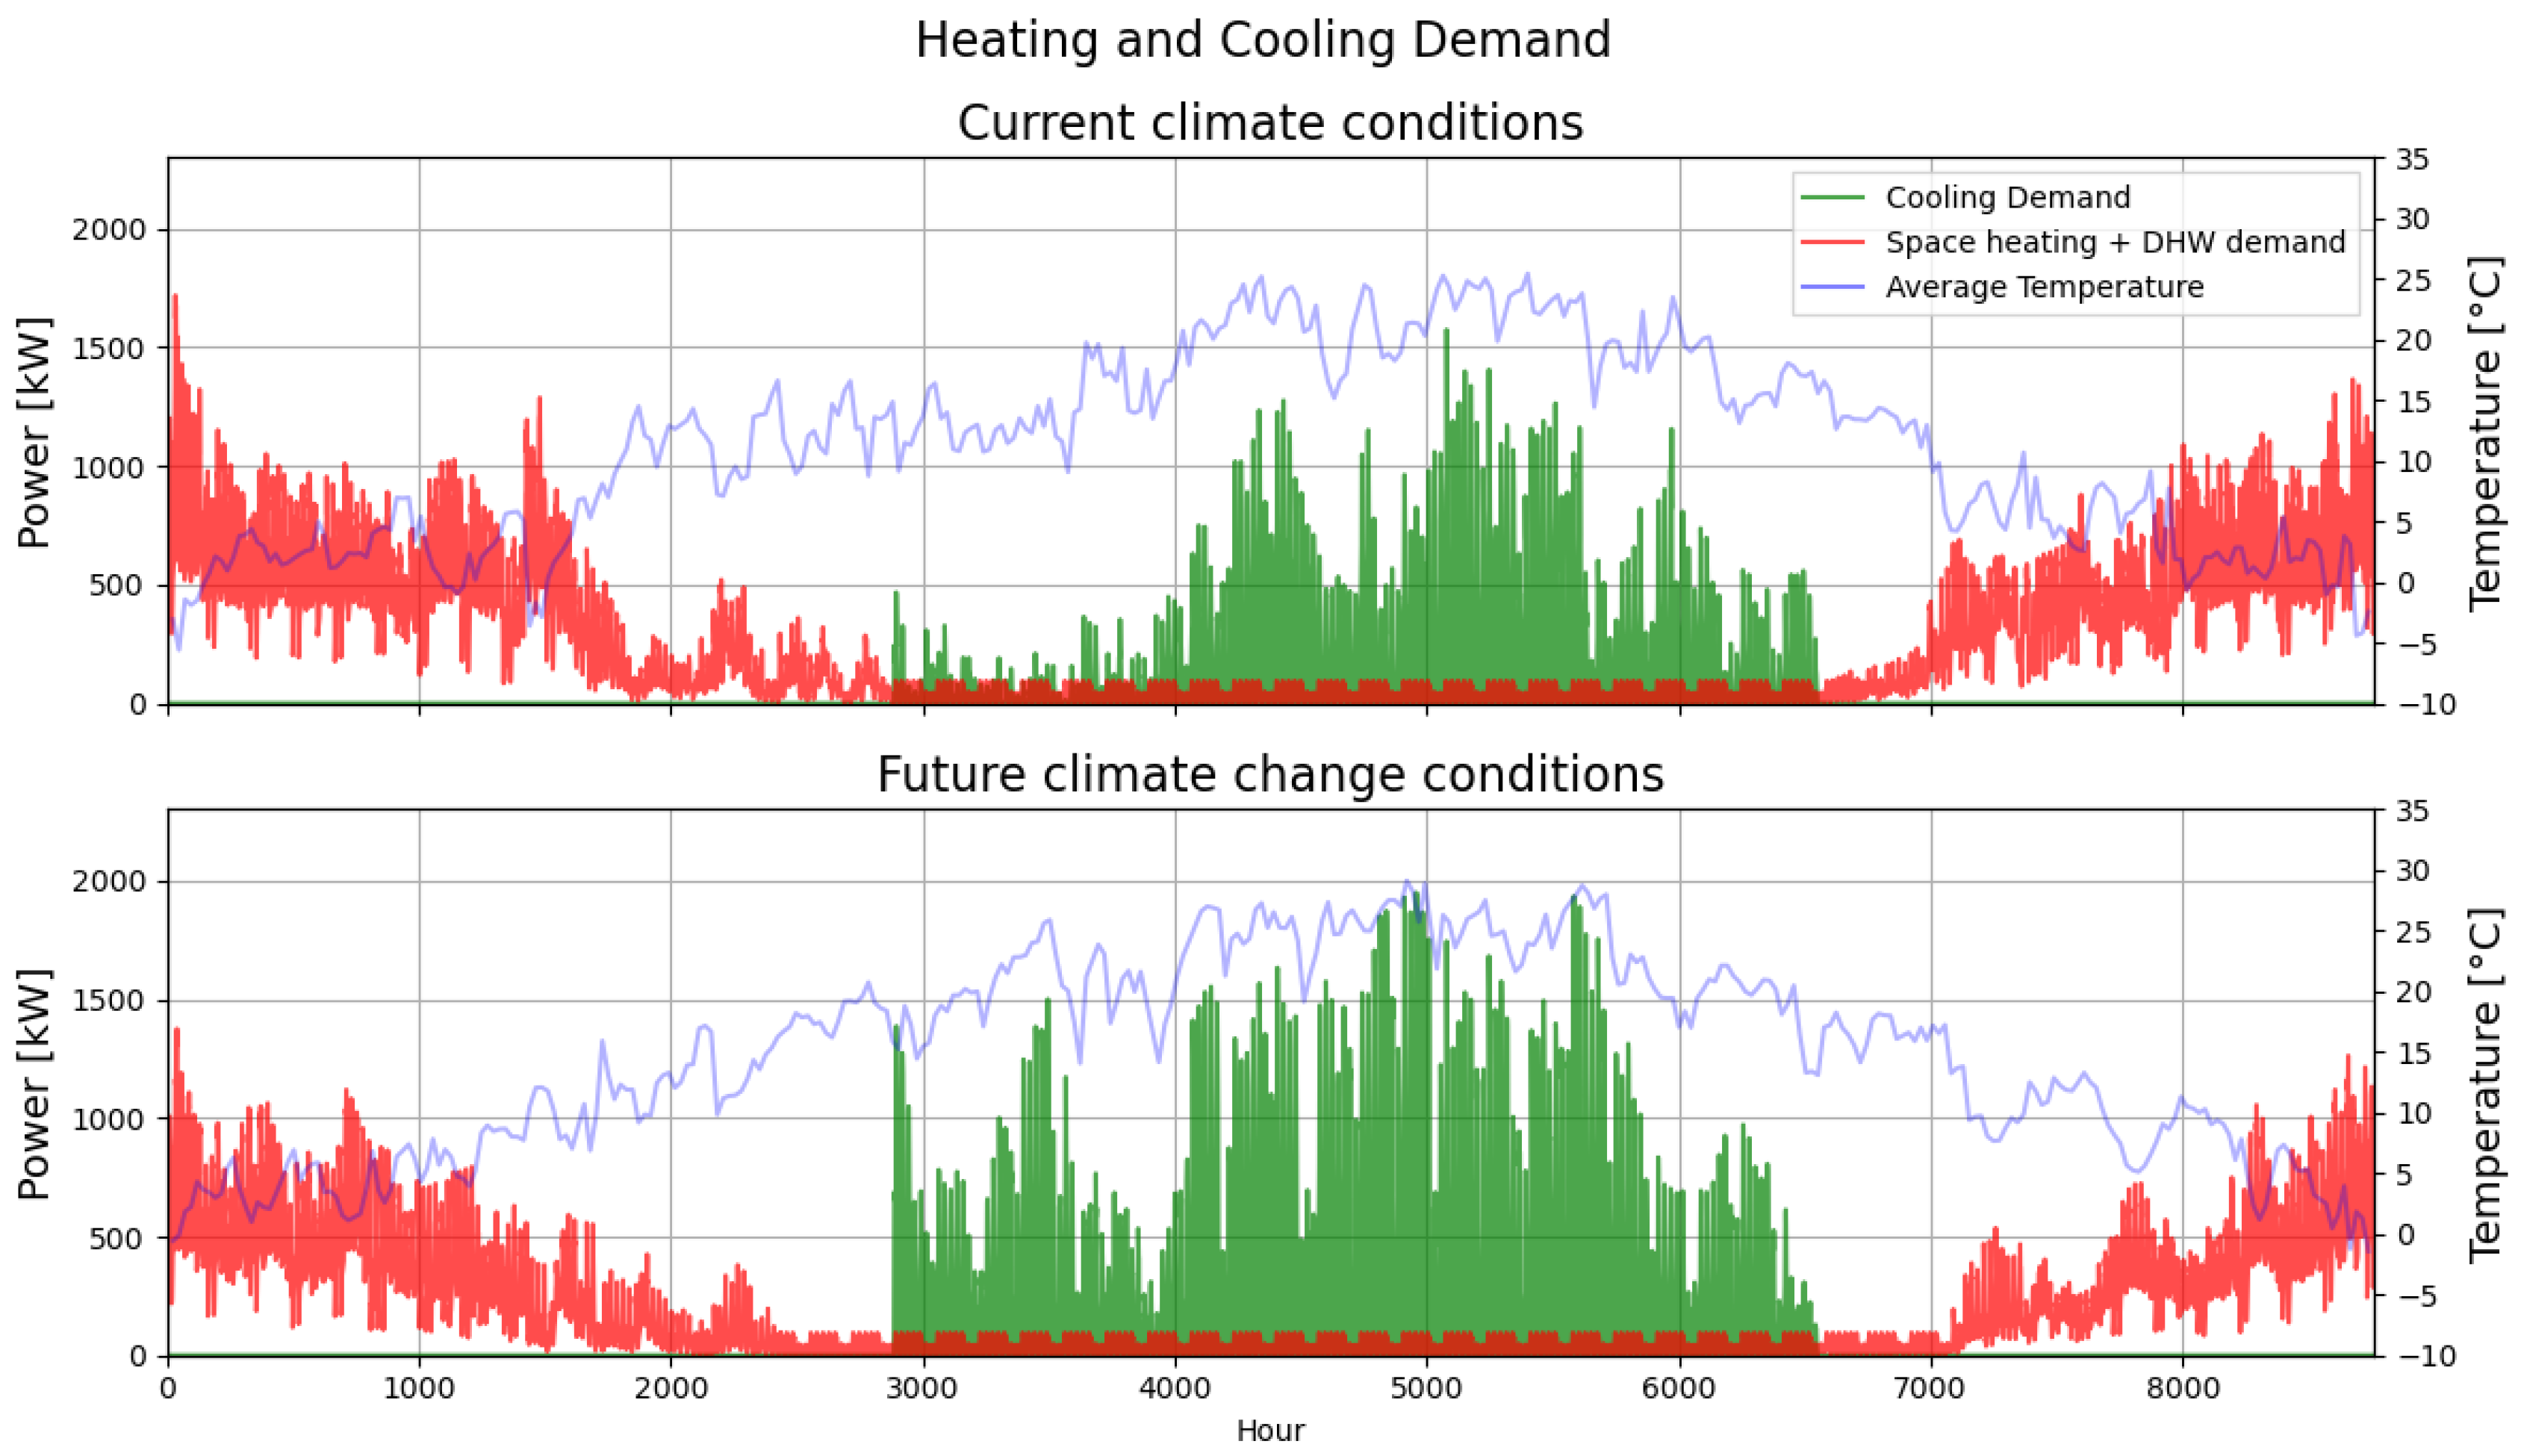
3.1. Umi Results
3.2. EnergyPLAN + MOEA Results
3.2.1. EnergyPLAN + MOEA 2024–2050: “S1: All Sectors and EC Incentive”
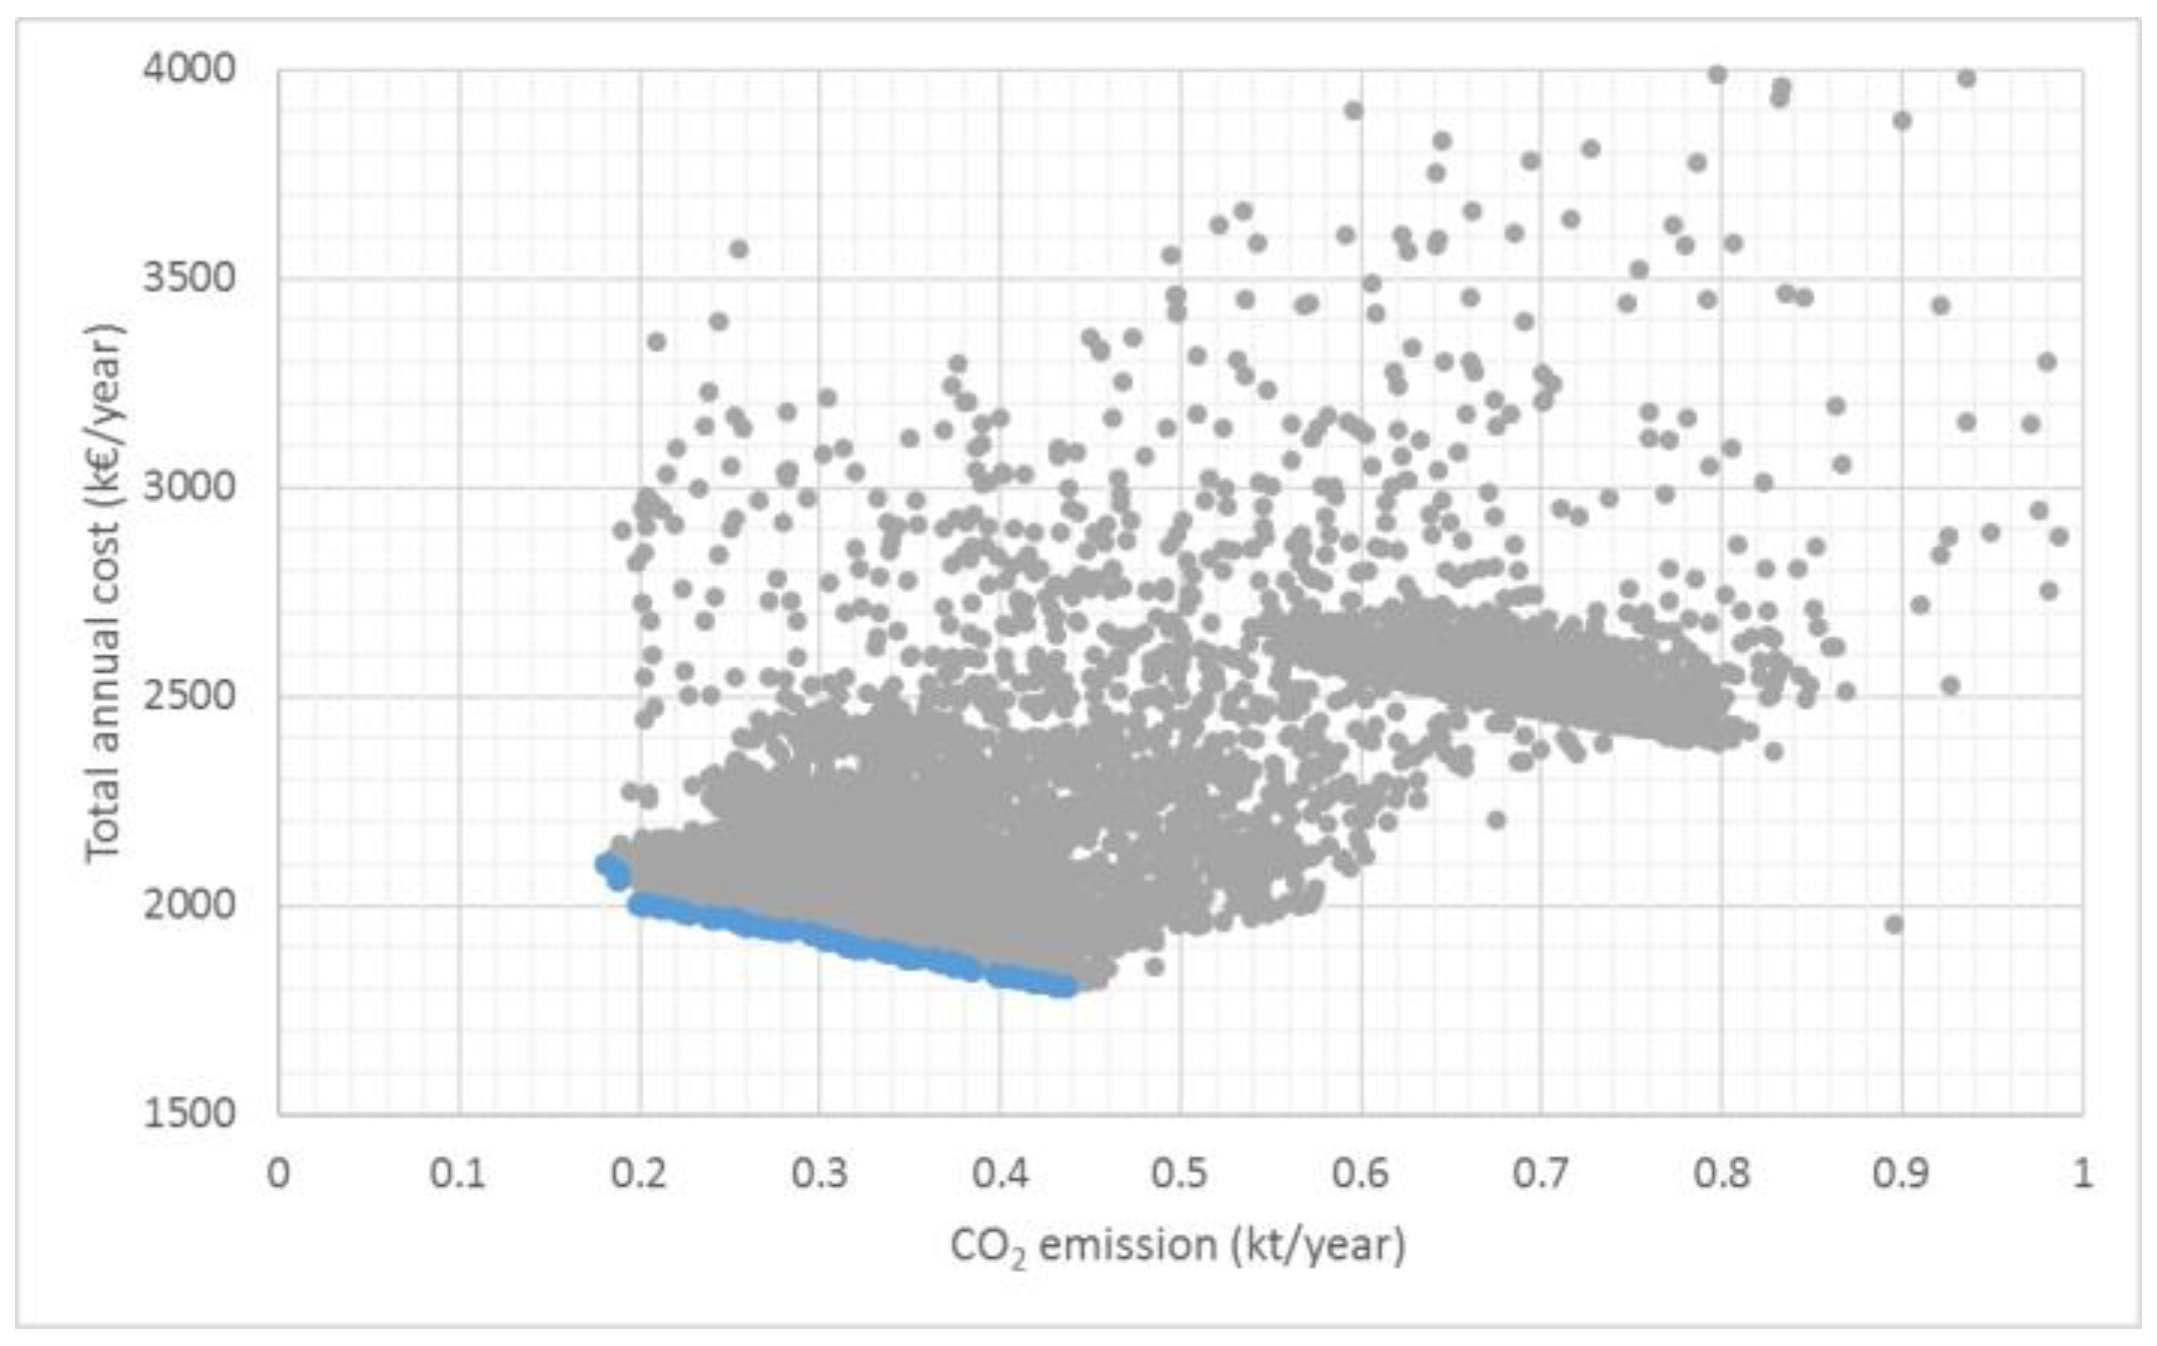
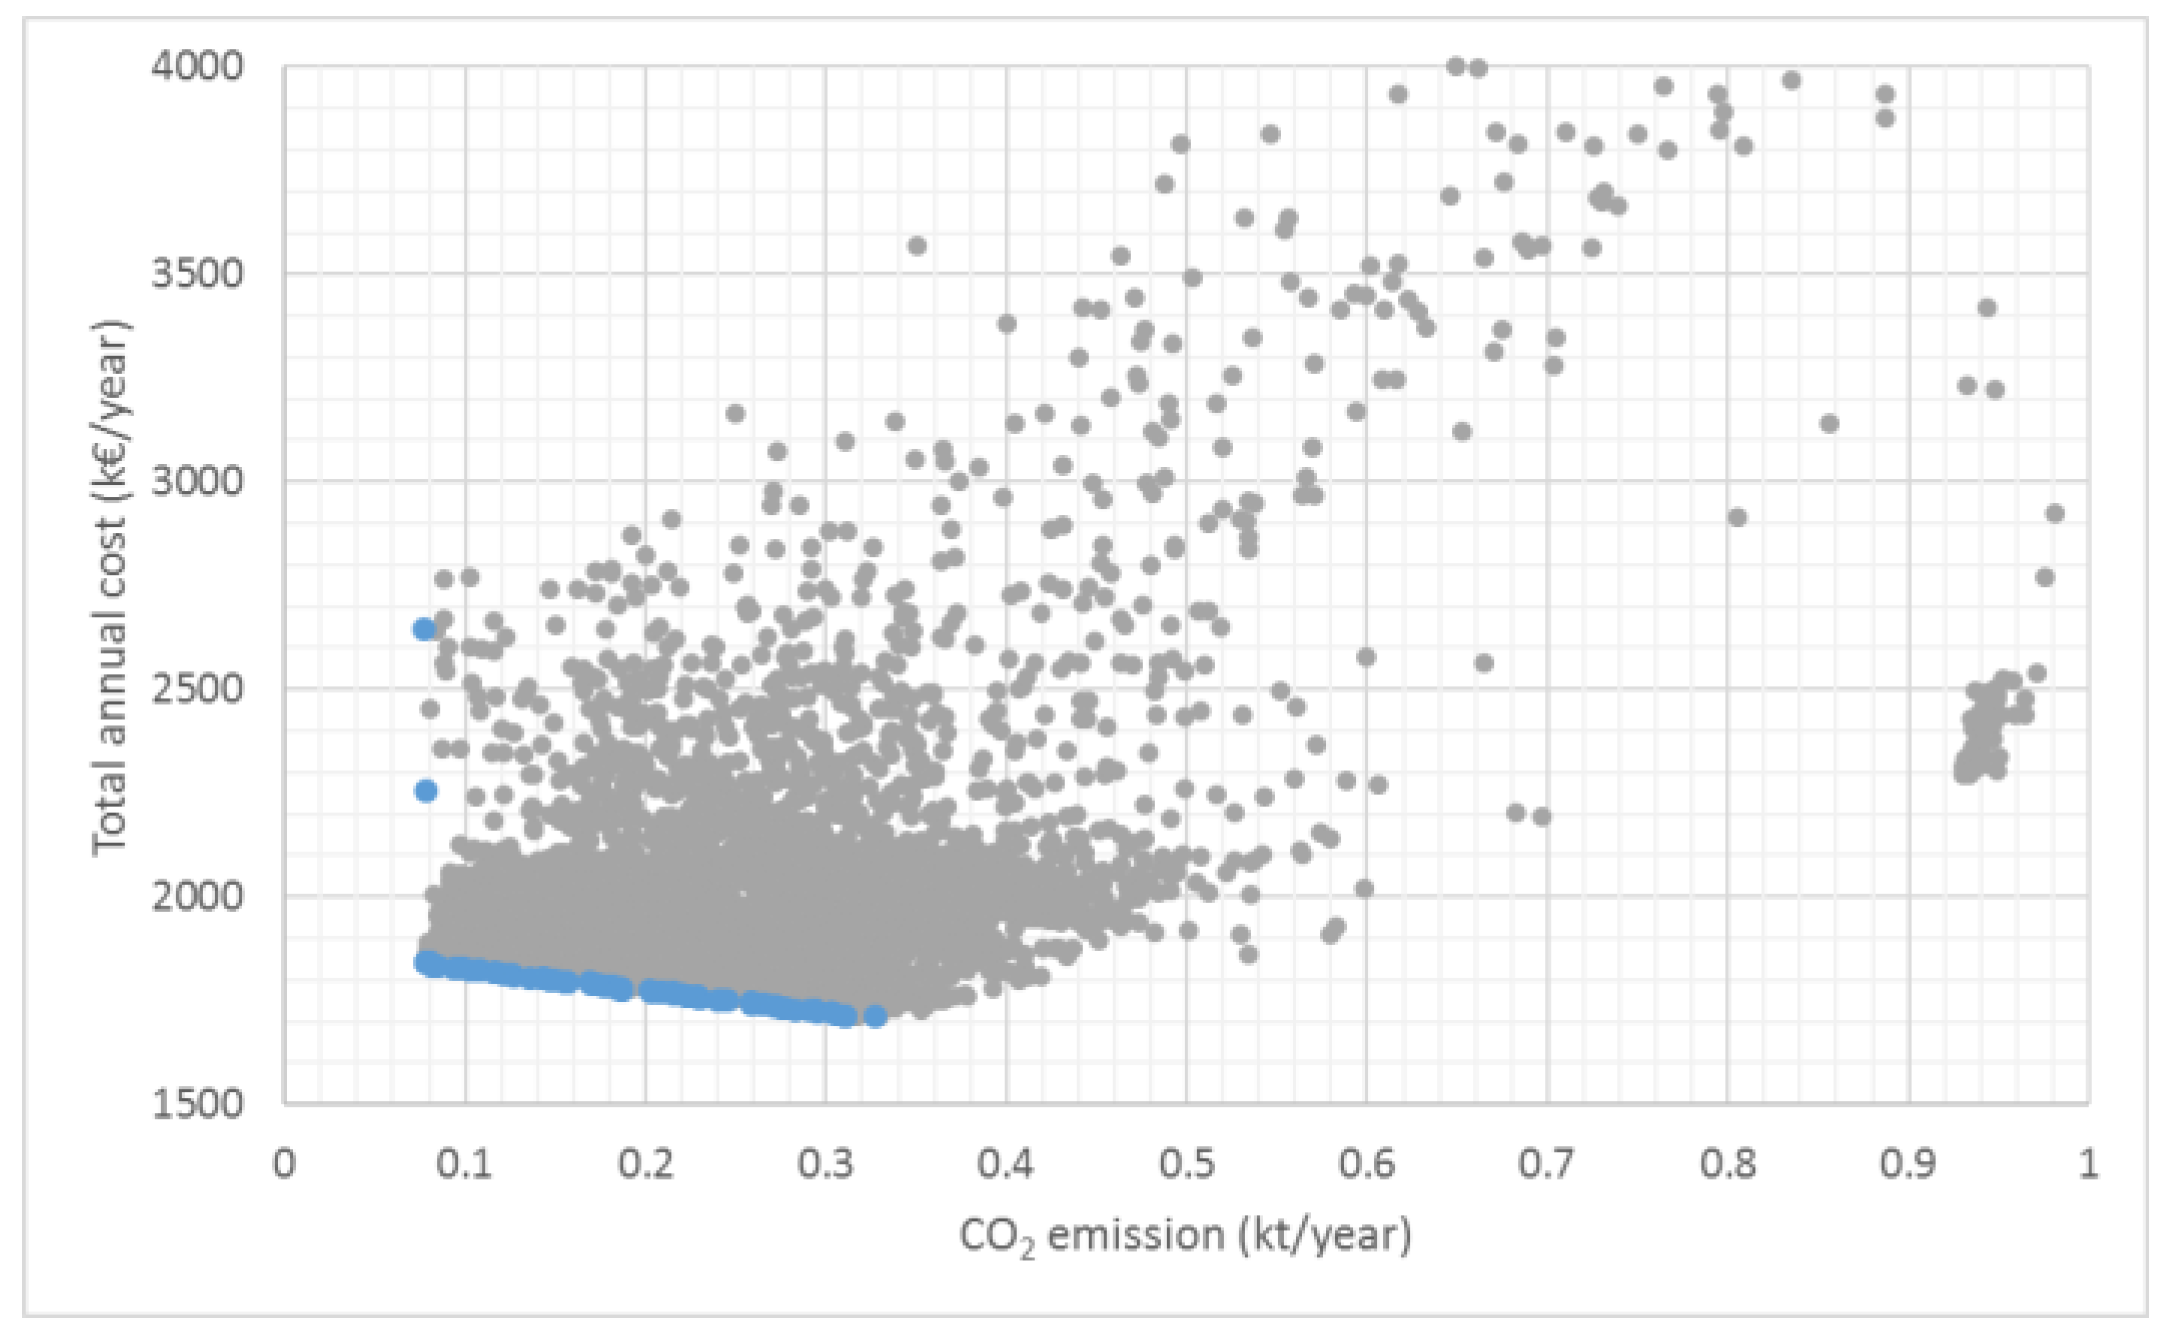
- For values higher than 0.44 kt/year, the algorithm does not identify a contradiction between CO2 emission reduction and the total annual cost reduction, this means that it is possible to decarbonize and reduce costs at the same time (no conflicting objectives). This point (0.44 kt/year) represents the less costly scenario for the Santa Chiara district.
- EnergyPLAN + MOEA is not able to find solutions for the complete decarbonization of the Santa Chiara district due to a lack of RES both at the district level (limited roof surface to install solar systems) and at the external grid level (electrical import is characterized in 2024 by a partial use of RES).
- From the point 0.44 kt/year (1806 thousand EUR/year), the slope of the Pareto front is more or less constant until the very final part, with CO2 emissions at 0.2 kt/year (2005 thousand EUR/year), where there is an increase in the slope due to the introduction of more costly decarbonization solutions; in the first part, there is a large reduction of 55% of CO2 emissions with a modest increase of 11% of the total annual cost (the slope is 829 thousand EUR/kt).
- The Pareto front is lower, more to the left, and less steep (524 thousand EUR/kt) because by 2050, the key technologies for the energy transition (PV, HP, and BEV) are cheaper and more efficient (see Supplementary Material A), and there are other favorable factors such as less heating demand and higher RES share in electricity imports (see Supplementary Material A).
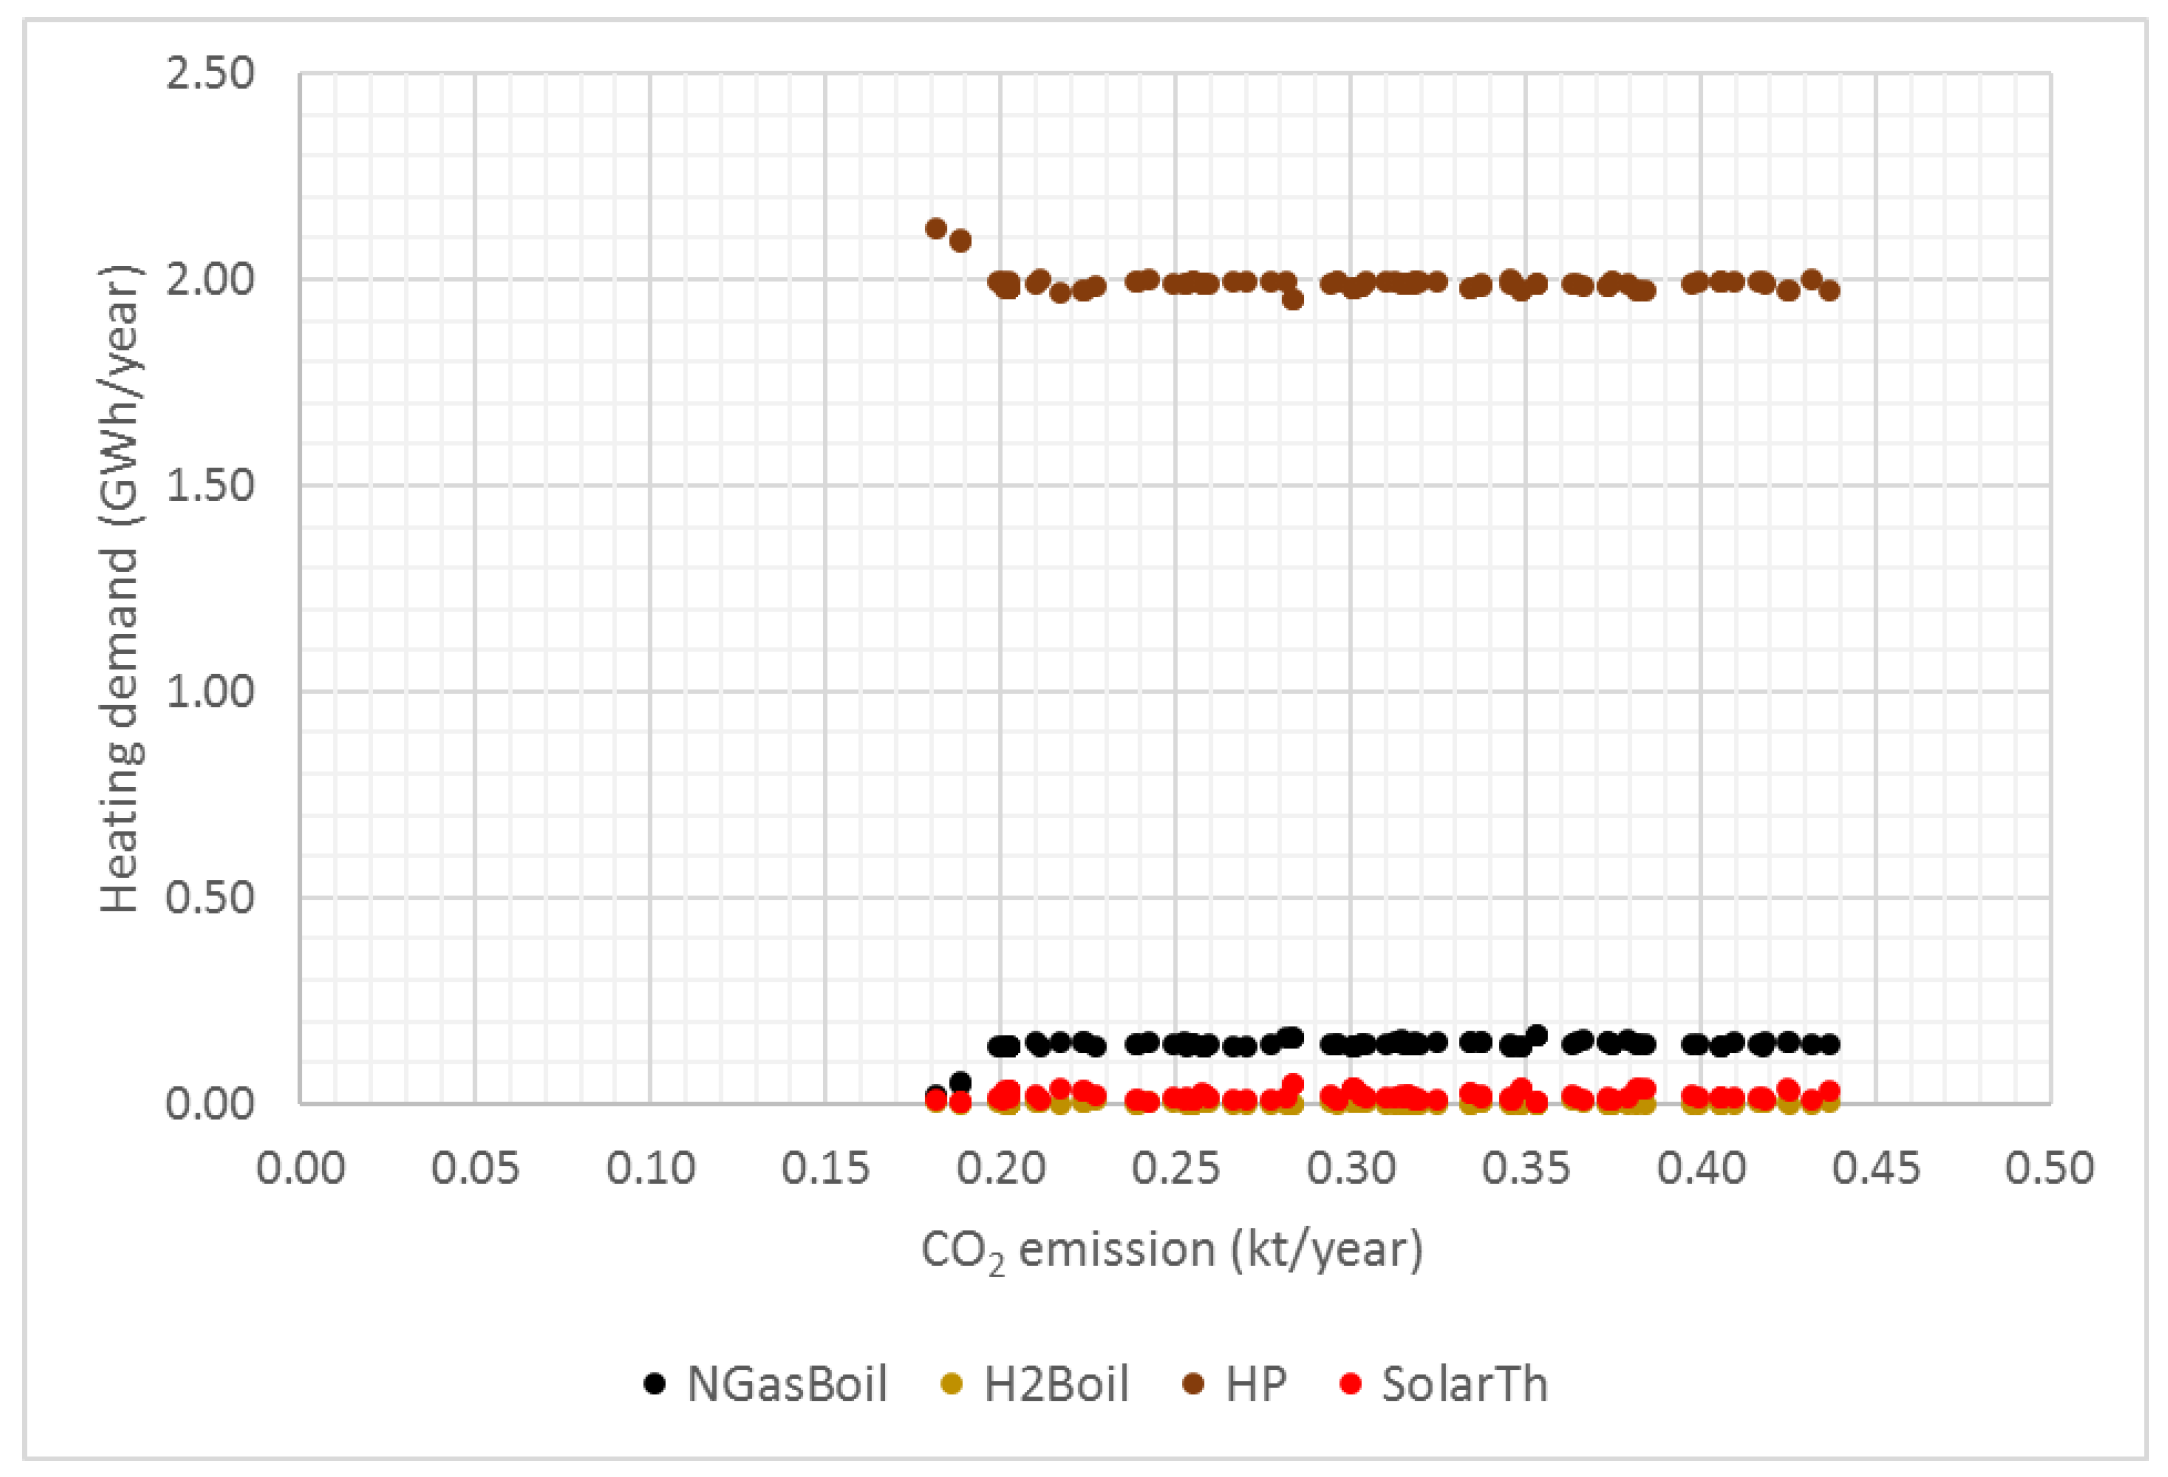
- In the heating sector, decarbonization takes place only through heat pumps; this is thanks to the lower demand for heating, cheaper/more efficient HP (see Supplementary Material A), better combination with cooling, greater production of local PV, and higher RES share in less costly electricity imports (see Supplementary Material A).
- In the transport sector, the full replacement of ICEVs with BEVs is confirmed but more shifted to the left due to cheaper/more efficient BEVs (see Supplementary Material A), greater production of local PV, and a higher RES share in less costly electricity imports.
- In the electricity sector, the behavior is similar but with more local PV production (maximized), less electricity import, and more electricity export; the use of electric storage solutions (in the form of batteries or P2P) is not seen as attractive in reducing CO2 emissions.
3.2.2. EnergyPLAN + MOEA 2024–2050: “S2: All Sectors and NO EC Incentive”
- The Pareto front is very similar although slightly more steep (868 thousand EUR/kt), higher, and longer on the right due to the absence of the EC incentive.
- The absence of the EC incentive also determines a lower attractiveness for the PV which is not always maximized clearly as in S1 2024 but is sometimes partially preferred to a greater import and a lower export.
- The other technological choices in the heating, transport, and electricity sectors are practically the same as in the S1 2024 scenario.
3.2.3. EnergyPLAN + MOEA 2024–2050: “S3: NO Transport and EC Incentive”
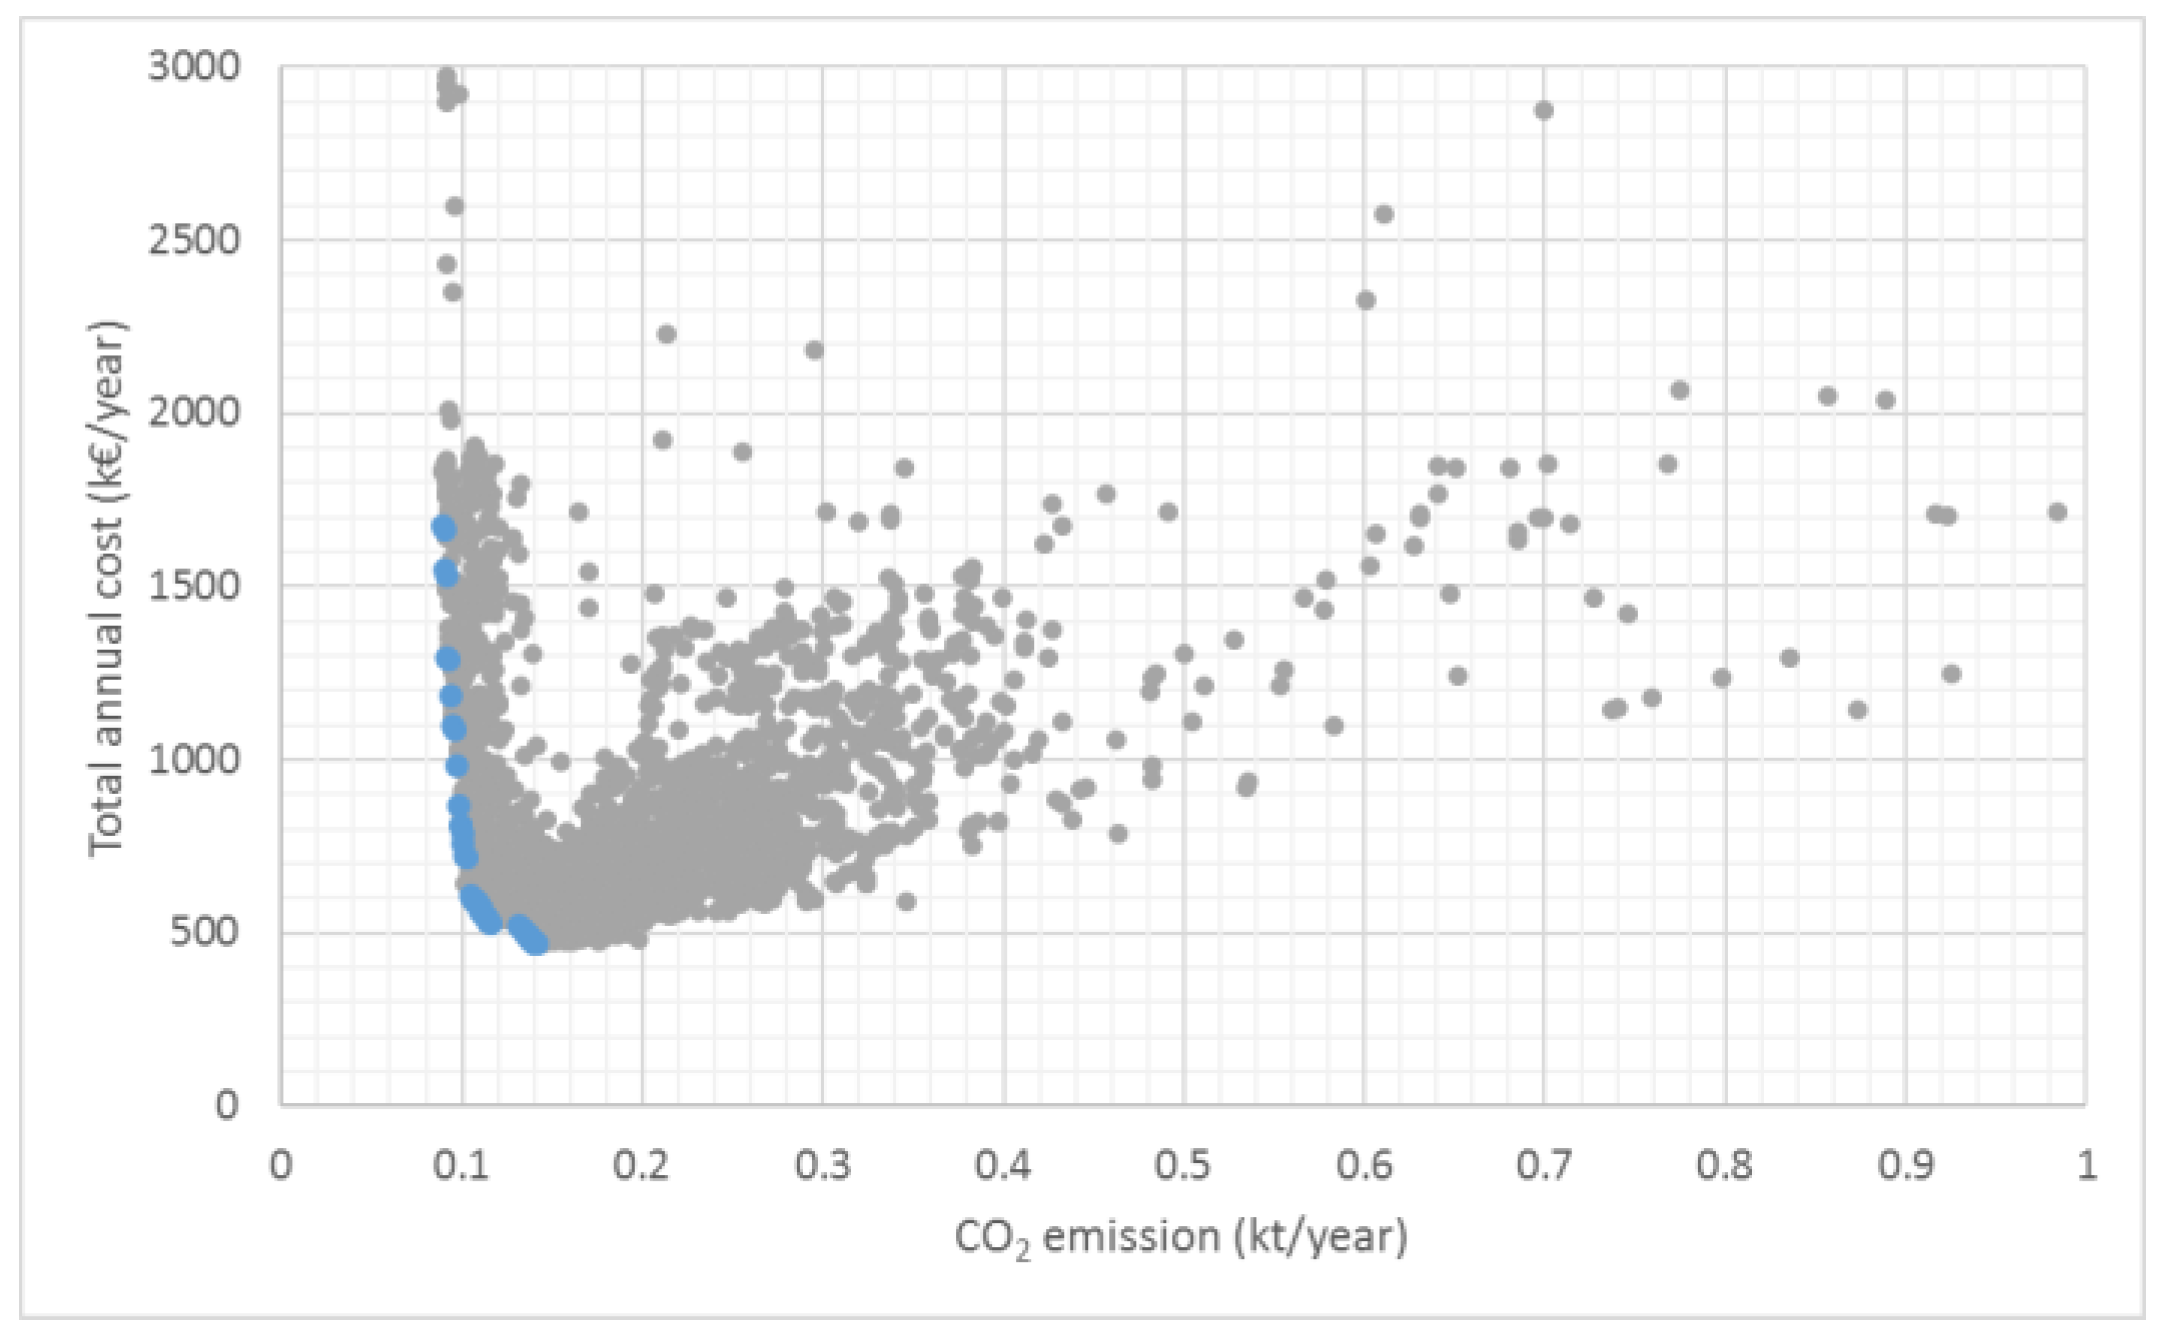
- The Pareto front is much lower and to the left because it does not include the transport sector; the shape is very different from subvertical to vertical and moving from the point 0.14 kt/year (470 thousand EUR/year) to the point 0.09 kt/year (1675 thousand EUR/year), there is a small reduction of 36% of CO2 emissions with a large increase of 256% of the total annual cost (the slope is 24100 thousand EUR/kt).
- In the heating sector, decarbonization takes place through heat pumps that only in the first part are combined with a small amount of natural gas boilers.
- In the electricity sector, there is a significant difference due to the increasing integration of batteries to store local PV production (always maximized) and reduce electricity imports (composed of a mix of RES and non-RES): this is a technological approach which implies energy losses in the charge and discharge cycle and above all is very expensive (due to high CAPEX), determining the vertical shape of the Pareto front. Along the Pareto front, the use of batteries is in the range of 0–0.22 GWh/year (of charging). To reach the point of 0.09 kt/year, it is necessary to install a battery system of about 900 kWh in capacity and 450 kW in peak power.
- The Pareto front is more to the left because by 2050, the key technologies for the energy transition (PV and HP) are cheaper and more efficient, and there are other favorable factors such as less heating demand and higher RES share in electricity imports.
- The technological choices in the heating and electricity sectors are practically the same as in the S3 2024 scenario, confirming the impact of heat pumps and batteries on the shape of the Pareto front.
3.2.4. EnergyPLAN + MOEA 2024–2050: “S4: Hydrogen vs. Fossil Fuels and EC Incentive”
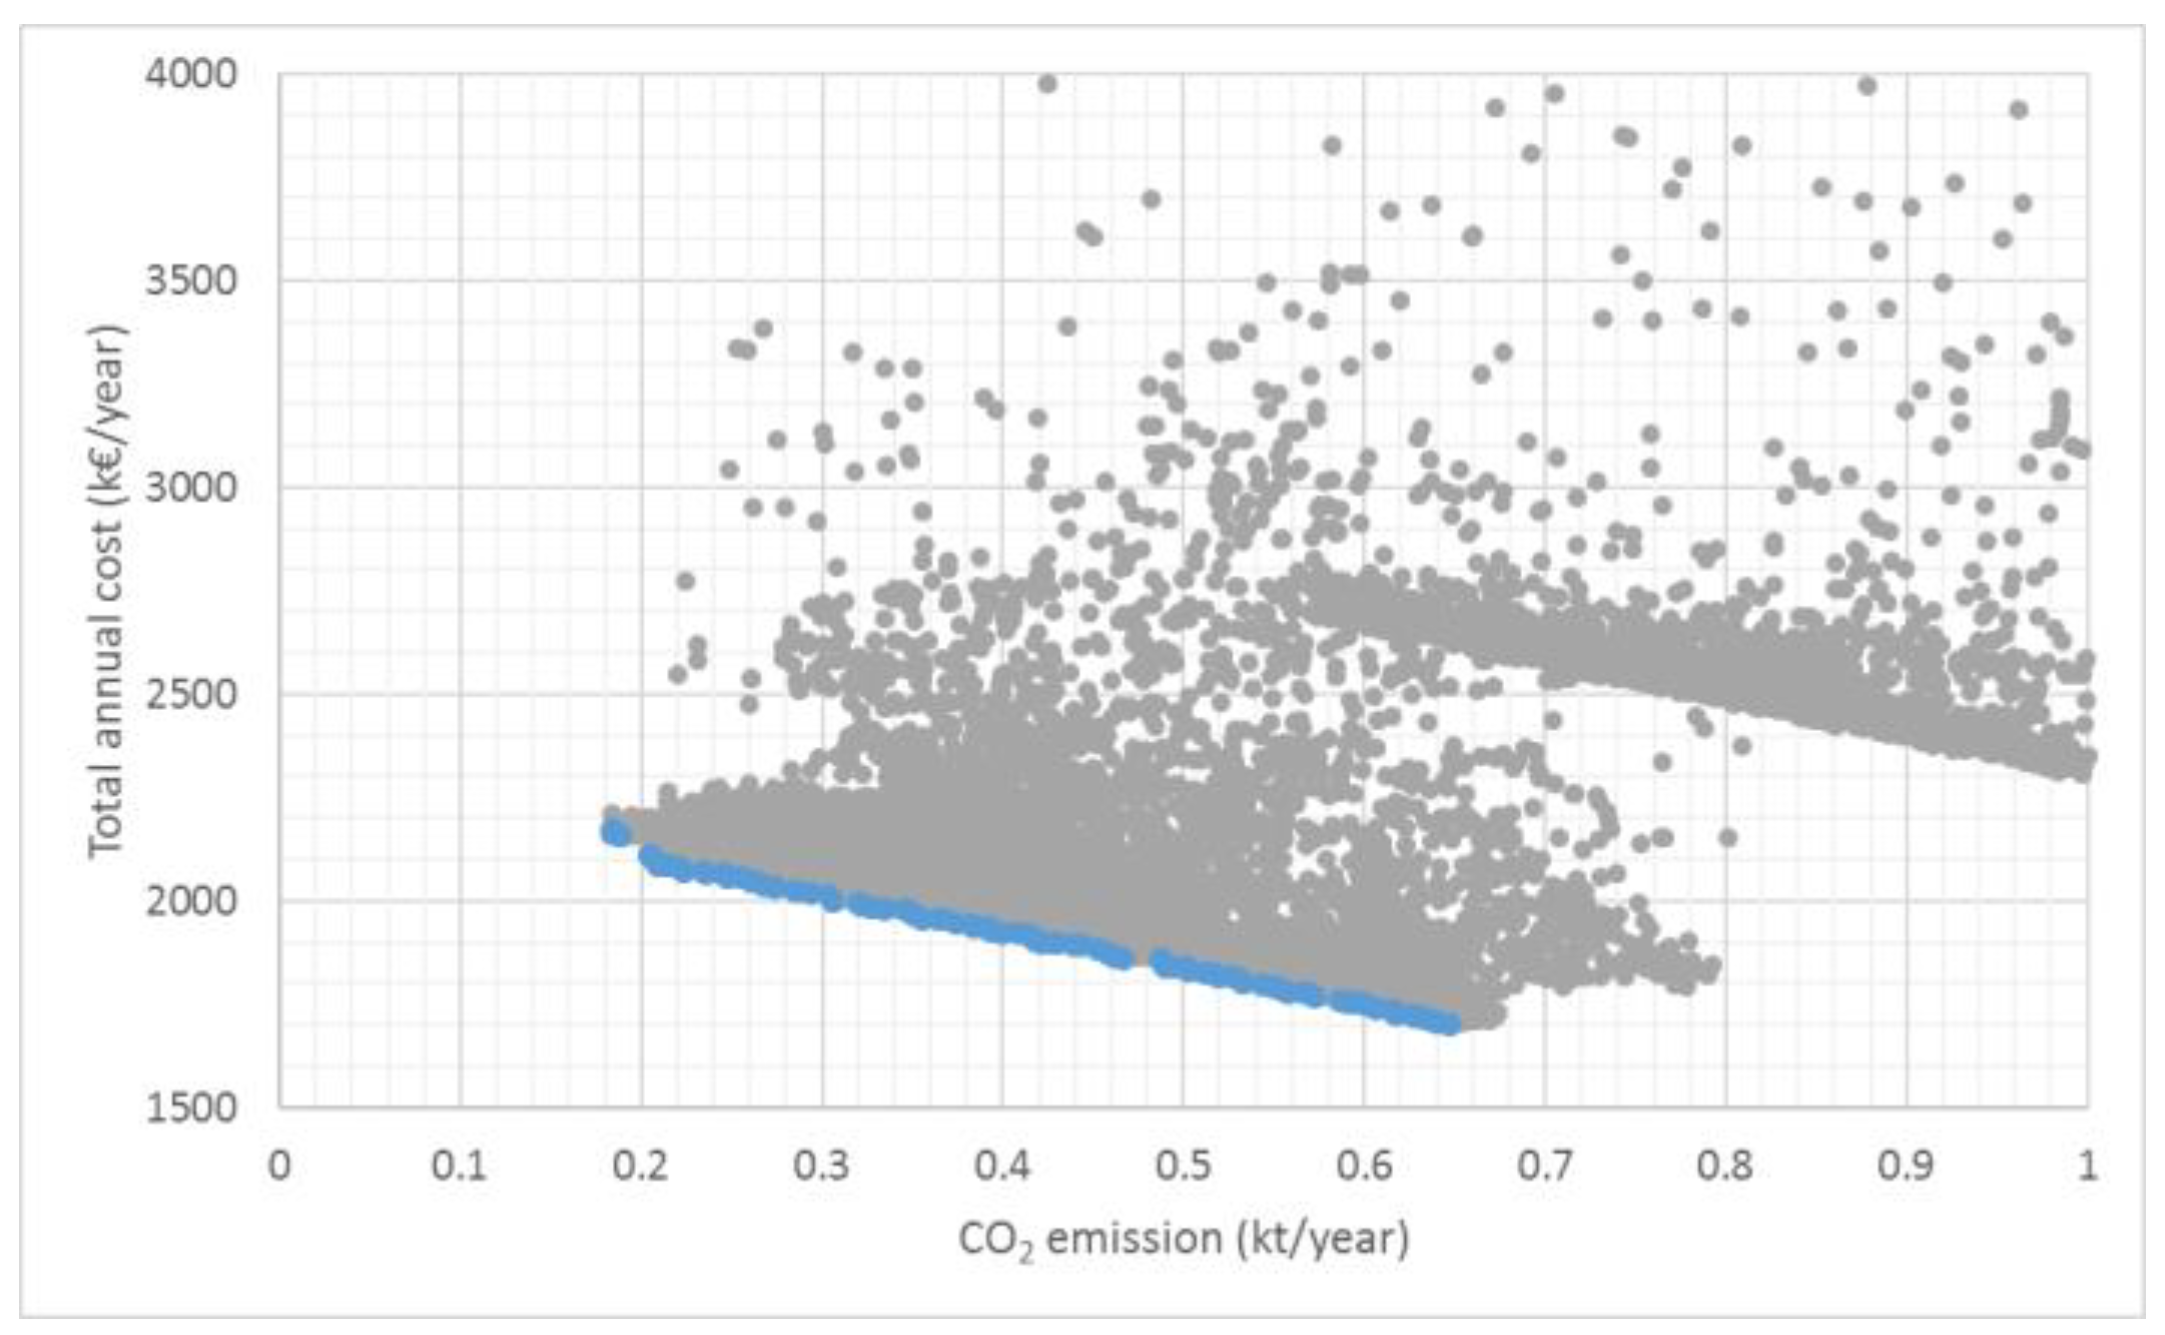
- The Pareto front is higher, to the right, and steeper because this energy transition based only on hydrogen technologies is more costly, less efficient, and with a lower capability to reach high decarbonization based on the limited local RES in the district.
- Two sections with different slopes can be distinguished; from the point 1.03 kt/year (1731 thousand EUR/year), the slope of the Pareto front is more or less constant (2720 thousand EUR/kt) until the CO2 emissions of 0.54 kt/year (3064 thousand EUR/year) where the second part starts with an increased slope (13,225 thousand EUR/kt) due to the introduction of more costly decarbonization solutions (until 0.42 kt/year and 4651 thousand EUR/year).
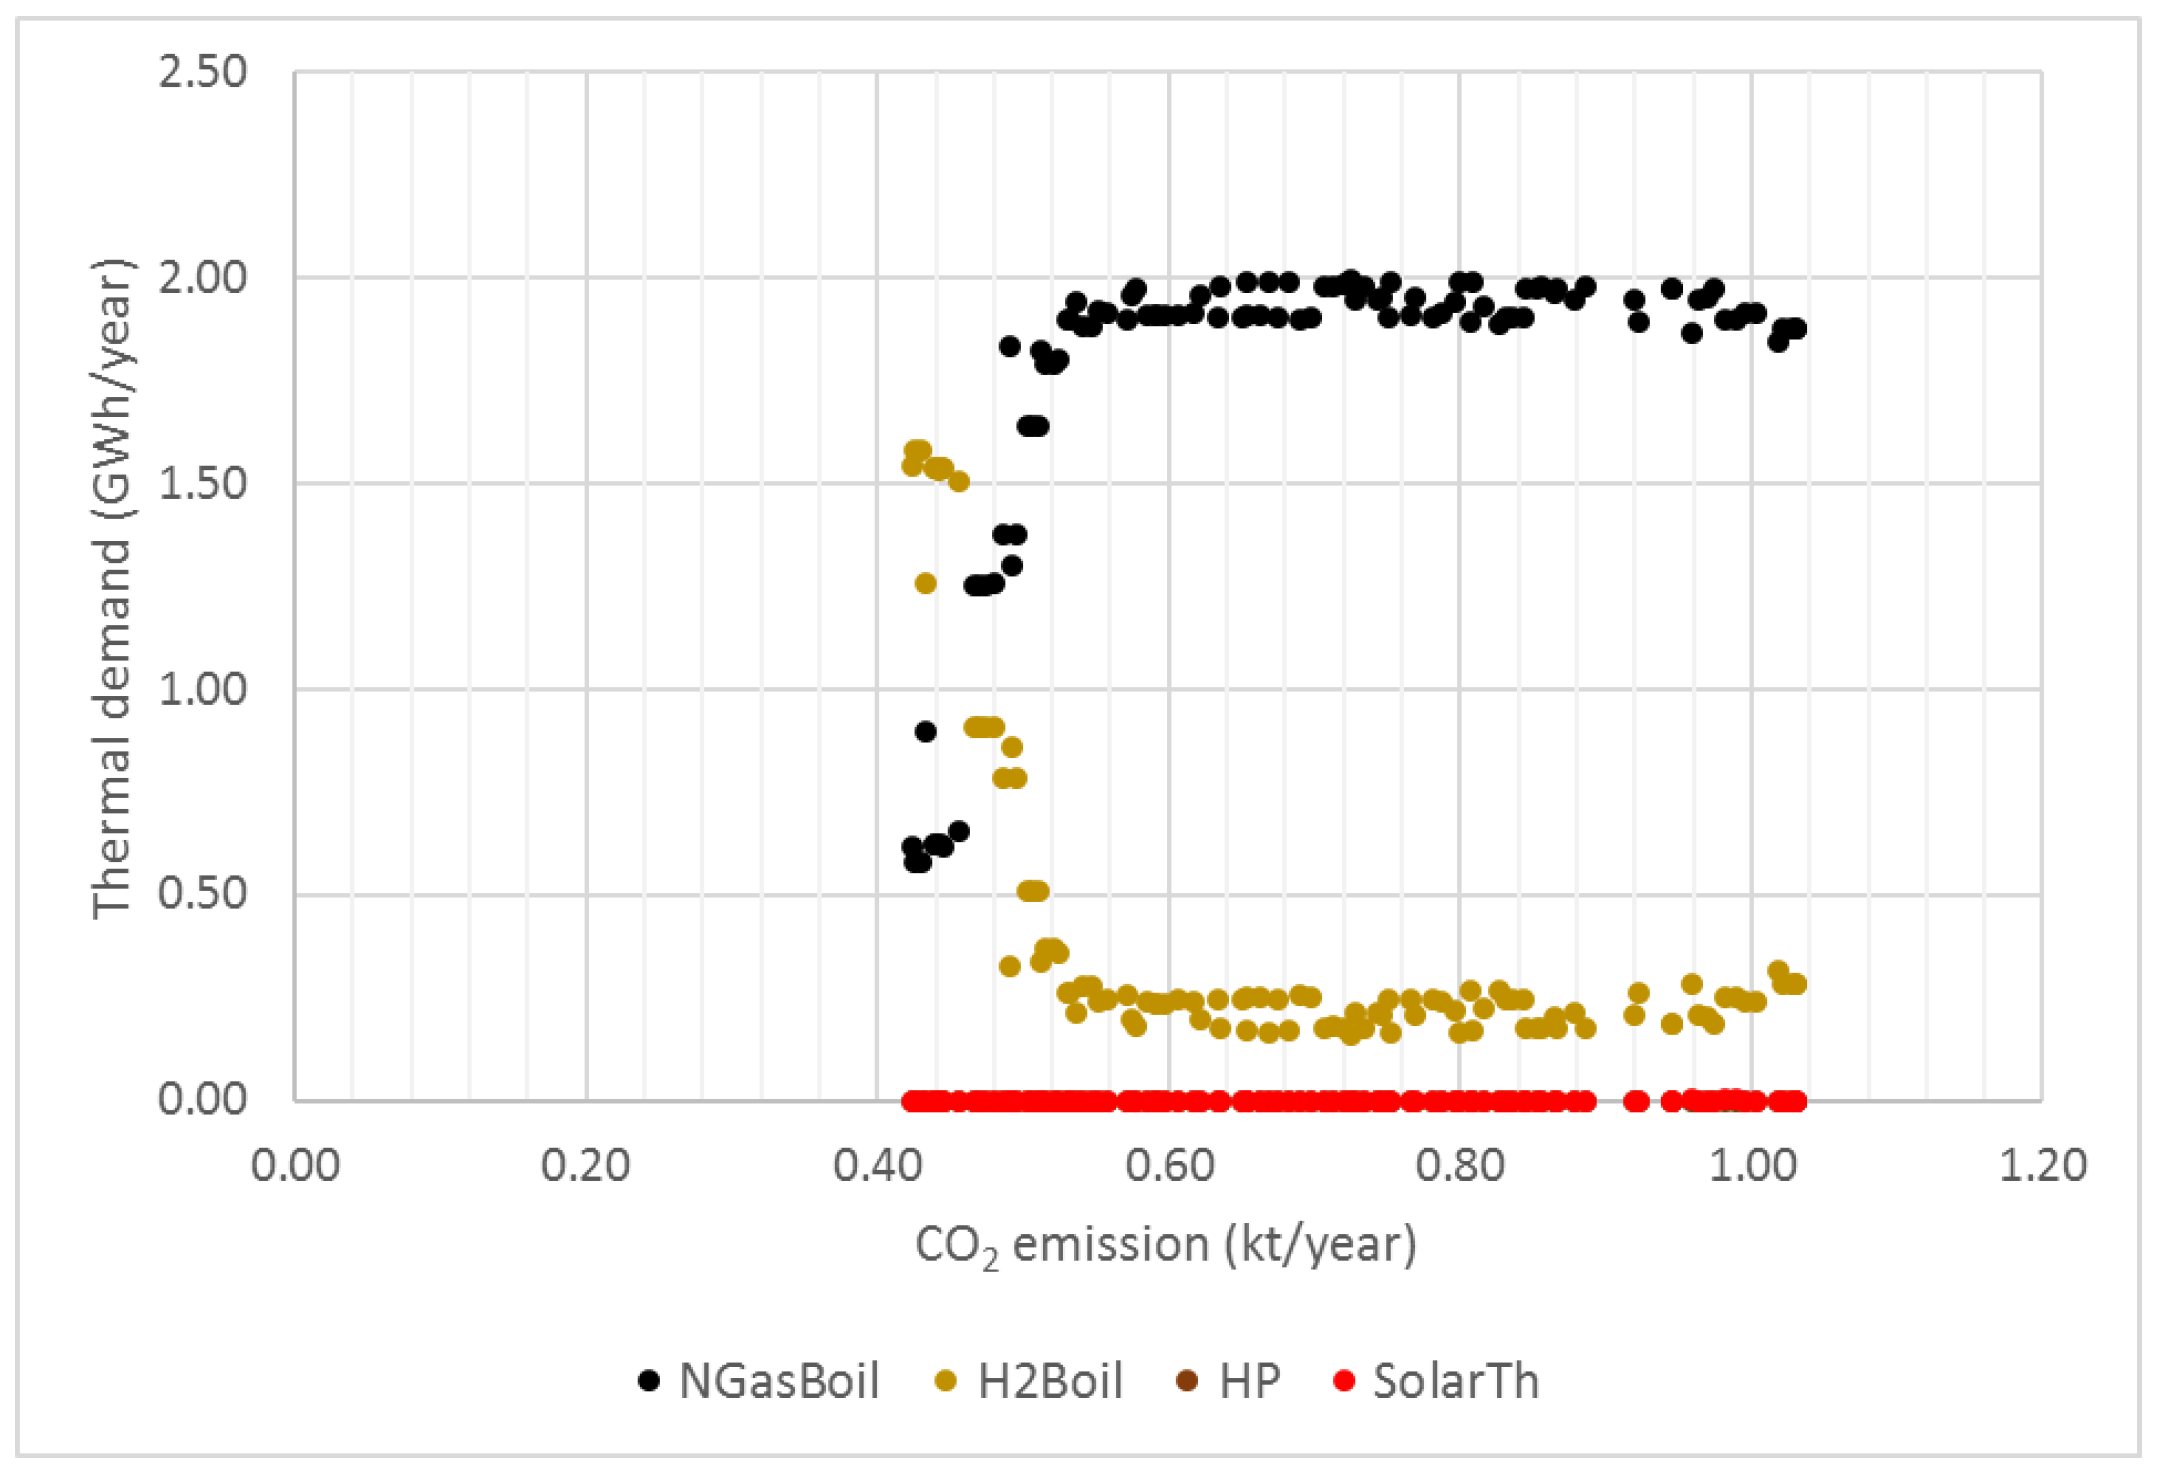
- In the heating sector (Figure 20), decarbonization takes place through H2 boilers that in the first part of the Pareto front are limited and combined with a larger amount of natural gas boilers, while in the second part are increasing and overtaking the fossil fuel solution that, however, does not completely disappear in the leftmost part of the Pareto front (due to a lack of RES both at the district and at external grid levels).
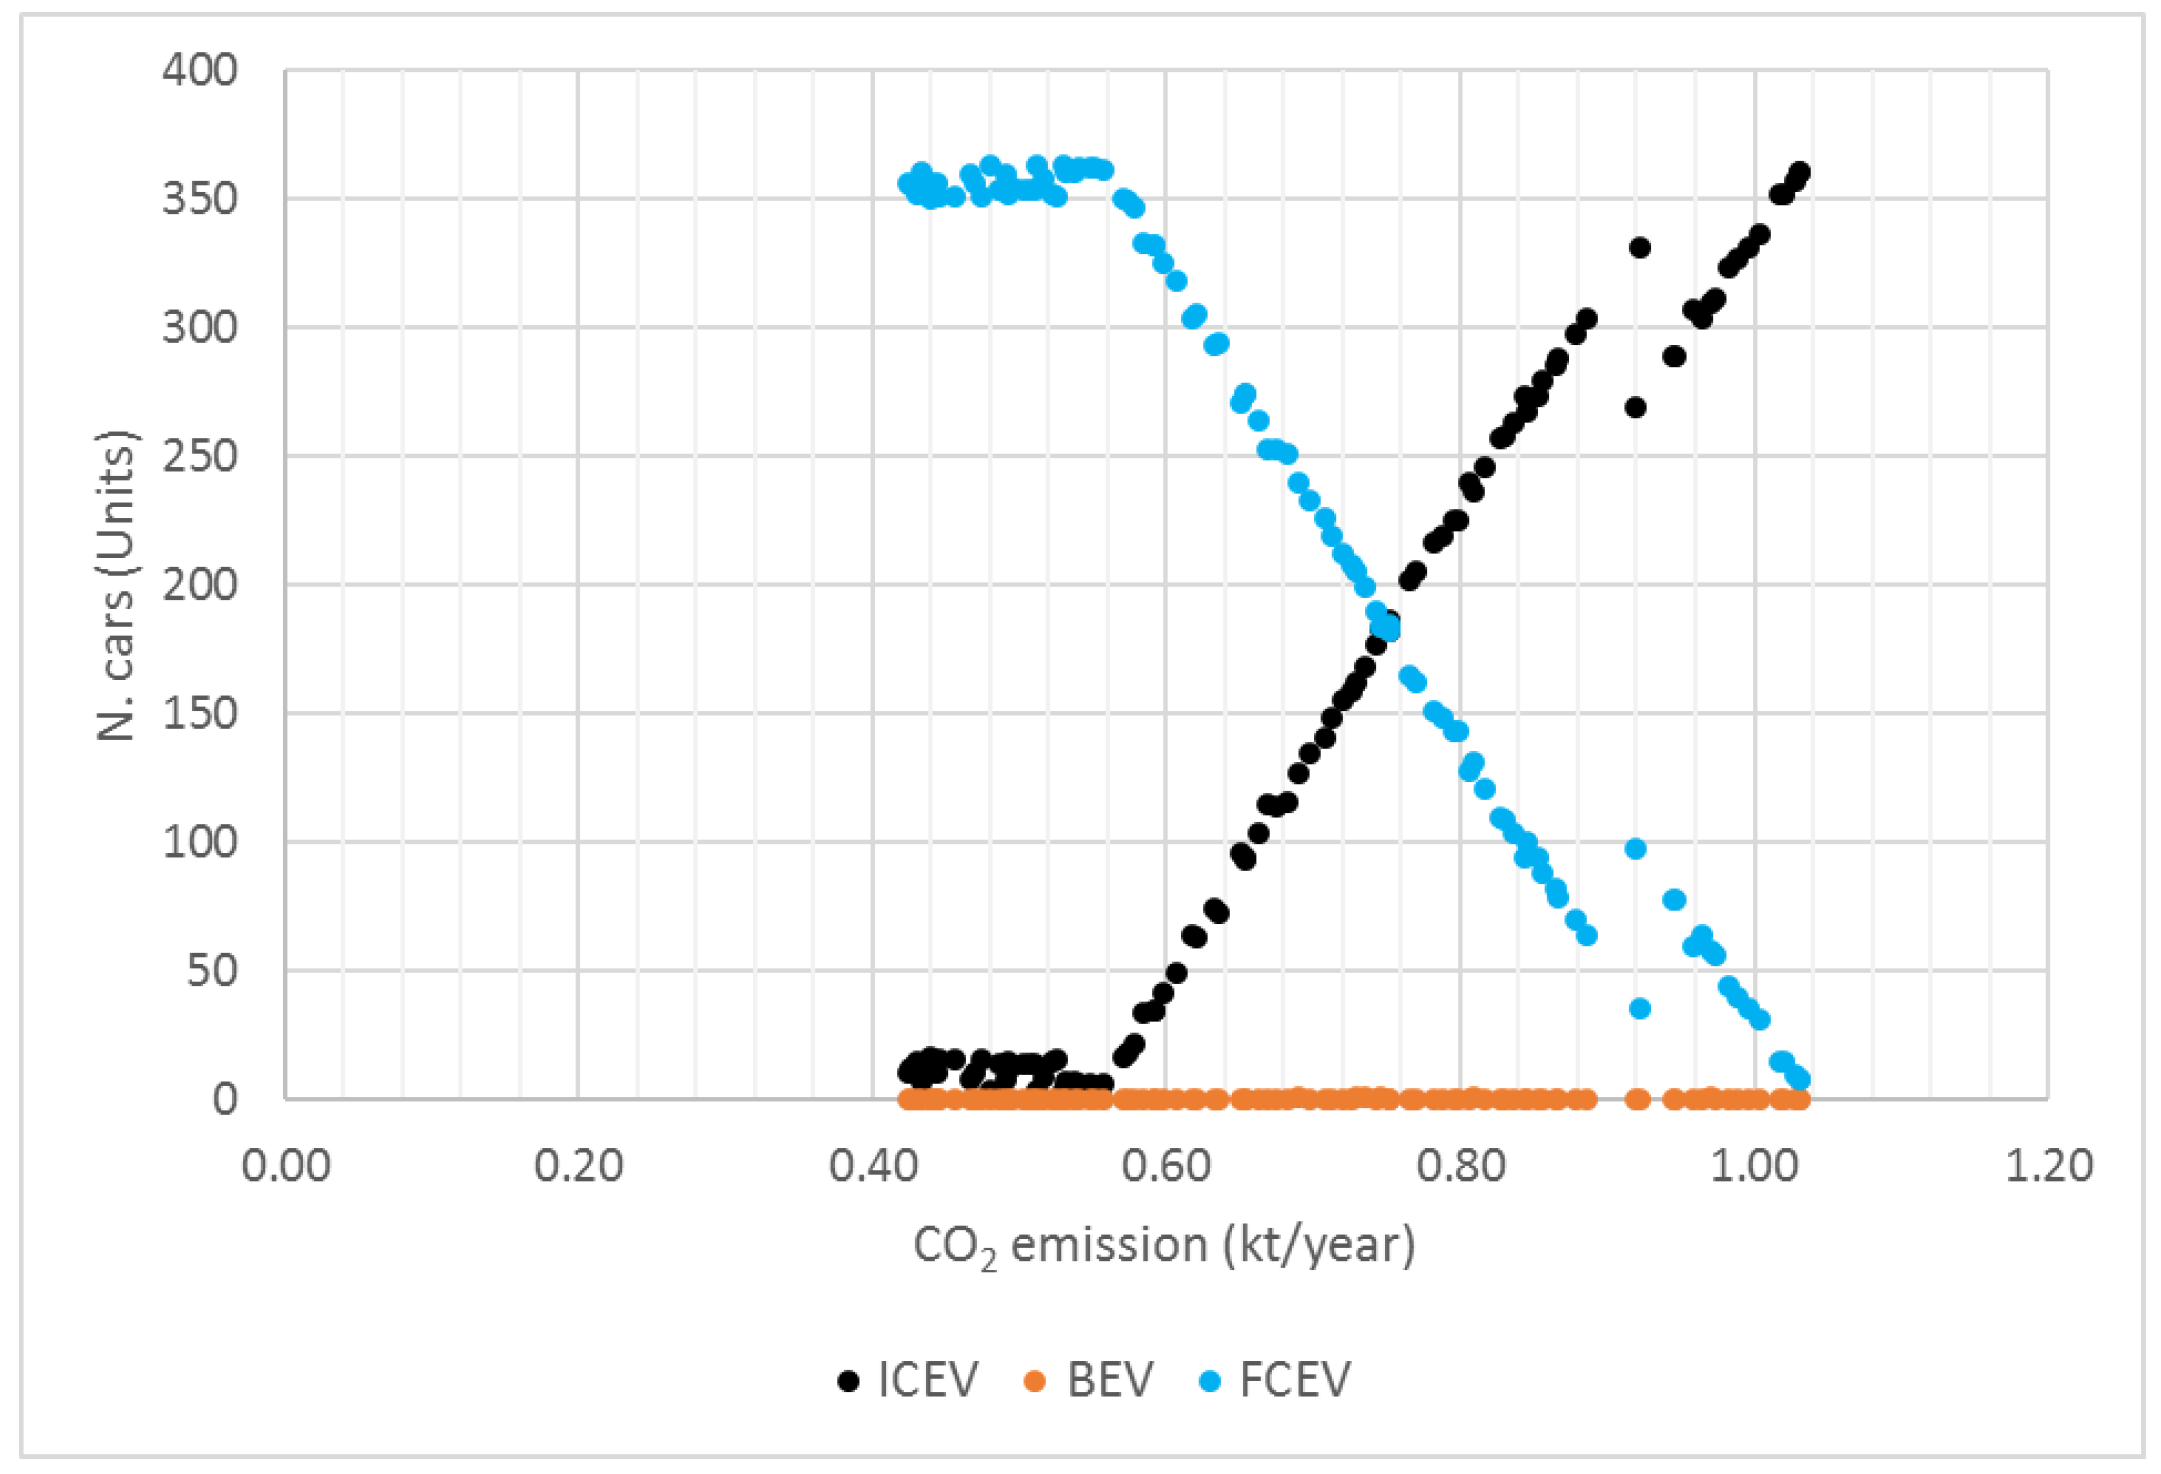
- In the transport sector (Figure 21), the full replacement of ICEVs with FCEVs occurs in the first part of the Pareto front: in this scenario, decarbonization takes place as a priority in the transport sector compared to the thermal sector, and FCEVs are more attractive than H2 boilers, with the exception of the limited quantity of the latter which is present from the far right part of the Pareto front.
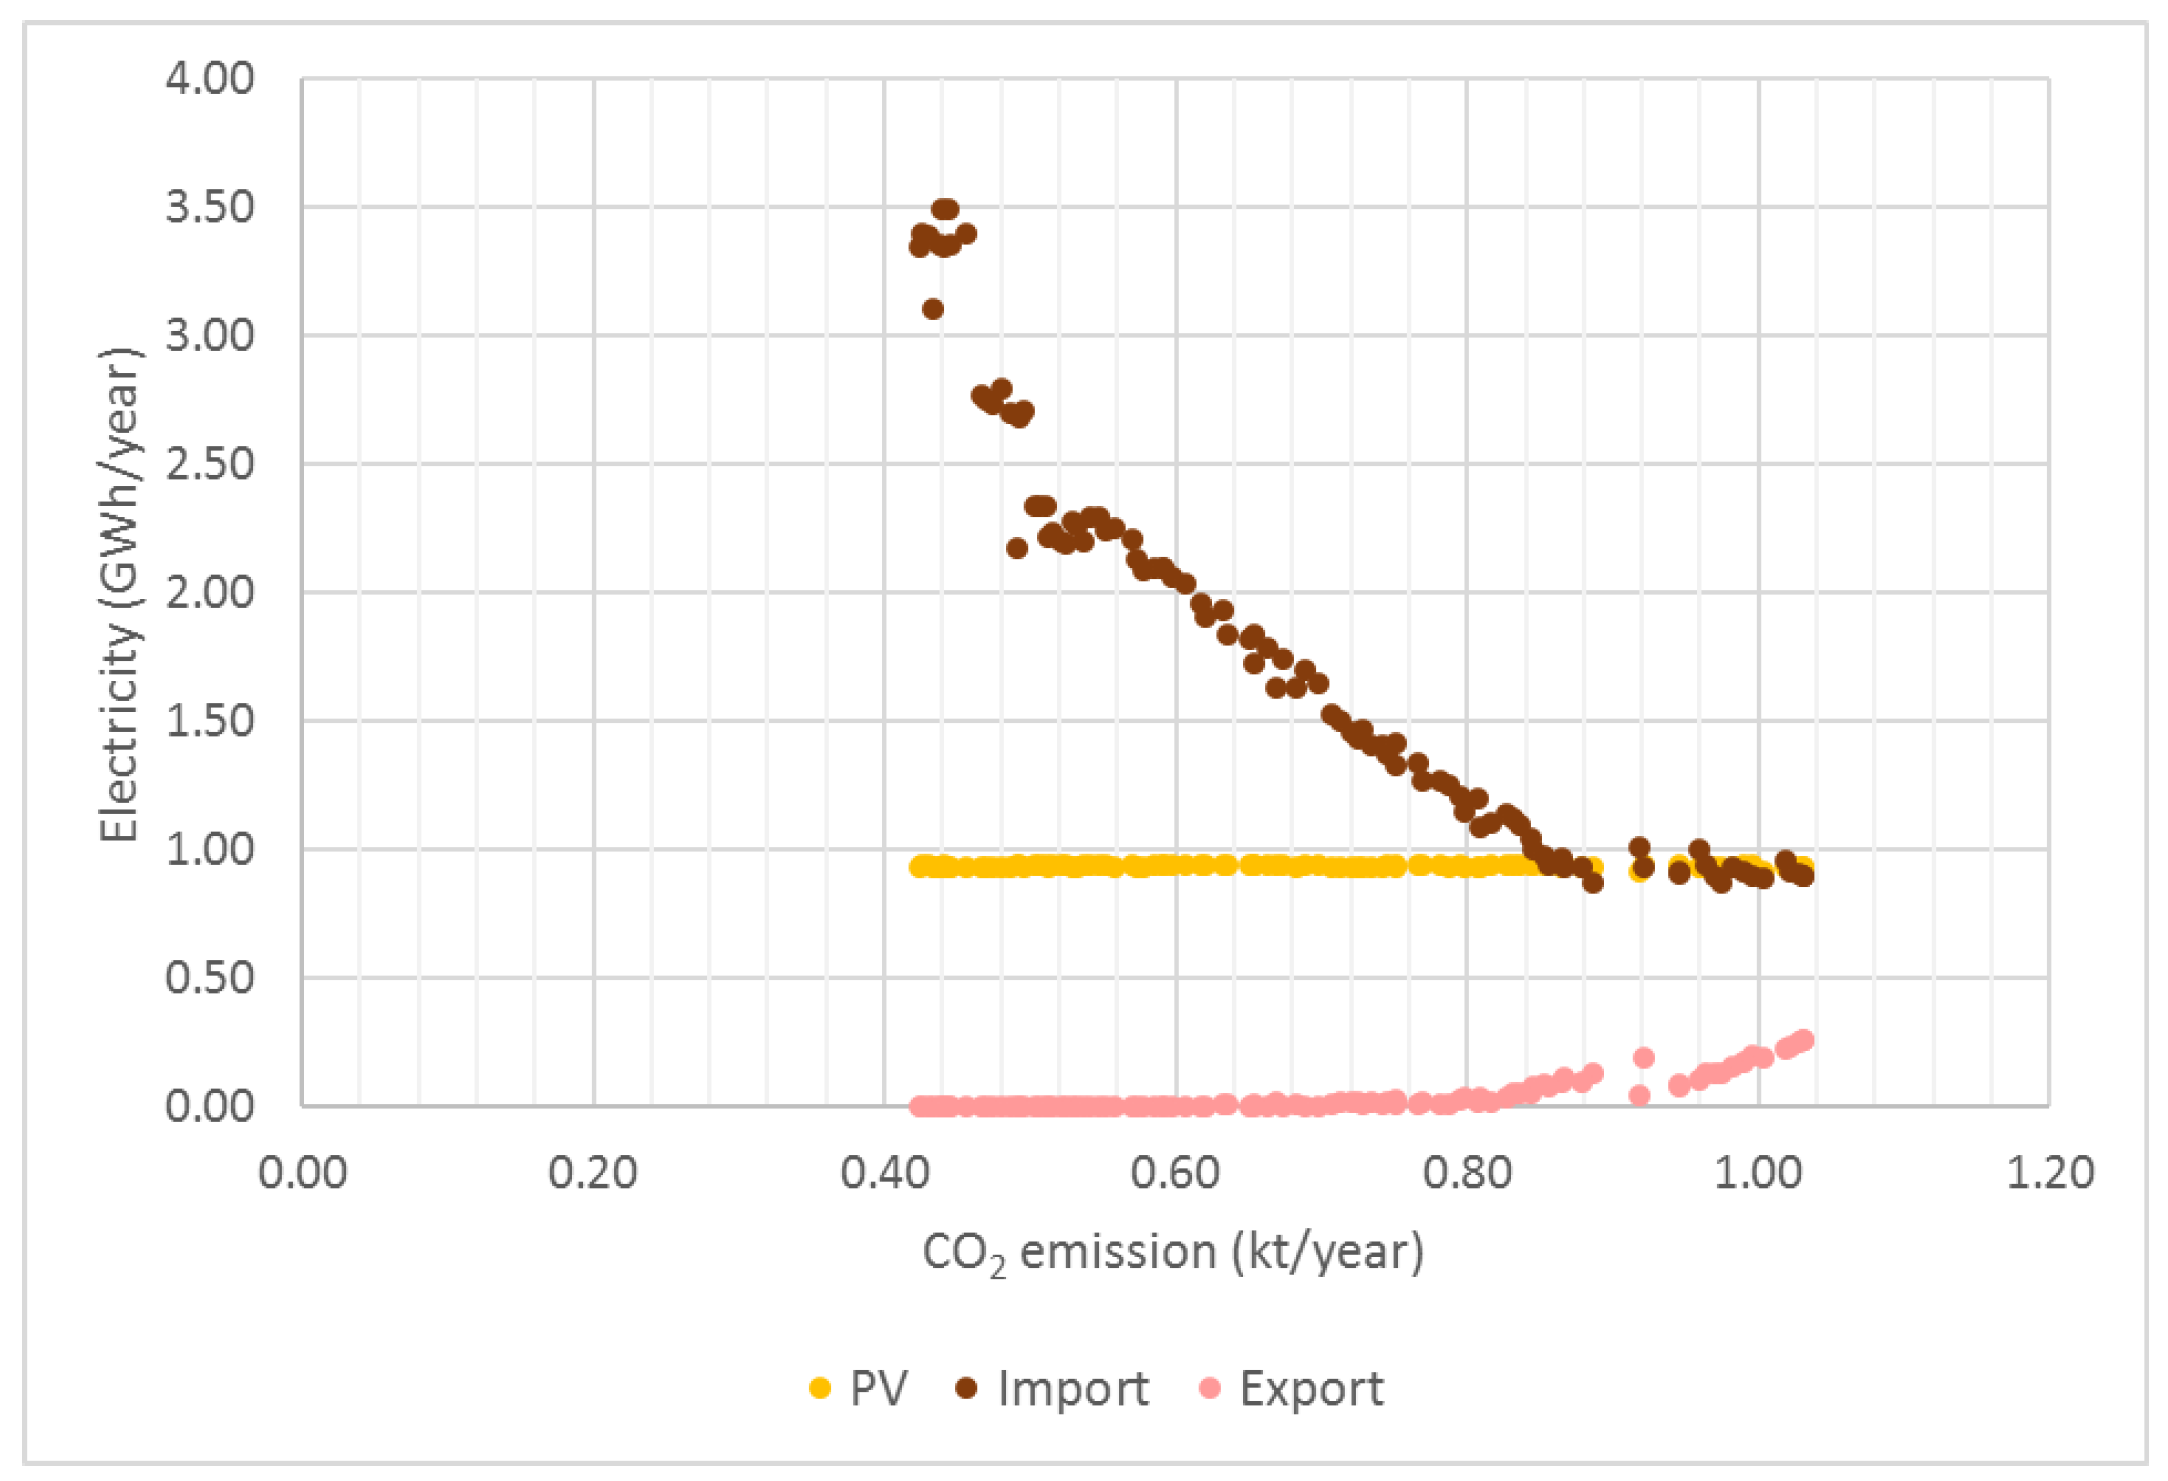
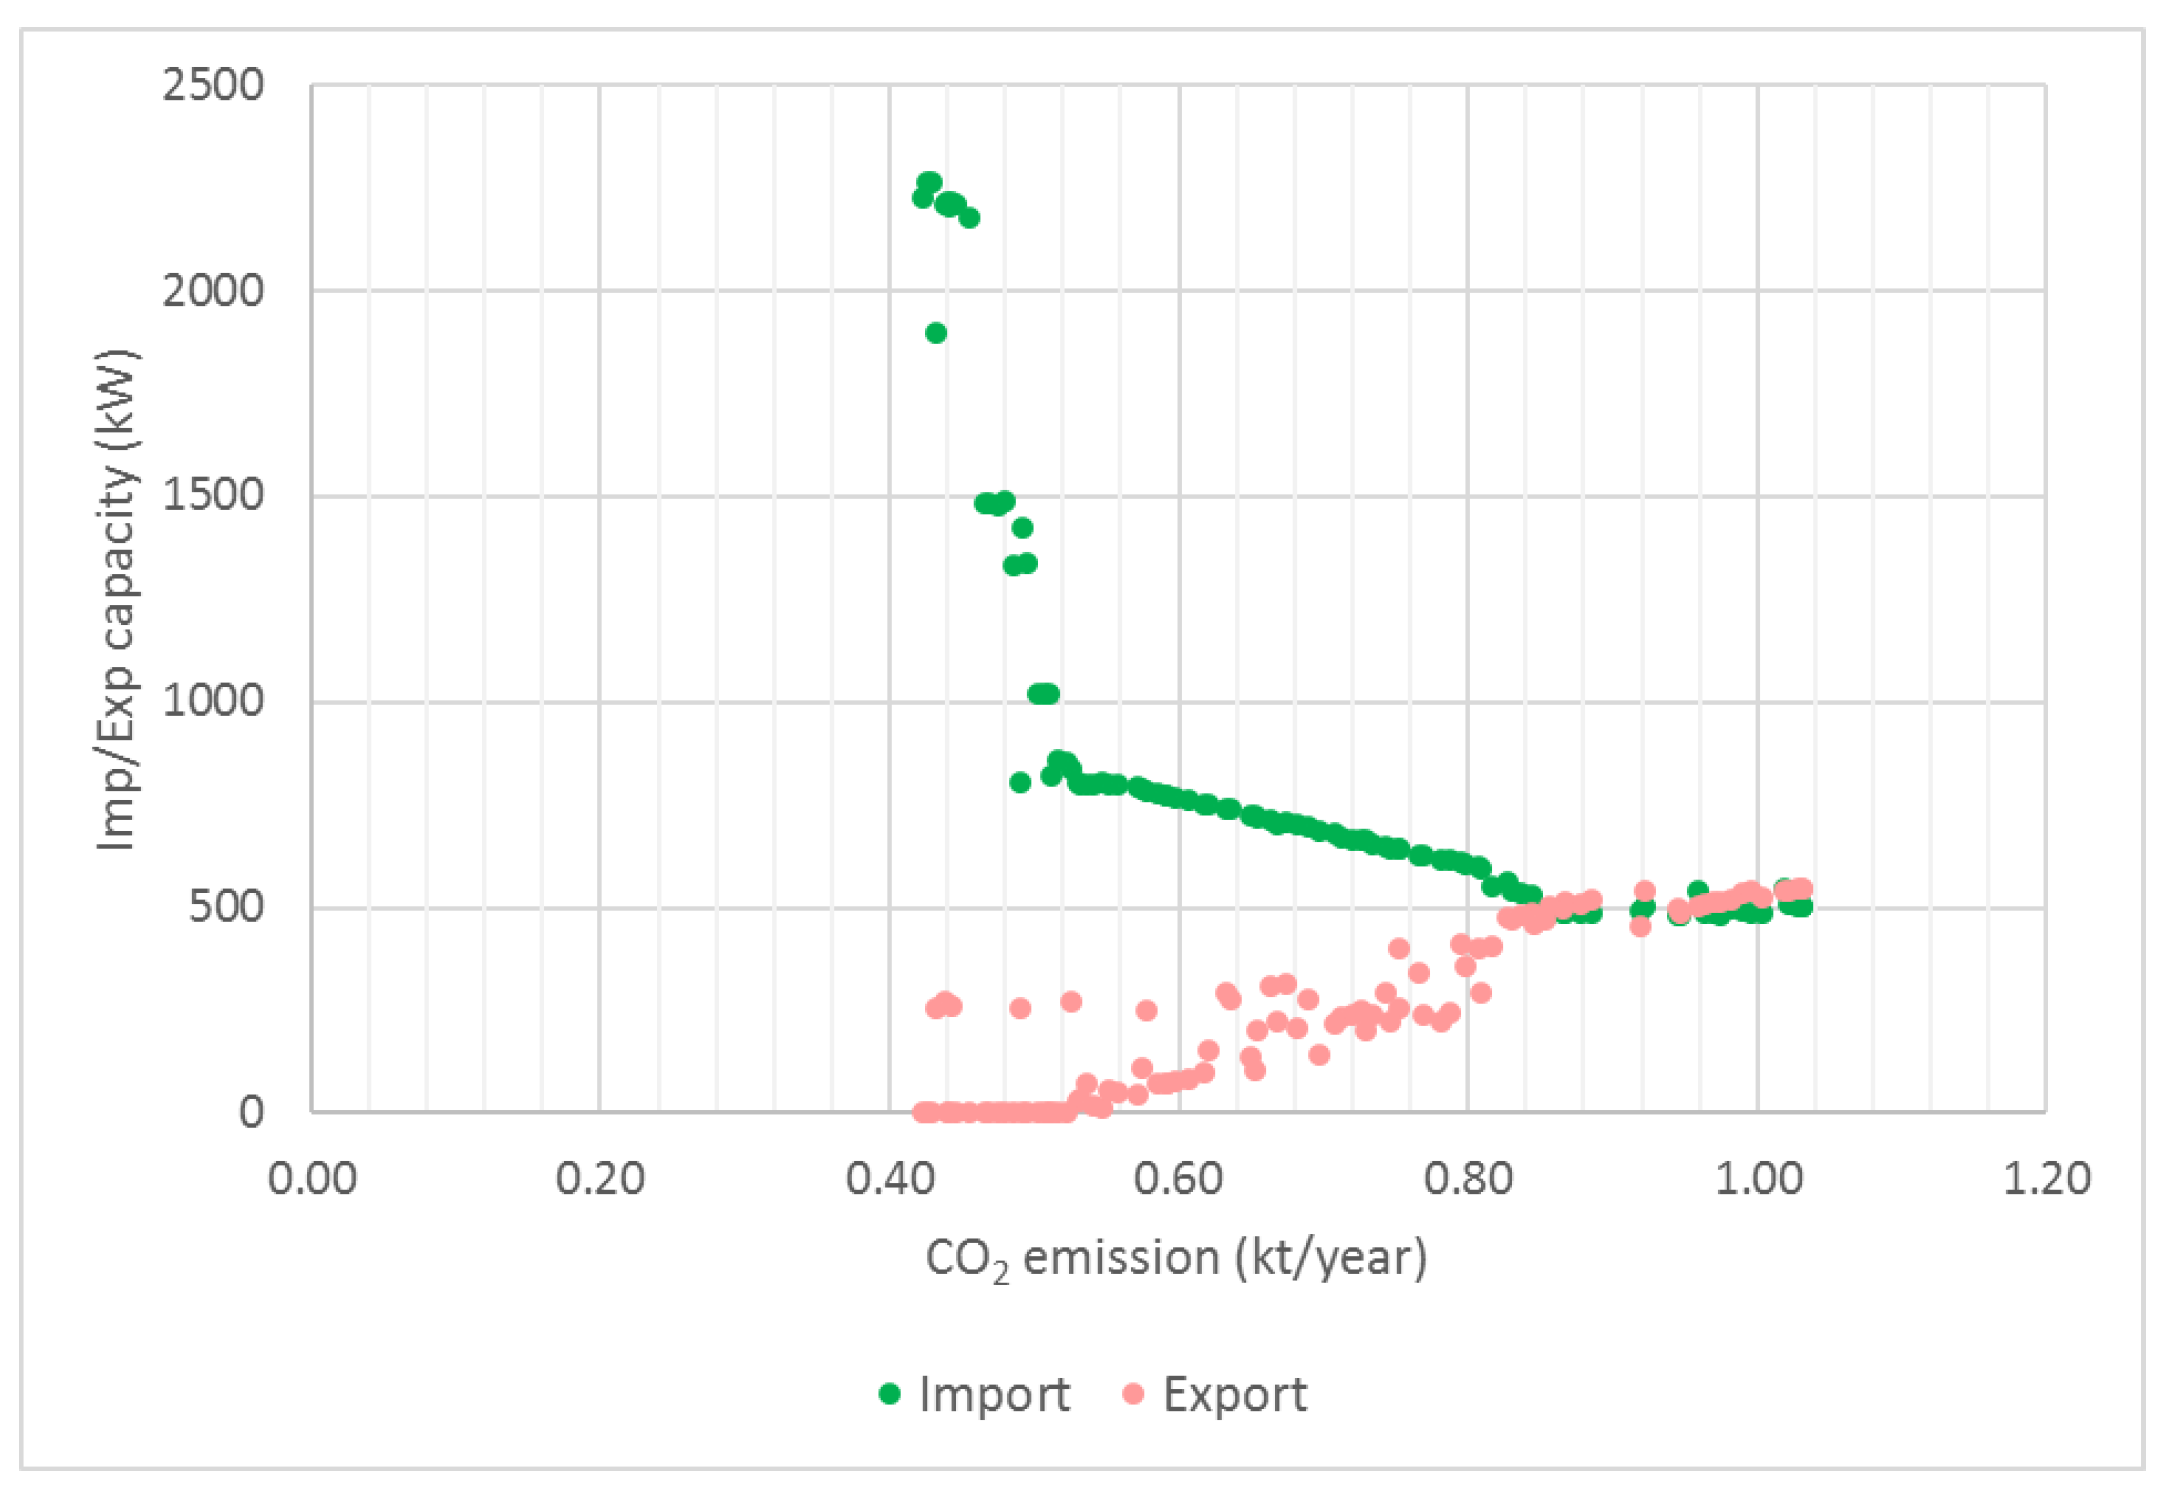
- In the electricity sector (Figure 22), in addition to the always maximized PV, three parts can be distinguished: (I) between 1.03 kt/year and 0.84 kt/year, import is constant and export slightly decreasing up to zero, and this strategy is due to the higher electricity demand to produce H2 and request to reduce CO2 emission; (II) between 0.84 kt/year and 0.54 kt/year, import is increasing rapidly, following the increasing demand of H2 production for FCEV; (III) between 0.54 kt/year and the end of the Pareto front, the slope of the import rise is even stronger due to the quick ascent of H2 boilers.
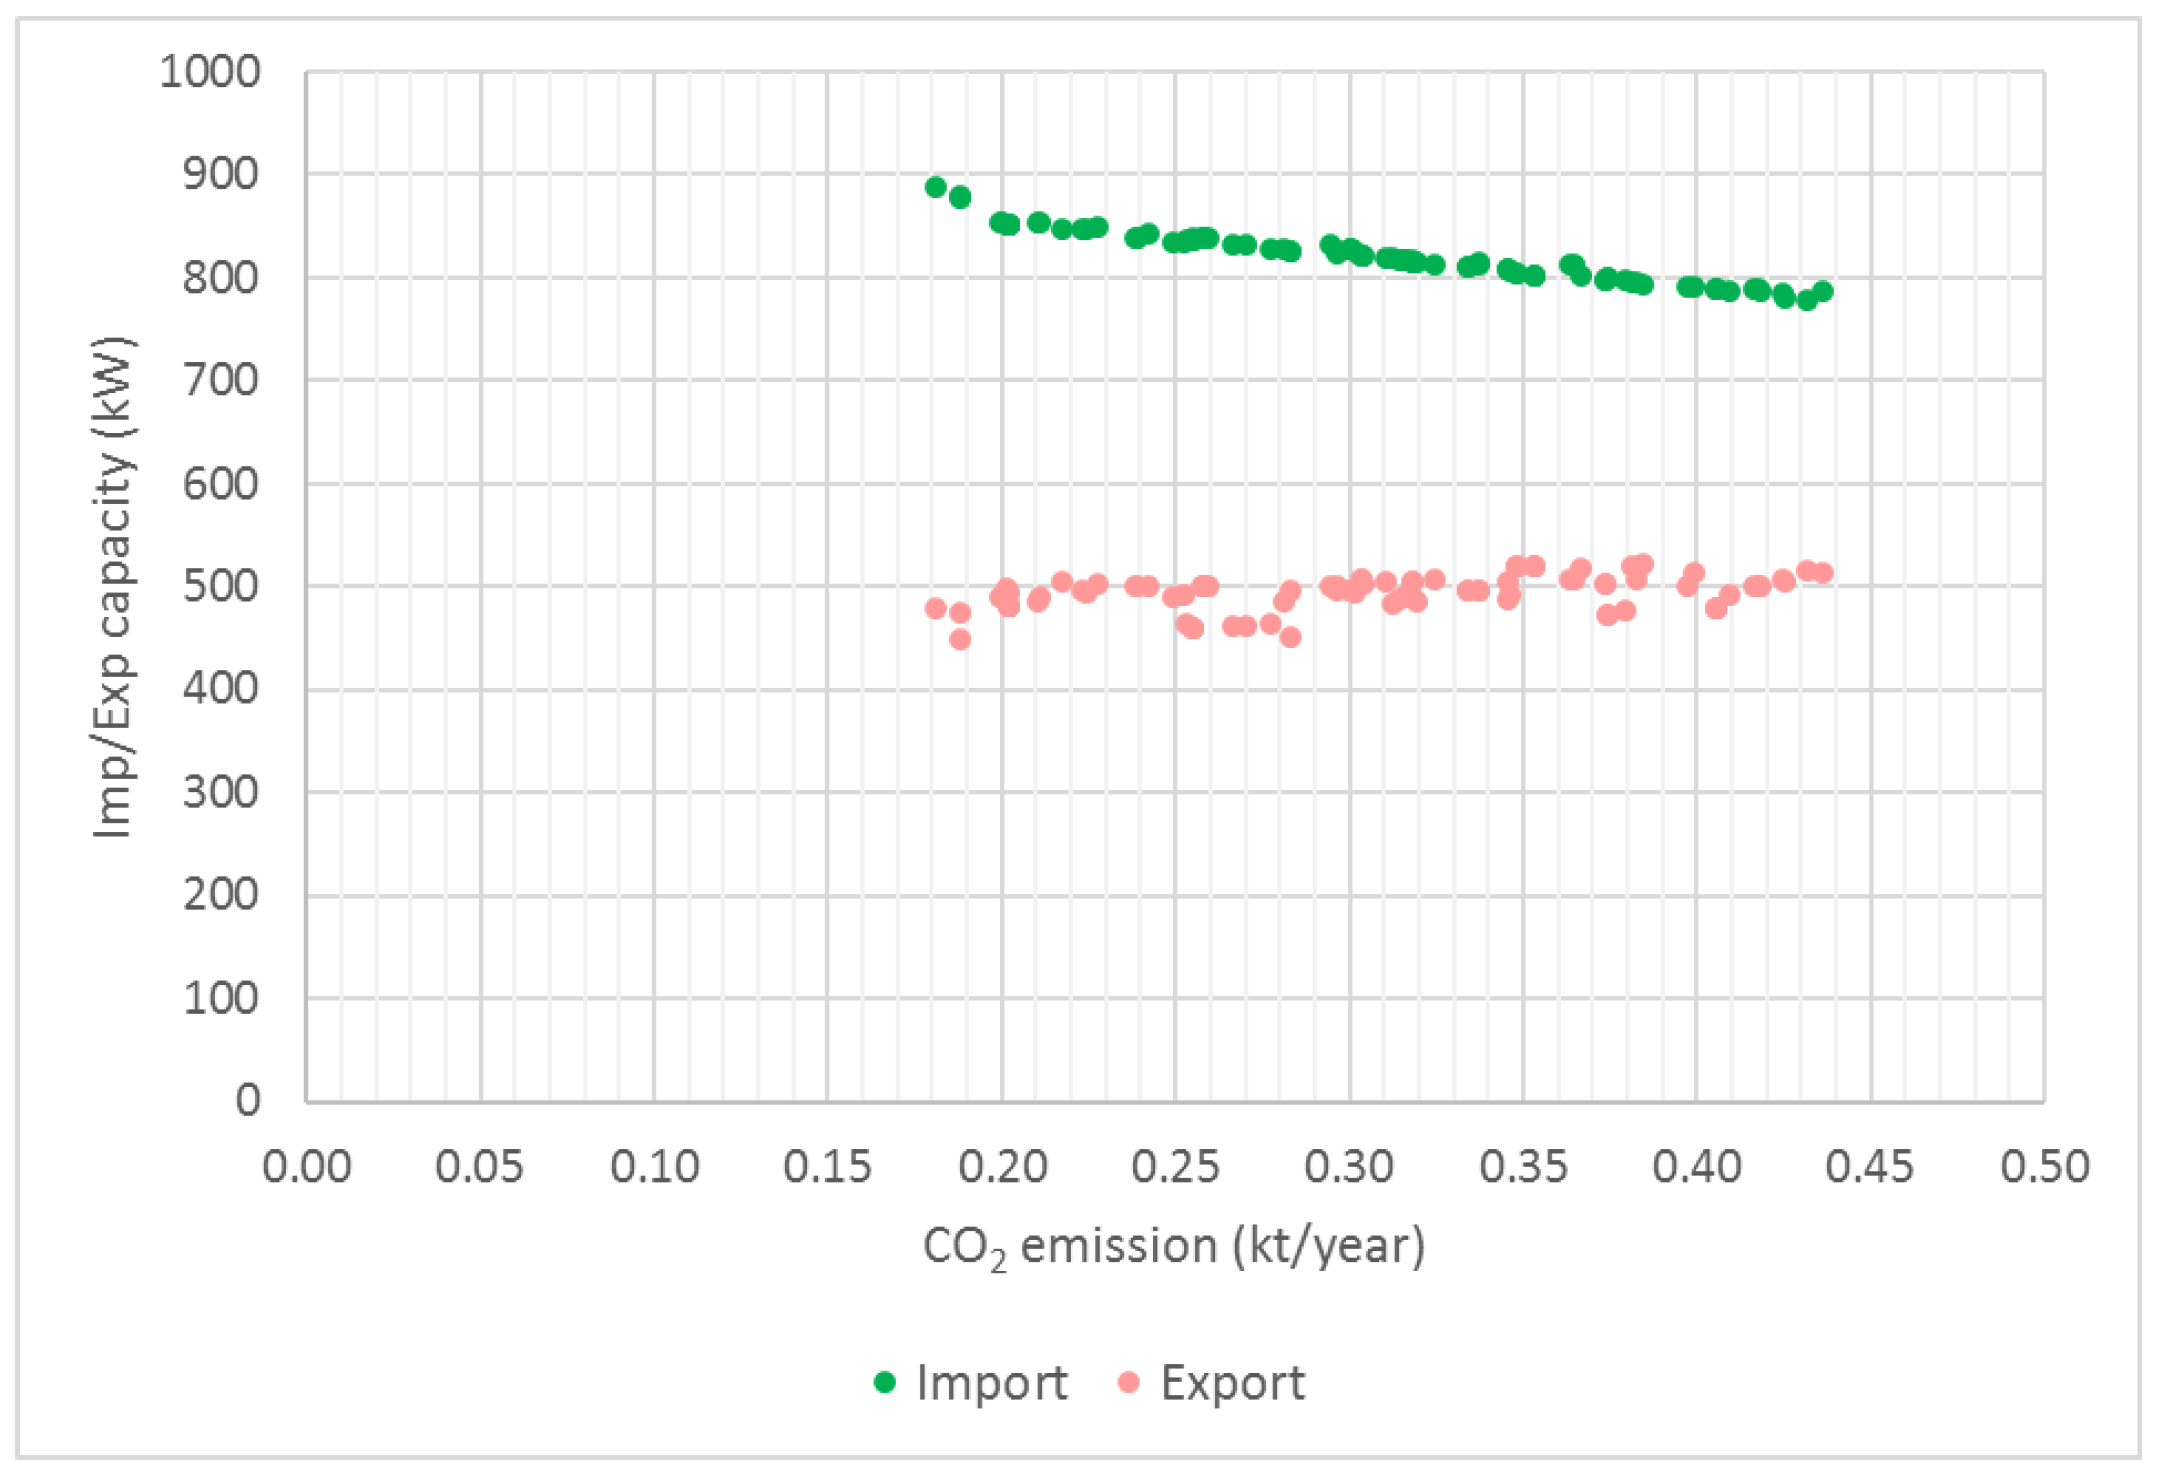
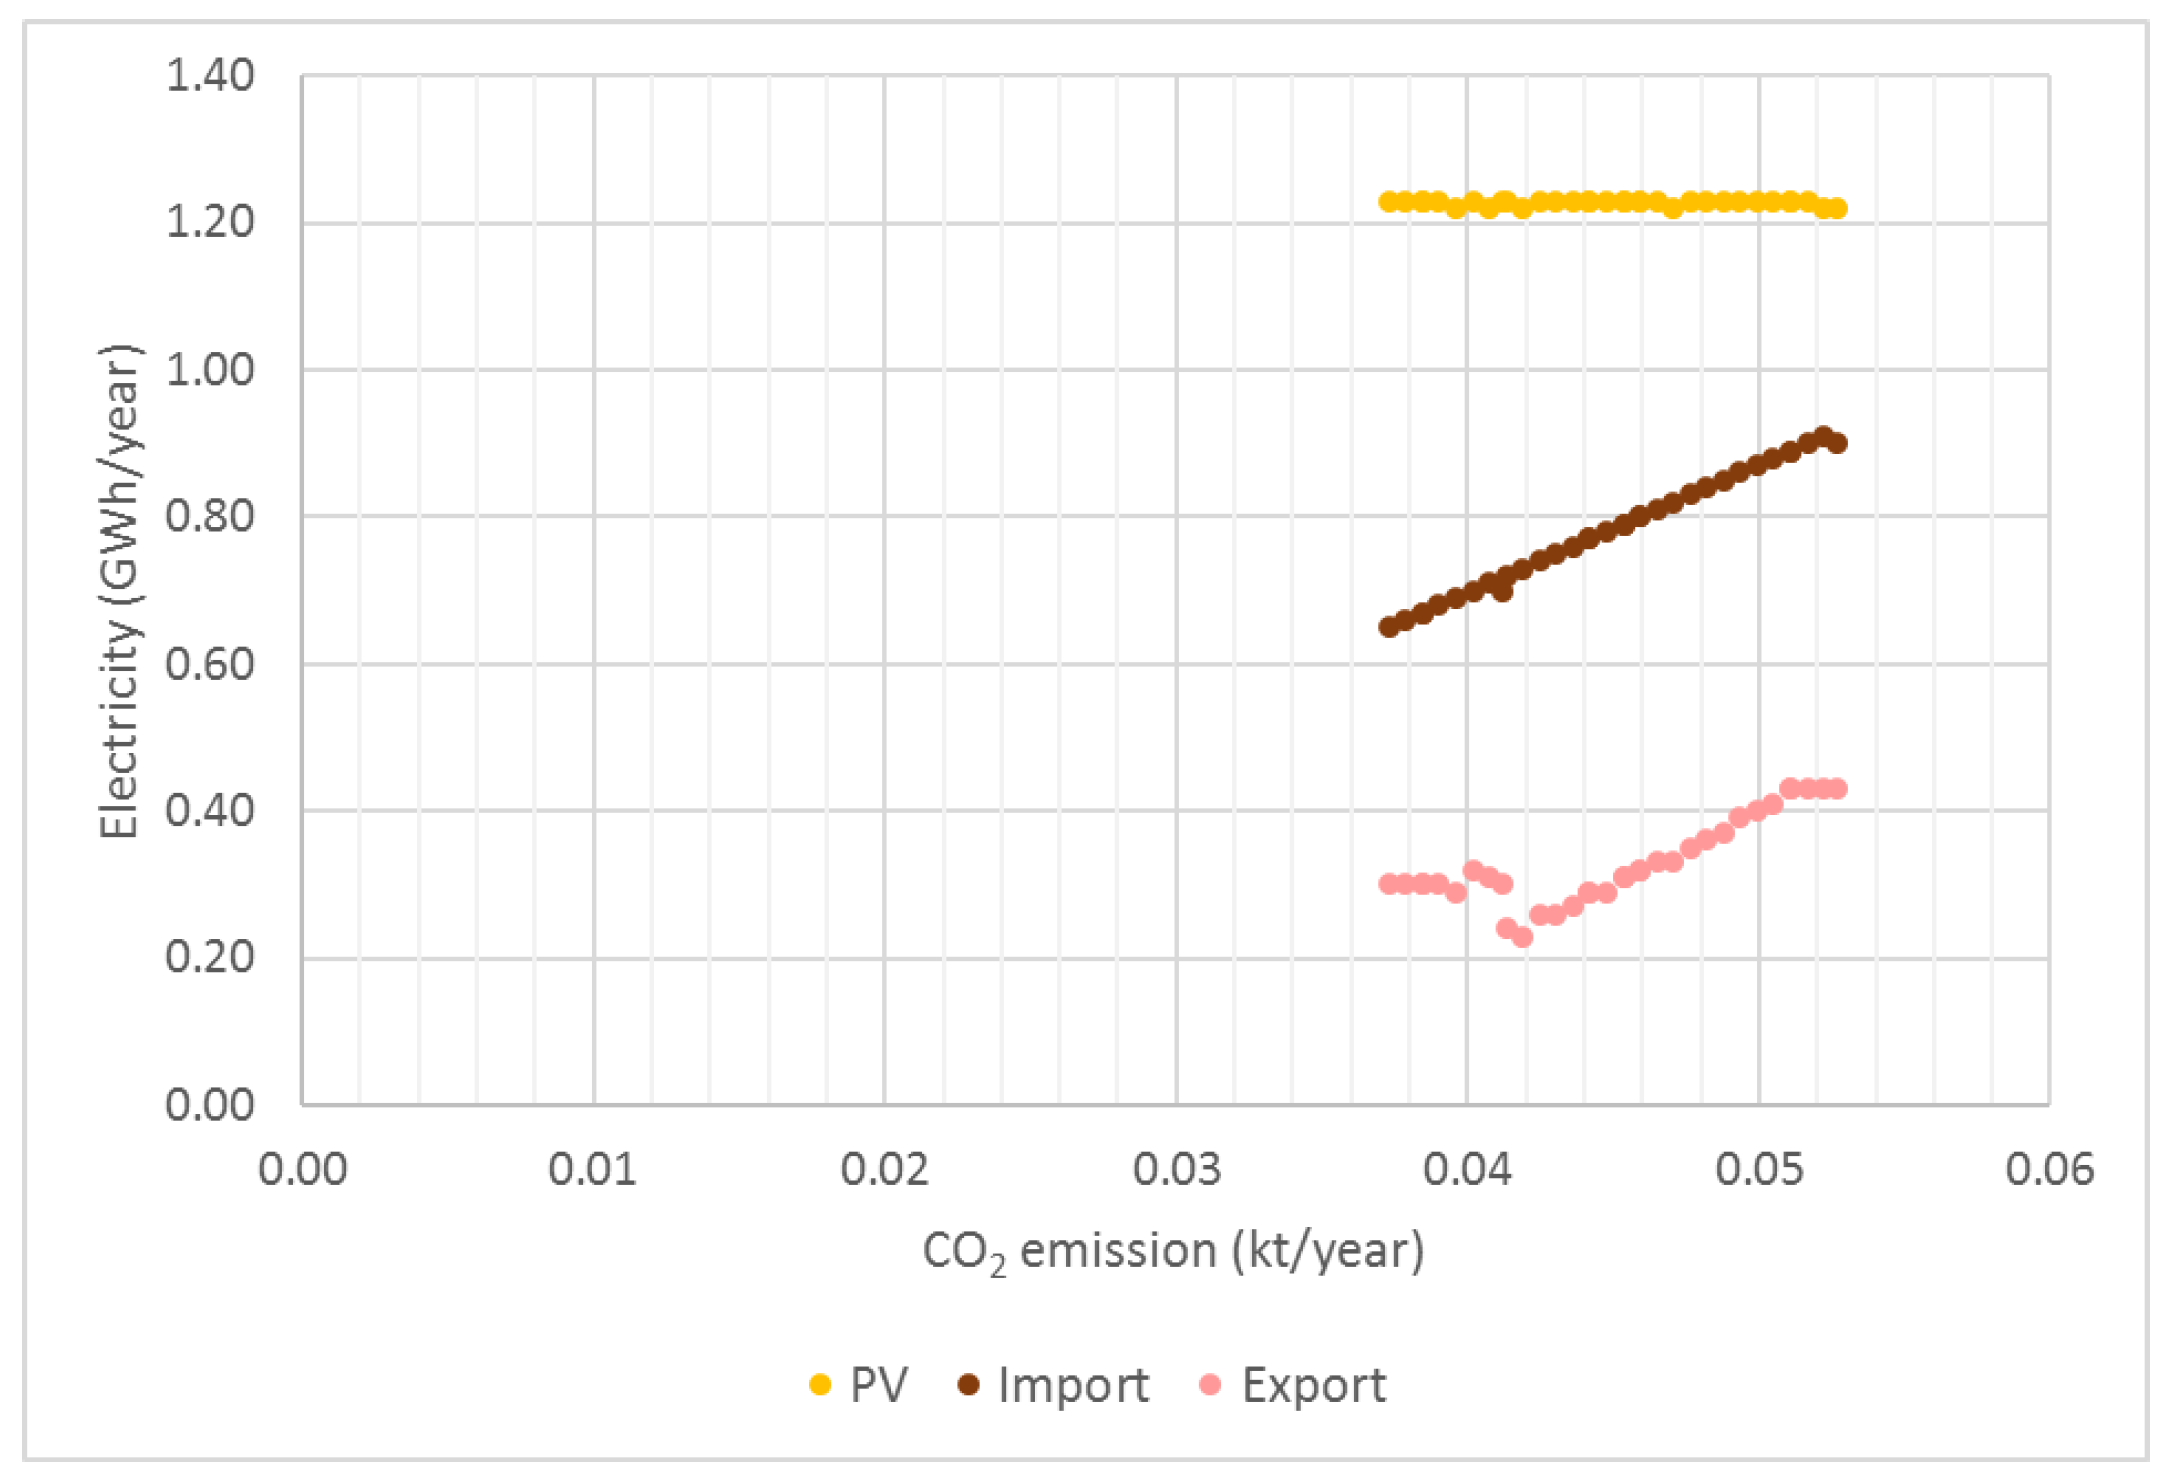
- The use of P2P as an electric storage solution is not seen as attractive in reducing CO2 emissions. In fact, all the local electricity production from PV is completely consumed directly by electricity demand or sector coupling with H2 boilers and FCEV, exports are practically nil, and there is no further way to reduce CO2 emissions either with the increase in PV (due to space limitations) or with the increase in imports (due to production mix constraints in the regional–national network). Finally, along the Pareto front, the results show that it is necessary to strengthen electricity exchanges with the external grid (Figure 23) to support the increase in imports, moving from around 500 kW of peak to an impressive 2260 kW of peak (+452%).
- The Pareto front is more to the left because by 2050, the key technologies for the energy transition (PV, H2 boilers, and FCEV) are cheaper and more efficient, and there are other favorable factors such as less heating demand and higher RES share in electricity imports.
- The technological choices in the heating, transport, and electricity sectors are practically the same as in the S4 2024 scenario, confirming the impact of H2 boilers and FCEVs on the shape of the Pareto front.
4. Conclusions
Supplementary Materials
Author Contributions
Funding
Data Availability Statement
Conflicts of Interest
References
- United Nations. Kyoto Protocol to the United Nations Framework Convention on Climate Change. 1998. Available online: https://unfccc.int/kyoto_protocol (accessed on 17 June 2024).
- United Nations. Paris Agreement. 2015. Available online: https://unfccc.int/process-and-meetings/the-paris-agreement (accessed on 17 June 2024).
- European Commission. The European Green Deal. 2019. Available online: https://commission.europa.eu/strategy-and-policy/priorities-2019-2024/european-green-deal_en (accessed on 17 June 2024).
- European Commission. Renovation Wave Strategy. 2020. Available online: https://ec.europa.eu/commission/presscorner/detail/en/ip_20_1835 (accessed on 17 June 2024).
- Available online: https://jpi-urbaneurope.eu/ped/ (accessed on 17 May 2024).
- Bossi, S.; Gollner, C.; Theierling, S. Towards 100 positive energy districts in Europe: Preliminary data analysis of 61 European cases. Energies 2020, 13, 6083. [Google Scholar] [CrossRef]
- JPI Urban Europe. Europe towards Positive Energy Districts. 2020. Available online: https://jpi-urbaneurope.eu/wp-content/uploads/2020/06/PED-Booklet-Update-Feb-2020_2.pdf (accessed on 17 June 2024).
- Available online: https://incubeproject.eu/ (accessed on 17 May 2024).
- Buckley, N.; Mills, G.; Reinhart, C.; Berzolla, Z.M. Using urban building energy modelling (UBEM) to support the new European Union’s Green Deal: Case study of Dublin Ireland. Energy Build. 2021, 247, 111115. [Google Scholar] [CrossRef]
- Perwez, U.; Shono, K.; Yamaguchi, Y.; Shimoda, Y. Multi-scale UBEM-BIPV coupled approach for the assessment of carbon neutrality of commercial building stock. Energy Build. 2023, 291, 113086. [Google Scholar] [CrossRef]
- Battini, F.; Pernigotto, G.; Gasparella, A. District-level validation of a shoeboxing simplification algorithm to speed-up Urban Building Energy Modeling simulations. Appl. Energy 2023, 349, 121570. [Google Scholar] [CrossRef]
- Dogan, T.; Reinhart, C. Automated Conversion of Architectural Massing Models into Thermal ‘Shoebox’ Models. In Proceedings of the 13th Conference of International Building Performance Simulation Association, Chambéry, France, 26–28 August 2013. [Google Scholar] [CrossRef]
- Lund, H.; Thellufsen, J.Z.; Østergaard, P.A.; Sorknæs, P.; Skov, I.R.; Mathiesen, B.V. Energy PLAN–Advanced analysis of smart energy systems. Smart Energy 2021, 1, 100007. [Google Scholar] [CrossRef]
- Lund, H.; Andersen, A.N.; Østergaard, P.A.; Mathiesen, B.V.; Connolly, D. From electricity smart grids to smart energy systems–a market operation based approach and understanding. Energy 2012, 42, 96–102. [Google Scholar] [CrossRef]
- Lund, H.; Østergaard, P.A.; Connolly, D.; Mathiesen, B.V. Smart energy and smart energy systems. Energy 2017, 137, 556–565. [Google Scholar] [CrossRef]
- Mathiesen, B.V.; Lund, H.; Connolly, D.; Wenzel, H.; Østergaard, P.A.; Möller, B.; Nielsen, S.; Ridjan, I.; Karnøe, P.; Sperling, K.; et al. Smart Energy Systems for coherent 100% renewable energy and transport solutions. Appl. Energy 2015, 145, 139–154. [Google Scholar] [CrossRef]
- Bhuvanesh, A.; Christa, S.J.; Kannan, S.; Pandiyan, M.K. Aiming towards pollution free future by high penetration of renewable energy sources in electricity generation expansion planning. Futures 2018, 104, 25–36. [Google Scholar] [CrossRef]
- Cantarero, M.M.V. Reviewing the Nicaraguan transition to a renewable energy system: Why is “business-as-usual” no longer an option? Energy Policy 2018, 120, 580–592. [Google Scholar] [CrossRef]
- Kiwan, S.; Al-Gharibeh, E. Jordan toward a 100% renewable electricity system. Renew. Energy 2020, 147, 423–436. [Google Scholar] [CrossRef]
- Matak, N.; Tomić, T.; Schneider, D.R.; Krajačić, G. Integration of WtE and district cooling in existing Gas-CHP based district heating system–Central European city perspective. Smart Energy 2021, 4, 100043. [Google Scholar] [CrossRef]
- Campos, J.; Csontos, C.; Munkácsy, B. Electricity scenarios for Hungary: Possible role of wind and solar resources in the energy transition. Energy 2023, 278, 127971. [Google Scholar] [CrossRef]
- Dominković, D.F.; Rashid, K.B.A.; Romagnoli, A.; Pedersen, A.S.; Leong, K.C.; Krajačić, G.; Duić, N. Potential of district cooling in hot and humid climates. Appl. Energy 2017, 208, 49–61. [Google Scholar] [CrossRef]
- Bamisile, O.; Obiora, S.; Huang, Q.; Okonkwo, E.C.; Olagoke, O.; Shokanbi, A.; Kumar, R. Towards a sustainable and cleaner environment in China: Dynamic analysis of vehicle-to-grid, batteries and hydro storage for optimal RE integration. Sustain. Energy Technol. Assess. 2020, 42, 100872. [Google Scholar] [CrossRef]
- Bamisile, O.; Babatunde, A.; Adun, H.; Yimen, N.; Mukhtar, M.; Huang, Q.; Hu, W. Electrification and renewable energy nexus in developing countries; an overarching analysis of hydrogen production and electric vehicles integrality in renewable energy penetration. Energy Convers. Manag. 2021, 236, 114023. [Google Scholar] [CrossRef]
- Doepfert, M.; Castro, R. Techno-economic optimization of a 100% renewable energy system in 2050 for countries with high shares of hydropower: The case of Portugal. Renew. Energy 2021, 165, 491–503. [Google Scholar] [CrossRef]
- Tomić, T.; Dominković, D.F.; Pfeifer, A.; Schneider, D.R.; Pedersen, A.S.; Duić, N. Waste to energy plant operation under the influence of market and legislation conditioned changes. Energy 2017, 137, 1119–1129. [Google Scholar] [CrossRef]
- Pupo-Roncallo, O.; Campillo, J.; Ingham, D.; Ma, L.; Pourkashanian, M. The role of energy storage and cross-border interconnections for increasing the flexibility of future power systems: The case of Colombia. Smart Energy 2021, 2, 100016. [Google Scholar] [CrossRef]
- Pastore, L.M.; Basso, G.L.; Cristiani, L.; de Santoli, L. Rising targets to 55% GHG emissions reduction–The smart energy systems approach for improving the Italian energy strategy. Energy 2022, 259, 125049. [Google Scholar] [CrossRef]
- Cabrera, P.; Lund, H.; Thellufsen, J.Z.; Sorknæs, P. The MATLAB Toolbox for EnergyPLAN: A tool to extend energy planning studies. Sci. Comput. Program. 2020, 191, 102405. [Google Scholar] [CrossRef]
- De Luca, G.; Fabozzi, S.; Massarotti, N.; Vanoli, L. A renewable energy system for a nearly zero greenhouse city: Case study of a small city in southern Italy. Energy 2018, 143, 347–362. [Google Scholar] [CrossRef]
- Bonati, A.; De Luca, G.; Fabozzi, S.; Massarotti, N.; Vanoli, L. The integration of exergy criterion in energy planning analysis for 100% renewable system. Energy 2019, 174, 749–767. [Google Scholar] [CrossRef]
- Calise, F.; Fabozzi, S.; Vanoli, L.; Vicidomini, M. A sustainable mobility strategy based on electric vehicles and photovoltaic panels for shopping centers. Sustain. Cities Soc. 2021, 70, 102891. [Google Scholar] [CrossRef]
- Battaglia, V.; De Luca, G.; Fabozzi, S.; Lund, H.; Vanoli, L. Integrated energy planning to meet 2050 European targets: A Southern Italian region case study. Energy Strategy Rev. 2022, 41, 100844. [Google Scholar] [CrossRef]
- Novosel, T.; Perković, L.; Ban, M.; Keko, H.; Pukšec, T.; Krajačić, G.; Duić, N. Agent based modelling and energy planning–Utilization of MATSim for transport energy demand modelling. Energy 2015, 92, 466–475. [Google Scholar] [CrossRef]
- Thellufsen, J.Z.; Nielsen, S.; Lund, H. Implementing cleaner heating solutions towards a future low-carbon scenario in Ireland. J. Clean. Prod. 2019, 214, 377–388. [Google Scholar] [CrossRef]
- Groppi, D.; Garcia, D.A.; Basso, G.L.; De Santoli, L. Synergy between smart energy systems simulation tools for greening small Mediterranean islands. Renew. Energy 2019, 135, 515–524. [Google Scholar] [CrossRef]
- Østergaard, P.A.; Jantzen, J.; Marczinkowski, H.M.; Kristensen, M. Business and socioeconomic assessment of introducing heat pumps with heat storage in small-scale district heating systems. Renew. Energy 2019, 139, 904–914. [Google Scholar] [CrossRef]
- Pfeifer, A.; Dobravec, V.; Pavlinek, L.; Krajačić, G.; Duić, N. Integration of renewable energy and demand response technologies in interconnected energy systems. Energy 2018, 161, 447–455. [Google Scholar] [CrossRef]
- Bačeković, I.; Østergaard, P.A. Local smart energy systems and cross-system integration. Energy 2018, 151, 812–825. [Google Scholar] [CrossRef]
- Lund, R.; Ilic, D.D.; Trygg, L. Socioeconomic potential for introducing large-scale heat pumps in district heating in Denmark. J. Clean. Prod. 2016, 139, 219–229. [Google Scholar] [CrossRef]
- Pillai, J.R.; Heussen, K.; Østergaard, P.A. Comparative analysis of hourly and dynamic power balancing models for validating future energy scenarios. Energy 2011, 36, 3233–3243. [Google Scholar] [CrossRef]
- Jiménez, A.; Cabrera, P.; Medina, J.F.; Østergaard, P.A.; Lund, H. Smart energy system approach validated by electrical analysis for electric vehicle integration in islands. Energy Convers. Manag. 2024, 302, 118121. [Google Scholar] [CrossRef]
- Olkkonen, V.; Rinne, S.; Hast, A.; Syri, S. Benefits of DSM measures in the future Finnish energy system. Energy 2017, 137, 729–738. [Google Scholar] [CrossRef]
- Mahbub, M.S.; Cozzini, M.; Østergaard, P.A.; Alberti, F. Combining multi-objective evolutionary algorithms and descriptive analytical modelling in energy scenario design. Appl. Energy 2016, 164, 140–151. [Google Scholar] [CrossRef]
- Prina, M.G.; Fanali, L.; Manzolini, G.; Moser, D.; Sparber, W. Incorporating combined cycle gas turbine flexibility constraints and additional costs into the EPLANopt model: The Italian case study. Energy 2018, 160, 33–43. [Google Scholar] [CrossRef]
- Bellocchi, S.; Manno, M.; Noussan, M.; Prina, M.G.; Vellini, M. Electrification of transport and residential heating sectors in support of renewable penetration: Scenarios for the Italian energy system. Energy 2020, 196, 117062. [Google Scholar] [CrossRef]
- Herc, L.; Pfeifer, A.; Duić, N. Optimization of the possible pathways for gradual energy system decarbonization. Renew. Energy 2022, 193, 617–633. [Google Scholar] [CrossRef]
- Laha, P.; Chakraborty, B. Low carbon electricity system for India in 2030 based on multi-objective multi-criteria assessment. Renew. Sustain. Energy Rev. 2021, 135, 110356. [Google Scholar] [CrossRef]
- Viesi, D.; Crema, L.; Mahbub, M.S.; Verones, S.; Brunelli, R.; Baggio, P.; Fauri, M.; Prada, A.; Bello, A.; Nodari, B.; et al. Integrated and dynamic energy modelling of a regional system: A cost-optimized approach in the deep decarbonisation of the Province of Trento (Italy). Energy 2020, 209, 118378. [Google Scholar] [CrossRef]
- Bellocchi, S.; Guidi, G.; De Iulio, R.; Manno, M.; Nastasi, B.; Noussan, M.; Prina, M.G.; Roberto, R. Analysis of smart energy system approach in local alpine regions-A case study in Northern Italy. Energy 2020, 202, 117748. [Google Scholar] [CrossRef]
- Prina, M.G.; Cozzini, M.; Garegnani, G.; Manzolini, G.; Moser, D.; Oberegger, U.F.; Pernetti, R.; Vaccaro, R.; Sparber, W. Multi-objective optimization algorithm coupled to EnergyPLAN software: The EPLANopt model. Energy 2018, 149, 213–221. [Google Scholar] [CrossRef]
- Vaccaro, R.; Rocco, M.V. Quantifying the impact of low carbon transition scenarios at regional level through soft-linked energy and economy models: The case of South-Tyrol Province in Italy. Energy 2021, 220, 119742. [Google Scholar] [CrossRef]
- Prina, M.G.; Moser, D.; Vaccaro, R.; Sparber, W. EPLANopt optimization model based on EnergyPLAN applied at regional level: The future competition on excess electricity production from renewables. Int. J. Sustain. Energy Plan. Manag. 2020, 27, 35–50. [Google Scholar] [CrossRef]
- Mahbub, M.S.; Viesi, D.; Cattani, S.; Crema, L. An innovative multi-objective optimization approach for long-term energy planning. Appl. Energy 2017, 208, 1487–1504. [Google Scholar] [CrossRef]
- Mahbub, M.S.; Viesi, D.; Crema, L. Designing optimized energy scenarios for an Italian Alpine valley: The case of Giudicarie Esteriori. Energy 2016, 116, 236–249. [Google Scholar] [CrossRef]
- Cabrera, P.; Carta, J.A.; Lund, H.; Thellufsen, J.Z. Large-scale optimal integration of wind and solar photovoltaic power in water-energy systems on islands. Energy Convers. Manag. 2021, 235, 113982. [Google Scholar] [CrossRef]
- Groppi, D.; Nastasi, B.; Prina, M.G.; Garcia, D.A. The EPLANopt model for Favignana island’s energy transition. Energy Convers. Manag. 2021, 241, 114295. [Google Scholar] [CrossRef]
- Yuan, M.; Thellufsen, J.Z.; Sorknæs, P.; Lund, H.; Liang, Y. District heating in 100% renewable energy systems: Combining industrial excess heat and heat pumps. Energy Convers. Manag. 2021, 244, 114527. [Google Scholar] [CrossRef]
- Prina, M.G.; Cozzini, M.; Garegnani, G.; Moser, D.; Oberegger, U.F.; Vaccaro, R.; Sparber, W. Smart energy systems applied at urban level: The case of the municipality of Bressanone-Brixen. Int. J. Sustain. Energy Plan. Manag. 2016, 10, 33–52. [Google Scholar] [CrossRef]
- de Maigret, J.; Viesi, D.; Mahbub, M.S.; Testi, M.; Cuonzo, M.; Thellufsen, J.Z.; Østergaard, P.A.; Lund, H.; Baratieri, M.; Crema, L. A multi-objective optimization approach in defining the decarbonization strategy of a refinery. Smart Energy 2022, 6, 100076. [Google Scholar] [CrossRef]
- Viesi, D.; Mahbub, M.S.; Brandi, A.; Thellufsen, J.Z.; Østergaard, P.A.; Lund, H.; Baratieri, M.; Crema, L. Multi-objective optimization of an energy community: An integrated and dynamic approach for full decarbonisation in the European Alps. Int. J. Sustain. Energy Plan. Manag. 2023, 38, 8–29. [Google Scholar] [CrossRef]
- Roman, O.; Farella, E.M.; Rigon, S.; Remondino, F.; Ricciuti, S.; Viesi, D. From 3D surveying data to BIM to BEM: The InCUBE dataset. Int. Arch. Photogramm. Remote Sens. Spat. Inf. Sci. 2023, 48, 175–182. [Google Scholar] [CrossRef]
- Ziozas, N.; Kitsopoulou, A.; Bellos, E.; Iliadis, P.; Gonidaki, D.; Angelakoglou, K.; Nikolopoulos, N.; Ricciuti, S.; Viesi, D. Energy Performance Analysis of the Renovation Process in an Italian Cultural Heritage Building. Sustainability 2024, 16, 2784. [Google Scholar] [CrossRef]
- CTI Comitato Termotecnico Italiano—Vendita Documenti Normativi. Available online: https://try.cti2000.it/ (accessed on 13 November 2023).
- Pernigotto, G.; Prada, A.; Gasparella, A. Extreme reference years for building energy performance simulation. J. Build. Perform. Simul. 2020, 13, 152–166. [Google Scholar] [CrossRef]
- Available online: https://www.ashrae.org/ (accessed on 17 May 2024).
- U.S. Department of Energy. DOE Commercial Building Energy Asset Score: Software Development for Phase II Building Types. Available online: https://www.energy.gov/eere/buildings/articles/doe-commercial-building-energy-asset-score-software-development-phase-ii (accessed on 13 July 2023).
- U.S. Department of Energy. Prototype Building Models. Available online: https://www.energycodes.gov/prototype-building-models#IECC (accessed on 13 July 2023).
- Available online: https://store.uni.com/uni-ts-11300-1-2014 (accessed on 17 June 2024).
- Available online: https://store.uni.com/uni-10339-1995 (accessed on 17 June 2024).










| Reference | Combined Tool | Type of Case Study |
|---|---|---|
| Bhuvanesh et al. [17] | LEAP | The development of a plan for electricity generation expansion, aiming for low carbon emissions in the future. A case study of Tamil Nadu (India). |
| Cantarero [18] | LEAP | The Nicaraguan energy system is modeled to review renewable energy policies. |
| Kiwan and Al-Gharibeh [19] | LEAP, SAM | A 100% renewable electricity supply scenario is constructed and compared with three other scenarios. A case study of Jordan. |
| Matak et al. [20] | LEAP | The possibility of the integration of a combined heat and power waste incineration plant into the existing gas-based district heating system in the central European city. A case study of the City of Zagreb (Croatia). |
| Campos et al. [21] | LEAP | The compatibility of wind and solar energy resources with the projections of future electricity demand in Hungary. A case study of Hungary. |
| Dominkovic et al. [22] | MATLAB | Analyze how district cooling systems in hot and humid climates are beneficial solutions, especially in future energy systems, dominated by large shares of intermittent renewable energy sources. A case study of Singapore. |
| Bamisile et al. [23] | MATLAB | A dynamic analysis of vehicle-to-grid, batteries, and hydro storage for optimal RE integration. A case study of China. |
| Bamisile et al. [24] | MATLAB | Electrification and renewable energy’s future interdependence. An overarching analysis of hydrogen production and electric vehicles integrality in renewable energy penetration. A case study of developing countries. |
| Doepfert and Castro [25] | MATLAB | Optimized 100% renewable energy system for countries with high shares of hydropower. A case study of Portugal. |
| Tomic et al. [26] | MATLAB | The influence of legislation changes on the new incineration plants. Case studies of Zagreb (Croatia) and Sønderborg (Denmark). |
| Pupo-Roncallo et al. [27] | MATLAB | The role of energy storage and cross-border interconnections in increasing the flexibility of future power systems. A case study of Colombia. |
| Pastore et al. [28] | MATLAB | Improving Italian energy strategy by means of smart energy system approach. A case study of Italy. |
| Cabrera et al. [29] | MATLAB | A description of the MATLAB Toolbox for EnergyPLAN (MaT4EnergyPLAN), a set of functions developed to manage the EnergyPLAN software using MATLAB. A case study of Denmark. |
| De Luca et al. [30] | TRNSYS | The economic and energy feasibility analysis of a renewable energy system for a small city to convert it to zero greenhouse gas city by 2030. A case study of Altavilla Silentina (Italy). |
| Bonati et al. [31] | TRNSYS | The integration of exergy criterion in energy planning analysis for 100% renewable system. A case study of Pompeii (Italy). |
| Calise et al. [32] | TRNSYS | A novel paradigm for mobility sectors related to shopping centers based on PV panels and EVs. A case study of Campania (Italy). |
| Battaglia et al. [33] | TRNSYS, DesignBuilder | An integrated energy plan for Campania satisfying the European and Italian targets of reducing CO2 emissions by 2050. A case study of Campania (Italy). |
| Novosel et al. [34] | MATSim | Model the hourly distribution of the energy consumption of EVs and use the calculated load curves to test their impact. A case study of Croatia. |
| Thellufsen et al. [35] | Markal/TIMES | EnergyPLAN and Markal/TIMES combined enable a better analysis of heating scenarios. Potential for the implementation of district heating in a future energy system originally intended not to include district heating. A case study of Ireland. |
| Groppi et al. [36] | Homer | An economically optimized smart energy system in a small MED island is designed. A case study of Favignana Island (Italy). |
| Østergaard et al. [37] | energyPRO | Comparing straw boilers and heat pump district heating systems. A case study of Samsø (Denmark). |
| Pfeifer et al. [38] | MultiNode | The integration of renewable energy and demand response technologies (i.e., V2G) in interconnected energy systems. Case studies of Vis, Korcula, Lastovo, and Mljet (Croatia). |
| Bačeković and Østergaard [39] | MultiNode | Firstly, a 100% local renewable energy system is created based on the interplay between the electricity, heating, and transport sectors. Secondly, an analysis of the integration of the proposed local system with the rest of the country is carried out. A case study of Varaždin County (Croatia). |
| Lund et al. [40] | Modest | Assess the economic potential for introducing HPs in DH in Denmark. A case study of Denmark. |
| Pillai et al. [41] | DIgSILENT PowerFactory | The comparison of hourly and dynamic power balancing models for validating future energy scenarios. A case study of Bornholm (Denmark). |
| Jiménez et al. [42] | PowerWorld, MATLAB | The integration of renewable energy sources in islanded energy systems, focusing on the electrification of the transport sector. The method combines an overall energy system analysis with more detailed power system analyses. A case study of Gran Canaria (Spain). |
| Olkkonen et al. [43] | Tailored demand-side response model | Assess demand shifting in the residential and commercial sectors and how those affect the hourly operation of the Finnish energy system, taking into account both the electricity and district heating sectors. A case study of Finland. |
| “CS 2024” | “CS 2050 UC” | “CS 2050 ” | |
|---|---|---|---|
| Average annual temperature [°C] | 11.21 | 11.21 | 14.92 |
| HDD18 | 2791 | 2791 | 1852 |
| CDD18 | 313 | 313 | 730 |
| Average global horizontal radiation [°C] | 128 | 128 | 152.9 |
| Building ID | External Wall [W m−2 K−1] | Ground Floor [W m−2 K−1] | Roof [W m−2 K−1] | Internal Partitions [W m−2 K−1] | Internal Slab [W m−2 K−1] | Window Type | Intended Use/Schedule Type |
|---|---|---|---|---|---|---|---|
| B1_Bar | 0.22 | 0.16 | 0.18 | 0.53 | 1.37 | Triple Glazing | Community area |
| B1_Off | 0.23 | 0.54 | 0.19 | 0.96 | 1.30 | Triple Glazing | Office |
| B2 | 0.21 | 0.23 | 0.20 | 0.70 | 0.51 | Triple Glazing | Community area |
| B3 | 0.29 | 0.54 | 0.16 | 0.71 | 0.20 | Triple Glazing | Office |
| B4 | 0.70 | 2.20 | 0.50 | 1.60 | 2.00 | Double Glazing | Community area |
| B5_Ret | 0.18 | 0.80 | 0.20 | 0.71 | 0.20 | Triple Glazing | Retail |
| B5_Res_s | 0.11 | 0.80 | 0.12 | 0.56 | 0.20 | Triple Glazing | Residential |
| B5_Res | 0.11 | 0.80 | 0.12 | 0.56 | 0.20 | Triple Glazing | Residential |
| B6 | 0.70 | 2.20 | 0.50 | 1.60 | 2.00 | Double Glazing | Community area |
| B6_Gym | 0.70 | 2.20 | 0.50 | 1.60 | 2.00 | Double Glazing | Community area |
| B6_Aud | 0.70 | 2.20 | 0.50 | 1.60 | 2.00 | Double Glazing | Community area |
| Building ID | Occupancy Density [p m−2] | Internal Loads [W m−2] | Mechanical Ventilation [m3 s−1 p−1] | DHW Demand [m3 h−1 m−2] |
|---|---|---|---|---|
| B1_Bar | 0.10 | 10 | 1.10 × 10⁻² | 1.16 × 10⁻⁴ |
| B1_Off | 0.06 | 6 | 1.10 × 10⁻² | 3.76 × 10⁻⁵ |
| B2 | 0.10 | 6 | 6.00 × 10⁻³ | 2.61 × 10⁻⁵ |
| B3 | 0.06 | 6 | 1.10 × 10⁻² | 2.42 × 10⁻⁴ |
| B4 | 1.20 | 8 | 6.00 × 10⁻³ | 3.32 × 10⁻⁵ |
| B5_Ret | 0.15 | 8 | 6.50 × 10⁻³ | 5.92 × 10⁻⁵ |
| B5_Res_s | 0.03 | 4 | 1.10 × 10⁻² | 7.36 × 10⁻⁵ |
| B5_Res | 0.03 | 4 | 1.10 × 10⁻² | 1.16 × 10⁻⁴ |
| B6 | 0.10 | 6 | 6.00 × 10⁻³ | 2.04 × 10⁻⁴ |
| B6_Gym | 0.20 | 5 | 6.50 × 10⁻³ | 2.53 × 10⁻⁴ |
| B6_Auditorium | 1.50 | 8 | 1.25 × 10⁻² | 1.16 × 10⁻⁴ |
| Electrical Sector | Hydrogen Sector | Thermal Sector | Transport Sector |
|---|---|---|---|
| PV (kW) | Bl-Tr Hydrogen Electrolyser (kW) | Solar Thermal * (GWh) | BEV (Mkm) |
| Battery (kW) | Bl-Tr Hydrogen Storage (MWh) | Heat Pump (heating) * (GWh) | FCEV (Mkm) |
| Battery (MWh) | P2P Hydrogen Electrolyser (kW) | Heat Pump (cooling) * (GWh) | ICEV (Mkm) |
| Import (kW) | P2P Hydrogen Fuel Cell (kW) | Boiler NG * (GWh) | |
| Export (kW) | P2P Hydrogen Storage (MWh) | Boiler Hydrogen * (GWh) | |
| Solar Heat Storage (in days of average heat demand) |
| Building ID | Heat Pump Heating [kW] | Heat Pump Cooling [kW] | NG Boiler [kW] | Solar Thermal [kWh/Year] | PV [kW] |
|---|---|---|---|---|---|
| B1 | 136.8 | 45.9 | 0 | 0 | 24.43 |
| B2 | 108.63 | 0 | 1.39 | 0 | 6 |
| B3 | 304.19 | 226.4 | 0 | 9.62 × 10³ | 20 |
| B4 | 0 | 0 | 25 | 0 | 0 |
| B5 | 145 | 165 | 163.2 | 7.76 × 10⁴ | 43 |
| B6 | 0 | 120 | 1118 | 0 | 77 |
| District | 694.62 | 557.3 | 1307.59 | 8.72 × 10⁴ | 170.43 |
| Technology | 2024 | 2050 UC | 2050 |
|---|---|---|---|
| Solar Thermal [kWh/m2] | 478.94 | 507.67 | 730.66 |
| PV [m2/kWp] | 5 | 4.43 | 4.43 |
| Building ID | Area [m2] | 2024 | 2050 UC | ||||
|---|---|---|---|---|---|---|---|
| PV [kW] | Solar Thermal [kWh/Year] | PV [kW] | Solar Thermal [kWh/Year] | PV [kW] | Solar Thermal [kWh/Year] | ||
| B1 | 1285.2 | 257.0 | 6.16 × 10⁵ | 289.9 | 6.54 × 10⁵ | 289.9 | 8.84 × 10⁵ |
| B2 | 220.0 | 44.0 | 1.05 × 10⁵ | 49.6 | 1.12 × 10⁵ | 49.6 | 1.51 × 10⁵ |
| B3 | 269.9 | 54.0 | 1.29 × 10⁵ | 60.9 | 1.37 × 10⁵ | 60.9 | 1.86 × 10⁵ |
| B4 | 0.0 | 0.0 | 0 | 0.0 | 0 | 0.0 | 0 |
| B5 | 2049.0 | 409.8 | 9.81 × 10⁵ | 462.2 | 1.04 × 10⁶ | 462.2 | 1.41 × 10⁶ |
| B6 | 0.0 | 0.0 | 0 | 0.0 | 0 | 0.0 | 0 |
| B6_gym | 482.0 | 96.4 | 2.31 × 10⁵ | 108.7 | 2.45 × 10⁵ | 108.7 | 3.32 × 10⁵ |
| B6_aud | 543.0 | 108.6 | 2.60 × 10⁵ | 122.5 | 2.76 × 10⁵ | 122.5 | 3.74 × 10⁵ |
| District | 4849.1 | 989.8 | 2.32 × 10⁶ | 1113.8 | 2.47 × 10⁶ | 1113.8 | 3.34 × 10⁶ |
| MOEA Parameter | Value |
|---|---|
| Population size | 100 |
| Generations | 100 |
| Crossover | SBX crossover |
| Crossover probability | 0.9 |
| Mutation | Polynomial mutation |
| Mutation probability | 1/number of decision variables |
| Type of Scenario | PV and Solar Thermal Constraint | Electricity Demand | Heating Demand | Cooling Demand | Transport Demand | Energy Community Incentive | Only Fossil Fuel Tech vs. H2 |
|---|---|---|---|---|---|---|---|
| S1 | |||||||
| S2 | |||||||
| S3 | |||||||
| S4 |
| Building ID | HD 2024 and 2050 UC [MWh/Year] | [MWh/Year] | Δ [%] | PP 2024 and 2050 UC [kW] | [kW] | Δ [%] |
|---|---|---|---|---|---|---|
| B1 | 54.84 | 37.30 | −32% | 81.45 | 55.52 | −32% |
| B2 | 30.77 | 24.66 | −20% | 14.46 | 14.24 | −2% |
| B3 | 155.43 | 119.42 | −23% | 351.81 | 275.69 | −22% |
| B4 | 16.40 | 9.07 | −45% | 12.46 | 10.54 | −15% |
| B5 | 240.79 | 177.58 | −26% | 137.61 | 127.24 | −8% |
| B6 | 1659.94 | 1178.00 | −29% | 1156.44 | 1101.50 | −5% |
| District | 2158.16 | 1546.03 | −28% | 1718.85 | 1375.21 | −20% |
| Building ID | CD 2024 and 2050 UC [MWh/Year] | [MWh/Year] | Δ [%] | PP 2024 and 2050 UC [kW] | Δ [%] | |
|---|---|---|---|---|---|---|
| B1 | 40.96 | 80.29 | 96% | 103.82 | 117.90 | 14% |
| B2 | 29.16 | 52.79 | 81% | 67.03 | 69.28 | 3% |
| B3 | 216.50 | 363.18 | 68% | 408.55 | 521.35 | 71% |
| B4 | 13.61 | 25.04 | 84% | 33.23 | 28.51 | −14% |
| B5 | 179.90 | 320.99 | 78% | 559.37 | 695.28 | 24% |
| B6 | 111.76 | 338.66 | 203% | 603.71 | 962.89 | 59% |
| District | 591.88 | 1180.95 | 100% | 1574.38 | 1949.12 | 24% |
| Type of Energy Demand | B1 | B2 | B3 | B4 | B5 | B6 | District |
|---|---|---|---|---|---|---|---|
| Electricity consumption [MWh/year] | 83.73 | 27.11 | 222.07 | 4.95 | 225.08 | 401.24 | 964.16 |
Disclaimer/Publisher’s Note: The statements, opinions and data contained in all publications are solely those of the individual author(s) and contributor(s) and not of MDPI and/or the editor(s). MDPI and/or the editor(s) disclaim responsibility for any injury to people or property resulting from any ideas, methods, instructions or products referred to in the content. |
© 2024 by the authors. Licensee MDPI, Basel, Switzerland. This article is an open access article distributed under the terms and conditions of the Creative Commons Attribution (CC BY) license (https://creativecommons.org/licenses/by/4.0/).
Share and Cite
Viesi, D.; Borelli, G.; Ricciuti, S.; Pernigotto, G.; Mahbub, M.S. Modeling the Optimal Transition of an Urban Neighborhood towards an Energy Community and a Positive Energy District. Energies 2024, 17, 4047. https://doi.org/10.3390/en17164047
Viesi D, Borelli G, Ricciuti S, Pernigotto G, Mahbub MS. Modeling the Optimal Transition of an Urban Neighborhood towards an Energy Community and a Positive Energy District. Energies. 2024; 17(16):4047. https://doi.org/10.3390/en17164047
Chicago/Turabian StyleViesi, Diego, Gregorio Borelli, Silvia Ricciuti, Giovanni Pernigotto, and Md Shahriar Mahbub. 2024. "Modeling the Optimal Transition of an Urban Neighborhood towards an Energy Community and a Positive Energy District" Energies 17, no. 16: 4047. https://doi.org/10.3390/en17164047
APA StyleViesi, D., Borelli, G., Ricciuti, S., Pernigotto, G., & Mahbub, M. S. (2024). Modeling the Optimal Transition of an Urban Neighborhood towards an Energy Community and a Positive Energy District. Energies, 17(16), 4047. https://doi.org/10.3390/en17164047


