Abstract
A new methodology for hybrid energy systems (HESs) was developed, namely the HY4RES model, tailored for the water sector, covering hybrid energy objective functions and grid or battery support using optimization algorithms in Solver, MATLAB, and Python, with evolutionary methods. HOMER is used for hybrid microgrids and allows for comparison with HY4RES, the newly developed model. Both models demonstrated flexibility in optimizing hybrid renewable solutions. This study analyzed an irrigation system for 3000 m3/ha (without renewables (Base case) and the Proposed system—with PV solar and pumped-hydropower storage to maximize cash flow over 25 years). Case 1—3000 m3/ha presented benefits due to PV supplying ~87% of energy, reducing grid dependency to ~13%. Pumped-hydropower storage (PHS) charges with excess solar energy, ensuring 24 h irrigation. Sensitivity analyses for Case 2—1000—and Case 3—6000 m3/ha—highlighted the advantages and limitations of water-energy management and system optimization. Case 2 was the most economical due to lower water-energy needs with noteworthy energy sales (~73.4%) and no need for the grid. Case 3 led to increased operating costs relying heavily on grid energy (61%), with PV providing only 39%. PHS significantly lowered operating costs and enhanced system flexibility by selling excess energy to the grid.
1. Introduction
With the growing concern about reducing environmental footprints, there is a global push to become less dependent on fossil fuels and other non-renewable sources of energy. To face the environmental problems and ensure a sustainable future for the next generations, the shift to clean and renewable energy sources is mandatory [1,2,3,4]. Within this objective, replacing the use of traditional batteries, which are often harmful to the environment, with other ways of storing energy, such as pumped-hydropower storage (PHS) is a significant step forward as a renewable alternative that has already proved beneficial and efficient for energy storage as water potential energy in upper reservoirs.
Some studies are presented for small communities to have access to electricity with a scheme to provide irrigation facilities and water supply using a photovoltaic system (PV) as the primary energy source for the pumped-hydro storage, showing a satisfactory net present cost and 100% of power supply probability [5,6,7,8,9,10].
Integrating storage technologies into hybrid energy systems (HESs) enhances stability and increases renewable energy (RE) integration. This research reviews pumped-hydro storage (PHS) in stand-alone or grid-connected RE-based HESs, focusing on reliability, cost-effectiveness, and environmental impact. Optimization techniques, including metaheuristics and advanced methods, are applied. PHS shows significant techno-economic and environmental benefits over battery storage, with GA, Solver, or particle swarm optimization being the most effective methods for cost and environmental efficiency. Other authors used HOMER Pro version 3.16.2 software to model irrigation systems which resulted in a combination of a submersible pump, PV modules’ rated capacity, and a battery bank size, which indicates that using a storage system allows for constant water flow for irrigation systems. Also, exploring solar water pumping, some research shows that a PHS and/or battery bank are economical solutions for improving irrigation systems [11,12,13,14,15,16]. For these solutions, economic models were developed to ascertain the economic feasibility of the hybrid plant. Hence, high-fidelity software (i.e., HOMER® 3.16.2, HY4RES—the newly developed tool—, Python3, MATLAB® R2024a, and MS 365 Excel® (Version 2407 Build 16.0.17830.20056)—Solver models) was utilized for both the design analysis and energy system optimization [17,18,19,20,21,22].
Henceforth, this research develops the implementation of an interesting comparison between hybrid energy models, i.e., the developed one, HY4RES, and the existent one, HOMER, as innovative and interesting approaches applicable in irrigation systems that use renewable energies as their main energy sources, powered by solar panels, PHS, and the electric grid as the secondary source when renewable components are not available.
For energy storage, the solution uses hydropower and pump storage whenever possible, reducing the use of batteries. The main objective is to minimize environmental impact and create a hybrid scheme as self-sufficient as possible depending on loads and production. In addition, the system needs to be economically viable, with the sale of the excess clean generated energy to the electric grid contributing to the project’s financial profit and sustainability [23,24,25,26].
Throughout this investigation, a full simulation of an irrigation system operation will be designed and analyzed, including the system characterization, its different components, the interaction between sources’ availability, operation mechanisms, and economic performance evaluation showing the associated benefits, flexibility, and feasibility. The irrigation system, of 6000 hectares, is located in southern Spain, on the Guadalquivir River basin, with crop fields of mainly citrus trees. The irrigation is run 24 h, pressurized and supplied with water from the upper reservoir.
For this purpose, this research explored a new model, HY4RES (Hybrid for Renewable Energy Solutions), under the scope of the research project HY4RES (Hybrid Solutions for Renewable Energy Systems) EAPA_0001/2022 within the INTERREG ATLANTIC AREA PROGRAMME, specifically to test its consistency, performance, ability, flexibility, and reliability when compared with HOMER (Hybrid Optimization of Multiple Energy Resources), a widely known commercial software. Both were designed to assist in the optimization of microgrids and distributed energy systems. Widely used in the energy sector, HOMER aids in planning, designing, and analyzing microgrid projects, especially those incorporating renewable energy sources. Instead, HY4RES is a tailored model that was developed, where the combination of elements and the flexibility of operation are added values requiring knowledge of mathematical languages and optimization algorithms [27,28,29,30]. In both models, key features are identified, which include the following:
- Versatile system modeling: supports off-grid, grid-tied, and hybrid systems combining multiple energy sources (solar, wind, diesel generators, and battery storage);
- Optimization: minimizes costs or emissions by optimizing the energy resource mix, considering load demands and renewable energy variability;
- Simulation: provides detailed insights into system performance, reliability, and economic viability through time-based simulations;
- Economic analysis: evaluates cost-effectiveness, including capital and operating costs, and provides key financial metrics (in HY4RES the net present value (NPV) or in HOMER the net present costs (NPC = −NPV), internal rate of return (IRR), and payback period);
- Renewable integration: integrates various renewable sources and battery storage systems;
- Grid interaction: models grid-tied systems for selling or buying power and designs reliable off-grid systems;
- Sensitivity analysis: allows for the analysis of the effect of key parameter changes on system performance and economics;
- User interface: features an intuitive graphical interface with visualization tools for data interpretation and presentation.
In terms of applications, both (the HY4RES and the HOMER) models (i) provide reliable, affordable electricity solutions to remote or underserved areas; (ii) develop resilient systems for grid outages or natural disasters; (iii) optimize energy systems for businesses to reduce costs and enhance sustainability; and can (iv) create robust power solutions for different types of operations.
Besides this, HY4RES, a newly developed model, and HOMER, as a commercial energy model, also present the following main advantages:
- Model a wide range of energy systems and scenarios;
- Identify cost-effective and sustainable energy solutions;
- HOMER is trusted by professionals, researchers, and policymakers globally.
In summary, the research to develop the HY4RES model uses the algorithm of Solver, in Excel, or the Python language for single- or multi-objective optimization functions. However, a simpler algorithm can be conducted via a non-linear generalized reduced gradient (GRG) method, which often finds the best local solutions. However, to enhance precision, the multistart option was selected, combining GRG’s speed with the evolutionary method’s accuracy based on genetic algorithms (GAa). This approach aims for a global solution with a population size of 200 and a default convergence of 0.0001. Decision variables include hydropower, grid, and solar factors, constrained between 0 and 1, with the definition of irrigation hours allowed. On the other hand, HOMER is a powerful commercial tool for designing and optimizing energy systems with renewable and distributed resources. Its ability to model complex interactions, optimize configurations, and perform detailed economic analyses makes it invaluable for developing efficient, reliable, and sustainable microgrids. It employs a blend of linear programming, heuristic optimization, and mixed-integer linear programming, using tools such as C++20, Python3, and MATLAB R2024a. HOMER’s iterative approach, integrating simulation feedback and heuristic methods (e.g., genetic algorithms) effectively navigates non-linearities and discrete decision variables, enhancing scenario analysis and components’ selection.
Hence, this research work is structured as follows: Section 1, as formerly presented, includes a recent literature review on the subject of hybrid energy solutions and optimization models, in particular for HY4RES, a newly developed model, and HOMER, a commercial software. Section 2 presents the materials and methods used in this research. Section 3 presents the main components of the hybrid system defined in both the HY4RES and HOMER models, and Section 4 presents the Results and Discussion for the economic optimization objective function for different scenarios of exploration for the HY4RES and HOMER models. Lastly, Section 5 presents the main conclusions and limitations of each model.
2. Materials and Methods
The methodology used to develop this research study is based on HY4RES (Hybrid for Renewable Energy Solutions), a newly developed model built to create a tailored hybrid energy system that better suits the water sector and process industry applications. It is versatile in terms of objective functions, hydraulic circuit characterization, economic performance indicators, CO2 emissions, hydro production and pump energy consumption, and grid or battery support. HOMER (Hybrid Optimization Model for Electric Renewables) is a simulation and optimization tool developed to model hybrid energy microgrids. It contains a highly developed economic model, taking into account factors such as capital costs, operation and maintenance, and component replacement. HY4RES is not specifically for electric components, as HOMER better covers these components, but more specifically covers the hydraulic and mechanical components’ integrated behavior.
For both models, some auxiliary tools are required for hydraulic simulators for hydro and pump systems, as presented in Figure 1a. In Figure 1b a brief scheme of the economic analysis is provided.
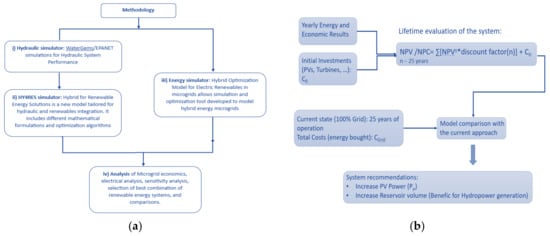
Figure 1.
Base methodology. (a) Main components of the simulation and analysis, and (b) economic analysis procedure.
Using this kind of methodology, this research aims to evaluate the technical and economic viability of the system to be implemented by optimizing the components to find the best combination that minimizes total costs and meets water-energy nexus requirements (Figure 1).
For the HY4RES model, the flowchart explains the tailored optimization model that can be defined (Figure 2) depending on the considered elements in the hybridization. For this study, the HY4RES model was optimized to maximize the yearly grid cash flow, via variation of the hydropower and pump energy that is attributed, according to what is feasible, with the following defined restraints: minimum and maximum reservoir volume, maximum required hydropower, maximum available solar energy, and maximum grid energy to supply the pumps.
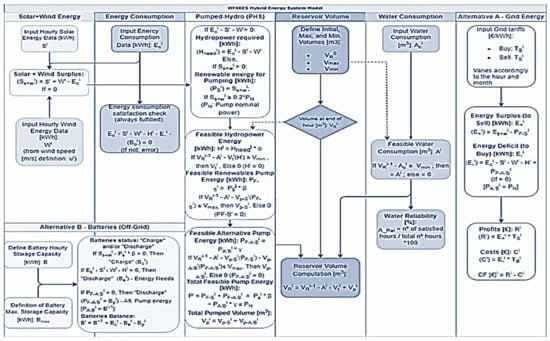
Figure 2.
Brief flowchart explaining the complex tailored and flexible model for HY4RES.
The HOMER model uses the following approach, as explained in Figure 3.
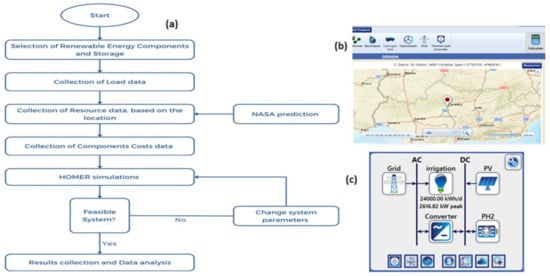
Figure 3.
HOMER model definition. (a) Base methodology, (b) case study’s location, and (c) defined microgrid with solar PV, grid, load as irrigation, converter, and PHS.
To perform correct simulations, detailed data on the system components are defined to create different steps, as shown in Figure 3a. The selection of the location of the project will influence the available radiation (Figure 3b), wind, and water availability, as well as the topography in terms of reservoir implantation. The microgrid for the irrigation case study is presented in Figure 3c.
After the definition of the hybrid solution and restrictions imposed for each model operation, the obtained results will show the influence of various parameters, taking into account, firstly, the behavior and functioning of the system in terms of energy (production/need) and, secondly, the economic aspect, in which a comparison is made between the new optimized hybrid renewable system and the current system (Base-case) without renewables.
For this research, three cases were studied, varying the volume of water made available annually for irrigation. The sequence used was 3000 m3/ha for Case 1, as the reference design, 1000 m3/ha for Case 2, and, finally, 6000 m3/ha for Case 3. These water allocations are based on common water designations for the yearly irrigation season of the under-analysis region and the range of crops cultivated (citrus trees). For all cases, the setup used in both models, HY4RES and HOMER, is the same within each model limitation, with only varying volumes of water allocation in HY4RES and load variation for each case in HOMER. HY4RES is a new model developed for this research, capable of being applied in Solver MS365, Python3, and MATLAB R2024a and is quite flexible in terms of the water allocations to be applied in the water sector where the pump and hydropower are crucial to integrate other intermittent renewables, while HOMER is a commercial model widely used in the renewable energy design projects environment.
3. System Components
3.1. Solar PV Resource
Solar PV panels are a reliable source of renewable energy, harnessing the sun’s power to generate electricity using natural resources without emitting harmful pollutants. In an economic aspect, this source is highly profitable due to the decreased installation costs and maintenance expenses making it a cost-effective investment over time. Utilizing solar PV panels as the primary energy source for irrigation systems is particularly advantageous as they provide a consistent energy supply while reducing the dependence on fossil fuels and lowering operational costs. For these reasons, the case studies aim to install 9 MW of solar energy. HY4RES used PVGIS as auxiliaries in the estimation of PV solar and Wind sources and used WaterGems for pump and hydropower hydraulic circuits operation, respectively. HOMER has its library for different types of PV panels and wind turbines but has quite limited capacity for the simulation of water allocation and hydraulic circuits.
The HY4RES model easily defines the desired power to be installed that is suited to the hydraulic system components and different configurations, such as irrigation, drinking, and process industries with water allocation, pump, and hydropower stations, combined with other renewables, complemented with grid or batteries or nothing. The HOMER model presents modular pre-defined elements that need to use multipliers to obtain the desired power installed. In this case, a generic PV component of 1 kW was chosen to simulate this installation with several components that were then increased to 9000 to achieve 9 MW of capacity. Additionally, the slope was set to 33 degrees and the derating factor to 86%, to replicate the solar system used in the HY4RES model. This derating factor is a scaling factor applied to the PV array power output to account for reduced output in practical operating conditions.
The power from the PV solar can be calculated using Equation (1) [31].
where the variables have the following representations:
- = power output during standard test conditions in kW;
- = derating factor of solar PV;
- = incident solar irradiance in kW/;
- = incident solar irradiance at standard test conditions which is 1 kW/;
- = temperature co-efficient of power;
- = cell temperature of solar PV in °C;
- = cell temperature under standard test conditions which is 25 °C.
Regarding the economic analysis, the acquisition price used was 425 EUR/kW, totaling EUR 3,825,000 (considering a 50% reduction due to government benefits). The yearly operation and maintenance costs are estimated to be 1% of the initial investment, amounting to EUR 76,500 [21]. In HOMER, the solar irradiation data were obtained from the NASA Power database built on the defined project location, where the annual average daily radiation is 4.85 kWh/m2/day. Figure 4 shows the distribution of the solar data across different months. The peak daily radiation occurs in July, with 7.76 kWh/m2/day, while the lowest daily radiation is in December, with 2.14 kWh/m2/day. According to these values, it can be concluded that the defined project’s location (in Alentejo, in the South of Portugal), receives a substantial amount of solar irradiation throughout the year, enabling a large energy production from PV solar panels.
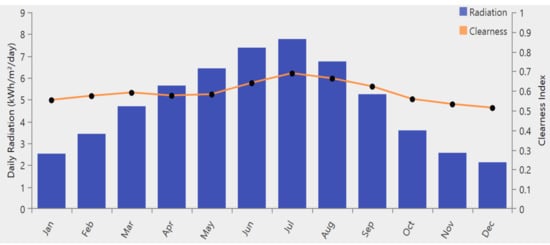
Figure 4.
Solar source from NASA power database with monthly average values of daily radiation and clearness index.
3.2. Electric Load
It is necessary to determine the electric load that needs to be met as the first step in sizing any electrical system. This involves calculating the total energy demand for irrigation, taking into account the power and operation hours. By understanding the specific energy requirements, it is possible to size the rest of the components such as the storage and converter, ensuring efficient and reliable operation for the creation of a better-suited system.
In these models, three different loads were used to simulate the energy required for allocating 1000, 3000 (reference system), and 6000 m3/ha of water annually for an irrigation field of 6000 ha. The studied values were obtained based on hourly energy consumption data. These values are distributed throughout the analyzed average year as presented in Table 1.

Table 1.
Hourly energy and water required for irrigation throughout the year.
Figure 5 is focused on 3000 m3/ha to explain some data related to the energy monthly load profile.
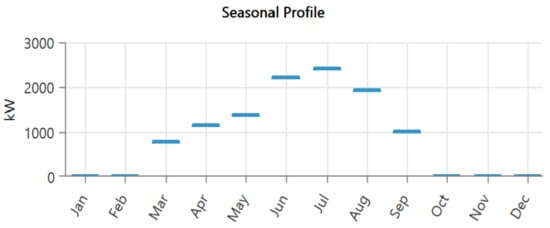
Figure 5.
Monthly energy load profile (in each hour) distributed along an average year.
In the defined case study, the irrigation season starts in March with low energy requirements, increasing until the peak load of 2420 kWh in July. The season ends in September, with energy consumption dropping to 0 kWh from October to February. The annual average energy consumption is 22,194 kWh, and the average daily consumption is 924.79 kWh. These values are presented in more detail in Figure 6.

Figure 6.
Required load for every hour and day of the year.
3.3. Grid Energy
The grid plays a key role in a highly consumed energy irrigation system, to make it doable and profitable. The aim is to use renewable energy to meet all the energy needs for a defined irrigation scheme. However, if there is not enough solar energy, the grid must provide the necessary power to maintain the normal functioning of the system. When there is an excess of energy production from the PV solar, this surplus must be used to provide the pump energy needed to fulfill the upper water pond, and the excess is sold to the grid, making the system profitable. This balance between using solar energy to feed water pumps to fill the upper pond and the irrigation needs and, when necessary, complementing the energy from the electric grid, allows for the optimization of the system.
The hourly values of energy price and the sellback rate of the grid in an average year were defined using real price data from the system location. These values were imported into the HY4RES and HOMER models, resulting in Figure 7.
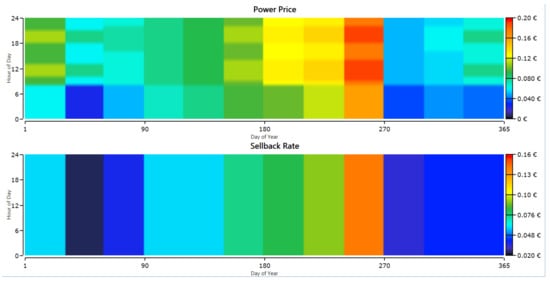
Figure 7.
Grid power price and sellback rate for every hour of the day and day of the year.
After defining the grid prices, the HOMER model needs to be adapted to be able to replicate real operating conditions and restrictions imposed by the system operation and compare it with the HY4RES model, the developed tailored model. A specified parameter is the “prohibit grid sales from the battery below a sellback price of 0.20 EUR/kWh”, to prevent depleting the reservoir for energy sales instead of storage since HOMER does not use water reservoirs. The set value corresponds to the maximum sellback rate.
3.4. Pumped-Hydropower Storage (PHS)
One of the most popular and effective types of energy storage is pumped-hydro storage (PHS). This type of storage technique consists of having two water reservoirs positioned at two different levels. The energy is stored by retaining water in the higher-elevation reservoir and, when needed, the water is released from the upper reservoir, flowing through a hydro-turbine driven by gravity to produce hydropower. During periods of surplus renewable energy production or lower demand, the excess energy is used to pump the water from the lower reservoir back to the upper one.
In the selected irrigation system, a variation is made using the upper reservoir and a nearby river (with no necessary defined volume) as the lower one. Despite this modification, the working procedure remains the same. Additionally, this particular PHS serves a dual purpose by also providing water for irrigation from the top reservoir.
HY4RES privileges the pump and hydropower operation, water needs, and the storage of water volume in the top reservoir, which affords the potential for water allocation that HOMER is not able to suit. Hence, HY4RES uses the following formulation: PHS operation depends on solar if it is available or not available, as expressed via Equation (2), where Hneedi is the required hydropower energy to satisfy the energy needs, in kWh, else with the energy needed ( satisfied by the solar energy, and if there exists a surplus of it, then the PHS is set for pump mode to use that same energy to pump water to the higher reservoir, expressed as Equation (3), where PSi is the available renewable energy to be used by the pumps, in kWh.
Regarding the turbine operation, the PHS system only produces hydropower if there is enough water stored in the top reservoir, already discounting the water allocation for irrigation (Equation (4)), and in reverse mode as a pump, the water allocation subtraction is also considered in Equation (5).
where VRi−1 corresponds to the reservoir volume at the end of the previous hour, is the water allocation to be guaranteed, Vti to the turbine volume, both in m3, and Vpi corresponds to the pumped volume, in m3. The turbine volume is computed by the following formula, Equation (6), based on [17,18,19,20,21,22]:
with the variable (α) being the hydropower factor, a value between 0 and 1; Hneedi is the required hydropower energy for energy needs, in kWh; ηt the average turbine + generator efficiency; and Ht is the average turbine head.
In the pump mode, the feasible renewable energy for the pump (PF−Si) in kWh is obtained via Equation (7):
The grid contribution for the pump station plus the available renewable energy for the pump (PSi) multiplied by its factor (β) is lesser or equal to the nominal power (PN), as described with the following Equation (8):
On the other hand, HOMER needs to define a specific type of component, PH 245 kWh, with the specifications presented in Table 2.

Table 2.
HOMER component vs. real system PHS specifications.
Since the specifications between HOMER components and the real system need adaptations, the number of components was defined as 1078 to achieve the storage capacity and power output of the real system using Equation (9).
E [kWh] = 9.81 ρwater Vres Hhead ƞ/(3.6 × 106)
- E is the energy stored in kWh;
- ρwater is the density of water, 1000 kg/m3;
- Vres is the volume of the reservoir in m3;
- Hhead is the available head in m;
- ƞ is the efficiency of the energy conversion and must consider losses like turbine efficiency, generator efficiency, and hydrodynamic losses.
Then, in the HOMER model, it was imposed that the minimum value of the reservoir is 10.96% of its total capacity. This value attends to avoid problems with the turbine and pump system. The initial state of charge of the reservoir at the beginning of the year is set to be 76%, after the simulation of the upper reservoir volume variation based on the HY4RES model.
To implement this type of energy storage, the initial investment was set to be EUR 2,240,000 to install the turbines and modify the pumps, assuming the top reservoir and some pipes are already installed, since other necessary components were already installed. The operation and maintenance costs were set to be EUR 94,000/year [21,22].
3.5. Converter and Controller
For the HOMER model, an electric converter is considered as a device that changes electrical energy from AC to DC or vice-versa depending on the type of equipment to be installed. In a system under analysis, where components work together using different forms of energy, a converter is vital for the system’s operation. It is divided into two parts: a rectifier and an inverter. An inverter converts direct current (DC) to alternating current (AC), which is essential for connecting the PV panel and the PSH (DC) to the load or grid (AC) (see Figure 3). A rectifier converts AC to DC, which is not used in this solution, except in the critical case where the grid provides power for the PSH. On the other hand, the controller is the final piece in the design of this system in HOMER, adjusting the system’s operation to meet desired objectives by changing its priorities and the way components interact. The strategy chosen in HOMER was Load Following (LF). According to HOMER’s explanation, when excess energy is needed, grid purchases are made only to meet the primary load demand. Lower priority objectives, such as charging storage, are not supplied unless renewable energy is available. In the HY4RES model, these electric devices do not need to be defined, since this model does not consider electric components.
4. Results and Discussions
The defined irrigation system presents different water allocations, with the status quo or the reference solution being for 3000 m3/ha. Sensitivity analyses are carried out for lower and higher values of the water allocation, such as 1000 and 6000 m3/ha, to enhance the system’s ability and operation behavior, as well as in terms of economic indicators and energy purchase and production for each case study.
There are main variables to better interpret the results and find the best option for the system by evaluating the following parameters:
- Net present cost (NPC): this is the difference between the present value of all costs, including operation and maintenance (O&M) costs and replacement costs over the project’s lifetime, and the present value of the revenue the project earns over its entire lifetime;
- Levelized Cost of Energy (LCOE): this is the ratio of the total average cost of producing electrical energy to the total electrical energy produced by the system;
- Operation and maintenance (O&M) Cost: these are the costs associated with the operation and maintenance of the equipment, such as the pumped-hydro storage (PHS), photovoltaic (PV) panels, and converters. HOMER uses the O&M costs for different systems as input to calculate the total O&M cost of the system over the complete project cycle.
With NPC representing the difference between the current value of all the costs including O&M costs, replacement costs for the lifetime of the project, and the present value of the revenue the project earns over its entire lifetime, the projects should be designed in such a way as to reduce the NPC [27]. HOMER uses the discount rate to calculate the NPC. The NPC can be calculated using the following Equations (10) and (11) [28]:
where the variables have the following representations:
- TAC = total annualized cost;
- CRF = Capital Recovery Factor;
- N = number of years;
- i = annual interest rate 10% [21,22].
Levelized Cost of Energy (LCOE) is the ratio of the average cost of electrical energy produced and the total electric load served by the system. This can be calculated using the following Equation (12):
where the variables have the following representations:
- = total annualized cost, in EUR;
- = total electric load served, in kWh.
The O&M costs are the costs associated with the wear and tear of the equipment such as PV solar, pump, and hydropower equipment. These can be variable or fixed costs associated with the project. These usually cover the maintenance of the pump and hydropower systems, and other equipment. Models receive the O&M costs for different systems as input and calculate the total O&M cost of the system over the complete cycle of the project [30,32,33,34,35,36,37,38,39,40,41].
4.1. Case 1—3000 m3/ha (Status Quo)
By running the simulation models for 25 years of lifespan, and using the load of 3000 m3/ha, the results are presented and explained. Starting with the project economics, Table 3 presents a comparison between a Base case (using energy from the grid) and the proposed system (prioritizing energy from renewables, namely PV and PHS, whenever available) under investigation, with a discount rate of 10%. The Base case only takes into account the reservoir and the grid, buying all the energy from it. It has a fixed maintenance cost of EUR 74,000 associated with the operation of the pumps that supply water to the top reservoir, with no initial investment since it already exists.

Table 3.
HOMER economics from the Base case (grid) versus proposed system (PV and PHS).
Analyzing the results, both models present similar outcomes, and it can be concluded that the system under study (with renewable energy) is more profitable compared to the base system (from the grid). The initial investment is significant, at ~EUR 6.0 million, compared to the system with no initial costs. However, the operation and maintenance (O&M) costs are significantly lower, amounting to only a quarter of the initial investment in the first year of operation, and further decreasing due to the applied discount rate. This difference in values is attributable to the PV panels supplying energy, with any excess being sold, and the PSH system charging and discharging daily. This operation reduces the need for energy purchases from the grid, as it feeds the system for a few hours each day. After 25 years of operation (Figure 8), the benefits of the new system become evident with a cost difference of ~EUR 650,000 compared to the base system, completely offsetting the initial investment. While the base system suffered a loss of EUR 9.1 M over 25 years, the proposed system has only EUR 8.4 M in costs of energy. Additionally, it is important to emphasize the reduction in the cost of energy, from EUR 0.124/kWh to EUR 0.072/kWh.
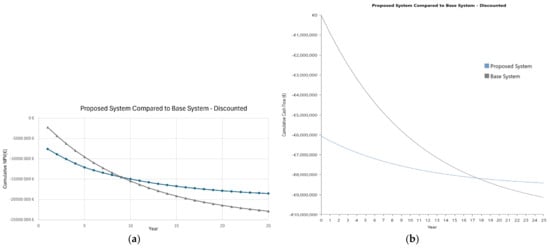
Figure 8.
Cumulative NPV, over years of the systems’ operation (discounted): (a) HY4RES model and (b) HOMER model.
As power input for the irrigation system, the PV solar will provide the highest energy contribution producing between 75 and 86% of the whole energy required, buying only 25–14% of total energy from the grid, which greatly reduces operating costs. Also, from consumption values, the grid sales have a percentage of 37.3%, with the remaining 62.7% used for irrigation in the HOMER model. The HY4RES model exhibits a similar behavior, emphasizing the importance of renewables (i.e., PV solar and PHS) (Figure 9). Small differences are justified by the type of data used from different databases and the characteristics of PV solar panels.
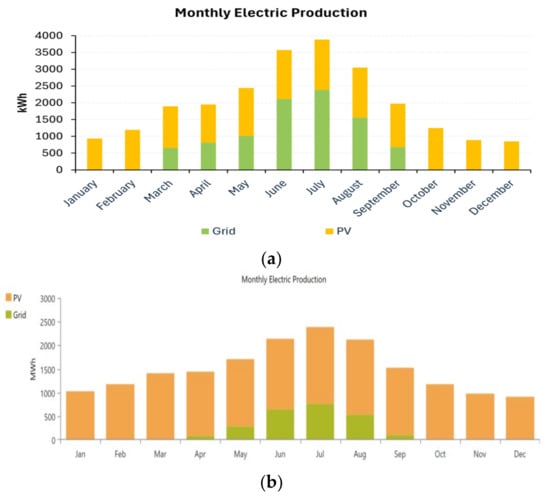
Figure 9.
Monthly energy production from renewables: PV and grid for a year. (a) HY4RES and (b) HOMER.
Analyzing Figure 10, as expected, the PV power output varies with the hour of the day, and with the day of the year, on a smaller scale. This figure has a color graph and confirms this information by displaying a yellow stripe (6000–9000 kW) between 10 a.m. and 7 p.m. which corresponds to peak production power, and another color gradient from green to purple (5000–1000 kW) for the rest of daylight hours, with the most visible being the two-tone blue line. In black (0 kW) is the power output during nighttime. The solar power output is the same for all cases.
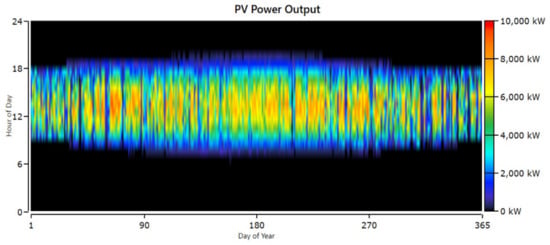
Figure 10.
Variation of PV power output with hours of the day and days of the year.
For the pumped-hydro storage (PHS), Table 4 presents some important parameters to take into consideration. Analyzing these values, the losses are significant when compared with the energy in and out, however it is on purpose. The PHS is responsible not only for energy storage but also for supplying water for irrigation which means a large loss of water that could be used to generate hydropower.

Table 4.
PHS parameters.
Knowing the water volume used for irrigation every hour, throughout the year, it was possible to calculate the amount of energy loss and transform that value into efficiency by knowing the energy input. The HOMER Pro version 3.16.2 software cannot simulate water needs, as a volume unit, especially water supply in a pumped-hydropower storage solution between two reservoirs (i.e., an upper and a bottom one). Therefore, to account for the required water for irrigation, it is necessary to impose energy dissipation on the PHS, to ensure that the lost energy equals the energy consumption by the pumps to store water in the upper reservoir, for later use in irrigation.
The state of charge of the water storage tank is also one of the essential parameters in both the economic and functional evaluation of the system. Figure 11 shows two different graphs of the state of the reservoir over the course of a year, respectively, from HY4RES and HOMER. It can be seen that there is a big drop in the month of April and from then on it stays close to the minimum value for the rest of the irrigation season, which is not an ideal situation.
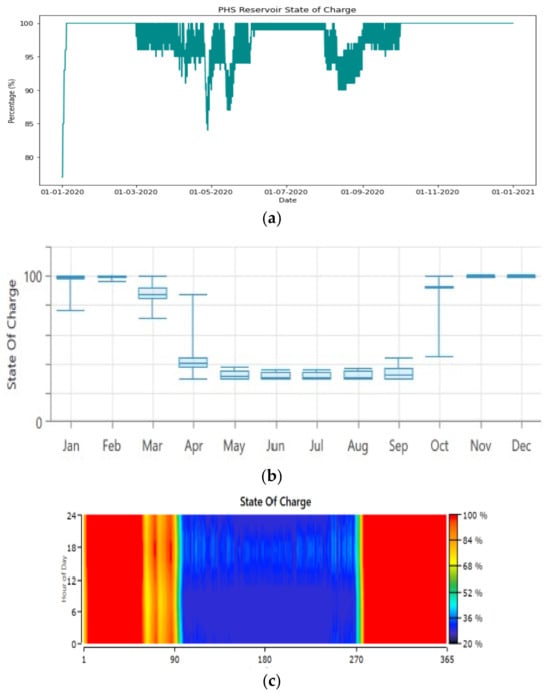
Figure 11.
Charge of the water storage reservoir hourly throughout the average year: (a) HY4RES through energy balance; (b) HOMER variation of the state of charge; (c) state of the charge related to the hour of the day throughout the year.
Since the water reservoir cannot remain at the minimum state of charge for more than 1 h due to irrigation requirements, this minimum value needs to be increased to ensure continuous irrigation. To know the minimum value in HOMER, the maximum duration in which the reservoir stayed at the minimum level was evaluated. Compared to the reservoir capacity of 1,078,627 m3, this corresponds to 17.7%. Adding this to the absolute minimum level of 10.96%, the final minimum reservoir level to assure irrigation throughout the year is 28.7%.
Figure 12 shows all the main parameters when evaluating this irrigation system over a year using HY4RES and HOMER. In January and February, there is no irrigation; the primary load is 0 kWh, so all the energy produced with PV solar is sold to the grid after filling the reservoir. In March, the irrigation season begins, so part of the energy produced is now used to meet the load requirements with any excess used to charge the storage and sold to the grid. The pumped-hydro storage starts working, as well as the fluctuations in the state of charge for the reservoir. In HOMER, when these values are below 0 (in Figure 12b top) it means that it is turbinating (generating energy) and above 0 is pumping (spending energy). In April, there is a slight increase in the load, resulting in a noticeable sharp decrease in the state of charge of the reservoir due to increased water turbine activity to generate power. When the storage reaches its minimum value, it becomes necessary to purchase energy from the grid. Since there is no excess energy, there are no sales. As the reservoir approaches its minimum value and only charges by a few percentage points per day, the combination of solar energy and storage becomes insufficient to supply irrigation for the entire day, necessitating more frequent use of the grid.
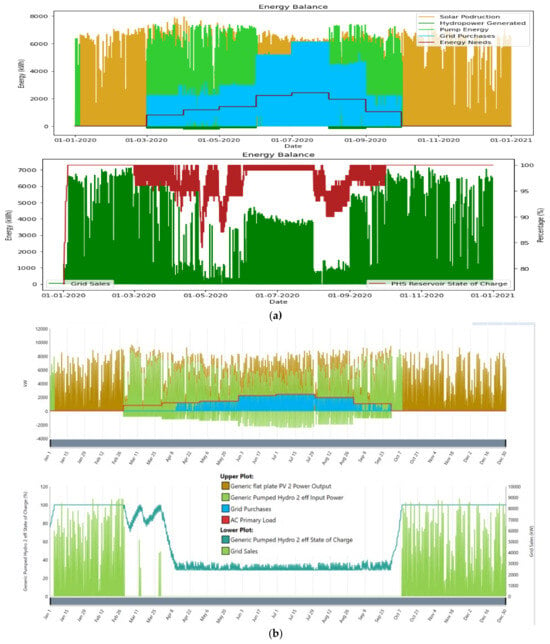
Figure 12.
Overview of energy balance for both models for the water allocation of 3000 m3/ha: (a) HY4RES and (b) HOMER.
After providing an overview of the system’s performance over the course of an average year, Figure 13, Figure 14 and Figure 15 offer a more detailed analysis throughout a single day in different months. On 20 March, as seen in Figure 13, from midnight to almost 7 a.m., the PHS supplied power (indicated by the green line below 0) to ensure the irrigation, with no need for any grid purchases due to the top reservoir level (around 85%). At 6 am, the PV panel begins generating energy from solar radiation, reducing the need for hydropower. By almost 7 a.m., the PV output matches the load, stopping the power production from the PHS. As soon as there is a surplus of energy produced by renewables, it is used to pump water to the top reservoir, storing energy. Between 8 a.m. and 6.30 p.m., power generation exceeds demand, allowing for the charging of the storage and an increase in the water level of the top reservoir. The cycle repeats as the absence of solar energy is compensated for with the PHS. HY4RES evaluates better the PHS and irrigation water allocation.
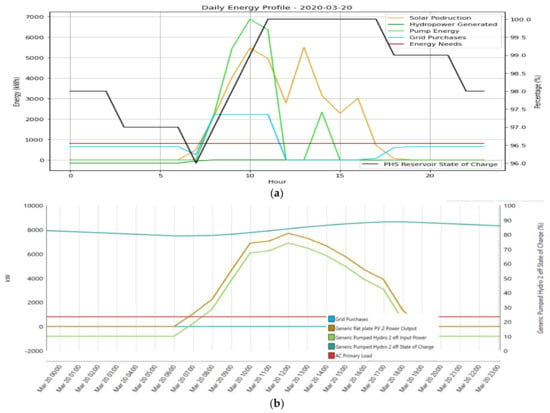
Figure 13.
System behavior for 20th March of the analyzed average year: (a) HY4RES and (b) HOMER.
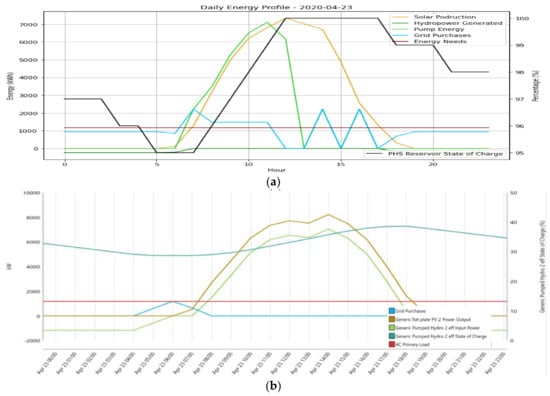
Figure 14.
System behavior for 23 April of the analyzed average year: (a) HY4RES and (b) HOMER.
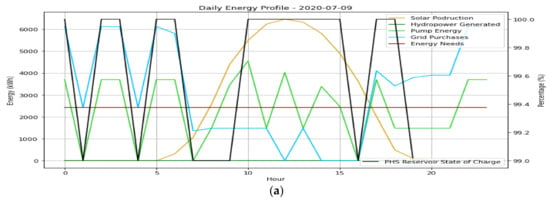
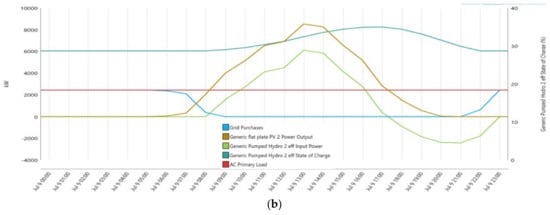
Figure 15.
System behavior for a day on 9 July: (a) HY4RES and (b) HOMER.
Analyzing the data for 23 April, the concept remains the same, but with a higher load, which places greater demand on the PHS during nighttime hours making the state of charge of the storage less stable (Figure 14). It is also evident that the reservoir reaches its minimum value, forcing the purchase of energy from the grid until solar energy becomes sufficient. Subsequently, the reservoir begins to refill, and the rising percentage is shown in both graphs.
In the peak load month, for 9 July (Figure 15), the system’s behavior follows the same pattern as previously described. However, the reservoir is at or near its minimum capacity during this period, requiring more energy from the grid as it has less capacity to provide power. This analysis is more sensible in HY4RES simulations where the reservoir charges throughout the day, beginning to provide power for irrigation energy needs and water allocation at the top reservoir. Consequently, during the night period, the energy is purchased from the grid and, in HY4RES, also from the PHS. Nevertheless, the PHS, with its charging capability during the day, still manages to supply power together with PV solar for the irrigation requirements for approximately 7 h, reducing the need for power purchase from the grid by a few hours daily.
A similar pattern of energy balance over a week is obtained with both models (Figure 16). HY4RES has an upper reservoir water level that needs to follow the operation constraint conditioning and, at the same time, all the hydropower and pumping processes, as well as the water allocation for irrigation supply. This model is more specific, incorporating in its optimization all the interaction components of the system, in which the energy for pumping, to guarantee enough water, is crucial to satisfy 24 h of irrigation and is an important imposed restriction. HOMER has a simpler definition because some conditions cannot be defined as tailored to each system’s characteristics as HY4RES, which requires a more complex controlled simulation process, depending on the imposed water-energy nexus restrictions and operating conditions, as specified in Figure 2.
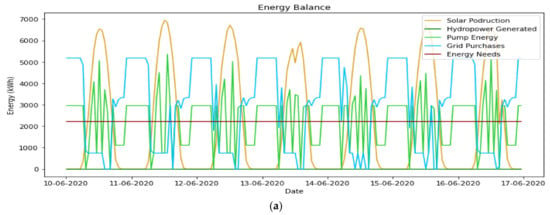
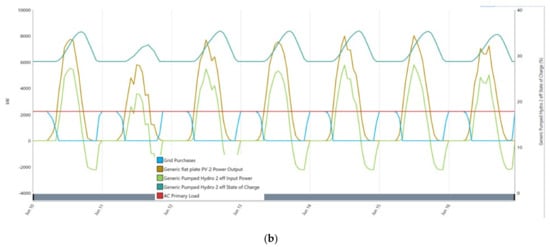
Figure 16.
The behavior of the system over one week in the middle of June, for similar input data: (a) HY4RES and (b) HOMER.
4.2. Case 2—1000 m3/ha
In this case, the HY4RES model was used with ease, and the HOMER model with the necessary adjustments in load and water requirements to simulate an allocation of 1000 m3/ha per year, with some factors to approach the real operation system. The economic results are presented in Table 5.

Table 5.
HOMER economics from the Base case versus the proposed system.
The HY4RES model uses a different database for PV solar and calculates the PHS system taking into consideration all the defined hydraulic circuits’ and hydraulic machines’ (i.e., pumps and turbines) efficiencies, bearing in mind all the restrictions imposed by the irrigation system operation and government or region to selling PV solar only after 5 years of production. HOMER has an easier interactive platform, enables modular and compact use of its input data library, and is not so easy to adopt restrictions in terms of water irrigation allocation. Comparing the values, the Base case has no initial investment and an O&M cost of EUR 384,950 in the first year, which is then reduced due to a 10% discount rate, resulting in a NPC of EUR 3,494,210 after 25 years. For the case under study, with renewables, the NPC is slightly higher due to the initial investment of EUR 6.07 million, with an operating cost of EUR −272,234, indicating a profit each year of operation. After 15 for HY4RES or 25 years for HOMER, because all restrictions cannot be considered as for HY4RES, both systems present similar result patterns in terms of economic tendency. However, with each passing year, the system under proposal reduces its cost, while the Base case only increases. Benefits associated with the water value paid by farmers, crop production, selling and exportation, and other associated agriculture benefits are not considered in both models since they are benefits downstream of the implemented system. Thus, it is only a matter of waiting a few years after the proposed system with renewables to see a return on the total initial investment. A graphical representation of this explanation is shown in Figure 17.
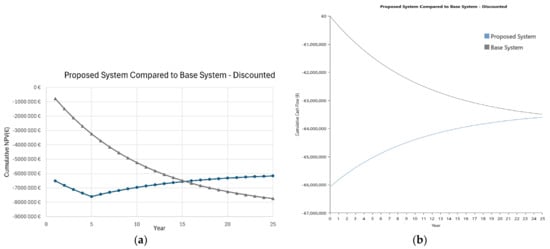
Figure 17.
Cumulative cash flow, over the years of the system’s operation: (a) HY4RES and (b) HOMER.
The focus here is also on the O&M costs, with grid sales making this value negative, indicating a profit of EUR 442,734 for the first year. This indicates significant cost savings and reduced dependence on the grid, achieved through the use of renewables.
The difference from the 3000 m3/ha case is that, as the load and energy needs are lower, more energy is sold to the grid, resulting in a significant profit. Additionally, with less energy lost (i.e., in water for irrigation), the pumped-hydro storage (PHS) system becomes more efficient, providing more power when the PV panel is not sufficient or during night hours, thereby reducing costs in grid purchases.
As seen from the comparison of energy purchases and sales from/to the grid, the Base case buys all the energy it needs from the grid, while the proposed system makes absolutely no purchases from the grid throughout the year, selling only energy. These energy sales depend on the surplus, so the value is higher during the months without irrigation or with less water-energy needs, and lower during the hottest months, when irrigation is more intense, requiring more energy.
According to these results, the system is capable of operating without the need to use the grid, making it 100% autonomous. As for the electrical production and consumption values, HOMER provides the following results (Table 6 and Table 7).

Table 6.
Electrical production during a year.

Table 7.
Electrical consumption during a year.
For this equivalent HOMER-model-derived water allocation, PV solar produces almost 100% (Figure 18) of the energy used, and 27% of that energy is used for irrigation, with the remaining ~73% being sold to the grid.
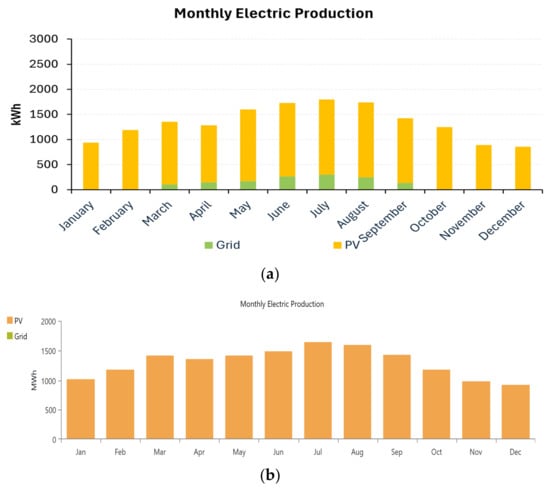
Figure 18.
Monthly electric production comparison between PV and grid for a year: (a) HY4RES and (b) HOMER.
For the pumped-hydro storage, Table 8 presents some important parameters for energy and nominal capacity.

Table 8.
PHS parameters.
The losses in Table 9 play a crucial role in the HOMER model to factiously simulate the irrigation system, representing the energy loss in the PHS, in order to be able to allocate water for irrigation during the year. Considering that the energy that enters via PHS is 3,026,828 kWh in a year, the losses in HOMER correspond approximately to 55%. In this case, as shown in Figure 19, the state of the charge of the reservoir is near 100% in both models (i.e., HY4RES and HOMER) all year, so the energy that enters the PHS is much lower than the reference case of 3000 m3/ha due to being almost full all year. In HY4RES, the water allocation may be input data, but in HOMER it is achieved via losses.

Table 9.
HOMER economics from the Base case versus the proposed system.
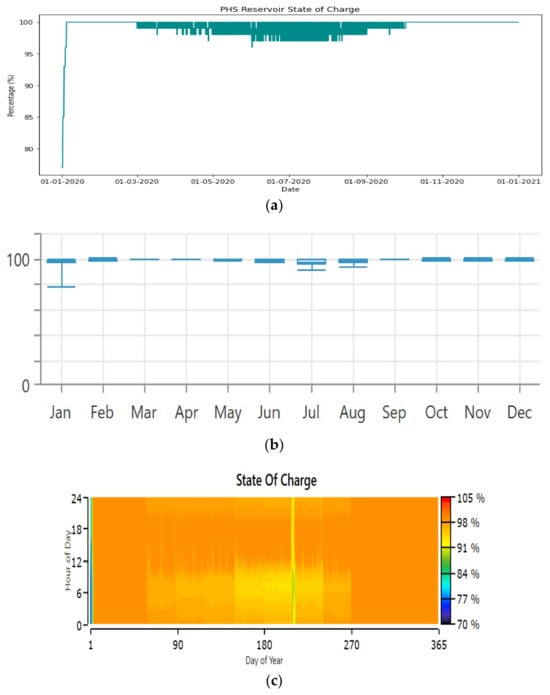
Figure 19.
Variation in the state of charge of the water storage reservoir every month: (a) HY4RES; (b) HOMER; and (c) state of charge of the water storage reservoir hourly throughout the year.
Figure 19 shows the state of the reservoir over the course of the analyzed average year. It can be seen that, in this case, it has three-times-less load than the previous one, which requires less energy from the solar panel and the PHS, leading to better charging during daylight hours and less discharging during night hours. This difference means that the reservoir remains close to its maximum level throughout the year, only changing in the most critical months.
Once again, Figure 20 contains all the important parameters for evaluating this system with both models when the water allocation is 1000 m3/ha.
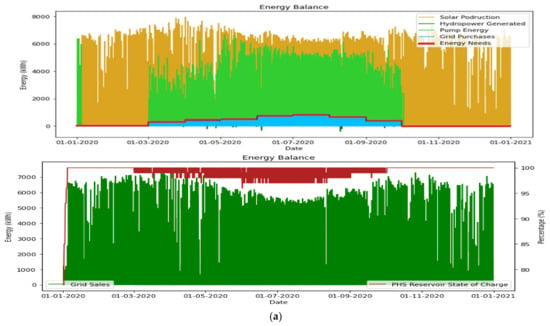
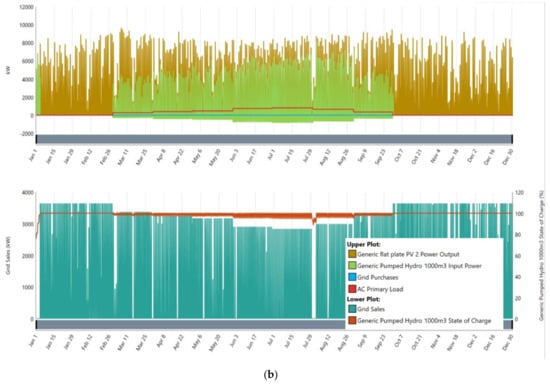
Figure 20.
Overview of how the system behaves over a year, for a water allocation of 1000 m3/ha: (a) HY4RES and (b) HOMER.
Compared with the 3000 m3/ha, our reference case, the differences can be seen mainly in the large volume of energy sales throughout the year, only decreasing according to the energy needs for irrigation, but always with very high values. Another major difference is the level of the reservoir, which always remains close to the maximum value but fulfills its purpose of supplying water and energy to the irrigation system during the irrigation season and is therefore constant at 100% outside this period.
The red line in the top graphs (Figure 20a,b) shows the energy required for irrigation, which, compared to the solar energy produced, is very low, thus allowing the excess to be used to charge the reservoir and then be sold to the grid.
The system behavior is consistent throughout the year, so it was chosen to show only one day in July—the month with the highest energy and water requirements—for this analysis. In Figure 21, the blue line has a quite low value throughout the irrigation season for the grid purchase, as formerly discussed. The pumped-hydro storage maintains the system’s operation during daylight hours, and when the PV panel is not sufficient, the decrease in the state of charge of the reservoir is shown by the black curve. When there is excess energy production from the PV panel, the green line shows a positive value, indicating energy consumption by the PHS in pump mode to fill the water reservoir, thereby increasing the state of charge. This optimization demonstrates precisely how the system should operate.
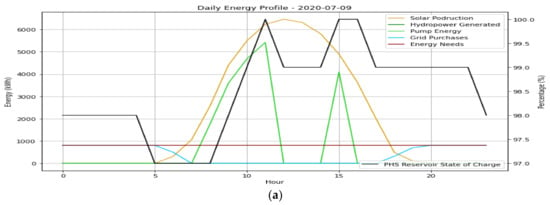
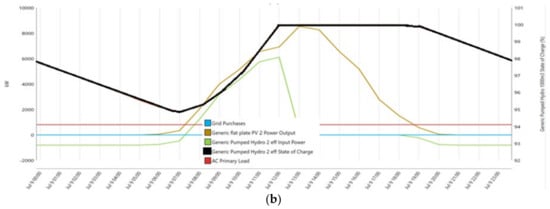
Figure 21.
System behavior for a day in July: (a) HY4RES and (b) HOMER.
4.3. Case 3—6000 m3/ha
For this case, using the same configurations as in the previous analysis and changing only the energy load and water needs, a different system behavior was observed, with more restrictions on water-energy availability.
In Table 9 the economic analysis results are presented.
For this case, the NPC value is slightly higher for the system under study (with renewables) (with a difference of EUR 287,100) than for the Base case (only grid) due to the high initial investment. After 25 years, it is still not economically beneficial compared to the system with no initial capital. However, the proposed system is not entirely dismissible, as the operating and maintenance costs are lower, with a substantial difference of EUR 637,073 for the first year of operation, which is then reduced by the 10% discount rate. Therefore, it is only a matter of a few years before the proposed system economically outperforms the Base system and becomes the most profitable.
Figure 22 confirms the previous analysis, as the distance between the two respective lines of each system reduces, suggesting the economic approximation of the proposed system (with renewables) and the consequent return on the investment made.
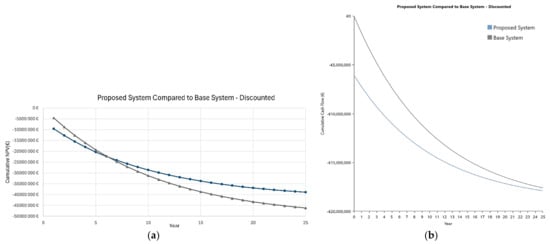
Figure 22.
Cumulative cash flow, with the discount rate, over the years of the system’s operation: (a) HY4RES and (b) HOMER.
One notable difference from Cases 1 and 2 already studied is the absence of energy sales to the grid, even outside the irrigation season.
As for the electrical production and consumption values, the following Table 10 and Table 11 provide more information.

Table 10.
Electrical production during a year.

Table 11.
Electrical consumption during a year.
As power input, the solar panel produces 42% of the whole energy required, buying 58% of the total energy from the grid which allows for the reduction in some operating costs (Figure 23).
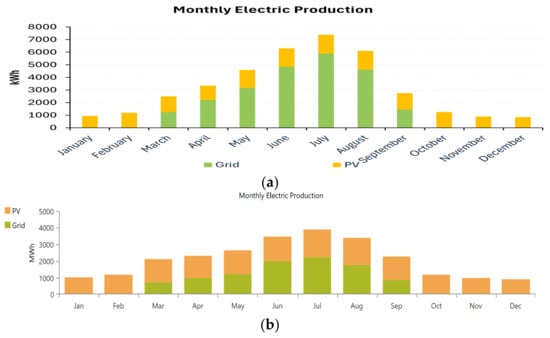
Figure 23.
Monthly electric production comparison between PV and grid for a year: (a) HY4RES and (b) HOMER.
Analyzing the parameters of pumped-hydro storage, Table 12 provides the main information.

Table 12.
PHS parameters.
The presentation of the water reservoir level for this case over the course of a year is shown in Figure 24. Initially, the reservoir starts at 76% similar to the other cases, rising slowly until the irrigation season begins, at which point it drops abruptly to the minimum level, remaining there throughout the irrigation period, rising only when it ends. The rapid fall is a result of the low efficiency of the system in terms of excessive water allocation for the reservoir capacity, which was not noticeable in the previous cases, for lower water allocations.
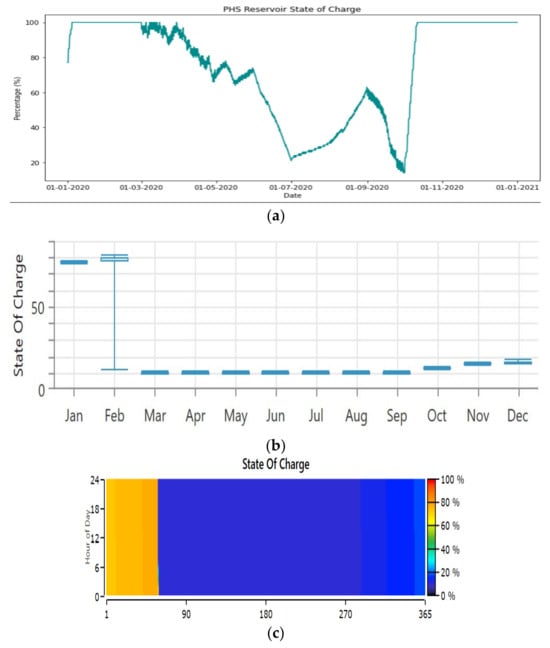
Figure 24.
Variation in the state of charge of the water storage reservoir every month: (a) HY4RES; (b) HOMER; (c) state of charge of the water storage reservoir hourly throughout the year.
Starting with a comparison with the previous cases, in the first two months of the year and the last three (when there is no irrigation), the energy produced by the solar panel was used to feed the PHS until the reservoir volume reached 100%, which was relatively quick. Afterward, all the energy produced was sold to the grid since there was no load and the storage was full. Since the reservoir never reaches maximum capacity, no energy is sold to the grid during the irrigation season. The HY4RES model, after the irrigation season, puts in operation the PHS to sell energy to the grid, allowing for associated benefits (Figure 25).
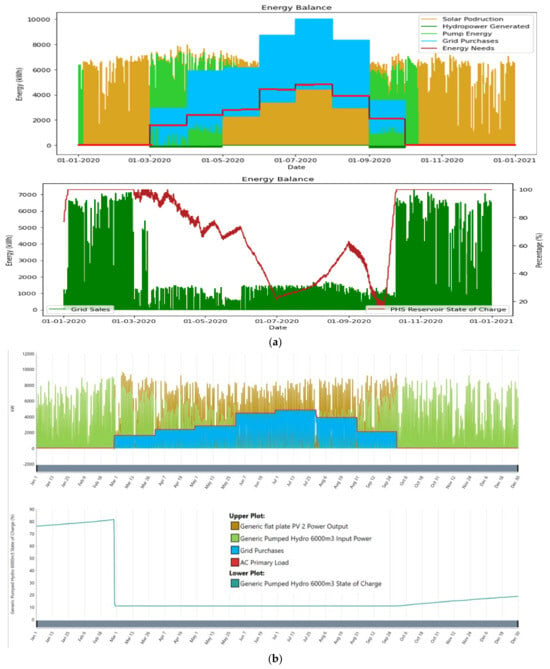
Figure 25.
An overview of how the system works over a year showing the main parameters under evaluation: (a) HY4RES and (b) HOMER.
The PHS system is an energy storage method that works based on two reservoirs at different water levels. When there is an excess of PV solar energy, the water is pumped into the top reservoir, and when there is not enough PV solar, the water is relieved to generate energy. Since HOMER does not take into account the water allocation to supply irrigation, the measure imposed was to reduce the efficiency so that the energy lost corresponded to the energy that would not be turbined due to the water used for irrigation. In the HY4RES model, this is considered and formerly explained, which makes the HY4RES model more adaptable to water needs in the water sector systems.
During the non-irrigation period, the HOMER behavior should be similar to other cases, using the excess energy to fill the storage and then selling the excess, producing a profit.
During the irrigation period, there is practically no energy generation by the turbines, as there is no excess water available, and considerable assistance from the electrical grid is needed for the system to be able to withstand the imposed loads.
Figure 26 shows the reduction in the reservoir level when the hydropower starts, producing only a small amount of energy, as indicated by the green curve with a value slightly below 0, just a few hours after the irrigation season begins. When the reservoir reaches its minimum level, it becomes necessary to buy energy from the grid until solar production exceeds the imposed load.
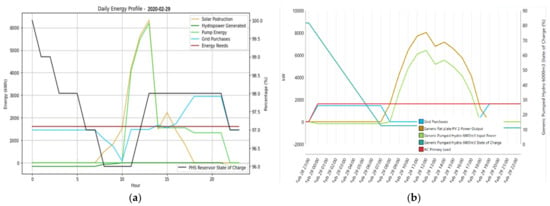
Figure 26.
System behavior as soon as the irrigation starts: (a) HY4RES and (b) HOMER.
In April (Figure 27), the behavior remains the same: during the hours without sunlight, the energy used is bought from the grid because the reservoir is at its lowest level, and during the sunny hours, the PV panel ensures irrigation and the excess is used to pump water into the reservoir; in the HY4RES model, this effect is significant. Filling the reservoir is necessary to supply water for irrigation, but its energy production is not relevant.
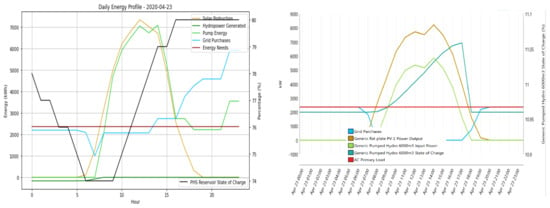
Figure 27.
System behavior for a day in April: (a) HY4RES and (b) HOMER.
In the most critical month (Figure 28), July, there is a notable decrease in the excess energy produced by the renewable energy source, increasing grid purchases and decreasing the energy supply to the PHS in pump mode.
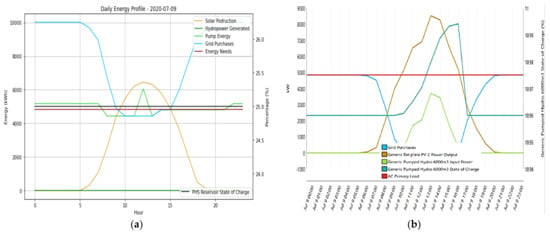
Figure 28.
System behavior for a day in July: (a) HY4RES and (b) HOMER.
4.4. Summary
Figure 26, Figure 27 and Figure 28 reveal a difference of approximately EUR 650,000 in the NPC, despite the initial investment of EUR 6.07 M. This difference is justified by the operating and maintenance costs, which go from EUR 1,006,813 (Base case) to EUR 266,009 (proposed system under study) in the first year.
Starting with a general analysis comparing the three cases studied after 25 years of operation and using the same configuration and parameters for all three, it can be concluded that the first case is the best design application for the proposed system under study. This is because it is the most economically profitable, with a lower NPC compared to its Base case (only grid purchased) (Table 13). Additionally, it behaves very closely to the idealized system, and its components are correctly sized for the annual water availability of 3000 m3/ha. Regarding the NPC, this concept is a cost balance that accounts for the initial investment and operation and maintenance costs. Within the considered lifespan of 25 years of the project, the Base system in Cases 2 and 3 is economically less expensive than the proposed system under study.

Table 13.
Economic parameters for the three cases.
However, the proposed solution presents several other benefits not quantified in this study. In terms of electrical production and consumption (Table 14 and Table 15), the volume of water available for irrigation and hydropower and the power installed in PV solar are crucial parameters in the optimization for searching for the best design and operation with fewer limitations and higher satisfaction.

Table 14.
Electrical production for a year for the three cases.

Table 15.
Electrical consumption for a year for the three cases.
5. Conclusions
A new methodology to develop and analyze hybrid energy systems (HESs) is presented based on a newly developed model built specifically to create tailored hybrid energy systems that better suit the water sector and process industry applications by using the HY4RES (Hybrid for Renewable Energy Solutions) model. It is versatile in terms of objective functions, hydraulic circuit characterization, namely pump energy consumption and hydropower production schemes, water allocation associated with the water sector (i.e., drinking, wastewater, irrigation, and process industry systems), calculating economic performance indicators, CO2 emissions, and also allow grid or battery support. The HY4RES model presents several mathematical formulations and different optimization algorithms based on Solver, in Excel, or it can all be developed in Python for single- or multi-objective optimization functions and multi-variables. In this research, a single algorithm was selected to conduct the non-linear generalized reduced gradient (GRG) method, which often finds the local best solutions combined with the multistart option, with the evolutionary method based on genetic algorithms (GAs), to improve the accuracy and the global optimum solution.
To compare and complement this approach, the methodology also uses the HOMER (Hybrid Optimization Model for Electric Renewables) model as a simulation and optimization tool developed to model hybrid energy microgrids. It contains a highly developed economic model, taking into account its library for renewable sources, capital costs, operation and maintenance, and component replacement. HOMER better covers the microgrid electric schemes, while HY4RES is more specifically for hydraulic and mechanical components’ integrated behavior. Both models show their flexibility in the optimization of hybrid renewable solutions, presenting similar pattern results that were analyzed in detail, enhancing the advantages and limitations of each model. For both models, some auxiliary tools are required for hydraulic simulators for a better characterization of hydro and pump initial design solutions.
In this research, the application was defined as a Base case, with no renewables for an irrigation system based on a pump hydraulic circuit to pump water to a top reservoir from a river, to guarantee a 3000 m3/ha of water allocation for an irrigation system of 6000 ha. The Proposed system uses the same water allocation but considers the implementation of renewable sources, such as PV solar and pumped-hydropower storage (PHS) requiring the application of optimization to better find the best energy solution in terms of maximization of cash flow along 25 years of a project lifespan (Case 1). Sensitivity analyses were also developed for two additional case studies: Case 2—for 1000 m3/ha—and Case 3—for 6000 m3/ha—of water allocation with several consequences in the energy system behavior in terms of water-energy nexus management, energy solution hybridization and optimization, and system flexibility. This sensitivity analysis allows us to enhance the solutions’ advantages and limitations, such as the following:
- ○
- In terms of energy, Case 1—3000 m3/ha—proves to be beneficial. The PV panel supplies ~87% of the energy produced, while only ~13% is bought from the electricity grid. The PHS works as expected, charging during hours of excess solar energy production and progressively discharging during hours without sunlight. This provides energy for irrigation 24 h a day, as an objective of this selected irrigation system, reducing the need to purchase energy from the grid. The storage system is highly effective, supplying energy throughout the night and almost the entire night in the most critical months, even when the reservoir is near its minimum level. The PHS’s contribution is remarkable, reducing dependence on the grid and lowering the system’s operating costs. The HY4RES model shows the dynamics of PHS operation with a great contribution to the system profit by selling energy to the grid, taking into account, for this analysis, cash flow optimization;
- ○
- Case 2—1000 m3/ha—was expected to be the most economically advantageous in all aspects, since the volume of water used for irrigation is the lowest, which consequently reduces energy requirements and improves the efficiency of the PHS. However, the NPC values are practically identical, differing by only EUR 100,000. For the Base case (with no renewables implementation and energy supplied only by the grid), there is no initial investment and an O&M cost of EUR 384,950 in the first year, resulting in a NPC of EUR 3,494,210. The proposed system under study, on the other hand, starts with an initial investment of EUR 6.07 million, which is realistic but very highly associated with the RES implementation. In the first year of operation, it makes a profit of EUR 272,234 and continues to be profitable each year, returning around EUR 3 million of the initial investment. This puts it on a bit higher level than the Base case system, which is very positive economically. In terms of energy balance, the system’s behavior is ideal as it does not need to buy energy from the electric grid and sells 73.4% of the energy it produces. From a general perspective, the developed and built models for this application are highly efficient, with their strengths including low operating costs and not requiring energy purchases from the grid;
- ○
- For Case 3—6000 m3/ha—the volume of water allocation used for irrigation is very high, leading to rising operating costs. Combined with the initial investment, the Proposed system simulation resulted in a higher NPC value of approximately EUR 200,000 compared to the Base case, making it the least profitable application of the system alerting for a correct optimization analysis depending on the water-energy needs. The Proposed system (with renewables) under study is significantly aided by the PV solar panel, which produced 39% of the required energy. Consequently, 61% of the energy is purchased from the grid, but the system allowed for the reduction of part of the O&M value. Irrigation requires a high volume of water, which means that there is no excess water available to generate hydropower and therefore it shall be complemented by the grid.
HOMER, for the higher water allocation, fails in terms of water management in reservoirs towards pump and hydropower operation, to ensure water needs, whereas HY4RES, the newly developed model, is capable of accounting for the water volume variable and managing the system to meet both energy and water needs. Hence, in HOMER, the hydropower unit operates with solely the energy target, but HY4RES takes into account the available volume to satisfy water requirements for consumption. All these factors culminate in Case 3—with the higher water allocation—being the less profitable application among the three case studies. It also puts on display the optimization models’ skills and the system’s operation behavior.
Regarding the developed integrated methodology, the HY4RES and HOMER models proved to present invaluable simulations and optimization tools, equipped with a well-developed and accurate energy management estimation and economic indicators that were tailored for more modular designs and water-energy nexus managing, guiding towards the best optimization solutions. Despite their advantages and limitations, it was possible to simulate the Base case and the Proposed system using both models showing the flexibility and sustainability of hybridization of irrigation systems with a near-ideal accuracy. This was true both economically, with detailed cost implementation and maintenance component analyses, and energetically, showing the system’s dynamic behavior and the influence of specific parameters depending on the previously imposed conditions. Results closely matched the best outcomes that were expected for the analyzed irrigation system. Consequently, important results were obtained on the feasibility of applying the system across different scenarios, considering factors such as location, available resources, and component specifications.
Although the values are not coincident between both models (i.e., the HY4RES and the HOMER models), the result patterns, type of system behavior, and evolution of water-energy allocation, depending on each system characteristic, are quite similar. The differences in values can easily be explained by the HOMER model not being able to ensure/control with 100% satisfaction the water consumption for irrigation, which makes the system easier and more flexible. It ends up always optimizing for values of lower energy consumption and lower pumped-hydropower storage and uses mainly energy from the grid. Both models have their strengths, whereas HOMER is suited for a deep techno-economic analysis optimization with energy consumption as the unique variable, the HY4RES model is designed to manage two consumption factors, water and energy, increasing its complexity but diminishing elasticity in its results, as seen through this research work. Nevertheless, this model serves as a guideline model for systems with a water-energy nexus that requires the assembly of multiple energy sources, renewable or not, for a variety of applications. The implementation of a PHS system deeply influences the logic behind the design of the HY4RES model, as it considers the consumption/storage of both energy and water volume. This contrasts with the HOMER model, which explains the difference in the obtained results. Additionally, HY4RES may serve as a basis for future updates on the HOMER Pro version 3.16.2 software to allow for the detailed analysis of systems with water needs, apart from energy.
In conclusion, this study has highlighted the significant benefits of exploring the Proposed irrigation system in addressing the identified challenges. It presents an innovative irrigation model that harnesses solar radiation to generate energy, stores this energy efficiently without relying on batteries, and minimizes dependence on the grid. By achieving these objectives, the system effectively reduces greenhouse gas emissions, diminishes reliance on fossil fuels and conventional batteries, and ultimately contributes to a more sustainable future. This underscores its potential to make a meaningful environmental impact and pave the way toward greater sustainability in energy use and agricultural practices.
Author Contributions
Conceptualization, J.S.T.C., A.B.A. and H.M.R.; methodology, J.S.T.C., A.B.A., J.G.M. and H.M.R.; software and calculus, J.S.T.C. and A.B.A.; writing—original draft preparation, A.B.A., J.S.T.C. and H.M.R.; review, J.G.M., O.E.C.-H., M.P.-S. and H.M.R.; supervision, H.M.R. and M.P.-S.; editing and final preparation, all authors. All authors have read and agreed to the published version of the manuscript.
Funding
The authors are grateful for the project HY4RES (Hybrid Solutions for Renewable Energy Systems) EAPA_0001/2022 from the INTERREG ATLANTIC AREA PROGRAMME, for the grants of the two first authors, as well as the Foundation for Science and Technology’s support to UIDB/04625/2020, the research unit CERIS, for the lab support.
Data Availability Statement
The used data are available in this manuscript.
Acknowledgments
This work was supported by FCT, to UIDB/04625/2020 CERIS, in the Hydraulic Laboratory, for experiments on PATs and pumped-storage performance, and the project HY4RES (Hybrid Solutions for Renewable Energy Systems) EAPA_0001/2022 from the INTERREG ATLANTIC AREA PROGRAMME. This research was carried out during Modesto Pérez-Sánchez’s stay at the CERIS-IST research center, called the “INCORPORATION OF NEW WATER RESOURCES IN IRRIGATION SYSTEMS THROUGH THE USE OF SUSTAINABLE TECHNOLOGIES AND COMPUTATIONAL TOOLS TO MITIGATE WATER SCARCITY”.
Conflicts of Interest
The authors declare no conflicts of interest.
Nomenclature
| Acronyms | |
| AC | Alternating Current |
| CO2 | Carbon Dioxide |
| CRF | Capital Recovery Cost |
| DC | Direct Current |
| GA | Genetic Algorithm |
| GRG | Generalized Reduced Gradient |
| HES | Hybrid Energy System |
| HY4RES | Hybrid for Renewable Energy Solutions |
| LCOE | Levelized Cost of Energy |
| LF | Load Following |
| NPC | Net Present Cost |
| NPV | Net Present Value |
| O&M | Operation and Maintenance |
| PH | Pumped-Hydro |
| PHS | Pumped-Hydropower Storage |
| PSH | Pumped-Storage Hydropower |
| PV | Photovoltaic |
| RE | Renewable Energy |
| TAC | Total Annualized Cost |
| Variables | |
| Ai | Water consumption [m3] |
| Cann,tot | Total annualized cost [Eur] |
| Eni | Energy needs [kWh] |
| Eserved | Total electric load served [kWh] |
| fPV | PV derating factor |
| g | Gravity acceleration [9.81 m/s2] |
| GT | Total incident solar irradiance [kW/m2] |
| GT,STC | Total incident solar irradiance at STC [1 kW/m2] |
| H | Pump head [m] |
| Hneedi | Required hydropower [kWh] |
| Ht | Average turbine head [m] |
| i | Annual interest rate [%] |
| N | Number of years |
| PF-Si | Feasible renewable for pump [kWh] |
| PN | Pump nominal power [kW] |
| PPV | PV power generated [kW] |
| PSi | Available renewable for pump [kWh] |
| Si | Solar energy [kWh] |
| SS+Wi | Renewable surplus [kWh] |
| Tc | Cell temperature of Solar PV [ºC] |
| Tc,STC | Cell temperature at STC [25 ºC] |
| Vmax | Maximum reservoir volume [m3] |
| Vmin | Minimum reservoir volume [m3] |
| Vpi | Pumped volume [m3] |
| VRi | Reservoir volume [m3] |
| VRi−1 | Previous reservoir volume [m3] |
| Vti | Turbine volume [m3] |
| YPV | Power output at STC [kW] |
| α | Hydropower factor |
| αP | Temperature coefficient of power |
| β | Renewable factor |
| γ | Grid factor |
| ηt | Average turbine efficiency [%] |
| ρ | Water density [kg/m3] |
References
- Energy Sector Management Assistance Program (ESMAP). Hydropower: Unveiling the Socioeconomic Benefits Technical Report (English). Washington, D.C.: World Bank Group. 2024. Available online: http://documents.worldbank.org/curated/en/099052324145538260/P1742021a3c29a0ff1bd8f16f1b85adf503 (accessed on 9 June 2024).
- Tobias, K. Powering the Future: Hydropower Provides Stable Energy for Fluctuating Needs, Voith Hydro Report. Available online: https://www.waterpowermagazine.com/analysis/powering-the-future-hydropower-provides-stable-energy-for-fluctuating-needs/?cf-view (accessed on 10 July 2024).
- World Hydropower Outlook, Opportunities to Advance Net Zero. Available online: https://www.hydropower.org/publications/2024-world-hydropower-outlook (accessed on 2 June 2024).
- Hydropower Europe, Powering Europe in a Sustainable Way, WP4-DlRp-53: Research & Innovation Agenda. Available online: https://hydropower-europe.eu/ (accessed on 10 July 2024).
- Onu, U.G.; Silva, G.S.; de Souza, A.C.Z.; Bonatto, B.D.; da Costa, V.B.F. Integrated design of photovoltaic power generation plant with pumped hydro storage system and irrigation facility at the Uhuelem-Amoncha African community. Renew. Energy 2022, 198, 1021–1031. [Google Scholar] [CrossRef]
- Šćekić, L.; Mujović, S.; Radulović, V. Pumped hydroelectric energy storage as a facilitator of renewable energy in liberalized electricity market. Energies 2020, 13, 6076. [Google Scholar] [CrossRef]
- Sidnell, T.; Clarke, F.; Dorneanu, B.; Mechleri, E.; Arellano-Garcia, H. Optimal design and operation of distributed energy resources systems for residential neighbourhoods. Smart Energy 2021, 4, 100049. [Google Scholar] [CrossRef]
- Caldera, U.; Sadiqa, A.; Gulagi, A.; Breyer, C. Irrigation efficiency and renewable energy powered desalination as key components of Pakistan’s water management strategy. Smart Energy 2021, 4, 100052. [Google Scholar] [CrossRef]
- Ashok, S. Optimised model for community-based hybrid energy system. Renew. Energy 2007, 32, 1155–1164. [Google Scholar] [CrossRef]
- Shahzad, M.K.; Zahid, A.; Rashid, T.; Rehan, M.A.; Ali, M.; Ahmad, M. Techno-economic feasibility analysis of a solar-biomass off grid system for the electrification of remote rural areas in Pakistan using HOMER software. Renew. Energy 2017, 106, 264–273. [Google Scholar] [CrossRef]
- Das, P.; Das, B.K.; Mustafi, N.N.; Sakir, M.T. A review on pump-hydro storage for renewable and hybrid energy systems applications. Energy Storage 2021, 3, e233. [Google Scholar] [CrossRef]
- Zamanlou, M.; Iqbal, M.T. Design and Analysis of Solar Water Pumping with Storage for Irrigation in Iran. In Proceedings of the 2020 IEEE 17th International Conference on Smart Communities: Improving Quality of Life Using ICT, IoT and AI (HONET), Charlotte, NC, USA, 14–16 December 2020; pp. 118–124. [Google Scholar] [CrossRef]
- Chandel, S.S.; Naik, M.N.; Chandel, R. Review of solar photovoltaic water pumping system technology for irrigation and community drinking water supplies. Renew. Sustain. Energy Rev. 2015, 49, 1084–1099. [Google Scholar] [CrossRef]
- HOMER Pro-Microgrid Software for Designing Optimized Hybrid Microgrids. Available online: https://www.homerenergy.com/products/pro/index.html (accessed on 1 March 2024).
- Rezk, H.; Abdelkareem, M.; Ghenai, C. Performance Evaluation and Optimal Design of Stand-Alone Solar PV-Battery System for Irrigation in Isolated Regions: A Case Study in Al Minya (Egypt). Sustain. Energy Technol. Assess. 2019, 36, 100556. [Google Scholar] [CrossRef]
- Obaid, W.; Hamid, A.-K.; Ghenai, C. Hybrid water pumping system design: A case study in Dubai, United Arab Emirates. Case Stud. Therm. Eng. 2021, 26, 101121. [Google Scholar] [CrossRef]
- Nyeche, E.N.; Diemuodeke, E.O. Modelling and optimisation of a hybrid PV-wind turbine-pumped hydro storage energy system for mini-grid application in coastline communities. J. Clean. Prod. 2020, 250, 119578. [Google Scholar] [CrossRef]
- Silva, D.; Velazco, M.; Oliveira, A. Influence of matrix reordering on the performance of iterative methods for solving linear systems arising from interior point methods for linear programming. Math. Methods Oper. Res. 2017, 85, 97–112. [Google Scholar] [CrossRef]
- Fytilis, K.; Semos, A. Crop management by linear programming. A literature review. Int. J. Innov. Sci. Res. Rev. (IJISRR) 2022, 4, 2364–2366. [Google Scholar] [CrossRef]
- Fytilis, K. Linear programming in agriculture using the solver tool of excel. Int. J. Sci. Technol. Res. 2022, 4, 73–76. [Google Scholar] [CrossRef]
- Shah, K.K.; Modi, B.; Pandey, H.P.; Subedi, A.; Aryal, G.; Pandey, M.; Shrestha, J. Diversified crop rotation: An approach for sustainable agriculture production. Adv. Agric. 2021, 2021, 8924087. [Google Scholar] [CrossRef]
- Fathy, E. A new method for solving the linear programming problem in an interval-valued intuitionistic fuzzy environment. Alex. Eng. J. 2022, 61, 10419–10432. [Google Scholar] [CrossRef]
- He, Y.; Guo, S.; Zhou, J.; Ye, J.; Huang, J.; Zheng, K.; Du, X. Multi-objective planning-operation co-optimization of renewable energy system with hybrid energy storages. Renew. Energy 2022, 184, 776–790. [Google Scholar] [CrossRef]
- Luz, T.; Moura, P. 100% Renewable energy planning with complementarity and flexibility based on a multi-objective assessment. Appl. Energy 2019, 255, 113819. [Google Scholar] [CrossRef]
- Rauf, H.; Gull, M.S.; Arshad, N. Complementing hydroelectric power with floating solar PV for daytime peak electricity demand. Renew. Energy 2020, 162, 1227–1242. [Google Scholar] [CrossRef]
- Zhang, Y.S.; Lian, J.J.; Ma, C.; Yang, Y.; Pang, X.L.; Wang, L. Optimal sizing of the grid-connected hybrid system integrating hydropower, photovoltaic, and wind considering cascade reservoir connection and photovoltaic-wind complementarity. J. Clean. Prod. 2020, 274, 123100. [Google Scholar] [CrossRef]
- Fan, J.; Xie, H.; Chen, J.; Jiang, D.; Li, C.; Tiedeu, W.N.; Ambre, J. Preliminary Feasibility Analysis of a Hybrid Pumped-Hydro Energy Storage System Using Abandoned Coal Mine Goafs. Appl. Energy 2020, 258, 114007. [Google Scholar] [CrossRef]
- Ma, T.; Yang, H.; Lu, L.; Peng, J. Pumped Storage-Based Standalone Photovoltaic Power Generation System: Modeling and Techno-Economic Optimization. Appl. Energy 2015, 137, 649–659. [Google Scholar] [CrossRef]
- Ilham, M.; Baladraf, T. Potential Design of Photovoltaics-Pumped Hydro Storage System at Ex-Paser Mine Holes in East Kalimantan. In Proceedings of the 1st International Seminar on Teacher Training and Education, ISTED 2021, Purwokerto, Indonesia, 17–18 July 2021; EAI: Purwokerto, Indonesia, 2021. [Google Scholar] [CrossRef]
- Isaac, A.; Tanyi, E.; Ali, A.; Agajie, T.F.; Khan, B.; Ballester, J.B.; Nsanyuy, W.B. Optimal Modeling and Feasibility Analysis of Grid-Interfaced Solar PV/Wind/Pumped Hydro Energy Storage Based Hybrid System. Sustainability 2023, 15, 1222. [Google Scholar] [CrossRef]
- Ramos, H.M.; Sintong, J.E.; Kuriqi, A. Optimal Integration of Hybrid Pumped Storage Hydropower toward Energy Transition. Renew. Energy 2024, 221, 119732. [Google Scholar] [CrossRef]
- Garcia, A.V.M.; Sánchez-Romero, F.J.; López-Jiménez, P.A.; Pérez-Sánchez, M. A New Optimization Approach for the Use of Hybrid Renewable Systems in the Search of the Zero Net Energy Consumption in Water Irrigation Systems. Renew. Energy 2022, 195, 853–871. [Google Scholar] [CrossRef]
- Türkay, B.E.; Telli, A.Y. Economic analysis of standalone and grid connected hybrid energy systems. Renew. Energy 2011, 36, 1931–1943. [Google Scholar] [CrossRef]
- Kenfack, J.; Neirac, F.P.; Tatietse, T.T.; Mayer, D.; Fogue, M.; Lejeune, A. Microhydro-PV-hybrid system: Sizing a small hydro-PV-hybrid system for rural electrification in developing countries. Renew. Energy 2009, 34, 2259–2263. [Google Scholar] [CrossRef]
- Lilienthal, P.; Givler, T. Using HOMER Software, NREL’s Micropower Optimization Model, to Explore the Role of Gen-Sets in Small Solar Power Systems; Case Study: Sri Lanka; Technical Report; NREL: Golden, CO, USA, 2006. [Google Scholar]
- Diaf, S.; Diaf, D.; Belhamel, M.; Haddadi, M.; Louche, A. Methodology for optimal sizing of autonomous hybrid PV/wind system. Energy Policy 2007, 35, 5708–5718. [Google Scholar] [CrossRef]
- Dalton, G.; Lockington, D.; Baldock, T.E. Feasibility analysis of renewable energy supply options for a grid-connected large hotel. Renew. Energy 2009, 34, 955–964. [Google Scholar] [CrossRef]
- Net Present Cost. n.d. Available online: https://homerenergy.com/products/pro/docs/3.15/net_present_cost.html (accessed on 10 April 2023).
- Levelized Cost of Energy. n.d. Available online: https://homerenergy.com/products/pro/docs/3.15/levelized_cost_of_energy.html (accessed on 8 May 2023).
- Operation and Maintenance Cost. n.d. Available online: https://homerenergy.com/products/pro/docs/3.15/operation_and_maintenance_cost.html (accessed on 14 June 2023).
- HOMER 3.15, PV Array Power Output. Available online: https://homerenergy.com/products/pro/docs/3.15/how_homer_calculates_the_pv_array_power_output.html (accessed on 20 May 2024).
Disclaimer/Publisher’s Note: The statements, opinions and data contained in all publications are solely those of the individual author(s) and contributor(s) and not of MDPI and/or the editor(s). MDPI and/or the editor(s) disclaim responsibility for any injury to people or property resulting from any ideas, methods, instructions or products referred to in the content. |
© 2024 by the authors. Licensee MDPI, Basel, Switzerland. This article is an open access article distributed under the terms and conditions of the Creative Commons Attribution (CC BY) license (https://creativecommons.org/licenses/by/4.0/).