Abstract
Thermal infrared imaging could detect hidden faults in various types of high-voltage power equipment, which is of great significance for power inspections. However, there are still certain issues with thermal-imaging-based abnormal heating detection methods due to varying appearances of abnormal regions and complex temperature interference from backgrounds. To solve these problems, a contour-based instance segmentation network is first proposed to utilize thermal (T) and visual (RGB) images, realizing high-accuracy segmentation against complex and changing environments. Specifically, modality-specific features are encoded via two-stream backbones and fused in spatial, channel, and frequency domains. In this way, modality differences are well handled, and effective complementary information is extracted for object detection and contour initialization. The transformer decoder is further utilized to explore the long-range relationships between contour points with background points, and to achieve the deformation of contour points. Then, the auto-encoder-based reconstruction network is developed to learn the distribution of power equipment using the proposed random argument strategy. Meanwhile, the UNet-like discriminative network directly explores the differences between the reconstructed and original image, capturing the deviation of poor reconstruction regions for abnormal heating detection. Many images are acquired in transformer substations with different weathers and day times to build the datasets with pixel-level annotation. Several extensive experiments are conducted for qualitative and quantitative evaluation, while the comparison results fully prove the effectiveness and robustness of the proposed instance segmentation method. The practicality and performance of the proposed abnormal heating detection method are evaluated on image patches with different kinds of insulators.
1. Introduction
Electric power systems play a crucial role in modern society, providing reliable and efficient energy supply for various applications [1]. However, due to the complexity and diversity of the system, potential risks and faults may arise, which may lead to power outages, equipment damage, or even safety hazards. Therefore, it is essential to conduct regular inspections and maintenance to ensure the safe and stable operation of the power system [2]. One important aspect of such inspections is transformer substation inspections, which involve checking the condition and performance of various components and systems, such as transformers, switchgears, and protective relays. To achieve this goal, various methods and tools have been developed, including visual inspection, thermography [3], acoustic monitoring, and online monitoring systems. These approaches can provide valuable information on the status of the equipment and help detect potential anomalies and defects, thus improving the reliability and efficiency of the power system.
Thermal infrared imaging has been widely applied in the field of electric power inspection due to its ability to detect thermal anomalies and provide non-destructive testing [4,5]. With the aid of thermal infrared imaging, inspectors can easily detect abnormal temperature rises caused by loose connections, faulty components, and other potential hazards in power equipment [6,7]. This technology has greatly improved the efficiency and accuracy of electric power inspections, allowing for early detection and prevention of potential equipment failures, thereby reducing maintenance costs and improving the reliability and safety of power systems. In recent years, numerous methods have been proposed for the analysis of infrared images of power equipment to detect abnormal thermal defects. However, existing abnormal thermal detection methods still face two main challenges, limiting their practical application in real-world environments:
(1) Existing methods commonly use object detection to extract target boxes and analyze the temperature within boxes areas [8,9]. However, due to the complex environments and dense equipment within transformer substations, the temperature of background objects may affect the temperature discrimination of foreground equipment. Moreover, due to the inherent low resolution and image blurring of infrared images, direct detection and segmentation of equipment from infrared images is difficult to achieve satisfactory results in various scenarios [10]. (2) Due to the varying appearances and different degrees of temperature rise, existing learning-based abnormal heating detection methods can still only handle some kinds of defect patterns. Taking insulators with voltage-induced heating faults as an example, the shape of the insulators themselves varies, and the temperature rise ranges within abnormal regions are different [11]. Meanwhile, these methods rely on several pre-defined parameters and temperature thresholds. There are many abnormal heating faults characterized by subtle temperature rises within small areas, which require precise temperature thresholds and distinguish strategies.
As shown in Figure 1, to address the above-mentioned problems, we develop a novel abnormal heating detection strategy for high-voltage power equipment. First, an efficient and accurate instance segmentation method is proposed to utilize the complementary information from visual and thermal images. Specifically, the tri-space feature fusion network is proposed to handle the significant modality differences from spatial, channel, and frequency domains. The thermal image is initially decomposed using discrete cosine transformation (DCT) [12] and encoded by multi-head self-attention to extract effective areas, which could provide more characteristic information. The multi-level RGB-T features are interacted with and projected along channel, spatial, and frequency dimensions to highlight foreground objects and suppress background noises. Multi-level fused features are further enhanced by the feature pyramid network (FPN) [13] and utilized for a fully convolutional one-stage (FCOS) detector. Meanwhile, the query-based contour deformation method is proposed to refine mask contours. Contour points are initially evolved via correlation with other contour points and are further refined by long-range dependence with all local points. Thus, in this way, the contour points can move towards the true contours in an iterative manner, which can effectively handle the inherent blurred details in infrared images. Compared with previous contour-based instance segmentation methods, the proposed method could achieve more robust performance against environmental interference.
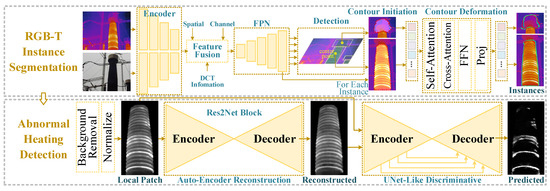
Figure 1.
Flowchart of the proposed abnormal heating detection strategy for high-voltage power equipment.
Then, in this paper, the local regions of insulators are cropped by detected bounding boxes, and the background interference is filtered out by segmentation masks. A random argument strategy is proposed to simulate abnormal heating regions to insulators during the training process, generating different kinds of appearances and enhancing the discrimination ability. Based on these augmented data, the auto-encoder network [14] could learn the distribution of data and reconstruct positive representations in a self-supervised manner. Based on the fidelity of normal reconstruction, the information removed in the reconstruction process can exhibit distinct biases between normal and abnormal data. Consequently, the UNet-like [8] discrimination network encodes both original and reconstructed images, directly capturing the difference between them and predicting probability maps of abnormal heating defects. More than 2000 pairs of RGB-T images are acquired in transformer substations and manually annotated to build the datasets. The proposed instance segmentation and abnormal heating detection methods are fully evaluated on the self-built datasets to demonstrate effectiveness and robustness.
The rest of this paper could be summarized as follows: Section 2 describes some related works. Section 3 elaborates on the proposed RGB-T instance segmentation method and subsequent abnormal heating detection method. The qualitative and quantitative experiments are conducted, and the results are detailed analyzed in Section 4. Section 5 concludes this paper.
2. Related Work
In this section, the related works for the two components within the proposed method are elaborated. Based on the detailed analysis of existing methods, the contributions of this work are summarized at the end of this section.
2.1. Instance Segmentation
Instance segmentation can predict the object category, location, and segmentation mask in a unified framework, which is generally classified into two categories:
2.1.1. Mask-Based Methods
Early on, instance segmentation in the modern sense was proposed by Hariharan et al. [15]. With the popularity of deep learning, Girshick et al. [16] proposed RCNN, which integrates AlexNet [17] to fine-tune CNN and uses selective search to obtain region proposals. To reduce the computational cost, Fast RCNN [18], Multipath Network [19], and Faster RCNN [20] are proposed successively for object detection. He et al. [21] proposed Mask RCNN, which adds a branch for predicting the object mask on the basis of Fast RCNN. Compared with two-stage methods, one-stage methods have attracted more attention, such as YOLACT [22] and SOLO [23]. One-stage methods pay more attention to structural integration and lightweight design. In recent years, Cheng et al. [24] utilized the transformer mechanism to change pixel classification tasks into mask classification problems using learnable query embeddings. Cheng et al. designed Mask2Former [25], which introduces the mask information into the transformer decoder to achieve effective segmentation.
2.1.2. Contour-Based Methods
Compared with mask-based methods, contour-based methods have better performance in terms of speed. Duan et al. [26] predicted anchor points and a set of landmarks that together define the shape of the target object. DeepSnake [27] proposed by Peng et al. uses an octagon as its initial contour and constantly optimizes itself with contour offsets. DANCE [28] designed by Liu et al. adopted a rectangle as the initial contour and adaptively divides the contour into smaller contour segments to match. Different from initializing the contour manually, Zhang et al. [29] proposed E2EC, which dynamically matches prediction points and ground truth (GT) points based on contour initialization modules and proposed multi-direction alignment to limit vertex pairing.
Nowadays, some multi-modal object detection methods have been proposed to utilize complementary information and achieve robust performance under different situations. Chen et al. [30] applied the probabilistic ensembling method to fuse the detection results, which could take advantage of single-modal images and deal with missing detections from particular modalities. Cao et al. [31] fused multi-modal cascade features using channel switching and spatial attention mechanism. The fused features are further fed into the Faster RCNN head for object detection. Ahmar et al. [32] proposed the sigmoid-activated gating mechanism to achieve early fusion and adopted the task-aligned one-stage object detection to handle fused features.
2.2. Fault Detection of Power Equipment
2.2.1. Detection and Segmentation of Power Equipment
Object detection and segmentation technologies are the basis for fault detection of power equipment [2]. Dai et al. [8] proposed the region-based convolutional network, which generates category scores based on the region proposals to determine the category of equipment. Zhang et al. [33] trained the Faster RCNN module with self-photographed datasets to detect power equipment. Different from the two-stage methods that are slow, Liu et al. [9] realized real-time automatic identification of power equipment based on YOLOv3. The feature fusion single-shot multi-box detection [34] was proposed, which designs a feature enhancement module to improve the effect of detection.
Meanwhile, various segmentation methods for power equipment have been proposed in recent years. Xu et al. [35] combined the PCNN algorithm with the intra-class absolute difference method to segment the power equipment. Li et al. [36] proposed the ratio method of maximum inter-cluster variance to intra-cluster variance and distinguish objects from backgrounds. As an unsupervised classification method, the Fuzzy C-means (FCM) clustering algorithm [37] proposed by Dunn et al. was used to automatically divide classified data sets to achieve power equipment segmentation. Furthermore, Wu et al. [38] made improvements to FCM by combining wavelet decomposition with FCM for image clustering segmentation. Due to the high cost of pixel-level annotation for images, there is still a shortage of instance segmentation datasets for power equipment. Therefore, most current methods for power equipment recognition and segmentation involve fine-tuning existing methods and networks on a small number of images, which cannot guarantee their effectiveness in practical environments.
2.2.2. Fault Detection of Power Equipment
Power equipment plays an important role in human life, and many methods have been proposed to achieve fault detection of power equipment in different electric power scenarios. The application of deep learning has promoted the development of power equipment fault detection [39]. Jian et al. [40] proposed Camp-Net, which integrates deep and shallow features of images for small components fault detection of transmission towers. Liu et al. [1] proposed a graph-based relation-guiding network (GRGN) that incorporates the relation knowledge into the power line detector. For transformer fault detection, Liao et al. [41] proposed the graph convolutional network (GCN), which uses the convolutional layer to obtain the complex nonlinear relationship between the soluble gas and the fault type. Siddiqui et al. [42] performed fault identification based on the fact that the color intensity of the insulator defect area is lower than that of the surrounding color intensity.
In addition, abnormal heating detection of power equipment is an important aspect of fault detection. Resendiz et al. [43] manually set thresholds to segment abnormal heating areas in infrared images. Lin et al. [44] used the histogram of the temperature difference of each part of the power equipment to calculate the threshold to determine whether there is a fault. Zou et al. [45] performed iterative clustering of images using the K-means method and optimized parameters with a support vector machine to detect abnormal heating regions. In [11], Zernike moments were adopted as the image feature, and a support vector machine was used as the classifier to identify the heating part. Wang et al. [46] obtained pixel coordinates of power equipment based on Mask RCNN, and combined them with temperature distribution to realize heating detection. Lin et al. [7] proposed a two-stage method for defect detection, which initially detected oriented power equipment with RCNN and analyzed the temperature distribution along the center line with one-class support vector machines.
Meanwhile, unlike industry products, the shapes, resolutions, and temperature distributions of insulators are different and constantly changing. Existing self-supervised surface anomaly detection methods [47] struggle with complex background and may not be suitable for direct application in abnormal heating detection. Thus, it is necessary to initially suppress the interference from background temperature, and on this basis, simulating abnormal heating defects is needed for self-supervised training in abnormal heating detection.
Thus, considering the shortcomings of existing methods when applied in abnormal heating detection tasks, an abnormal heating detection method for high-voltage power equipment is proposed in this paper, and the contributions could be summarized as:
- The contour-based RGB-T instance segmentation method is proposed to achieve all-day capability. The multi-modality features are fused from spatial, channel, and frequency domains, which could handle modality differences and extract complementary information. The transformer decoder is utilized to evolve contour points via long-range dependencies across whole patches rather than connections between themselves;
- After extracting instance information of power equipment and suppressing background interference, the auto-encoder network is built to learn the distribution from positive samples and reconstruct input images. Then, the UNet-like network is built to learn the joint representation of original and reconstructed images, which could capture the lost information during the reconstruction process and segment abnormal heating regions;
- The proposed instance segmentation and abnormal heating detection methods are fully evaluated on the self-built datasets. The extensive results of experiments demonstrate the superiority of the proposed RGB-T instance segmentation method and the practicality of the proposed abnormal heating detection strategy for various kinds of power equipment.
3. Proposed Method
In this section, we first introduce the design process and theoretical analysis of the proposed RGB-T instance segmentation network in detail. Then, each sub-network and training strategy of the proposed abnormal heating detection method are elaborated.
3.1. Contour-Based RGB-T Instance Segmentation Network
3.1.1. Network Architecture
The architecture of the instance segmentation network proposed in this article is shown in Figure 2. Infrared and visible images are first fed into a dual-stream backbone network to obtain multi-level features and , . Then, the tri-dimensional feature fusion method is proposed to fuse multi-modal features from the aspects of channel, spatial, and frequency. Meanwhile, fused features are fed into the feature pyramid to obtain rich multi-scale features , . The object detection boxes are extracted by the multi-head FCOS method, and then the segmentation masks for each target box are extracted. The target contour is initialized with the features of the center points of detection boxes, and then the MLP is used to optimize the initialized contour points. Based on this, a contour optimization method based on the transformer network is further proposed, which obtains the offsets via the self-attention of the contour and the cross-attention of the contour with other features. After multiple iterations, finely detailed target contour edges are obtained, completing the instance segmentation of power equipment.
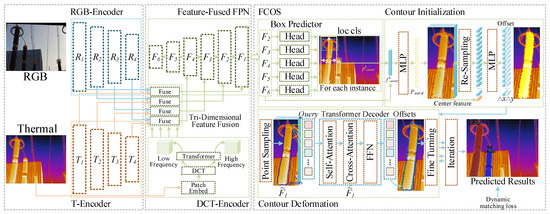
Figure 2.
Illustration of the proposed RGB-T instance segmentation network, consisting of two meaningful designs. Tri-dimensional feature fusion strategy is proposed to extract informative complementary information from RGB-T features. Transformer-based contour deformation strategy is proposed to obtain accurate segmentation masks.
3.1.2. Tri-Dimensional Feature Fusion Module
After the feature extraction of the two-stream backbone network, multi-modal features of the same scale are fused for subsequent processing. Due to the difference between infrared and visual spectra, directly fusing multi-model features by generating weight maps from spatial information is insufficient. Thus, the tri-dimensional feature fusion network is proposed to select crucial and effective information from multi-modal features. As for the abnormal heating detection task, each channel of thermal images is divided into a set of 8 × 8 patches . Each patch is converted into frequency spectrum by DCT [12] and encoded as a zigzag pattern. is flattened and reshaped to form embeddings, and then concatenated to build . Total frequency features of three color channels could be calculated as , in which each channel belongs to one band.
In practice, since a variety of power equipment and complicated backgrounds may exist in thermal images, the frequency information calculated by DCT may not handle varying scenes well. Thus, the DCT features are enhanced via learned strategies. High-frequency information in an image refers to details, edges, and textures, while low-frequency information refers to more gradual variations and broad patterns across larger areas of the image. Thus, is first downsampled and partitioned for RGB dimensions into low-frequency signals and high-frequency signals . Two multi-head self-attention (MHSA) modules [48] are adopted to enhance and among corresponding frequency bands. The MHSA module is further applied to the concatenation of enhanced and , which could further explore relations within different frequency bands to obtain frequency features . The DCT and the above-mentioned enhancement operations mainly describe the relations of the inner patches. Thus, the is further transposed and fed into MHSA layers to obtain cross-patch information .
Then, the i-th stage features and are first flattened and operated as:
in which and denote the extracted weights for RGB-T features. and denote the global max-pooling and multi-level perception (MLP) layers, which are used to aggregate features from the channel dimension. The cross weight map is calculated as , in which ‘⊙’ denotes the channel-wise multiplication. The high responses in w represent the effective channels with high responses in both visual and thermal features. Then, the effective information from the channel dimension is selected as:
in which denotes the sigmoid activation operation. c is a learnable parameter used for adjusting the influence. and denote the effective features selected from the channel dimension. Depth-wise convolution consists of separate convolution and point-wise convolutions, which could aggregate features along channel dimensions. Thus, RGB-T features are further fed into depth-wise convolutional, global max-pooling, and MLP layers to obtain channel weights, which are adopted to enrich complementary information from channel dimension as:
Then, considering that in some cases, only single modal data are valid and effective. The value of w will be lower, which may result in poor performance under some extreme situations. Thus, the remaining information is selected with weight and fused with enhanced features as:
Consequently, RGB-T features are operated with convolutional layers separately and concatenated to generate weight maps, which could select effective information from spatial aspects.
in which () denotes the convolution operator with n kernels. denotes the weight maps calculated from spatial information.
Finally, the frequency features are fed into convolutional and softmax activation layers to obtain two-channel weight maps for i-stage features. is further split along channel dimension and multiplied with current-stage multi-modal features. The spatially enhanced features are added in a residual path as:
in which denotes the i-th stage fused features from channel, spatial and frequency dimensions. The changes of feature maps within the first stage fusion process are shown in Figure 3. Lower stage features are adopted for the contour deformation in the subsequent processing. The contour pixels obtain higher response compared with background area in fused features, which further proves the effectiveness of the proposed fusion strategy.
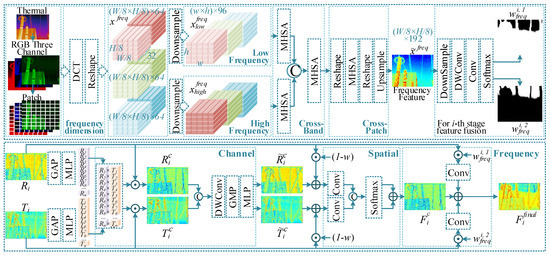
Figure 3.
Overall framework of the proposed tri-dimensional feature fusion strategy.
3.1.3. Object Detection Module
The single-stage anchor-free FCOS detector [49] is adopted and embedded in the network framework for the object detection task. Specifically, multiple object detection heads within FCOS are adopted for multi-scale prediction. In contrast to anchor-based methods, FCOS object detection heads directly estimate vectors of classification labels with dimensions of class numbers and the vector of bounding box coordinates with dimensions four times the class numbers.
3.1.4. Transformer-Based Contour Deformation
As shown in Figure 4, existing contour deformation methods rely mostly on information of neighbor points (three adjacent points [27] or nine adjacent points [29]). On the one hand, all edge contour points should interact with each other, and on the other hand, pixels in other areas of the image should also play a role in optimizing the edge contour. Some object detection methods have introduced the transformer modules into the network framework, proving the powerful modeling ability of global information. Thus, transformer decoder module [48] is utilized to deform contour points by self and cross-attention mechanisms.
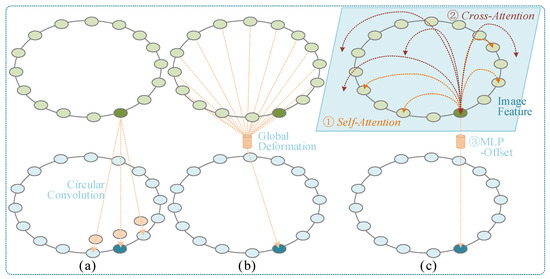
Figure 4.
Comparison of different contour deformation strategies. (a) Circular convolution [27]; (b) global deformation via MLP layers [29]; (c) query-based contour deformation. Green points denote the features of contour points and the blue points denote the evolved results.
First, to avoid using random or learnable query embeddings, we directly initialize the contour from center point features as [29]. For the bounding box of the k-th object, features of the center point are projected into dimensional features, which is further considered as the offsets of N contour points relative to the center point. Then, as shown in Figure 2, N crucial points are sampled from contour edges, and their features are extracted from to build feature embeddings . P is considered as N D-dimensional features to be decoded in parallel. The self-attention module is first applied as:
In this way, the control points are activated by the relations with all other control points. The relations between control points and feature maps could be adopted for further activation of control points. The region feature of this object is convoluted and transposed into , which is adopted as the and embeddings for cross-attention as:
Then, the feed-forward network (FFN) is proposed to project into two channel results as , representing the offsets along x and y axes for N contour points. The FFN follows the standard architecture of transformer decoders, consisting of the 3-layer perceptron with ReLU activation function. In the end, the above-mentioned deformation method is iterated three times for better performance.
The IoU loss and cross-entropy loss are applied to the object detection results of FCOS heads [49]. Smooth L1 loss is generally adopted for the supervision of segmentation masks, which are used for the final segmentation results. Meanwhile, in order to achieve better fitting results for mask boundaries, the dynamic matching loss proposed in [29] is applied to the contours of segmentation, resulting in multiple iterations.
3.2. Reconstruction-Guided Abnormal Heating Detection
3.2.1. Network Framework
Abnormal heating faults in power equipment can manifest in various patterns, and the specific temperature rise values can also be influenced by the ambient temperature and the degree of hazard. Therefore, directly constructing a dataset of abnormal heating makes it difficult to encompass all the forms of abnormal heating. Training an anomaly detection network using traditional supervised training methods would result in a high rate of wrong detection in practical applications. The auto-encoder is utilized for defect detection of industry products in a self-supervision manner. However, there is a major problem preventing the application of auto-encoders in abnormal heating detection.
Since the value of abnormal temperature rise is not large, there is a trade-off between normal reconstruction fidelity and abnormal reconstruction distinguishability. Thus, the UNet-like discrimination network is built to capture loss information from the concatenation of original and reconstructed images. Meanwhile, to enable the normal reconstruction fidelity of the auto-encoder, the random argument strategy is proposed to randomly raise the temperature of different areas on insulators. The details of the proposed abnormal heating detection method are described in the following.
3.2.2. Auto-Encoder Based Reconstruction Network
The reconstruction network is realized with the auto-encoder framework, which converts the local patterns of the input image into patterns closer to the normal distributions. Res2Block [50], as the basic feature extraction module, is selected as both the encoder and decoder module. Compared with the original ResBlock, Res2Block adds an additional convolutional layer before the convolutional layer, which enables the network to capture more diverse features. As shown in Figure 5, our autoencoder model is divided into 9 stages. Among them, the first 5 stage modules build the encoder network, which downsamples the features after feature extraction to extract high-level abstract features of the image. The later 4 stage modules build the decoder module, which upsamples the features to restore the spatial details.
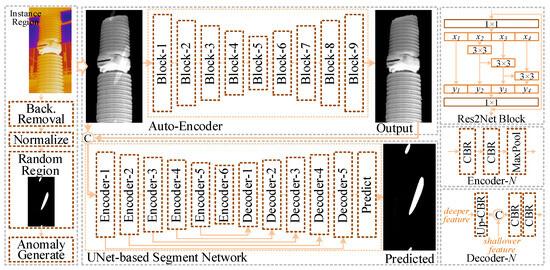
Figure 5.
Illustration of the proposed abnormal heating detection method, which is mainly composed of the auto-encoder based reconstruction network to change the distribution of input patches and the UNet-like discrimination network to segment abnormal heating areas.
3.2.3. UNet-like Discrimination Network
Auto-encoder-based methods generally segment abnormal areas by thresholding the reconstruction error. However, directly segmented results have low contrast due to reconstruction noise and poor threshold decisions. Therefore, we build a simple segmentation network based on the UNet framework. Encoder and decoder blocks mainly consist of convolution, batch normalization, and ReLU operations, while the max-pooling is adopted for downsampling and bilinear interpolation is adopted for upsampling. The original and the reconstructed images are concatenated into two channels as the input tensor. Then, the UNet network is used to encode the two-channel input, capturing the error area within the reconstruction process and generating accurate abnormal probability maps.
3.2.4. Random Argument Strategy
Thermal images are first cut into several regions according to object detection boxes, and these regions of pre-defined equipment are further normalized based on the segmentation mask. To simulate the abnormal heating regions within the equipment, the Perlin noise generator [51] is first applied to obtain argument regions. Noise maps are generated, binarized, and cropped within equipment to obtain anomaly masks with various shapes. The temperature of the selected area is manually increased, and the increased temperature value is processed with a Gaussian kernel to simulate the pattern of real abnormal heating. The temperature rise is relatively large at the beginning, but it gradually decreases in the following epochs to enhance the ability to detect abnormal heating.
The structural similarity (SSIM) loss function [52] is used for the supervision of the reconstruction network, while the focal loss and binary cross-entropy loss functions are used for the supervision of the discrimination network. The reconstruction and discrimination networks are combined in a unified framework, and loss functions are combined to increase robustness for accurate segmentation.
4. Experimental Results
In this section, the self-built datasets are elaborated in detail initially. Then, extensive comparative and ablation experiments are conducted to evaluate the performance of the proposed networks, proving the effectiveness of the proposed abnormal heating detection strategy.
4.1. Dataset Construction
As shown in Figure 6, thermal and visible cameras are embedded on the pan-tilt-zoom (PTZ) platform. The PTZ platform is mounted on a moving platform to collect RGB-T images in transformer substations. The resolution of thermal images is and the resolution of visual images is . The RGB-T image pairs are registered and resized into the same resolution. Voltage-induced heating power equipment, including voltage transformers (VT), current transformers (CT), and lightning arresters (LA) are selected as typical equipment objects for annotation and evaluation. The RGB-T image pairs of 110 kV and 220 kV power equipment are acquired, registered into sizes of , and annotated manually, respectively. Meanwhile, due to the long horizontal baseline distance between multi-modal cameras and short shooting distances, there are inevitably large disparities between stereo images. This results in pixel-level errors during the registration process, so all annotations are performed on infrared images. Finally, there are 1600 and 1000 pairs of RGB-T images for 220 kV and 110 kV power equipment, which are divided into training and test sets with a ratio of 9:1.
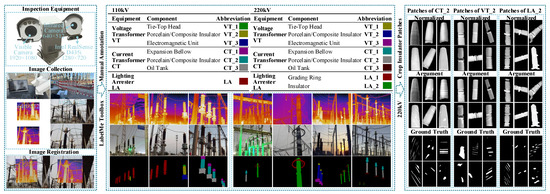
Figure 6.
Illustration of the construction process of power equipment instance segmentation and abnormal heating detection datasets.
In foggy weather, water droplets suspended in the air may absorb and scatter infrared radiation to some extent, which may reduce the contrast and clarity of thermal images. Although the adopted visual camera could handle low illumination conditions by ColorUV technology, there is still much noise in visual images. Meanwhile, due to the drop in ambient temperature at night, the temperature difference between the power equipment and the environment increases, causing changes in the temperature distribution of thermal images. We further manually simulate the illumination changes of visible cameras with transformations. Thus, 179 and 294 RGB-T image pairs are acquired on foggy days and in low illumination conditions to build two test sets.
After the training of RGB-T instance segmentation methods, all acquired images are processed to obtain pixel-level segmentation results. Local patches of insulators within thermal images are cropped for abnormal heating detection. The values of background pixels are set as 0 to avoid interference with background temperatures. A total of 980, 850, and 750 normal insulator image patches of CT, VT, and LA are selected to construct datasets of positive samples for the training process. A total of 54, 70, and 40 image patches of CT, VT, and LA insulators with suspected voltage-induced abnormal heating defects are manually annotated with binary values as test sets for fair evaluation.
4.2. Effectiveness of the Instance Segmentation Network
4.2.1. Implementation Details and Evaluation Metrics
The instance segmentation network is implemented with the Python 3.8 language, Pytorch 1.13.0 framework, and MMDetection 2.25.1 library [53]. A desktop with an NVIDIA RTX 4090 GPU is adopted for training and testing for all networks. By observing the changes in training losses, the losses and evaluation metrics of the proposed network fluctuate within a small range after 50 epochs. Thus, the parameters of the 50th epoch are used for subsequent experiments.
Compared with the object detection task, the average precision () is applied for both detection boxes () and segmentation masks () for the instance segmentation task. is calculated according to the value of , which represents the ratio of the intersection and union between the predicted results and the ground truths.
where denotes the predicted results and denotes the ground truth. The and are calculated by setting different thresholds for as:
Correct detection samples are denoted as true positive (), representing the results when is greater than the preset threshold. Wrong detection samples are denoted as false positive (), representing the results when is less than the preset threshold. False negative () samples represent the miss detection. The of prediction results is defined as:
in which denotes the value at a value r. The metric is generally calculated as the weighted average of the with thresholds in the range of [0.5, 0.95] in steps of 0.05. When is calculated using the intersection of bounding boxes or segmentation masks, and metrics are obtained, respectively.
Meanwhile, variants for different fixed thresholds are adopted for extensive evaluation, such as (threshold of is 0.5) and (threshold of is 0.75). For objects of different sizes, the paper uses different representations, such as (small objects with the area less than pixels), (medium objects with the area greater than pixels and less than pixels), (large objects with the area greater than pixels). A high indicates that the model has a good balance between precision and recall across various thresholds, which demonstrates that the model is not only identifying a high proportion of actual positives (high recall) but is also doing so with a high proportion of correct identifications (high precision). Floating-point operations per second (FLOPs) could specify how many floating-point operations are required during inference, and parameters (Params) denote the number of all learned weights and biases. A model with more FLOPs and parameters could potentially capture more intricate patterns from the data, but it also requires more computation cost.
4.2.2. Qualitative Evaluation
To demonstrate the effectiveness of the instance segmentation network, several state-of-the-art methods are selected and re-trained on the same platform with the self-built datasets. All compared methods are trained on thermal images with three-channel pseudo color. The same training strategies as their papers or open-source codes from [53] are adopted to achieve better supervision and ensure fair comparisons.
As shown in Figure 7, in some multi-target scenarios, the proposed method achieves the best segmentation results, and the other methods more or less have the problem of missed detection or incomplete segmentation. Additionally, benefiting from the proposed contour deformation strategy and supplements of visual images, the proposed method could achieve sharper results compared with other methods. For example, the serrated insulator boundaries are well preserved in the segmented masks. Overall, most methods achieve good performance for 110 kV and 220 kV power equipment under normal scenes with sufficient illumination.
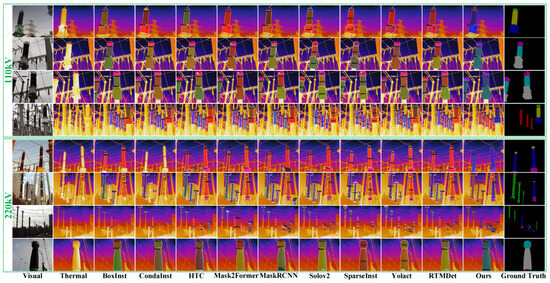
Figure 7.
Instance segmentation results of the proposed method and state-of-the-art methods for 110 kV and 220 kV power equipment in normal scenes.
As shown in Figure 8, the imaging quality of thermal and visual images suffers from extreme weather, low illumination, and temperature changes. Infrared images could handle the changes in illumination, but the temperature distribution between the power equipment and the environment changes at nighttime. Most thermal-based methods still have good visual segmentation performance at nighttime, despite a certain degree of decrease in segmentation accuracy. The proposed method could adaptively extract sufficient characteristic information from multi-modal images and handle the influence of low-quality visual images, thus segmenting power equipment accurately. Meanwhile, the performance of compared methods decreases a lot when applied on low-contrast thermal images acquired on foggy days. The segmentation of power equipment becomes incomplete with compared methods due to unclear boundaries. Changes in temperature distribution lead to a significant decrease in the prediction confidence. Unlike these compared methods, due to the introduction of proposed modules, the proposed method could satisfy various feature fusion requirements and achieve robust performance under extreme environments.
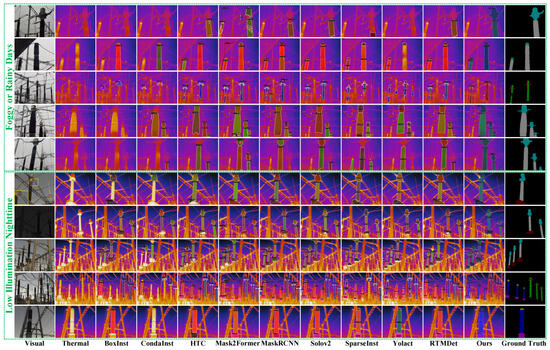
Figure 8.
Instance segmentation results of the proposed method and state-of-the-art methods for 220 kV power equipment in challenging foggy weather or nighttime low illumination scenes.
4.2.3. Quantitative Evaluation
Table 1 and Table 2 demonstrate the comparison results of the proposed instance segmentation method and other methods on the two self-built datasets. Thermal imaging could handle environmental changes to some extent and capture more location information on power equipment. However, thermal images lack detailed information, which may result in ambiguous areas when segmenting objects. Although the values of some variants are slightly lower than those of several instance segmentation methods, the proposed method achieves the best performance with regard to the metric. Compared with the results of the second-best methods on two datasets, the metrics of the proposed methods improve by about 1% and 3% for segmentation masks and bounding boxes, respectively. Benefiting from the detailed information in visual images, the locations of bounding boxes are more accurate, and the accuracy of predicted bounding boxes significantly improves. The experimental results show that our method outperforms most state-of-the-art instance segmentation methods, demonstrating the effectiveness of the proposed instance segmentation method.

Table 1.
Comparative results of 220 kV instance segmentation datasets. The best and second-best results for each metric are highlighted in bold and bold, respectively.

Table 2.
Comparative results of 110 kV instance segmentation datasets. The best and second-best results for each metric are highlighted in bold and bold, respectively.
To further illustrate the all-day performance of the proposed method, the metrics on test datasets of two challenging scenes are calculated, and the results are shown in Table 3. Since all compared methods are trained on thermal images, the performance drops a lot when the gray-level distribution changes on foggy days. The CondaInst and RTMDet methods could handle the changes in temperature distribution to some extent and achieve better performance compared with others at nighttime. The proposed feature fusion strategy could effectively handle the impact of information changes of single-modal images and extract more informative complementary information. Therefore, the proposed method achieves higher values. The mask and box-level metrics of the proposed method improve by about 6.0% and 6.8% compared with the second-best methods on two challenging test sets. Especially for the metrics at fixed higher thresholds, the proposed method clearly outperforms other methods, demonstrating its significant advantages for all-day instance segmentation with high accuracy under challenging light conditions and temperature distributions.

Table 3.
Comparative results for normal, foggy, and nighttime scenes from 220 kV instance segmentation dataset. The best results of each scenes are highlighted in bold.
4.2.4. Ablation Studies
Ablation studies are conducted to evaluate the effectiveness of the proposed multi-modal feature fusion and contour deformation strategies. It could be seen from Figure 9 that the fused features show higher responses in boundary areas for contour deformation. When thermal images provide more effective information, the foreground objects are more obvious compared to backgrounds, and thus, the power equipment areas have higher responses in the enhanced frequency features. Even if thermal images cannot provide sufficient information under foggy weather and the frequency domain features are not effective, the fusion from pixel and channel dimensions extracts sufficient complementary information within fused features. Thus, the tri-dimensional feature fusion strategy could effectively select the characteristic complementary information from RGB-T images, which could well handle different fusion requirements.
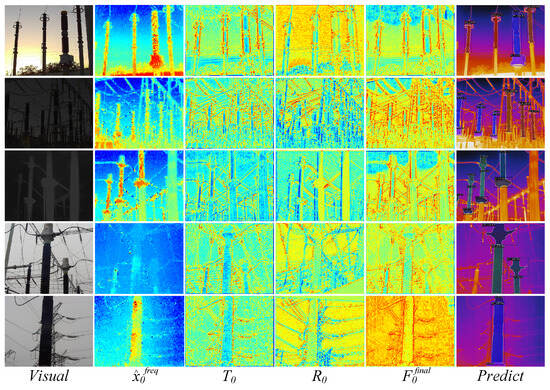
Figure 9.
Visualization of the changes of features within feature fusion process.
To evaluate the numerical performance of each module, we first replace the proposed feature fusion strategy with channel-wise concatenation, pixel-level addition, and complementary activation module (CAM) proposed in [60]. Experiments of the proposed network using only thermal features are also conducted. As illustrated in Table 4, the proposed feature fusion strategy outperforms the simple feature fusion methods. Meanwhile, compared to using only infrared images, the proposed method could effectively fuse multi-modal information and improve the segmentation accuracy.

Table 4.
Ablation studies on multi-modal feature fusion and contour deformation strategies.
As shown in Figure 10, for the equipment with simple contours, the contour points generally achieve high accuracy after the first deformation. The deformation process for equipment with complex boundaries further proves the robust ability of the proposed strategy. Benefiting from the fused features and clear boundary information, sharp and accurate boundary points could be located. Compared to the existing contour deformation method [29], the proposed strategy optimizes contour points using global information and achieves better results for objects of various sizes.
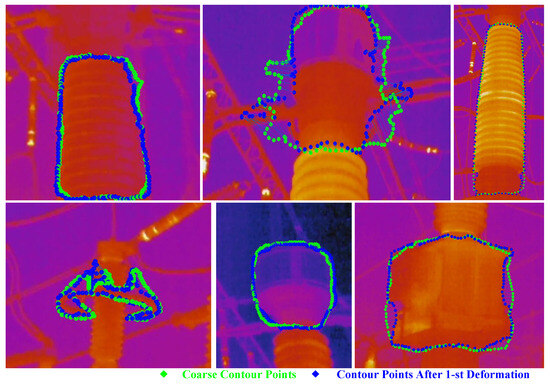
Figure 10.
Visualization of contour deformation in 1st iteration, in which the local regions are cropped according to detected bounding boxes. The contour points move closer to the ground truth under the low-contrast thermal images.
In terms of calculation speed, the number of parameters in the proposed RGB-T instance segmentation network is about 62.12 M. Compared to other single-modality instance segmentation methods, the additional parameters are mainly in the two-stream encoder module, while the feature fusion, object detection, and contour deformation modules are quite efficient. Therefore, as shown in Table 5, the computational cost and inference time are acceptable compared to other methods.

Table 5.
Efficiency results. FLOPs and runtime are estimated for inputs of RGB (480 × 640 × 3) and thermal (480 × 640 × 3) on the same experimental platform.
4.3. Effectiveness of the Abnormal Heating Detection Method
4.3.1. Implementation Details and Evaluation Metrics
The experiments for abnormal heating detection methods are conducted on the same platform as the instance segmentation experiments. The Adam optimizer is selected for training. The learning rate is set to initially, and reduced to one-tenth of the previous setting every ten epochs. The batch size is set to 4 to fit the GPU memory and total epochs are set as 500.
Standard metrics for anomaly detection including area under the receiver operator characteristic curve (AUROC) and average precision (AP) are adopted for evaluation [61,62]. The r operating characteristic curve is widely used in the evaluation of binary classifications, depicting the true positive rate () against the false positive rate () at various threshold settings. Given a preset threshold, and could be calculated as:
in which denotes the proportion of all true positive instances () that are correctly identified as positive (), and FPR measures the proportion of all true negative instances () that are incorrectly identified as positive (). AUROC denotes the area under the ROC curve, which is calculated as . An AUROC value closer to 1 indicates that the model could distinguish the anomaly samples and identify positive samples without false alarms. When considering each pixel in the image as an individual unit for classification, the pixel-level AUROC is calculated to represent the ability to localize anomalies. When the entire image is treated as a single unit for classification, the per-pixel predicted maps are averaged, and the maximum values are adopted to calculate the image-level AUROC for anomaly detection.
Similar to object detection metrics, is further adopted to measure the ability of the model to rank positive instances higher than negative ones across various thresholds under [0, 1], which could reflect the precision-recall trade-off for different classification criteria [47]. A higher AP value indicates high precision across all recall levels, meaning the model is good at identifying anomalies without false positives. Similar to the AUROC metric, the AP metric is also evaluated at the pixel and image levels. These metrics are calculated according to the predicted anomaly scores and ground truths by the Scikit-Learn library [63].
4.3.2. Qualitative Evaluation
The qualitative comparison results of all abnormal heating detection methods are shown in Figure 11. Compared methods either fail to detect abnormalities or incorrectly classify normal areas as abnormalities, leading to unexpectedly low abnormality detection efficiency. Particularly evident for small-sized abnormal heating areas, such as those in the third and fourth groups of images, several compared methods incorrectly segment all power equipment as abnormal regions. Benefiting from the data argumentation and learning strategies, it is noticeable that our method outperforms other methods with accurate localization and segmentation results.
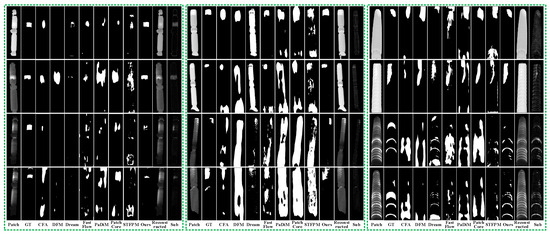
Figure 11.
Abnormal heating detection of the proposed method and state-of-the-art methods for different insulator equipment. Note that all predicted results are binarized for better comparison.
If the images of power equipment are acquired at a closer distance, the patches will contain more details. Detailed boundary information may be lost during the reconstruction process. The UNet-like discrimination network could distinguish the changed information within the reconstruction process and achieve detection. Thus, though the lost detailed boundaries could also be seen from Figure 11, the abnormal heating areas are relatively clearer in the detected results.
The feature maps within the UNet-like discrimination network are shown in Figure 12. By jointly encoding both original and reconstructed patches, the boundaries of abnormal areas exhibit higher responses, as clearly seen from encoded features. Differences between input and reconstructed images, including detailed textures, abnormal areas, and incomplete equipment areas, are all well captured. During the decoding process, the entire abnormal areas become more salient compared to normal areas, resulting in finer segmentation and making the proposed method more competitive.
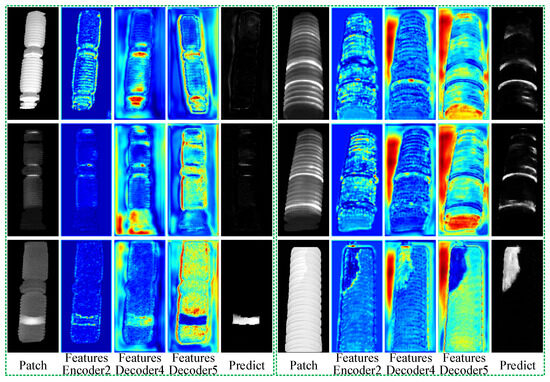
Figure 12.
Visualization of the features within the UNet-like discrimination network.
4.3.3. Quantitative Evaluation
Quantitative comparison results of AUROC and AP metrics are shown in Table 6. Partial defect detection methods construct the memory bank or adaptive cluster features to learn the distribution of positive samples, which may achieve good results in defect detection of standard work pieces. However, the appearances, texture details, ranges of temperature improvement, and sizes of abnormal areas of the same types of insulators may differ, resulting in huge differences between positive samples. Thus, in this way, the distinguishability of existing methods may drop and the predicted pixel-level abnormal areas may not match the real areas. Consistent with qualitative results, most methods obtain better detection performance than segmentation performance for abnormal heating areas. Meanwhile, the image-level results of compared methods are much higher than pixel-level results.

Table 6.
Comparative AUROC and precision results (%) of abnormal heating detection for insulators of LA, VT, and CT categories. The best results for each metric are highlighted in bold.
The random argument strategy simulates various kinds of abnormal areas on insulators, enhancing the learning ability and improving the reconstruction of positive representations of abnormal areas. The proposed method obtains the optimal performance in all three categories from both image-level and pixel-level metrics, highlighting its significant advantages for abnormal heating detection and segmentation. It is worth mentioning that since all patches are acquired in real-world transformer substation scenes, these experiments fully validate the practicality of the proposed methods for power inspections. Meanwhile, the entire abnormal heating detection strategy mainly consists of these two proposed networks, which could be easily integrated into different system frameworks. The temperature of all pixels in the abnormal heating areas could be extracted to further determine the defect level through absolute temperatures or for manual review.
5. Conclusions
In this paper, to achieve abnormal heating detection of high-voltage power equipment, we first proposed a contour-based RGB-T instance segmentation to locate and segment power equipment. Specifically, multi-level RGB-T features were fused from spatial, channel, and frequency dimensions to fully extract complementary effective information against illumination, weather, and other environmental changes. The self-relationships and cross-relationships between contour points and background pixels were calculated for deformation, which resulted in sharp and accurate segmentation. In this way, local patches of each insulator were cropped, and background interferences were removed. Furthermore, the reconstruction and discrimination networks were built and jointly supervised via patches enhanced by the random argument strategy. The auto-encoder network reconstructed the local patches, bringing the reconstruction results closer to the distribution of positive samples. Then, the UNet-like discrimination network encoded both original and reconstructed patches, capturing poorly reconstructed information and achieving abnormal heating detection. Extensive experiments were conducted on self-built instance segmentation and abnormal heating detection datasets. Through careful analysis of experimental results, we demonstrated that the proposed methods achieve better performance than state-of-the-art methods.
Author Contributions
Conceptualization, J.L. and C.X.; Data curation, J.L. and C.X.; Formal analysis, Q.Y.; Funding acquisition, J.L. and Q.L.; Investigation, Q.Y., L.C. and X.D.; Methodology, L.C. and C.X.; Project administration, J.L.; Resources, J.L., C.X. and Q.L.; Software, X.D. and Q.L.; Supervision, J.L. and Q.L.; Validation, Q.Y., C.X. and L.C.; Visualization, L.C. and C.X.; Writing—original draft, C.X. and Q.Y.; Writing—review and editing, L.C. and C.X. All authors have read and agreed to the published version of the manuscript.
Funding
This research was funded by the State Grid Jiangsu Electric Power Company Limited (grant number J2023061).
Data Availability Statement
The data in this paper are undisclosed due to the confidentiality requirements of the data supplier.
Conflicts of Interest
Jiange Liu, Li Cao and Xin Dai were employed by the company State Grid Huaian Power Supply Company. The remaining authors declare that the research was conducted in the absence of any commercial or financial relationships that could be construed as a potential conflict of interest. The authors declare that this study received funding from the State Grid Jiangsu Electric Power Company Limited. The funder was not involved in the study design, collection, analysis, interpretation of data, the writing of this article or the decision to submit it for publication.
References
- Liu, X.; Miao, X.; Jiang, H.; Chen, J.; Wu, M.; Chen, Z. Component Detection for Power Line Inspection Using a Graph-Based Relation Guiding Network. IEEE Trans. Ind. Inform. 2023, 19, 9280–9290. [Google Scholar] [CrossRef]
- Zhao, Z.; Feng, S.; Zhai, Y.; Zhao, W.; Li, G. Infrared Thermal Image Instance Segmentation Method for Power Substation Equipment Based on Visual Feature Reasoning. IEEE Trans. Instrum. Meas. 2023, 72, 5029613. [Google Scholar] [CrossRef]
- Hao, Z.; Pengfei, L.; Guoqing, M.; Zilong, C.; Yubing, D.; Xiaoli, H. Case analysis on the abnormal heating defect of a 220 kV XLPE cable intermediate joint. IOP Conf. Ser. Earth Environ. Sci. 2020, 610, 012008. [Google Scholar] [CrossRef]
- Xu, C.; Li, Q.; Jiang, X.; Yu, D.; Zhou, Y. Dual-Space Graph-Based Interaction Network for RGB-Thermal Semantic Segmentation in Electric Power Scene. IEEE Trans. Circuits Syst. Video Technol. 2023, 33, 1577–1592. [Google Scholar] [CrossRef]
- Zhong, Z.; Chen, Y.; Hou, S.; Wang, B.; Liu, Y.; Geng, J.; Fan, S.; Wang, D.; Zhang, X. Super-resolution reconstruction method of infrared images of composite insulators with abnormal heating based on improved SRGAN. IET Gener. Transm. Distrib. 2022, 16, 2063–2073. [Google Scholar] [CrossRef]
- Yue, Y.k.; Wu, T.b. Analysis of abnormal heating of 66kV dry-type air-core reactor grounding device. J. Phys. Conf. Ser. 2022, 2237, 012014. [Google Scholar]
- Lin, Y.; Li, Z.; Sun, Y.; Yang, Y.; Zheng, W. Voltage-Induced Heating Defect Detection for Electrical Equipment in Thermal Images. Energies 2023, 16, 8036. [Google Scholar] [CrossRef]
- Dai, J.; Li, Y.; He, K.; Sun, J. R-FCN: Object detection via region-based fully convolutional networks. In Proceedings of the 30th International Conference on Neural Information Processing Systems, Barcelona, Spain, 5–10 December 2016; pp. 379–387. [Google Scholar]
- Liu, Y.; Ji, X.; Pei, S.; Ma, Z.; Zhang, G.; Lin, Y.; Chen, Y. Research on automatic location and recognition of insulators in substation based on YOLOv3. High Volt. 2020, 5, 62–68. [Google Scholar] [CrossRef]
- Li, B.; Wang, T.; Zhai, Y.; Yuan, J. RFIENet: RGB-thermal feature interactive enhancement network for semantic segmentation of insulator in backlight scenes. Measurement 2022, 205, 112177. [Google Scholar] [CrossRef]
- Rahmani, A.; Haddadnia, J.; Seryasat, O. Intelligent fault detection of electrical equipment in ground substations using thermo vision technique. In Proceedings of the 2010 2nd International Conference on Mechanical and Electronics Engineering, Kyoto, Japan, 1–3 August 2010; Volume 2, pp. V2-150–V2-154. [Google Scholar] [CrossRef]
- Zhao, Z.; Zhang, J.; Xu, S.; Lin, Z.; Pfister, H. Discrete Cosine Transform Network for Guided Depth Map Super-Resolution. In Proceedings of the IEEE/CVF Conference on Computer Vision and Pattern Recognition (CVPR), New Orleans, LA, USA, 18–24 June 2022; pp. 5697–5707. [Google Scholar]
- Lin, T.Y.; Dollar, P.; Girshick, R.; He, K.; Hariharan, B.; Belongie, S. Feature Pyramid Networks for Object Detection. In Proceedings of the IEEE Conference on Computer Vision and Pattern Recognition (CVPR), Honolulu, HI, USA, 21–26 July 2017. [Google Scholar]
- Ahuja, N.A.; Ndiour, I.; Kalyanpur, T.; Tickoo, O. Probabilistic Modeling of Deep Features for Out-of-Distribution and Adversarial Detection. arXiv 2019, arXiv:1909.11786. [Google Scholar]
- Hariharan, B.; Arbeláez, P.; Girshick, R.; Malik, J. Simultaneous detection and segmentation. In Proceedings of the European Conference on Computer Vision (ECCV), Zurich, Switzerland, 6–12 September 2014; pp. 297–312. [Google Scholar]
- Girshick, R.; Donahue, J.; Darrell, T.; Malik, J. Rich feature hierarchies for accurate object detection and semantic segmentation. In Proceedings of the IEEE Conference on Computer Vision and Pattern Recognition, Columbus, OH, USA, 23–28 June 2014; pp. 580–587. [Google Scholar]
- Sarkar, A.; Maniruzzaman, M.; Alahe, M.A.; Ahmad, M. An Effective and Novel Approach for Brain Tumor Classification Using AlexNet CNN Feature Extractor and Multiple Eminent Machine Learning Classifiers in MRIs. J. Sens. 2023, 2023, 1224619. [Google Scholar] [CrossRef]
- Girshick, R. Fast r-cnn. In Proceedings of the IEEE International Conference on Computer Vision, Santiago, Chile, 7–13 December 2015; pp. 1440–1448. [Google Scholar]
- Zagoruyko, S.; Lerer, A.; Lin, T.Y.; Pinheiro, P.H.; Gross, S.; Chintala, S.; Dollar, P. A MultiPath Network for Object Detection. In Proceedings of the British Machine Vision Conference, York, UK, 19–22 September 2016. [Google Scholar]
- Ren, S.; He, K.; Girshick, R.; Sun, J. Faster R-CNN: Towards Real-Time Object Detection with Region Proposal Networks. IEEE Trans. Pattern Anal. Mach. Intell. 2017, 39, 1137–1149. [Google Scholar] [CrossRef] [PubMed]
- He, K.; Gkioxari, G.; Dollar, P.; Girshick, R. Mask R-CNN. IEEE Trans. Pattern Anal. Mach. Intell. 2020, 42, 386–397. [Google Scholar] [CrossRef] [PubMed]
- Bolya, D.; Zhou, C.; Xiao, F.; Lee, Y.J. Yolact: Real-time instance segmentation. In Proceedings of the IEEE/CVF International Conference on Computer Vision, Seoul, Republic of Korea, 27 October–2 November 2019; pp. 9157–9166. [Google Scholar]
- Wang, X.; Kong, T.; Shen, C.; Jiang, Y.; Li, L. Solo: Segmenting objects by locations. In Proceedings of the European Conference on Computer Vision (ECCV), Glasgow, UK, 23–28 August 2020; pp. 649–665. [Google Scholar]
- Cheng, B.; Schwing, A.; Kirillov, A. Per-pixel classification is not all you need for semantic segmentation. Adv. Neural Inf. Process. Syst. 2021, 34, 17864–17875. [Google Scholar]
- Cheng, B.; Misra, I.; Schwing, A.G.; Kirillov, A.; Girdhar, R. Masked-attention mask transformer for universal image segmentation. In Proceedings of the IEEE/CVF Conference on Computer Vision and Pattern Recognition, New Orleans, LA, USA, 18–24 June 2022; pp. 1290–1299. [Google Scholar]
- Duan, K.; Xie, L.; Qi, H.; Bai, S.; Huang, Q.; Tian, Q. Location-sensitive visual recognition with cross-iou loss. arXiv 2021, arXiv:2104.04899. [Google Scholar]
- Peng, S.; Jiang, W.; Pi, H.; Li, X.; Bao, H.; Zhou, X. Deep snake for real-time instance segmentation. In Proceedings of the IEEE/CVF Conference on Computer Vision and Pattern Recognition, Seattle, WA, USA, 13–19 June 2020; pp. 8533–8542. [Google Scholar]
- Liu, Z.; Liew, J.H.; Chen, X.; Feng, J. Dance: A deep attentive contour model for efficient instance segmentation. In Proceedings of the IEEE/CVF Winter Conference on Applications of Computer Vision, Virtual, 5–9 January 2021; pp. 345–354. [Google Scholar]
- Zhang, T.; Wei, S.; Ji, S. E2ec: An end-to-end contour-based method for high-quality high-speed instance segmentation. In Proceedings of the IEEE/CVF Conference on Computer Vision and Pattern Recognition, New Orleans, LA, USA, 18–24 June 2022; pp. 4443–4452. [Google Scholar]
- Chen, Y.T.; Shi, J.; Ye, Z.; Mertz, C.; Ramanan, D.; Kong, S. Multimodal Object Detection via Probabilistic Ensembling. In Proceedings of the European Conference on Computer Vision (ECCV), Tel Aviv, Israel, 23–27 October 2022; pp. 139–158. [Google Scholar]
- Cao, Y.; Bin, J.; Hamari, J.; Blasch, E.; Liu, Z. Multimodal Object Detection by Channel Switching and Spatial Attention. In Proceedings of the IEEE/CVF Conference on Computer Vision and Pattern Recognition (CVPR) Workshops, Vancouver, BC, Canada, 17–24 June 2023; pp. 403–411. [Google Scholar]
- El Ahmar, W.; Massoud, Y.; Kolhatkar, D.; AlGhamdi, H.; Alja’afreh, M.; Hammoud, R.; Laganiere, R. Enhanced Thermal-RGB Fusion for Robust Object Detection. In Proceedings of the IEEE/CVF Conference on Computer Vision and Pattern Recognition (CVPR) Workshops, Vancouver, BC, Canada, 17–24 June 2023; pp. 365–374. [Google Scholar]
- Zhang, Q.; Chang, X.; Meng, Z.; Li, Y. Equipment detection and recognition in electric power room based on faster R-CNN. Procedia Comput. Sci. 2021, 183, 324–330. [Google Scholar] [CrossRef]
- Zheng, H.; Sun, Y.; Liu, X.; Djike, C.L.T.; Li, J.; Liu, Y.; Ma, J.; Xu, K.; Zhang, C. Infrared image detection of substation insulators using an improved fusion single shot multibox detector. IEEE Trans. Power Deliv. 2020, 36, 3351–3359. [Google Scholar] [CrossRef]
- Xu, P.; Zhang, J.; Yin, T.; Qian, X.; Yang, Y. Research on image segmentation of power equipment based on improved PCNN algorithm. Intell. Comput. Appl. 2019, 9, 59–62. [Google Scholar]
- Li, H.G.; Lu, C.Y.; Qi, L. Road Target Detection Based on Otsu Multi-Threshold Segmentation. In Proceedings of the Mechanical Engineering and Control Systems: Proceedings of 2015 International Conference on Mechanical Engineering and Control Systems (MECS2015), Wuhan, China, 23–25 January 2015; pp. 265–269. [Google Scholar]
- DUNN, J. A fuzzy relative of the ISODATA process and its use in detecting compact well-separated clusters. J. Cybern. 1974, 3, 32–57. [Google Scholar] [CrossRef]
- Wu, J.; Wang, Y.; Lou, J.; Li, M. Infrared image segmentation for power equipment failure based on fuzzy clustering and wavelet decomposition. In Proceedings of the 2015 International Conference on Computational Intelligence and Communication Networks (CICN), Jabalpur, India, 12–14 December 2015; pp. 1274–1277. [Google Scholar]
- Balakrishnan, G.K.; Yaw, C.T.; Koh, S.P.; Abedin, T.; Raj, A.A.; Tiong, S.K.; Chen, C.P. A Review of Infrared Thermography for Condition-Based Monitoring in Electrical Energy: Applications and Recommendations. Energies 2022, 15, 6000. [Google Scholar] [CrossRef]
- Li, Y.; Li, Q.; Liu, Z.; Chen, Q. Diagnosis and Analysis of Abnormal Heating Fault for 35kV Dry Air Core Reactor. In Proceedings of the 2021 IEEE 5th Advanced Information Technology, Electronic and Automation Control Conference (IAEAC), Chongqing, China, 12–14 March 2021; Volume 5, pp. 431–434. [Google Scholar]
- Liao, W.; Yang, D.; Wang, Y.; Ren, X. Fault diagnosis of power transformers using graph convolutional network. CSEE J. Power Energy Syst. 2020, 7, 241–249. [Google Scholar]
- Siddiqui, Z.A.; Park, U.; Lee, S.W.; Jung, N.J.; Choi, M.; Lim, C.; Seo, J.H. Robust powerline equipment inspection system based on a convolutional neural network. Sensors 2018, 18, 3837. [Google Scholar] [CrossRef] [PubMed]
- Resendiz-Ochoa, E.; Osornio-Rios, R.A.; Benitez-Rangel, J.P.; Morales-Hernandez, L.A.; Romero-Troncoso, R.d.J. Segmentation in thermography images for bearing defect analysis in induction motors. In Proceedings of the 2017 IEEE 11th International Symposium on Diagnostics for Electrical Machines, Power Electronics and Drives (SDEMPED), Tinos, Greece, 29 August–1 September 2017; pp. 572–577. [Google Scholar] [CrossRef]
- Zheng, H.; Cui, Y.; Yang, W.; Li, J.; Ji, L.; Ping, Y.; Hu, S.; Chen, X. An Infrared Image Detection Method of Substation Equipment Combining Iresgroup Structure and CenterNet. IEEE Trans. Power Deliv. 2022, 37, 4757–4765. [Google Scholar] [CrossRef]
- Zou, H.; Huang, F. A novel intelligent fault diagnosis method for electrical equipment using infrared thermography. Infrared Phys. Technol. 2015, 73, 29–35. [Google Scholar] [CrossRef]
- Wang, B.; Dong, M.; Ren, M.; Wu, Z.; Guo, C.; Zhuang, T.; Pischler, O.; Xie, J. Automatic Fault Diagnosis of Infrared Insulator Images Based on Image Instance Segmentation and Temperature Analysis. IEEE Trans. Instrum. Meas. 2020, 69, 5345–5355. [Google Scholar] [CrossRef]
- Zavrtanik, V.; Kristan, M.; Skočaj, D. DRAEM—A Discriminatively Trained Reconstruction Embedding for Surface Anomaly Detection. In Proceedings of the IEEE/CVF International Conference on Computer Vision (ICCV), Montreal, BC, Canada, 11–17 October 2021; pp. 8330–8339. [Google Scholar]
- Liu, Z.; Lin, Y.; Cao, Y.; Hu, H.; Wei, Y.; Zhang, Z.; Lin, S.; Guo, B. Swin Transformer: Hierarchical Vision Transformer Using Shifted Windows. In Proceedings of the IEEE/CVF International Conference on Computer Vision (ICCV), Montreal, BC, Canada, 11–17 October 2021; pp. 10012–10022. [Google Scholar]
- Tian, Z.; Shen, C.; Chen, H.; He, T. FCOS: Fully Convolutional One-Stage Object Detection. In Proceedings of the IEEE/CVF International Conference on Computer Vision (ICCV), Seoul, Republic of Korea, 27 October–2 November 2019. [Google Scholar]
- Gao, S.H.; Cheng, M.M.; Zhao, K.; Zhang, X.Y.; Yang, M.H.; Torr, P. Res2Net: A New Multi-Scale Backbone Architecture. IEEE Trans. Pattern Anal. Mach. Intell. 2021, 43, 652–662. [Google Scholar] [CrossRef] [PubMed]
- Xu, Y.; Zhang, P.; Zhu, Y.; Lei, S. Simulation of Flood Wave Surface by Fast Fourier Transform Based on Perlin Noise. In Proceedings of the 2022 IEEE 13th International Conference on Software Engineering and Service Science (ICSESS), Beijing, China, 21–23 October 2022; pp. 1–8. [Google Scholar]
- Wang, Z.; Bovik, A.; Sheikh, H.; Simoncelli, E. Image quality assessment: From error visibility to structural similarity. IEEE Trans. Image Process. 2004, 13, 600–612. [Google Scholar] [CrossRef] [PubMed]
- Chen, K.; Wang, J.; Pang, J.; Cao, Y.; Xiong, Y.; Li, X.; Sun, S.; Feng, W.; Liu, Z.; Xu, J.; et al. MMDetection: Open MMLab Detection Toolbox and Benchmark. arXiv 2019, arXiv:1906.07155. [Google Scholar]
- Chen, K.; Pang, J.; Wang, J.; Xiong, Y.; Li, X.; Sun, S.; Feng, W.; Liu, Z.; Shi, J.; Ouyang, W.; et al. Hybrid Task Cascade for Instance Segmentation. In Proceedings of the IEEE/CVF Conference on Computer Vision and Pattern Recognition (CVPR), Long Beach, CA, USA, 15–20 June 2019. [Google Scholar]
- Wang, X.; Zhang, R.; Kong, T.; Li, L.; Shen, C. SOLOv2: Dynamic and Fast Instance Segmentation. In Proceedings of the Advances in Neural Information Processing Systems; Larochelle, H., Ranzato, M., Hadsell, R., Balcan, M., Lin, H., Eds.; Curran Associates, Inc.: New York, NY, USA, 2020; Volume 33, pp. 17721–17732. [Google Scholar]
- Tian, Z.; Shen, C.; Wang, X.; Chen, H. BoxInst: High-Performance Instance Segmentation With Box Annotations. In Proceedings of the IEEE/CVF Conference on Computer Vision and Pattern Recognition (CVPR), Nashville, TN, USA, 20–25 June 2021; pp. 5443–5452. [Google Scholar]
- Tian, Z.; Shen, C.; Chen, H. Conditional Convolutions for Instance Segmentation. In Proceedings of the European Conference on Computer Vision (ECCV), Glasgow, UK, 23–28 August 2020; pp. 282–298. [Google Scholar]
- Cheng, T.; Wang, X.; Chen, S.; Zhang, W.; Zhang, Q.; Huang, C.; Zhang, Z.; Liu, W. Sparse Instance Activation for Real-Time Instance Segmentation. In Proceedings of the IEEE/CVF Conference on Computer Vision and Pattern Recognition (CVPR), New Orleans, LA, USA, 18–24 June 2022; pp. 4433–4442. [Google Scholar]
- Lyu, C.; Zhang, W.; Huang, H.; Zhou, Y.; Wang, Y.; Liu, Y.; Zhang, S.; Chen, K. RTMDet: An Empirical Study of Designing Real-Time Object Detectors. arXiv 2022, arXiv:2212.07784. [Google Scholar]
- Li, G.; Wang, Y.; Liu, Z.; Zhang, X.; Zeng, D. RGB-T Semantic Segmentation with Location, Activation, and Sharpening. IEEE Trans. Circuits Syst. Video Technol. 2023, 33, 1223–1235. [Google Scholar] [CrossRef]
- Roth, K.; Pemula, L.; Zepeda, J.; Schölkopf, B.; Brox, T.; Gehler, P. Towards Total Recall in Industrial Anomaly Detection. In Proceedings of the IEEE/CVF Conference on Computer Vision and Pattern Recognition (CVPR), New Orleans, LA, USA, 18–24 June 2022; pp. 14318–14328. [Google Scholar]
- Lee, S.; Lee, S.; Song, B.C. CFA: Coupled-Hypersphere-Based Feature Adaptation for Target-Oriented Anomaly Localization. IEEE Access 2022, 10, 78446–78454. [Google Scholar] [CrossRef]
- Kramer, O. Scikit-Learn. In Machine Learning for Evolution Strategies; Springer International Publishing: Cham, Switzerland, 2016; pp. 45–53. [Google Scholar] [CrossRef]
- Defard, T.; Setkov, A.; Loesch, A.; Audigier, R. PaDiM: A Patch Distribution Modeling Framework for Anomaly Detection and Localization. In Proceedings of the Pattern Recognition. ICPR International Workshops and Challenges, Virtual, 10–15 January 2021; pp. 475–489. [Google Scholar]
- Yu, J.; Zheng, Y.; Wang, X.; Li, W.; Wu, Y.; Zhao, R.; Wu, L. FastFlow: Unsupervised Anomaly Detection and Localization via 2D Normalizing Flows. arXiv 2021, arXiv:2111.07677. [Google Scholar]
- Yamada, S.; Hotta, K. Reconstruction Student with Attention for Student-Teacher Pyramid Matching. arXiv 2022, arXiv:2111.15376. [Google Scholar]
Disclaimer/Publisher’s Note: The statements, opinions and data contained in all publications are solely those of the individual author(s) and contributor(s) and not of MDPI and/or the editor(s). MDPI and/or the editor(s) disclaim responsibility for any injury to people or property resulting from any ideas, methods, instructions or products referred to in the content. |
© 2024 by the authors. Licensee MDPI, Basel, Switzerland. This article is an open access article distributed under the terms and conditions of the Creative Commons Attribution (CC BY) license (https://creativecommons.org/licenses/by/4.0/).