Article

Dynamic Radiant Barrier for Modulating Heat Transfer and Reducing Building Energy Usage

by
Tyler R. Stevens
1,
Behzad Parsi
1,
Rydge B. Mulford
2 and
Nathan B. Crane
1,*
1
Department of Mechanical Engineering, Brigham Young University, Provo, UT 84602, USA
2
Department of Mechanical and Aerospace Engineering, University of Dayton, 300 College Park, Dayton, OH 45469, USA
*
Author to whom correspondence should be addressed.
Energies 2024, 17(16), 3959; https://doi.org/10.3390/en17163959
Submission received: 10 July 2024 / Revised: 2 August 2024 / Accepted: 4 August 2024 / Published: 9 August 2024
(This article belongs to the Section G: Energy and Buildings)

Abstract

:
Buildings consume significant energy, much of which is used for heating and cooling. Insulation reduces undesired heat transfer to save on heating and cooling energy usage. Radiant barriers are a type of insulation technology that reduces radiant heat absorbed by a structure. Applying radiant barriers to buildings reduces costs and improves both energy efficiency and occupant comfort. However, homes often have favorable thermal gradients that could also be used to reduce energy usage if the insulation properties were switched dynamically. This article introduces two dynamic radiant barriers intended for residential attics, which can switch between reflecting and transmitting states as needed. These radiant barriers are manufactured as a single deformable assembly using sheet materials and are compatible with various actuation mechanisms. The efficacy of these radiant barriers is reported based on a hotbox experiment and numerical calculations. The experimental results demonstrate that both proposed dynamic radiant barrier designs increase effective thermal resistance by factors of approximately 2 when comparing insulating to conducting states, and by approximately 4 when comparing the insulating state to the case without a radiant barrier. Additionally, the dynamic radiant barriers achieve heat flux reductions up to 41.9% in the insulating state compared to tests without a dynamic radiant barrier.

1. Introduction

Buildings consume significant materials and energy, accounting for 38% of total US energy use, with 31% of the building energy usage dedicated to heating, cooling, and ventilation [1]. This already-large energy consumption is projected to increase 15% by 2050 [2]. Additionally, buildings contribute up to one-third of total greenhouse gas emissions [3]. To address these environmental challenges, many governments worldwide are implementing policies to enhance energy efficiency in the building sector [4,5,6,7]. Improving the energy efficiency of buildings is essential to meet the rising energy demands and mitigate their environmental impact.
A building envelope, comprising walls, roofs, foundations, and windows, serves as a barrier to heat, moisture, and air transfer between the interior and exterior environments [8]. The energy efficiency of a building hinges partly on the control of energy and mass transmission through the envelope [8,9,10]. One dominant strategy for regulating heat flow involves the installation of insulation materials. Distinct types of insulation serve specific purposes in different components of the building envelope [11]. Fiberglass insulation, for example, is commonly used within walls and ceilings due to its effectiveness in reducing conduction heat transfer at low costs. On the other hand, foam board insulation is often applied to foundations and below-grade spaces to provide thermal resistance and moisture control. Reflective insulation systems, which typically consist of aluminum foil or other reflective materials, are frequently utilized in attics and roofs to reduce radiant heat transfer between building surfaces, such as the underside of the roof and the attic floor.
A dynamic insulation strategy in which the insulation can change shape and/or properties has been proposed [12,13,14,15,16]. In dynamic insulation, the insulation state is adjusted to control the flow of heat between the environment and the building. For example, during the summer, dynamic insulation can switch states to release heat to the surroundings during cool nights while preventing overheating during the day. Unlike static insulation (whose thermal properties do not change), dynamic insulation can regulate heat flow by transitioning between insulating and conducting states [17]. Simulations show that dynamic insulation could yield energy savings between 7% and 42% depending on the climate [18].
Despite extensive research and proposed concepts for dynamic insulation, dynamic insulation remains largely confined to academic studies. The lack of commercial products suggests that existing concepts do not compete with traditional methods. For example, some dynamic insulation technologies are too costly to manufacture or deviate significantly from the forms taken by traditional insulation (such as batts and rolls), which may require specialized training for installation [11].
The U.S. Energy Information Administration estimates that by 2050, 85% of residential buildings and 55% of commercial buildings existing today will still be in use [19], making retrofitting important. The attic is an area where dynamic insulation could be easily installed but has received little attention [20]. The attic space is easily accessible for retrofits, making it an ideal candidate for dynamic insulation solutions. One study suggested that given the potential energy savings, dynamic attic insulation can be competitive with a 55% cost premium relative to traditional insulation to be favorable [21].
Solar radiation is a major source of heat gain for buildings. To mitigate unwanted heat gain in warm climates, radiant barriers with low-emissivity surfaces are employed [22]. These barriers are typically applied under roof deckings, over ceiling insulation, or among the rafters [23]. Studies on static radiant barriers have shown significant benefits. For instance, these barriers can reduce the heat load through ceilings by up to 50% [22,24,25]. Their effectiveness is greater in hot climates than in cooler ones [26].
Incorporating the principles of dynamic insulation into radiant barriers could enhance energy savings at a low cost. This paper introduces the concept of a dynamic radiant barrier (DRB) that switches between low- and high-emissivity states. The benefits of passive heating/cooling can be maximized by controlling the radiant heat flow in the attic according to the season and time of day, and potentially expanding the range of climates where radiant barriers will be favorable. Computer simulations by Dehwah et al. predict that an attic insulation system capable of switching states could double energy savings compared to static insulation [21]. Savings include annual cooling energy savings up to 54% [27] and reduced heat flux by 33% [28]. Developing a cost-effective DRB that regulates energy transmission while retaining familiar forms [11] would significantly aid in achieving global energy efficiency goals by increasing the likelihood of successful market adoption.
In 2021, the combined production capacity of fiberglass in China, the United States, Germany, and India was approximately 7.8 million metric tons per year [29], with costs of a fiberglass batt below USD 1/ft2 [30]. Therefore, any dynamic insulation must compete with the costs and ease of installation of traditional insulation and be manufacturable in similar volumes. Roll-to-roll (R2R) manufacturing is one process that could meet these requirements. R2R manufacturing is a continuous process where a flexible material moves through a series of manufacturing steps on rolls, capable of producing various devices, from microelectronics to photovoltaics [31]. This process supports large volumes and relatively low manufacturing costs. A dynamic radiant barrier manufactured using R2R techniques would be cost-competitive and have the potential for widespread adoption.
To simplify manufacturing and make DRBs more cost-effective, two designs that utilize a stack of selectively bonded sheets that can be actuated to open channels for radiative heat transfer are proposed. The motion is achieved through the deflection of compliant sheets, employing the principles of compliant mechanisms [32]. Various actuation mechanisms, such as mechanical deflection or inflation, could be utilized to actuate the modulations of radiative behavior, but this paper focuses on assessing the thermal performance of a prototype concept. The DRB concepts discussed in this paper are designed to be compatible with R2R manufacturing and are intended to regulate radiative heat transfer between the roof and attic floor. The thermal transport of these designs is evaluated through hotbox testing, and the results are compared to finite element analysis (FEA) simulations. Subsequently, the heat transfer through the DRB in both positions is compared to a system without the DRB. These results are used to identify opportunities for further improvement.

2. Experimental Procedures

2.1. Materials and Manufacturing

The DRBs in this study were designed to mirror conventional static radiant barriers in materials and properties. Typically, radiant barriers (and other types of reflective insulation) use low-emittance materials and may include multiple reflective layers, either fully bonded or periodically spaced [22,33]. Radiant barriers can be as thin as 9 μm and are often attached to substrates like paper or polymers like polyethylene [33]. Likewise, the DRBs proposed in this study were made of layers of sheet materials. Two distinct DRB geometries, the Accordion and S-Curve (Figure 1), were investigated.

2.1.1. DRB Concept

The DRBs in this study use two compliant layers spaced by an adhesive bond, which creates an air gap and prevents a direct conductive pathway through the DRBs. Fabricating the DRBs as stacked sheets of material mimics multilayer insulation employed in space applications. Multiple layers enhance the effectiveness of radiative barriers [34,35].
The Accordion DRB design, inspired by the origami accordion fold and depicted in Figure 1 and Figure 2, features a series of rectangular cavities when deployed. While traditional origami accordion folds are fabricated from a single sheet of paper, this approach forms the fold by selectively cutting and bonding two sheets. The cavities formed when deploying the accordion fold create a path for radiation transmission from the roof decking to the attic floor. (For more on the accordion fold, readers are directed to the following resources [36,37,38].) The prototype accordion DRB has 20 compliant elements or pieces of aluminum.
The S-Curve DRB design, a compliant fixed-guided mechanism shown in Figure 1 and Figure 2, forms an “S” shape when deployed. Unlike the Accordion DRB, the S-Curve does not offer a direct path for radiation heat transfer. Instead, radiation must reflect between the curves to pass through the openings in the outer layers of material. The prototype S-Curve DRB has twelve compliant elements.
While both DRB designs are produced from rectangular strips of reflective materials, the bonding locations on the sheet materials change the geometry. The compliant aluminum middle layers of the DRB bond one side to the exterior layer and the opposite side to a reflective sheet. (Locations of bonds for each DRB are illustrated in Figure 1.) The effectiveness of these designs is significantly influenced by manufacturing parameters such as bond width. Increasing the bond width (or reducing the number of compliant elements) increases the aspect ratio (height/width). The bond width also impacts the transmission region (the area through which radiation can propagate through the DRB) in the deployed state. The dimensions of compliant elements and bond width are based on the hotbox experimental setup described below.

2.1.2. Fabrication

While DRBs could be made by high-volume roll-to-roll fabrication, the DRBs in this study were manually fabricated to demonstrate the key concept. Each DRB was designed to be constructed by cutting, placing, and bonding four layers of sheet materials. The DRBs comprised two outer layers made from Low-Density Polyethylene (LDPE) with two interior reflective layers. For these DRBs, aluminum foil was used for the reflective layers. (Figure 3a presents the dimensions of each component of the manufactured DRBs.) In U.S. residential houses, truss spacings range from 304.8 mm (12 inches) to 609.6 mm (24 inches), depending on conditions [39,40]. Spacing is typically determined by the width of the sheathing material, and so 406.40 mm (16 inches) is most common [41]. The DRB and hotbox were designed to replicate attic spaces for potential DRB installation, resulting in a standard size for the experiment.
Since manufacturing is not the primary focus of this study, the Accordion DRB was simplified by replacing the bond between the reflective layers with a single folded aluminum sheet, as depicted in Figure 4. This represents an optimal scenario, as a bond between reflective sheets would protrude into the cavity and reflect some radiation to the source. The simplified Accordion design uses ten folded aluminum sheets (instead of twenty sheets bonded to form 10 hinged sheets), each folded in half to a width of 35.56 mm, as shown in Figure 3b and manufactured in Figure 5. The S-Curve utilizes twelve aluminum sheets, each cut to a width of 68.16 mm and bonded at the edges. The S-Curve’s design was not simplified.
LDPE (0.1 mm thick) was used for the top and bottom layers of the DRB because it has high transmissivity in the infrared spectrum [42,43]. To further reduce the absorption of infrared light, apertures were cut into the sheets; see Figure 3b. The LDPE sheets were precision-cut using an Epilog Fusion M2 laser cutter, while the aluminum foil was manually cut. Subsequently, each material layer was bonded using 3M 9088 Double-Sided Tape (0.013 mm thick by 6.35 mm wide). This approach allows for quick prototyping of the key concepts. Commercial applications will require a more robust bonding technique to ensure low costs, long-term durability, and narrower bonds for higher performance.
Sheets of aluminum foil (0.016 mm thick) were used as the reflective interior layers in the prototype DRBs. Aluminum foil possesses two distinct surface characteristics: a reflective side (specular reflection) and a matte side (diffuse reflection). While both surfaces have the same total reflectivity [44], the Accordion DRB was manufactured with its reflective side facing the interior of the large rectangular cavity upon deployment. In contrast, the S-Curve DRB was crafted with its reflective side directed towards the heat source—with the hotbox part representing the attic decking.

2.2. Hotbox Testing

The test setup used was based on the hotbox design by Fairey [45]. This setup was chosen to more accurately represent field conditions compared to standard methods such as ASTM C518 [46], which, as noted by Lee et al. [22], often under-represents the actual R-value due to differences in emissivity between the testing plates and real building materials. This setup, designed to replicate a roof-stud interface, experiences thermal leakage via the hotbox’s vertical walls and is influenced by ambient temperature. However, ensuring proper insulation of the hotbox walls and maintaining a controlled ambient environment during testing mitigate these issues sufficiently to demonstrate the core DRB concept and compare the relative performance of different DRB configurations.
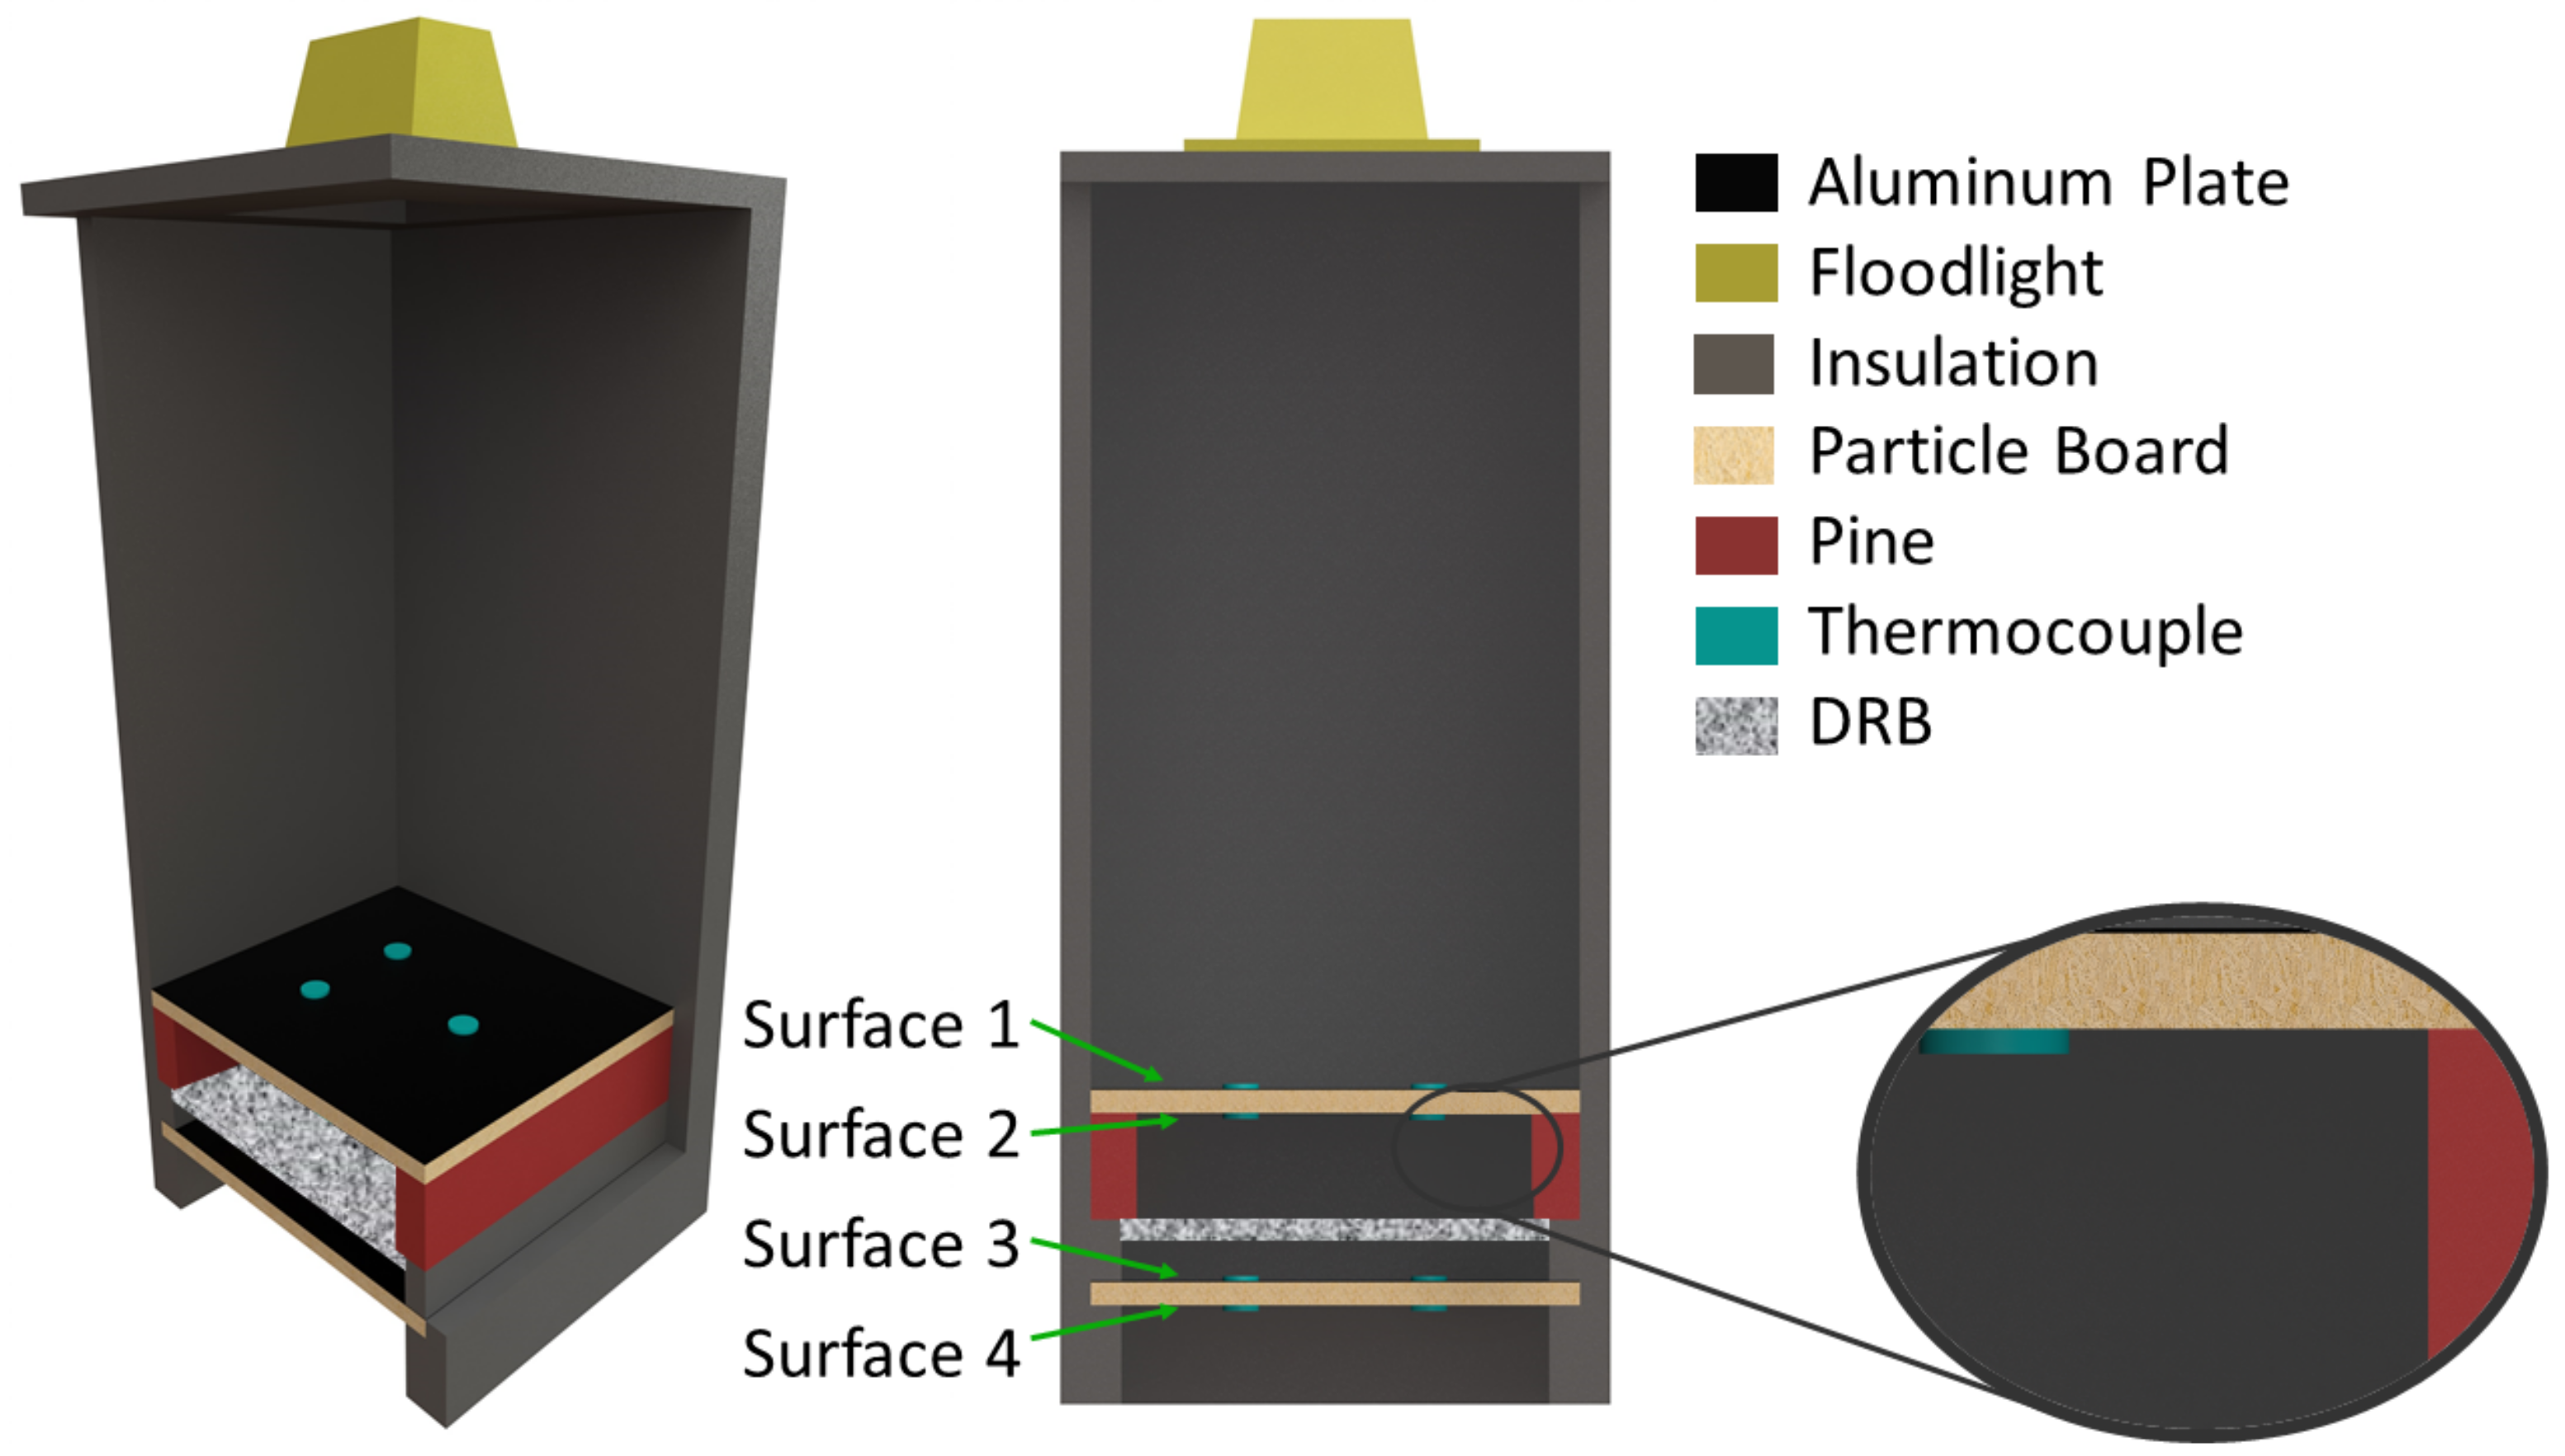
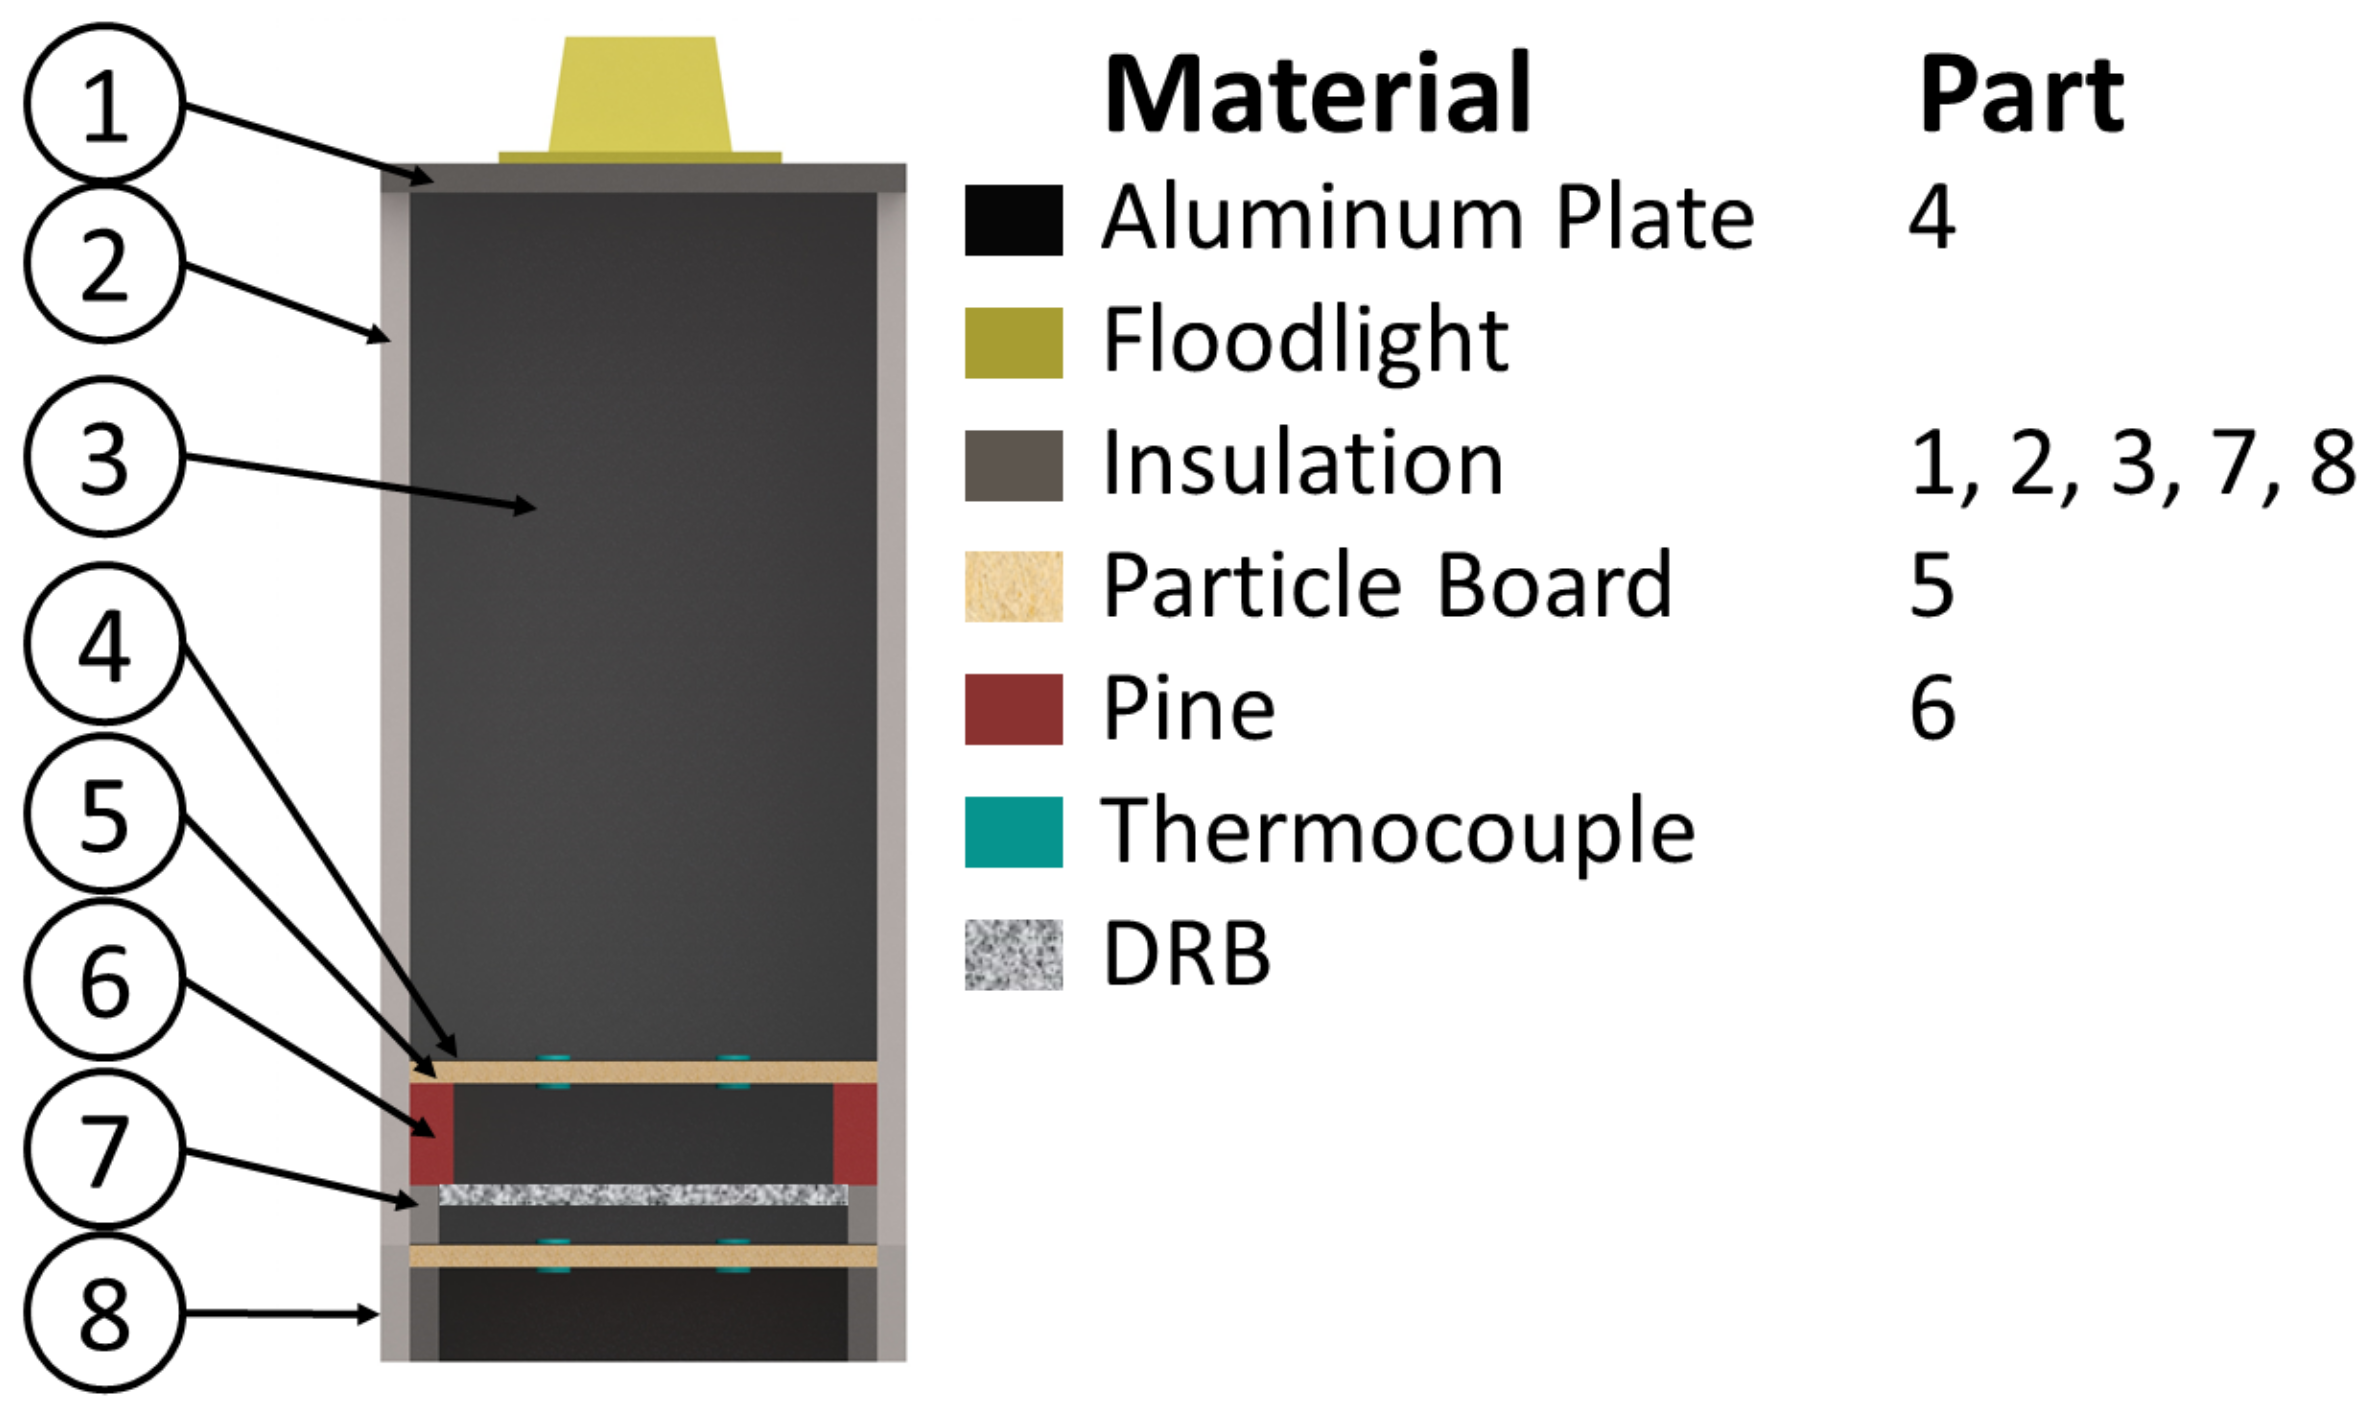
The experimental setup, shown in Figure 6 and Figure 7 and detailed in Table 1, included a Lowell QUARTZ Direct FOCUS floodlight connected to a variable transformer (voltage limited to 50 volts) as the heat source. The floodlight irradiates a flat-black spray-painted aluminum sheet (0.6 mm thick) to evenly distribute the heat across the top particleboard. (A small gap is introduced between the aluminum sheet and the thermocouples to ensure the temperature readings accurately reflect the particleboard, not the aluminum plate.) The foam board insulation, manufactured by Rmax, had an RSI value of 1.06 m2 K/W [47] and was used to isolate the hotbox from the environment. Pine beams support the top particleboard. These pine beams rest atop foam board insulation (90 mm tall), which is on a second flat-black aluminum sheet. Finally, another particleboard is placed atop the aluminum sheet to complete the setup. There are two sheets (25.4 mm thick each) of insulation on all sides of the hotbox in the measurement region, along with a layer of aluminum foil covering the interior exposed surfaces of the insulation.
This setup creates an air gap between the top particleboard—the emitting surface—and the radiant barrier to ensure that radiative heat transfer can be regulated (contact establishes a pathway for conduction). Previous research indicates that radiant barriers are most effective when a gap separates the emitting surface and the barrier [48,49,50].
The exposed region subjected to heat is 35.56 cm by 35.56 cm. Three Type K thermocouples (AWG 24) were placed on each side of each particleboard layer to monitor the temperature and estimate heat fluxes through the particleboard. The exposed tip of each thermocouple was placed in a small recess in the particleboards and bonded to the particleboards using a silver-filled, thermally conductive epoxy Aremco-Bond™ 556 manufactured by Aremco Products, Inc. (Northbrook, IL, USA) with a reported thermal conductivity of 2.2 W/m K [51]. Additionally, a portion of the thermocouple wire was bonded to respective particleboards to relieve strain. For each test, data were recorded for at least two hours after the system reached steady state, which required approximately seven hours. The heat flux, q, through the DRBs after reaching a steady state was measured as described below.
Pairs of thermocouples were installed on opposing sides of each particleboard to measure temperature and calculate temperature differentials. Subsequently, the temperature difference between these paired thermocouples was averaged to ascertain the heat flux through each particleboard layer. Subsequently, the heat flux through the bottom board was used to estimate the effective thermal resistance of the cavity between the particleboards by using the temperatures recorded on surfaces 2 and 3—as illustrated in Figure 6. Temperature data were recorded at 3 Hz.
All values presented in this paper stem from averaged data collected under steady–state conditions, defined as a temperature change of less than 0.5 °C over a two-hour period. Measurements were recorded for at least two additional hours, with data extracted and averaged over a half-hour period in the steady state. Effective thermal resistivity values represent the thermal resistivity in the cavity between the particleboard sheets and the heat flux through the bottom particleboard, which corresponds to the heat transfer into the living space. The heat flux between each pair of thermocouples was estimated using Equation (1). The heat flux values for each thermocouple pair were averaged to estimate the heat flux across the member, at steady–state. Using the heat flux through the bottom particleboard and the surface 2 and 3 temperatures, the cavity’s thermal resistance (RSI-Value) was calculated using Equation (2).
q i = k Δ T i x
R cavity = Δ T 23 q 34
where the variables k, x, q i , q 34 , R cavity , Δ T i , and Δ T 23 represent the thermal conductivity of the particleboard (0.12 W/m K [52]), particleboard thickness, heat flux through paired thermocouples, averaged heat flux through surfaces 3 and 4, thermal resistance, temperature difference of the thermocouple pair, and difference in averaged temperatures on surfaces 2 and 3, respectively.

Measurement Uncertainty

The measurement error depends on many factors including thermocouple type, purity of thermocouple metals, operating temperature range, contact with the measured surface, data acquisition device, and quality of electrical connections. Type K thermocouples, made from chromel–alumel, are manufactured such that the limits of error (in the temperature range 0–1250 °C) offer a systematic uncertainty of ±2.2 °C or 0.75% of the temperature (whichever is greater) [53]. To verify accuracy, and mitigate the systematic uncertainty, thermocouples were compared against a Fisher mercury immersion glass thermometer (resolution 0.028 °C, ca., 0.05 °F) in a water bath. The measured error of the thermocouples, with respect to the thermometer, had a mean error of 0.29 °C. The sample variance had a mean value of 0.09 °C and a standard deviation of 0.005 °C. Since the temperature difference across the boards is the primary metric, the mean error is less important than the variation.
To determine the uncertainty (denoted as u) in the reported measurements, the errors associated with the thermocouples were first accounted for. Subsequently, the propagation of these errors into the final results was calculated using a combined standard uncertainty. (For more on uncertainty propagation, readers are directed to [54,55].) To estimate the propagated error for a set of measurements that includes both random and systematic errors, for the measured data, the error for thermocouple T i was calculated using the known error from the measured error ( u M E ) and the calculated error from the experimental data, which include the standard error of the mean (SEM, defined as σ n where σ is the standard deviation and n is the number of measurements), using Equation (3).
u ( T i ) = S E M ( T i ) 2 + u M E
The uncertainty in the temperature difference, u ( Δ T ) , was derived from the uncertainties of each thermocouple; see Equation (3). These uncertainties can be combined using a root sum square method to estimate the error for the temperature differential across paired thermocouples ( u ( Δ T i j ) ):
u ( Δ T i j ) = u ( T i ) 2 + u ( T j ) 2
where i and j subscripts represent the thermocouple and thermocouple pair, respectively.
The uncertainty of the heat flux u q i j was then calculated using the temperature difference Δ T across the material:
u q i j = q i j u Δ T i j Δ T i j
where q i j is the heat flux through the material calculated using mean recorded values and Equation (6).
q i j = k · Δ T i j x
The heat flux was averaged, using the temperature differential from the paired thermocouples, to estimate the heat flux through the particleboard. This then creates a total uncertainty for the heat flux through surfaces m and n:
u ( q m n ) = S E M q ¯ i j 2 + i j = 1 3 u q i j 2
where sigma notation accounts for the uncertainties from each thermocouple pair, and S E M q ¯ i j comes from the error arising from averaging the paired heat fluxes through one particleboard.
This uncertainty propagates into the calculation of the final thermal resistance of the cavity between the particleboards. The error propagation into the thermal resistance, using the heat flux through surfaces 3 and 4, is then
u ( R cavity ) = R cavity u ( Δ T 23 ) Δ T 23 2 + u ( q 34 ) q 34 2 2 u Δ T 23 Δ T 23 u q 34 q 34

2.3. Finite Element Analysis

The experimental section investigated two DRB geometries: the Accordion and the S-Curve. For simplicity, in the FEA, the idealized, fully opened Accordion DRB geometry with rectangular cavities was studied numerically to examine the effect of radiation interacting with the barrier. In this section, the effectiveness of the DRBs was measured by comparing the heat flux through the system with and without DRBs through a numerical simulation, using the heat transfer module in COMSOL™Multiphysics software version 5.6 .
In this study, two sets of FEA models were used to evaluate the effectiveness of the DRB by comparing heat flux variations with and without DRBs against the hotbox experiment. The models, shown in Figure 8, capture conduction, convection, and radiation in the hotbox. In the model, a constant temperature is applied on surface 1 (the top surface of the top particleboard). The external and internal walls are exposed to stationary air with a convection coefficient of 5 W/m2K (The simulation showed that changing the value did not significantly impact the results. The experimental data from the No DRB case were compared with the FEA output to determine the optimal convection coefficient). The heat transfer processes within the hotbox include the following:
(1)
Heat conduction through the system.
(2)
Free convection in the interior cavity between particleboards.
(3)
Radiation exchange between the underside of the top particleboard and the surfaces in the cavity using the hemicube surface-to-surface method.
The COMSOL model includes two domains: fluid (air) and solids (e.g., insulation, wood, DRB). The default properties of each material were loaded from the COMSOL Multiphysics material library and are listed in Table 2. The dimensions of the hotbox are shown in Figure 7 and listed in Table 1. The initial air temperature was set to T 0 = 292.15 K, with the ratio of specific heats set to 1.4 [56]. In this setup, the average surface temperature of surfaces 2 through 4 was measured and averaged with and without the DRB. Additionally, in the model, the insulating state of the DRBs is represented by a continuous aluminum layer. This approach simplifies the simulation and approximates the DRB’s actual conditions—by removing the negligible gaps between the compliant aluminum components.
The flow was modeled as laminar using COMSOL’s Heat Transfer in Solids and Fluids module and the Radiation in Participating Media module. This method applies the surface-to-surface radiation condition to all boundaries on surface 1, accounting for shading and reflection between radiating surfaces. This study solved the steady–state heat transfer equation and the Navier–Stokes equations for compressible Newtonian flow, with the continuity equation.
The model was discretized using a structured mesh, with refined regions near the heat source and insulation layers to capture significant gradients. This resulted in an average element size of 0.137 mm and a total of 540,723 elements. Convergence was achieved when the residuals of continuity, momentum, and energy equations fell below 10 6 , with temperature and velocity fields showing changes of less than 0.1% between iterations. A grid-independence study demonstrated less than 0.5% of temperature variation, indicating the solution’s relative insensitivity to mesh size and determining the optimal mesh size.

3. Results and Discussion

3.1. DRB Performance

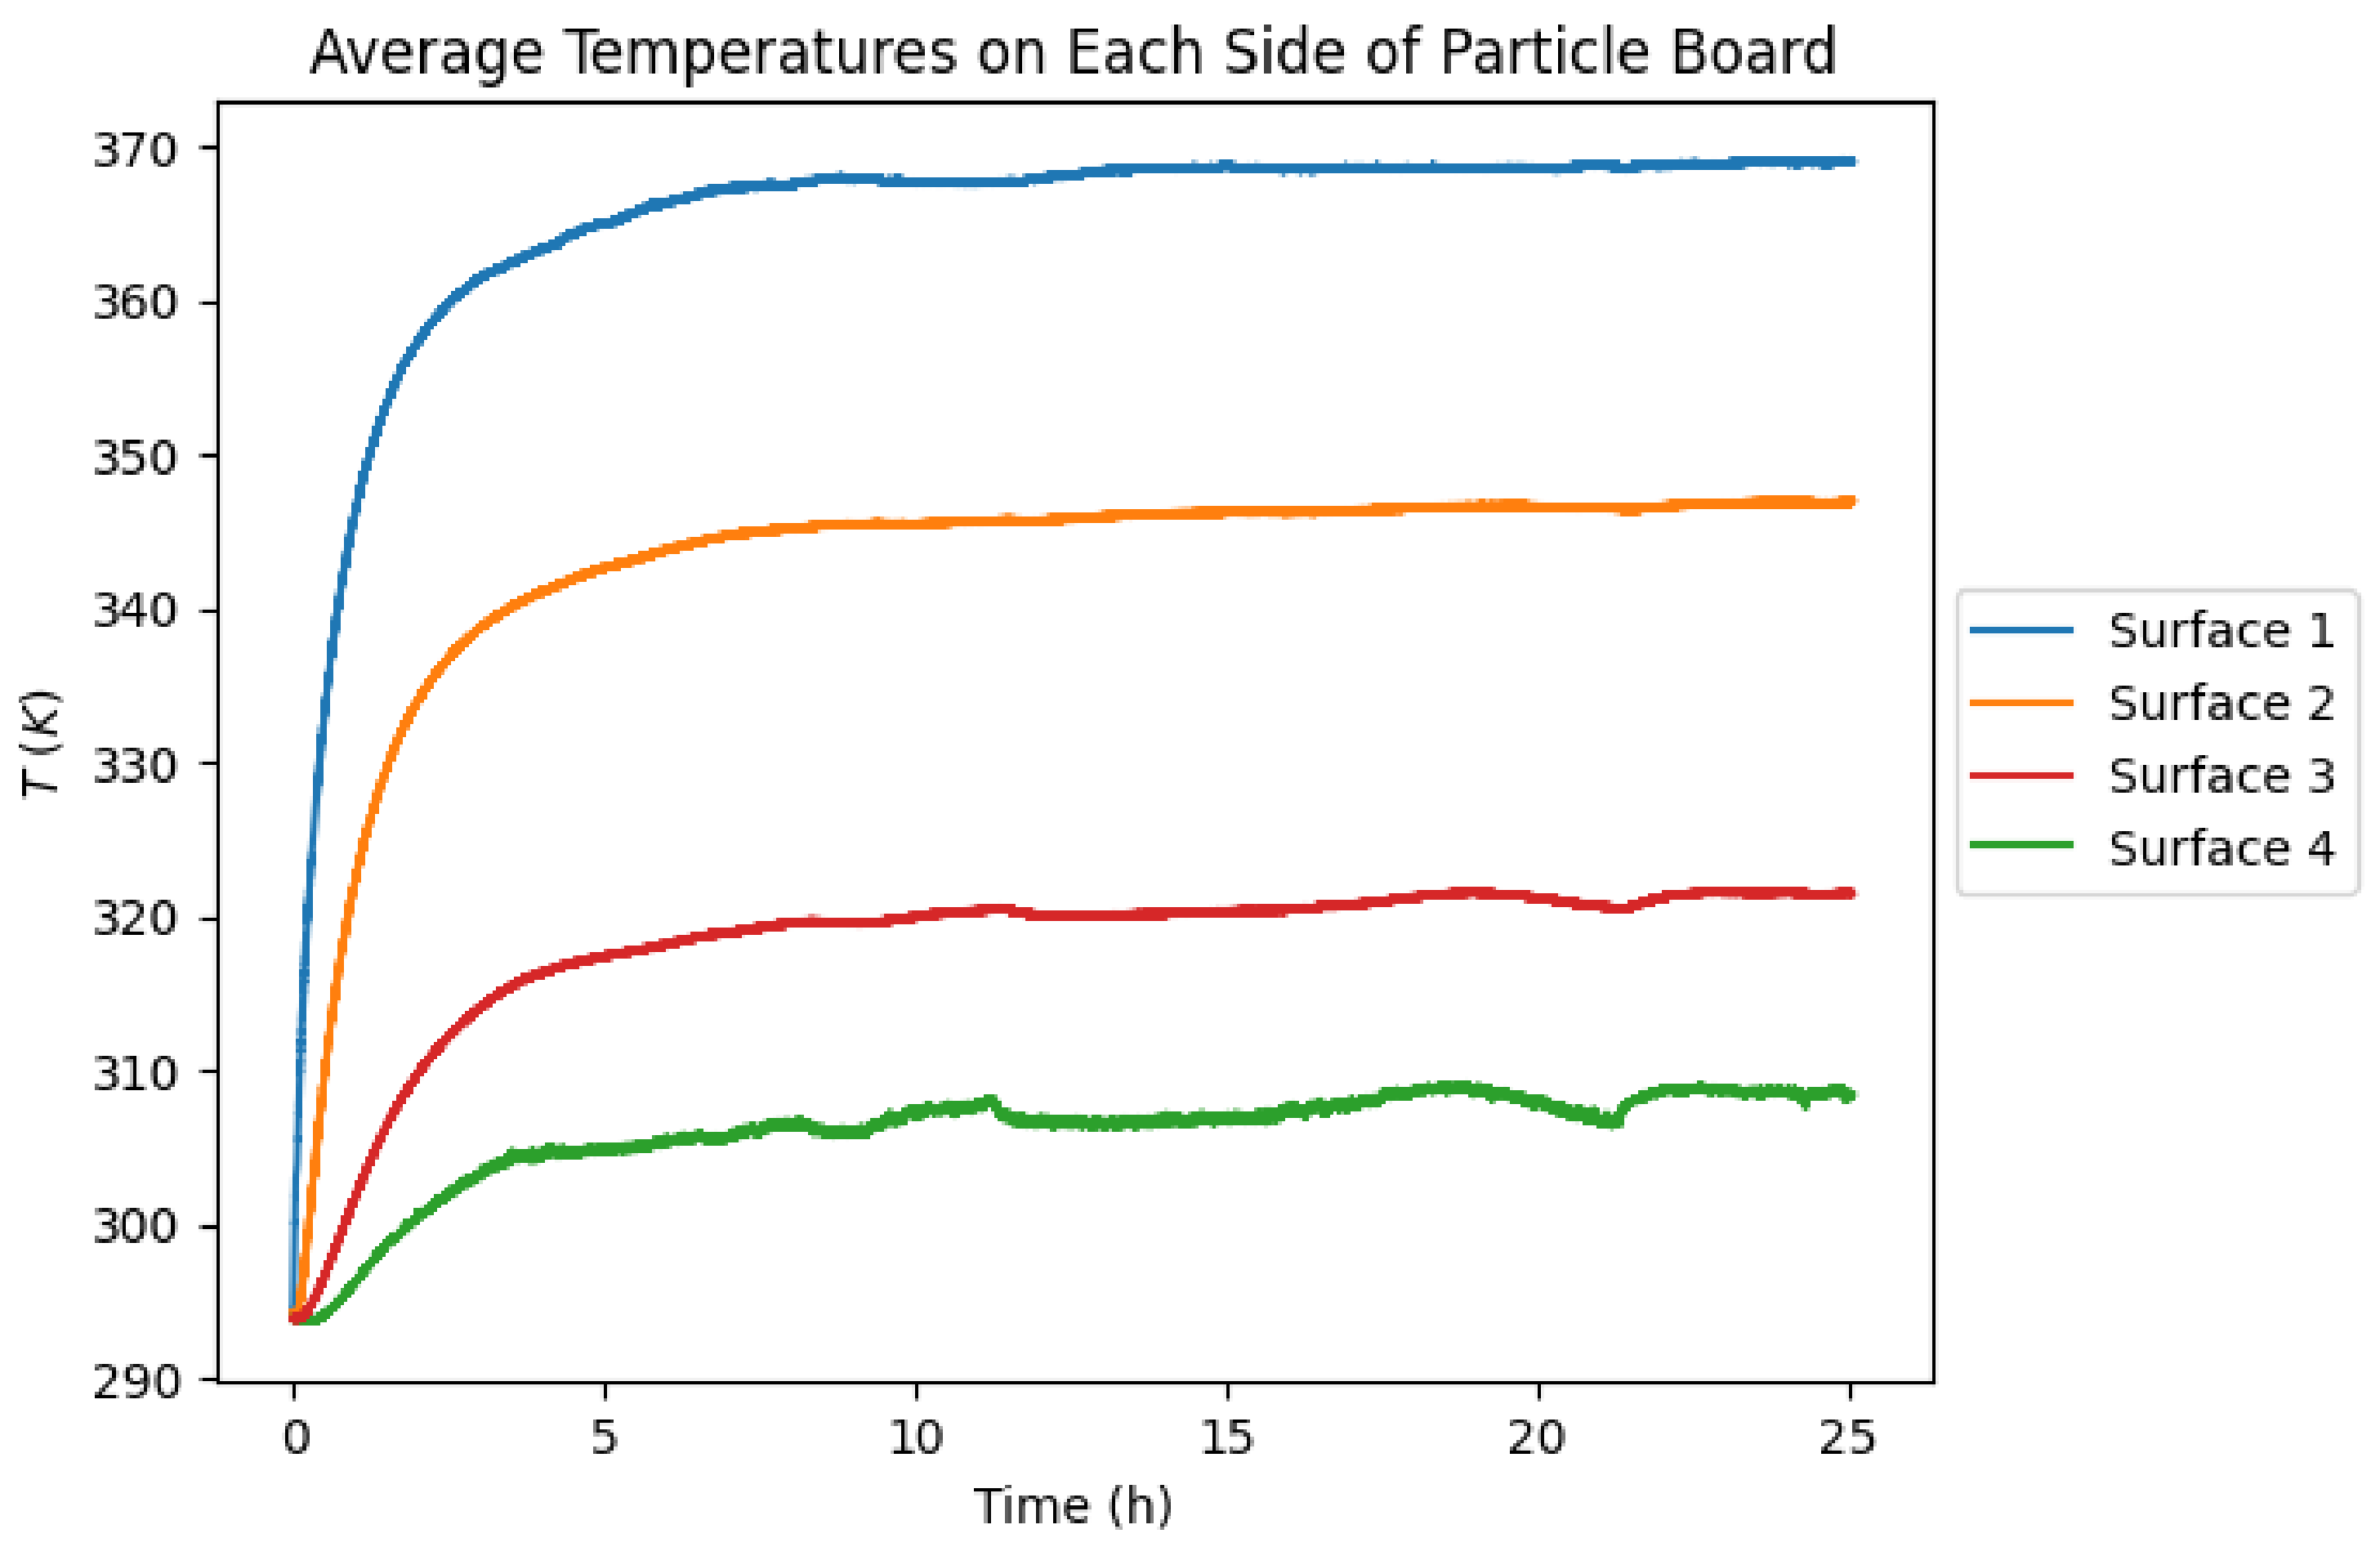
Figure 9 shows the time-dependent temperature of the hotbox in the control case without the DRB. The system reached steady–state and the temperature remained stable during the test period, with minor perturbations in the experimental data likely due to room-temperature fluctuations (mean temperature of 292.65 K with mean and standard deviation of variance of 0.09 K and 0.02 K) and thermocouple measurement errors. Surface 4 experienced the largest variations, as it is directly exposed to the environment. Using steady–state data, the heat flux, thermal resistance (RSI-value), and the ratio of thermal resistances for two DRB designs were evaluated. These results are summarized in Table 3 and Table 4 and Figure 10.
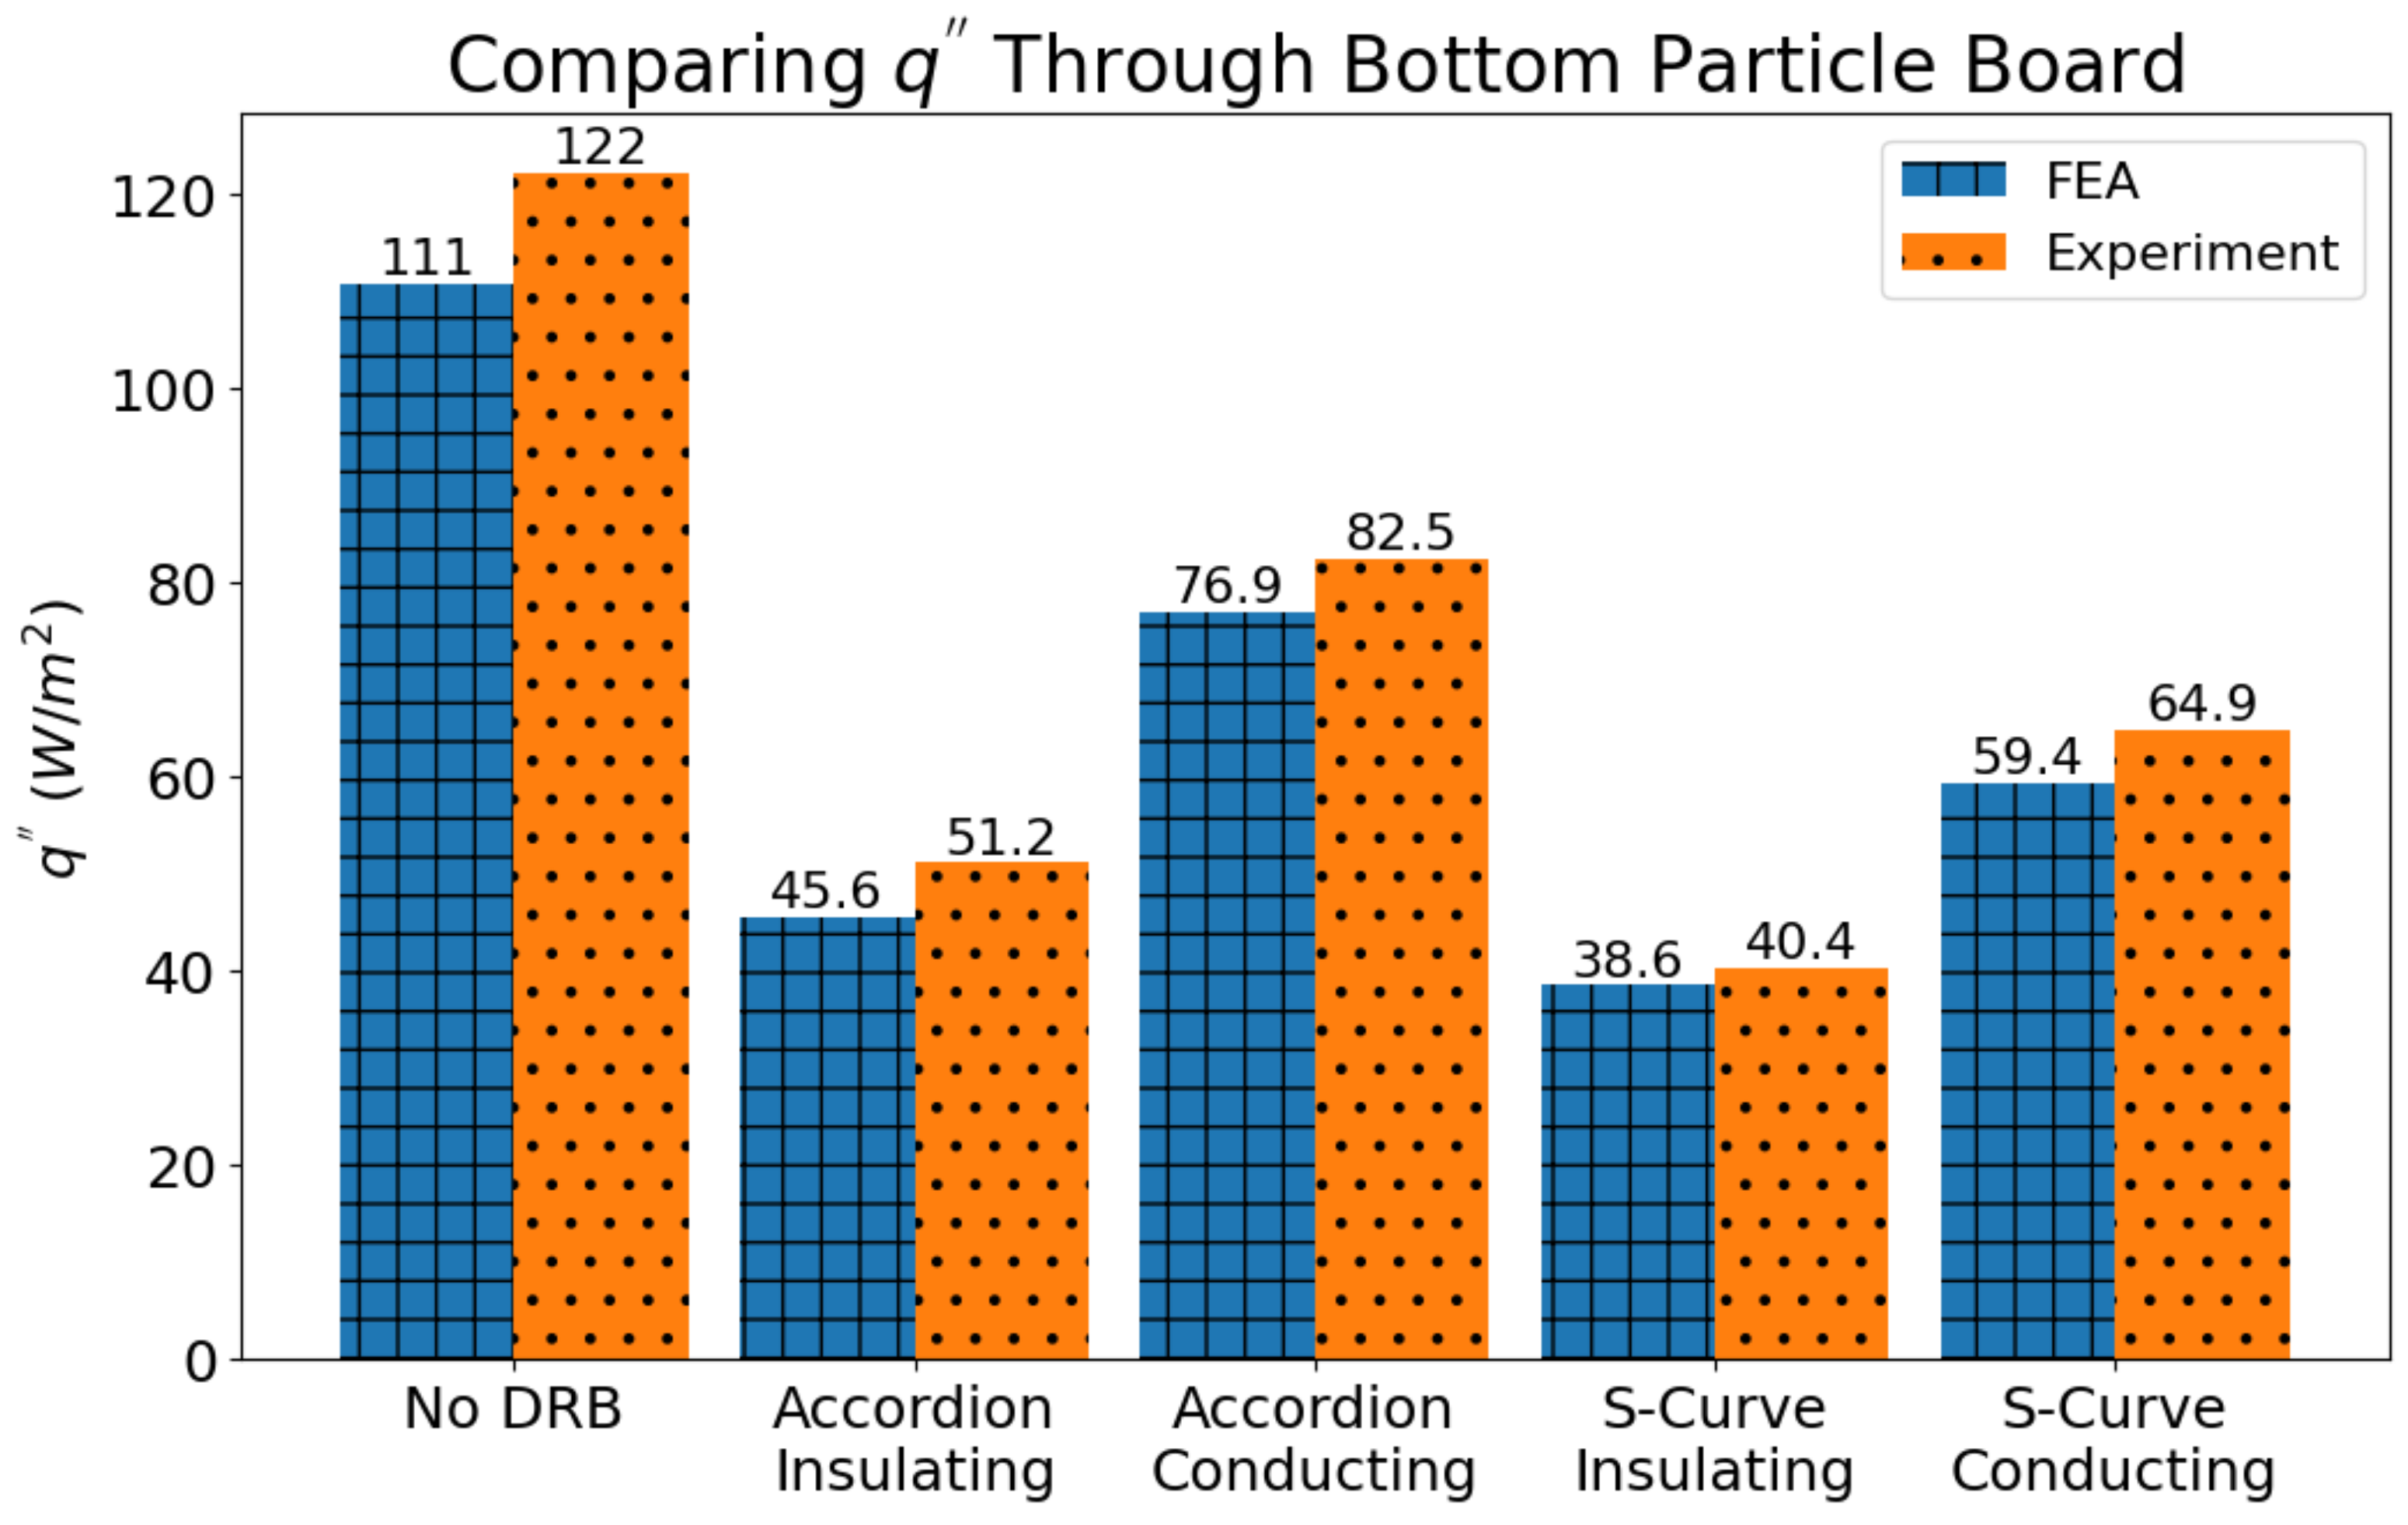
Our experimental results show that the Accordion and S-Curve DRB designs significantly reduce heat flux (Figure 10a,b) and enhance thermal resistance (Figure 10c,d) in their insulating states compared to their conducting states and conditions without a DRB. Research demonstrates that radiant barriers effectively reduce heat flux into structures. Specifically, Accordion and S-Curve DRBs achieve heat flux reductions of 41.9% and 33.1%, respectively, in the insulating state compared to No DRB. These reductions are within the 26–50% reduction achieved by static radiant barriers [22,24,25]. In terms of thermal resistance, both designs achieve a turndown ratio of approximately 2.2:1 between insulating and conducting states, and at least a 4:1 ratio between the insulating state and No DRB. Maximizing the effectiveness of the DRBs requires reducing the difference between the conducting state and the control case while maintaining (or increasing) the turndown ratio of the insulating and conducting state.
Similar thermal resistance values are expected for the conducting and insulating states when comparing the DRBs. However, in the insulating state, the S-Curve is 13% more resistive, likely due to its geometry. The S-Curve’s overlapping aluminum layers prevent gaps, reducing paths for radiative heat transfer. In contrast, manufacturing tolerances in the Accordion DRB may introduce significant spacing between the folded aluminum sheets, impacting radiative heat transfer. In the conducting state, the resistance difference between the S-Curve and Accordion DRB is negligible (0.01 m2 K/W). When partially deployed, it reflects some heat to the emitting surface. The difference between the turndown ratio for the heat flux (reported in Table 4) for each case is negligible.
A comparative analysis indicates that the S-Curve design marginally outperforms the Accordion design, with a higher thermal resistance turndown ratio. This is likely due to the deformation of each DRB in the prototypes. During the DRB-Conducting test, the Accordion exhibited less deformation than the S-Curve such that the S-Curve’s aluminum was deformed into approximately rectangular cavities while the Accordion deformed into hourglass-shaped cavities that left less open area for radiative transport through the cavities. (When deployed, the aluminum experiences plastic deformation, which then reduces the curvature of the deflected material and creates rectangular cavities.) Both Accordion and S-Curve DRBs, as single-degree-of-freedom mechanisms, are expected to show similar performance if deformed into roughly rectangular cavities with the same area fraction of open cavities. In designing DRBs, the impact on heat transfer efficiency significantly depends on factors such as material selection, geometry, and actuation. These elements not only influence the deployment but also considerably affect the manufacturing processes.
Ideally, the conducting DRB and No DRB experiments would have matching thermal resistances. The observed difference likely results from the DRB absorbing some heat, increased losses due to minor setup changes (e.g., air tightness), and the small scale of the experiment. In a small hotbox, additional material can absorb more thermal energy than in a larger setup, such as a roof, where the impact of additional material would be less significant.

3.2. FEA Results

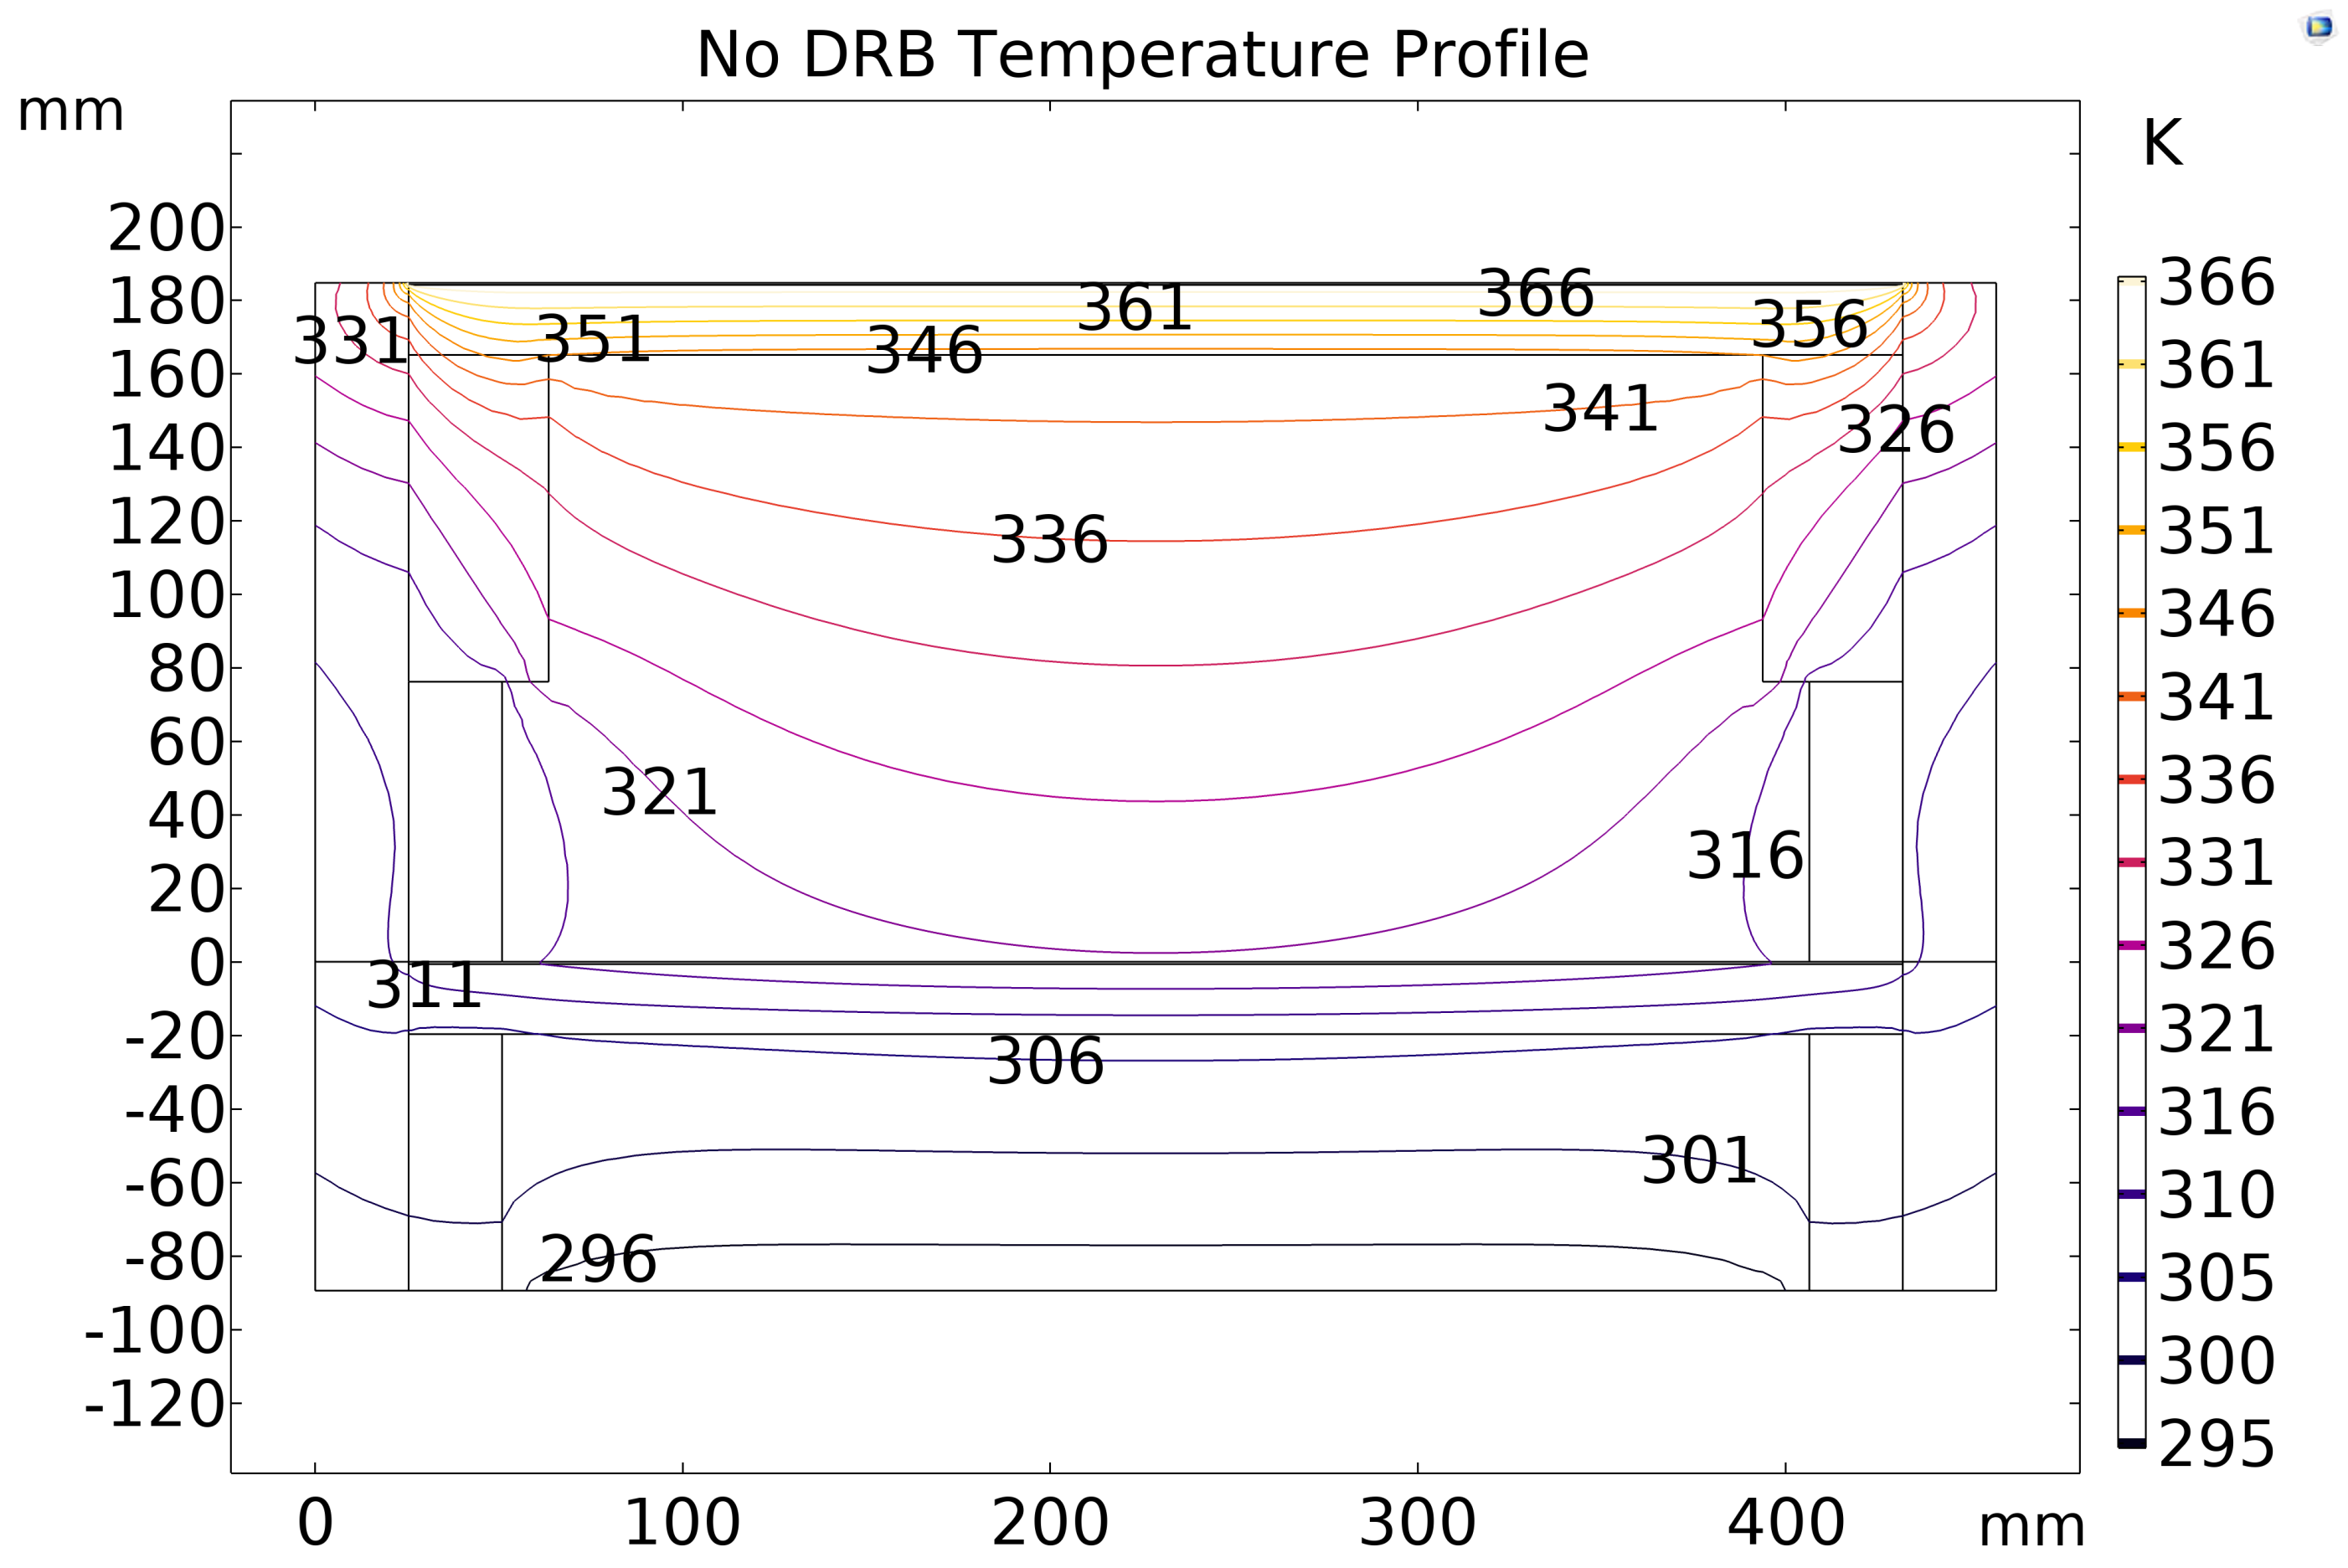
At steady–state (Figure 11), the average temperature error between experimental and FEA model data is less than 0.72% across surface 4 (the surface temperature of the interior of the structure), calculated using a relative error (surface temperatures reported in Table 5). When the Accordion DRB was in the conducting position, the temperature of the particleboard’s top surface ( T 3 ) increased from 304 K (insulating) to 312 K, confirmed by experimental measurements (310 K). The same behavior was observed for the S-Curve DRB. Furthermore, the heat flux between FEA and the experiments remained close, with an error of up to 10.8% (Figure 12).
During the experiment, the steady–state temperature differed on surface 1 by up to 7.89% between experiments—this variation likely arises from small gaps introduced when switching between experiments, room-temperature fluctuations, and changes in lamp intensity. To study the impact of the DRB and remove the impact of the changing surface 1 temperature, simulations were run with the same boundary condition (surface 1 temperature). This revealed that the No DRB and the conducting DRB simulations produce almost the same temperature on surface 4, as shown in Table 6. In the insulating state, the presence of the DRB reduces the temperature of surface 4 by nearly 10 K. This indicates that the DRB can effectively switch between limiting and permitting heat flow into a structure.

3.3. Design Considerations

This section discusses how parameters such as the number of compliant elements, bonding, and materials influence the performance of the DRB.
Practical implementation of the DRBs would require elastic deformation to ensure that the DRB could repeatedly switch between insulating and conducting states. Reflective sheets that deform elastically will have a significant curvature that influences the heat flux into the structure. The FEA model does not account for the curvature (resulting from plastic deformation). This represents an idealized performance, which removes the impact of curvature. Realistically, the curvature could degrade performance.
Increasing the number of compliant pieces increases the material bonded to the LDPE (assuming the bond width remains constant). Each compliant element requires at least two bonding locations (one to each LDPE sheet); increasing the number of elements increases the number of bonds (keeping a constant bond width). This results in lower thermal energy as the material bonded to the LDPE absorbs and reflects the heat towards the source. As the spacing between cavities decreases, there is an increase in the area fraction bonded to the reflective layers. With an increasing area fraction of bonds, the difference in DRB performance between the insulative and conductive states will likely decrease and benefits relative to a static radiant barrier will decrease. Increasing the number of compliant elements also results in a higher required actuation force. However, with smaller elements, displacement during actuation decreases, which allows for smaller cavities. Consequently, designers must carefully select the optimal number of compliant elements and the bond width when designing DRBs.
In practice, the DRB must repeatedly switch between insulating and conducting states. Due to its low elastic strain, aluminum foil poses a challenge in achieving this goal. Replacing aluminum with a thin sheet of double-sided metalized polymer or another material would address this issue. Without this capability, the widespread adoption of DRBs would be infeasible. Manufacturing scalability is crucial; bonding, placement, and layer cutting of the DRB must be carefully managed to ensure successful production.

4. Conclusions and Future Work

Radiant barriers are a highly effective means of reducing summer heat gain in buildings, consequently lowering cooling costs. By reflecting radiant heat rather than absorbing it, these barriers prevent radiative heat transfer to other surfaces, which can lead to significant energy savings. The ability to modulate the radiant barrier by switching between reflecting and conducting states offers superior thermal control. During summer, this dynamic adjustment would allow buildings to reflect heat during the hot parts of the day, reducing the need for air conditioning, and then switching to conducting heat during cooler times, potentially reducing the need for heating. The opposite approach could be useful to reduce heating energy usage during the winter. Such a system could adapt to varying weather conditions and building occupancy patterns and a varying electrical grid to optimize energy use and contribute to even greater energy savings.
DRBs represent a significant advancement in the control of radiative heat transfer, with implications extending across various disciplines. Integrating DRBs into spacecraft technology, for instance, could revolutionize thermal management systems, offering a compliant louvre mechanism that adapts responsively to the fluctuating thermal environments encountered in space. Similarly, incorporating DRBs into textile manufacturing could create fabrics capable of dynamically regulating human body temperature, thereby enhancing comfort and performance. Such textiles could impact personal clothing and medical textiles, where maintaining specific temperature ranges is crucial.
Our results indicate that the Accordion and S-Curve DRB designs significantly enhance thermal resistance and reduce heat flux in their insulating states compared to their open states and conditions without a DRB. Both designs achieve a thermal resistance turndown ratio of 2:1 between their insulating and conducting states, and a 4:1 ratio between the insulating DRB state and without a DRB. These findings highlight the potential of DRBs as a method of radiative thermal control. Applying DRBs to buildings can enhance energy efficiency by reducing both heating and cooling demands.
The DRBs discussed in this paper are designed for R2R manufacturing and form familiarity. If produced at scale with costs competitive to traditional insulation, DRBs could be widely adopted by the industry. However, improvements in bonding, material choice, and other manufacturing considerations are essential for successful adoption. These factors directly impact the kinematics and heat transfer efficiency of the DRBs.
While DRBs in the insulating state resemble traditional radiant barriers or multilayer insulation, the effectiveness of DRBs compared to these conventional methods of regulating radiative heat transfer has not been compared. Assessing the potential of DRBs would require additional testing to compare their effectiveness to static systems in real-world environments. Further tests may include investigating actuation mechanisms, the number of compliant layers, validating DRB effectiveness with a guarded hotbox, and larger-scale tests in actual structures. Ultimately, the DRB performance data must be incorporated into a comprehensive economic analysis, including estimated payback periods and upfront costs, which is crucial to determine the commercial viability of DRBs and ensure they are competitive.
To complement the economic analysis and performance testing, future tests should focus on evaluating material degradation to understand the effects of thermal cycling through accelerated aging tests and real-world environmental exposure assessments. Mechanical durability testing should simulate real-world conditions to assess resistance to tearing, puncturing, and mechanical fatigue from repeated expansion and contraction. Additionally, assessing environmental resistance is necessary to determine the barrier’s durability against dust, mold, mildew, and pests under various conditions.
Developing a methodology for estimating the DRB’s lifespan, considering different climate conditions and installation environments, is also crucial for DRBs to be competitive. Implementing long-term monitoring programs to analyze changes in thermal performance over time will ensure the DRB maintains its insulating properties throughout its lifespan (or fails in the insulating state). Finally, proposing maintenance and inspection guidelines will help identify potential issues early and ensure continuous optimal performance, making DRBs a reliable and durable building insulation solution.

Author Contributions

T.R.S.: Data Curation, Formal Analysis, Investigation, Methodology, Software, Visualization, Writing—Original Draft Preparation, Writing—Reviewing and Editing. B.P.: Software, Writing—Original Draft Preparation. R.B.M.: Supervision, Writing—Reviewing and Editing. N.B.C.: Conceptualization, Resources, Supervision, Writing—Reviewing and Editing. All authors have read and agreed to the published version of the manuscript.

Funding

This research did not receive any specific grant from funding agencies in the public, commercial, or not-for-profit sectors.

Institutional Review Board Statement

Not applicable.

Informed Consent Statement

Not applicable.

Data Availability Statement

Data available upon request.

Acknowledgments

While composing the text, AI-assisted tools were employed to ensure proper grammar. However, the human authors have subsequently modified the corrected text and assume full responsibility for its form and content.

Conflicts of Interest

The authors declare no conflicts of interest.

Abbreviations

The following abbreviations are used in this manuscript:
c p heat capacity at constant pressure
Δ T i j difference in averaged temperatures on surfaces i and j
DRBdynamic radiant barrier
ϵ emissivity
FEAfinite element analysis
hconvection coefficient
kthermal conductivity
LDPElow-density polyethylene
nnumber of measurements
q heat flux
q i heat flux through paired thermocouples
q i j averaged heat flux through surfaces i and j
q c o n conducting heat flux
q i n s insulating heat flux
R cavity thermal resistance of the cavity between the particleboards
R c o n conducting thermal resistance
R i n s insulating thermal resistance
R2Rroll-to-roll
SEMstandard error of the mean
σ standard deviation
T i temperature on surface i
uuncertainty
u M E uncertainty of measured thermocouple error
xthickness of particleboard

References

  1. US Department of Energy. Quadrennial Technology Review: An Assessment of Energy Technologies and Research Opportunities; US Department of Energy: Washington, DC, USA, 2015.
  2. U.S. Energy Information Administration. Annual Energy Outlook 2023 (AEO2023); U.S. Energy Information Administration: Washington, DC, USA, 2023.
  3. United Nations Environment Programme Buildings and Climate Change: Summary for Decision Makers; United Nations Environment Programme: Paris, France, 2009.
  4. Directorate-General For Energy European Commission. Commission ‘Digitalising the Energy System—EU Action Plan’; Technical Report; European Commission: Brussels, Belgium, 2022. [Google Scholar]
  5. Federal Information & News Dispatch, LLC. Building a Better Grid Initiative to Upgrade and Expand the Nation’s Electric Transmission Grid to Support Resilience, Reliability, and Decarbonization; Technical Report; Federal Information & News Dispatch, LLC: Lanham, MD, USA, 2022. [Google Scholar]
  6. Butt, O.M.; Zulqarnain, M.; Butt, T.M. Recent advancement in smart grid technology: Future prospects in the electrical power network. Ain Shams Eng. J. 2021, 12, 687–695. [Google Scholar] [CrossRef]
  7. Tan, K.M.; Babu, T.S.; Ramachandaramurthy, V.K.; Kasinathan, P.; Solanki, S.G.; Raveendran, S.K. Empowering smart grid: A comprehensive review of energy storage technology and application with renewable energy integration. J. Energy Storage 2021, 39, 102591. [Google Scholar] [CrossRef]
  8. Hagentoft, C.E. Introduction to Building Physics, 1st ed.; Studentlitteratur: Lund, Sweden, 2001. [Google Scholar]
  9. Pinteric, M. Building Physics: From Physical Principles to International Standards, 2nd ed.; Springer International Publishing: Cham, Switzerland, 2021. [Google Scholar] [CrossRef]
  10. Heat and Mass Transfer in Buildings. Available online: https://www.staff.dtu.dk/-/media/staff/menqin/heat-and-mass-transfer-in-buildings.pdf (accessed on 20 June 2024).
  11. DRAFT Research and Development Opportunities Report for Opaque Building Envelopes. Available online: https://www.energy.gov/sites/prod/files/2020/05/f74/bto-20200505_Draft_Envelope_RDO_0.pdf (accessed on 20 June 2024).
  12. Burdajewicz, F.; Korjenic, A.; Bednar, T. Bewertung und Optimierung von dynamischen Dämmsystemen unter Berücksichtigung des Wiener Klimas. Bauphysik 2011, 33, 49–58. [Google Scholar] [CrossRef]
  13. Nicol, K. The thermal effectiveness of various types of window coverings. Energy Build. 1986, 9, 231–237. [Google Scholar] [CrossRef]
  14. Le-Thanh, L.; Le-Duc, T.; Ngo-Minh, H.; Nguyen, Q.H.; Nguyen-Xuan, H. Optimal design of an Origami-inspired kinetic façade by balancing composite motion optimization for improving daylight performance and energy efficiency. Energy 2021, 219, 119557. [Google Scholar] [CrossRef]
  15. Krarti, M. Optimal energy performance of dynamic sliding and insulated shades for residential buildings. Energy 2023, 263, 125699. [Google Scholar] [CrossRef]
  16. Viereck, V.; Ackermann, J.; Li, Q.; Jakel, A.; Schmid, J.; Hillmer, H. Sun glasses for buildings based on micro mirror arrays: Technology, control by networked sensors and scaling potential. In Proceedings of the 2008 5th International Conference on Networked Sensing Systems, Kanazawa, Japan, 17–19 June 2008; pp. 135–139. [Google Scholar] [CrossRef]
  17. Yang, Y.; Chen, S. Thermal insulation solutions for opaque envelope of low-energy buildings: A systematic review of methods and applications. Renew. Sustain. Energy Rev. 2022, 167, 112738. [Google Scholar] [CrossRef]
  18. Menyhart, K.; Krarti, M. Potential energy savings from deployment of Dynamic Insulation Materials for US residential buildings. Build. Environ. 2017, 114, 203–218. [Google Scholar] [CrossRef]
  19. U.S. Energy Information Administration. Annual Energy Outlook 2018 (AEO2018); Technical Report; U.S. Energy Information Administration: Washington, DC, USA, 2018.
  20. Stevens, T.R.; Crane, N.B.; Mulford, R.B. Topology Morphing Insulation: A Review of Technologies and Energy Performance in Dynamic Building Insulation. Energies 2023, 16, 6978. [Google Scholar] [CrossRef]
  21. Dehwah, A.H.A.; Krarti, M. Cost-benefit analysis of retrofitting attic-integrated switchable insulation systems of existing US residential buildings. Energy 2021, 221, 119840. [Google Scholar] [CrossRef]
  22. Lee, S.W.; Lim, C.H.; Salleh, E.I.B. Reflective thermal insulation systems in building: A review on radiant barrier and reflective insulation. Renew. Sustain. Energy Rev. 2016, 65, 643–661. [Google Scholar] [CrossRef]
  23. Desjarlais, A.O. Radiant Barrier Fact Sheet; Technical Report; Oak Ridge National Laboratory: Oak Ridge, TN, USA, 2010. [Google Scholar]
  24. Fairey, P. The measured side-by-side performance of attic radiant barrier systems in hot, humid climates. In Proceedings of the Nineteenth International Thermal Conductivity Conference, Cookville, TN, USA, 20–23 October 1985; pp. 481–496. [Google Scholar]
  25. Medina, M.A. A comprehensive review of radiant barrier research including laboratory and field experiments. ASHRAE Trans. 2012, 118, 400. [Google Scholar]
  26. United States Department of Energy. Radiant Barriers. 2016. Available online: https://www.energy.gov/energysaver/radiant-barriers%7D. (accessed on 20 June 2024).
  27. Dehwah, A.H.A.; Krarti, M. Impact of switchable roof insulation on energy performance of US residential buildings. Build. Environ. 2020, 177, 106882. [Google Scholar] [CrossRef]
  28. Chang, P.C.; Chiang, C.M.; Lai, C.M. Development and preliminary evaluation of double roof prototypes incorporating RBS (radiant barrier system). Energy Build. 2008, 40, 140–147. [Google Scholar] [CrossRef]
  29. AustuteAnalytica. Global Fiberglass Market Is Poised to Reach US $23,217.3 Million by 2031, Says Astute Analytica. 2013. Available online: https://finance.yahoo.com/news/global-fiberglass-market-poised-reach-133000622.html (accessed on 8 August 2023).
  30. United States Department of Energy. Guide to Home Insulation. 2010. Available online: https://www.energy.gov/sites/prod/files/guide_to_home_insulation.pdf (accessed on 20 June 2024).
  31. Greener, J. Roll-to-Roll Manufacturing. In Roll-to-Roll Manufacturing: Process Elements and Recent Advances; John Wiley & Sons, Inc.: Hoboken, NJ, USA, 2018; pp. 1–17. [Google Scholar] [CrossRef]
  32. Howell, L.L. Compliant Mechanisms; John Wiley & Sons Ltd: Hoboken, NJ, USA, 2001. [Google Scholar]
  33. Yarbrough, D.W. Assessment of Reflective Insulations for Residential and Commercial Applications; Technical Report; Oak Ridge National Lab: Oak Ridge, TN, USA, 1983. [Google Scholar] [CrossRef]
  34. Finckenor, M.M.; Dooling, D. Multilayer Insulation Material Guidelines; Technical Report; NASA: Washington, DC, USA, 1999.
  35. Smith, C.; Mckinley, I.; Ramsey, P.; Rodriguez, J. Performance of multi-layer insulation for spacecraft instruments at cryogenic temperatures. In Proceedings of the 46th International Conference on Environmental Systems, Vienna, Austria, 10 July 2016. [Google Scholar]
  36. Morgan, J.; Magleby, S.P.; Howell, L.L. An Approach to Designing Origami-Adapted Aerospace Mechanisms. J. Mech. Des. 2016, 138, 052301. [Google Scholar] [CrossRef]
  37. Thrall, A.P.; Quaglia, C.P. Accordion shelters: A historical review of origami-like deployable shelters developed by the US military. Eng. Struct. 2014, 59, 686–692. [Google Scholar] [CrossRef]
  38. Klotz, A. Origami-shaped conducting polymer stretches like an accordion. MRS Bull. 2018, 43, 400. [Google Scholar] [CrossRef]
  39. American Wood Council. 2024 Wood Frame Construction Manual (WFCM) for One- and Two-Family Dwellings; American Wood Council: Leesburg, VA, USA, 2023. [Google Scholar]
  40. International Code Council. 2021 International Residential Code; International Code Council: Nappanee, IN, USA, 2021. [Google Scholar]
  41. Association, A.T.E.W. APA Engineered Wood Construction Guide. 2019. Available online: https://osb.westfraser.com/wp-content/uploads/2020/01/E30X.pdf (accessed on 20 June 2024).
  42. Ndegwa, N.G.; Ndiritu, F.G.; Hussein, G.S.A.; Kamweru, P.K.; Kagia, J.K.; Muthui, Z.W. Reflectance, Transmittance and Absorptance of HDPE, LDPE, Glass and Sand Layer Used in a SAH. Int. J. Appl. Phys. Math. 2014, 4, 406–416. [Google Scholar] [CrossRef]
  43. Carrobé, A.; Martorell, I.; Solé, C.; Castell, A. Transmittance analysis for materials suitable as radiative cooling windshield and aging study for polyethylene. In Proceedings of the EuroSun 2020, Athens, Greece, 29 September–1 October 2020. [Google Scholar] [CrossRef]
  44. Pozzobon, V.; Levasseur, W.; Do, K.V.; Palpant, B.; Perré, P. Household aluminum foil matte and bright side reflectivity measurements: Application to a photobioreactor light concentrator design. Biotechnol. Rep. 2020, 25, e00399. [Google Scholar] [CrossRef]
  45. Fairey, P.W. Effects of Infrared Radiation Barriers on the Effective Thermal Resistance of Building Envelopes. In Proceedings of the ASHRAE/DOE Conference on Thermal Performance of the Exterior Envelopes of Buildings II, Clearwater, FL, USA, 1–5 December 1982. [Google Scholar]
  46. ASTM C518-21; Standard Test Method for Steady-State Thermal Transmission Properties by Means of the Heat Flow Meter Apparatus. ASTM International: West Conshohocken, PA, USA, 2021. [CrossRef]
  47. RMax. Sika® Rmax® Pro Select Polyiso Insulation Board. 2023. Available online: https://usa.sika.com/dms/getdocument.get/137e484c-d2c9-4fc2-bc25-2a7b2e4dc52a/Sika-Rmax-Pro-Select-R-Matte-Plus-3-Product-Data-Sheet.pdf (accessed on 20 June 2024).
  48. Fricker, J.M. Computational Analysis of Reflective Air Spaces. Airah J. 1997, 51, 29–32. [Google Scholar]
  49. Asadi, S.; Hassan, M.M.; Beheshti, A. Performance evaluation of an attic radiant barrier system using three-dimensional transient finite element method. J. Build. Phys. 2013, 36, 247–264. [Google Scholar] [CrossRef]
  50. Robinson, H.E.; Powlitch, F.J. The Thermal Insulating Value of Air Spaces; Technical Report; National Bureau of Standards: Gaithersburg, MD, USA, 1954.
  51. Aremco. Electrically and Thermally Conductive Adhesives and Coatings. Available online: https://www.aremco.com/wp-content/uploads/2018/05/A08_S1_18.pdf (accessed on 20 June 2024).
  52. Sonderegger, W.; Niemz, P. Thermal conductivity and water vapour transmission properties of wood-based materials. Eur. J. Wood Wood Prod. 2009, 67, 313–321. [Google Scholar] [CrossRef]
  53. Nakos, J.T. Uncertainty Analysis of Thermocouple Measurements Used in Normal and Abnormal Thermal Environment Experiments at Sandia’s Radiant Heat Facility and Lurance Canyon Burn Site; Technical Report; Sandia National Laboratories: Livermore, CA, USA, 2004. [Google Scholar] [CrossRef]
  54. ISO; BIPM; OIML. Guide to the Expression of Uncertainty in Measurement (GUM), BIPM, IEC, IFCC, ISO, IUPAC, IUPAP, OIML; ISO: Geneva, Switzerland, 2008. [Google Scholar]
  55. Farrance, I.; Frenkel, R. Uncertainty of Measurement: A Review of the Rules for Calculating Uncertainty Components through Functional Relationships. Clin. Biochem. Rev. 2012, 33, 49–75. [Google Scholar] [PubMed]
  56. Eggers, A.J. One-Dimensional Flows of an Imperfect Diatomic Gas; Technical Report; NASA: Washington, DC, USA, 1949.
  57. Yost, B.; Weston, S. State-of-the-Art Small Spacecraft Technology; Technical Report; NASA: Washington, DC, USA, 2024.
  58. Fantucci, S.; Serra, V. Experimental Assessment of the Effects of Low-Emissivity Paints as Interior Radiation Control Coatings. Appl. Sci. 2020, 10, 842. [Google Scholar] [CrossRef]
  59. Anderson, K.; Weritz, J.; Kaufman, J.G. (Eds.) 1xxx Aluminum Alloy Datasheets. In Properties and Selection of Aluminum Alloys; ASM International: Detroit, MI, USA, 2019; Volume 2B. [Google Scholar] [CrossRef]
  60. Zhang, A.; Li, Y. Thermal Conductivity of Aluminum Alloys—A Review. Materials 2023, 16, 2972. [Google Scholar] [CrossRef] [PubMed]
  61. Sonnier, R.; Ferry, L.; Gallard, B.; Boudenne, A.; Lavaud, F. Controlled Emissivity Coatings to Delay Ignition of Polyethylene. Materials 2015, 8, 6949. [Google Scholar] [CrossRef] [PubMed]
  62. Gauthier, M.M. Thermal Analysis and Properties of Polymers; Engineered Materials Handbook Desk Edition; ASM International: Detroit, MI, USA, 1995. [Google Scholar] [CrossRef]
  63. Lopes, C.M.A.; Felisberti, M.I. Thermal conductivity of PET/(LDPE/AI) composites determined by MDSC. Polym. Test. 2004, 23, 637–643. [Google Scholar] [CrossRef]
  64. Yousefi, Y.; Tariku, F. Thermal Conductivity and Specific Heat Capacity of Insulation materials at Different Mean Temperatures. J. Phys. Conf. Ser. 2021, 2069, 12090. [Google Scholar] [CrossRef]
  65. Ross, R.J.; Laboratory, F.P.U.F.S. Wood Handbook: Wood as an Engineering Material; Technical Report; U.S. Department of Agriculture, Forest Service, Forest Products Laboratory: Washington, DC, USA, 2010. [CrossRef]
  66. Czajkowski, L.; Olek, W.; Weres, J.; Guzenda, R. Thermal properties of wood-based panels: Specific heat determination. Wood Sci. Technol. 2016, 50, 537–545. [Google Scholar] [CrossRef]
  67. Long, L.; Ye, H. The roles of thermal insulation and heat storage in the energy performance of the wall materials: A simulation study. Sci. Rep. 2016, 6, 24181. [Google Scholar] [CrossRef]
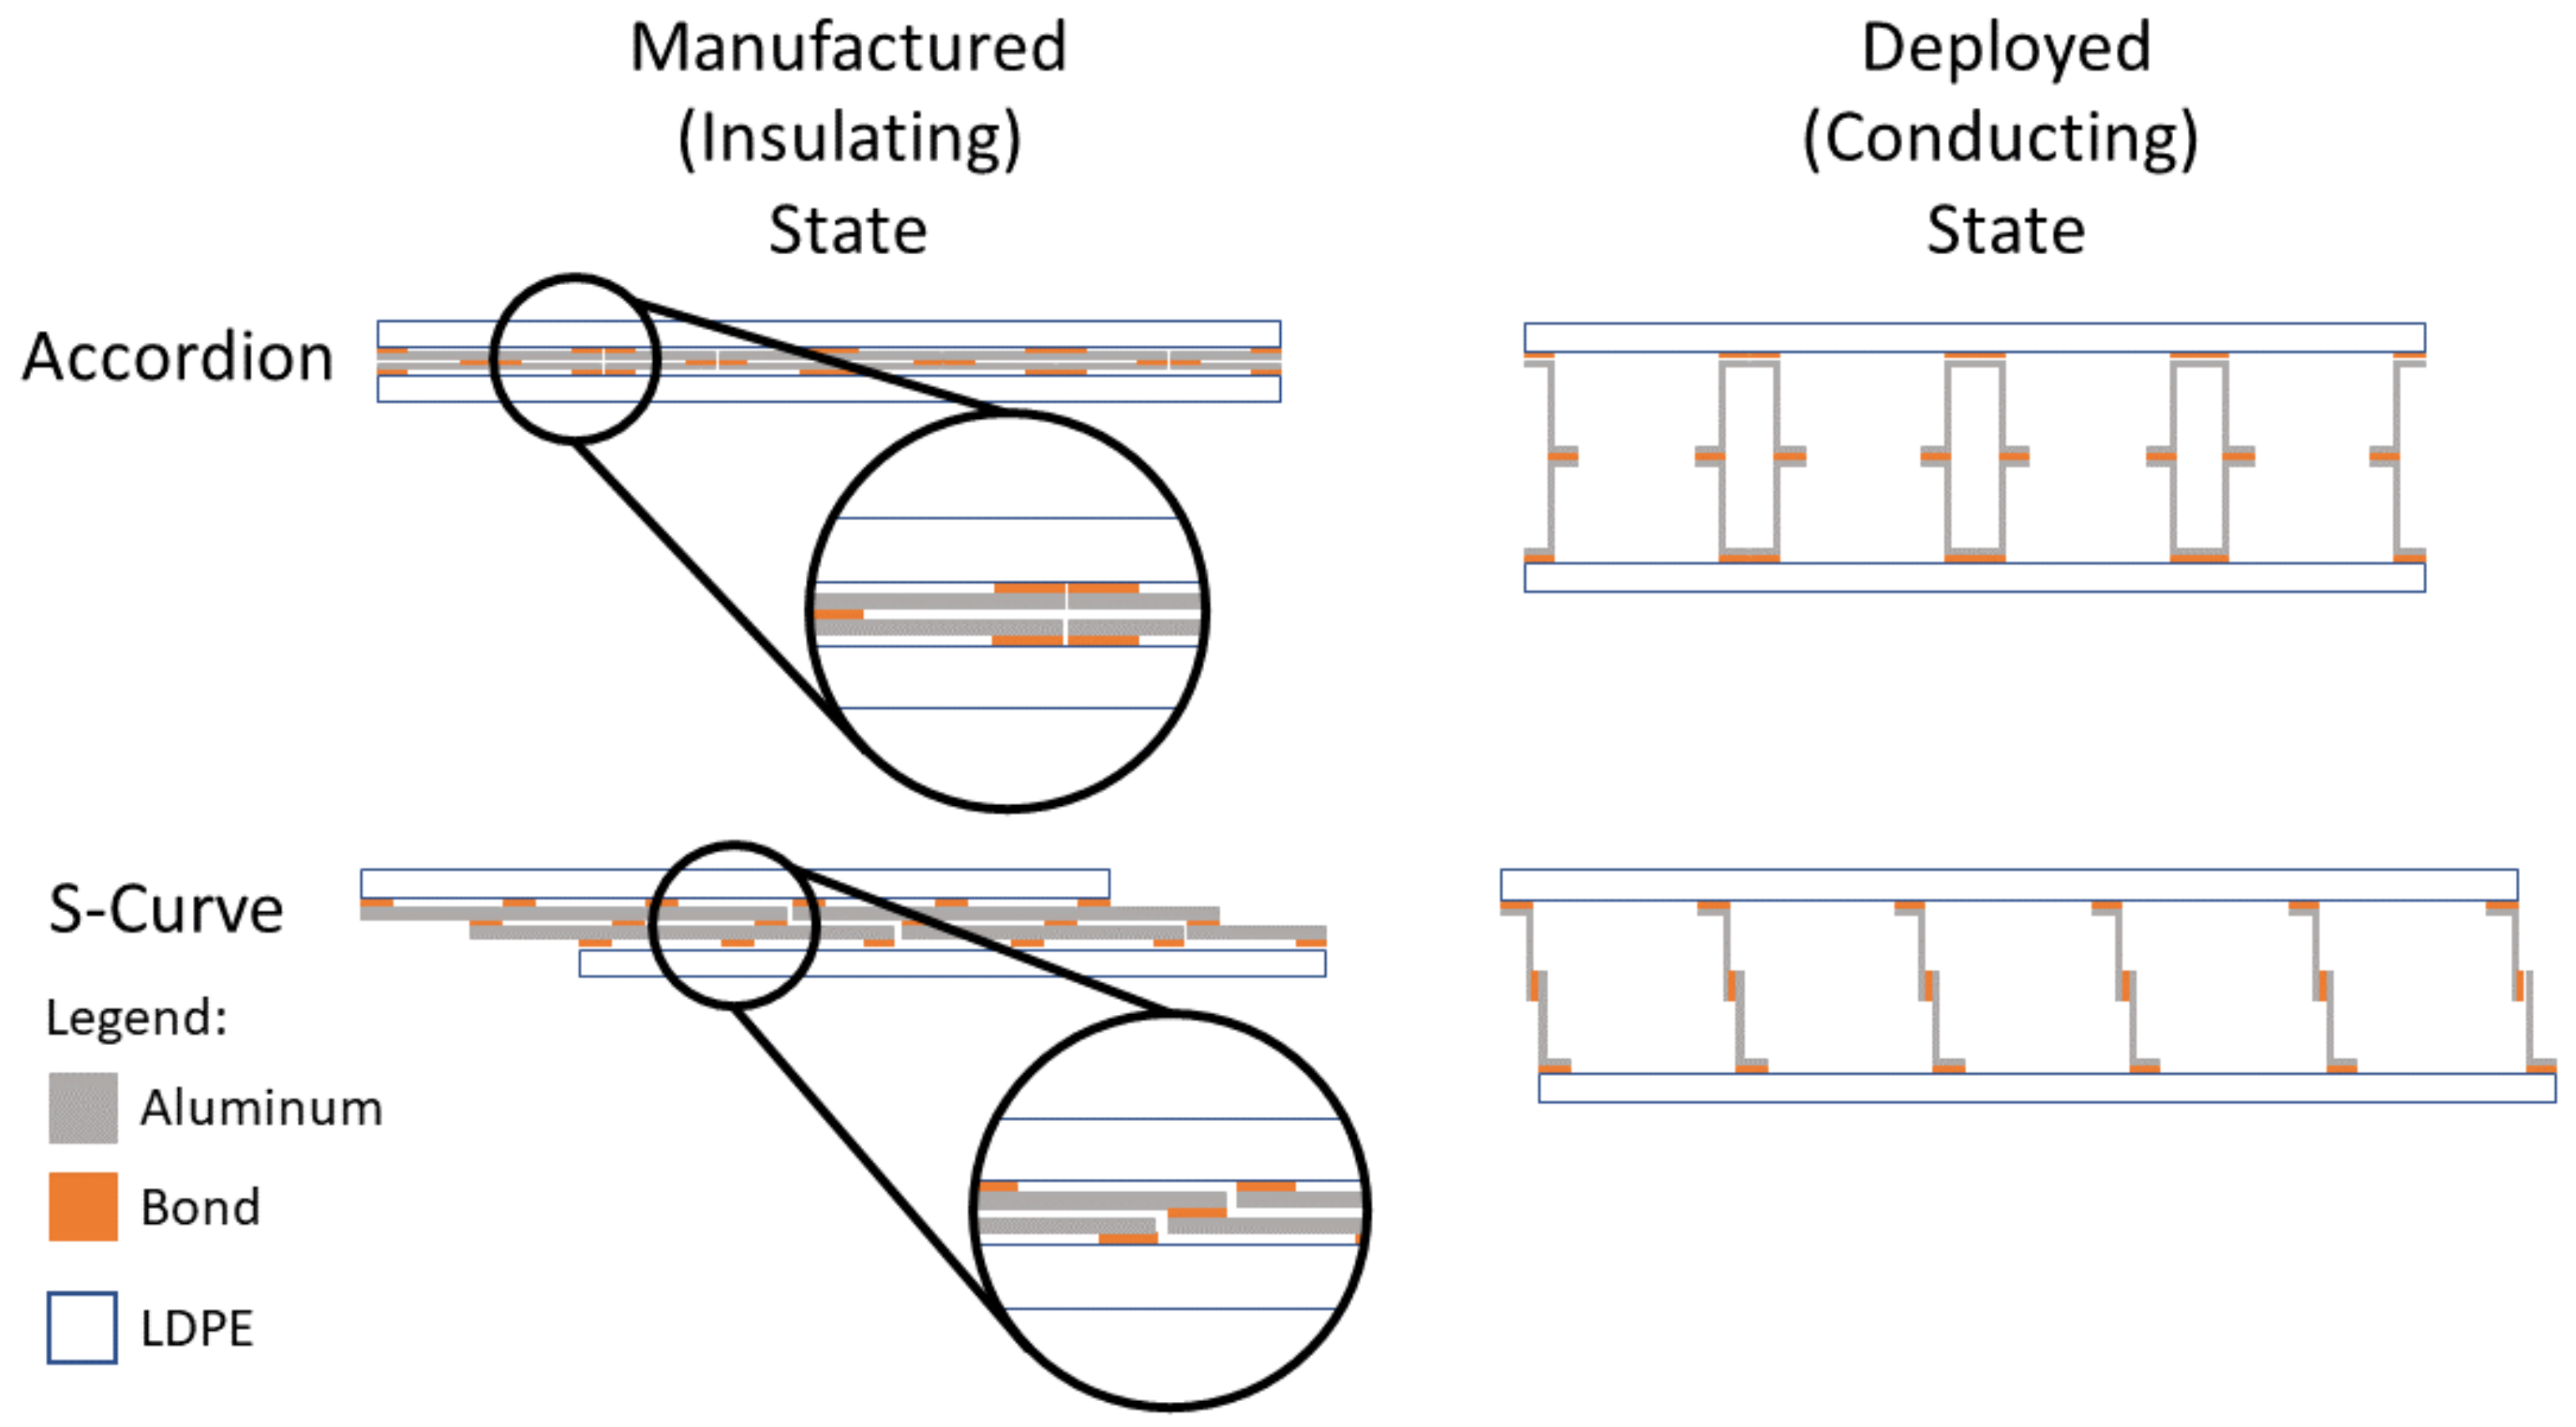
Figure 1. Conceptual designs of the two dynamic radiant barrier designs: Accordion and S-Curve.
Energies 17 03959 g001
Figure 2. Two dynamic radiant barrier designs: Accordion fold and S-Curve. The DRBs in this image are made from polyethylene and metalized polyester.
Energies 17 03959 g002
Figure 3. (a) Manufactured and exploded views of Accordion and S-Curve DRBs. Black represents the LDPE, while blue and teal are used to differentiate the segments formed by cutting each reflective sheet. (b) Dimensions for LDPE and aluminum components, with units in mm.
Energies 17 03959 g003
Figure 4. A conceptual design of the simplified Accordion DRB which uses a single folded reflective sheet instead of multiple bonded sheets.
Energies 17 03959 g004
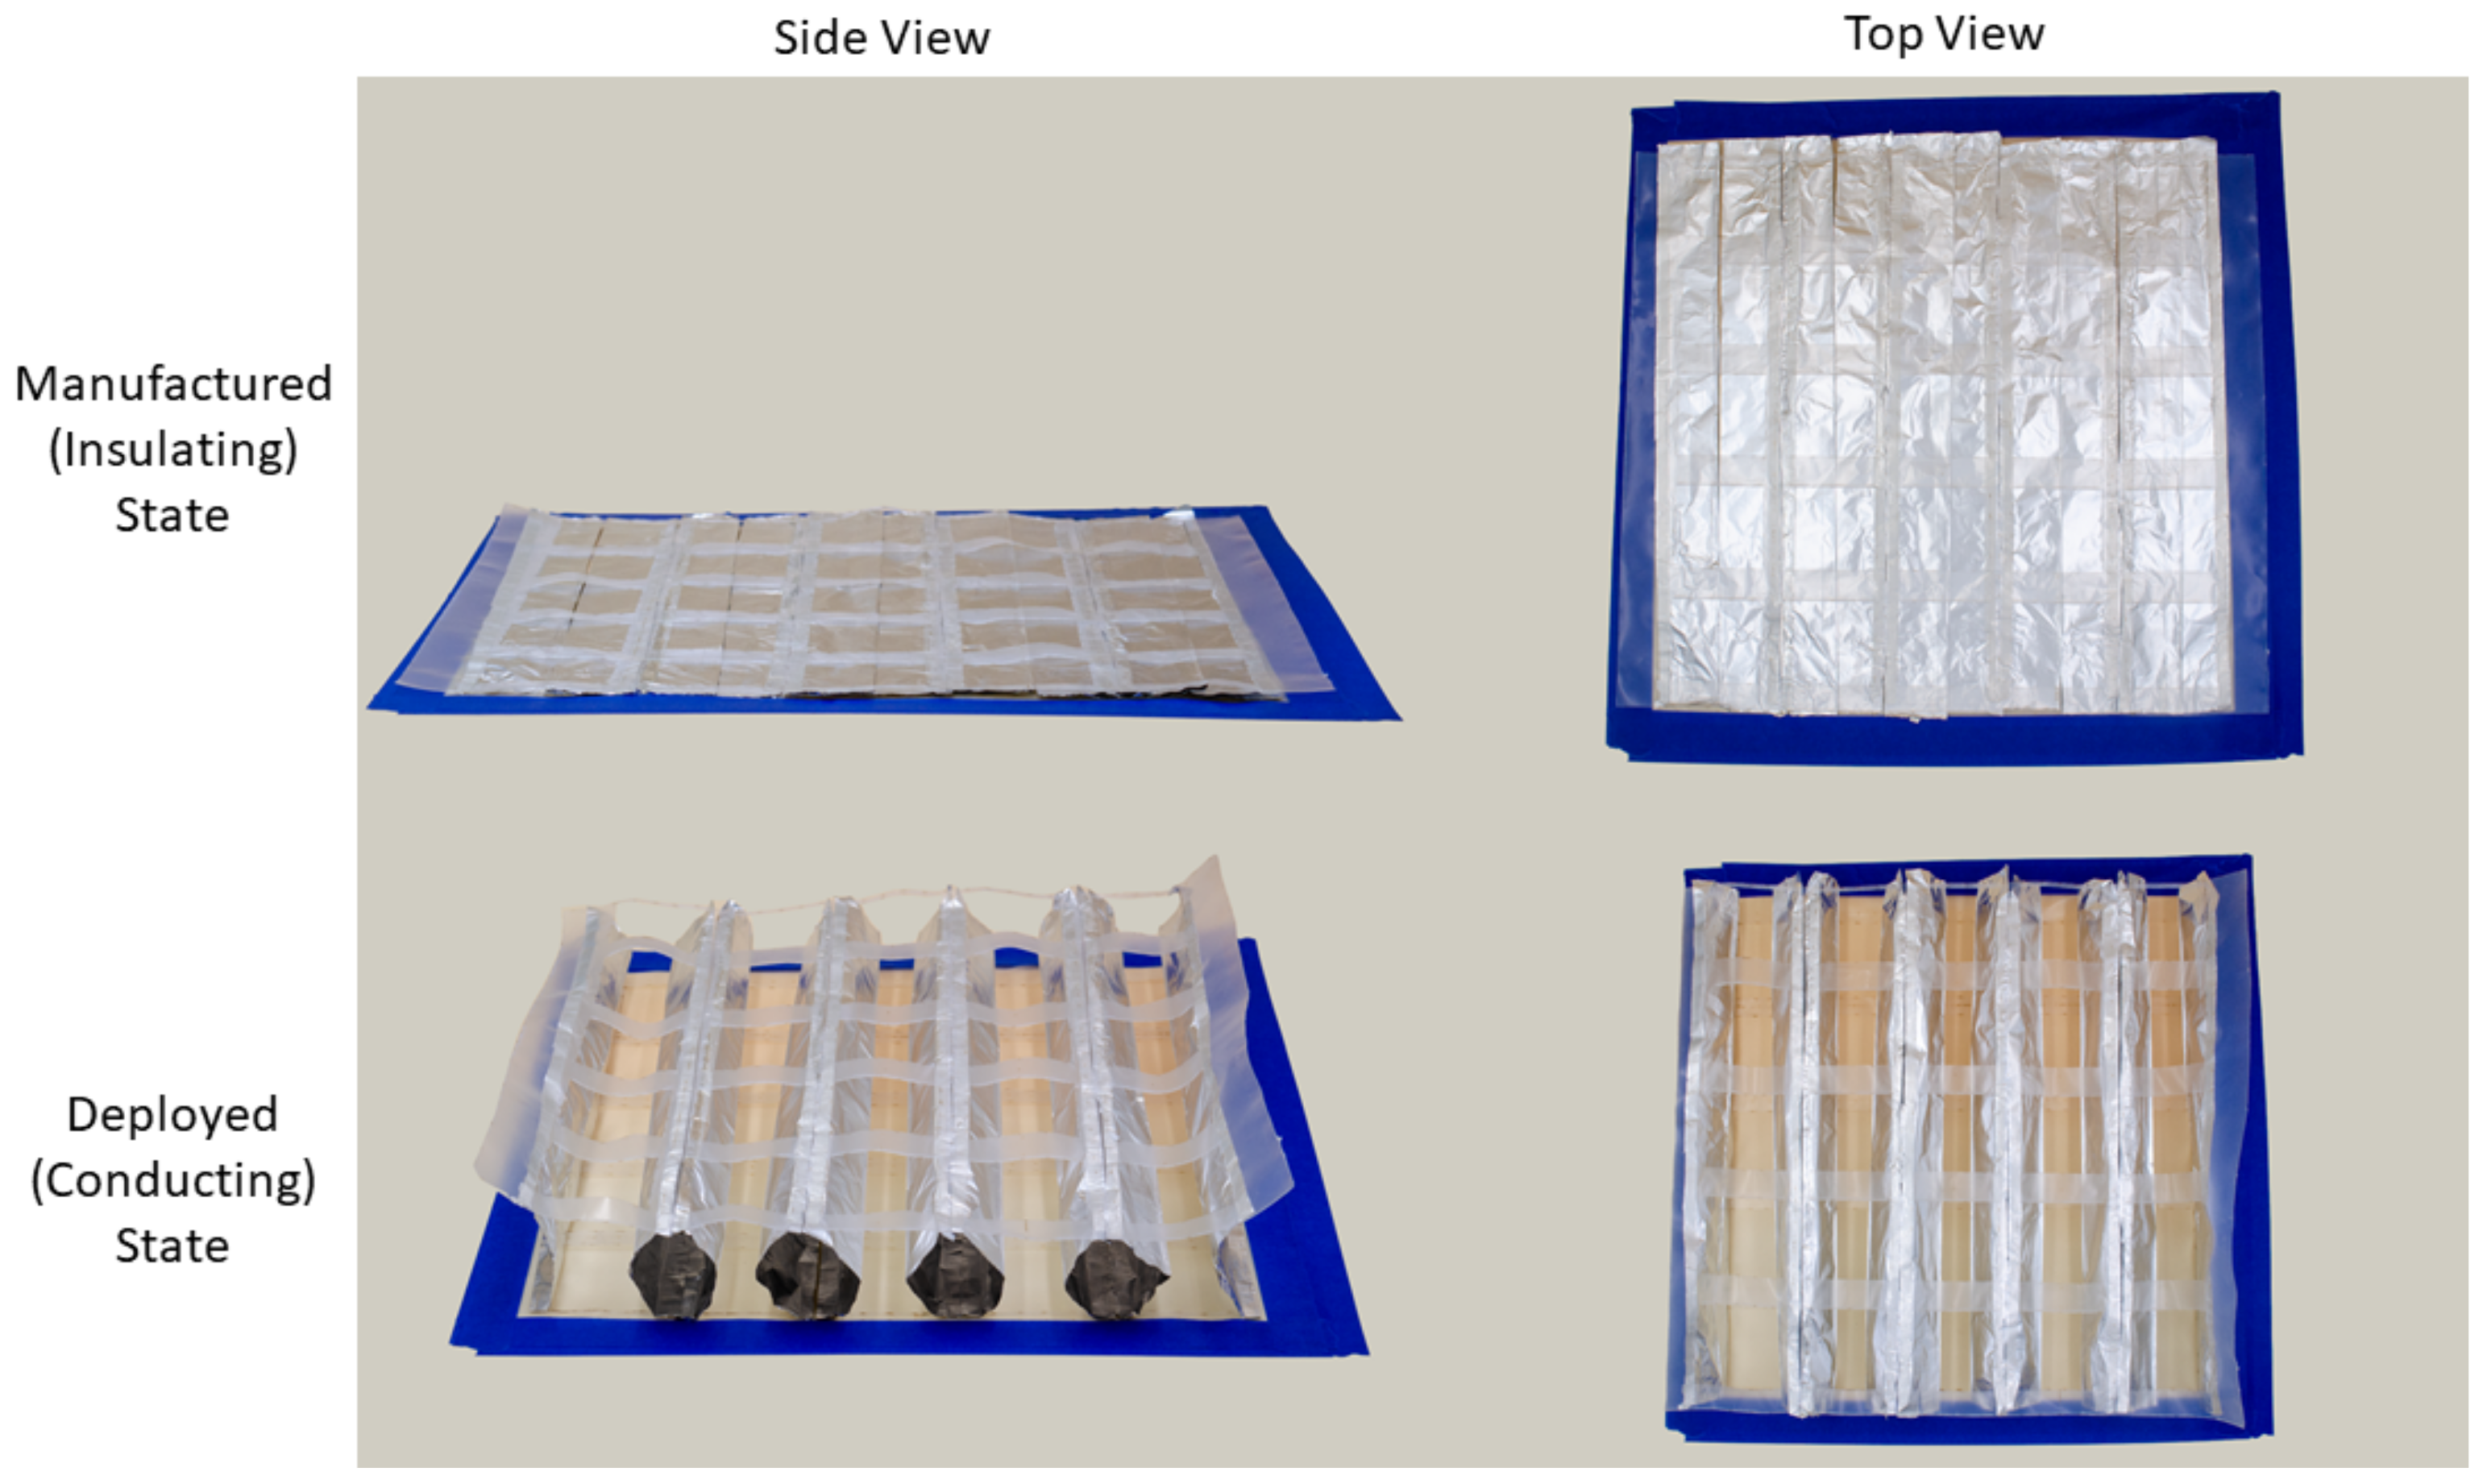
Figure 5. The manufactured, simplified Accordion DRB using LDPE and ten aluminum sheets in the manufactured (insulating) and deployed (conducting) states. Blue tape is used to hold down the DRB.
Energies 17 03959 g005
Figure 6. Isometric view and cross-section of the hotbox used to measure the effective transmissivity of the proposed DRBs. Thermocouples are placed on each side of both particleboard layers to estimate the heat fluxes. The insulation has a reflective layer, and the representation of the insulating DRB is scaled to emphasize its location.
Energies 17 03959 g006
Figure 7. Labeled cross-section of hotbox setup for corresponding dimensions listed in Table 1. Shades of grey indicate the distinct sections of insulation.
Energies 17 03959 g007
Figure 8. Schematic figures of the FEA hotbox and boundary conditions of the system for the 2D simulation.
Energies 17 03959 g008
Figure 9. Averaged temperature distribution across particleboards in the control group (No DRB) during testing.
Energies 17 03959 g009
Figure 10. A comparison of the experimental data, between the control test (without DRB) and the Accordion and S-Curve DRB configurations. Plots represent (a) the heat flux measurements, (b) ratio of heat flux across the lower particleboard, (c) the thermal resistance measurements, and (d) ratios of thermal resistance. Ins and Con refer to the insulating (manufactured) and conducting (deployed) states of the DRB.
Energies 17 03959 g010
Figure 11. Steady–state temperature profiles of the hotbox without DRB.
Energies 17 03959 g011
Figure 12. Heat flux from simulation and experiment through the bottom particleboard (between surfaces 3 and 4).
Energies 17 03959 g012
Table 1. Hotbox dimensions corresponding to Figure 7.
ComponentMaterialDimensions
Length (mm)Width (mm)Thickness (mm)
1Insulation46046025.4
2Insulation91440625.4
3Insulation91440651
4Aluminum Plate4064060.6
5Particleboard40640619
6Pine4063889
7Insulation40625.490
8Insulation40625.4111
Table 2. Material properties in FEA: ϵ is surface emissivity. c p is the heat capacity at constant pressure. k is thermal conductivity. Foam board covered in a layer of aluminum foil.
MaterialProperties
ϵ c p   (J/kg·K) k   (W/m K)
Aluminum0.85 [57]/0.04 [58] *900 [59]237 [60]
LDPE0.92 [61]2300 [62]0.33 [63]
Foam Board-1700 [64]0.87 [47]
Particleboard0.8 [65]1420 [66]0.12 [52]
Pine0.95 [65]2850 [67]0.12 [65]
* The emissivity values are ϵ = 0.85 for the flat-black coating on the aluminum plate and ϵ = 0.04 for the aluminum foil.
Table 3. Average surface temperatures for each physical experiment. Uncertainty accounts for systematic and measured uncertainty.
SimulationTemperature (K) of Surface
1234
No DRB369 ± 0.50 347 ± 0.50 321 ± 0.50 309 ± 0.51
Accordion Insulating358 ± 0.50 346 ± 0.50 303 ± 0.50 298 ± 0.50
Accordion Conducting355 ± 0.50 341 ± 0.50 310 ± 0.50 301 ± 0.50
S-Curve Insulating349 ± 0.50 340 ± 0.50 302 ± 0.50 298 ± 0.50
S-Curve Conducting342 ± 0.50 330 ± 0.50 307 ± 0.50 300 ± 0.50
Table 4. DRB experiment outcomes: thermal resistance (R) and heat flux (q) with subscripts denoting conducting ( c o n ) and insulating ( i n s ) states.
Experiment R con
(m2 K/W)
R ins
(m2 K/W)
R ins / R con q c o n
(W/m2)
q i n s
(W/m2)
q i n s / q c o n
No DRB0.21 ± 0.01 122 ± 6.77
Accordion0.37 ± 0.02 0.84 ± 0.1 2.2382.5 ± 6.73 51.2 ± 6.72 0.62
S-Curve0.36 ± 0.03 0.94 ± 0.14 2.5864.9 ± 6.72 40.4 ± 6.72 0.62
Table 5. Surface temperatures for each FEA experiment using the steady–state temperature from surface 1 from the corresponding experiment. The surface 1 temperature for the DRB insulating simulation uses the recorded steady–state temperature from the corresponding experimental data.
SimulationTemperature (K) of Surface
1234
No DRB369345318307
Accordion Insulating358346304299
Accordion Conducting355338312303
S-Curve Insulating349339302298
S-Curve Conducting342329307301
Table 6. Surface temperatures for each FEA experiment using surface 1’s temperature from the control FEA.
SimulationTemperature (K) of Surface
1234
No DRB369345318307
DRB Insulating369354306300
Accordion Conducting369346316306
S-Curve Conducting369348316306
Disclaimer/Publisher’s Note: The statements, opinions and data contained in all publications are solely those of the individual author(s) and contributor(s) and not of MDPI and/or the editor(s). MDPI and/or the editor(s) disclaim responsibility for any injury to people or property resulting from any ideas, methods, instructions or products referred to in the content.