Article

Improved MTPA and MTPV Optimal Criteria Analysis Based on IPMSM Nonlinear Flux-Linkage Model

by
Yingpeng Fan
1,
Hongtai Ma
2,
Guoqing Zhu
1 and
Jian Luo
1,*
1
Shanghai Key Laboratory of Power Station Automation Technology, School of Mechatronics Engineering and Automation, Shanghai University, Shanghai 200072, China
2
School of Electrical and Data Engineering, University of Technology Sydney, Ultimo, NSW 2007, Australia
*
Author to whom correspondence should be addressed.
Energies 2024, 17(14), 3494; https://doi.org/10.3390/en17143494
Submission received: 12 June 2024 / Revised: 14 July 2024 / Accepted: 15 July 2024 / Published: 16 July 2024
(This article belongs to the Section F: Electrical Engineering)

Abstract

:
The use of interior permanent-magnet synchronous machines (IPMSMs) is prevalent in automotive and vehicle traction applications due to their high efficiency over a wide speed range. Given the high-power-density requirements of automotive IPMSMs, it is imperative to consider the effect of nonlinearities, such as saturation and cross-coupling, on the motor model. The aforementioned nonlinearities render conventional linear motor models incapable of accurately describing the operating characteristics of the IPMSM, including the maximum torque per ampere (MTPA) trajectory, the flux-weakening (FW) trajectory, and the maximum torque per volt (MTPV) trajectory. With respect to the linear motor model, the nonlinear flux-linkage model is gradually receiving attention from researchers. This modeling method represents the nonlinear behavior of the motor through the direct establishment of a bidirectional mapping relationship between flux-linkage and current. It is capable of naturally incorporating the effects of magnetic saturation and cross-coupling factors. However, the analysis of the current trajectory optimal criteria based on this model has not yet been reported. In this paper, the optimal criteria for the MTPA and MTPV current trajectories are analyzed based on the nonlinear flux-linkage model of IPMSMs. Firstly, the nonlinear flux-linkage model of the tested IPMSM is established by the experimental calibration method. The mathematical analytical expressions of the MTPA and MTPV optimal criteria are then analyzed by constructing and solving optimal problems with different objectives. Finally, the current command table applicable to actual motor control is constructed by calculating the current command for different operating conditions according to the optimal criteria proposed in this paper. The validity and feasibility of the optimal criteria proposed in this paper are verified through experimental tests on different operating conditions.

1. Introduction

Transportation is one of the largest emitters of greenhouse gases in the industrial sector [1]. Replacing fuel-efficient vehicles with electric vehicles is a crucial step toward reducing greenhouse gas emissions from transportation. This shift represents a global structural change that will have a significant impact on the environment. The popularity of electric vehicles has led to advancements in motor and control technology, resulting in more efficient and cost-effective solutions. Synchronous reluctance motors (SyRMs) have the advantages of low cost and independence of rare-earth magnets. However, they suffer from problems of torque ripple drop and acoustic noise [2,3]. Compared to induction motors (IMs), permanent-magnet synchronous motors (PMSMs), especially the interior permanent magnet (IPMSM), show advantages in terms of power factor, operating efficiency, speed control stability, and torque density. By utilizing the reluctance torque generated by the asymmetry of the magnetic circuit, the IPMSMs offer a higher torque density and wider constant power speed range, making them more suitable for electric vehicle power performance [4].
Based on the constraints of the inverter voltage and current, the operation of IPMSMs can be classified into two or three regions depending on the motor speed [5]. In order to achieve the output performance of IPMSMs in different speed regions, a well-designed motor structure and appropriate control methods are required. Field-oriented control (FOC), also known as current vector control (CVC), is a motor control method based on currents that can be directly measured. It is widely used in electric vehicle drives due to its high algorithmic maturity and low computational complexity [6,7]. FOC indirectly controls external characteristics, such as the torque and speed of IPMSMs, by manipulating the component of the stator current vector in the rotor field-oriented rotational frame (d-q reference frame). Based on the mathematical model of the motor developed in the d-q reference frame, FOC can visualize the operating characteristics of IPMSMs, inverter voltage-, and current-limiting conditions as a set of equation curves in the d-q current plane [7]. For each load torque requirement, there is an infinite number of current operating points in the d-q current plane that satisfy the load condition. Depending on the motor speed, different control strategies can be used to determine the optimal current operating point that satisfies the current/voltage constraints and operating conditions [8]. At low speeds, the maximum torque of the motor is mainly determined by the current-limiting conditions. An ideal control strategy for this condition is to achieve the maximum output torque per unit of motor current, thus increasing the output torque and reducing motor losses. The control strategy can be referred to as MTPA control. The different current operating points determined by the MTPA control strategy are plotted as the MTPA current trajectory [9]. In the high-speed region, the motor’s maximum torque is determined by both the current- and voltage-limiting conditions. The current operating point determined by the field-weakening (FW) control strategies can weaken the magnetic field of the permanent magnets, thereby reducing the motor’s back electromotive force. This expands the motor’s speed range while maintaining control stability [10]. Subject to voltage limitations, the range of operating points is varied for different speeds of the IPMSM. The maximum torque per volt (MTPV) current trajectory can be plotted by summarizing the current operating points at which the IPMSM can yield the maximum electromagnetic torque at different speed conditions [11].
To determine the current operating point for different speed and torque conditions, it is possible to compute online while the motor is operating [7,12,13,14,15]. Another approach is to store the reference table in the microprocessor. During motor operation, the current reference can then be found by looking up the table (LuT) [16,17,18]. The data in the current reference table can be calculated offline based on the mathematical model of the motor or calibrated experimentally. The calculation of the current operating point, whether through the online calculation or the look-up table method, relies on the mathematical model of the motor. The fidelity of the motor model has an impact on the accuracy of the calculated results of the current reference [19]. Due to the high-power-density requirements of automotive IPMSMs, the effect of nonlinear factors, such as saturation and cross-coupling, on the motor model cannot be neglected [20]. The conventional motor model can no longer adequately characterize the actual operating characteristics of the motor, and the current operating point calculated from this model cannot realize efficient motor operation. Some model-independent methods, such as high-frequency signal injection [21,22,23,24,25,26], search optimization [27,28,29,30], and controller-based feedback control [31,32], have been widely studied for MTPA or FW operation. These methods do not depend on model parameters but require high microprocessor power and long computation times. Furthermore, they control the operating characteristics of IPMSMs only for a certain speed range, which is difficult to extend to the whole speed range. Online computational methods combined with parameter identification can overcome the influence of nonlinear parameters to a certain extent [33,34]. But this type of parameter identification or rectification algorithm generally suffers from high complexity and heavy computational load. In comparison with the above methods, the LuT method requires less microprocessor computing power, has higher stability and faster computation times, and the data in the current reference table cover the entire speed range of the motor. The data in the current reference LuT can be obtained through the experimental calibration method. Traditional motor calibration methods require a significant amount of test time to sweep the IPMSM for speed and current. In comparison to traditional motor calibration methods, model-based calibration (MBC) uses statistical modeling and numerical optimization to optimally calibrate complex nonlinear systems. It has been used in a wide range of applications and is well known for being adopted in internal combustion engine control calibration [35]. When applied to the process of calibration in motor control, MBC has the beneficial effect of reducing the test time and workload. However, this approach still necessitates a priori knowledge about the motor model, particularly in the case of nonlinear conditions. The analysis of IPMSM models and optimal current trajectory criteria, such as MTPA and MTPV, under nonlinear conditions will be beneficial for the development of MBC and LuT-based motor control.
The effect of nonlinear factors, such as saturation and cross-coupling, on motor modeling has been extensively studied in the literature [36,37,38,39,40,41]. As a result of saturation and cross-coupling factors, the d- and q-axis flux-linkages of the IPMSM are not only correlated by the currents in the respective axis directions, but are also affected by the currents in the orthogonal axis directions [36]. This implies that the d- and q-axis flux-linkages behave as nonlinear functions with respect to the d- and q-axis currents. Since the conventional linear motor models, linear MTPA and MTPV criteria, employ constant inductance values, the current trajectories calculated according to these linear criteria usually deviate from the actual optimal current trajectories of the motor, especially in high-power-density automotive IPMSMs. With the introduction of self-inductance and cross-coupled inductance terms and the nonlinear functional relationships between these inductance terms and currents, the modeling fidelity of the motor model is enhanced [36,37]. However, to adequately characterize the nonlinear relationship between the flux-linkage and the current, these modeling methods require the introduction of multiple nonlinear inductance terms, which increases the complexity and usefulness of the model. Considering that the essence of the nonlinear relationship of the motor’s magnetic circuit is the relationship between the flux-linkage and the current, the authors of [20] did not use the inductance term and directly established a nonlinear model based on the winding flux-linkage. This modeling method, by directly establishing a bi-directional mapping between the flux-linkage and the current, can naturally accommodate the effects of saturation and cross-coupling on the motor model without introducing redundant inductive terms. Further research has demonstrated that this modeling method is a straightforward and effective methodology for motor modeling, particularly in the case of automotive IPMSMs, where the effects of nonlinearities need to be taken into account [38,39,40,41]. Based on this modeling method, the authors of [38,39] further considered the effects of space harmonics and iron losses, which improved the applicability. A further implementation of this nonlinear flux-linkage model into hardware-in-the-loop (HIL) is presented in [41]. However, these existing literatures tend to focus on enhancing the fidelity of IPMSM models as much as possible, without delving into the analysis of the optimal criterion for current trajectories. The authors of [42] analyzed the MTPA criterion based on the nonlinear flux-linkage model, but they did not cover FW and MTPV criteria in the high-speed region. Consequently, the analysis of current trajectory optimal criteria based on nonlinear flux-linkage models, particularly in the high-speed region, remains a valuable problem for further investigations.
This paper further analyzes the optimal operating criteria of IPMSMs over the full speed and torque range on the basis of the nonlinear flux-linkage model. The improved optimal criteria for MTPA and MTPV are derived by constructing and solving different optimization problems for the efficient operation of IPMSMs in different speed ranges. This paper is organized as follows: Section 2 provides a review of the conventional IPMSM model in the d-q reference frame, together with MTPA and MTPV formulations in the linear case. In Section 3, the improved MTPA and MTPV optimal criteria based on the nonlinear flux-linkage model are analyzed. Section 4 provides a description of the experimental platform and the series of experimental tests that were carried out during the study. Experiments include flux-linkage model identification, MTPA and MTPV current point calibration, and practical motor control based on the improved nonlinear criteria proposed in this paper. The experimental results show that the improved nonlinear criteria proposed in this paper are more consistent with actual motor measurements, in comparison to the conventional linear current criteria, when saturation and cross-coupling factors are considered. The current reference LuT, determined according to the nonlinear criteria, can effectively implement the actual motor control. Finally, Section 5 concludes this article.

2. Conventional Linear Motor Model and Operating Criteria

The mathematical model of IPMSM describes the relationship between physical quantities, such as motor voltage, flux-linkage, current, and electromagnetic torque, as well as the electrical limits that need to be satisfied in the operation of the motor through mathematical equations. This section reviews the conventional linear motor model and the operating criteria. Table 1 provides detailed specifications for the IPMSM under study.

2.1. Flux, Voltage, and Electromagnetic Torque Equations

In the synchronous rotating reference frame (d-q frame), the flux equation of IPMSM can be described as follows:
  ψ d = L d i d + ψ P M
  ψ q = L q i q
where i d and i q are the stator currents in the d-q frame, ψ d and ψ q represent the stator flux resulting from the combination of the stator current excitation and the permanent-magnet field, ψ P M is the permanent-magnet flux-linkage, while L d and L q are the stator d- and q-axis inductances. In the linear motor model, the values of ψ P M , L d , and L q are considered as constants.
Equations (3) and (4) report the IPMSM voltage equations in the d-q frame:
v d = R s i d + d ψ d d t ω e ψ q
v q = R s i q + d ψ q d t + ω e ψ d
where R s is the stator resistance and ω e is the rotor electrical frequency, while v d and v q are the stator voltages in the d-q frame.
Substituting Equations (1) and (2) into Equations (3) and (4), the voltage equation can be expressed as follows:
v d = R s i d + L d d i d d t ω e L q i q
v q = R s i q + L q d i q d t + ω e L d i d + ψ P M
The electromagnetic torque can be calculated from Equation (7):
T e = 1.5 P n ψ d i q ψ q i d
where P n is the number of pole pairs.
Substituting Equations (1) and (2) into Equation (7), the torque equation can be expressed as:
T e = 1.5 P n ψ P M i q + L d L q i d i q

2.2. Current and Voltage Limits

Achievable operating points of the IPMSM are restrained according to the current and voltage limits. Equations (9) and (10) represent the current and voltage limits, as:
i d 2 + i q 2 = I m a x 2
v d 2 + v q 2 = V m a x 2
where I m a x is the maximum stator current magnitude, and it is determined by the maximum motor current, maximum inverter current, and maximum power supply current. V m a x is the maximum stator voltage magnitude, and it is determined by the DC bus voltage, V D C , and the voltage modulation strategy. In this paper, space vector PWM modulation (SVPWM) was employed, with a 10% voltage margin reserved for the current PI regulator. Thus, the voltage limit can be calculated as: V m a x = 0.9 3 V D C .
Neglecting the voltage drop across the resistance and considering steady-state operation, the voltage limits can be expressed as:
  L d i d + ψ P M 2 V m a x ω e 2 + L q i q 2 V m a x ω e 2 = 1
In the d-q plane, the current limit (9) is depicted as a circle centered at the origin of the coordinates, with I m a x as the radius. The voltage limit (11) is depicted as a set of ellipses with the same center. The major and minor axes of this set of ellipses decrease in inverse proportion to the motor speed, eventually converging at the point I c h , 0 . I c h is the characteristic current and is calculated by Equation (12):
I c h = ψ P M L d

2.3. MTPA and MTPV Criteria Based on the Linear Motor Model

When the motor is operated at low speeds, the achievable operating points are mainly bounded by the current-limit condition. For a given torque command, the minimum stator current can be achieved at the operating point determined by the MTPA operating criteria. In the linear motor model, the equation for the MTPA operation criteria is as below:
i d = ψ P M 2 L d L q ψ P M 2 4 L d L q 2 + i q 2
When the motor operates at high speed, the achievable operating points are majorly bounded by the voltage limit, and the operating point determined by the MTPV operating criteria can realize the maximum torque output under the voltage limit condition. In the linear motor model, the criteria for MTPV operation are as below:
i d = ψ P M L d + L d ψ P M + L q ψ P M 2 + 4 L q 2 i q 2 L d L q 2 2 L d L d L q

3. Improved MTPA and MTPV Criteria Based on Nonlinear Flux-Linkage Model

Due to the high-power-density requirements of automotive IPMSMs, the effect of saturation and cross-coupling on the motor model cannot be neglected. As previously stated in Section 1, the linear motor model does not account for saturation and cross-coupling effects, which can result in discrepancies between the calculated and actual current trajectories of the motor. The nonlinear flux-linkage model proposed in [20] is a practical and effective modeling method, which is especially suitable for automotive IPMSMs that need to take saturation and cross-coupling factors into account. This modeling method employs a bi-directional mapping between the flux-linkage and current, which enables the natural incorporation of the effects of saturation and cross-coupling on the motor model. However, operational criteria based on this model are less discussed. This section presents the development of the nonlinear flux-linkage model of the IPMSM, followed by a detailed analysis of the MTPA and MTPV optimal criteria based on the nonlinear flux-linkage model.

3.1. Nonlinear Flux-Linkage Model

In the nonlinear flux-linkage model, the equations for flux, voltage, and torque are as follows:
ψ d = f i d , i q
ψ q = g i d , i q
v d = R s i d + d ψ d d t ω e ψ q
v q = R s i q + d ψ q d t + ω e ψ d
T e = 1.5 P n ψ d i q ψ q i d
where d- and q-axis flux-linkages, ψ d and ψ q , respectively, are the fucntions of d- and q-axis currents i d and i q . Therefore, the effects of saturation and cross-coupling are inherently considered in the flux-linkage functions f i d , i q and g i d , i q above.
The data of the flux-linkage functions can be obtained through FEA calculation or experimental bench tests. The FEA method is straightforward, but it requires information about the machine, such as geometry and material. Obtaining this information can be challenging, and the results of the FEA method may not fully represent the actual data due to factors such as manufacturing errors. Although the experimental test method requires more test time, this method is more practical, as it does not require additional information about the motor structure.
It is important to note that temperature can have a significant impact on the electromagnetic relationships of the IPMSM. The d- and q-axis flux-linkages, in addition to being current dependent, also behave as a function of motor temperature [37,41]. However, this paper was solely concerned with the study of magnetic saturation and cross-coupling factors. Therefore, it was essential to ensure that the experimental identification of the flux-linkage model and the experimental testing of the motor control were conducted at the same temperature as closely as possible in order to eliminate the impact of temperature on the electromagnetic relationship of the IPMSM. In order to standardize the experimental conditions, the motor was cooled by a programmable external water-cooling system. This was carried out to ensure that all tests were performed at the same temperature, thus eliminating the influence of the temperature factor.
The d- and q-axis flux-linkage data identified by experimental test methods are shown in Figure 1. The principles and procedures of the experimental test methods are described in detail in Section 4.2.
The nonlinear functional relationship between the flux-linkage and current can be described by a generalized polynomial fitting model, with the following expression:
ψ d = f i d , i q = m = 0 P n = 0 m a m n n i d m n i q n
ψ q = g i d , i q = m = 0 P n = 0 m b m n n i q m n i d n
where P is a given polynomial degree, and the symbols a ( ) ( ) and b ( ) ( ) are coefficients with sub-indexes indicating the power of i d and i q , respectively.
The fidelity of the flux-linkage fitting model increases with the degree of polynomial order, but the more complex the expression of the model becomes. The coefficients a ( ) ( ) and b ( ) ( ) in the model can be obtained using the fitting technique, such as least squares fitting or other methods.

3.2. Analysis of Improved MTPA Criteria Based on the Nonlinear Flux-Linkage Model

The MTPA criteria are used to determine the current operating point at which the maximum output torque per unit current is realized. Thus, the analysis of the MTPA criteria can be implemented in solving the following optimization problem:
m i n i d ,   i q f i = i s 2 = i d 2 + i q 2 s . t . T r e f 1.5 P n ψ d i q ψ q i d = 0 i d 2 + i q 2 I m a x 2
where f i is the objective function to be minimized and T r e f is the reference torque.
A closed-form solution can be achieved by solving the above problem by means of the Lagrange multiplier method, and the Lagrange function of (23) is expressed as:
F i i d , i q , α = i d 2 + i q 2 + α T r e f 1.5 P n ψ d i q ψ q i d
where α is the Lagrange multiplier. Calculating the partial derivatives of F i with respect to i d , i q , and α and setting them to zero yields the following system of equations:
F i i d = 2 i d 1.5 P n α ψ d i d i q ψ q ψ q i d i d = 0 F i i q = 2 i q 1.5 P n α ψ d i d i q + ψ d ψ q i q i d = 0 F i α = T r e f 1.5 P n ψ d i q ψ q i d = 0
By eliminating the Lagrange multiplier α from the first two equations in (24), the improved MTPA criteria can be obtained, as expressed in (25):
  ψ d i q + ψ q i d i d i q + ψ d i d + ψ q i q ψ q i q i d 2 + ψ q i d i q 2 = 0
Equation (25) is the improved MTPA criteria based on the nonlinear flux-linkage model. By substituting the flux-linkage fitting models (20) and (21) into the above criteria, the improved nonlinear MTPA trajectory in the d- and q-axis current plane can be derived.
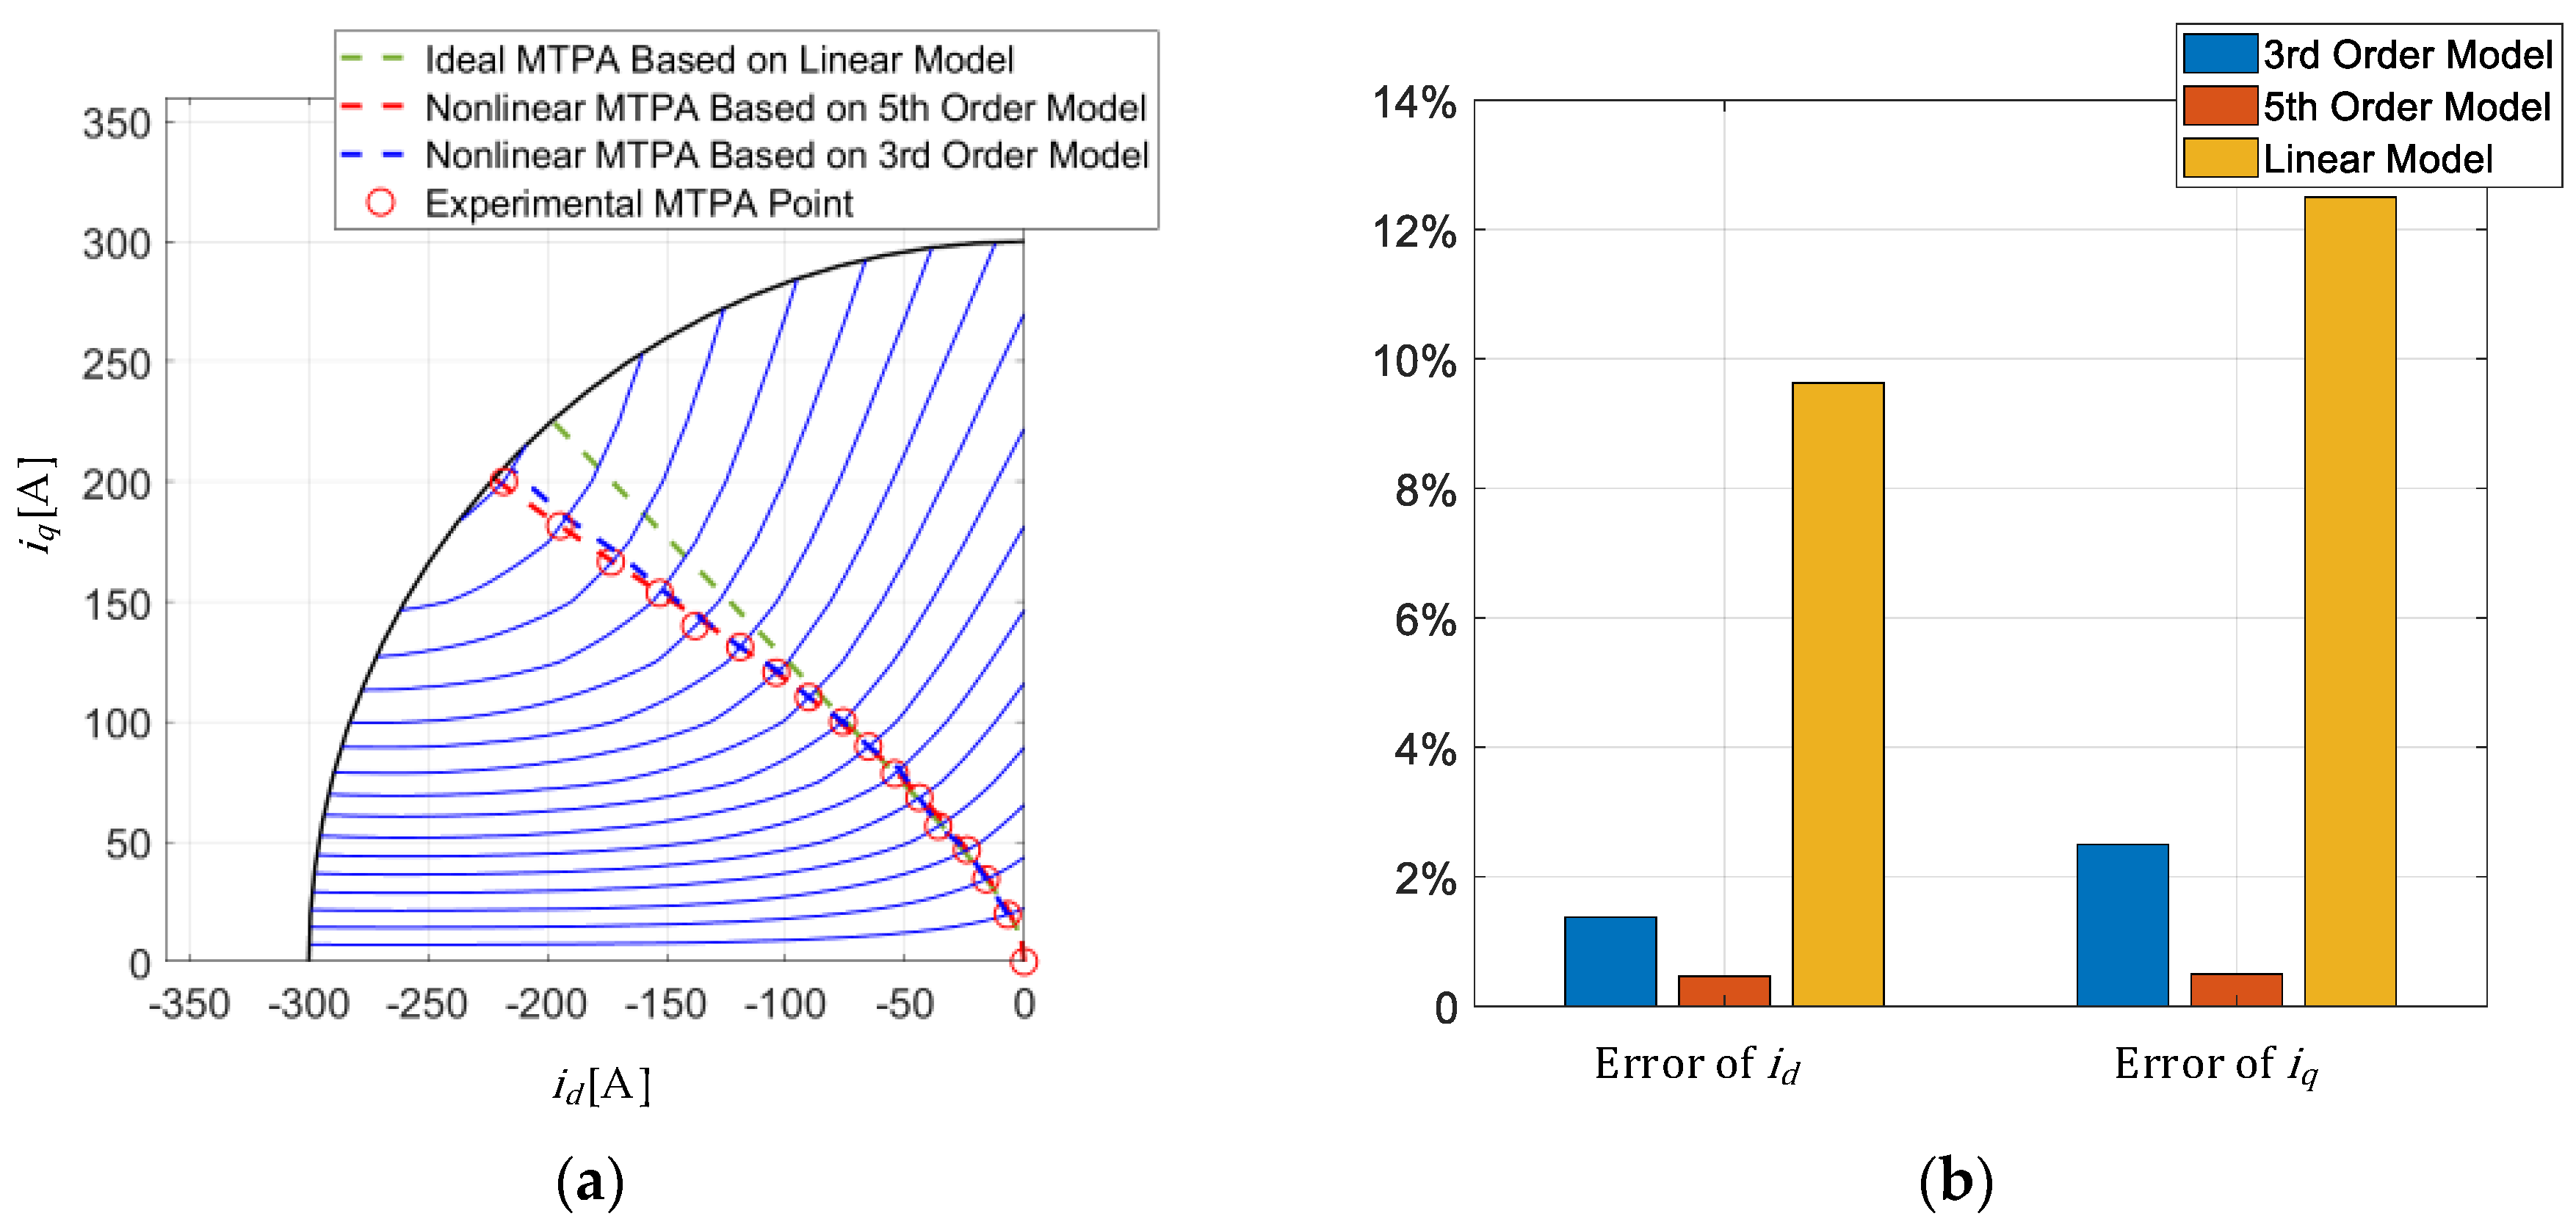
Figure 2a shows the MTPA trajectory of the conventional and improved nonlinear criteria in comparison to the experimental results. The conventional MTPA trajectory in Figure 2a is derived based on Equation (13), in which L d and L q are determined at the no-load condition. The experimental MTPA trajectory in Figure 2a is determined by the manually searching method. The details of the manually searching method are provided in Section 4.3. To compare the effect of different orders of the polynomial fitting model on the current trajectory, Figure 2a shows the results of current trajectory based on the third-order polynomial fitting model and the fifth-order polynomial fitting model, respectively.
Figure 2a illustrates that both the linear and nonlinear MTPA trajectories coincided with the experimental MTPA points for a limited range of stator current amplitudes. As the amplitude of the stator current increased, the linear MTPA trajectory tended to deviate from the experimental MTPA point, whereas the nonlinear MTPA trajectory remained consistent with the experimental MTPA point. Figure 2b shows the errors in d- and q-axis currents for the linear MTPA current trajectory and nonlinear MTPA current trajectory for current-limit conditions. Errors in the d- and q-axis currents corresponding to linear and experimental MTPA points under current-limit conditions were of a significant magnitude, reaching 9.6% and 12.5%, respectively. The current errors of the nonlinear MTPA current points in the d- and q-axis were less than 3%, regardless of whether the third-order polynomial fitting model or the fifth-order polynomial fitting model was employed. Considering the current fluctuations inherent in FOC, a third-order polynomial fitting model was sufficient to achieve good MTPA control results, while the fitting model structure was relatively simple.

3.3. Analysis of Improved MTPV Criteria Based on the Nonlinear Flux-Linkage Model

In the high-speed region, the resistive voltage drop was negligible compared to the motor back electromotive force. When considering steady-state operation, Equations (17) and (18) can be simplified to Equations (26) and (27), respectively. The relationship between stator voltage and stator flux-linkage can be expressed by Equation (28):
v d = ω e ψ q
v q = ω e ψ d
v s = ω e ψ s
where v s is the stator voltage, and it can be calculated as: v s = v d 2 + v q 2 , while ψ s is the stator flux-linkage, and it can be calculated as: ψ s = ψ d 2 + ψ q 2 .
Equations (26)–(28) show that when the resistive voltage drop was neglected and steady-state operation was considered, there was a direct relationship between the stator voltage and the stator flux-linkage. The analysis of the MTPV criteria can be transformed into the following stator flux-linkage optimization problem:
m i n i d , i q f v = ψ d 2 + ψ q 2 s . t . T r e f 1.5 P n ψ d i q ψ q i d = 0 ψ d 2 + ψ q 2 V m a x ω e 2
where f v is the objective function to be minimized in the analysis of improved MTPV criteria, and T r e f is the reference torque in this analysis.
The Lagrange multiplier method was used to obtain a closed-form solution to the above problem. The Lagrange function is constructed as shown in Equation (30):
F v i d , i q , β = ψ d 2 i d , i q + ψ q 2 i d , i q + β T r e f 1.5 P n ψ d i q ψ q i d
where β is the Lagrange multiplier. Calculating the partial derivatives of F v with respect to i d , i q , and β and setting them to zero yielded the following system of equations:
F v i d = 2 ψ d ψ d i d + 2 ψ q ψ q i d + β 1.5 P n ψ d i d i q ψ q i d i d ψ q = 0 F v i d = 2 ψ d i d , i q ψ d i q + 2 ψ q ψ q i q + β 1.5 P n ψ d i q i q ψ q i q i d + ψ d = 0 F v β = T r e f 1.5 P n ψ d i q ψ q i d = 0
By eliminating the Lagrange multiplier, β , from the first two equations in (31), the improved MTPV criteria can be obtained, as expressed in (32):
ψ q ψ d ψ d i q + ψ q ψ q i q ψ d i d ψ d i d + ψ q i q ψ q i q ψ d 2 + ψ q i d ψ d i d + ψ q i q ψ d i q + ψ d ψ q = 0
Equation (32) is the improved MTPV criteria based on the nonlinear flux-linkage model. By substituting the flux-linkage fitting models (20) and (21) into the above criteria equation, the improved MTPV trajectory in the d- and q-axis current plane can be derived.
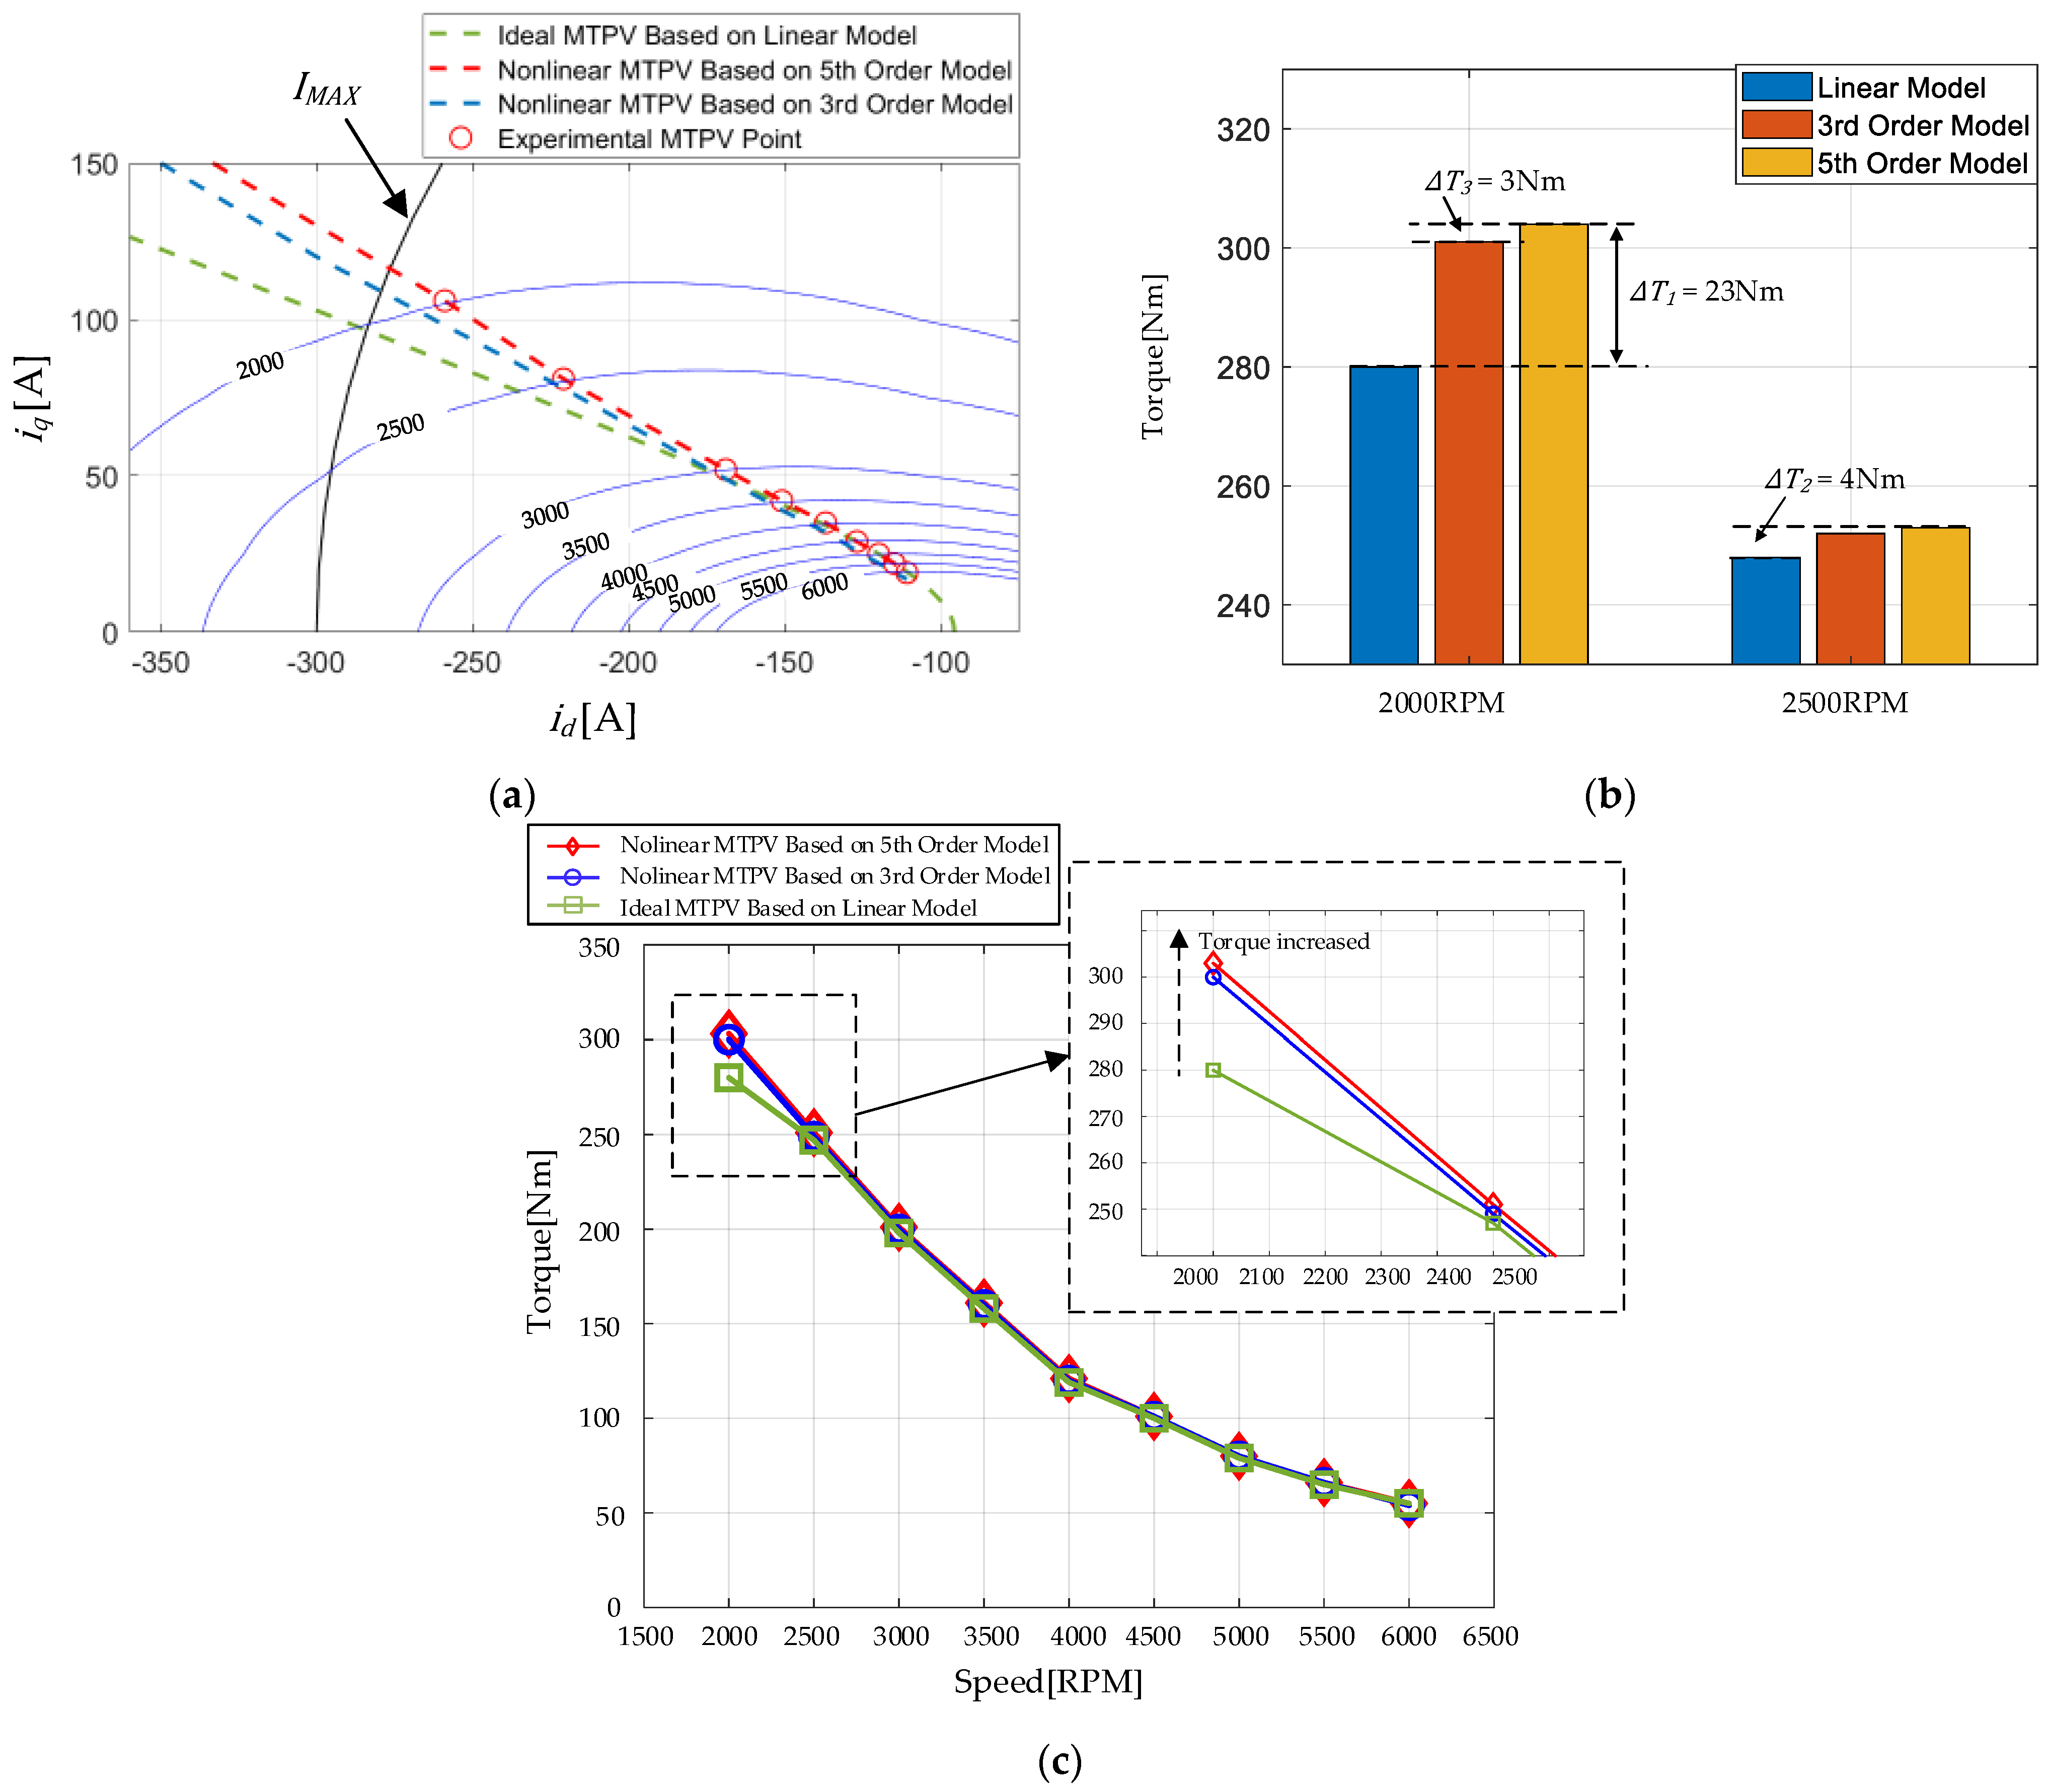
Figure 3a shows the MTPV trajectory of the linear and improved criteria in comparison to the experimental results. The methods used to determine the MTPV points through experimental testing are detailed in Section 4.3. To compare the effect of different orders of the polynomial fitting model on the current trajectory, Figure 3a shows the results of current trajectory based on the third-order model and the fifth-order model, respectively.
As shown in Figure 3a, the differences between the linear MTPV trajectory and the nonlinear MTPV trajectory were relatively small when the speed was close to the maximum speed of the motor, and both were consistent with the experimental MTPV points. This is because in the high-speed region, the amplitude of the stator current was relatively small due to the constraint of the voltage limit. Therefore, the magnetic saturation phenomenon was relatively insignificant. However, when the motor speed was relatively low, the difference between the linear MTPV trajectory and the nonlinear MTPV trajectory increased, and the linear MTPV trajectory deviated from the experimental MTPV points. Figure 3b shows the motor torque of the current operating points determined for different MTPV criteria at 2000 RPM and 2500 RPM. The torque difference, T 1 , between the nonlinear MTPV criteria and the linear MTPV criteria was 23 Nm at 2000 RPM, and this torque difference decreased with increasing motor speed.
Figure 3c shows the torque-speed characteristics determined according to different MTPV criteria. From the figure, it can be seen that in the 2000 RPM to 2500 RPM speed range, the nonlinear criteria can improve the output torque of the motor, in comparison to the conventional linear MTPV criteria, which means that the output power of the motor was increased. Although, the improved nonlinear MTPV criteria may not significantly improve the motor operating efficiency when the motor speed is close to the maximum speed. However, from the point of view of the whole speed expansion range, the improvement in the motor power in some speed regions was also meaningful for the overall operating efficiency of the motor. In addition, the MTPV current trajectory of the IPMSM under test in this research was in the region of relatively low current, which implies that the effects of saturation and cross-coupling factors were not significant. For other higher-power IPMSMs, the practicality of nonlinear MTPV criteria could be more apparent if the MTPV trajectory was in a higher-current region, where the effects of saturation and cross-coupling factors are more significant.
In the nonlinear MTPV criteria analysis, the torque difference can be used as the primary criteria for selecting different fitted model orders. A small difference in torque was observed between polynomial-fitted models of different orders. As illustrated in Figure 3b, the torque difference, T 3 , between the third-order fitted model and the fifth-order fitted model was minimal, with a difference of only 3 Nm at the motor speed of 2000 RPM. For an output torque of 300 Nm, this torque difference can be considered negligible. Furthermore, as the motor speed increased, the torque difference decreased. Considering the unavoidable torque ripples during FOC, a third-order polynomial fitting model was sufficient to achieve good MTPV control results, while the fitting model structure was relatively simple.
The current reference LuT, corresponding to the different torque commands, can be calculated for the whole speed range based on the improved MTPA criteria (25) and MTPV criteria (32) proposed in this paper, as well as the torque Equation (19), the current-limit Equation (9), and the voltage-limit Equation (11). The workflow and calculation algorithm for the current reference LuT were performed according to [15]. Figure 4 shows the results of the calculation. As can be seen in the figure, the current reference covered the whole speed and torque region, and the transition between the MTPA, FW, and MTPV regions was smooth.

4. Experiments

This section introduces the experimental platform, details the principles and procedures of the experimental method used to identify the nonlinear flux-linkage model and the current trajectory of the IPMSM, as well as provides experimental validation of the improved MTPA and MTPV criteria proposed in this paper.

4.1. Experiment Platform

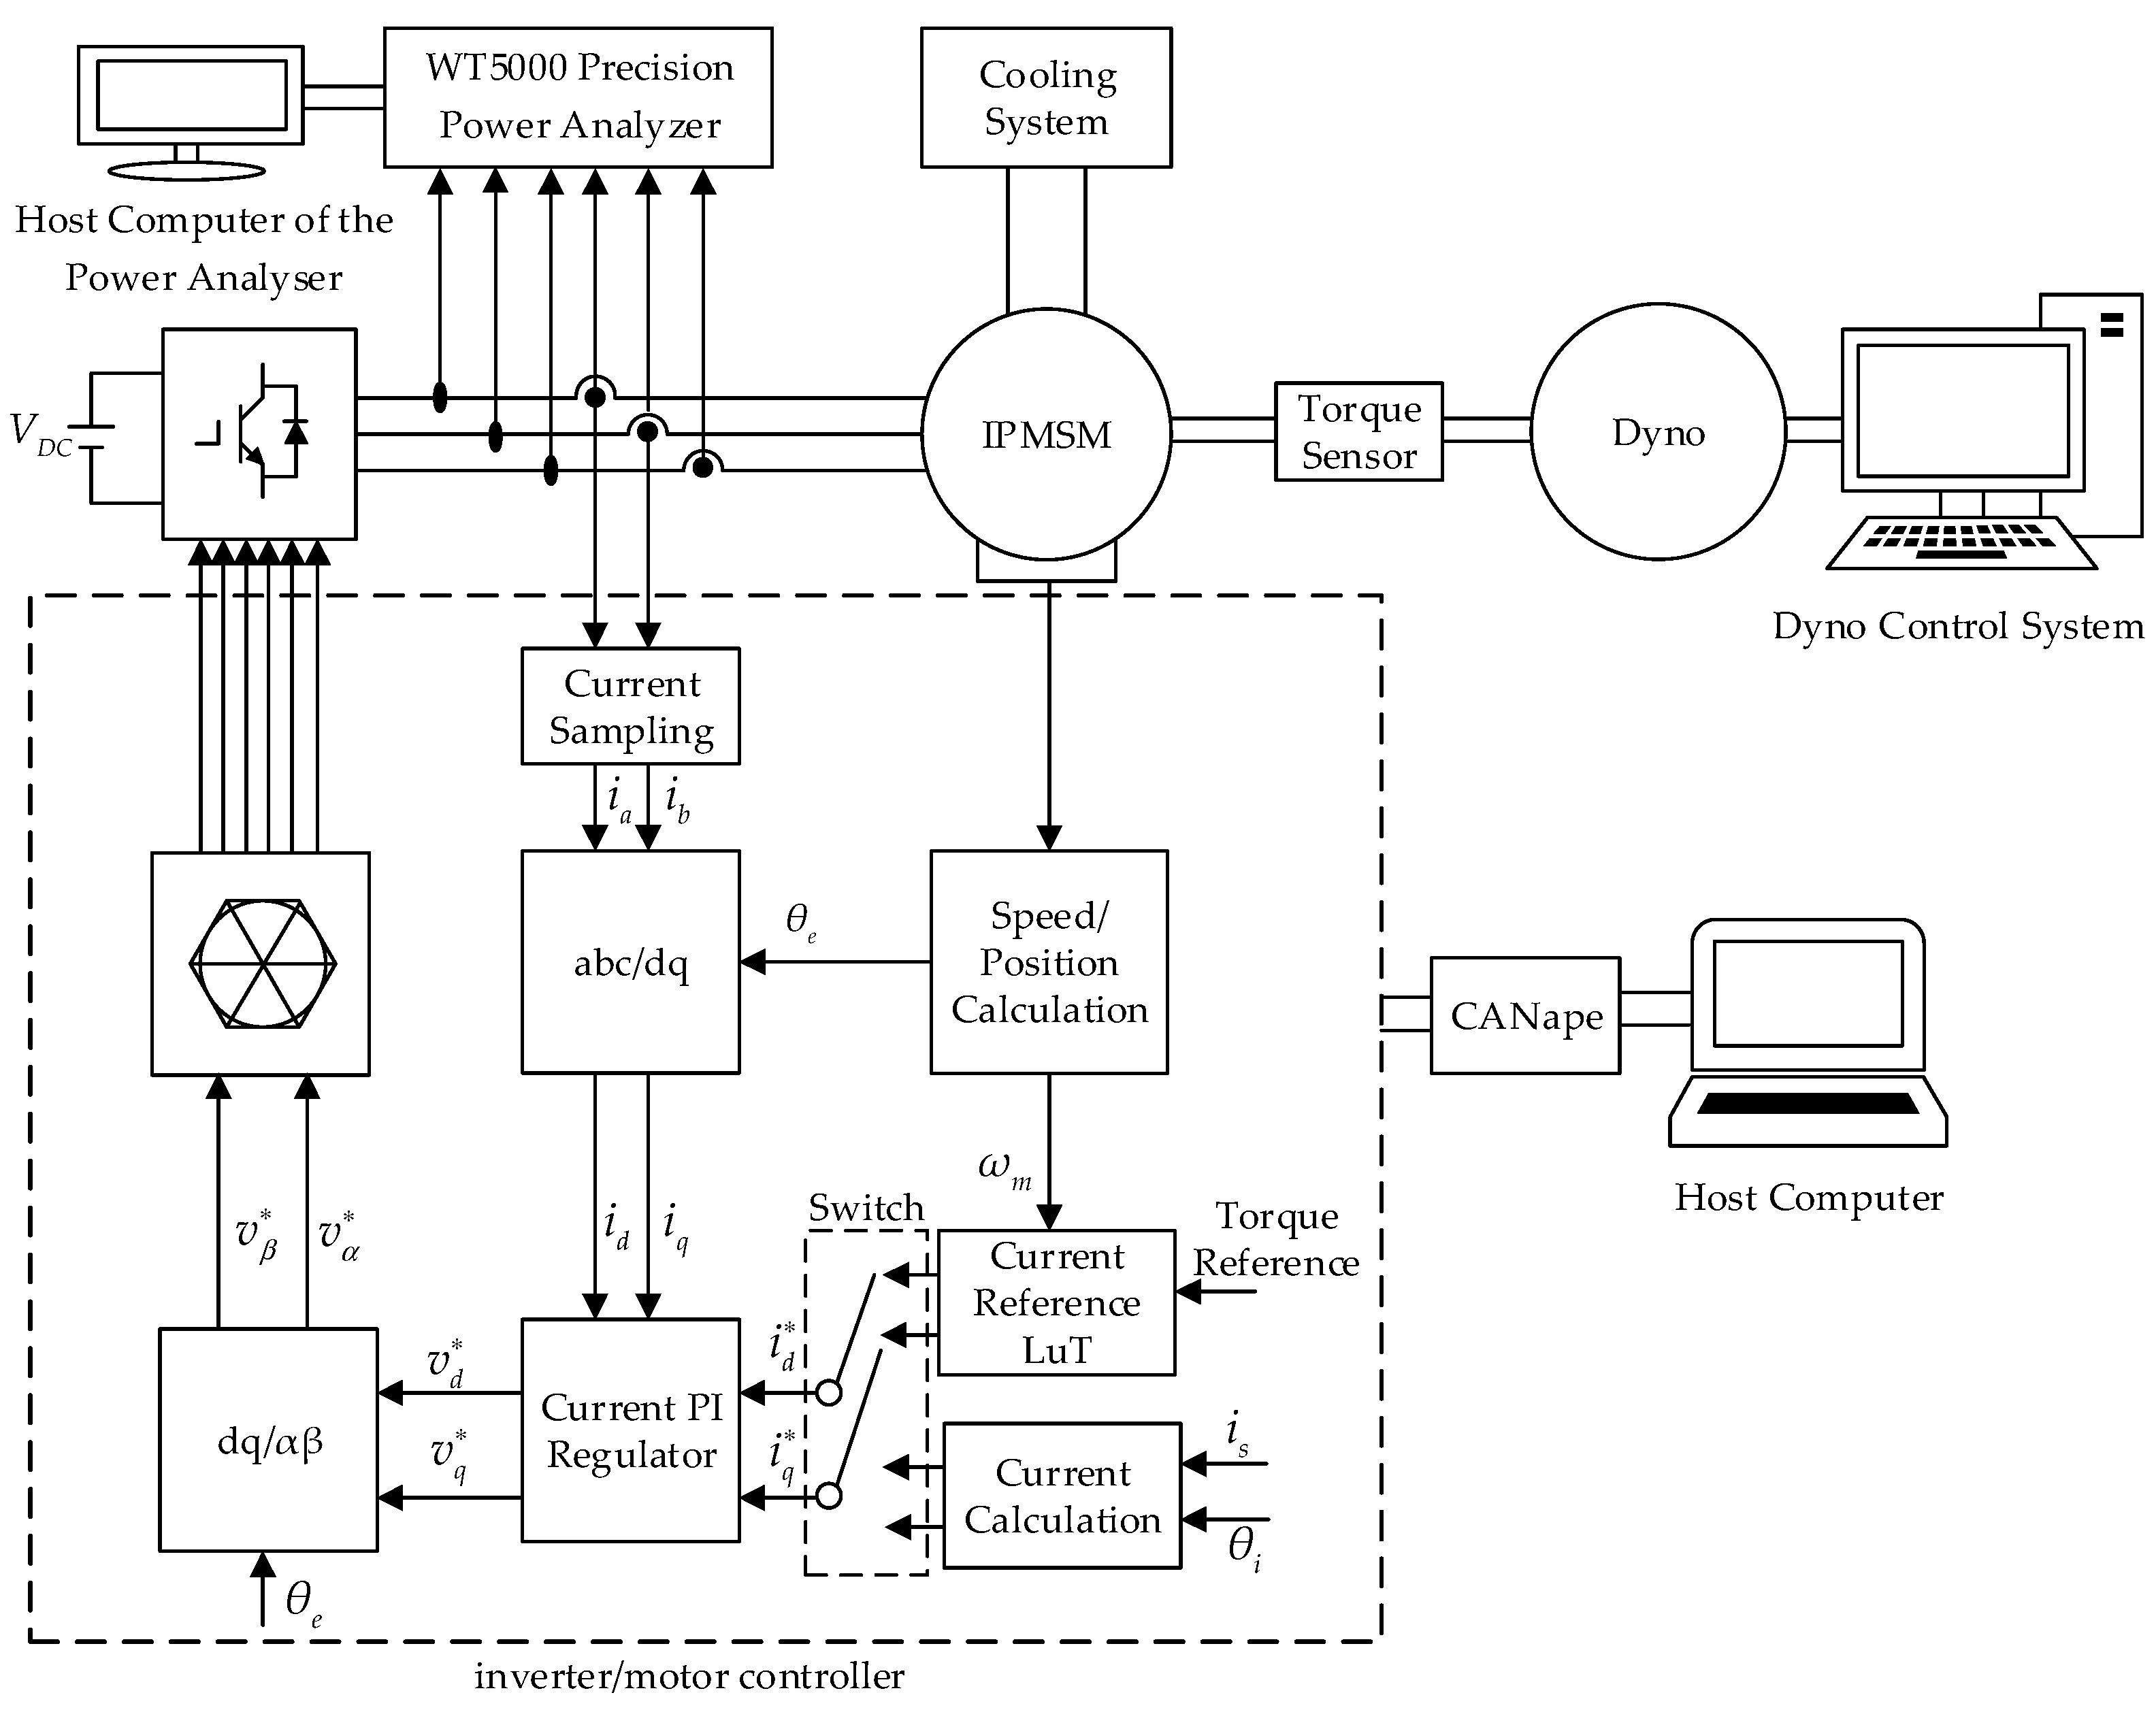
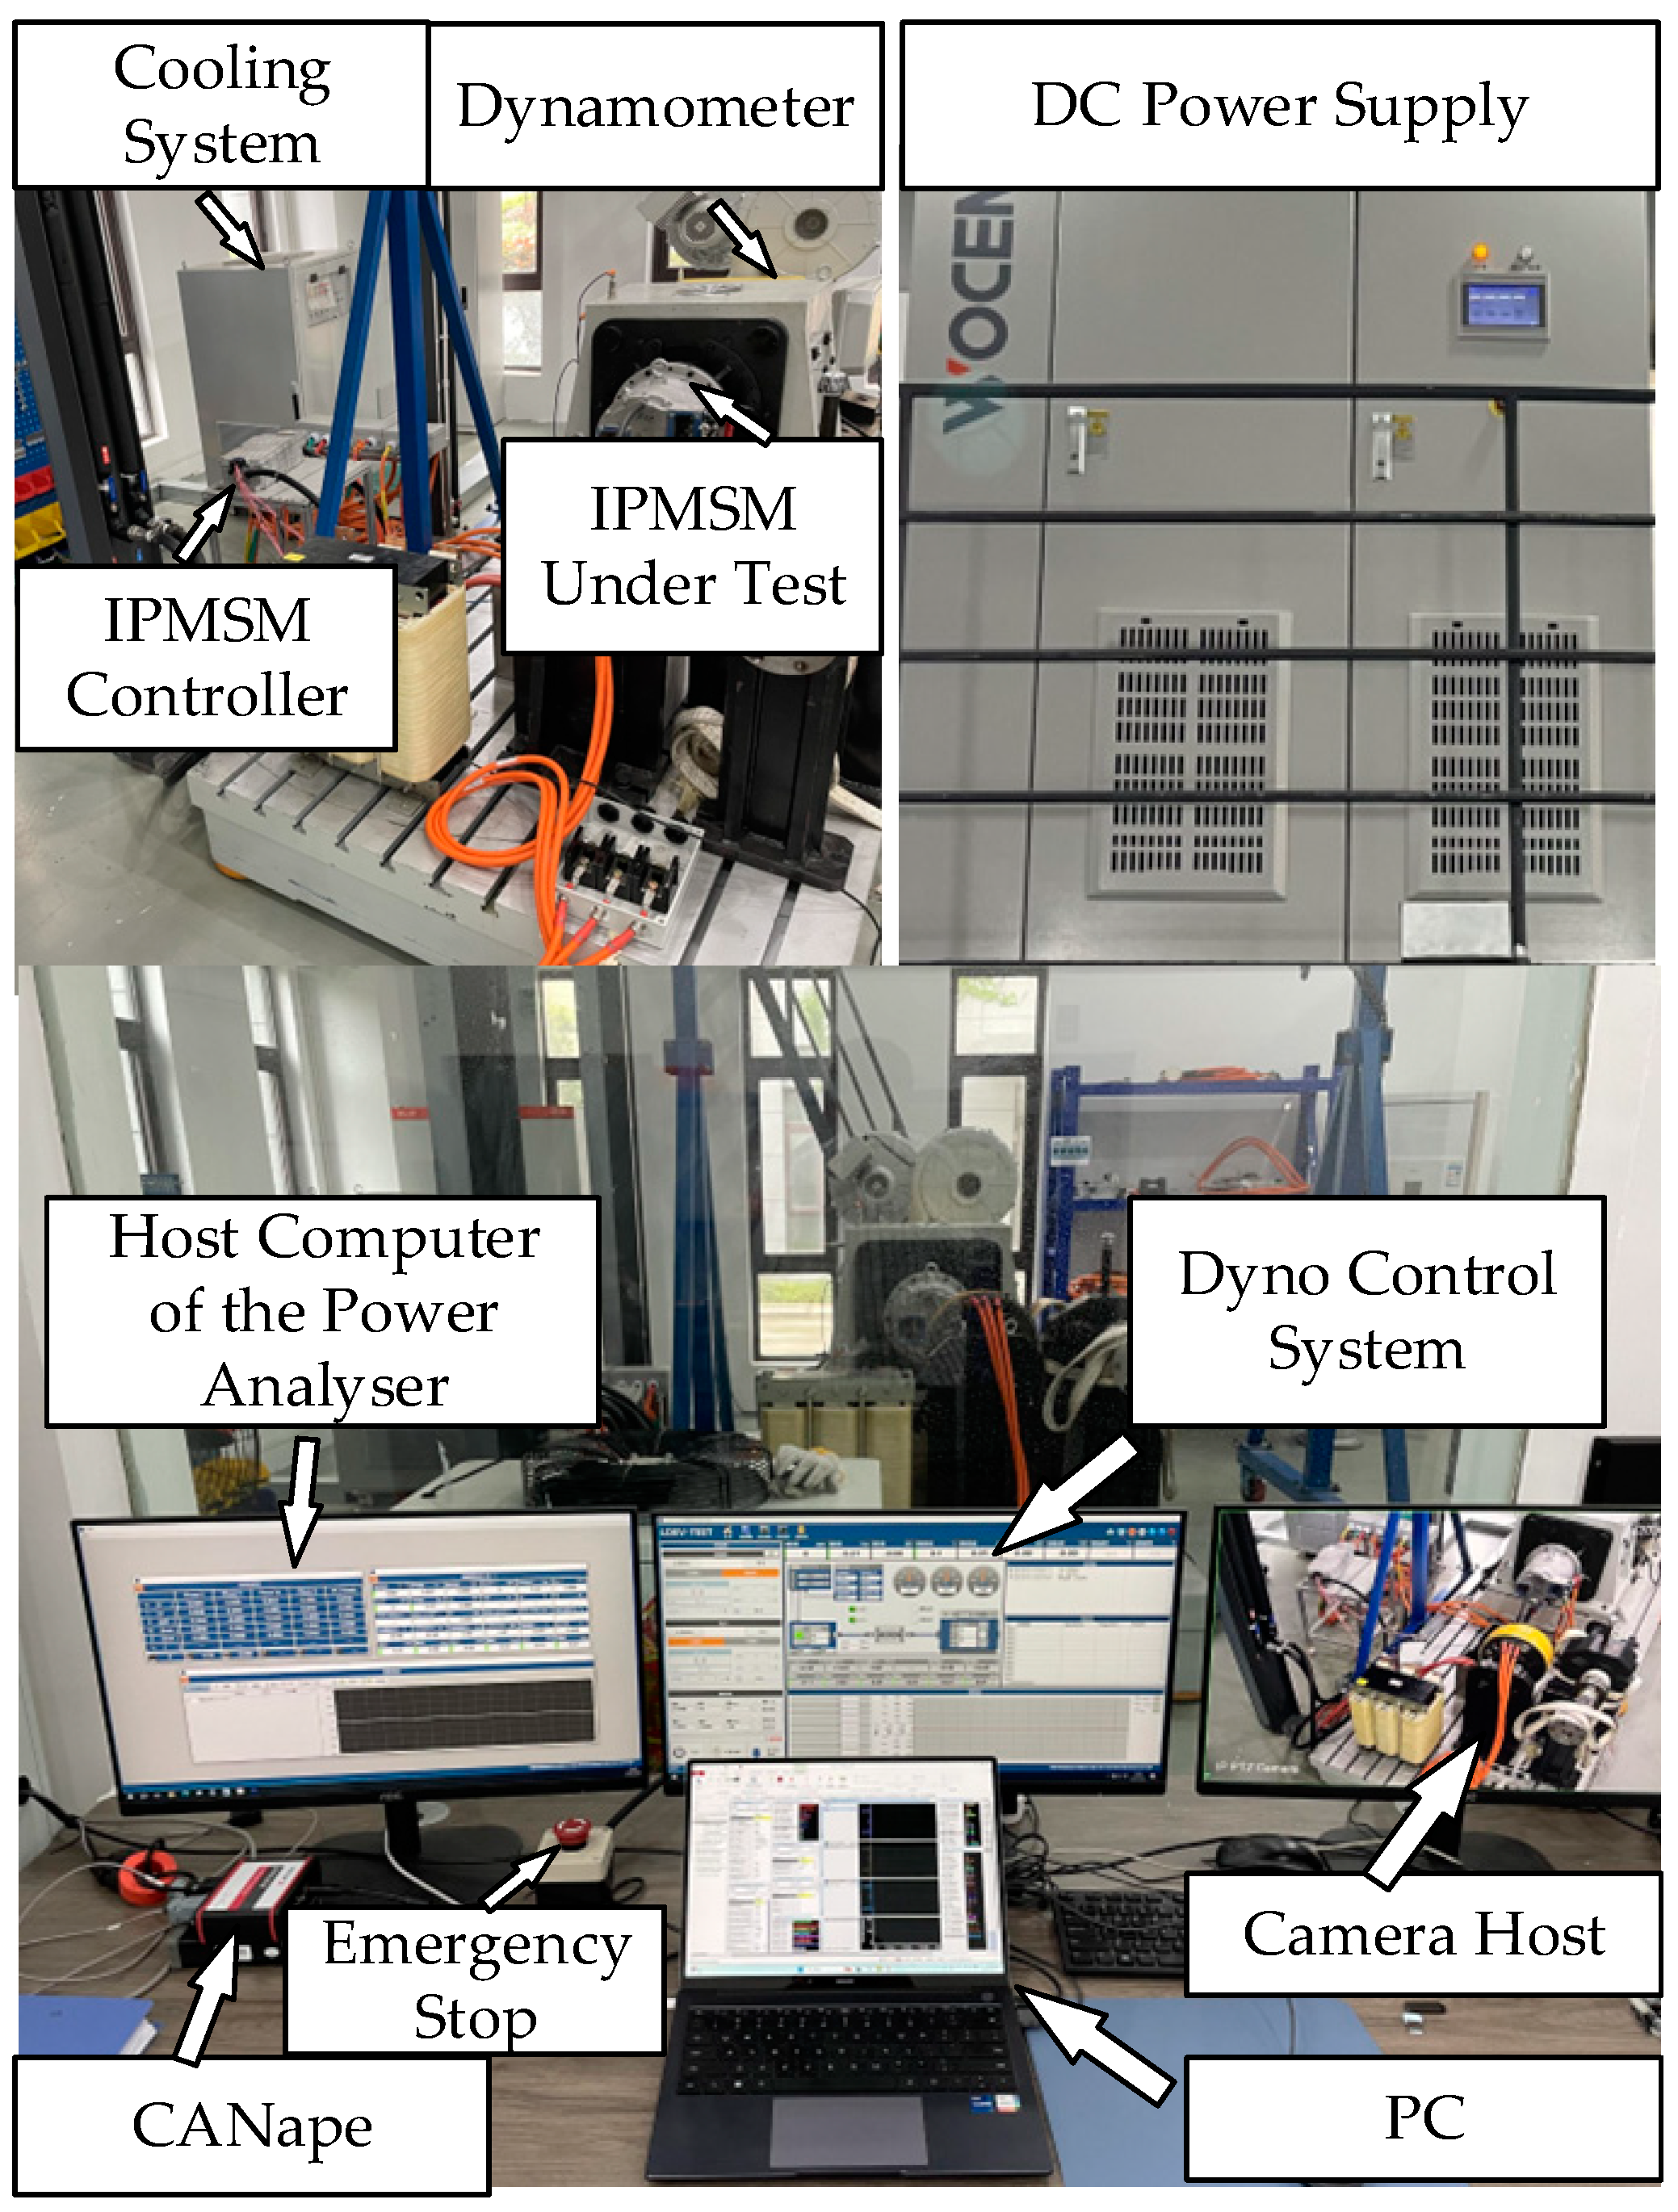
Figure 5 and Figure 6 show the schematic diagram and the photograph of the experimental platform. The experimental platform comprises a 200 kW AC asynchronous motor from Wuxi Langdi Measurement and Control Technology Co., Ltd. (Wuxi, China), which serves as a dynamometer, and the IPMSM under test. The two machines were mechanically coupled together with a torque sensor placed in-between. The dynamometer was in speed control mode, with its speed being regulated by a host computer control system. The IPMSM under test was in torque or current-control mode and was driven by a commercial inverter/motor controller supplied by VEPCO Technologies Inc (Los Angeles, CA, USA). The controller is based on the TC377, a 32-bit AURIX™ microcontroller from Infineon Technologies AG (Neubiberg, Germany). The verter/motor controller is responsible for regulating the current and torque of the IPMSM under test according to the FOC algorithm, which consists of algorithmic modules, such as a complex vector current regulator, current reference LuT, dead-time compensation, and feed-forward decoupling voltage compensation. When the flux-linkage model identification experiments were performed, this controller was in current-control mode, and the d- and q-axis current command values were directly determined by the given stator current amplitude and current angle. When the nonlinear criteria validation experiments were performed, the controller was in torque-control mode and the current command value was obtained from the torque command through the current reference LuT. The data in the current reference LuT were calculated from the improved current criteria. The communication and data transfer between the motor controller and the host software was realized through CANape 17.0, a CAN bus tool developed by Vector Informatik GmbH (Stuttgart, Germany). MATLAB R2024a was employed for the graphical analysis of experimental process data exported from CANape. The Yokogawa WT5000 Precision Power Analyzer (Yokogawa Electric Corporation, Tokyo, Japan) was used to monitor and calculate the voltage and current during experiments. The temperature of the inverter and IPMSM was regulated and maintained by a liquid-cooling system. The DC power supply from the Shandong Wocen Power Equipment Co., Ltd. (Jinan, China) provided the bus voltage for the test bench. Table 2 presents a summary of the principal equipment utilized in the experimental platforms.

4.2. Experimental Identification of Nonlinear Flux-Linkage Model

In the steady-state operation of the IPMSM, it can be assumed that the dynamic voltage term in the voltage equation can be neglected, i.e., that d ψ d / d t = 0 , and d ψ q / d t = 0 . Therefore, the d- and q-axis flux-linkages can be calculated by solving the following equations based on the voltage from Equations (17) and (18):
ψ d = v q R s i q ω e
ψ q = v d + R s i d ω e
Equations (33) and (34) are basic principles for the experimental identification of the nonlinear flux-linkage model. These two equations show that if the variables i d , i q , v d , v q , R s , and ω e are known, then the d- and q-axis flux-linkages, ψ d and ψ q , can be uniquely determined. For the variables in Equations (33) and (34), the speed, ω e , can be controlled by the dynamometer. The current i d and i q can be provided and realized by the IPMSM controller. The resistance of the stator winding varies with temperature, which can cause errors in the calculation of the flux linkage. Thus, it is essential to ensure that the motor temperature is the same at each test point and that all flux-linkage calculations are performed under the same temperature condition. An external water-cooling system was used to maintain a constant motor temperature during the experimental tests. The resistance, R s , in the flux-linkage calculation can be determined according to the following equation:
R s = R 0 1 + α T T s T 0
where T 0 is the initial ambient temperature at the beginning of the test and R 0 is the resistance value at that ambient temperature. In the experiment, the initial ambient temperature was 25 °C and the stator resistance value was measured as 0.058 Ω. T s is the temperature that was set and maintained during experimental testing, and α T is the temperature coefficient of resistance.
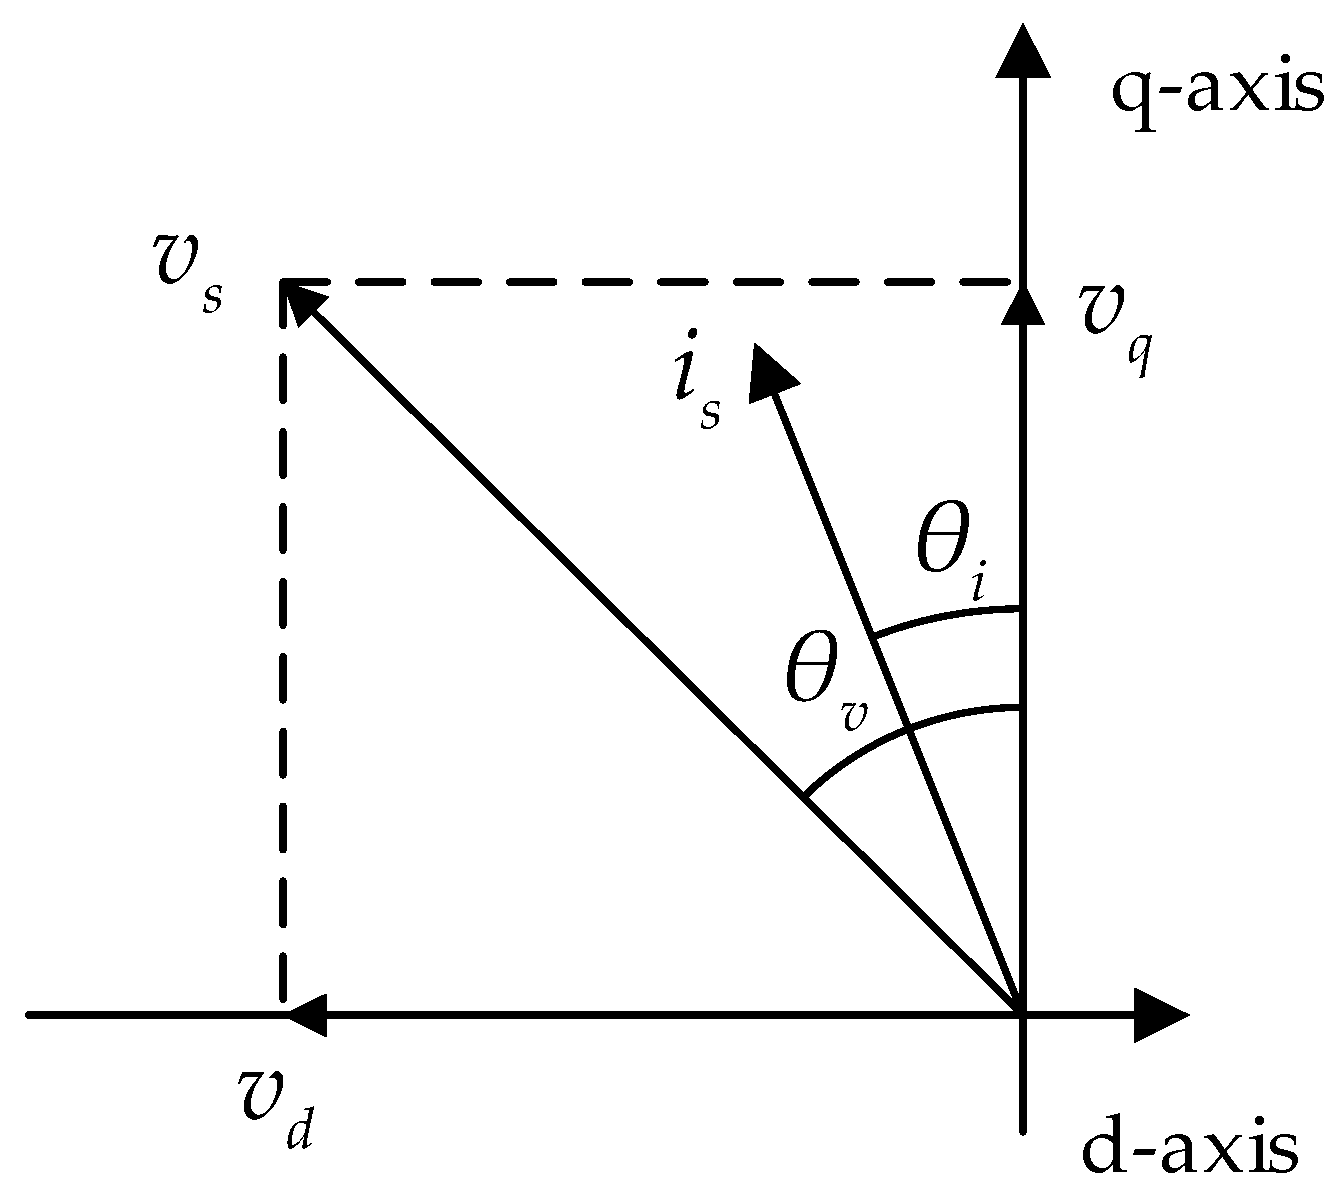
To enhance the identification accuracy, the voltage, v d and v q , in Equations (33) and (34) used the actual motor voltage measured by the power analyzer instead of the output voltage of the current PI regulator. The stator voltage fundamental component amplitude, v s , and angle, θ v (the angle between the stator voltage vector and the q-axis), can be measured with the power analyzer WT5000 [43], and then the d- and q-axis voltages can be calculated, as below. Figure 7 is the measured voltage vector diagram.
    v d = v s s i n θ v
v q = v s c o s θ v
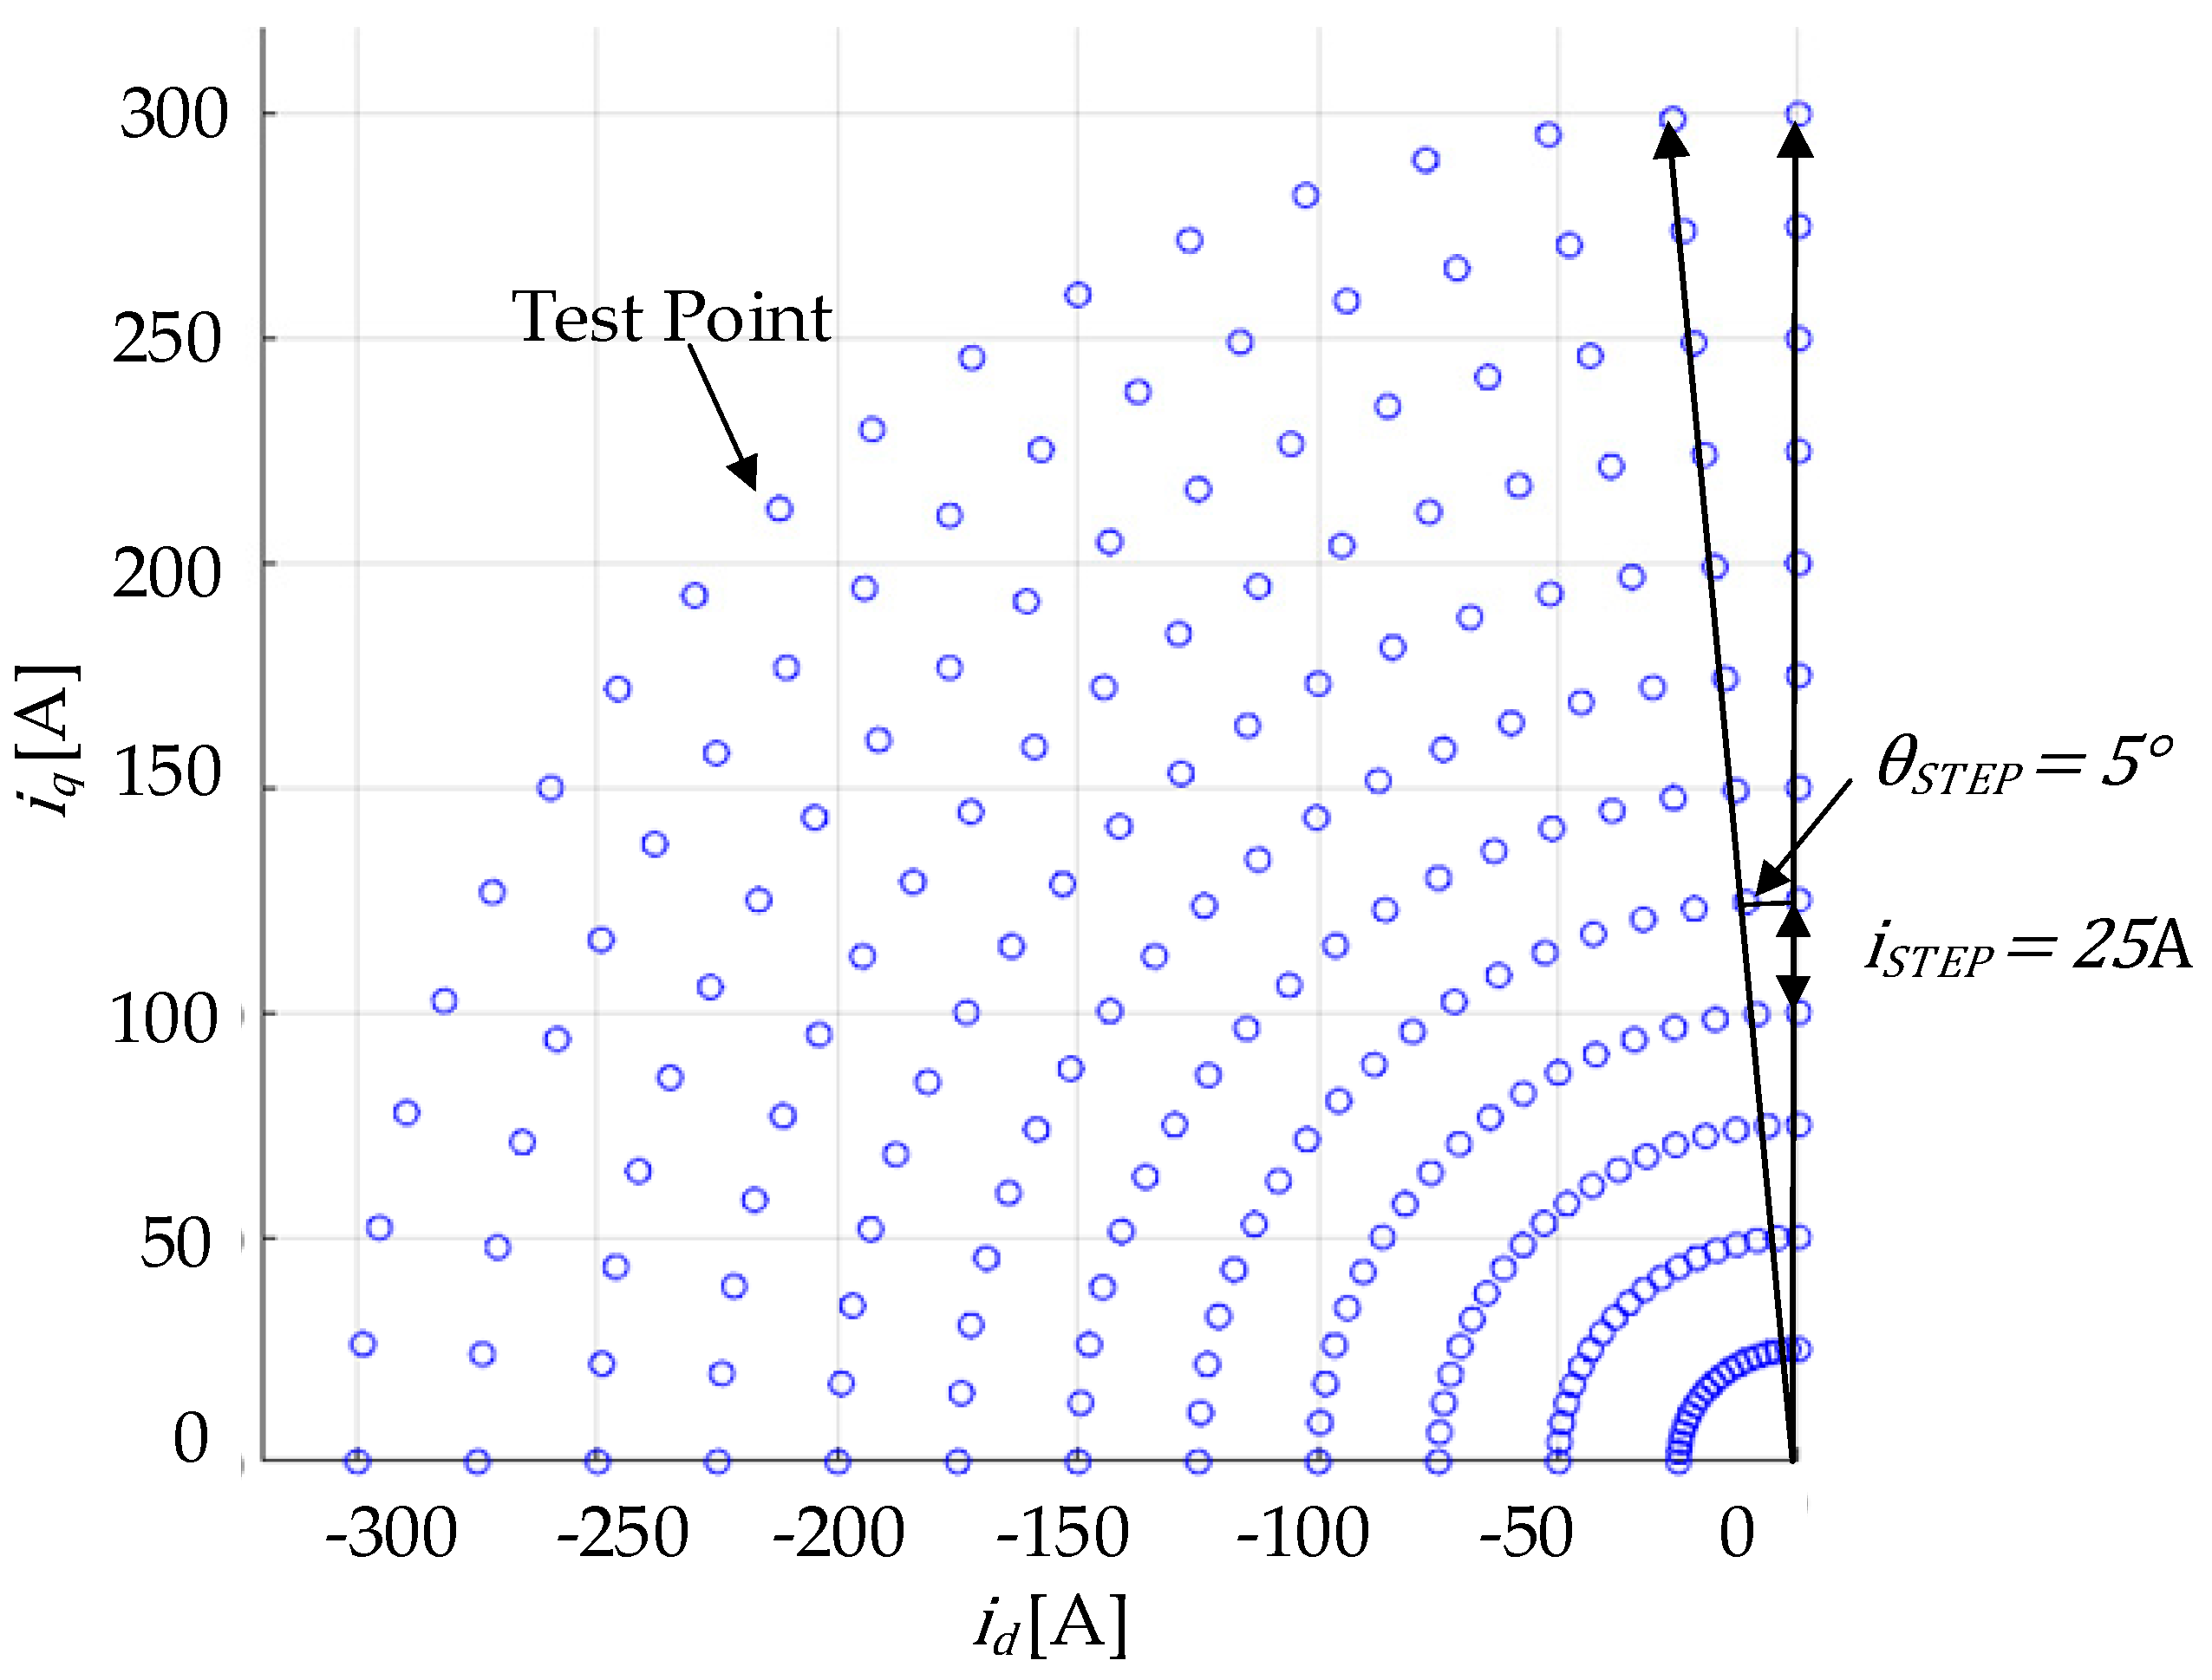
Based on the above principle, the flux-linkage model can be calculated for various combinations of i d and i q by scanning the amplitude and angle of the stator current within the current limit. The sweep test points are shown in Figure 8.
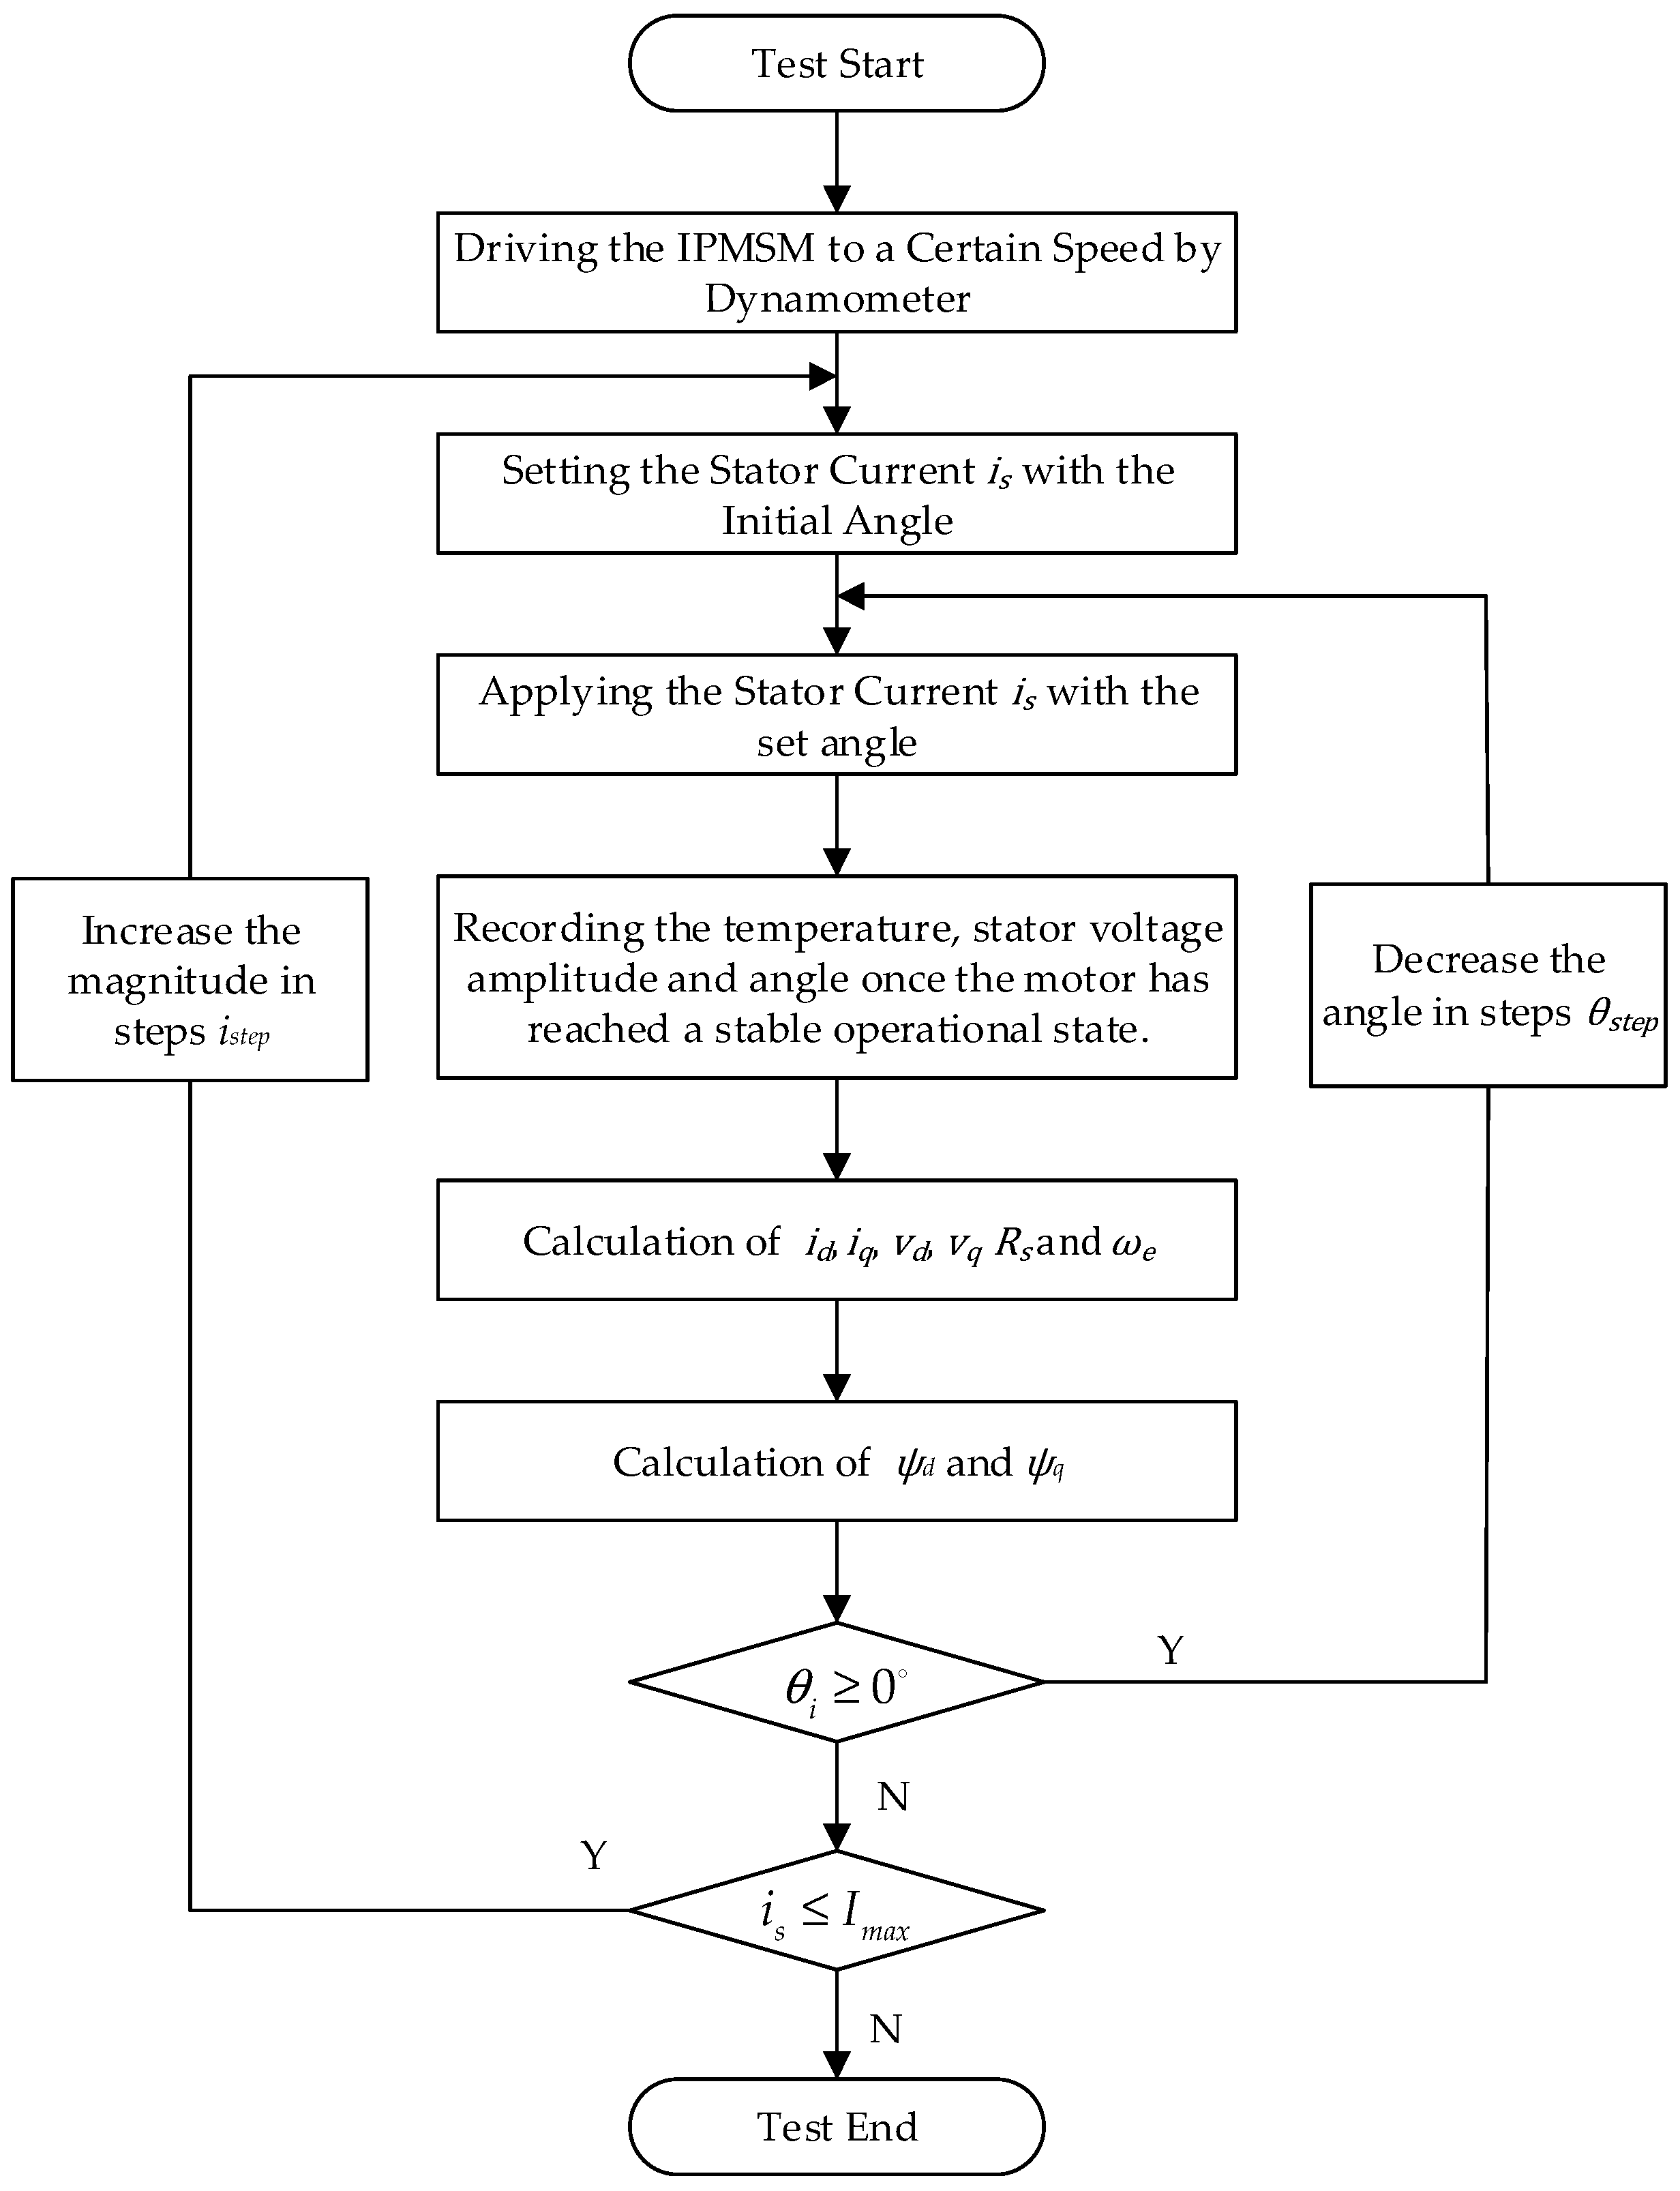
As shown in Figure 9, the following steps are to be followed in order to identify the flux-linkage model: Firstly, the IPMSM was driven by the dynamometer to a defined speed ω e . This speed was set below the base speed so that the operation of the IPMSM was limited only by current constraints. Then, a stator current vector with initial amplitude was applied to the IPMSM, which had an initial angle of 90°. Once the motor operation reached a stable state, the stator voltage amplitude, v s   , and angle, θ v , were read and recorded by the power analyzer WT5000. With the given current amplitude and angle, i d and i q of this test point can be obtained by the vector calculation shown in Figure 7, while v d and v q can be calculated from the recorded stator voltage amplitude, v s , and angle, θ v . It is important to monitor and record the temperatures of the motor in order to ensure that it remains within the specified experimental temperature range. At this stage, the requisite values of i d , i q , v d , v q , ω e , and R s for the calculation of the flux-linkage of this test point were already determined, and the substitution of these values into Equations (33) and (34) allowed the flux-linkages, ψ d and ψ q , of this test point to be obtained. By repeating the above process with current amplitude and angle steps, the flux-linkage data for each test point shown in Figure 8 can be obtained. These flux-linkage data can then be combined to construct the nonlinear flux-linkage model of the IPMSM under test. In the experimental identification of the nonlinear flux-linkage model, the current amplitude step was 25 A and the current angle step was 5°.
As previously discussed in Section 3.1, it is essential that the flux-linkage model identification and other experiments are conducted at the same temperature to ensure that the effect of temperature on the electromagnetic performance of the motor is eliminated. In the series of experiments conducted in this paper, the temperature was set to 60 °C. As the flux-linkage identification experiments necessitate repeated loading tests on a wide range of test points, the motor temperature may be excessively high, even in the presence of an external water-cooling system. Therefore, during the flux-linkage identification experiment or other experiments, once the motor temperature is higher than the set temperature range, it is necessary to stop the test and wait for the motor to cool down before carrying out the test, in order to eliminate, as much as possible, the error caused by the temperature factor.

4.3. Experimental Identification of MTPA, FW, and MTPV Current Trajectory

The experimental method for identifying current trajectories consists of two main parts: the identification of MTPA current trajectory in the low-speed region and the identification of FW current trajectories under different speed conditions in the high-speed region. The MTPV current trajectory can be obtained naturally by summarizing the operating points corresponding to the maximum torque in the FW trajectory for different speed conditions in the high-speed region.
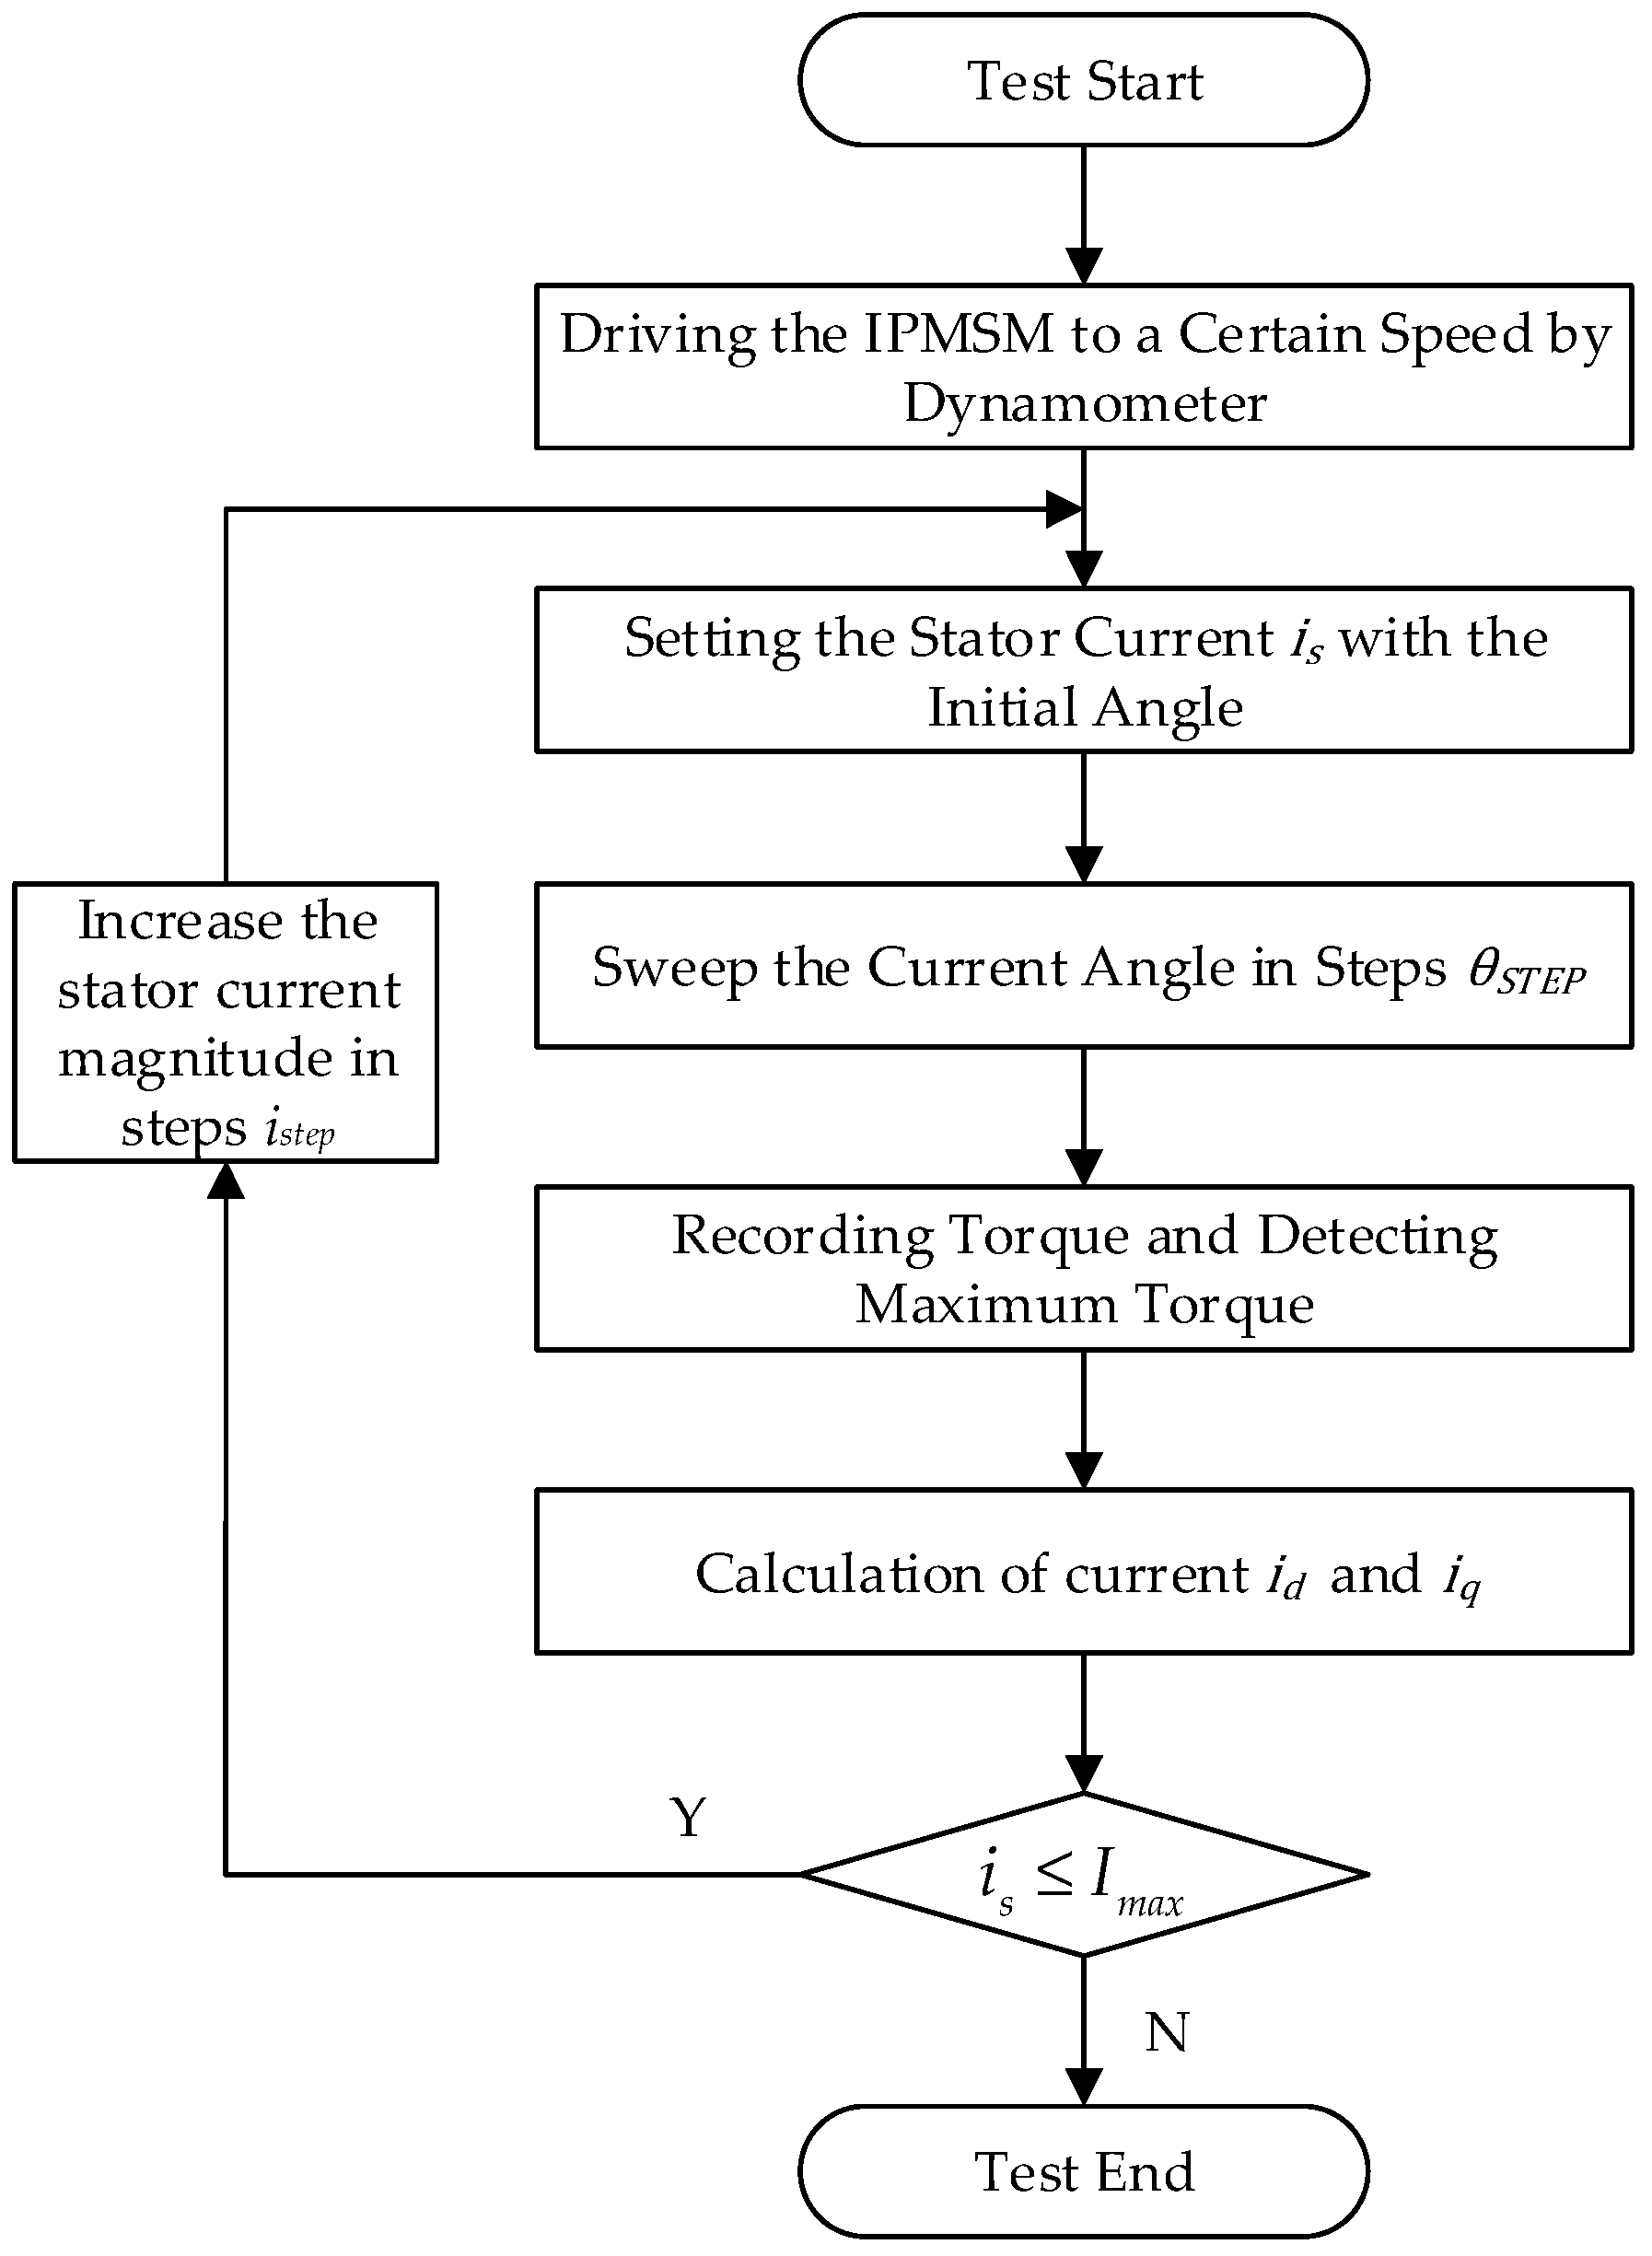
Figure 10 shows the flowchart for the experimental identification of the MTPA current trajectory, and Figure 11 is the related vector diagrams. Similar to the experimental identification of the flux-linkage model, the IPMSM was first driven by the dynamometer to a speed lower than the base speed. Then, a stator current with amplitude i s was applied to the IPMSM, which had an initial angle of 90°. Following this, the current angle was then decreased in step θ S T E P from 90° to 0°, while the motor output torque was monitored by the host computer and the current angle corresponding to the maximum output torque was recorded, so that the MTPA operating point for this stator current condition was determined. After this process, the stator current amplitude was increased in step i S T E P and the angle sweep process was repeated until the stator current amplitude reached the current limit.
By increasing the stator current in certain steps within the current limit and repeating the angle sweep process, a series of MTPA operating points was obtained, and these operating points were summarized to obtain the MTPA current trajectory. During the test, it is important to monitor the motor temperature to ensure that each angle sweep is performed at the same motor temperature. To enhance the identification accuracy, the current angle sweep process can be divided into two parts: approximate and precise measurements. For approximate measurements, the angle step can be set to a relatively large value, such as θ S T E P = 10 ° . This process allows for a quicker determination of the angle interval in which the MTPA operating point is located but does not allow for an accurate determination of the MTPA operating point. Precise measurements were performed based on the MTPA angular approximate interval. The angle step in precise measurements can be set to a smaller value, such as θ S T E P = 1 ° .
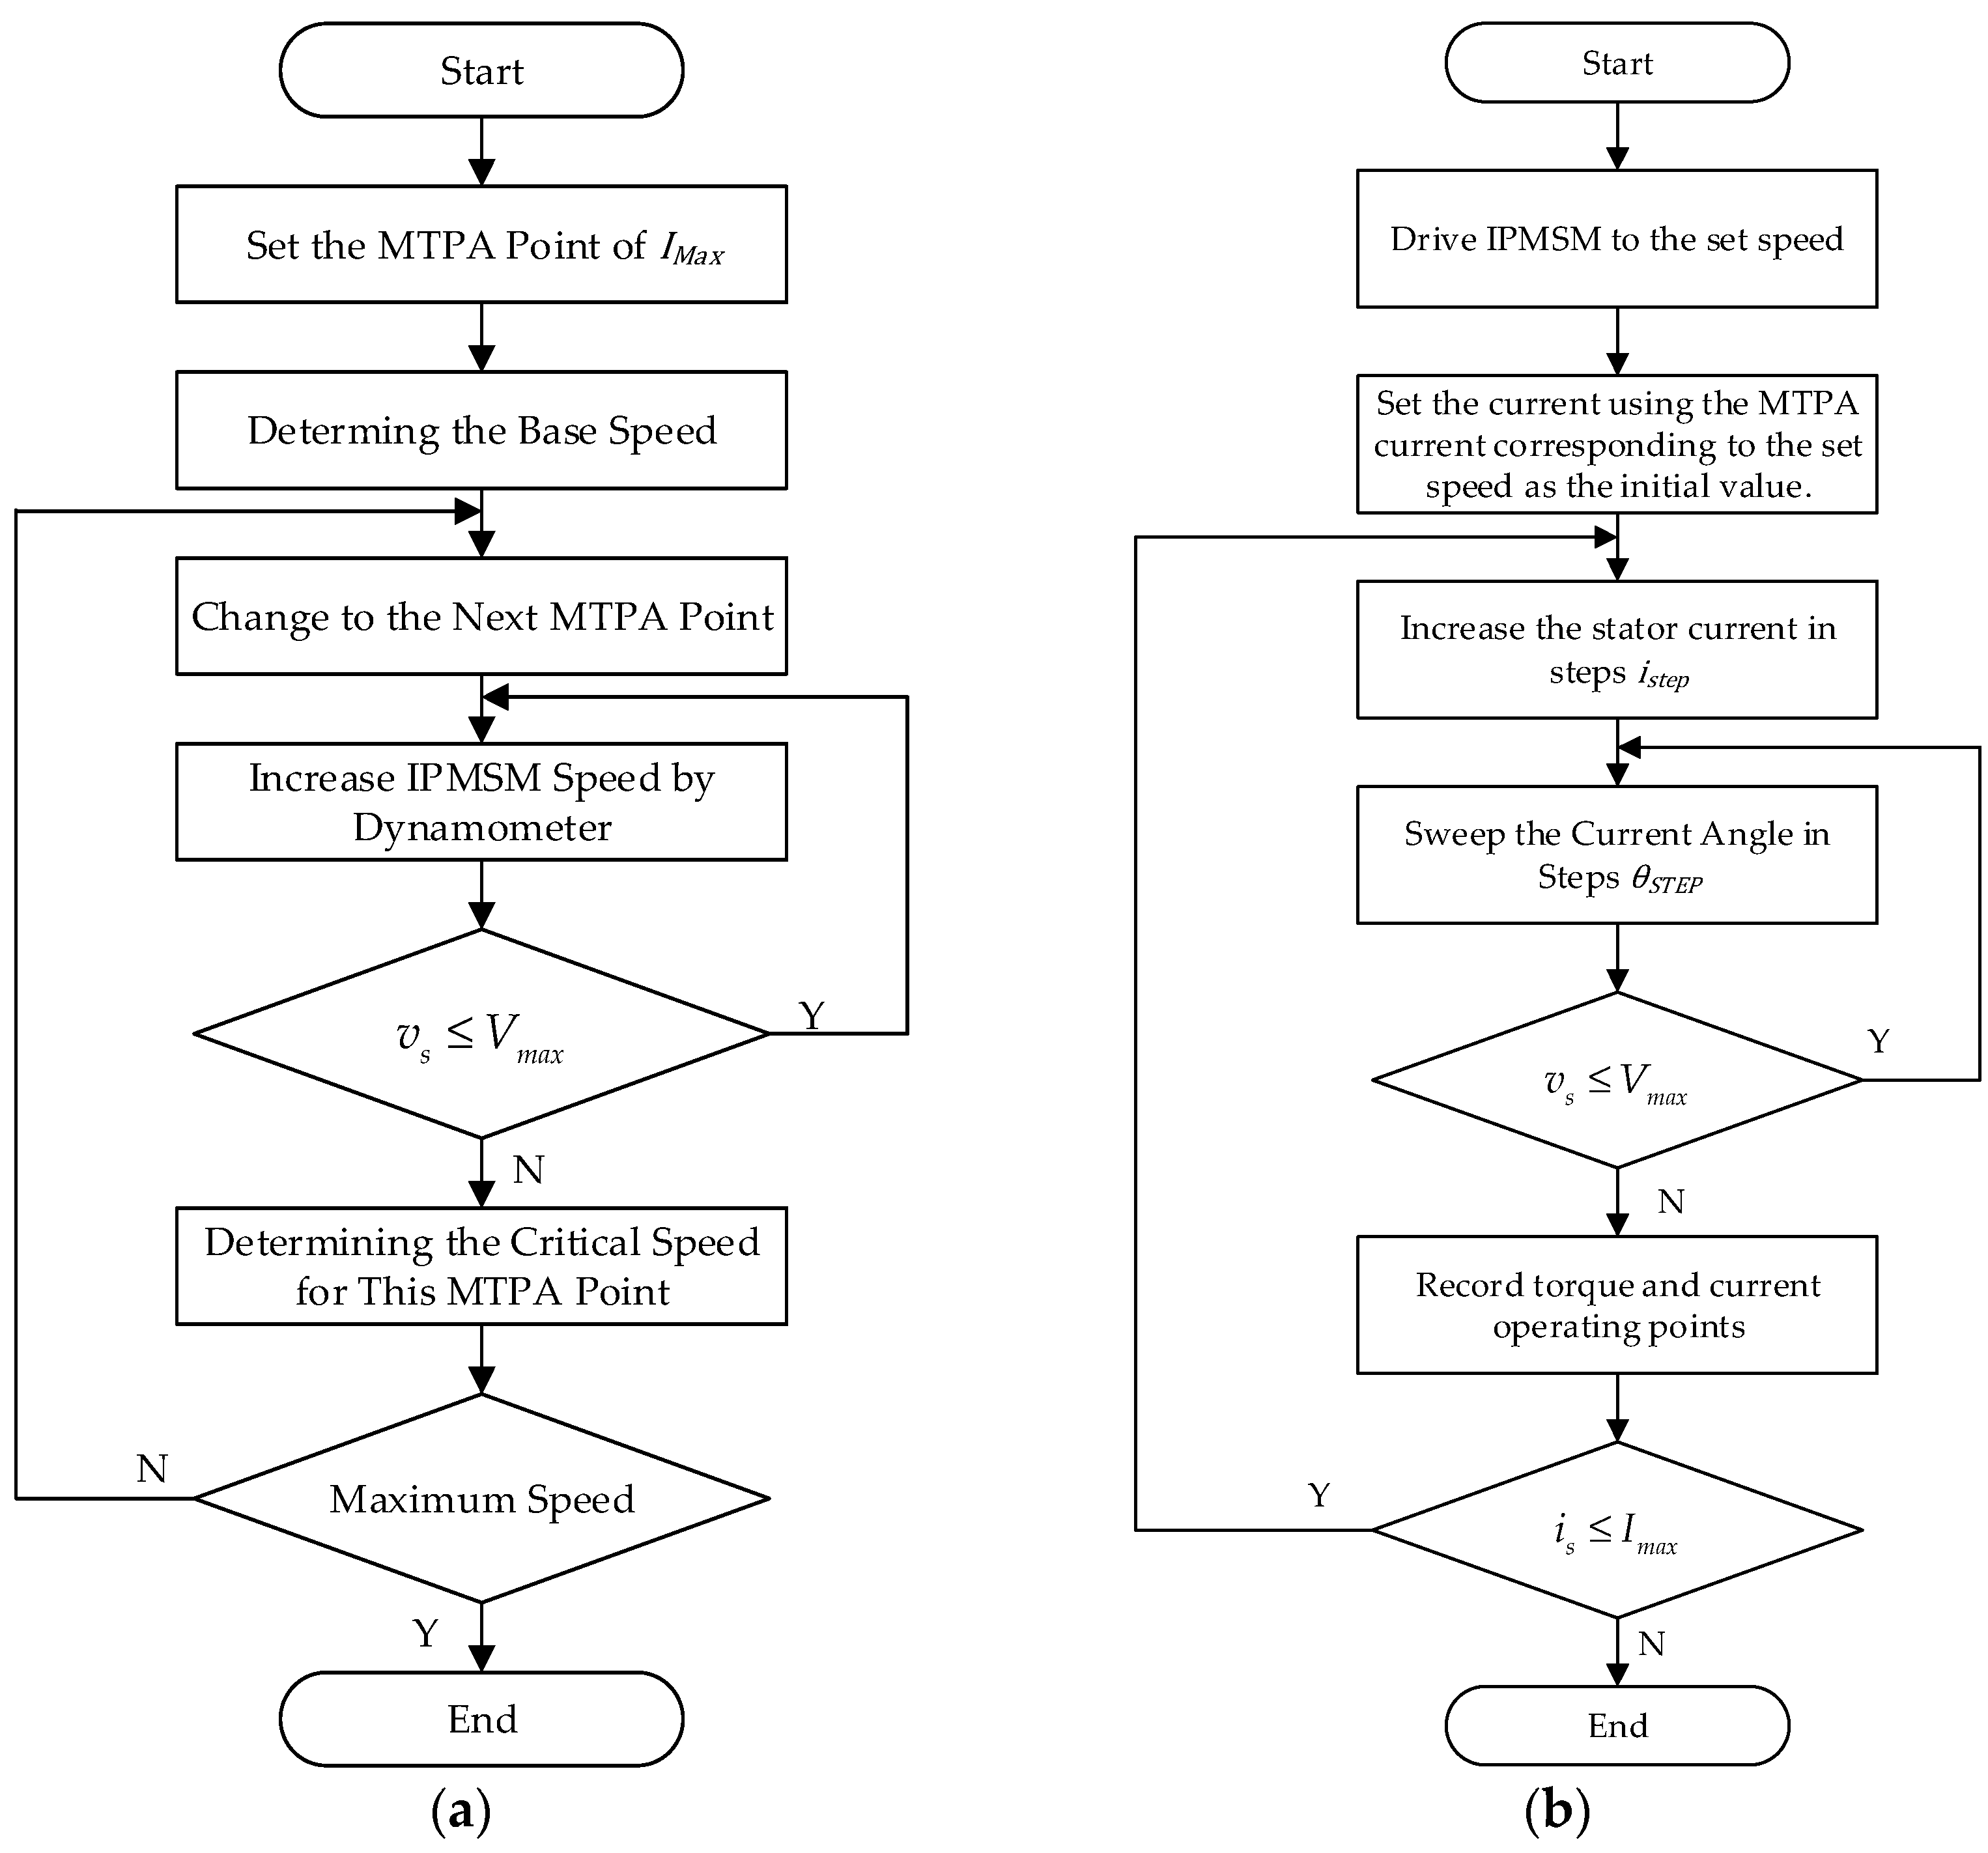
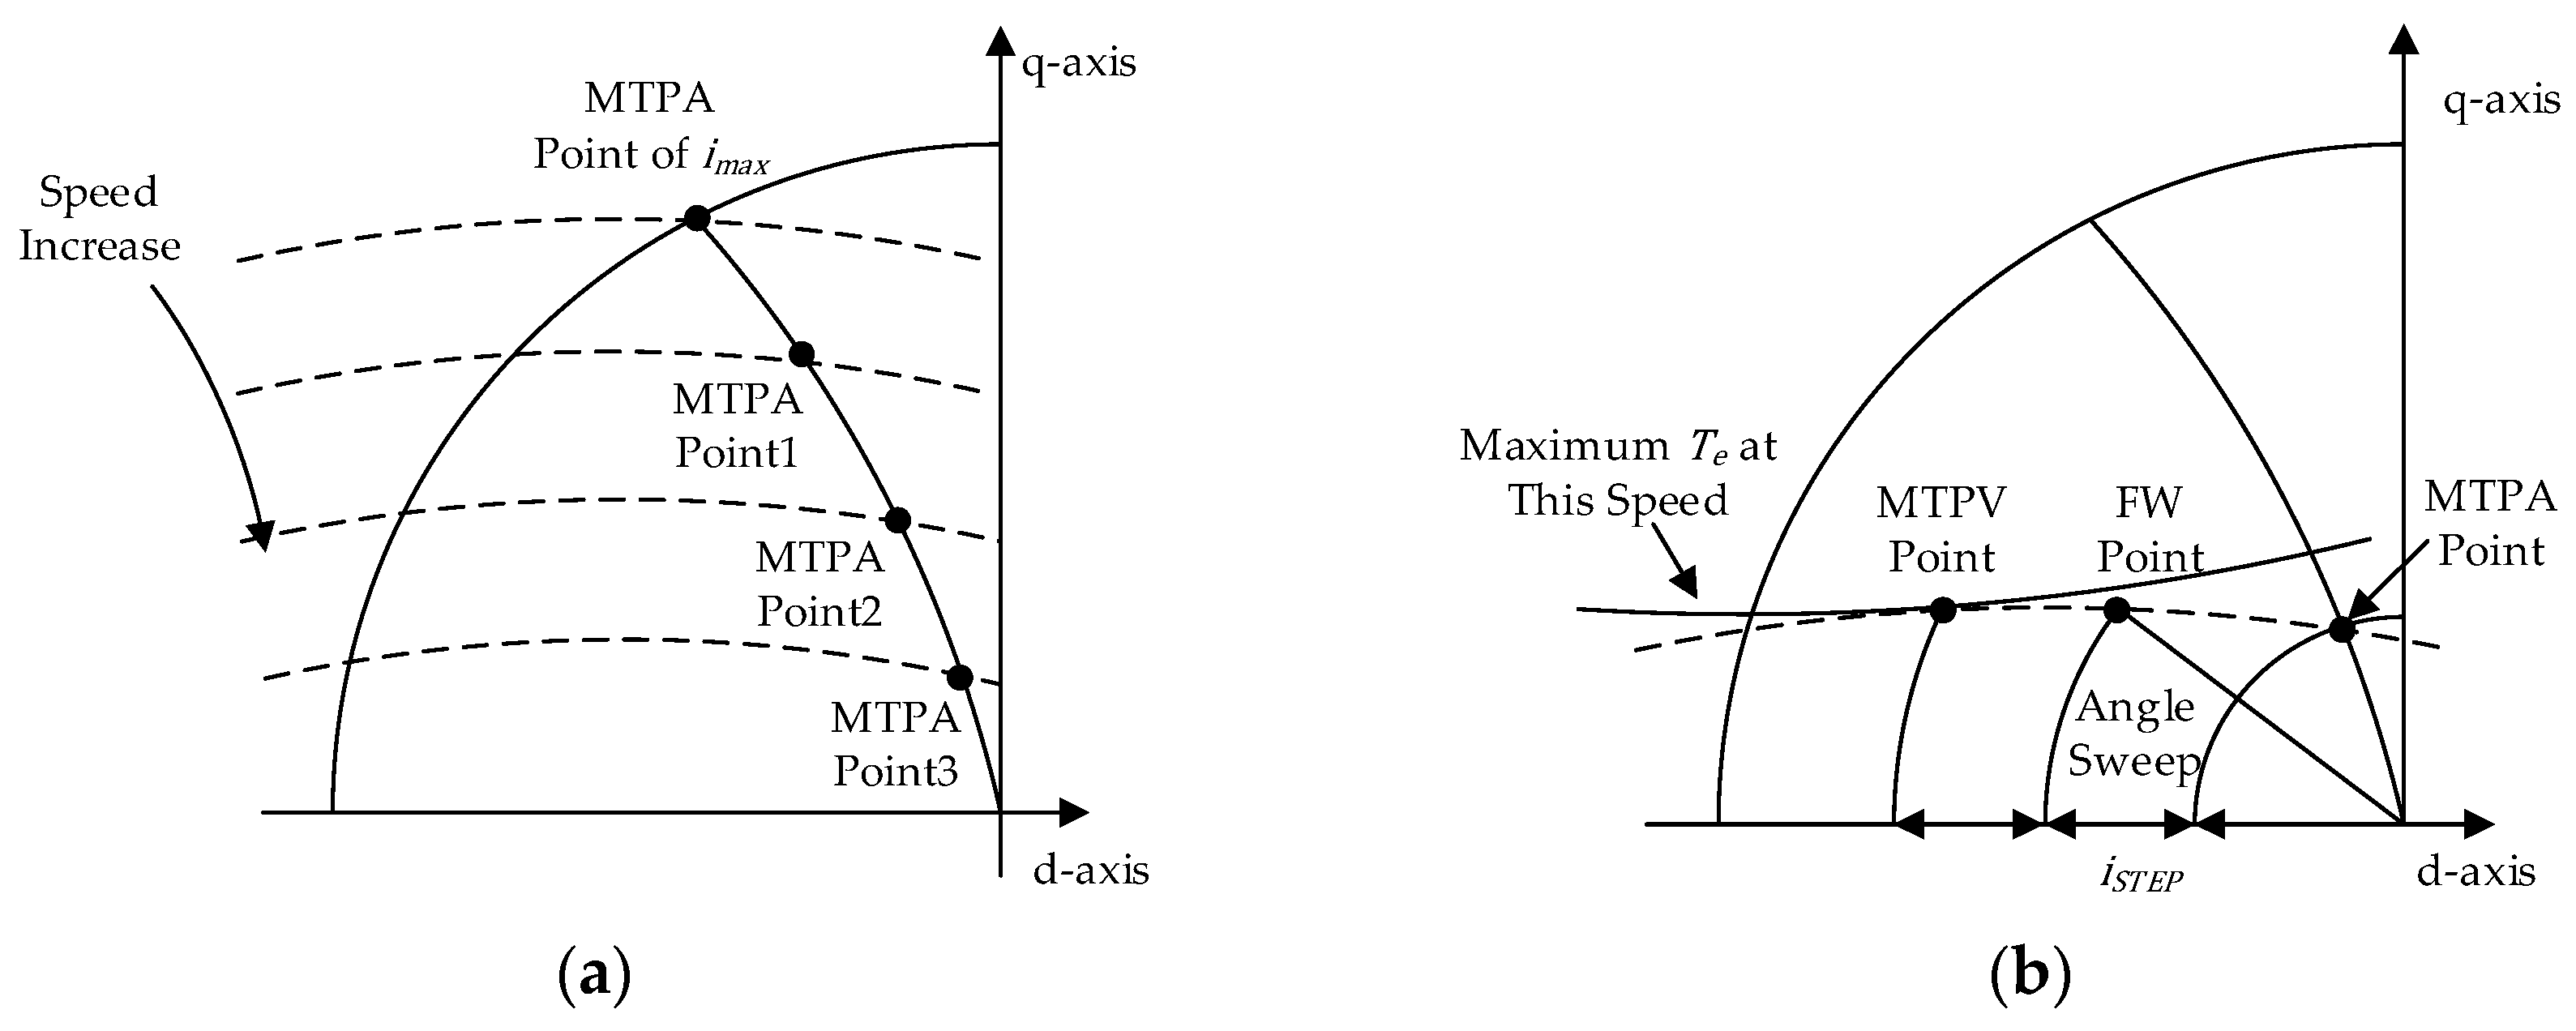
For each MTPA current operating point, the corresponding FW critical speed and torque need to be determined. Figure 12a is the flowchart of calibrating the critical speed and torque. At the start of calibration, the IPMSM was driven by the dynamometer to a low speed. The current operating point was then set to the MTPA operating point, corresponding to the current-limit condition. Subsequently, the IPMSM speed was increased by the dynamometer, and the stability of the current control and the stator voltage amplitude were observed by the host computer and the power analyzer during the increase in speed. Once the stator voltage amplitude reached the maximum voltage value set in the control program and there was no overshoot in the current control, the motor speed at this condition was the critical speed corresponding to the MTPA operating point of the current-limit condition; that is to say, the motor base speed. Following the determination of the motor base speed, the current operating point was set to the next point in the MTPA current trajectory, which was determined previously in the MTPA identification. The motor speed was then increased by the dynamometer, and the voltage magnitude and current control stability were observed in order to determine the critical speed corresponding to this MTPA point. Repeating the above process along the MTPA current trajectory until the maximum speed of the motor is reached, critical speeds for different MTPA points can be obtained. Figure 13a shows the vector diagrams of the FW critical speed at various MTPA operating points. The dashed lines represent the voltage limit equation curves corresponding to the critical speed of FW at different MTPA points.
When the critical speed corresponding to each MTPA point has been determined, the FW points can be calibrated under these speed conditions. Figure 12b shows the flowchart of calibrating the FW points for a given speed condition. The IPMSM was first driven to the speed of one of the MTPA critical speed sequences, and then the initial value of the current amplitude was set based on the MTPA current value corresponding to that critical speed. As the MTPA operating characteristic can be achieved at this current amplitude condition, it is unnecessary to perform a current angle sweep on this current vector. Subsequently, the current amplitude was increased in step i S T E P and the angle of the current vector was scanned. To ensure the stable operation of the IPMSM, the initial value of the angle sweep can be set as 90°. This value can then be reduced in step θ S T E P , with the q-axis current gradually increased in each step. The stability of the current control and the stator voltage amplitude were monitored by the host computer and the power analyzer during the angular sweeping process. Once the stator voltage amplitude reached the maximum voltage value set in the control program and there was no overshoot in the current control, the current operating point and motor torque were recorded as the FW operating points for this current amplitude condition. A repetition of the aforementioned scanning process of current amplitude and angle under different critical speed conditions allowed for the determination of the FW operating point in the high-speed region. It is important to note that as the current amplitude increases, there will be an initial increase in motor torque, which will subsequently decrease. The operating current point corresponding to the maximum torque during this process is the MTPV point for the given speed condition. The current trajectory of the MTPV can be obtained by summarizing the operating points corresponding to the maximum torque during the sweep of current amplitude and angle of different speed conditions. Figure 13b presents the vector diagram of the FW current amplitude and angle sweep at a certain speed.

4.4. Experimental Results of the Improved MTPA and MTPV Criteria

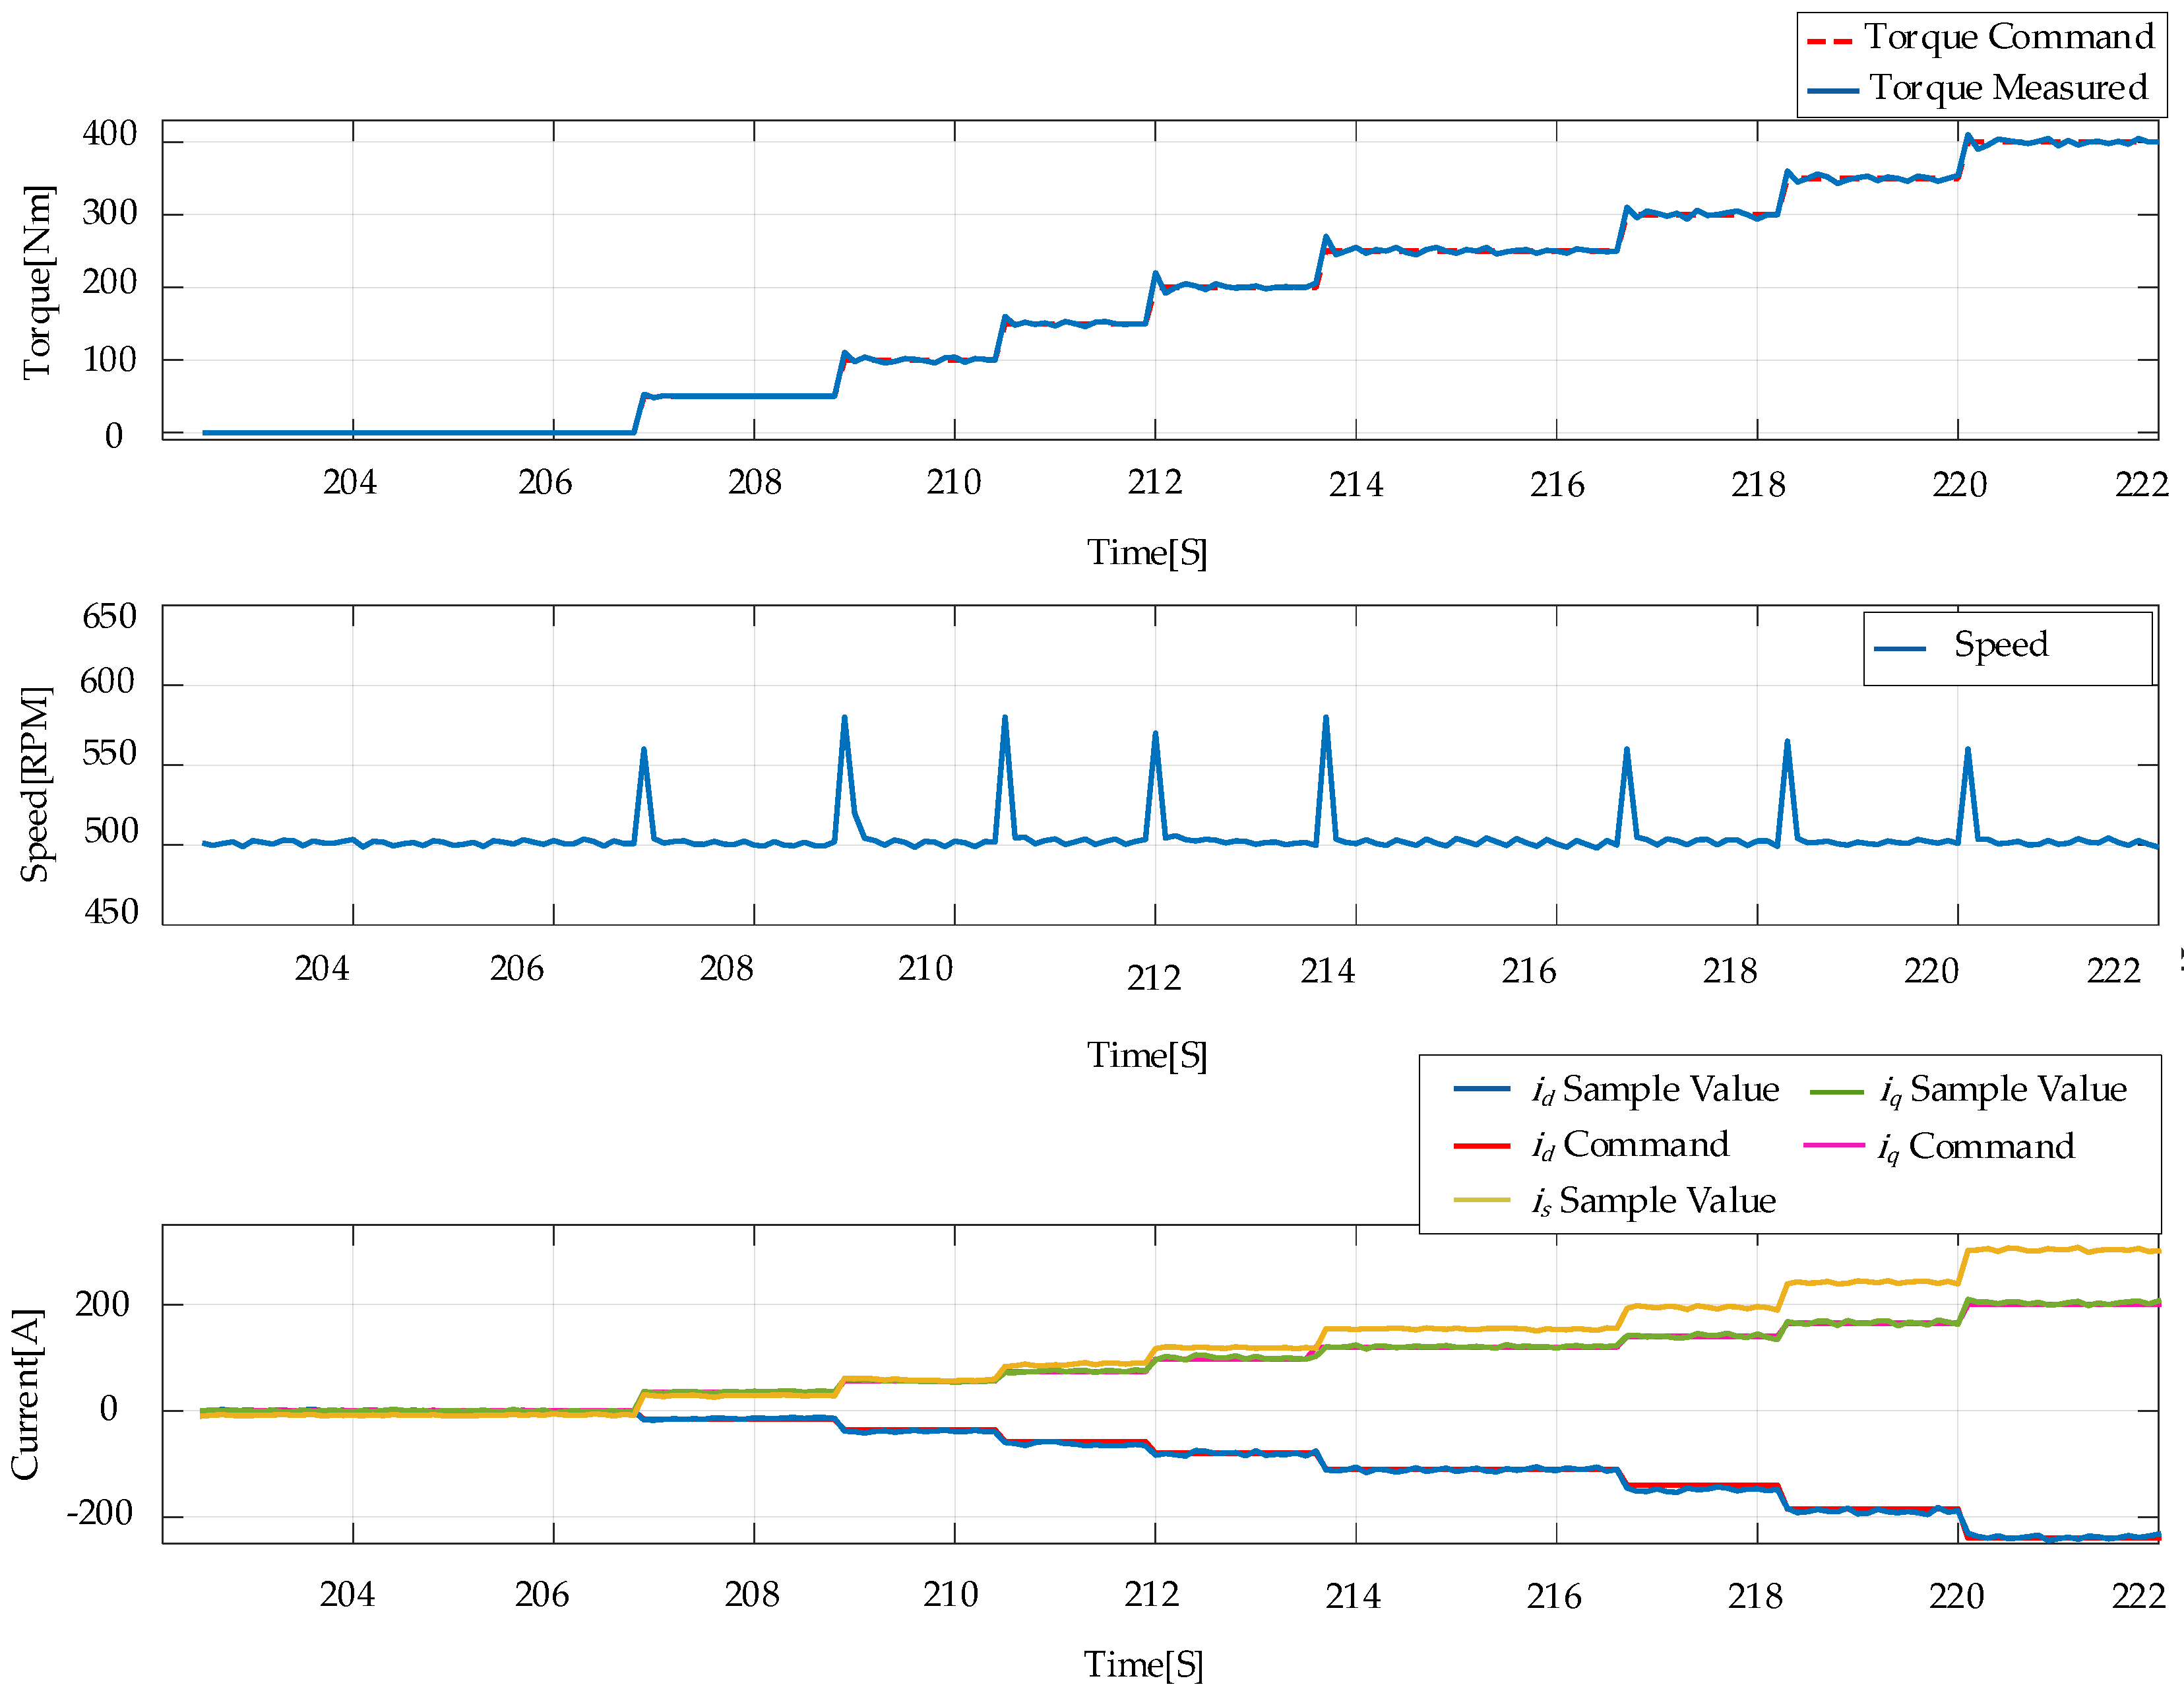
Figure 14 illustrates the experimental performance of the MTPA region. The IPMSM under test was accelerated to a speed of 500 RPM through the dynamometer. At this speed, the torque command was incrementally increased in 50 Nm steps. As illustrated in Figure 13, it can be observed that as the torque command increased, the motor d- and q-axis current could track the current command well, while the motor stator current gradually increased until the motor current-limit condition was reached.
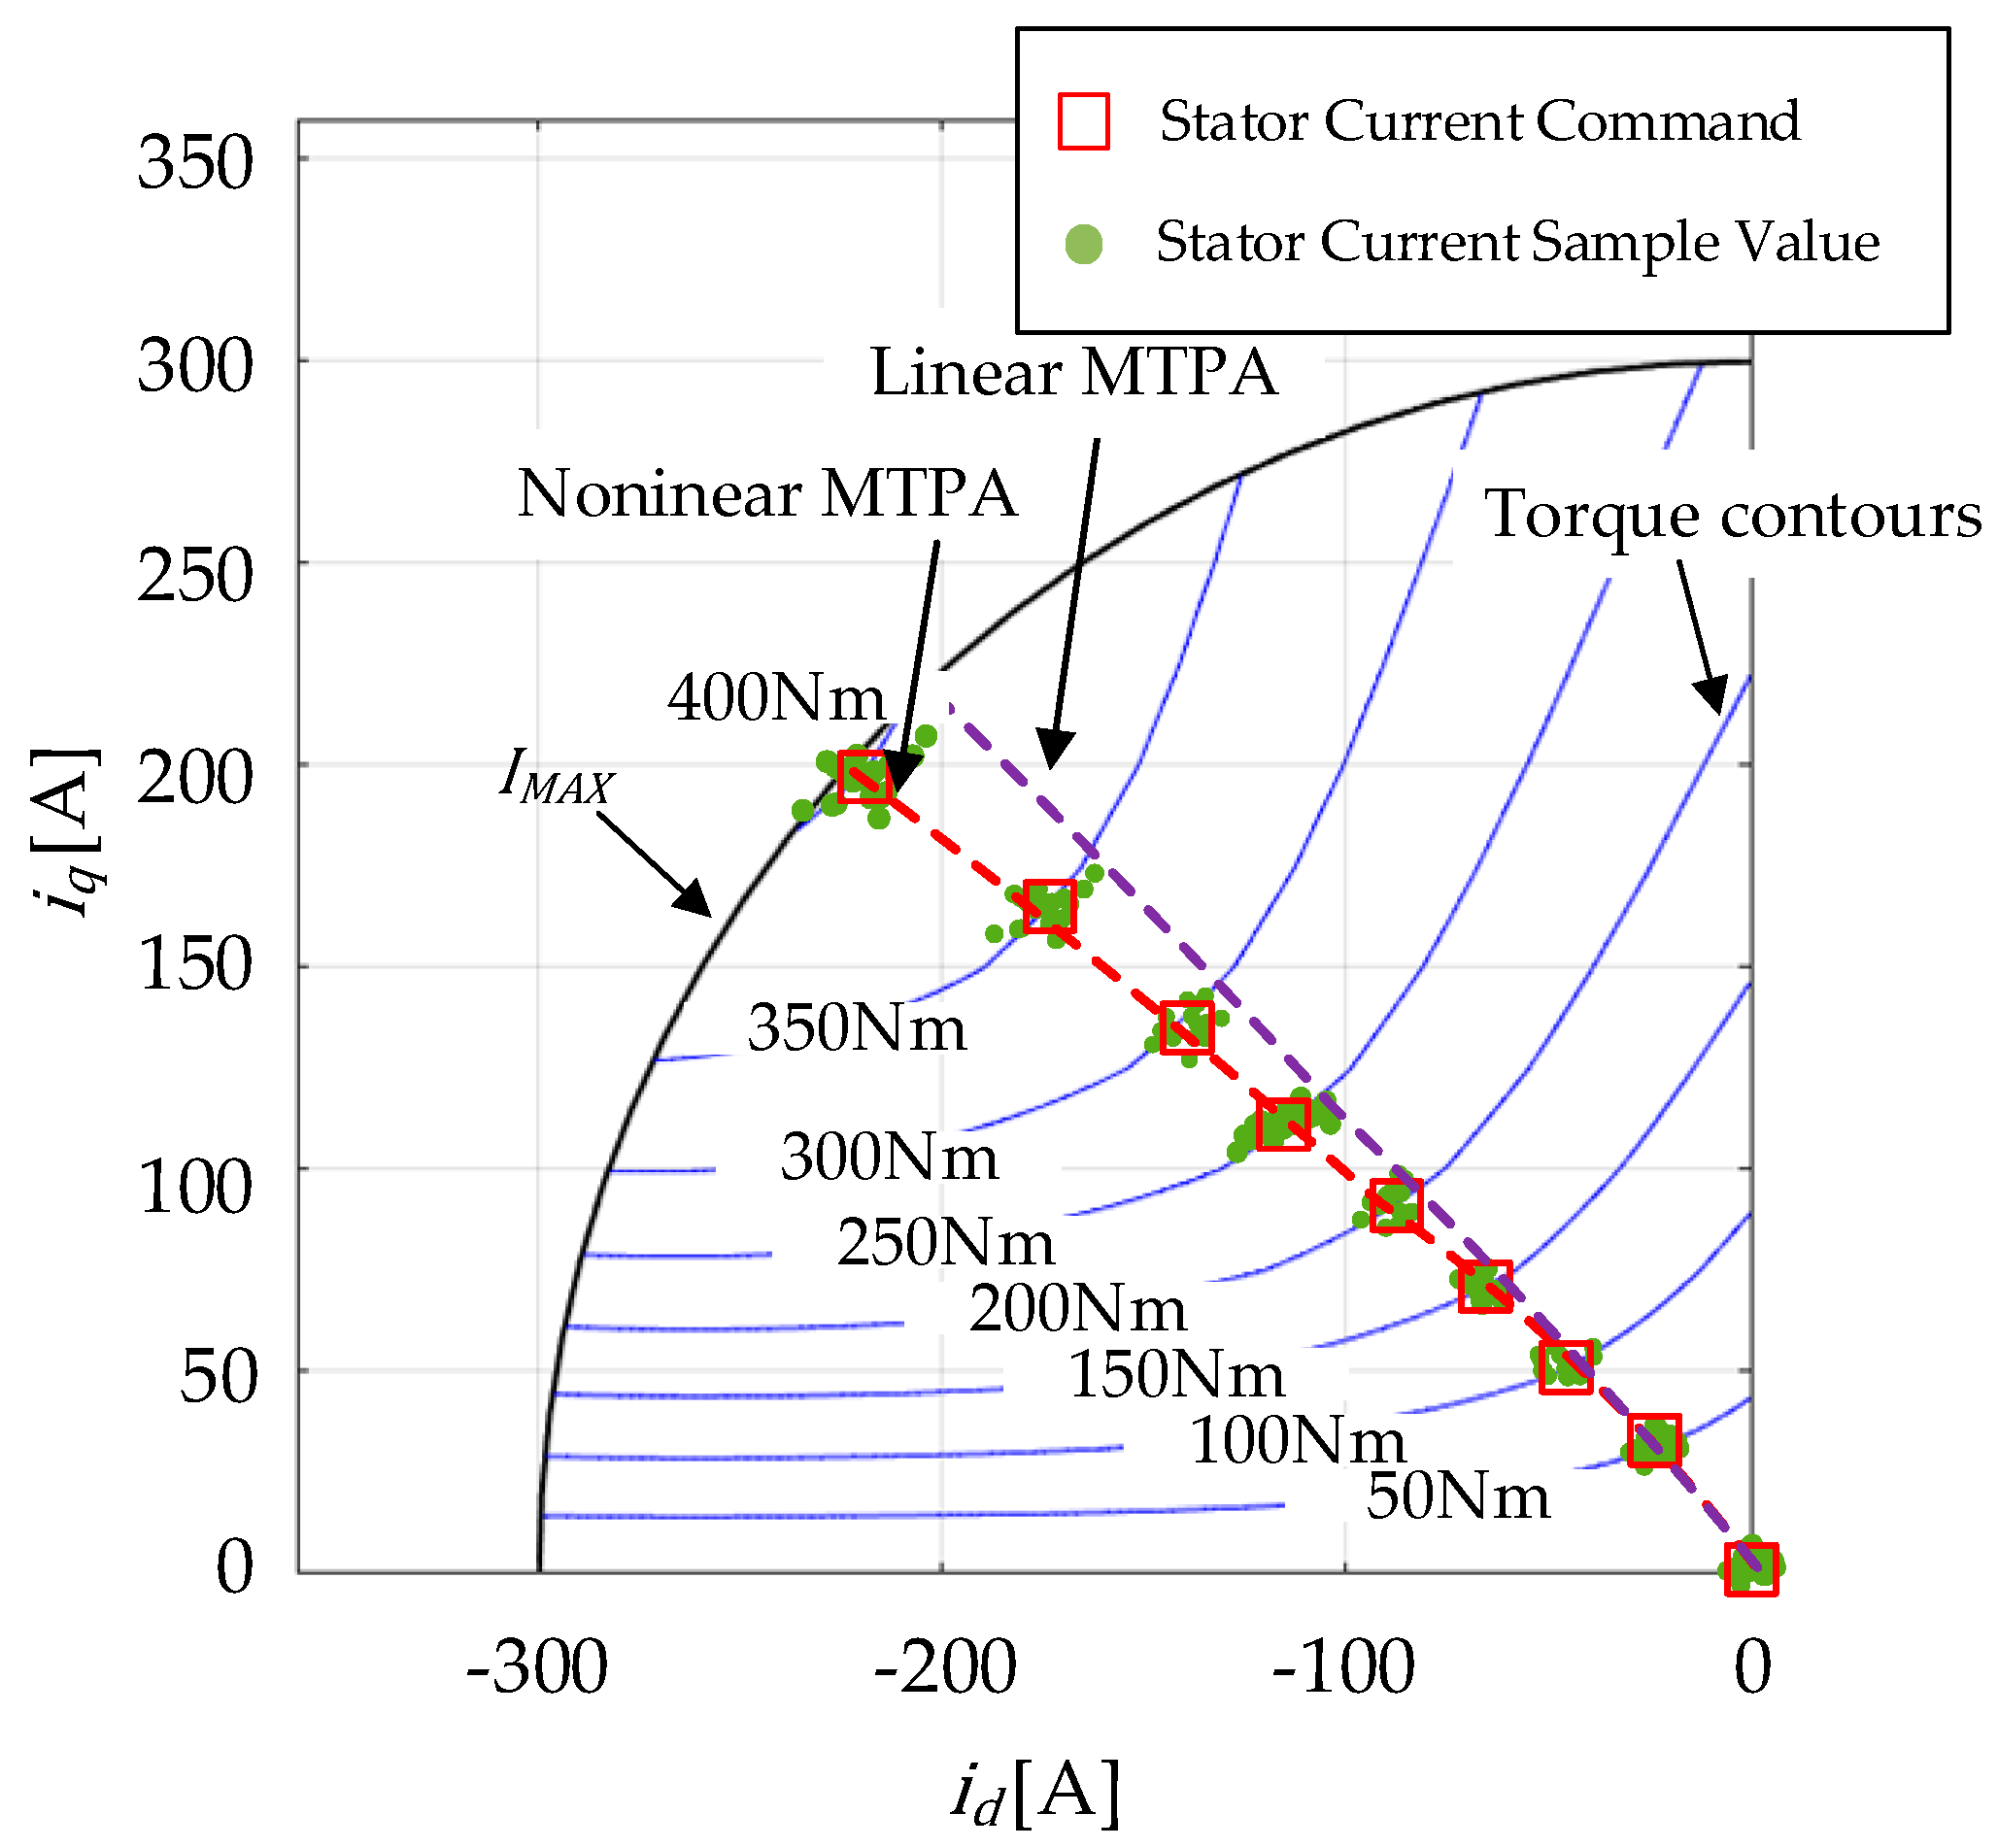
The MTPA trajectories of the current operating points are summarized in Figure 15. In Figure 15, the red squares indicate the current command calculated based on the improved MTPA criteria. The green dots indicate the actual motor current sampling values during motor operation. Due to the relatively low motor speeds, the operational limits of the motor were determined by the current-limit conditions. As the torque command increased, the current operating points gradually approached the maximum current of the motor, and the trajectory of the current operating points converged with the calculation results of the nonlinear MTPA criteria.
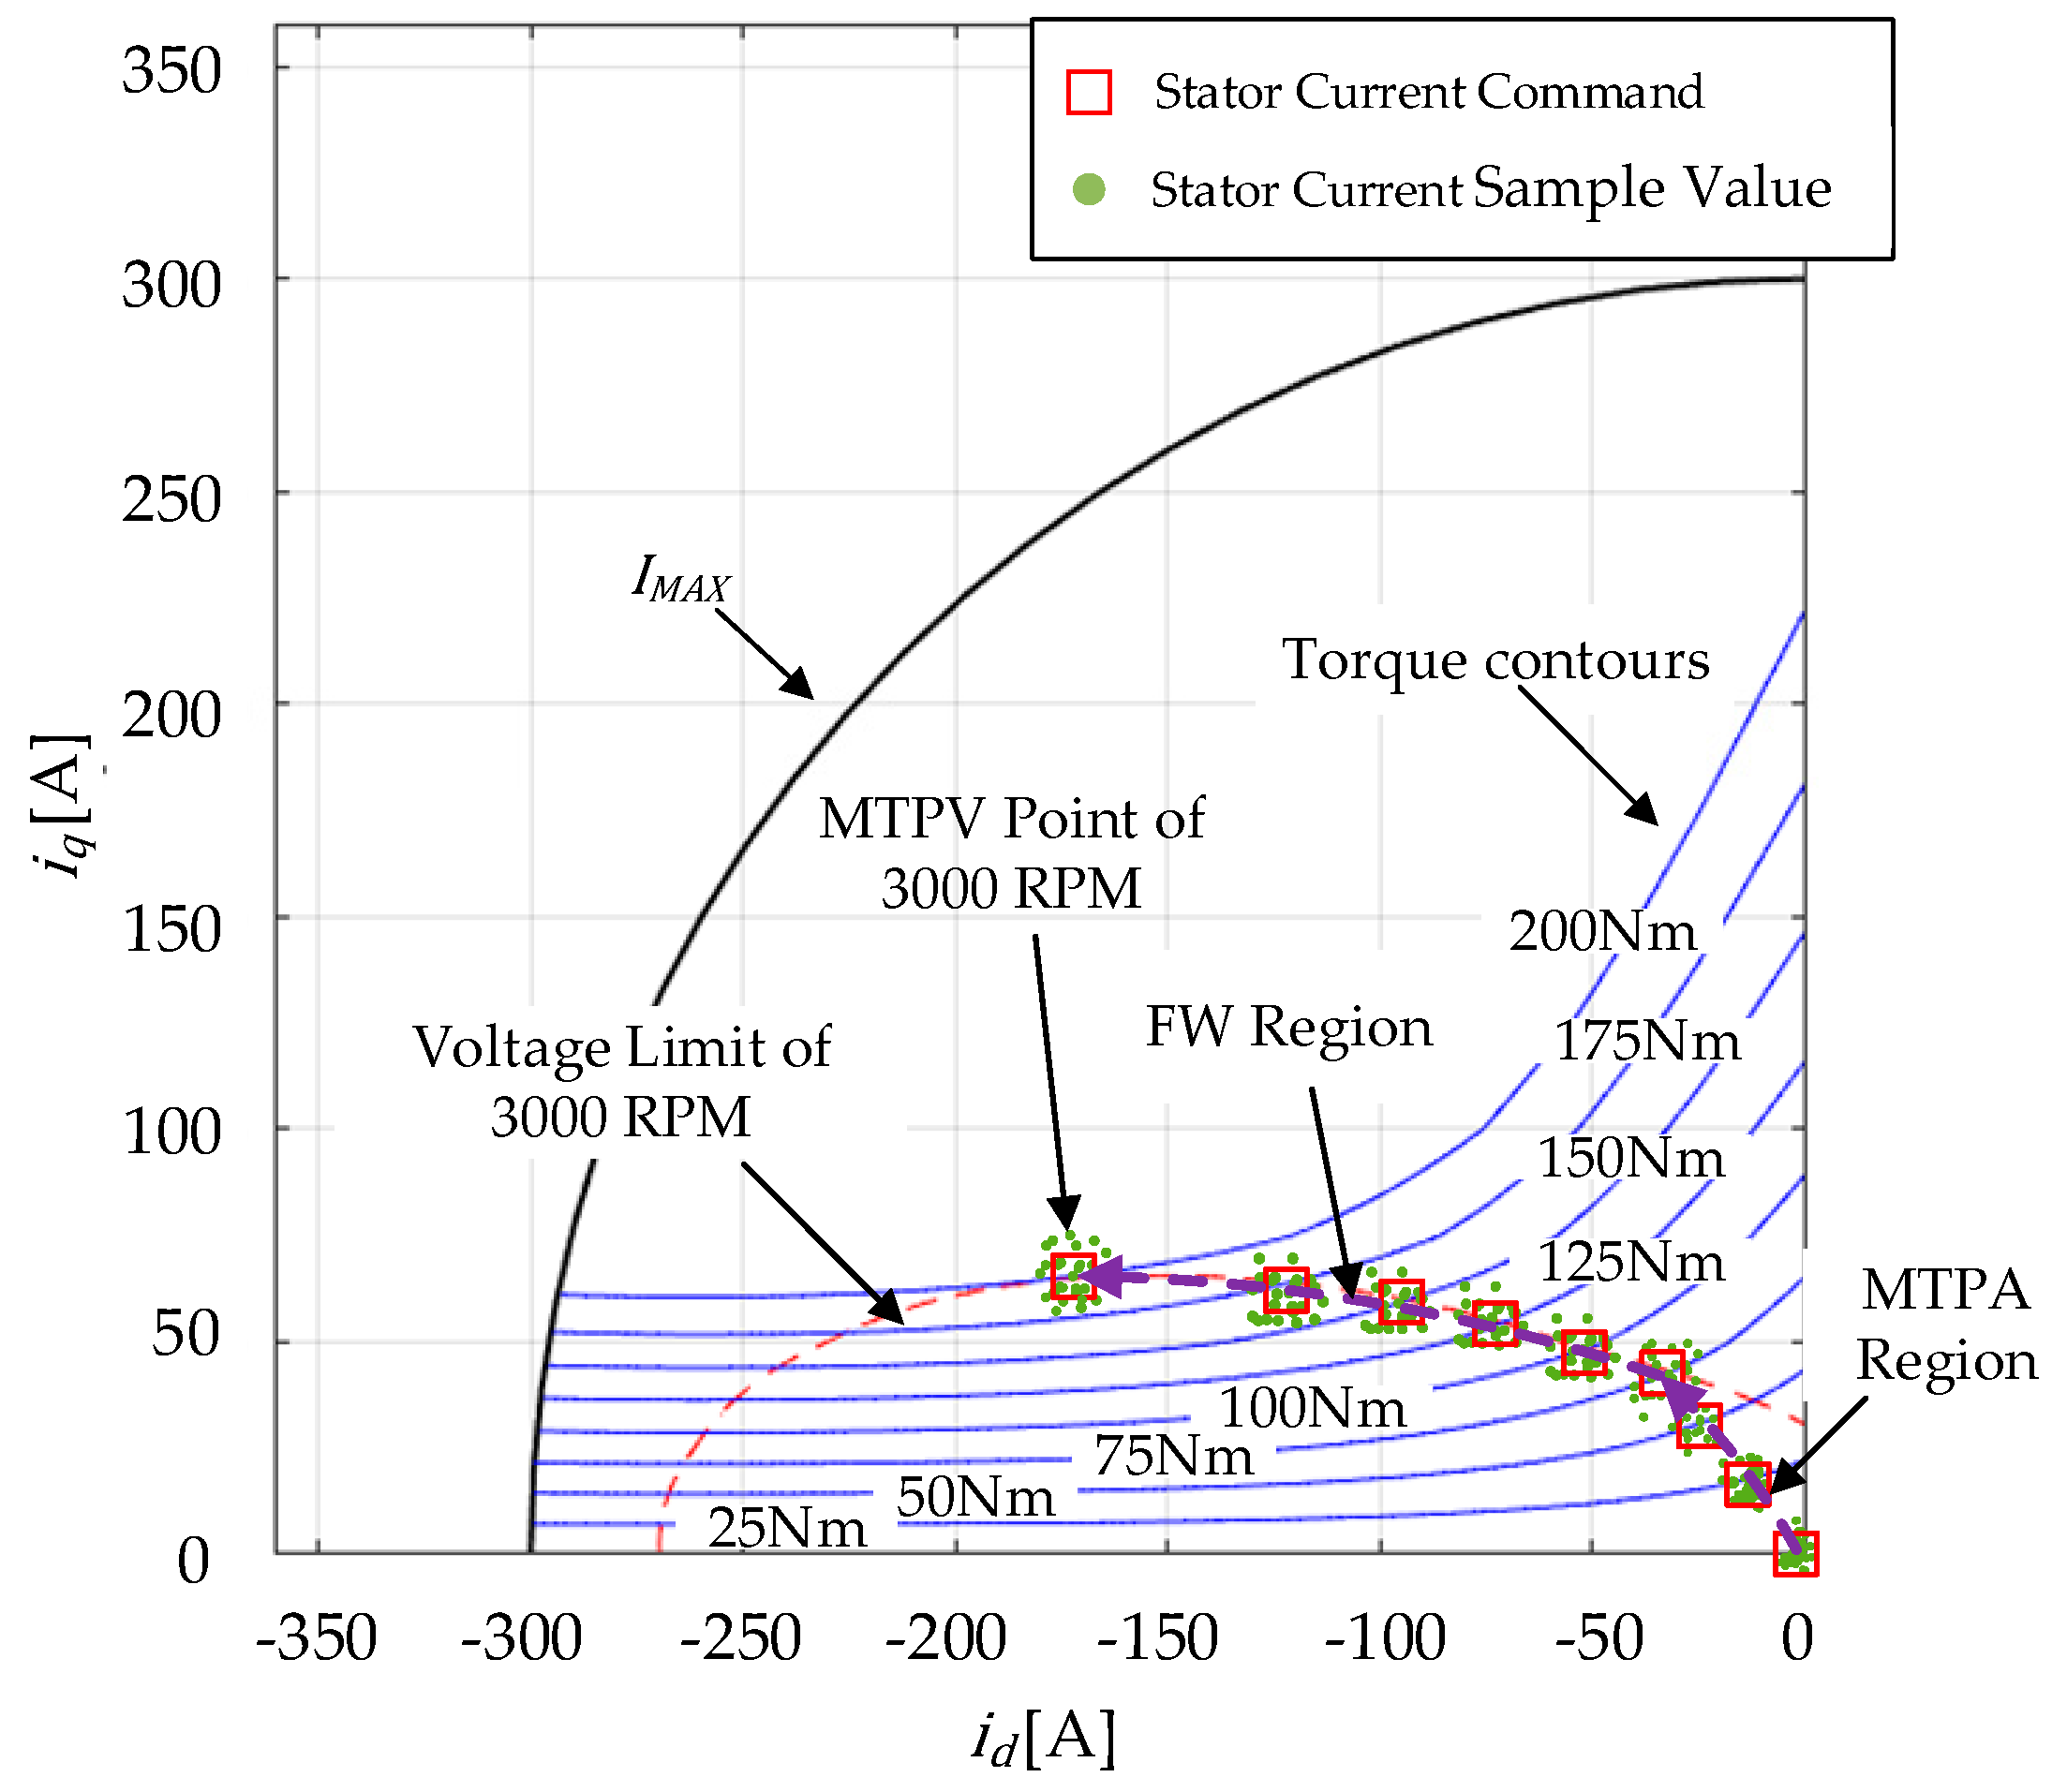
The experimental performance of the FW region is shown in Figure 16. The IPMSM under test was accelerated to 3000 RPM by the dynamometer and maintained at that speed. The torque command increased in increments of 25 Nm, from a value of 0 to 225 Nm. As can be seen in Figure 16, the torque response followed the torque command well in the range of torque command from 0 to 200 Nm. However, when the torque command was 225 Nm, the torque response failed to follow the command and only maintained a torque output of 200 Nm. This indicates that this torque command exceeded the maximum torque output capability of the motor for that speed condition. Due to the voltage-limiting condition, the motor output torque will not exceed the maximum torque for the speed condition even if the torque command continues to increase. A more intuitive trajectory of the current operating points is shown in Figure 17. The red squares indicate the current command, and the green dots indicate the actual motor current sampling values. The dashed red line shows the voltage-limit curve corresponding to 3000 RPM speed, and the purple line with an arrow shows the trajectory of the current operating point as the torque command increased. When the torque command was relatively small, the current operating point moved along the MTPA trajectory. As the torque command increased, the corresponding MTPA operating point exceeded the voltage constraint range. In such a case, the current operating points move along the FW trajectory (the intersection of the torque curve and the voltage-limit curve) until the maximum torque can be output from the IPMSM under this speed condition.
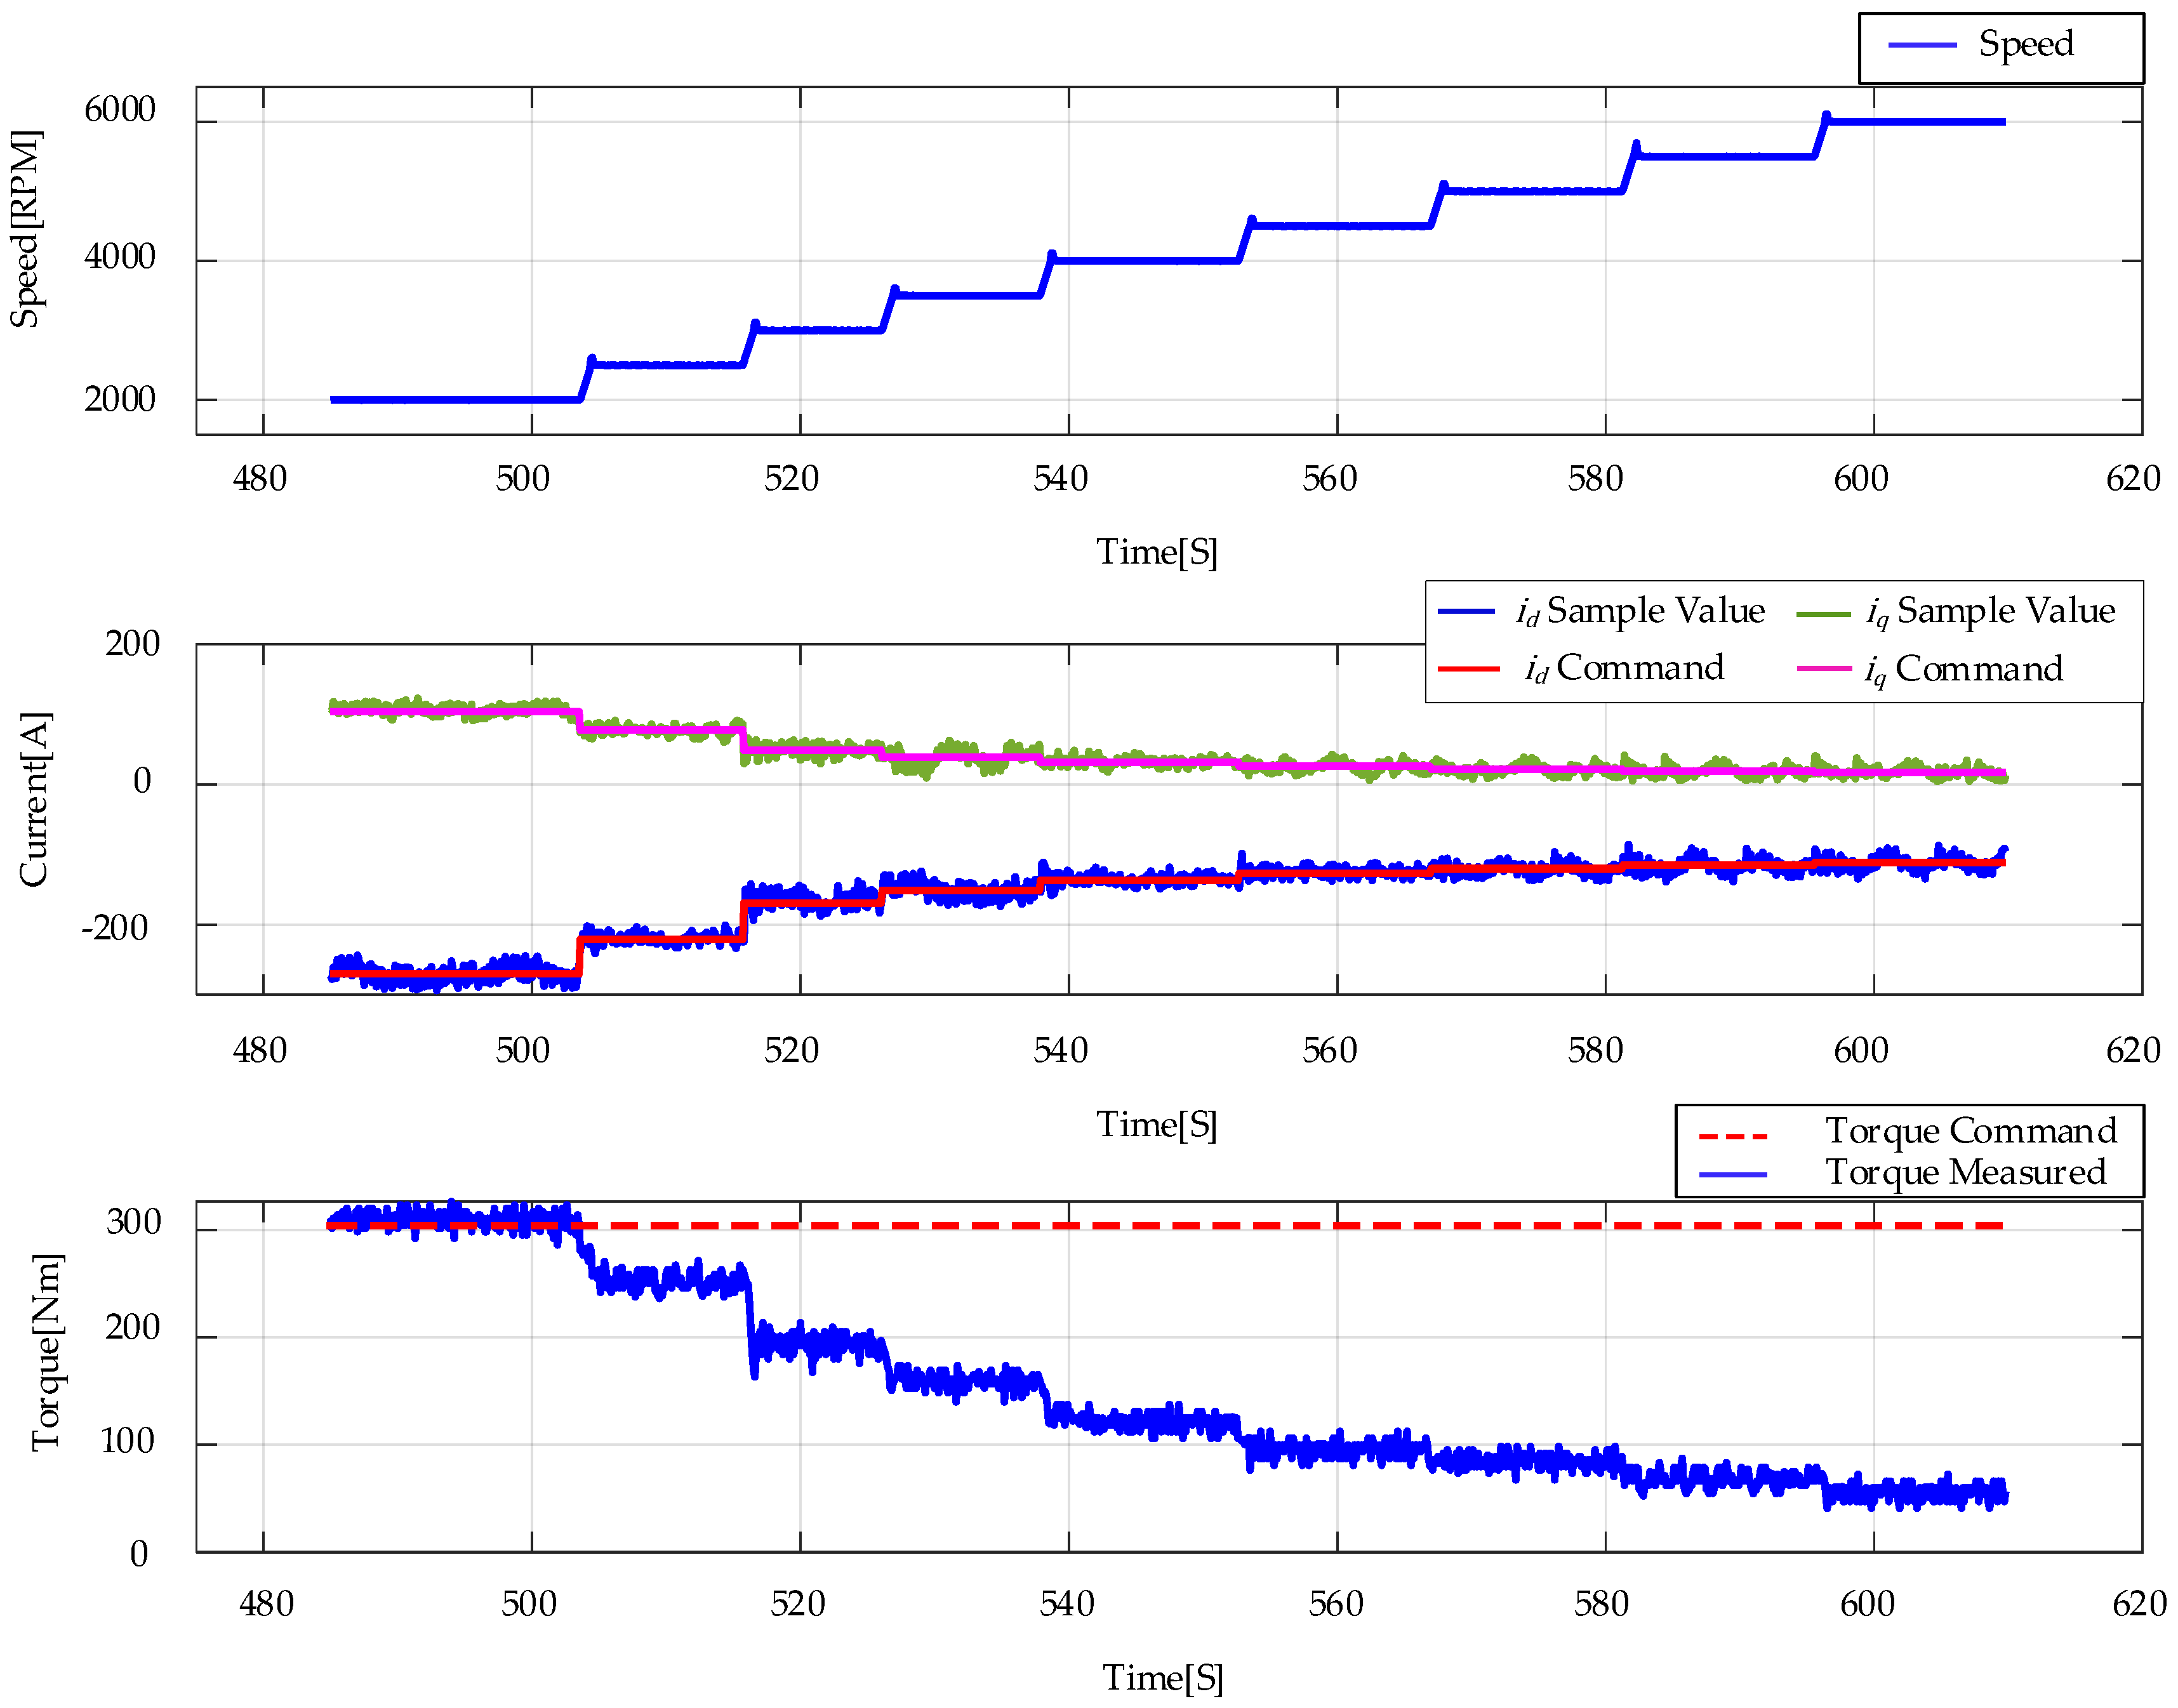
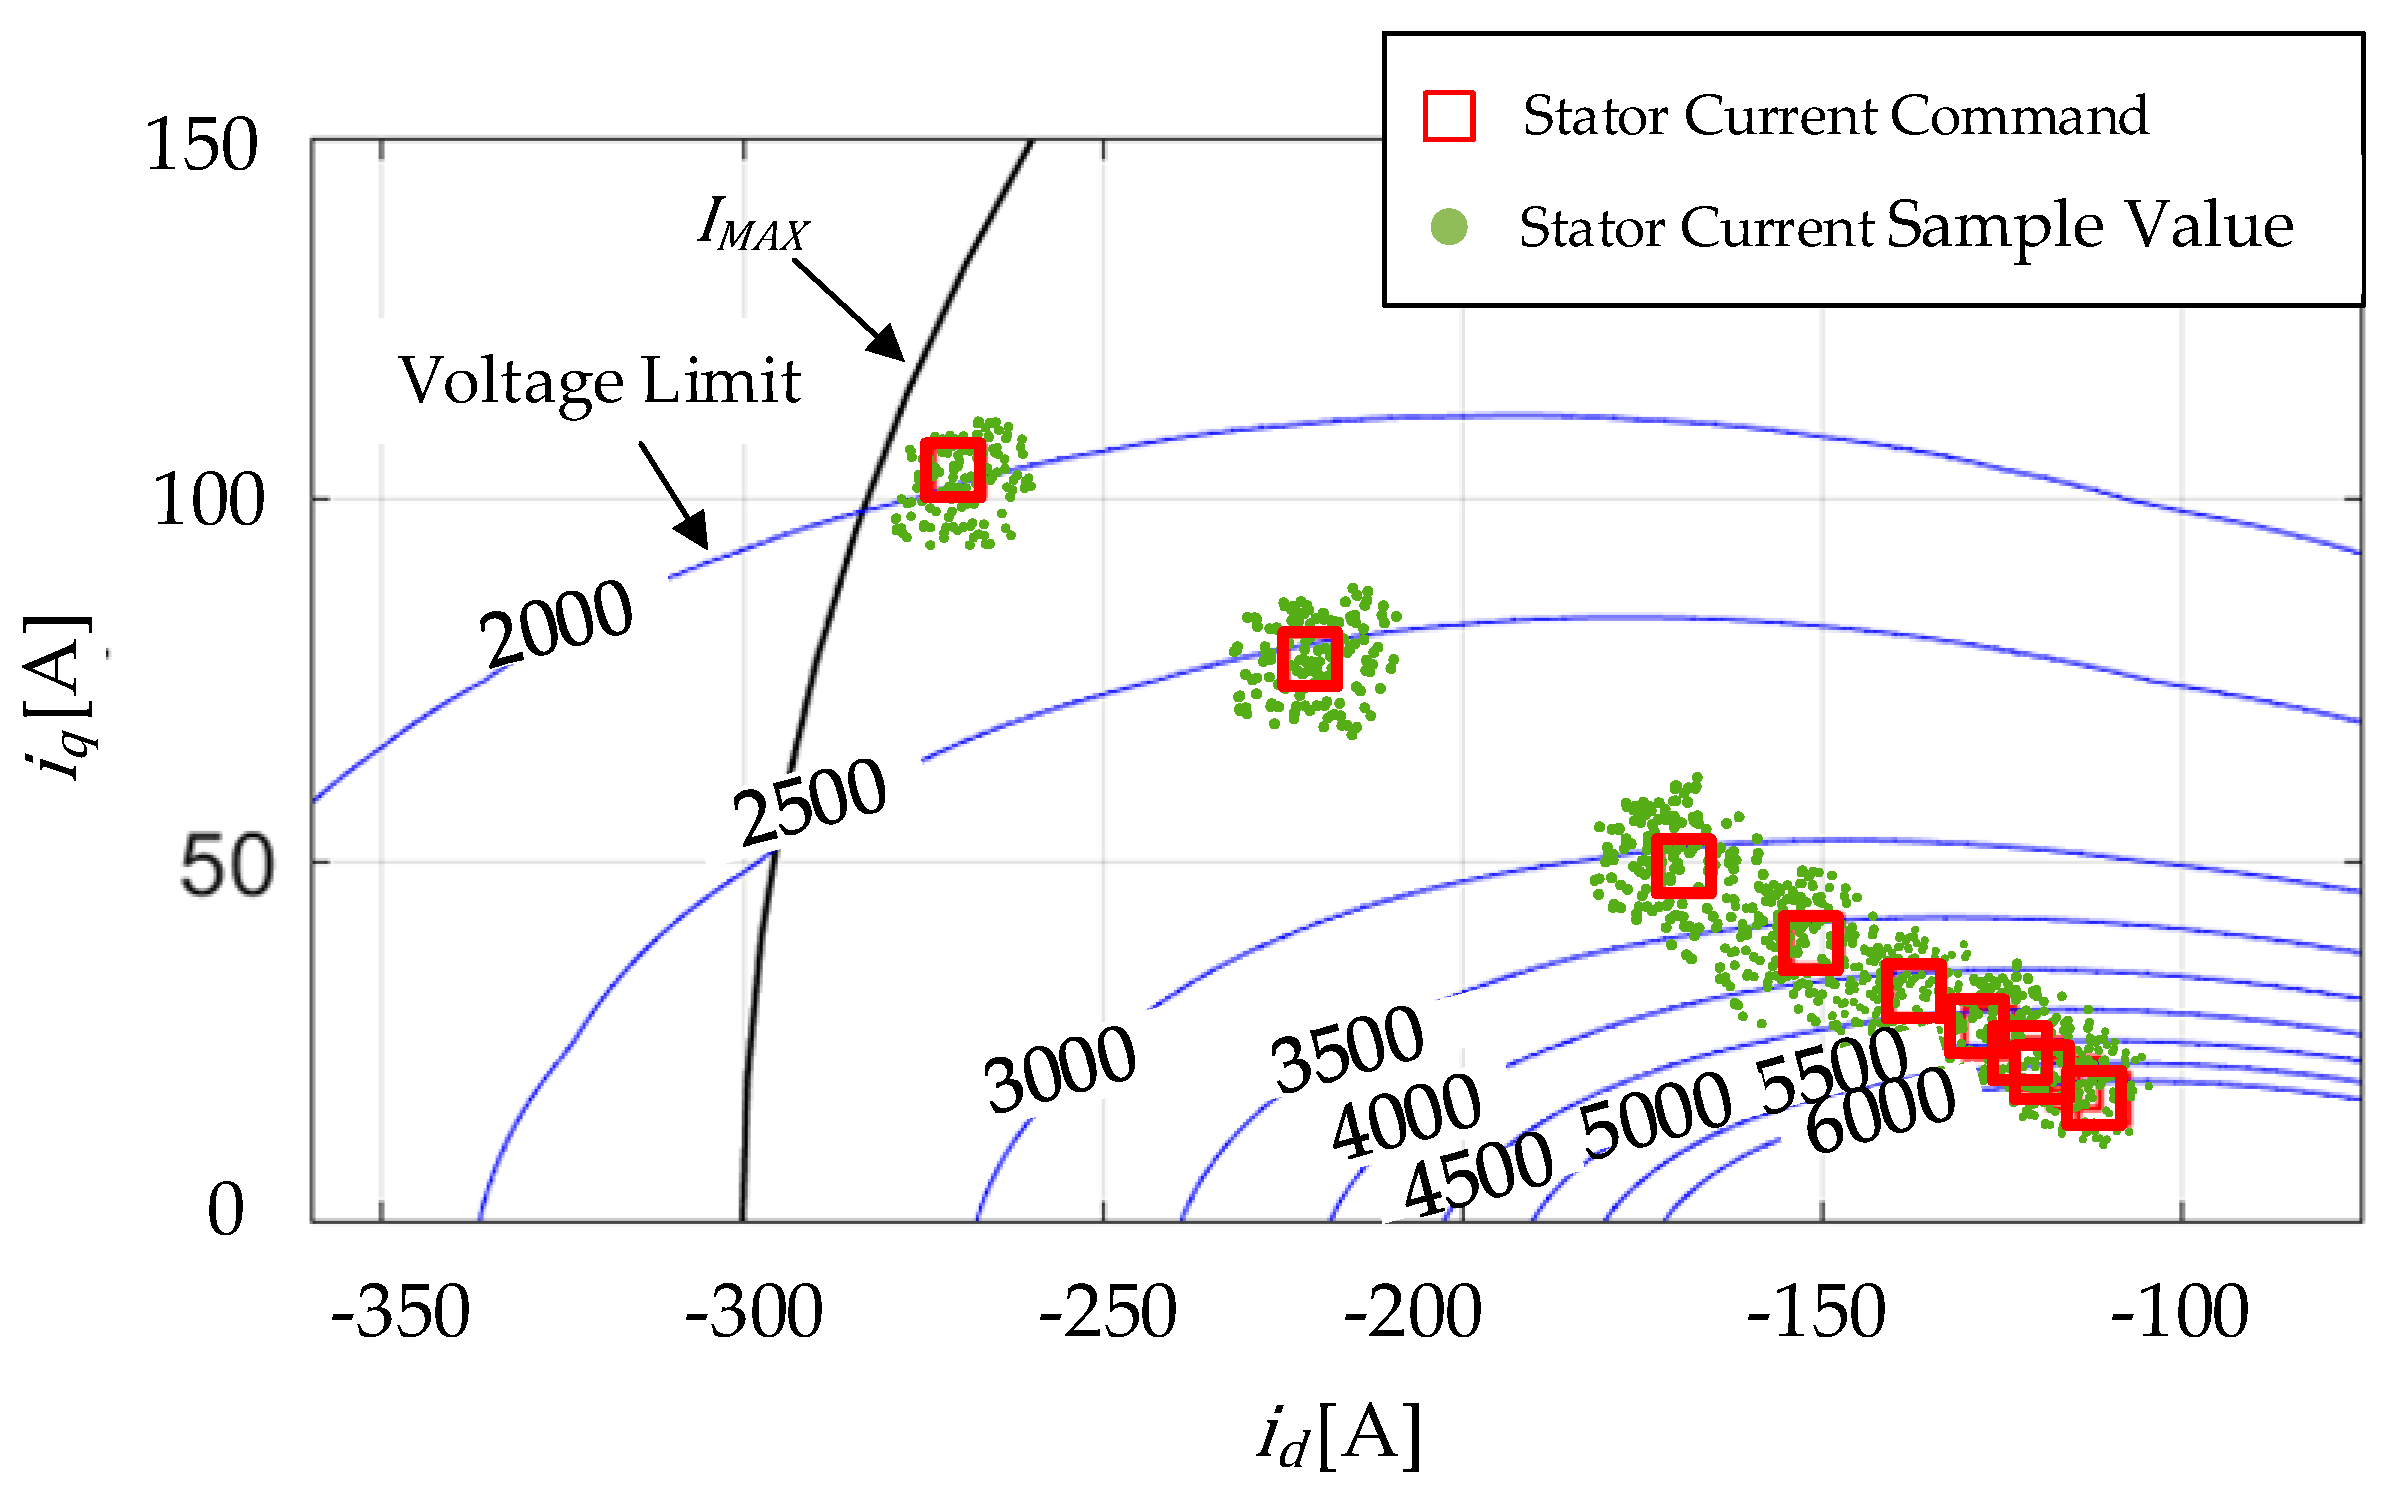
Figure 18 illustrates the experimental performance in the MTPV region. Firstly, the IPMSM under test was operating at 2000 RPM. At this speed, the maximum torque that can be delivered by the motor was 300 Nm. The motor speed was then gradually increased to the maximum speed in steps of 500 RPM. As motor speed increased, the current operating region gradually shrunk due to voltage-limit conditions, and the stator current amplitude gradually decreased. Although the torque command was still 300 Nm, the maximum torque that can be delivered by the IPMSM gradually decreased as the speed increased. The maximum output torque was approximately 250 Nm when the speed was 2500 RPM, 200 Nm when the speed was 2000 RPM, and 55 Nm when the IPMSM was running at the highest speed. The trajectory of the current operating point is summarized in Figure 19.
In Figure 19, the red squares indicate the current command calculated based on the improved MTPV criteria. The green dots indicate the actual motor current sampling values. As the motor speed increased, the d- and q-axis current commands moved along the MTPV current trajectory toward the characteristic current point, and the actual motor current followed the command well. It can be seen that there was a portion of the current operating point in Figure 19 that exceeded the voltage-limit curve. This was due to the fact that a 10% voltage margin was reserved for the current regulator when calculating the current command, taking into account the error-based control characteristics of the PI regulator. The voltage of operating points that exceeded the voltage limit curve was covered by the voltage margin.

5. Conclusions

This paper analyzed the MTPA and MTPV optimal criteria on the basis of the IPMSM nonlinear flux-linkage model, considering the influence of magnetic saturation and cross-coupling factors.
(1)
The nonlinear flux-linkage model of the IPMSM under test was established through the experimental test method. The principle, procedure, and precautions of the experimental test method were explained in detail.
(2)
The MTPA and MTPV optimal criteria were then analyzed by constructing and solving different optimal problems to obtain their closed-form solutions. The analysis results showed that the nonlinear current criteria can achieve a good matching effect with the actual current trajectory compared to the linear current criteria.
(3)
The current command LuT suitable for IPMSM control was constructed based on the improved MTPA and MTPV optimal criteria proposed in this paper. The optimal criteria proposed in this paper and their control performance were validated through experimental testing.
(4)
The experimental results showed that the maximum current error between the improved MTPA criteria and the experimental MTPA points was reduced to 3% in the MTPA region. Considering the current ripple inherent in FOC, this is an almost negligible current error. In contrast, the maximum current error of the linear MTPA criteria could be up to 12.5%. In the high-speed region, the performance difference between the nonlinear criteria and the linear current criteria was not significant due to the low influence of magnetic saturation and cross-coupling factors. Nevertheless, in the 2000 RPM to 2500 RPM speed range, the nonlinear standard achieved a notable torque enhancement effect, with a maximum torque increase of 23 Nm.
(5)
In addition to saturation and cross-coupling factors, the temperature factor can also influence the performance of IPMSMs. In this paper, the research was performed only on the saturation and cross-coupling factors. The temperature of the experiments was controlled by an external water-cooling equipment in order to ensure that all experiments were performed at approximately the same temperature, thus eliminating the effect of temperature on the errors in this research. In the subsequent stage of the investigation, it would be beneficial to introduce the effect of the temperature factor.

Author Contributions

Conceptualization, Y.F., H.M. and J.L.; formal analysis, Y.F.; data curation, Y.F. and G.Z.; methodology, Y.F. and H.M.; software, Y.F.; validation, Y.F. and G.Z.; resources, J.L.; writing—original draft preparation, Y.F.; writing—review and editing, H.M., G.Z. and J.L.; visualization, Y.F.; supervision, J.L.; project administration, J.L.; funding acquisition, J.L. All authors have read and agreed to the published version of the manuscript.

Funding

This research received no external funding.

Data Availability Statement

The original contributions presented in the study are included in the article, further inquiries can be directed to the corresponding author/s.

Conflicts of Interest

The authors declare no conflicts of interest.

Nomenclature

Variables and functions in the IPMSM model section:
TermsUnitsMeaning
R s ΩStator winding resistance
ψ P M WbPermanent-magnet flux-linkage
P n Number of pole pairs
L d ,   L q mHd- and q-axis inductance
i d ,   i q Ad- and q-axis stator current
ψ d ,   ψ q Wbd- and q-axis stator flux-linkage
v d ,   v q Vd- and q-axis stator voltage
ω e rad/sElectrical rotor speed
T e NmElectromagnetic torque
I m a x AMaximum stator current
V m a x VMaximum stator voltage
V D C VDC-link voltage of inverter
I c h ACharacteristic current
f i d ,   i q d-axis stator flux-linkage function
g i d ,   i q q-axis stator flux-linkage function
P Polynomial degree of flux-linkage fitting model
a ,   b Coefficients in the flux-linkage fitting model
Variables and functions in the improved MTPA and MTPV criteria analysis section:
TermsUnitsMeaning
f i Objective function in improved MTPA criteria analysis
F i Lagrange function in improved MTPA criteria analysis
α Lagrange multiplier in improved MTPA criteria analysis
f v Objective function in improved MTPV criteria analysis
F v Lagrange function in improved MTPV criteria analysis
β Lagrange multiplier in improved MTPV criteria analysis
v s VStator voltage
i s AStator current
ψ s WbStator flux-linkage
Variables in the experiments section:
TermsUnitsMeaning
i A ,   i B AA and B phase current
i d * ,   i q * Ad- and q-axis current command
v d * ,   v q * Vd- and q-axis voltage command
v α * ,   v β * Vα- and β-axis voltage command
ω m RPMMechanical rotor speed
θ e radElectrical rotor position angle
θ v radStator voltage vector angle
θ i radStator current vector angle
T 0 °CInitial ambient temperature
T s °CThe set and maintained experimental temperature
α T 1/°CTemperature coefficient of resistance
R 0 ΩStator winding resistance measured at the initial ambient temperature
θ S T E P °Stator current angle scanning step
i S T E P AStator current magnitude scanning step

References

  1. Inventory of U.S. Greenhouse Gas Emissions and Sinks: 1990–2022. Available online: https://www.epa.gov/system/files/documents/2024-04/us-ghg-inventory-2024-main-text_04-18-2024.pdf (accessed on 11 April 2024).
  2. Aiso, K.; Akatsu, K. Performance Comparison of High-Speed Motors for Electric Vehicle. World Electr. Veh. J. 2022, 13, 57. [Google Scholar] [CrossRef]
  3. Yang, Z.; Shang, F.; Brown, I.P.; Krishnamurthy, M. Comparative Study of Interior Permanent Magnet, Induction, and Switched Reluctance Motor Drives for EV and HEV Applications. IEEE Trans. Transp. Electrif. 2015, 1, 245–254. [Google Scholar] [CrossRef]
  4. Zhu, Z.Q.; Chu, W.Q.; Guan, Y. Quantitative comparison of electromagnetic performance of electrical machines for HEVs/EVs. CES Trans. Electr. Mach. Syst. 2017, 1, 37–47. [Google Scholar] [CrossRef]
  5. Krishnan, R. Permanent magnet synchronous and brushless DC motor drives; CRC press: 2017.
  6. Novotny, D.W.; Lipo, T.A. Vector Control and Dynamics of AC Drives; Oxford University Press: Oxford, UK, 1996; Volume 41. [Google Scholar]
  7. Morimoto, S.; Takeda, Y.; Hirasa, T.; Taniguchi, K. Expansion of operating limits for permanent magnet motor by current vector control considering inverter capacity. IEEE Trans. Ind. Appl. 1990, 26, 866–871. [Google Scholar] [CrossRef]
  8. Bianchini, C.; Bisceglie, G.; Torreggiani, A.; Davoli, M.; Macrelli, E.; Bellini, A.; Frigieri, M. Effects of the Magnetic Model of Interior Permanent Magnet Machine on MTPA, Flux Weakening and MTPV Evaluation. Machines 2023, 11, 77. [Google Scholar] [CrossRef]
  9. Tinazzi, F.; Bolognani, S.; Calligaro, S.; Kumar, P.; Petrella, R.; Zigliotto, M. Classification and review of MTPA algorithms for synchronous reluctance and interior permanent magnet motor drives. In Proceedings of the 2019 21st European Conference on Power Electronics and Applications (EPE’19 ECCE Europe), Genova, Italy, 3–5 September 2019; pp. P.1–P.10. [Google Scholar]
  10. Miguel-Espinar, C.; Heredero-Peris, D.; Villafafila-Robles, R.; Montesinos-Miracle, D. Review of Flux-Weakening Algorithms to Extend the Speed Range in Electric Vehicle Applications with Permanent Magnet Synchronous Machines. IEEE Access 2023, 11, 22961–22981. [Google Scholar] [CrossRef]
  11. Hackl, C.M.; Kullick, J.; Eldeeb, H.; Horlbeck, L. Analytical computation of the optimal reference currents for MTPC/MTPA, MTPV and MTPF operation of anisotropic synchronous machines considering stator resistance and mutual inductance. In Proceedings of the 2017 19th European Conference on Power Electronics and Applications (EPE’17 ECCE Europe), Warsaw, Poland, 11–14 September 2017; pp. P.1–P.10. [Google Scholar]
  12. Jahns, T.M.; Kliman, G.B.; Neumann, T.W. Interior Permanent-Magnet Synchronous Motors for Adjustable-Speed Drives. IEEE Trans. Ind. Appl. 1986; IA-22, 738–747. [Google Scholar] [CrossRef]
  13. Morimoto, S.; Sanada, M.; Takeda, Y. Wide-speed operation of interior permanent magnet synchronous motors with high-performance current regulator. IEEE Trans. Ind. Appl. 1994, 30, 920–926. [Google Scholar] [CrossRef]
  14. Xia, Z.; Nalakath, S.; Tarvirdilu-Asl, R.; Sun, Y.; Wiseman, J.; Emadi, A. Online Optimal Tracking Method for Interior Permanent Magnet Machines with Improved MTPA and MTPV in Whole Speed and Torque Ranges. IEEE Trans. Power Electron. 2020, 35, 9753–9769. [Google Scholar] [CrossRef]
  15. Xia, Z.; Filho, S.R.; Xiao, D.; Fang, G.; Sun, Y.; Wiseman, J.; Emadi, A. Computation-Efficient Online Optimal Tracking Method for Permanent Magnet Synchronous Machine Drives for MTPA and Flux-Weakening Operations. IEEE J. Emerg. Sel. Top. Power Electron. 2021, 9, 5341–5353. [Google Scholar] [CrossRef]
  16. Cheng, B.; Tesch, T.R. Torque Feedforward Control Technique for Permanent-Magnet Synchronous Motors. IEEE Trans. Ind. Electron. 2010, 57, 969–974. [Google Scholar] [CrossRef]
  17. Ge, H.; Miao, Y.; Bilgin, B.; Nahid-Mobarakeh, B.; Emadi, A. Speed Range Extended Maximum Torque Per Ampere Control for PM Drives Considering Inverter and Motor Nonlinearities. IEEE Trans. Power Electron. 2017, 32, 7151–7159. [Google Scholar] [CrossRef]
  18. Chen, Y.; Huang, X.; Wang, J.; Niu, F.; Zhang, J.; Fang, Y.; Wu, L. Improved Flux-Weakening Control of IPMSMs Based on Torque Feedforward Technique. IEEE Trans. Power Electron. 2018, 33, 10970–10978. [Google Scholar] [CrossRef]
  19. Dianov, A.; Tinazzi, F.; Calligaro, S.; Bolognani, S. Review and Classification of MTPA Control Algorithms for Synchronous Motors. IEEE Trans. Power Electron. 2022, 37, 3990–4007. [Google Scholar] [CrossRef]
  20. Hu, D.; Alsmadi, Y.; Xu, L. High fidelity nonlinear IPM modeling based on measured stator winding flux linkage. In Proceedings of the 2014 IEEE Energy Conversion Congress and Exposition (ECCE), 14–18 September 2014; pp. 3199–3205. [Google Scholar]
  21. Bolognani, S.; Petrella, R.; Prearo, A.; Sgarbossa, L. Automatic Tracking of MTPA Trajectory in IPM Motor Drives Based on AC Current Injection. IEEE Trans. Ind. Appl. 2011, 47, 105–114. [Google Scholar] [CrossRef]
  22. Kim, S.; Yoon, Y.; Sul, S.; Ide, K. Maximum Torque per Ampere (MTPA) Control of an IPM Machine Based on Signal Injection Considering Inductance Saturation. IEEE Trans. Power Electron. 2013, 28, 488–497. [Google Scholar] [CrossRef]
  23. Antonello, R.; Carraro, M.; Zigliotto, M. Maximum-Torque-Per-Ampere Operation of Anisotropic Synchronous Permanent-Magnet Motors Based on Extremum Seeking Control. IEEE Trans. Ind. Electron. 2014, 61, 5086–5093. [Google Scholar] [CrossRef]
  24. Liu, G.; Wang, J.; Zhao, W.; Chen, Q. A Novel MTPA Control Strategy for IPMSM Drives by Space Vector Signal Injection. IEEE Trans. Ind. Electron. 2017, 64, 9243–9252. [Google Scholar] [CrossRef]
  25. Lai, C.; Feng, G.; Mukherjee, K.; Tjong, J.; Kar, N.C. Maximum Torque Per Ampere Control for IPMSM Using Gradient Descent Algorithm Based on Measured Speed Harmonics. IEEE Trans. Ind. Inform. 2018, 14, 1424–1435. [Google Scholar] [CrossRef]
  26. Lai, C.; Feng, G.; Tjong, J.; Kar, N.C. Direct Calculation of Maximum-Torque-Per-Ampere Angle for Interior PMSM Control Using Measured Speed Harmonic. IEEE Trans. Power Electron. 2018, 33, 9744–9752. [Google Scholar] [CrossRef]
  27. Dianov, A.; Kim, Y.-K.; Lee, S.-J.; Lee, S.-T. Robust self-tuning MTPA algorithm for IPMSM drives. In Proceedings of the 2008 34th Annual Conference of IEEE Industrial Electronics, Orlando, FL, USA, 10–13 November 2008; pp. 1355–1360. [Google Scholar]
  28. Windisch, T.; Hofmann, W. A Novel Approach to MTPA Tracking Control of AC Drives in Vehicle Propulsion Systems. IEEE Trans. Veh. Technol. 2018, 67, 9294–9302. [Google Scholar] [CrossRef]
  29. Xia, J.; Guo, Y.; Li, Z.; Jatskevich, J.; Zhang, X. Step-Signal-Injection-Based Robust MTPA Operation Strategy for Interior Permanent Magnet Synchronous Machines. IEEE Trans. Energy Convers. 2019, 34, 2052–2061. [Google Scholar] [CrossRef]
  30. Dianov, A.; Anuchin, A. Adaptive Maximum Torque Per Ampere Control for IPMSM Drives with Load Varying Over Mechanical Revolution. IEEE J. Emerg. Sel. Top. Power Electron. 2020, 10, 3409–3417. [Google Scholar] [CrossRef]
  31. Kwon, Y.C.; Kim, S.; Sul, S.K. Voltage Feedback Current Control Scheme for Improved Transient Performance of Permanent Magnet Synchronous Machine Drives. IEEE Trans. Ind. Electron. 2012, 59, 3373–3382. [Google Scholar] [CrossRef]
  32. Jacob, J.; Bottesi, O.; Calligaro, S.; Petrella, R. Design Criteria for Flux-Weakening Control Bandwidth and Voltage Margin in IPMSM Drives Considering Transient Conditions. IEEE Trans. Ind. Appl. 2021, 57, 4884–4900. [Google Scholar] [CrossRef]
  33. Uddin, M.N.; Chy, M.M.I. Online Parameter-Estimation-Based Speed Control of PM AC Motor Drive in Flux-Weakening Region. IEEE Trans. Ind. Appl. 2008, 44, 1486–1494. [Google Scholar] [CrossRef]
  34. Wang, H.; Li, C.; Zhang, G.; Geng, Q.; Shi, T. Maximum Torque Per Ampere (MTPA) Control of IPMSM Systems Based on Controller Parameters Self-Modification. IEEE Trans. Veh. Technol. 2020, 69, 2613–2620. [Google Scholar] [CrossRef]
  35. Hoffmann, S.; Schrott, M.; Huber, T.; Kruse, T. Model-based Methods for the Calibration of Modern Internal Combustion Engines. MTZ Worldw. 2015, 76, 24–29. [Google Scholar] [CrossRef]
  36. Stumberger, B.; Stumberger, G.; Dolinar, D.; Hamler, A.; Trlep, M. Evaluation of saturation and cross-magnetization effects in interior permanent-magnet synchronous motor. IEEE Trans. Ind. Appl. 2003, 39, 1264–1271. [Google Scholar] [CrossRef]
  37. Li, S.; Han, D.; Sarlioglu, B. Modeling of Interior Permanent Magnet Machine Considering Saturation, Cross Coupling, Spatial Harmonics, and Temperature Effects. IEEE Trans. Transp. Electrif. 2017, 3, 682–693. [Google Scholar] [CrossRef]
  38. Chen, X.; Wang, J.; Griffo, A. A High-Fidelity and Computationally Efficient Electrothermally Coupled Model for Interior Permanent-Magnet Machines in Electric Vehicle Traction Applications. IEEE Trans. Transp. Electrif. 2015, 1, 336–347. [Google Scholar] [CrossRef]
  39. Chen, X.; Wang, J.; Sen, B.; Lazari, P.; Sun, T. A High-Fidelity and Computationally Efficient Model for Interior Permanent-Magnet Machines Considering the Magnetic Saturation, Spatial Harmonics, and Iron Loss Effect. IEEE Trans. Ind. Electron. 2015, 62, 4044–4055. [Google Scholar] [CrossRef]
  40. Hu, D.; Alsmadi, Y.M.; Xu, L. High-Fidelity Nonlinear IPM Modeling Based on Measured Stator Winding Flux Linkage. IEEE Trans. Ind. Appl. 2015, 51, 3012–3019. [Google Scholar] [CrossRef]
  41. Scheer, R.; Bergheim, Y.; Heintges, D.; Rahner, N.; Gries, R.; Andert, J. An FPGA-Based Real-Time Spatial Harmonics Model of a PMSM Considering Iron Losses and the Thermal Impact. IEEE Trans. Transp. Electrif. 2022, 8, 1289–1301. [Google Scholar] [CrossRef]
  42. Miao, Y.; Ge, H.; Preindl, M.; Ye, J.; Cheng, B.; Emadi, A. MTPA Fitting and Torque Estimation Technique Based on a New Flux-Linkage Model for Interior-Permanent-Magnet Synchronous Machines. IEEE Trans. Ind. Appl. 2017, 53, 5451–5460. [Google Scholar] [CrossRef]
  43. Calculation of Orthogonal Coordinate System DQ-Axis Parameters of Permanent Magnet Synchronous Motor (PMSM) Using Clarke & Park Transform with the Precision Power Analyzer and the Waveform Measuring Instrument’s High-speed Math Function. Available online: https://cdn.tmi.yokogawa.com/1/9729/files/WP_WT5000_dqCalc-01EN_r2.pdf (accessed on 5 December 2023).
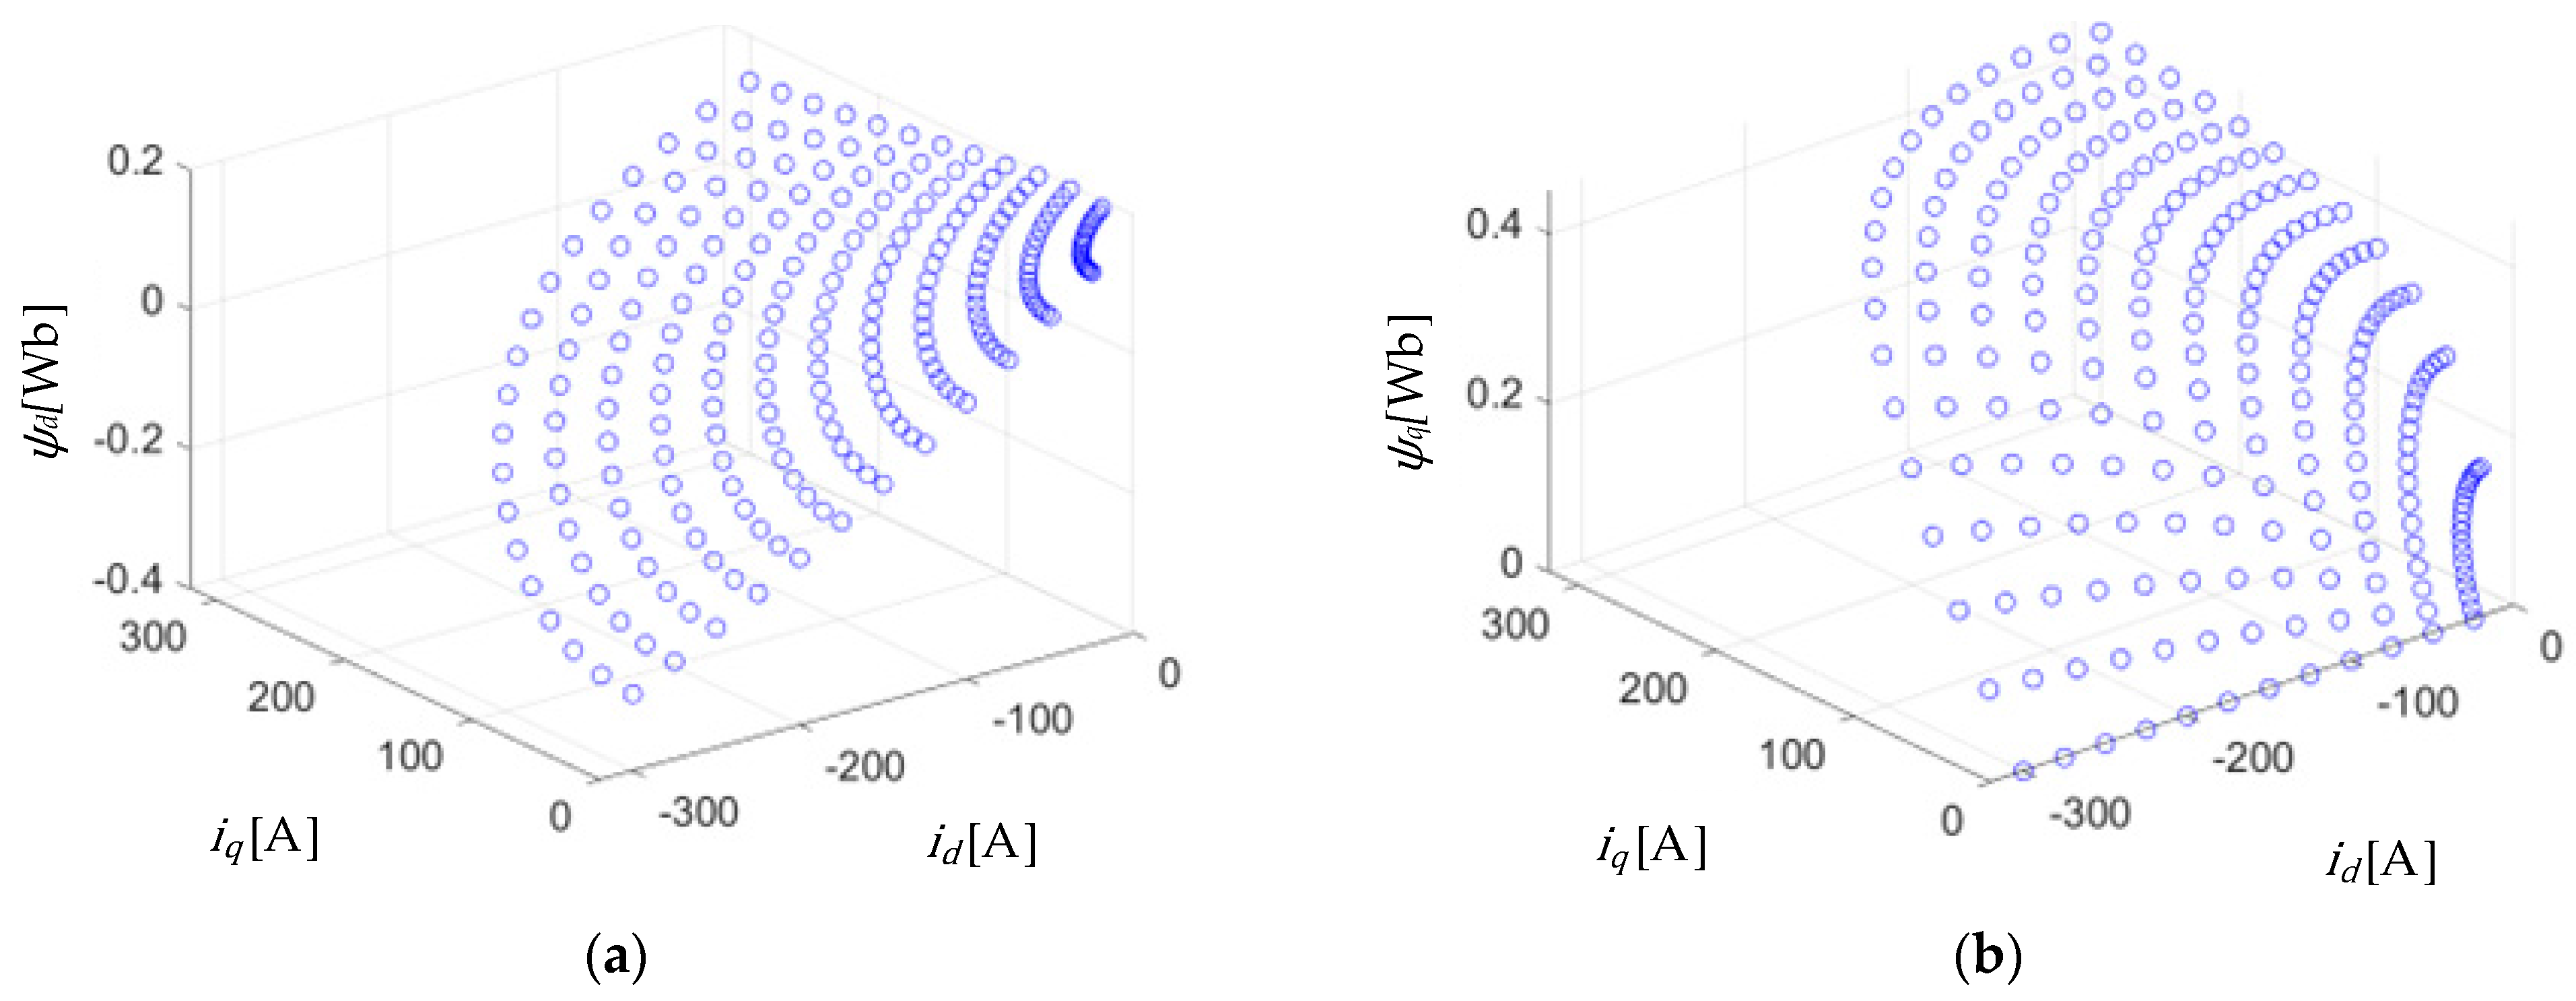
Figure 1. Measurement results of d- and q- axis flux-linkages. (a) Measurement result of d-axis flux-linkage. (b) Measurement result of q-axis flux-linkage.
Energies 17 03494 g001
Figure 2. MTPA trajectory and current errors of different MTPA criteria. (a) MTPA trajectory by linear and improved criteria, in comparison with experimental results. (b) Current errors for different MTPA criteria under current-limit conditions.
Energies 17 03494 g002
Figure 3. MTPV trajectory and torque errors of different MTPV criteria. (a) MTPV trajectory of different criteria in comparison to the experimental results. (b) Torque errors for different MTPV criteria under current-limit conditions. (c) Torque-speed characteristics of different criteria.
Energies 17 03494 g003
Figure 4. Current reference determined based on improved nonlinear MTPA and MTPV criteria. (a) d-axis current reference determined based on improved nonlinear MTPA and MTPV criteria and (b) q-axis current reference determined based on improved nonlinear MTPA and MTPV criteria.
Energies 17 03494 g004
Figure 5. Schematic diagram of the experimental platform.
Energies 17 03494 g005
Figure 6. Experimental platform.
Energies 17 03494 g006
Figure 7. The vector diagram of measured voltage.
Energies 17 03494 g007
Figure 8. Schematic diagram of test points on the d- and q-axis current plane.
Energies 17 03494 g008
Figure 9. Flowchart for the experimental identification of the flux-linkage model.
Energies 17 03494 g009
Figure 10. Flowchart for the experimental identification of the MTPA current trajectory.
Energies 17 03494 g010
Figure 11. Vector diagrams of MTPA current trajectory experimental identification. (a) Vector diagrams of approximate measurements. (b) Vector diagrams of precise measurements.
Energies 17 03494 g011
Figure 12. Flowchart of calibrating the FW current trajectories. (a) Flowchart of calibrating the FW critical speed and torque. (b) Flowchart of calibrating the FW points for a given speed.
Energies 17 03494 g012
Figure 13. Vector diagrams of FW current trajectory experimental identification. (a) Vector diagram of the FW critical speed. (b) Vector diagram of the FW current amplitude and angle sweep at a certain speed.
Energies 17 03494 g013
Figure 14. Experimental performance of the MTPA region.
Energies 17 03494 g014
Figure 15. Experimental MPTA current trajectory.
Energies 17 03494 g015
Figure 16. Experimental performance of the FW region.
Energies 17 03494 g016
Figure 17. Experimental FW current trajectory.
Energies 17 03494 g017
Figure 18. Experimental performance of the MTPV region.
Energies 17 03494 g018
Figure 19. Experimental MPTV current trajectory.
Energies 17 03494 g019
Table 1. Parameters of the IPMSM under study.
ParametersValue
Number of pole pairs4
Stator winding resistance0.058 Ω
Permanent-magnet flux-linkage0.182 Wb
d-axis inductance based on static measurements1.9 mH
q-axis inductance based on static measurements5 mH
Rated speed1500 RPM
Maximum speed6000 RPM
Rated torque400 Nm
Rated power60 kW
DC bus voltage500 V
Maximum current300 A
Table 2. Summary of experimental equipment.
Experimental EquipmentVendor
IPMSM under testA 60 kW IPMSM with the parameters shown in Table 1
Dynamometer A 200 kW AC asynchronous motor with a control system developed by Wuxi Langdi Measurement and Control Technology Co., Ltd. (Wuxi, China).
Inverter/motor controller A 100 kW inverter/motor controller developed by VEPCO Technologies Inc. (Los Angeles, CA, USA).
DC Power A 1000 V/600 A battery simulator provided by Shandong Wocen Power Equipment Co., Ltd. (Jinan, China).
CAN CommunicationCANape, developed by Vector Informatik GmbH (Stuttgart, Germany).
Power AnalyzerYokogawa WT5000 Precision Power Analyzer (Tokyo, Japan)
Cooling SystemWater-cooling system developed by Wuxi Langdi Measurement and Control Technology Co., Ltd. (Wuxi, China).
Torque SensorT40B from Hottinger Brüel and Kjaer GmbH (Darmstadt, Germany)
Disclaimer/Publisher’s Note: The statements, opinions and data contained in all publications are solely those of the individual author(s) and contributor(s) and not of MDPI and/or the editor(s). MDPI and/or the editor(s) disclaim responsibility for any injury to people or property resulting from any ideas, methods, instructions or products referred to in the content.