1. Introduction
It is widely recognized that the internal combustion engine holds a pivotal position in the automotive industry [
1,
2]. Serving as a power source, it efficiently converts the thermal energy generated by the combustion of fossil fuels into mechanical energy to meet various transportation needs [
3]. Nevertheless, in contradiction to this energy conversion process, the combustion of fossil fuels inevitably leads to the production of pollutant emissions such as CO, NO
X, HC, and PM, which have a certain degree of negative consequences on the ecological environment [
4,
5]. In pursuit of effectively diminishing the negative consequences and actively aligning with the energy conservation and environmental protection policies enacted by various national governments [
6,
7], exploring alternative fuels to decrease dependency on traditional fossil fuels has become a historical inevitability [
8].
In the realm of energy, natural gas is commonly regarded as an ideal substitute for traditional fossil fuels (petrol, diesel) because of its numerous benefits, including affordability, ample reserves, and environmentally friendly combustion [
9,
10]. However, a distinguishing drawback of natural gas lies in its constrained energy density [
11], which inherently leads to a relatively slower rate of mixing with air than conventional fossil fuels. Especially in direct injection gas engines, the slower mixing rates and shorter mixing duration frequently result in suboptimal gas mixing within the cylinder precisely at the ignition [
12], consequently lowering the engine’s combustion efficiency.
To tackle this challenge, researchers worldwide have investigated the mixing characteristics of direct-injection gas engines based on factors such as the shape of the combustion chamber, the type of nozzle, and the injection position. By modifying the structure of the piston head, the effect of combustion chamber geometry on gas engine mixture formation was further explored by B. Yadollahi et al. [
13]. The study’s findings demonstrated that combustion chambers equipped with narrow-bowl piston heads yielded a more homogeneous air–fuel mixture and increased the production of the combustible mixture in proximity to the spark plug position. In the study conducted by Karri Keskinen et al. [
14], the correlation between the mixture formation process and nozzle type in direct-injection gas engines was analyzed. It was found that the nozzle structure greatly influenced the in-cylinder mixture formation, and the optimum mixing performance could be obtained by using a hollow conical nozzle. Jinwen You et al. [
15] investigated the impact of various injection positions on the homogeneity of gas blending within the cylinder at the ignition. The results of their analyses revealed that the gas mixing uniformity was further improved by adopting an earlier injection timing and selecting a vertically downward-facing gas injection. Although the scope of research on mixing characteristics has been enriched by the above research methods, there are still certain limitations in effectively improving gas mixing uniformity. This arises because all the aforementioned studies, which explore the variation rules of gas mixing uniformity by altering the structure of relevant components, lack a theoretical discussion of the intrinsic factors significantly affecting gas mixing uniformity. Additionally, modifications to the structure of relevant components also result in marked elevations in the experimental time cost.
Given the intimate association between the mixture formation process and turbulent kinetic energy (TKE) [
16], this nexus is adopted as a point of departure for delving into the gas mixing laws, which can provide a reference to improve the gas mixing uniformity at the ignition moment. Typically, heightened TKE tends to facilitate the enhancement of gas mixing velocity [
17], consequently exerting a positive influence on improving the uniformity of gas mixing [
18,
19]. With the objective of exploring this specific influence, the inlet pressure is designated as the experimental variable to delineate the impact of TKE on the gas mixing uniformity. Furthermore, with the proposal of the theoretical concept of the core mixing stage, an analysis was conducted to dissect the numerical variations rules between the mean turbulent kinetic energy (MTKE) and the best mixture concentration region (BMCR) proportion under specific injection timing conditions.
2. Model Validation and Scheme Design
2.1. CFD Model
The four-valve engine model was utilized in this experiment [
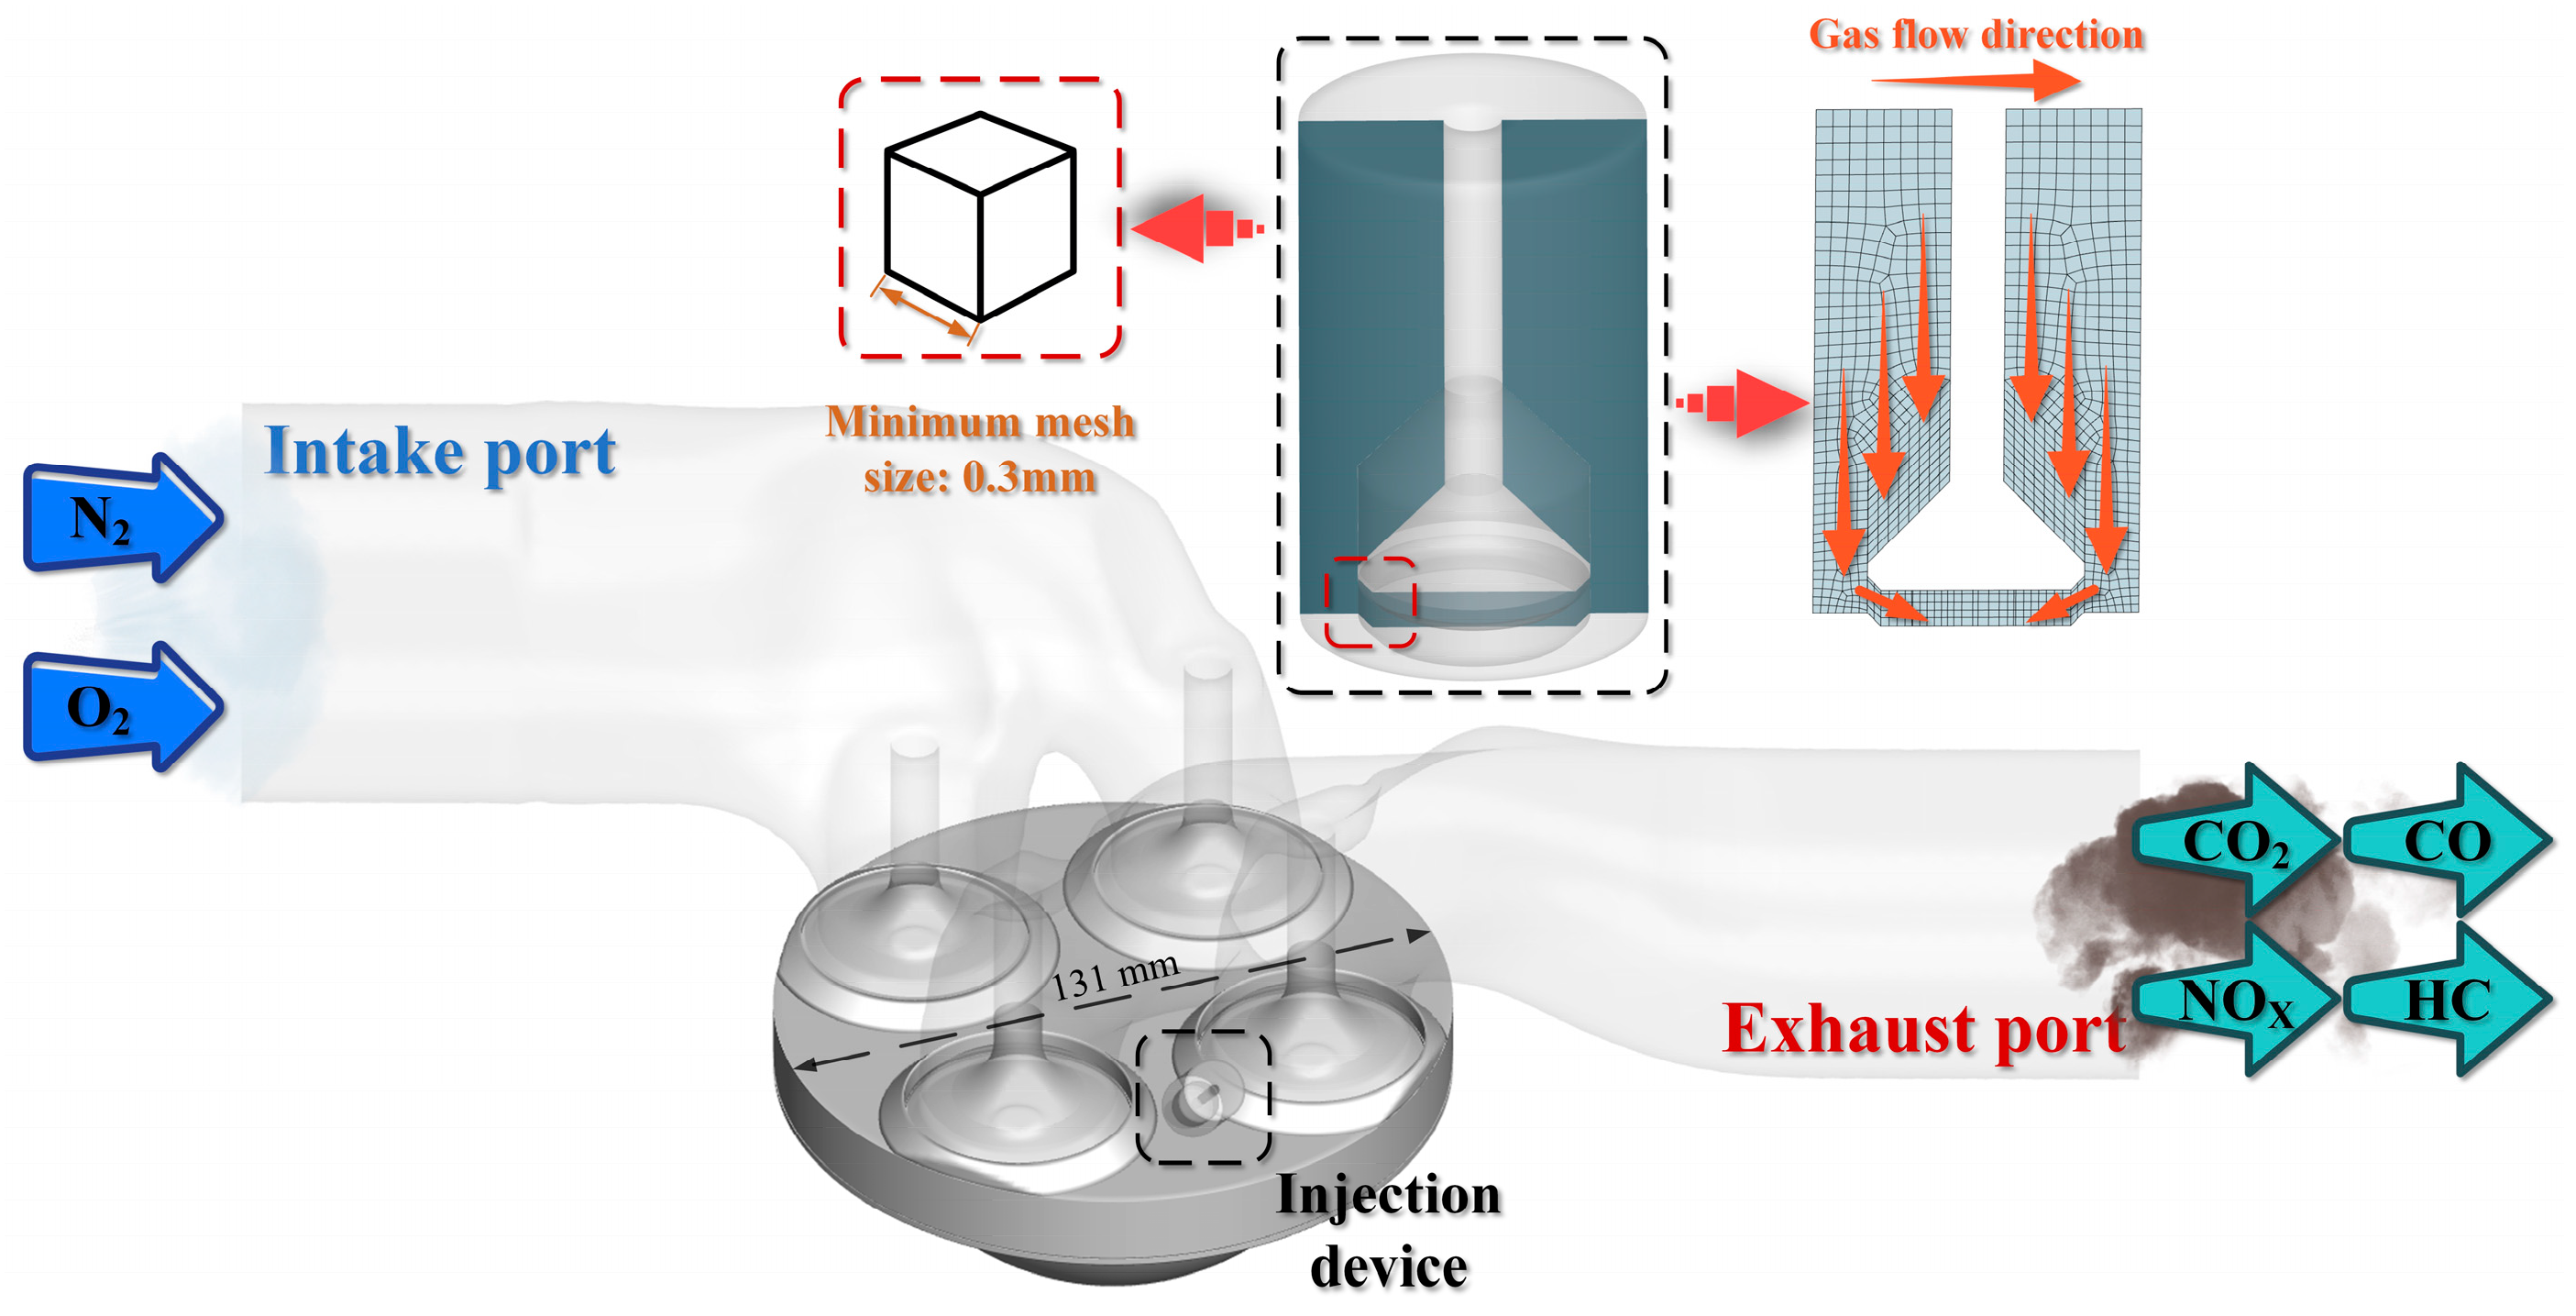
20]. The main parameters of the engine and the computational fluid dynamics (CFD) model are depicted in
Table 1 and
Figure 1, respectively. The CFD model in
Figure 1 corresponds to the intake valve opening timing (30° BTDC), as indicated in
Table 1, at which time the exhaust valve was in an open state. Considering that the intake flow between the two intake valves often exhibits higher levels of TKE due to their interaction [
21], the gas injection device was chosen to be installed on the cylinder head midway between the two exhaust valves at an angle of 45° to the horizontal. In this injection method, the gas jet could fully contact the intersecting intake flows, enhancing the mixing efficiency between the gas and air. The adopted injection device featured a pull-open valve with a valve diameter of 7 mm and a lift of 1.5 mm. The corresponding mesh division can be seen in
Figure 1. Faster jet velocities and improved mixing efficiency are typically achieved by this type of valve opening [
20,
22]. The transition times for both valve opening and closing were set to 1 ms.
2.2. Model Validation
The mesh-independence verification of the CFD model has been completed in previous work [
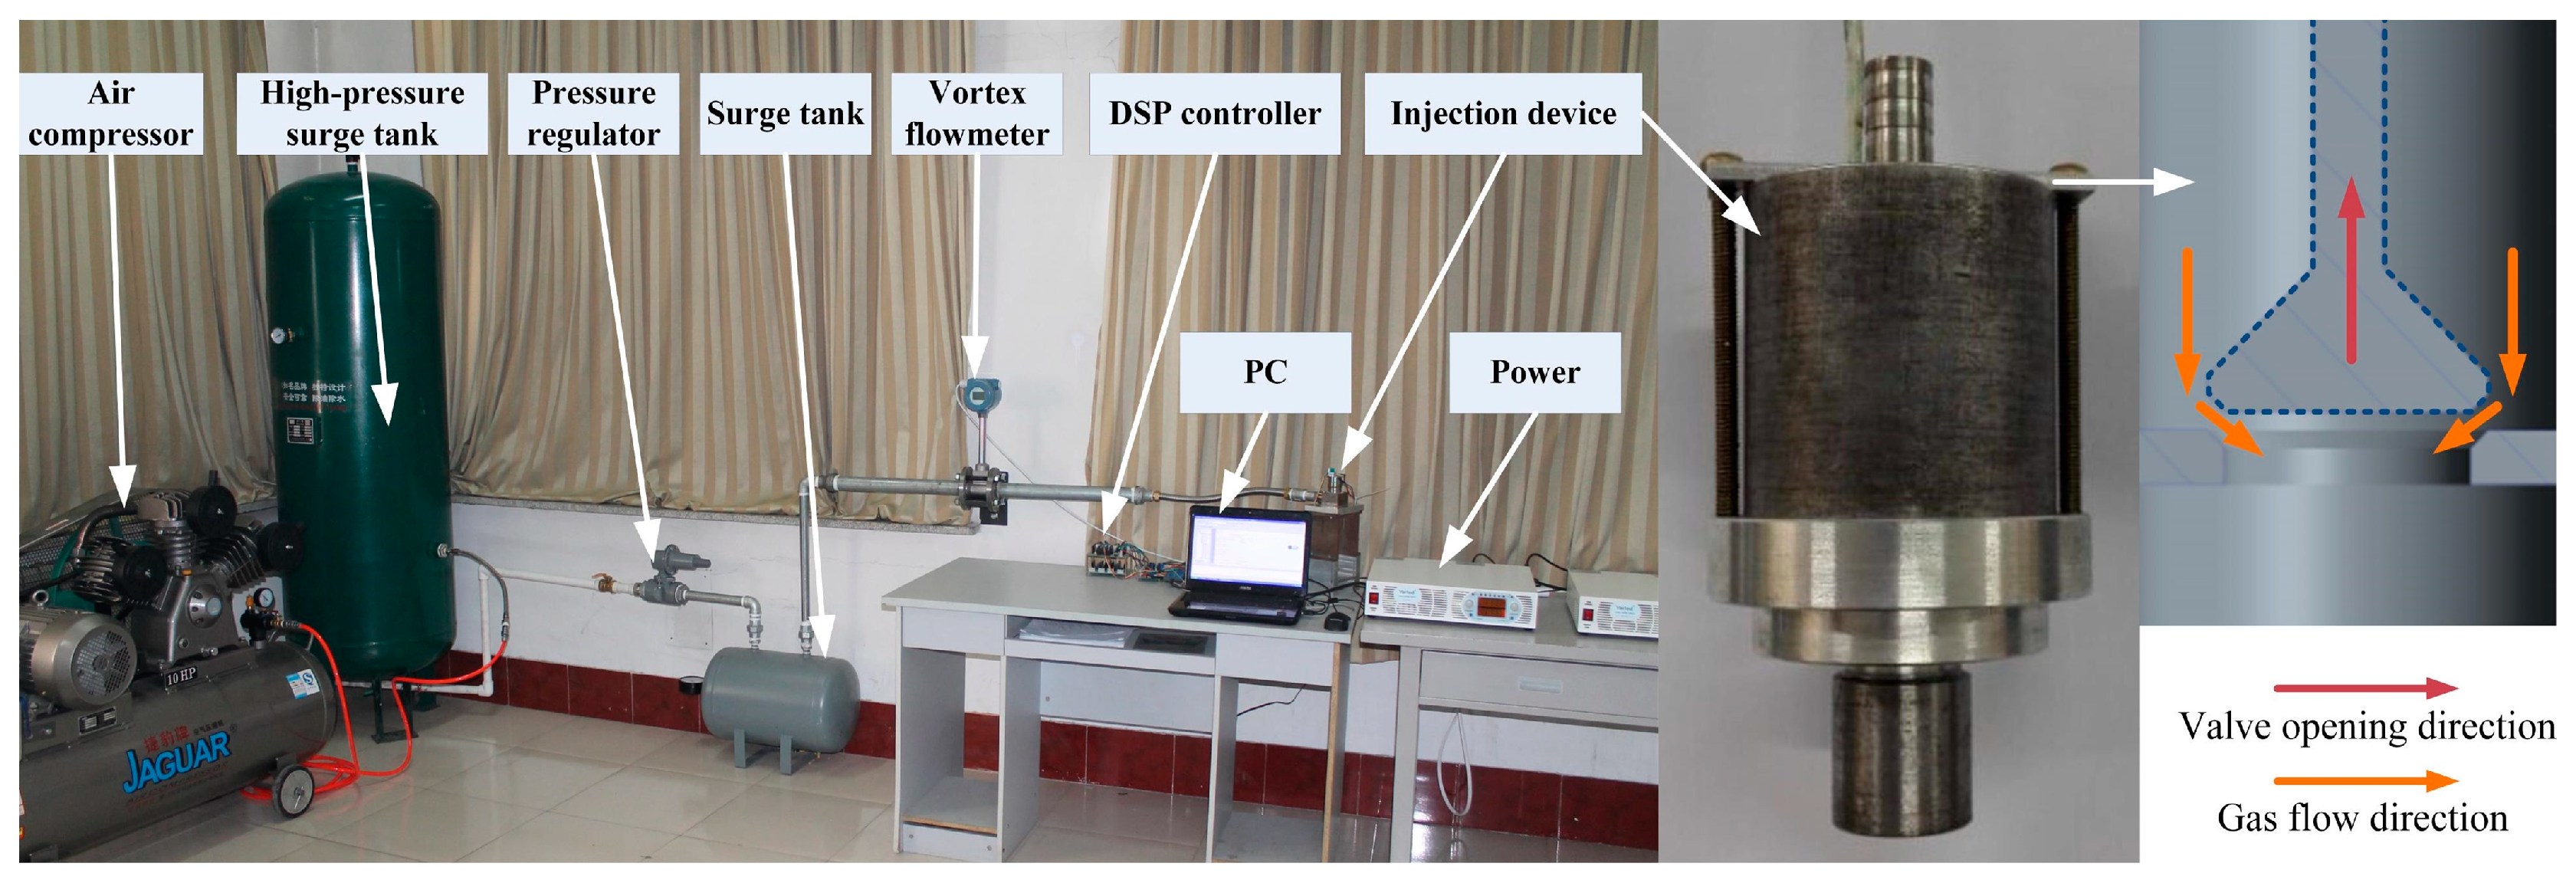
23]. Here, the transient flow rate of this model was verified to ensure that the experimental results met the accuracy requirements, and the experimental platform is shown in
Figure 2. In the figure, the digital signal processor (DSP) served as the primary device governing the injection duration. The pressure regulator was responsible for adjusting the pressure from the upstream high-pressure surge tank to the injection pressure required for the experiment, with its downstream connected to the surge tank. The main function of the surge tank was to provide a constant and stable injection pressure to the injector. Only under stable injection pressure conditions could the cumulative flow rate measured by the vortex flowmeter be regarded as a valid experimental data sample.
Limited by the spatial distance between the flowmeter and the injection apparatus, an accurate determination of the transient flow during a single operational cycle of the injection device was unachievable. Therefore, opting to dynamically inject for a period of time through the injection apparatus to accumulate flow, followed by a subsequent conversion, obtained the transient flow rate during a single operational cycle. In consideration of experimental safety, air was chosen as the medium for the experiments instead of natural gas. Similarly, the medium in the CFD simulation was also set to air to ensure the reliability of the validation results. To exclude the effect of cumulative injection time on the experimental outcomes, comparisons were made between the results at 5 min and 12 h of dynamic injection. The gas injection pressures were set at 1.0, 1.2, 1.4, 1.6, 1.8, and 2.0 bar. The injection durations were set at 40, 60, and 120 ms, corresponding to engine speeds of 3000, 2000, and 1000 rpm, respectively. The injection pulse width was set to one-quarter of the injection duration.
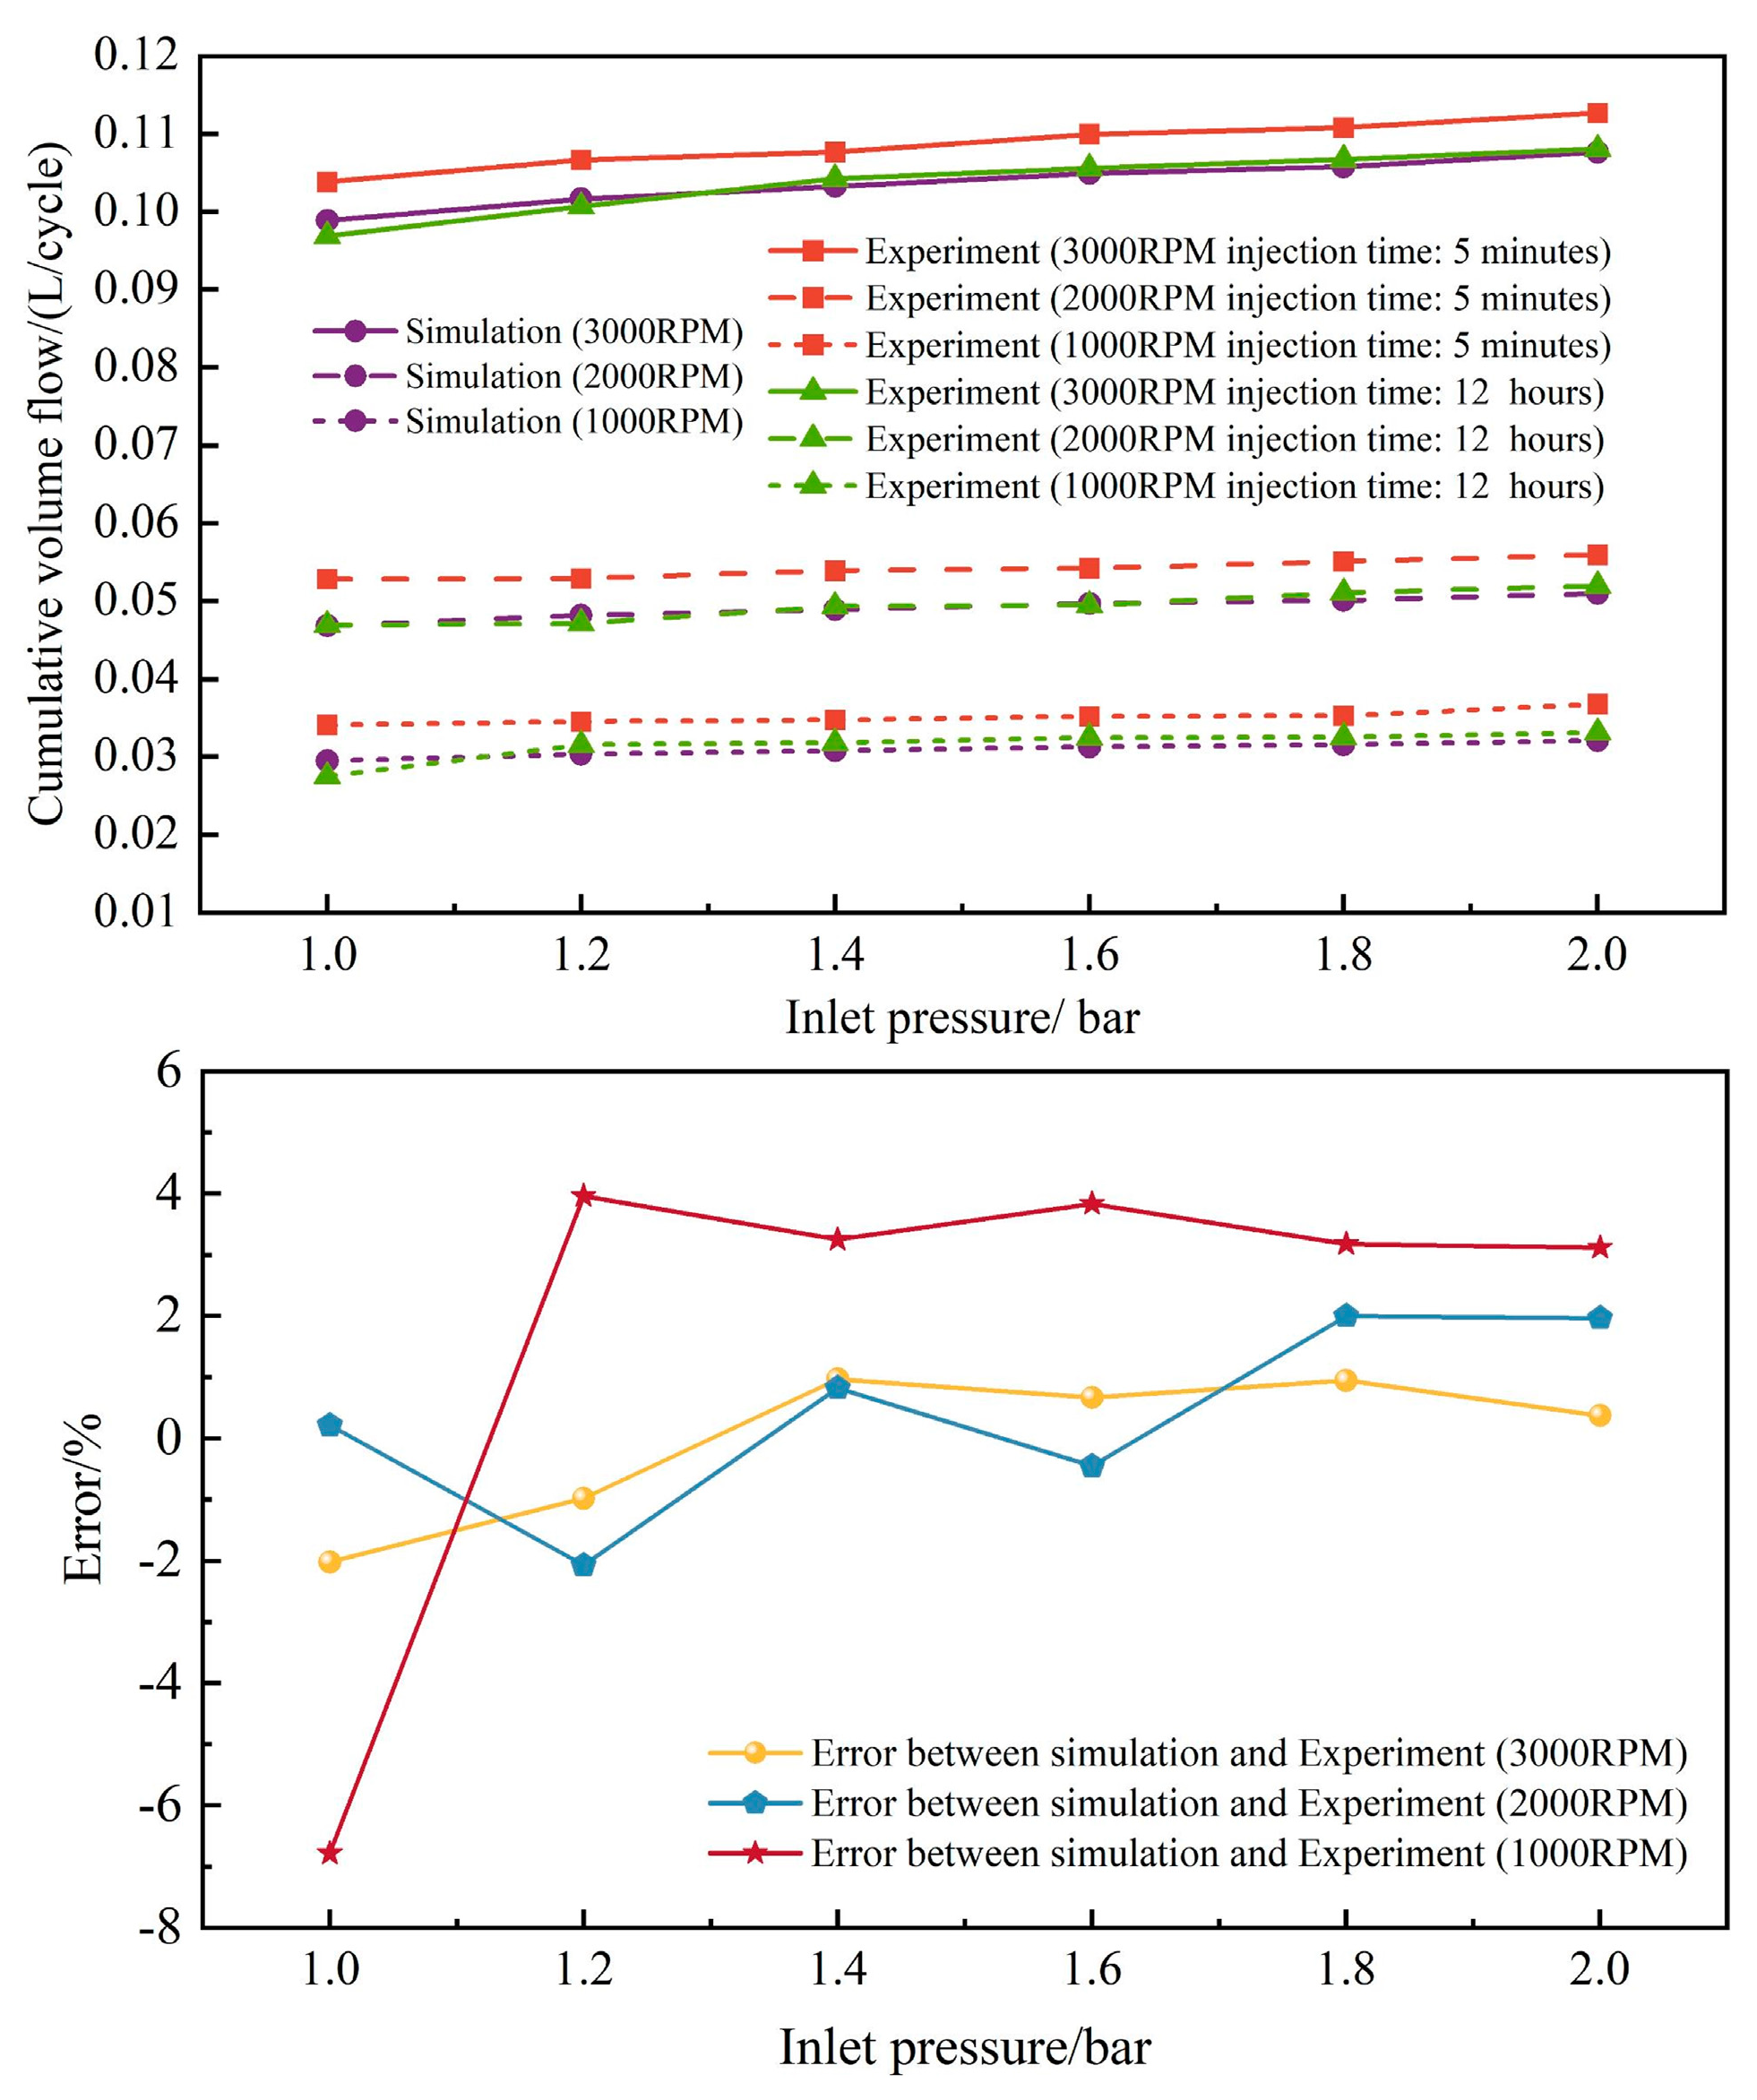
The comparison of experimental and CFD numerical results under a single working cycle is shown in
Figure 3. It was determined that the transient flow rate achieved from the long-term conversion (lasting 12 h) deviated less from the CFD numerical results than that obtained from the short-term conversion (lasting 5 min), aligning well with the expectations. It was necessary to explain that one of the reasons for the significant error observed under the 5 min dynamic injection condition was that within the short injection duration, the impact of upstream pressure, data collection, and other random factors on the experimental results was more pronounced. Another noteworthy reason was that during the 5 min dynamic injection period, the wear on the injection device was relatively unstable, causing fluctuations in the effective lift of the valve, which, in turn, affected the experimental results. By analyzing the errors between the experimental and CFD results for single operating cycles at various pressures shown in
Figure 3, it was observed that the upstream pressure had minimal impact on the errors. The maximum error occurred at 1000 rpm and an inlet pressure of 1.0 bar. In conclusion, based on the transient flow rates measured during individual cycles, the flow characteristics of the transient injection simulation model for the gas fuel injector were validated.
2.3. Scheme Design
Five different intake pressures of 1.0 bar, 1.5 bar, 2.0 bar, 2.5 bar, and 3.0 bar were selected as experimental variables to investigate the influence of TKE on the gas mixing uniformity. Given the generally higher levels of TKE during the intake valve opening phase, an earlier start of injection (SOI) could be employed to fully harness the TKE generated by the intake flow to enhance the gas mixing within the cylinder. To minimize excessive gas spillage caused by scavenging processes, the SOI corresponding to these five groups of intake pressure was set as the exhaust valve closing time (CA 390). Furthermore, five additional schemes were configured with CA 635 as the end of injection (EOI). This time selection could be adequately contrasted with the scheme using CA 390 as the SOI, as the intake valves were already closed at that time, and the TKE level within the cylinder was relatively low. Notably, the back pressure within the cylinder at that time point coincided with the inlet pressure of the injection device [
20], ensuring the supersonic development of the gas jet at the nozzle throat throughout the injection process. To facilitate an effective comparison of the mixing effects of different schemes at the ignition timing, it was stipulated that all scenarios maintained a consistent air–fuel ratio within the cylinder. Details of the specific schemes are shown in
Table 2.
Subsequently, the CFD numerical calculation was carried out for the specific scheme developed above, and the corresponding CFD calculation software was FLUENT 2022. Considering that the effects of various turbulence models on the jet penetration distance and the related wall functions on the computational accuracy have been analyzed in previous research [
24], the RNG k-ε two-equation turbulence model and the non-equilibrium wall functions were selected for the CFD numerical calculations in this study. The numerical convergence limit for the energy equation was set to 10
−6, while those for other equations were set to 10
−4. The turbulent Schmidt number was specified as 0.7. Assuming the initial computational domain to be at rest, its initial velocity was set to 0. The inlet pressures for the intake port and the injection device were set to 2 bar and 10 bar, respectively, with corresponding temperatures of 353 K and 300 K. The outlet pressure of the exhaust port was set to 1.8 bar, and the temperature was 773 K. The initial pressure and temperature of the combustion chamber were the same as those of the exhaust port. Since the jet tended to reach supersonic within the throat region of the injection device, the mesh size here was minimized to 0.3 mm, as shown in
Figure 1. With the goal of reducing computational costs, the mesh size away from the throat region was gradually enlarged, with a maximum size not exceeding 3 mm. For simplicity, the natural gas in the CFD numerical calculations was assumed to be 100% methane. Given that combustion was not covered in this study, the CFD numerical calculations spanned from the moment of intake valve opening (CA 330) to the timing of ignition (CA 700).
3. Results and Discussion
Since all scenarios shared a consistent air–fuel ratio at the time of ignition, the average mass fraction of gas at the ignition was calculated to be between 2.5% and 3.0%, based on the total mass of air and gas in the cylinder after intake valve closure (IVC). Here, this interval was defined as the BMCR. Correspondingly, concentration regions of 0–2%, 2–2.5%, 3–3.5%, and greater than 3.5% were assigned as the thinnest, thinner, thicker, and thickest intervals, respectively. Among them, the BMCR percentage (the volumetric proportion of the stoichiometric mixture in the cylinder at the ignition) served as the primary benchmark for evaluating gas mixing uniformity in this study.
The proportion of gas in each concentration interval of CASES 1–10 was extracted, as depicted in
Figure 4. It was evident that CASES 1, 3, 5, 7, and 9 with CA 390 as the starting time of injection (SOI) had a significantly higher BMCR percentage at the ignition than CASES 2, 4, 6, 8, and 10. The occurrence of this phenomenon was attributed to the earlier SOI of the former, which increased the mixing time of the gas. Concurrently, the TKE generated by the intake flow during the opening of the intake valve could effectively be utilized by the gas injected earlier into the cylinder to accelerate the gas mixing. It was noteworthy that, with the increase in intake pressure, the BMCR proportion for CASES 1, 3, 5, 7, and 9 exhibited an initial upward trend followed by a subsequent decline, whereas the BMCR percentage for CASES 2, 4, 6, 8, and 10 tended to converge. At an intake pressure of 1.5 bar, CASE 3 achieved the highest BMCR proportion, reaching a notable 82.47%. In order to better elucidate the phenomena described above and to clarify the influence of TKE on gas mixing uniformity, detailed analyses were conducted on CASES 1, 3, 5, 7, and 9, which presented higher overall BMCR proportions. In particular, the analysis process was unfolded primarily in accordance with the stages of gas jet development and gas core mixing.
3.1. Gas Jet Development Stage
The “gas jet development stage” means the gas injection stage. In this stage, the kinetic energy of the airflow within the cylinder is significantly lower than that of the gas jet. Thus, this phase is predominantly dominated by the inertial development of the gas jet, with relatively limited mixing between the gas and air [
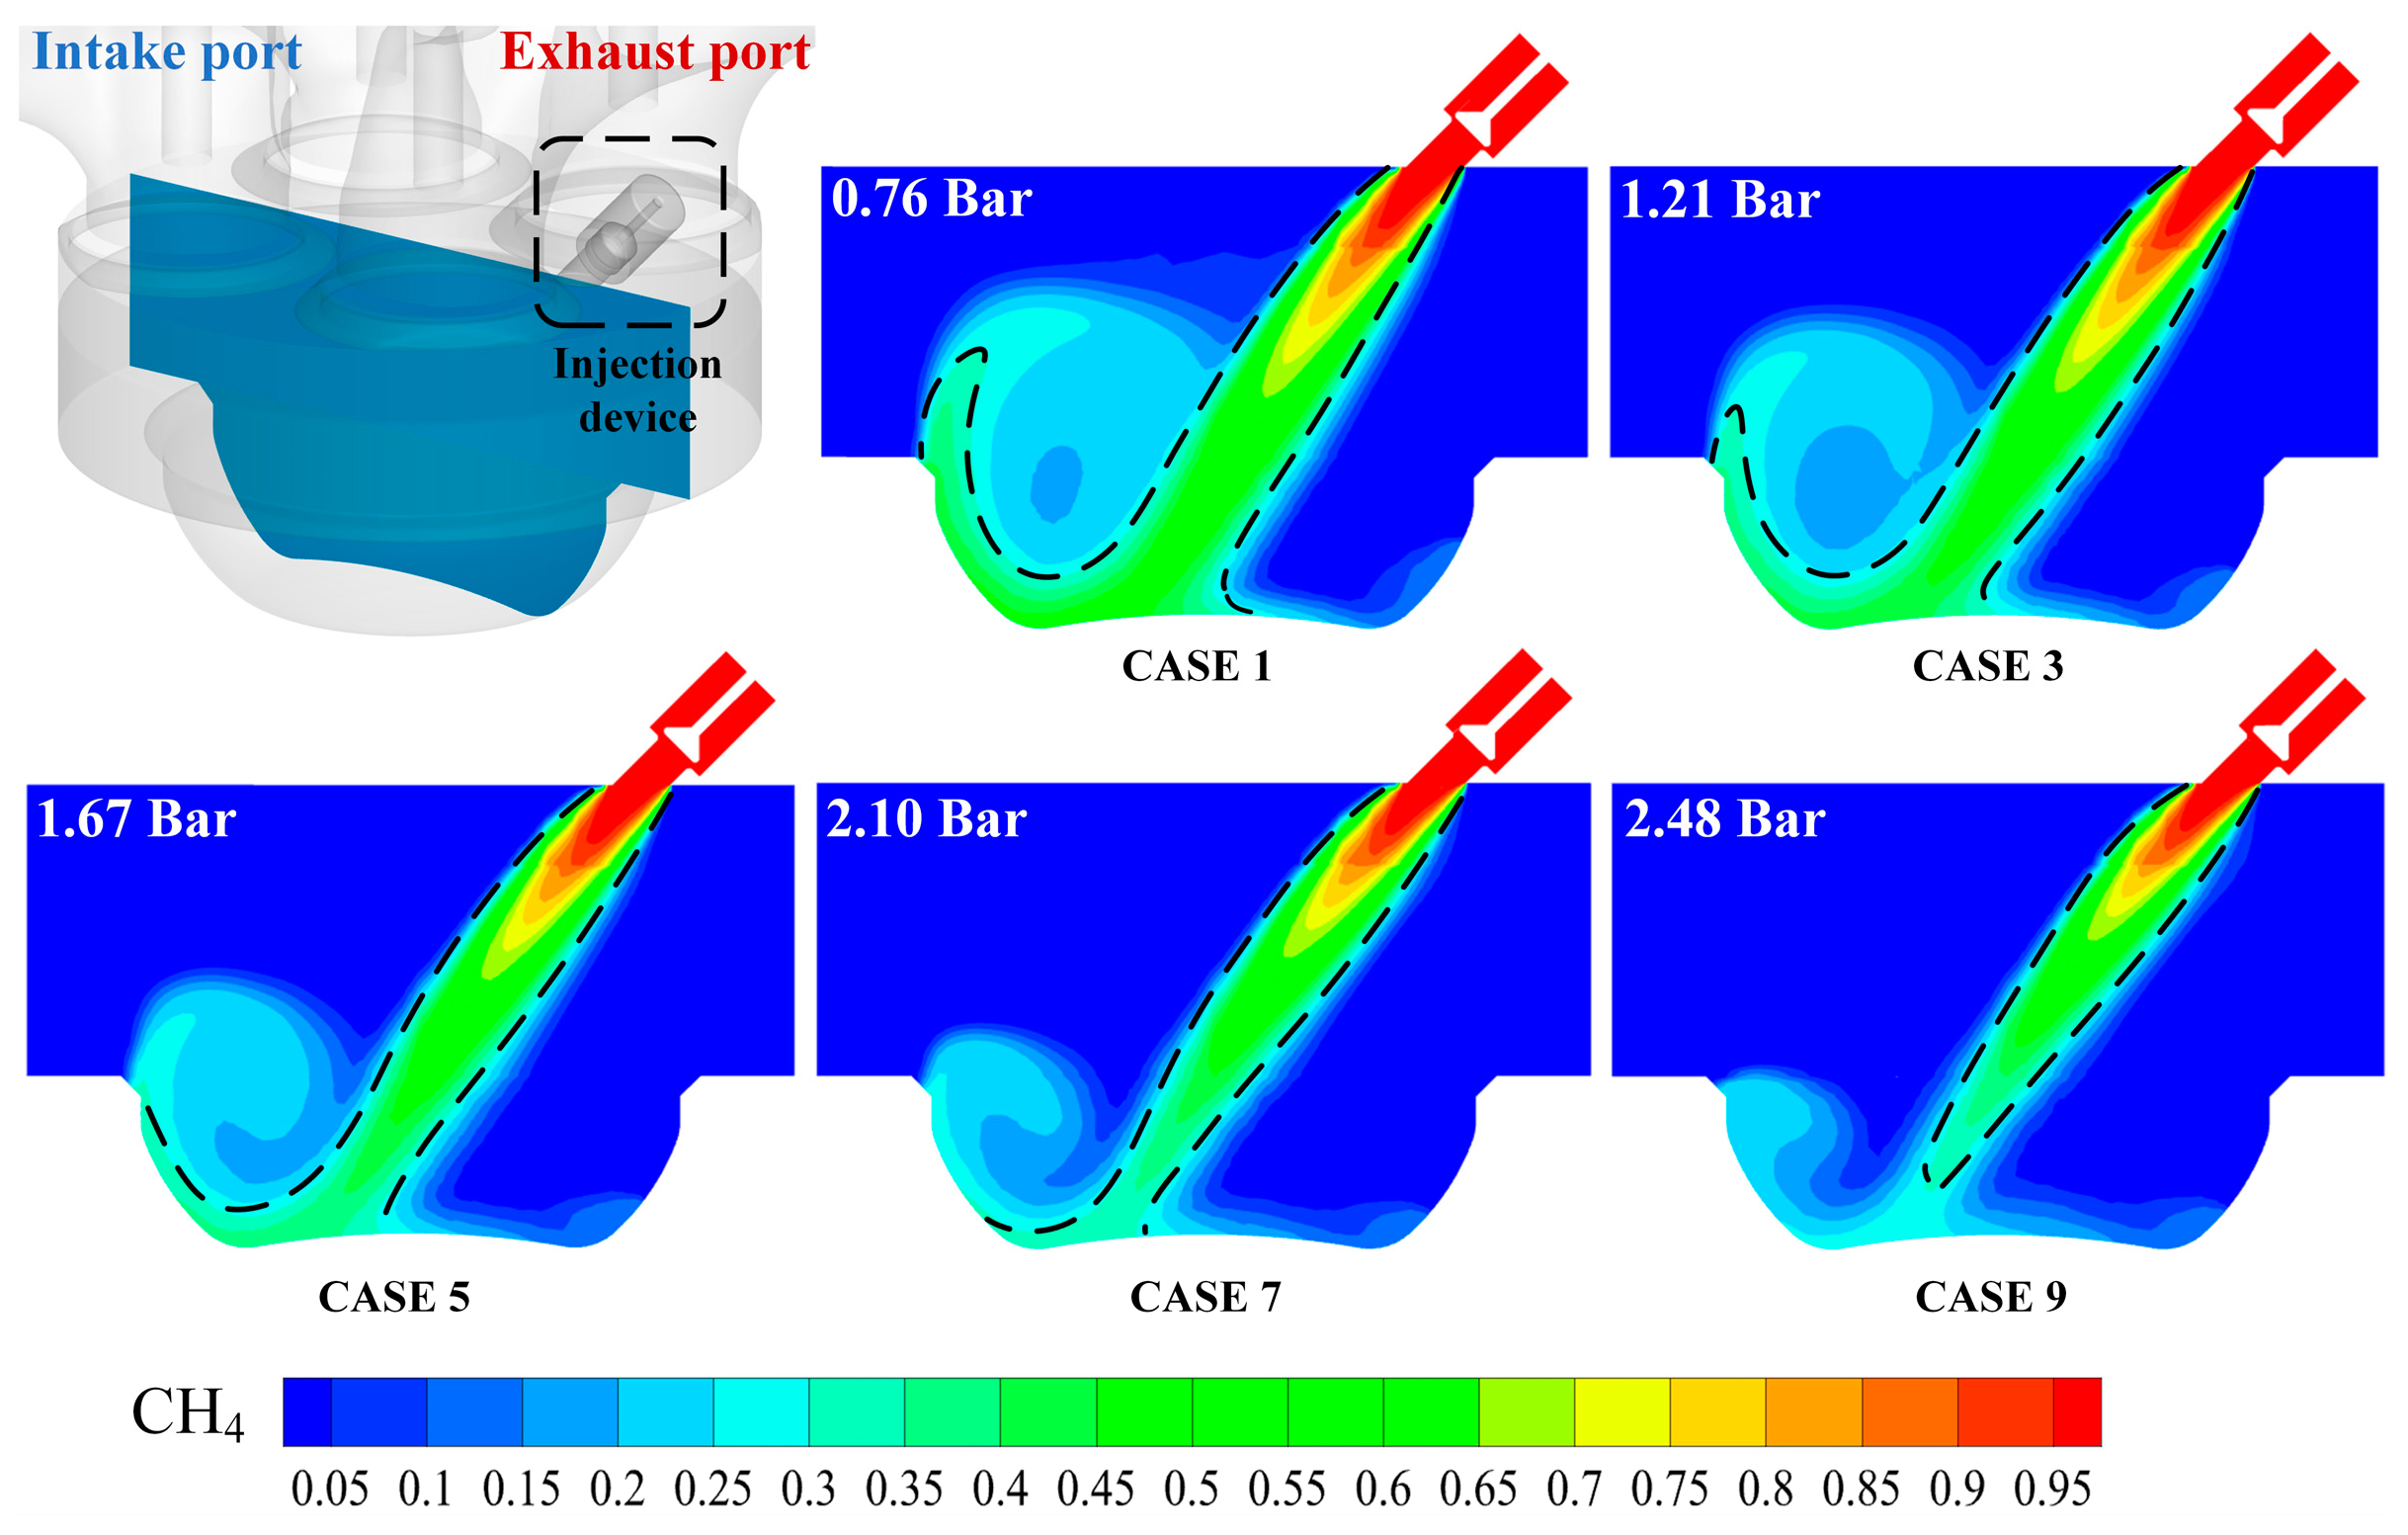
25]. Taking CASES 1, 3, 5, 7, and 9 as examples, the state of the gas jet was scrutinized with the injection device valves in the fully open position. The gas jet in CASE 1 was observed to continue its upward development after impacting the piston top, as illustrated in
Figure 5. As the inlet pressure increased, the penetration distance of the upward-developing gas became increasingly shorter, which indicated that the adequacy of the gas jet development was becoming worse. A further explanation of this conclusion can be gleaned from
Figure 5. By observing the numerical variation in the back pressure in the upper-left corner of the contour, it was found that with the increase in intake pressure, the back pressure within the cylinder progressively ascended. Consequently, the hindering effect (from back pressure within the cylinder) on the development of gas jets in CASES 1, 3, 5, 7, and 9 was increasing, which was the principal cause for the gradual decline in the adequacy of gas jet development.
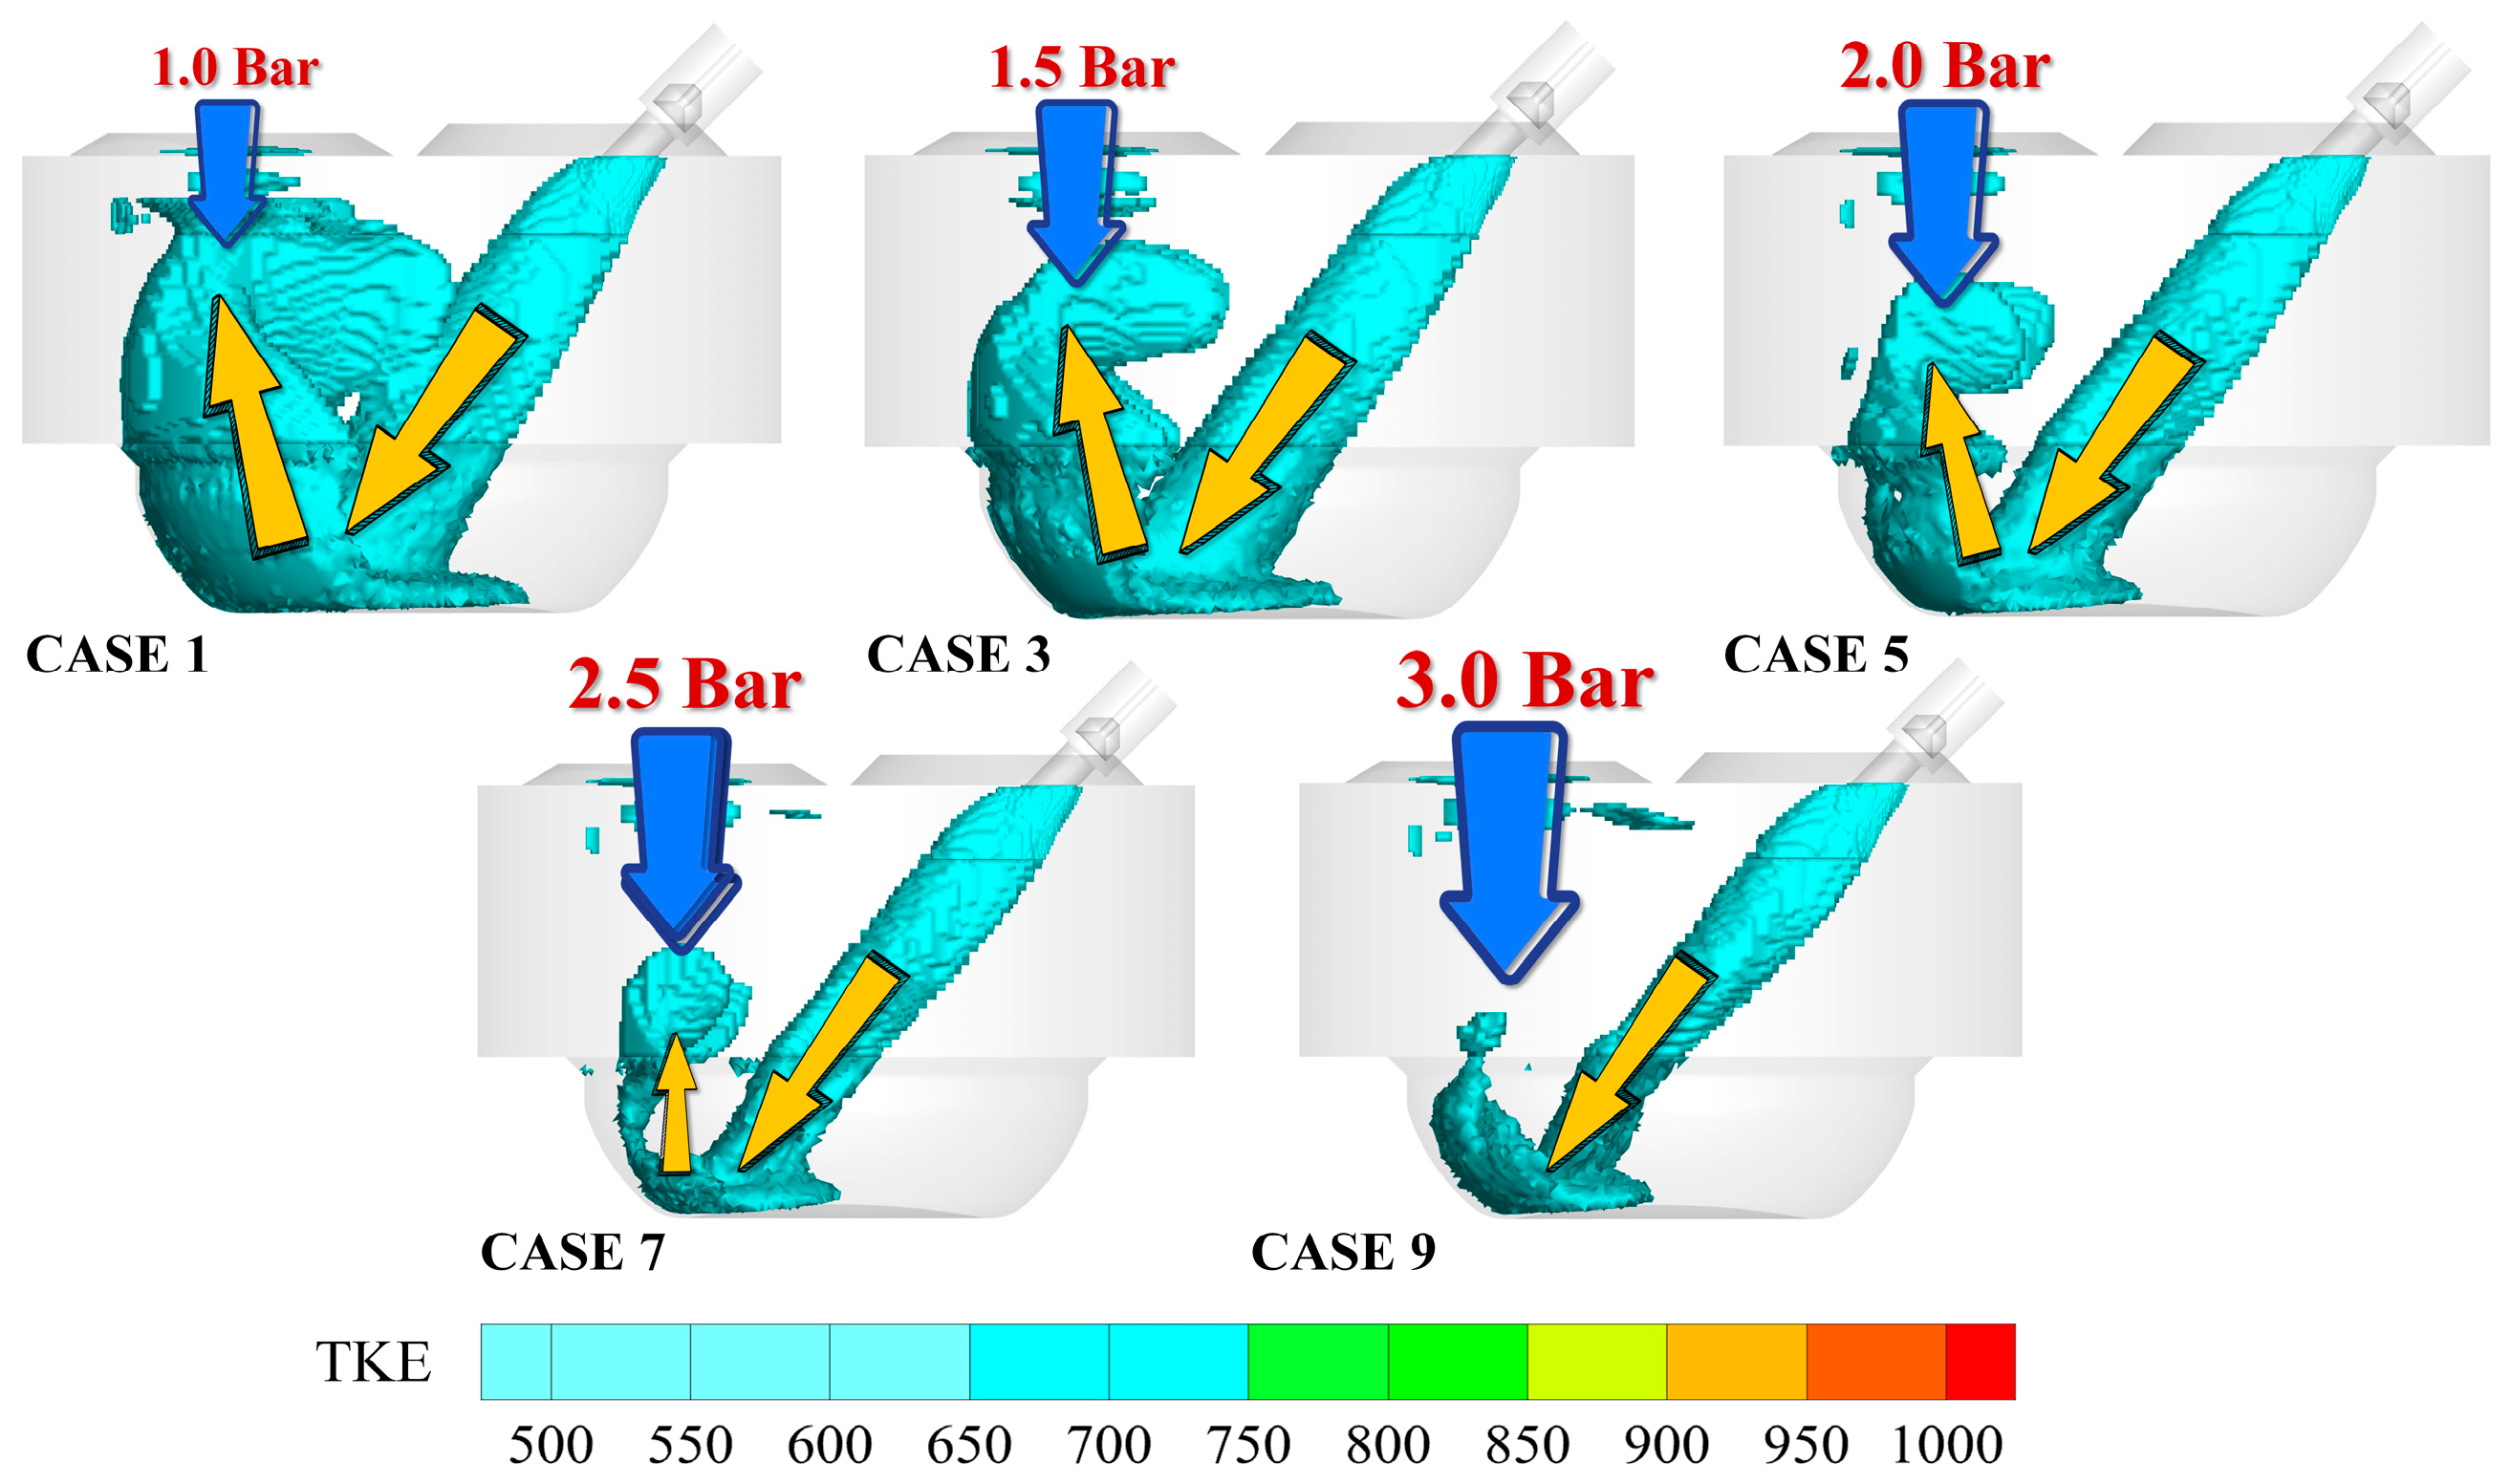
Additionally, the volume distribution of TKE exceeding 500 (m
2/s
2)/kg for CASES 1, 3, 5, 7, and 9 is showcased in
Figure 6. It could be plainly seen that the portion with relatively high TKE in the cylinder was primarily generated by the gas jet, as the volumetric shape of TKE in
Figure 6 basically coincided with the development morphology of the gas jet depicted in
Figure 5. Thus, the volumetric shape variations of TKE portrayed in
Figure 6 also substantiated that the adequacy of gas jet development progressively diminished with increasing intake pressure. Combining the above analyses of TKE volume distribution and gas jet contours, it was determined that during the stage of gas jet development, the adequacy of gas jet development obeyed the sequence CASE 1 > CASE 3 > CASE 5 > CASE 7 > CASE 9.
3.2. Gas Core Mixing Stage
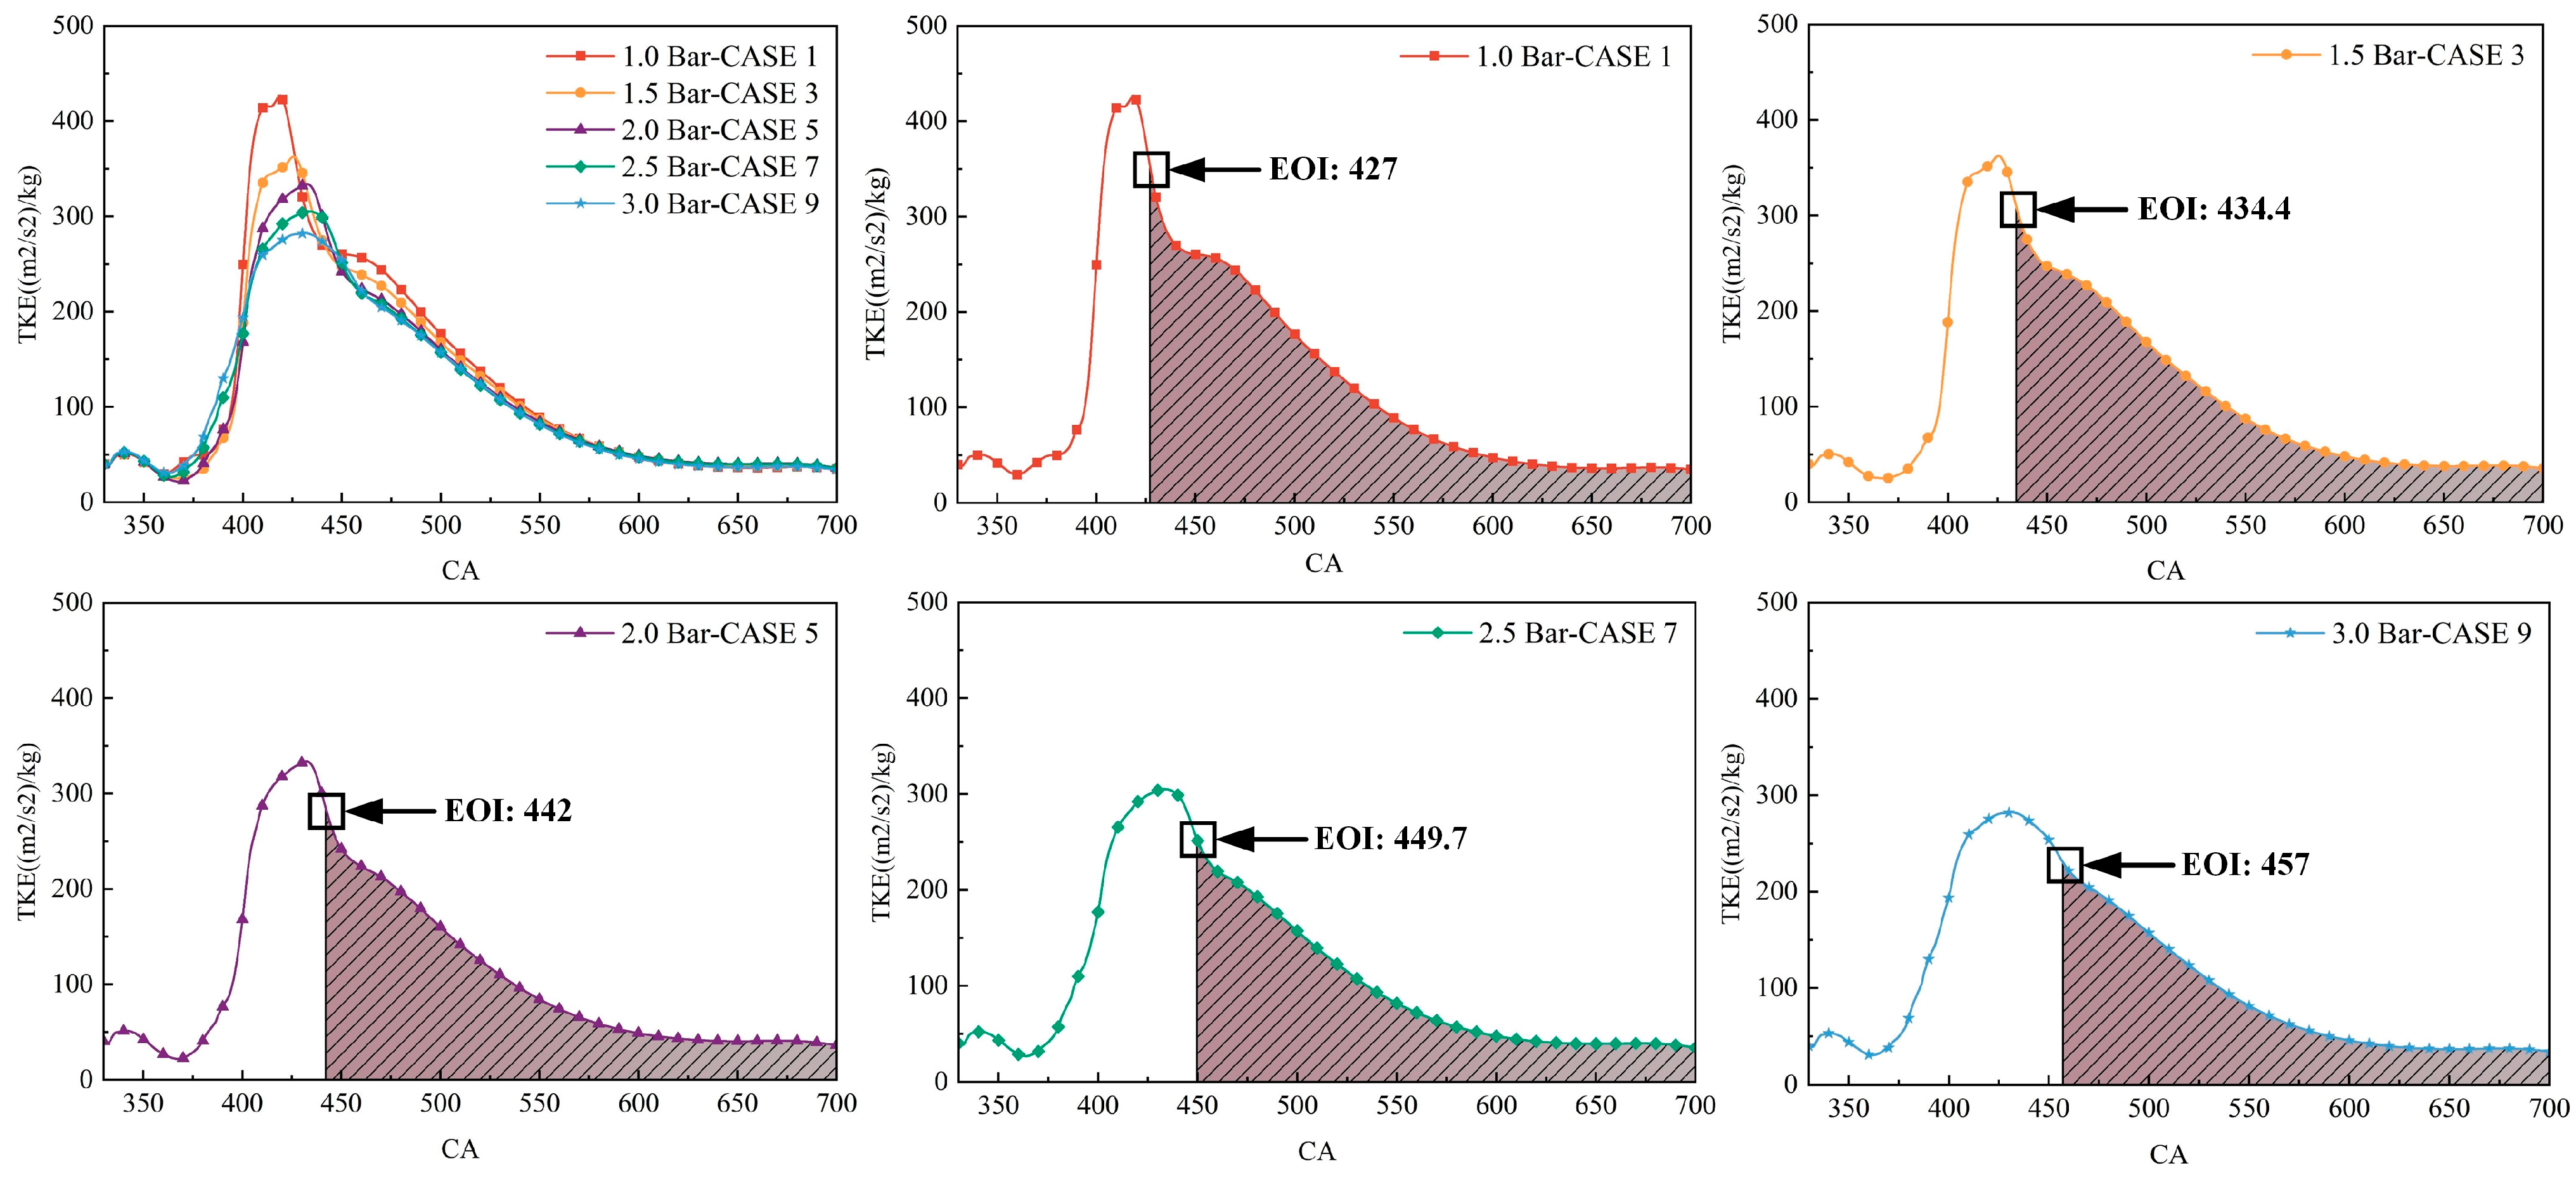
After having gone through the stage of gas jet development, the overall TKE and velocity of the gas jet in CASES 1, 3, 5, 7, and 9 began to decrease significantly. Subsequently, the analytical process transitioned into the major stage that determined the gas-mixing homogeneity at the ignition moment. The stage was hereby designated as the “gas core mixing stage”, with its corresponding process commencing from the EOI and terminating at the ignition moment. In this process, the high concentration of gas was extensively mixed with the air, thereby diluting to a more uniform range of gas concentrations. Therefore, it was more comprehensive to analyze the impact of TKE on gas mixing uniformity based on the core mixing stage. Simultaneously, considering the differing pulse width of gas injection among these five schemes, the numerical relationship between the MTKE (during the core mixing stage) and the BMCR proportion (at the ignition) was additionally dissected in this study. The specific formulas for the corresponding TKE and MTKE are given in (1) and (2).
where TKE is the unit mass turbulence kinetic energy; MTKE is the unit mass mean turbulence kinetic energy;
is the turbulence kinetic energy of the
grid cell;
is the density of the
grid cell;
is the volume of the
grid cell; EOI is the ending time of injection; and
is the time interval between the EOI and the ignition timing.
The core mixing stages of CASES 1, 3, 5, 7, and 9 are labeled in
Figure 7, where the area of the shaded portion represents the total turbulent kinetic energy (TTKE) of the core mixing stage, and the corresponding values (and the MTKE of this process) are detailed in
Table 3. Upon meticulously examining the numerical variations in the table, it became clear that the TTKE in the core mixing stage of these five schemes was sequentially decreasing. Consequently, the gas mixing velocity in the core mixing stage of CASES 1, 3, 5, 7, and 9 was progressively declining. Under the influence of this mixing velocity, the phenomenon (analyzed in
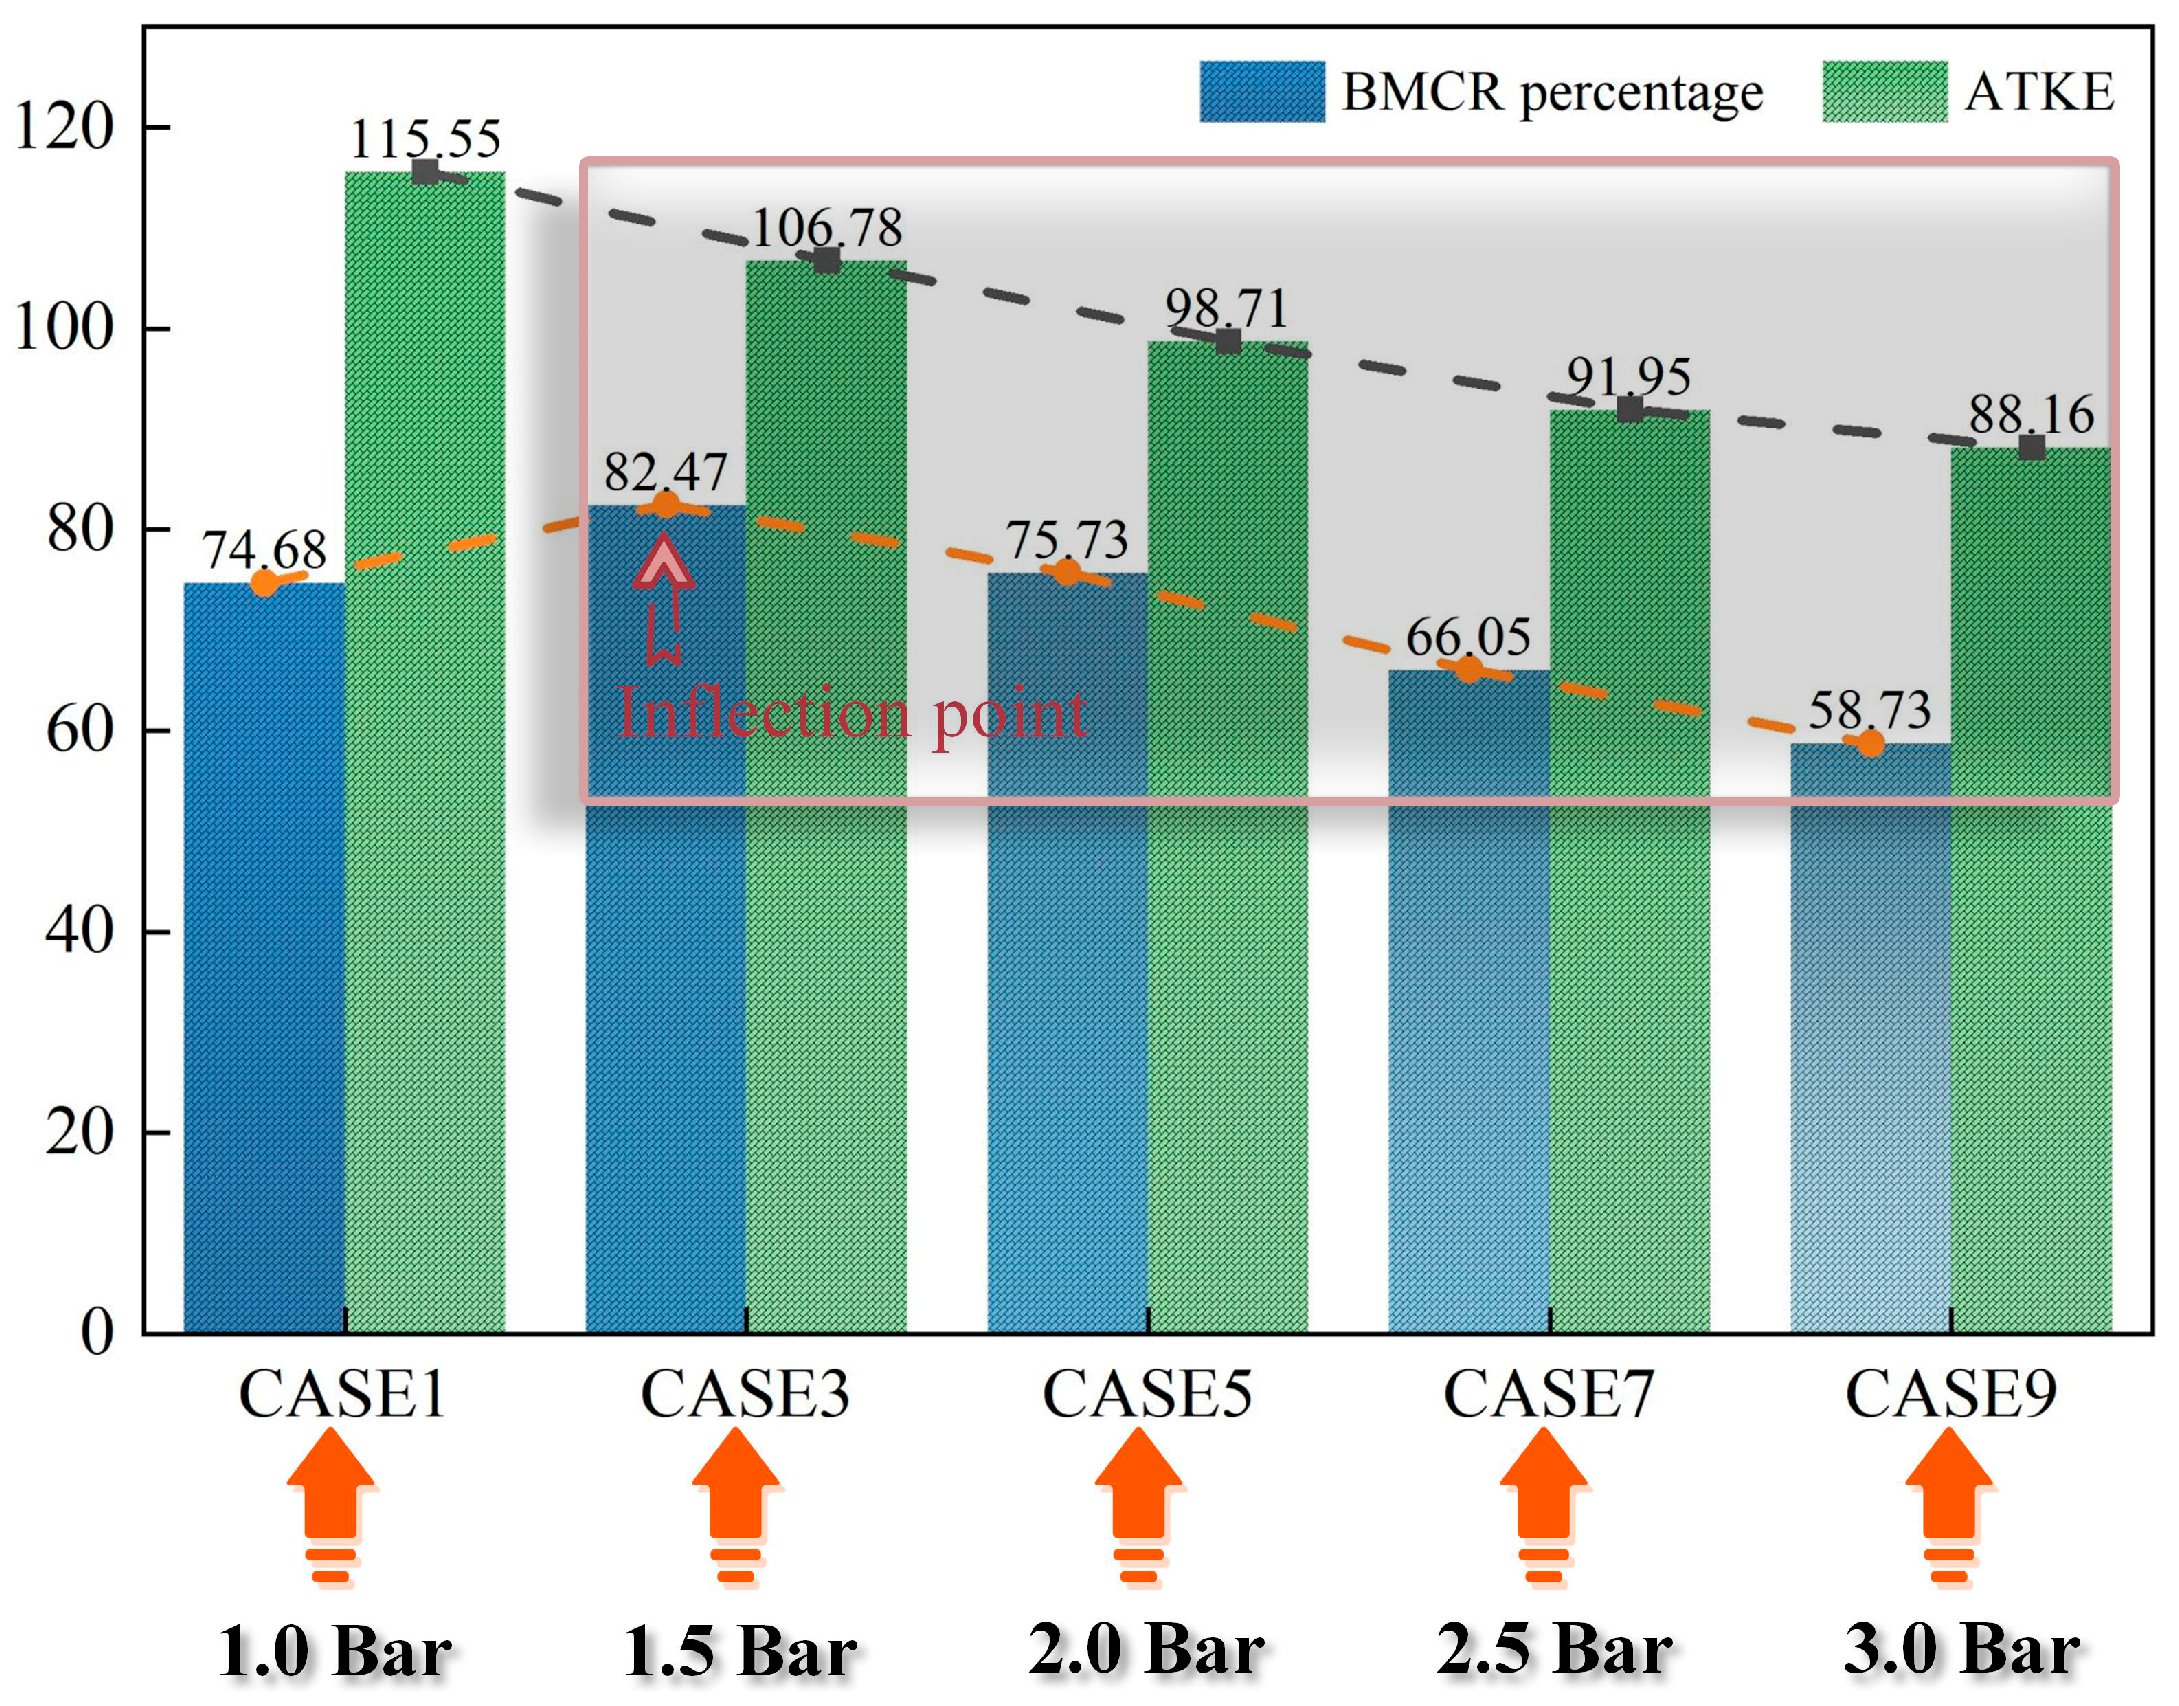
Section 3.1) of the stepwise reduced adequacy in the development of gas jet for CASES 1, 3, 5, 7, and 9 would lead to a consistent decrease in the BMCR percentage at the moment of ignition. However, the facts were slightly different, as the characteristic inflection point in the BMCR percentage occurred under the intake pressure of 1.5 bar, as illustrated in
Figure 8. CASE 1 had a significantly lower percentage of BMCR at the ignition than CASE 3, which went against the overall decreasing trend of TTKE in the core mixing stage. Only when the intake pressure had exceeded 1.5 bar did the BMCR percentage at ignition time follow the declining trend of TTKE.
To elucidate the numerical relations between the MTKE (during the core mixing stage) and the BMCR proportion (at the ignition), the two groups of data enumerated in
Table 3 were contrasted, as portrayed in
Figure 8. It was apparent that when the intake pressure surpassed 1.5 bar, the decline trends of both BMCR proportion and MTKE were remarkably similar. This particular phenomenon indicated that under certain conditions, utilizing either a set of data from BMCR proportion or MTKE could approximately predict the changing trend of the other set.
3.3. Differential Analysis of BMCR Proportions
Here, the reasons for the characteristic inflection point in the BMCR percentage under 1.5 bar intake pressure were analyzed. A comparison of gas volume distribution of CASE 1 and CASE 3 after EOI (CA 440) was performed, as shown in
Figure 9. In comparison to CASE 3, CASE 1 exhibited a significantly higher concentration of gas beneath the intake valve, attributed to the longer penetration distance of the upward-developing gas in CASE 1 (analyzed in
Section 3.1). Given the relatively weaker airflow movement beneath the conical valve (intake valve) employed in this study compared to other spaces within the cylinder, the gas located closer to the bottom of this valve performed inferior mixing performance with air. This disparity in airflow movement explained why the TTKE was higher in CASE 1 while the BMCR percentage at the ignition was lower relative to CASE 3. (The aforementioned analysis did not need to address the issue of insufficient comparison of high-concentration gas due to the inconsistent amount of air in the cylinder at the moment of CA 440, since the high-concentration gas was generally not fully mixed by the air for a short period of time after the EOI.)
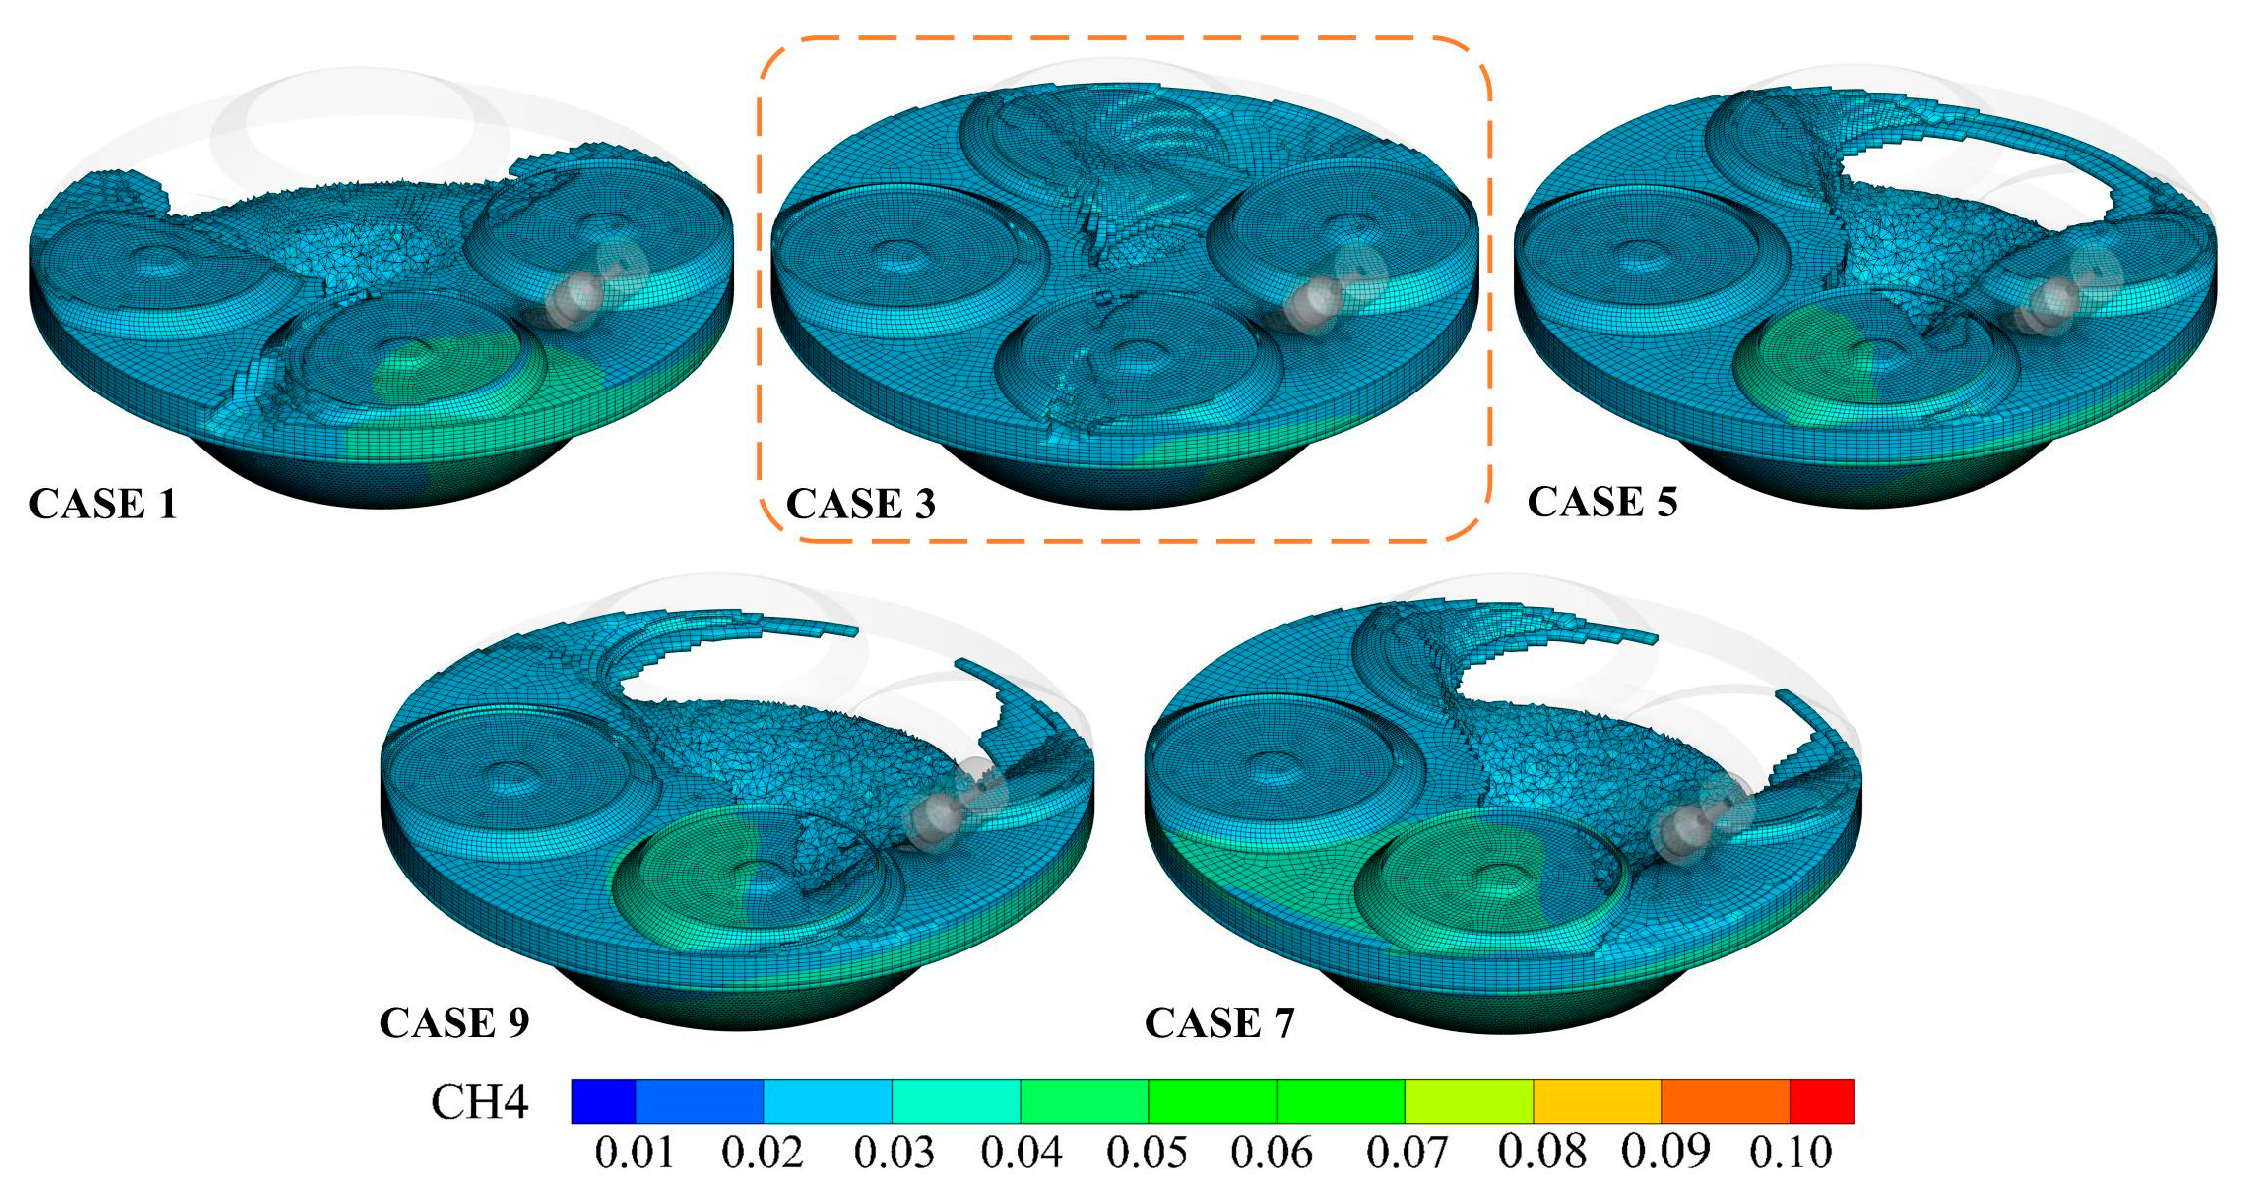
At this juncture, the predominant reason for the first increase and then decrease in the BMCR proportion of CASES 1, 3, 5, 7, and 9 was elucidated. To further visualize the disparity in gas mixing uniformity at ignition among these five schemes, the gas below a 2.5% concentration was hidden in
Figure 10. The observations indicated that CASE 3 achieved the highest level of gas mixing uniformity, with a small percentage of low-concentration gas. In contrast, CASE 5 had a significantly worse spatial distribution of gas than CASE 3, even though it also had a relatively high percentage of BMCR.
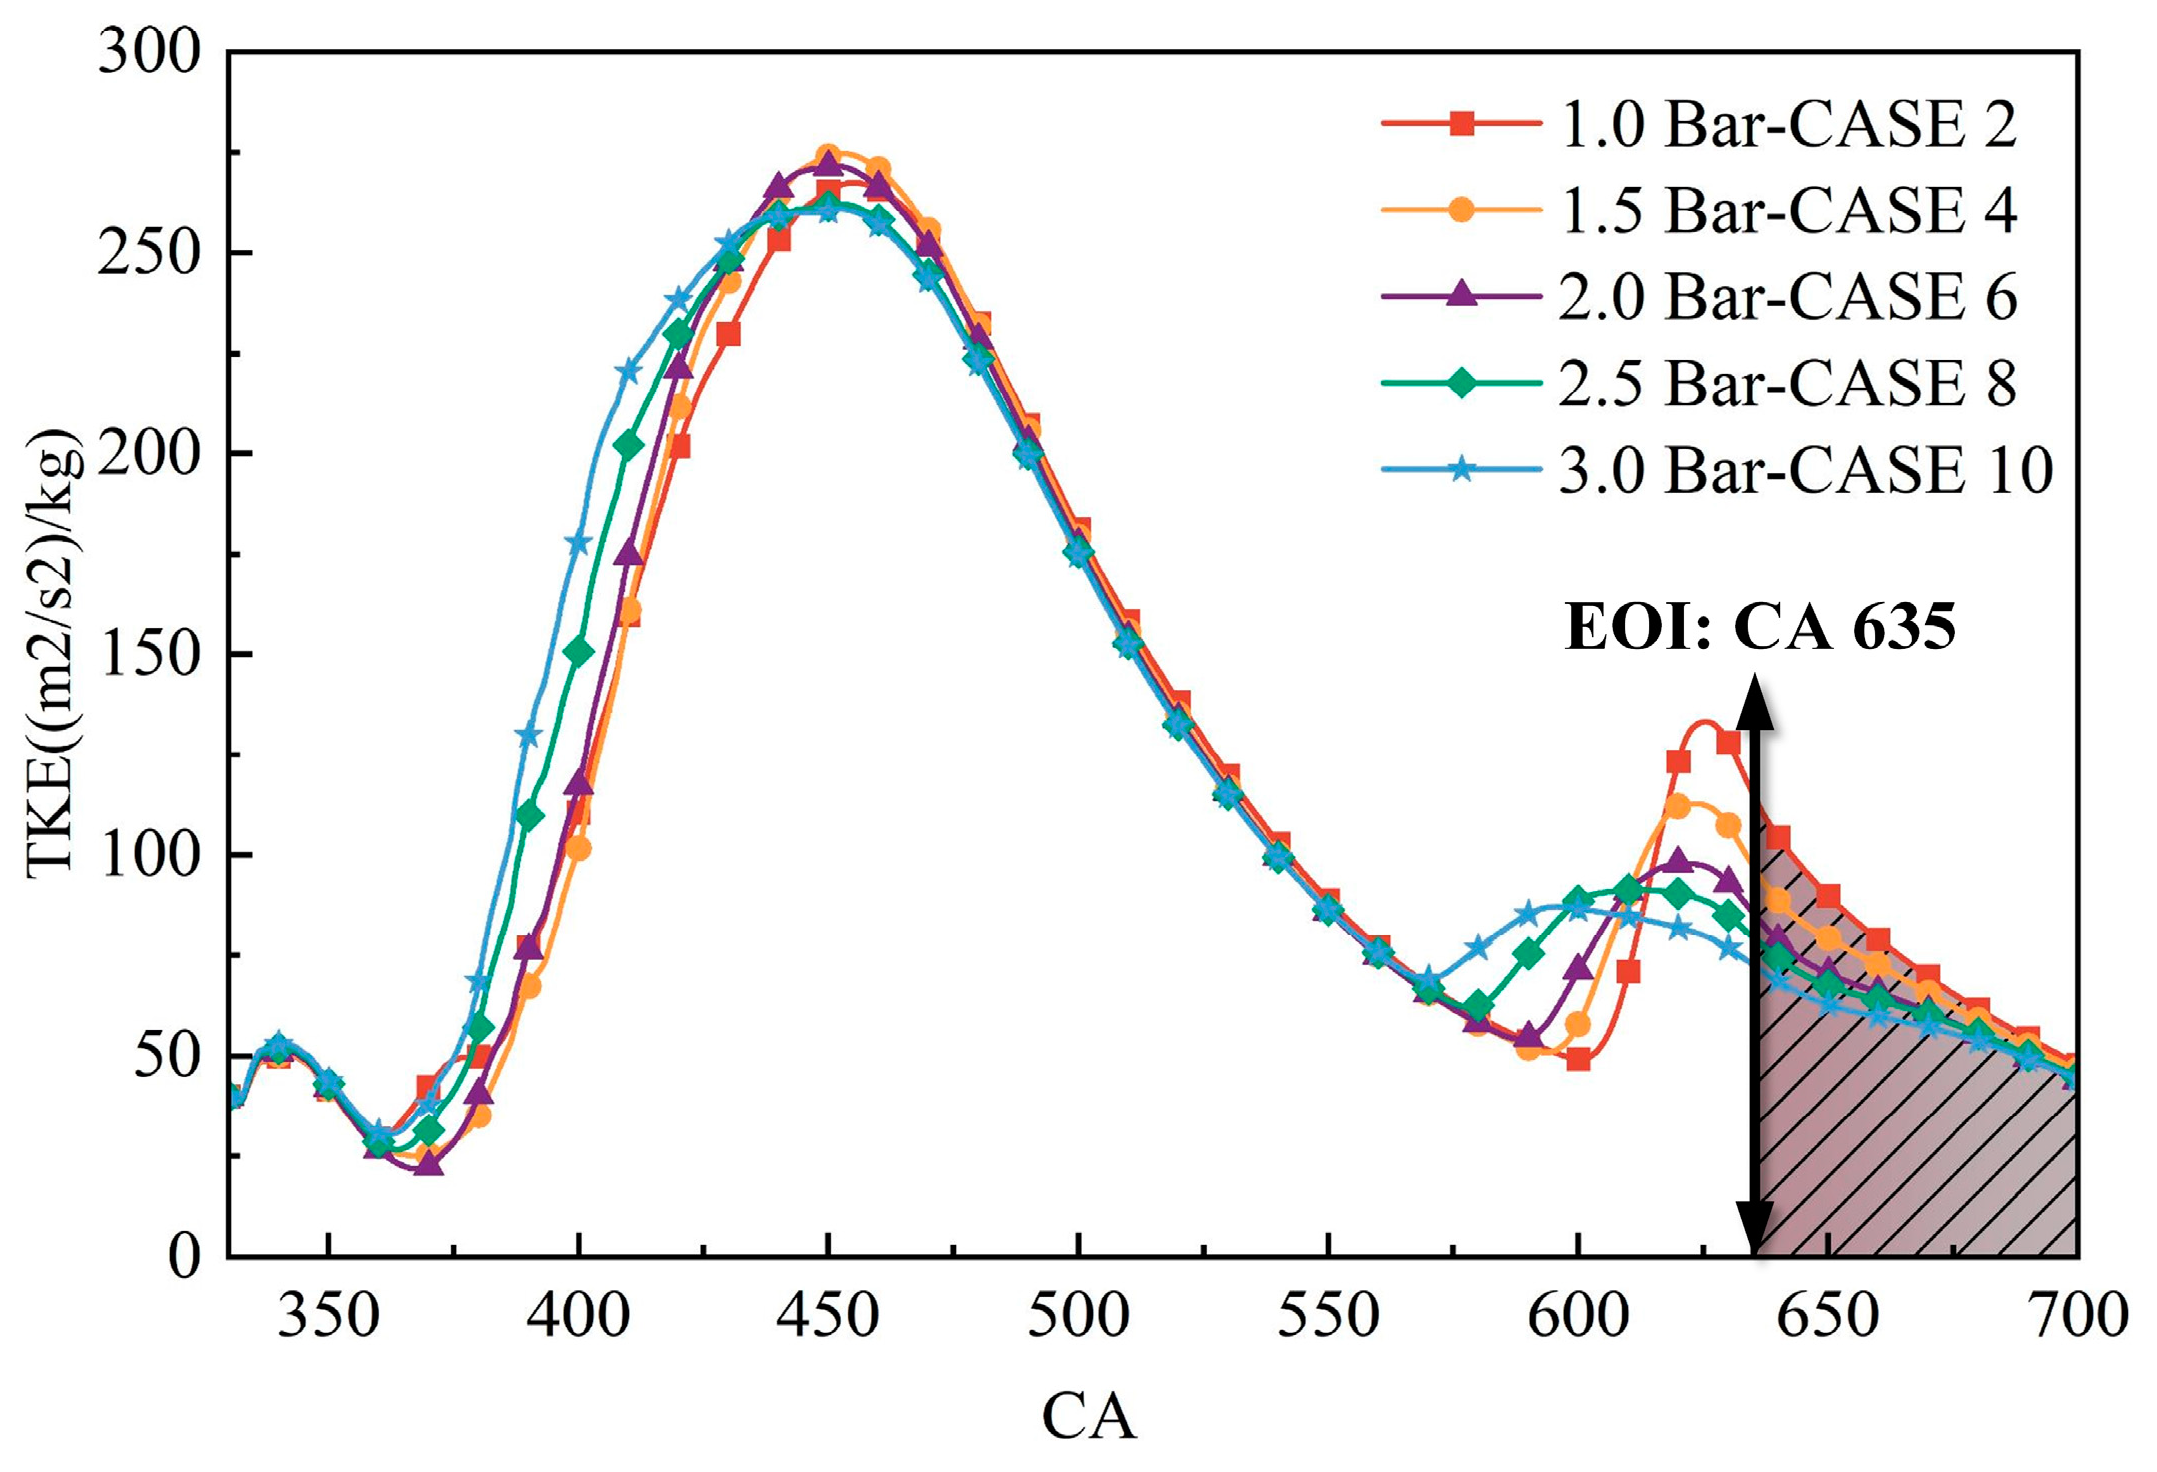
Finally, the causes behind the overall low and convergent BMCR percentage of CASES 2, 4, 6, 8, and 10 were conducted from two perspectives. Firstly, given that the EOI for these five scenarios was CA 635, the gas mixing time was notably shortened compared to CASES 1, 3, 5, 7, and 9. This directly led to their BMCR proportions dropping to around 12% at ignition. Secondly, it was observed from
Figure 11 that the TTKE (during the core mixing stage) of CASES 2, 4, 6, 8, and 10 did not differ much. Consequently, fluctuations in the BMCR proportion due to differences in TTKE (during the core mixing stage) could be very subtle when the BMCR percentage values were already low.
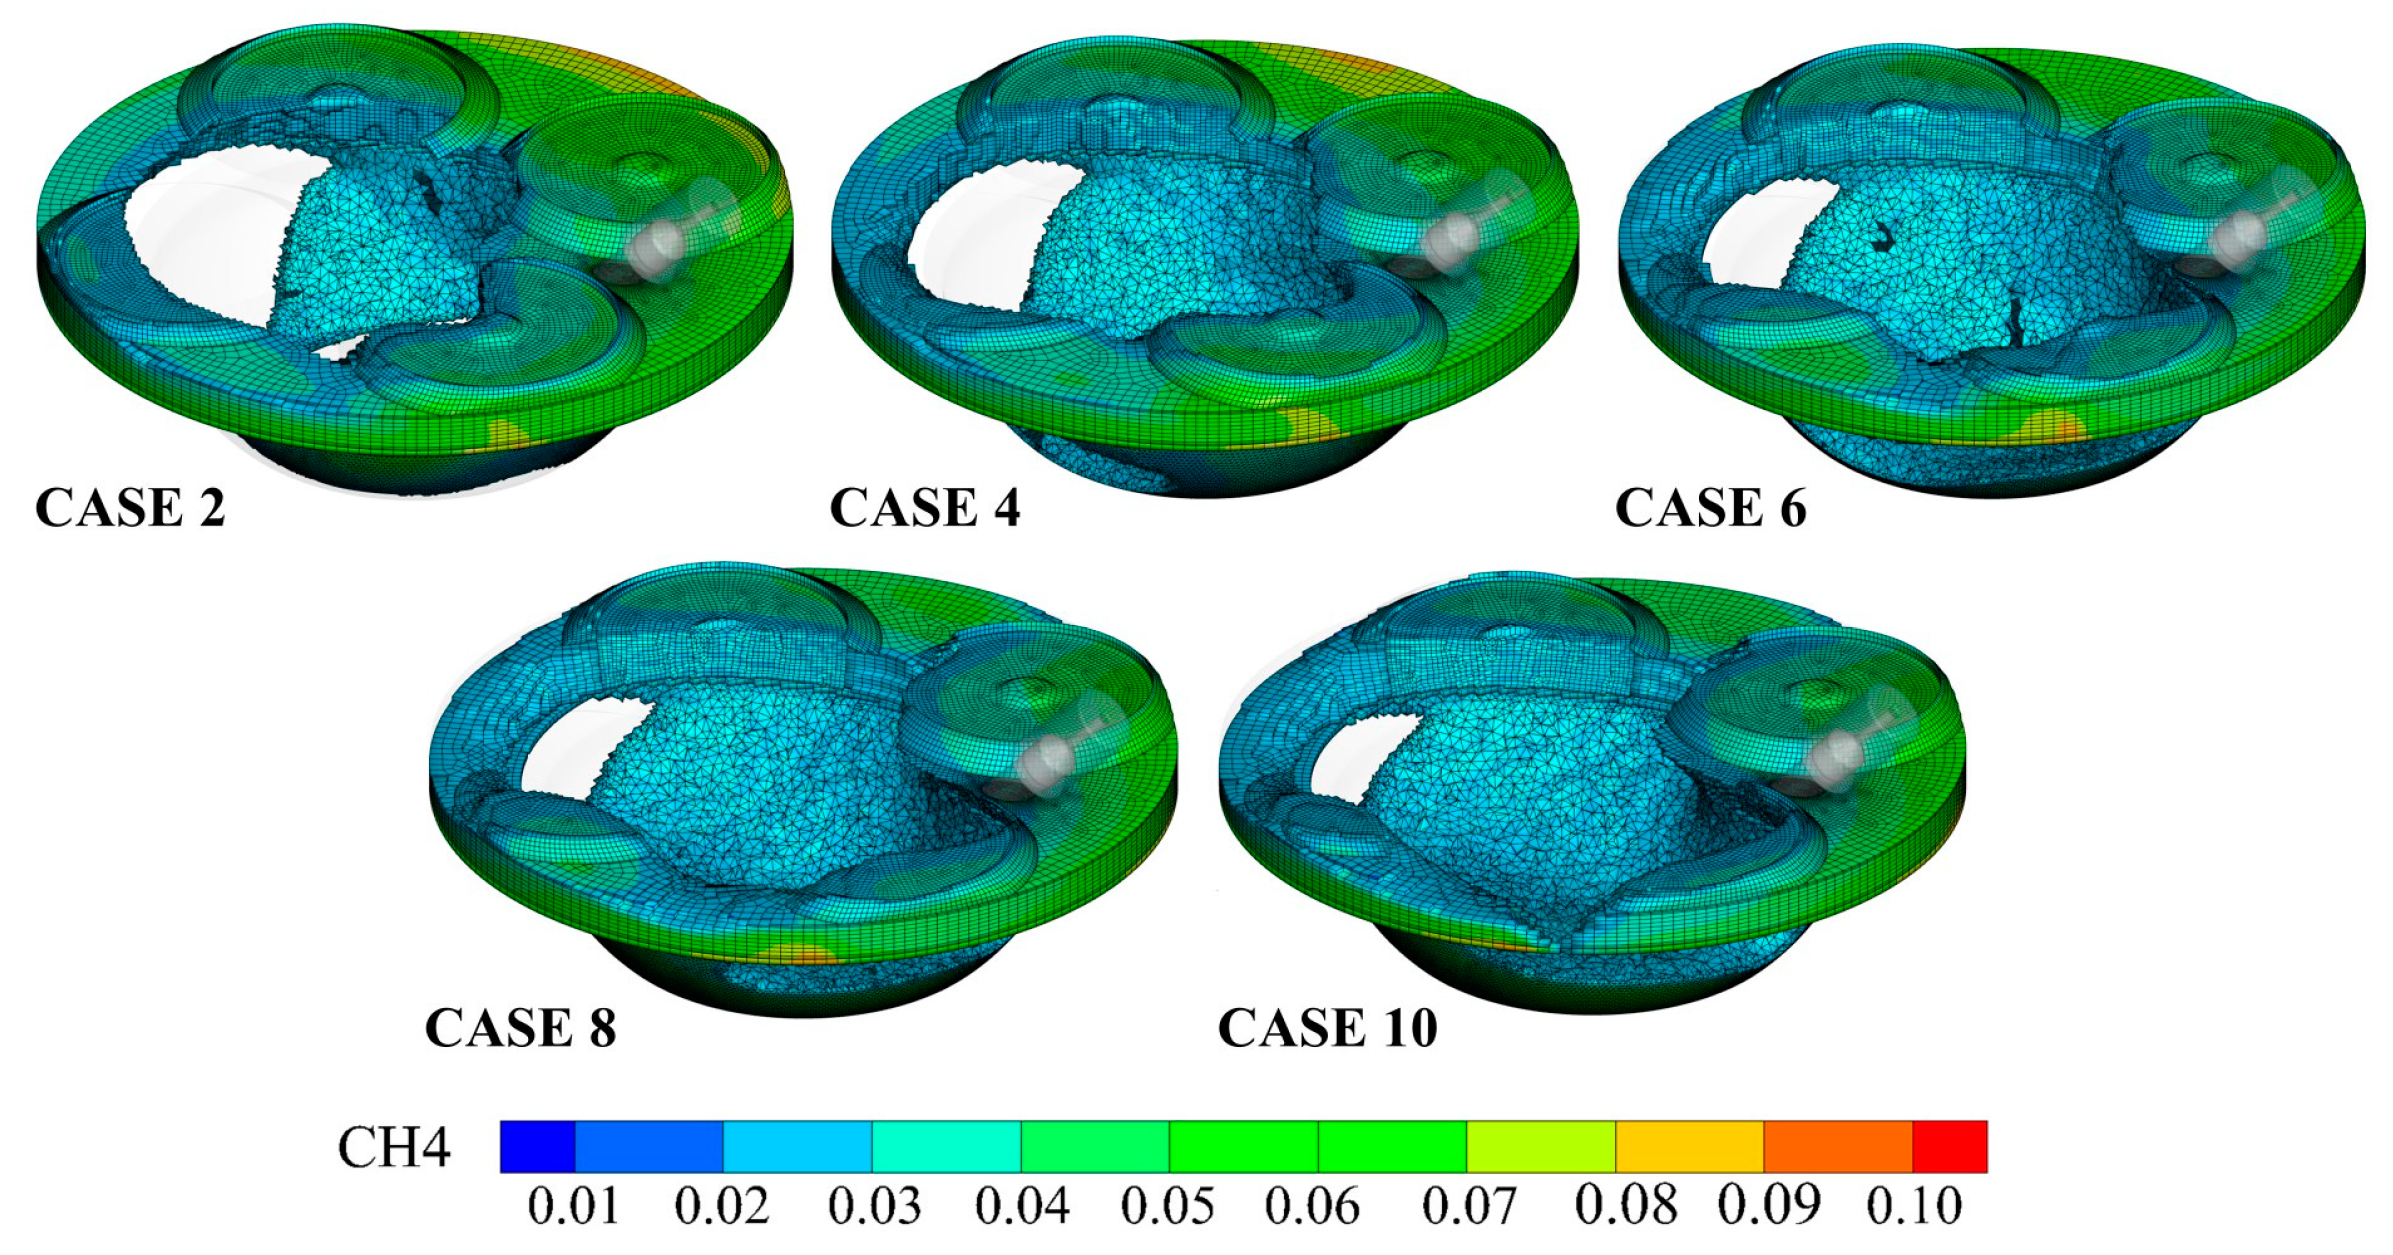
In addition, the gas distribution of CASES 2, 4, 6, 8, and 10 at the ignition was demonstrated, as shown in
Figure 12. The gas mixing uniformity of these five schemes was relatively low, and the gas with a concentration of 2.5% or more was predominantly clustered around the periphery of the combustion chamber. When the spark plug was positioned at the center of the combustion chamber, all five schemes presented the disadvantage of uneven flame propagation at the moment of ignition.
