Article

Enhancing Electric Shuttle Bus Efficiency: A Case Study on Timetabling and Scheduling Optimization

by
Kayhan Alamatsaz
1,2,
Frédéric Quesnel
2,3 and
Ursula Eicker
1,4,*
1
Department of Building, Civil and Environmental Engineering, Concordia University, Montreal, QC H3G 1M8, Canada
2
GERAD 3000 ch, de la Côte-Sainte-Catherine, Montreal, QC H3T 2A7, Canada
3
School of Management Science, Université du Québec a Montréal, 315, Ste-Catherine Street East, Montreal, QC H2X 3X2, Canada
4
Canada Excellence Research Chair in Smart, Sustainable and Resilient Communities and Cities, Concordia University, 1515 St. Catherine St. West, Montreal, QC H3H 2L9, Canada
*
Author to whom correspondence should be addressed.
Energies 2024, 17(13), 3149; https://doi.org/10.3390/en17133149
Submission received: 30 May 2024 / Revised: 19 June 2024 / Accepted: 22 June 2024 / Published: 26 June 2024
(This article belongs to the Section E: Electric Vehicles)

Abstract

:
As transit authorities increasingly adopt electric buses (EBs) to mitigate air quality concerns and greenhouse gas emissions, new challenges arise in bus scheduling and timetabling. Unlike traditional buses, EBs face operational obstacles due to their shorter range and extended charging times. Existing mathematical optimization models for operation planning of traditional buses must be revised to address these unique characteristics of EBs. This study introduces a new approach to integrate timetabling and bus scheduling to enhance the level of service and minimize operational costs, using a case study of a University shuttle bus service in Montreal, Canada. The level of service will be enhanced by reducing students waiting time and improving their in-vehicle comfort through seat availability. The scheduling aspect seeks to reduce the total operational costs, which include travel, electricity consumption, and usage costs of EBs. The proposed algorithm calculates the waiting time and seat availability for different headway values and addresses the scheduling problem using a mixed-integer linear programming (MILP) model with an arc-based approach, solved using the Cplex Optimization Studio software version 12.8. A normalized weighted sum technique is then applied to select the optimal headway, balancing waiting time, seat availability, and operational costs. The effectiveness of our approach was tested through a case study of Concordia University’s shuttle bus service. Comparative analysis of the current and proposed schedules shows that our approach significantly improves service quality by decreasing waiting times and increasing seat availability while optimizing cost-effectiveness compared to the existing timetable of the Concordia shuttle bus. The proposed approach ensures a smooth transition to a fully electric transit system for shuttle bus services.

1. Introduction

Sources of energy that release greenhouse gases are major contributors to global warming and atmospheric pollution. Shifting to electric transit systems is crucial for developing greener and sustainable urban environments. In the United Kingdom, buses are responsible for emitting roughly 4.3 million tons of CO2, emphasizing the critical necessity for shifting towards more sustainable energy sources. Electric buses (EBs) emerge as a viable strategy to reduce urban transport’s carbon footprint, which is responsible for 15% of worldwide CO2 emissions [1]. In light of this, China has taken a substantial step by converting its bus fleets to electric vehicles. As of 2019, approximately 400,000 electric buses were operating in China’s public transport system, constituting 99% of the worldwide total of EBs [2]. Also, numerous cities have embarked on ambitious plans to electrify their public bus fleets [3]. Similarly, academic institutions, including those in the United States, Japan, Turkey, and Singapore, are adopting EBs for campus shuttle operations [4]. Research conducted by Lie et al. [5] indicates that the adoption of biofuels and electric buses could diminish the carbon footprint of bus fleets by 37%, with a complete transition to electric buses potentially reducing emissions by as much as 52%.
The shift toward electric transportation systems, particularly electric buses, involves significant challenges, primarily the high initial costs. This includes the cost of the buses, their batteries, and the essential charging infrastructure, which is about 63% higher than conventional diesel buses [6]. However, electric buses offer lower operational and maintenance expenses—around CAD 700,000 annually compared to CAD 1.1 million for diesel buses—potentially resulting in savings over their lifetime [7]. Despite the advantages of lower fuel and maintenance costs, electric buses face challenges such as limited range, long charging times, and performance declines in cold climates, which significantly reduce their operational range. These issues complicate their integration into existing transportation systems.
Public transit agencies are actively working to enhance the efficiency of their transportation systems, focusing particularly on bus operations. The effectiveness of these systems largely relies on how they are managed, particularly in aspects such as bus timetabling and scheduling. Bus timetabling (TT) is the process of setting departure and arrival times for all bus trips to improve service quality [8]. The goal is to minimize waiting and transfer times for passengers, ensure more available seats, and coordinate bus arrivals at major transfer hubs and intersections. On the other hand, The vehicle scheduling problem (VSP), or bus scheduling problem (BSP) in this context, involves assigning buses to trips based on a predetermined timetable. The aim is to reduce the number of buses needed and minimize operational costs. These costs include travel expenses, electricity and refuelling costs, expenses related to bus waiting times, and maintenance costs [9].
Since switching from hybrid or conventional buses to fully electric buses affects the operational and economical aspects of the bus service, a reconsideration of the current timetable and schedule of EBs is required. This study focuses on improving the timetable and schedule of EBs by developing a new integrated approach specifically designed for the operational needs of electric buses, with objectives to increase the level of service and minimize EB operational costs. By finding the best headways—the intervals between consecutive bus departures from the same stop—for buses and optimum schedules of fully electric shuttle bus services, we seek to facilitate a smoother transition to a fully electric transit system and improve operational efficiency and reduce students’ waiting time. Additionally, strategic choices regarding the best models of EBs underscore the importance of this research in reducing total operational costs and improving the service level.
The remainder of this paper is structured as follows. The theoretical background and related works of electric bus timetabling, scheduling, their integration, and challenges of electrifying the bus transit systems are reviewed in Section 2. Section 3 describes a detailed description of the integration of electric bus scheduling and timetabling for shuttle bus services. Also, it outlines the proposed solution approach, the mathematical optimization model, and the algorithm to solve the problem. Section 4 provides a detailed explanation of the Concordia University shuttle bus service as a case study and reports the computational results and sensitivity analysis. Finally, conclusions and potential research direction are drawn in Section 5.

2. Literature Review

This literature review examines significant contributions that address the complexities of creating effective timetables and schedules, emphasizing the necessity of integrating these elements to better support electric bus operations.

2.1. Bus Timetabling

Bus timetabling involves several key decisions to improve transit services. One is the departure times of buses, which involves setting the time buses leave terminals and stops, including the first and last departures for each route. Frequency setting is another important aspect, where intervals of buses are determined based on the time of day—like peak or off-peak hours—to match passenger demand and prevent overcrowding or underutilization. Headway management then focuses on managing the time gaps between consecutive buses on a route to minimize passenger waiting times [10].
Studies have examined the TT phase from various angles, focusing on multi-objective models designed to minimize waiting times, enhance bus utilization [11], and adjust bus frequencies to align with passenger demand [12]. Enhancing the synchronization of bus arrivals at transfer points and bus intersections enables EBs to utilize idle time for recharging, necessitating the incorporation of charging times into the timetabling process. This charging time takes about 5 to 15 min. Even though fast-charging technology influences timetable adjustments, research on timetabling for EBs remains limited [13].
Ceder et al. [14] formulated a multi-objective model aimed at minimizing the expected wait times for passengers who arrive randomly while also enhancing bus utilization from the operators’ perspective. Zhang and his colleagues [11] introduced a decomposition heuristic algorithm to tackle a bi-objective optimization model for feeder bus lines that aimed to minimize passenger waiting time costs while considering the total operational costs and budget constraints for bus operators. Shang et al. [12] suggested a timetabling strategy to maximize bus frequency and optimize headway values by focusing on customer satisfaction. This approach seeks to find a balance between satisfying bus users’ demands through minimal waiting time and seat availability and achieving efficient bus transit operations by focusing on increasing income with more passengers. However, their strategy did not address the scheduling of buses based on these optimized headways, an issue our research intends to tackle. Ceder and Philibert [15] developed a methodology for creating transit timetables that aim for an even distribution of load across vehicles to facilitate smooth transfers and achieve a high vehicle load without discrepancies, thereby enhancing vehicle use and reducing the time vehicles spend with empty seats. However, this approach could lead to longer wait times for passengers at stops that are not predetermined. Gkiotsalitis and Alesiani [16] introduced a robust timetable through a mathematical model of bus movements, aiming to minimize the impact of worst-case scenarios by reducing the discrepancies between actual and planned bus departure times.

2.2. EB Scheduling

The EBSP can encompass various goals, including minimizing the number of EBs needed, reducing the total acquisition cost of EBs, reducing deadhead trips (empty trips to relocalize a bus), and lowering travel cost, electricity, and maintenance costs associated with EBs [17]. Key decisions in EBSP include assigning buses to specific trips, charging scheduling of EBs, and determining the required number of EBs. The charging technology and the EB specifications will significantly impact these decisions.
There are different types of EBSP, primarily influenced by the fleet’s characteristics and the structure of the bus networks. These problems can be specific to operations involving a single bus line [18] or multiple lines [19], and similarly, they may concern single or multiple bus depots [20,21]. Another vital consideration is the type of vehicles in the fleet. For a more comprehensive understanding of electric bus scheduling and its variations, readers are directed to the detailed reviews provided in the recent articles by Perumal et al. [22] and Alamatsaz et al. [23].

2.3. Integrating TT and Scheduling

Ceder et al. [24] and Chakroborty et al. [25] were pioneers in examining the combination of bus timetabling and bus scheduling. Ceder and his colleagues proposed a method to merge timetables and bus schedules, looking at both bus users’ satisfaction and operational efficiency to decrease the number of buses needed. Their strategy utilized a four-step sequential process with a loop for feedback. On the other hand, Chakroborty et al. were the first to incorporate the decision to determine the optimal fleet size into the timetable development problem. The objectives were minimizing the fleet size and reducing passengers’ waiting time simultaneously. They also demonstrated their approach using a test instance involving three bus lines over a total scheduling period of four hours. The majority of research in this field primarily focuses on minimizing passenger waiting and travel times for timetabling and reducing the costs faced by bus operators, including the expenses associated with acquiring new buses and the costs of deadhead trips.
Balancing the different objectives of TT and BSP requires the use of various approaches, including adjusting timing (shifting), prioritizing certain goals over others (weighting), utilizing Pareto optimization to find the best compromise (Pareto front), applying a hierarchical decision-making process (bi-level programming), and rearranging processes or priorities (reordering) [26].
In the shifting method, BSP is addressed with minor adjustments to the timetable, such as slight shifts in arrival and departure times, to lower the operational costs associated with scheduling. This method optimizes a selected objective function while ensuring that a second objective does not fall below or exceed a certain threshold [27]. Kliewer et al. [27] were the first to introduce this method for the vehicle scheduling problem. Ceder [28] also used the shifting technique to enhance the service level by increasing passenger comfort and minimizing wait times. To address the scheduling problem, the authors utilized the deficit function. Their objective was to reduce the number of vehicles required to cover the trips planned during the timetabling phase. However, Ceder’s research is specifically focused on conventional buses and is not applicable to EBs.
Another approach to address this type of problem is the weighting method. Guihaire and Hao [29] presented an iterative local search algorithm with the goal of optimizing service quality and decreasing bus operating expenses. Service quality was evaluated based on the evenness of headways, and operational costs were assessed by considering the lengths of deadhead trips and fleet size. Another application of the weighting technique for this problem is detailed in [30], which focuses on balancing passenger waiting times with the overall cost of resources. The problem was also addressed by Schmid and Ehmke [31], who took a flexible approach to schedule modifications and balanced departure times. Their objectives included minimizing operational expenses and optimizing the timetable’s quality by minimizing deviations from desired headways. Carosi et al. [26] developed a MILP model to optimally balance the costs for service providers and passengers’ waiting times for conventional buses. However, this model does not take into account the seat availability metric. The key challenge of studies using the weighting method is determining the weight values that best represent the desires of both transit authorities and bus users.
Another method for addressing such integrated problems is the Pareto front technique. This approach aims to identify the optimal Pareto front, a set of solutions where no other solutions can outperform any in the optimal set without compromising another criterion. Essentially, it enables decision makers to visualize trade-offs and make choices that best balance competing objectives, ensuring that every solution on the Pareto front represents an optimal balance of these objectives. Weiszer et al. [32] introduced a model focused on two goals, which were minimizing passenger wait times at each bus stop and reducing the number of buses required to cover all scheduled trips. In order to address TT and BSP, Ibarra-Rojas et al. [33] employed two mathematical formulations, yielding optimal headways and schedules. After that, they combined the two problems into a single bi-objective integrated problem. Teng et al. [18] developed a multi-objective particle swarm optimization (PSO) approach to address single-line bus timetabling and the bus scheduling problem for EBs. The authors focused on reducing both the total number of electric buses needed and the costs associated with charging them.
The bi-level programming technique is another approach that tackles problems on two levels: leader and follower. In this method, leaders optimize their objectives independently of the followers. After that, followers address the problem by optimizing their own objectives, utilizing the outcomes from the leader’s initial optimization stage [34]. Liu and Ceder [35] developed a bi-level integer programming model to determine the departure time of buses aimed at minimizing passenger waiting times and ensuring seat availability, while also reducing the number of buses needed. However, unlike our research, their study did not consider EBs, deadhead trips, and the fuel costs of buses. Liu and Shen [36] applied this method to address bus TT and BSP. At the first level, they focused on minimizing the number of buses required for each trip. Subsequently, at the second level, they aimed to reduce passengers’ transfer times at bus intersections and transfer hubs, taking into account the solutions derived from the first level.
The reordering method is the last approach discussed, and it considers public bus transit planning as a unified, integrated problem [35]. This method is named “reordering” because it rearranges the traditional sequence of bus operational planning steps. Xu et al. [37] developed a framework based on a time-space network to combine electric bus TT and EBSP. This framework takes into account various factors such as minimum and maximum headway times, deadhead trips, and the battery capacities of the vehicles. The authors aimed to maximize operational profit by increasing the number of service trips and reducing operational costs. This reduction in costs is achieved by minimizing the number of EBs used and the travel time of deadhead trips. Quttineh et al. [38] introduced a new mathematical model that combines the TT and BSP. However, they did not consider any passenger’s point of view, including factors like waiting time, transfer time, and seat availability, in developing the timetable.
The current research focuses on integrating the timetabling and scheduling of electric shuttle buses, aiming to address multiple objectives. We aim to reduce the number of EBs required for each shift with varying travel times, decrease deadhead trips and electricity costs, and simultaneously lower student waiting times while improving seat availability. This study seeks to find a balance between minimizing operational costs for Concordia University Facility Management and enhancing service quality for shuttle bus users. Unlike many existing studies, we employ and solve an MILP model to identify the most cost-effective schedule. To our knowledge, this dual focus on cost efficiency and service quality in the context of electric buses has not been previously explored.

2.4. Shuttle Bus Operations Planning

Shuttle bus service operation planning and public bus transportation planning serve different purposes and address the needs of distinct user groups, resulting in different operational characteristics. Shuttle buses are often designed for specific tasks, such as transporting employees from transit hubs to workplaces, moving passengers between airport terminals, or moving students between campuses. These services are flexible, typically operate on a smaller scale with limited routes, and adjust routes and schedules based on specific needs or events. They are usually privately funded or managed by specific institutions, focusing on efficiency and convenience for targeted users.
Shuttle bus services are typically used for short-distance commuting at university campuses [39], tourist sites [40], and airports [41]. A simulation-based optimization modelling approach was developed by Liu et al. [42] to help airport shuttle operators efficiently deploy EBs. The authors used an event-driven simulation model to optimize battery capacity, charging power, and the number of chargers to minimize the capital cost and emissions. Similarly, academic institutions across various countries, including the United States, Canada, Japan, Turkey, and Singapore, are increasingly adopting electric buses for their campus shuttle services. This shift underscores a broader commitment to sustainability and modernization within university transportation systems. By integrating electric buses, these institutions are not only improving the efficiency of their transport services but also playing a significant role in reducing carbon emissions on their campuses. Thus, it is necessary to study the operational planning of shuttle bus services that are transitioning to fully electric transit systems.
To ensure cost-effective and practical operations of campus shuttle bus services, a comprehensive framework was developed by Saner et al. [4], with the objective of distributing trips among EBs optimally to balance daily energy usage. This framework also tackles the charging scheduling problem to minimize electricity costs, taking into account both demand and time-of-use rates, significantly reducing charging costs and battery degradation. The authors applied their model on the shuttle bus service of the National University of Singapore. Building on these efficiencies, another integrated optimization method was devised to improve bus timetable and BSP based on real-time passenger demand [43]. Further enriching the operational planning of campus transportation systems, a multi-objective integer programming model was created by Hulagu et al. [44] to incorporate power usage and variable electricity rates within university zones. The objectives were minimizing operational, recharging, and total charging station installation costs and determining the most economical routes for buses to adequately meet the transport demands of the entire campus without exceeding the EB’s range before requiring a recharge. Finally, the implementation of autonomous vehicles for shuttle bus services has been studied by [45]. The authors investigated the social aspects of implementing autonomous vehicles and the legal framework of autonomous driving for shuttle services. Also, the comparison between EBs and modular autonomous vehicles to reduce the energy consumption per passenger has been studied in [46].

2.5. Challenges of Bus Electrification: Vehicle Scheduling and Timetable Adjustments

Electric buses represent a major step forward in sustainable urban transportation. However, their adoption and integration into existing operations pose unique challenges that are not faced with traditional diesel buses. These challenges stem primarily from the distinct characteristics of electric vehicles, such as limited battery capacity, longer charging times, and fewer charging stations, which differ significantly from conventional fuel vehicles [23]. Consequently, transitioning from diesel to electric buses impacts both operational and economic aspects, requiring a comprehensive reevaluation of timetables and schedules for electric buses [13].
EBs are limited by the distance they can travel on a single charge, known as their range. This range is particularly limited under specific operational conditions, including passenger loads, driving profiles, the number of stops, climate conditions, road gradients, and the use of air conditioning or heating systems. For more detailed information on how these factors affect the energy consumption and travel range of EBs, readers are directed to [47,48,49,50]. The successful deployment of EBs is also heavily dependent on the availability of adequate charging infrastructure. Essential to this infrastructure are sufficient charging stations and their strategic locations. Also, the type of charging plays a critical role in the operational efficiency of EBs [23].
One of the main challenges with adopting EBs is the high initial investment required. The costs of purchasing EBs and setting up the necessary charging infrastructure are significantly higher than those for traditional diesel buses [51]. While the operating costs of EBs are lower than conventional buses, the initial investment represents a substantial barrier for many transit agencies considering the switch to EBs. Also, it is crucial to plan for the recycling and procurement of batteries and charging infrastructure, which tend to have shorter lifecycles, to ensure a cost-effective and efficient bus transit system. In response to these challenges, Gao et al. [52] developed a tool that optimizes the battery sizing and configuration of EBs, aiming to enhance their service reliability. Another challenge lies in the need to standardize EBs and the charging technologies to promote wider adoption and compatibility [53]. Moreover, electric buses require specialized maintenance practices that differ from those needed for diesel buses. Consequently, transit agencies must invest in training their technical staff to handle electric-specific issues and perform routine maintenance, which is essential for ensuring the long-term operational stability and efficiency of the fleet.
Pantograph chargers provide opportunity charging along bus routes, reducing the need for large batteries and consequently lowering energy consumption. This technology seamlessly integrates into existing bus networks by installing fast chargers at specific stops. This arrangement maintains continuous bus service, reduces maintenance costs, enhances bus availability, and allows for around-the-clock operations [54]. This charging technology is highly flexible and can charge electric buses during the day at rates from 150 kW to 600 kW. Importantly, pantographs are designed to be compatible with buses from various manufacturers. They adhere to international standards and have undergone extensive interoperability testing to ensure this compatibility. Although pantograph systems are more costly upfront, they have the potential to lower the total cost of ownership (TCO) and operational costs for EBs over time [55].
The introduction of electric buses introduces specific challenges for BSP and TT, mainly because of their limited range and lengthy charging times [38]. EBs must make trips to charging stations as part of their daily routines to ensure they can operate throughout the day. By strategically scheduling charging during off-peak hours and aligning with time-of-use (TOU) electricity rates, it is possible to reduce charging costs through dynamic electricity pricing and lessen the load on the electrical grid [56]. Timetables may require modifications to allow longer stops at charging stations, especially if on-route pantograph charging has been implemented. Consequently, adjustments in timetabling and scheduling are necessary to cater to the specific requirements of EBs, ensuring they serve the objectives of both the service providers and the needs of the passengers. Such adjustments could lead to more waiting time for passengers, impacting the overall appeal of EBs. Incorporating charging times into bus timetables without substantially extending service hours requires careful planning and often encounters challenges from peak traffic periods and high passenger demand [23].
Numerous mathematical optimization models have been formulated for the BSP and TT of traditional buses. Nonetheless, these models fall short when applied to EBs. Therefore, there is a need to create new mathematical models that account for the distinctive characteristics of EBs. This requirement highlights the importance of further research into the various phases of bus operation planning, especially TT and BSP. As indicated in Table 1 and according to [13], fast-charging, wireless charging, and battery swapping are the charging strategies that influence both TT and electric BSP (EBSP). That is why studying the integration of TT and EBSP for bus transit systems that use such charging technologies is necessary. Depot charging only influences the BSP phase and continuous charging has no significant impact on TT and BSP.
In the timetabling step, the duration of charging for electric buses, which depends on the charging technology used, plays a critical role. To improve the alignment of bus arrival times at intersections, EBs may use the downtime during service connections to recharge. This requires explicitly integrating charging durations into the timetabling process. Fast-charging technologies significantly influence the way timetables are designed. For instance, opportunity charging lasts approximately 30 s and can occur at designated stops without passengers alighting. On the other hand, pantograph charging, conducted when buses are not carrying passengers, demands strategic location planning to prevent interference with other traffic flows. Given that buses often have extended wait times at transfer points compared to regular stops, leveraging these intervals for charging is a feasible strategy. Thus, timetables should detail not just the bus schedules but also the timing and locations for charging, including identifying optimal locations for charging infrastructure. If the charging process is brief, less than 15 min, it directly impacts the timetable configuration [13]. Conversely, longer charging times, ranging from 2 to 6 h, as seen with depot charging, do not affect the timetable. Similarly, during the BSP phase, the specifications of the bus fleet, including capacity, range, and energy consumption, are vital for developing an optimal schedule, underscoring the importance of these considerations in planning an efficient bus operation schedule.
Typically, vehicle timetabling and scheduling for public transit systems are handled as two separate processes, where the timetable is created first and then used to inform the scheduling. A major limitation of this sequential approach is that it often overlooks the interactions between the timetable and the schedule. This oversight can lead to suboptimal outcomes. For instance, a well-constructed timetable might require using many buses, which increases operational costs. Conversely, a well-designed schedule might compromise the timetable’s effectiveness by restricting vehicle availability. Thus, the solution is a complete integration of timetabling and bus scheduling. The complete integration approach treats the problem as a fully integrated problem, simultaneously addressing both TT and BSP of public transit planning. For example, minor adjustments to the bus timetable could lead to a more efficient vehicle schedule. This integration is more essential for EBs, where the traditional sequential approach—designing the timetable first and then scheduling—can significantly increase costs due to the EBs’ limited range and longer charging times. For instance, an overly strict timetable may make the optimal schedule infeasible for EBs due to their charging requirements. Therefore, a fully integrated approach to timetabling and scheduling is necessary for transit systems using electric buses.

3. Methodology

In this section, we explain the problem description and the methodology used to solve the problem. We propose an algorithm to determine the optimal headways for different passenger volumes and find the most efficient schedule for the EBs. The proposed methodology aims to reduce passengers’ waiting times and increase their comfort by ensuring seat availability, and optimizing the schedule of shuttle buses to minimize the total operational costs. First, we will discuss timetable development. Then, we will present a mathematical optimization model for the shuttle bus scheduling problem. Finally, we will describe the proposed workflow.

3.1. Problem Description

This study aims to improve the timetable and schedule of fully electric shuttle bus services at Concordia University that use pantograph chargers to charge EBs. By optimizing bus headways, we aim to minimize waiting times and ensure seat availability for student comfort. Simultaneously, we seek to optimize the EBs’ schedule to lower operational costs while ensuring all scheduled trips are covered. This includes minimizing the number of required EBs, deadhead trips (empty trips to relocalize buses), and electricity costs for charging EBs.
The problem is centered around a real-world case study of Concordia University in Montreal, Canada, focusing on its shuttle bus service. The service includes two bus stops, S = { S 1 , S 2 } , which serve as the starting and ending points of the shuttle route. Additionally, there is a depot, denoted as O, from which the electric buses begin their daily operations. The EBs are short-range electric buses that must be charged frequently during their operation with pantograph chargers located at the Loyola campus, represented by F. Since charging with pantograph chargers takes 5 to 10 min to fully charge an EB and they could only charge one EB at a time, we should also consider the charging scheduling and its impact on the shuttle bus frequency settings and scheduling.
The operation time of the shuttle bus service is denoted by T and it is divided into J intervals or time spans. The total number of daily trips made by the shuttle bus is represented by I, and the number of trips within each specific time span is denoted by I j , where j J . This number depends on the headway value h. For instance, if h = 20 min and the total time | T j | = 100 min, then there will be five trips for time span j J . Headway between shuttle buses varies between a minimum of h m i n and a maximum of h m a x , and it is assumed to be constant throughout a time span. The travelling distance and travelling time between the bus stops are known during the planning and denoted by d i j and τ i j , where i , j S , respectively. Similarly, the travel distance and travel time from the depot to the bus stops and vice versa are fixed and given. The ridership datasets of the shuttle bus are available, and we assume the number of passengers will not be affected by the headway of shuttle buses.

3.2. Waiting Time and Passenger Comfort

Designing an effective and practical timetable is complex due to balancing multiple objectives. According to [12], the primary goals of frequency setting and TT are minimizing passenger waiting times and in-vehicle seat availability. The interaction between bus headways, passenger waiting time, and seat availability is essential in optimizing public transport systems. Shorter headways typically reduce waiting times and improve seat availability, leading to higher passenger satisfaction but potentially increasing operational costs. On the other hand, longer headways can result in longer waiting times and crowded buses, decreasing seat availability. Effective transit management requires carefully balancing these factors by adjusting headways based on passenger demand to enhance both service quality and operational efficiency.
According to McLeod et al. [57] research, the average waiting time of bus users during a specific time span j J , denoted by A W T j , is calculated as follows:
A W T j = 1 2 σ j 2 + μ j 2 μ j
where μ j and σ j 2 are the mean and variance of the bus headways for time span j J , respectively. The average passenger waiting time consists of two components. The first component, 1 2 μ j , is influenced by the bus service frequency. The second component, 1 2 σ j 2 μ j , is impacted by the variability in headways. Typically, the component associated with bus service irregularity holds greater significance in performance measurement since the other component remains constant for a specified bus frequency. That is why we focus on the average interval, or headway, between shuttle buses. In this study, the headway value is consistent across all time spans, resulting in a variance of zero. Therefore, given a headway value h, the average waiting time is given by
A W T j h = h 2
The pattern of passengers’ arrival is assumed to follow a Poisson distribution based on the ridership dataset from the existing timetable of the shuttle bus service. The Poisson distribution serves as a robust statistical model for analyzing passenger arrivals at bus stops, given its ability to accurately represent events that occur independently and maintain a consistent average rate. This model assumes that each passenger’s arrival is an independent event unaffected by the arrivals of others, which aligns well with the random and uncoordinated nature of passengers arriving at bus stops. Characterized by a constant mean rate of passengers arriving, denoted by λ , the Poisson distribution captures the average rate of passenger arrivals per unit of time. The value of λ is determined using the available ridership data. The total waiting time of passengers for trip i I j where j J at a bus stop is determined by both the departure time of trip i at time span j and the number of passengers waiting at a bus stop, denoted as ρ i j . The total waiting time for trip i I j is expressed through the equation:
w i j = ρ i j × A W T j
The total waiting time for time span j J , denoted as γ j , is calculated as follows:
γ j = i I j w i j
Passenger comfort is hard to quantify, and according to [12], in-vehicle bus comfort through seat availability is one of the most important attributes of passenger comfort. To assess passenger satisfaction, we start by calculating the load factor, denoted as L. Load factor is equal to l i j / ϕ , which l i j is the number of passengers riding on trip i I j , where j J and ϕ is the number of seats in the shuttle bus. Let Q be the bus capacity and L m a x = Q / ϕ be the maximum load factor. If L 1 , all passengers have seats; otherwise, if L > 1 , ϕ passengers have seats while ( L 1 ) ϕ passengers experience crowding and must stand. Based on the load factor values, we calculate the passengers’ comfort through seat availability by quantifying this criterion. As a result, passengers’ comfort, η i j , for trip i I j can be quantified and calculated by
η i j = 1 l i j ϕ L m a x ϕ l i j L m a x ϕ ϕ ϕ < l i j
and the total comfort of passengers for time span j J is as follows:
δ j = i I j η i j

3.3. Shuttle Bus Scheduling

This section explains the electric shuttle bus scheduling problem in more detail. We present an arc-based mathematical formulation to model the scheduling of electric shuttle buses with the objective of minimizing the total operational costs of EBs. The operational costs include the usage cost of each EB, or, in this case, the annual leasing fees for each bus that Concordia University must pay for each shuttle bus shift, the travelling costs of EBs, the deadhead trips, and the cost of charging EBs with the pantograph chargers. We assume buses can be leased on a per-shift basis, so the number of leased buses can vary between time spans.
In this paper, the term trip is used to describe each scheduled travel within the shuttle bus service timetable. Assume the shuttle bus operates daily starting at 07:20 a.m., running at 50-min intervals until noon. This yields a timetable with six trips for the morning time span, specifically at 07:20 a.m., 08:10 a.m., 09:00 a.m., 09:50 a.m., 10:40 a.m., and 11:30 a.m. To address the shuttle bus scheduling problem, we consider a set of trips, represented as I, which are defined by their start times s i and end times e i . This set of trips is derived from the timetabling process outlined in Section 3.4. Each electric shuttle bus is allocated to only one trip at any given time. Also, an electric bus can begin a new trip if it completes its previous one with sufficient time and energy remaining to start the next trip.
Deadhead trips, which involve EBs travelling empty in order to relocate for subsequent trips and charging, is an essential component of the operational logistics of EB scheduling. These trips typically occur between the depot and the starting points of the bus line or between the charging station and the starting points of the bus line. Let d i j represent the distance of a deadhead trip from i to j, where i and j can be a depot, a charging station, or the start/end location of a trip. The trip distance i I , is denoted by d ˜ i and Δ i represents the duration of trip i I . The maximum distance an EB can travel on a fully charged battery is indicated by D and the annual leasing or usage cost of each EB is represented by C v . The cost per unit distance travelled by an electric shuttle bus is denoted by c d . Lastly, the cost of using a fast-charging station at time t is given by C t .
Electric shuttle buses begin their routes fully charged from a depot. As long as they have enough energy to return to the same depot or a pantograph charger, they may run the whole schedule. At the pantograph charging station, only one EB can be charged at a time, and a fixed charging period, denoted by U, is assumed for each charging event. We conceptualize the charging station’s capacity using time-expanded station nodes. This involves dividing the possible times for charging EBs into distinct, one-minute intervals. The set of time periods, denoted by P, is defined as { 1 , 2 , , | P | } , representing the planning horizon for charging EBs at the charging station. Furthermore, P represents the sequence of time periods { 1 , 2 , , | P | U } , ranging from the first period to the last, adjusted by subtracting the fixed charging duration of electric buses.
Assuming a fixed charging duration for EBs and charging them to full capacity simplifies their operational planning. Fully charging the batteries, rather than maintaining them at mid-level charges, helps preserve their health and longevity. Battery management systems are designed to optimize full charging cycles, and avoiding partial charges can extend battery life. Additionally, fully charging the batteries results in predictable energy usage patterns, which are essential for effective energy management and planning. This allows the university to more accurately predict electricity costs and manage demand on the electrical grid.
Our arc-based formulation is based on the following network G = ( N , A ) where N includes the daily trips of the shuttle bus, the depot, O, and the time-expanded nodes of the pantograph charger, and A represents the feasible connecting arcs. The arcs in A are categorized into five types: depot-to-trip arcs from O to i I ; trip-to-trip arcs from i I to j I if s i + Δ i + τ i j e j (i.e., if the corresponding connection is feasible); trip-to-charger arcs from i I to the time-expanded node t P at the pantograph charger located at the Loyola campus, represented by F if s i + Δ i + τ i t | P | U ; charger-to-trip arcs from t P to j I if t + τ t j s j ; and trip-to-depot arcs from j I to O. Additionally, A represents all potential arcs between trips and the charging station. The cost of an arc ( i , j ) is defined as follows: depot-to-trip arcs have cost c i j = c d d i j + C v ; trip-to-charger arcs have cost c i t = c d d i t + C t where t P ; and trip-to-trip arcs have cost c i j = c d d i j . As an example, an arc-based network for three time spans is illustrated in Figure 1. The proposed mathematical model optimizes one time span individually, using the list of trips derived from the headway value. In this model, we focus only on feasible trips between nodes, removing any infeasible connections between trips, the charging station, and the depot. This is carried out by considering the travel times between nodes and the duration of the trips.
We now introduce a mathematical optimization model for scheduling electric shuttle buses. The following defines the model’s decision variables: Let x i j be a binary decision variable, where x i j = 1 indicates that a shuttle bus takes arc ( i , j ) , and x i j = 0 otherwise. Additionally, let r i be a continuous decision variable, indicating the cumulative distance travelled from the depot to the endpoint of trip i I since the last charging event. Let v i j be a variable equal to x i j r i . The purpose of v i j is to make the model linear.
The bus scheduling problem is modelled as follows:
Z = min ( i , j ) A c i j x i j
s.t.
i ( i , j ) A x i j = 1 j I
j ( i , j ) A x i j j ( j , i ) A x j i = 0 i N
r j = i ( i , j ) A ( v i j + ( d ˜ j + d i j ) x i j ) i S
r t ( 1 x i t ) D ( i , t ) A
r j D j S P
v i j D x i j ( i , j ) A
v i j r i i I
v i j r i ( 1 x i j ) D ( i , j ) A
i ( i , t P ) A x i t + i ( i , t P ) A s = 1 U x i , t + s 1 t P
x i j { 0 , 1 } ( i , j ) A
r j 0 j I P
v i j 0 ( i , j ) A
The objective function (7) calculates the total operational costs of shuttle bus scheduling. The costs include the usage cost of each electric bus, the charging costs, and the travel costs between trips and the charging station. Constraints (8) and (9) ensure trip coverage and flow conservation, respectively. Constraint (10) measures the accumulative distance travelled since the most recent charging event. Constraint (11) specifies that the total distance travelled by an electric bus is reset to zero whenever it recharges at a station. Constraint (12) requires that the total distance travelled by each electric bus must not surpass its maximum range. Constraints (13) ensure that the value of v i j does not exceed the maximum travel range of EBs whenever the corresponding decision variable x i j = 1 . If x i j = 0 then v i j is forced to zero. Similarly, constraints (14) guarantee that the auxiliary variables cannot exceed the total travelled distance of each EB. Constraints (15) indicate the exact value of v i j . If x i j = 1 , then v i j is at least r i . If x i j = 0 , then v i j should be equal to zero. Finally, constraint (16) requires adherence to the station capacity constraint.

3.4. Solution Approach

To determine the optimal timetable and headway for the shuttle bus service, we developed and implemented an algorithm using a time-span-based decomposition. This algorithm assesses different headway values to develop an effective timetable that minimizes waiting times and improves passenger comfort. Simultaneously, it optimizes the shuttle bus schedule to reduce operational costs. The inputs for this algorithm include the shuttle bus service data, EBs’ specifications, designated time spans, student ridership data, and the weighted importance of each optimization objective. The optimization process begins with the initial time span j = 1 . For this time span, we start with the smallest possible headway, h m i n , and calculate both the average waiting time of passengers and in-vehicle bus comfort for passengers, based on Equations (4) and (6), respectively, represented in Section 3.2. Based on the selected headway, we then determine the list of departure times for that time span, which is then incorporated into the mathematical optimization model presented in Section 3.3 to generate a bus schedule. The proposed algorithm calculates the costs associated with each headway, considering the weights assigned to the waiting time, ω γ , comfort ω δ , and cost ω Z . We collect the outcomes as the normalized weighted sum of the objectives, represented by the variable ψ j for each time span j J . The formula used to calculate ψ j is as follows:
ψ j h = ( γ j h min h ( γ j h ) ) max h ( γ j h ) min h ( γ j h ) ω γ ( δ j h min h ( δ j h ) ) max h ( δ j h ) min h ( δ j h ) ω δ + ( Z j h min h ( Z j h ) ) max h ( Z j h ) min h ( Z j h ) ω Z
where γ j h , δ j h , and Z j h are, respectively, the waiting time, seat availability metric, and total operational cost for time span j under headway h, and ψ h = j = 1 J ψ j h is the total normalized weighted sum of the objectives across all the time spans.
This process is then repeated for each possible value of h, ranging from h min = 15  min to h max = 40 min with Δ h = 1 . The optimal headway is the value that minimizes ψ j h . We denote this optimal value as h j * = arg min h ( ψ j h ) and the corresponding minimized value as ψ j * = min h ( ψ j h ) . Once h j * is determined, the corresponding schedule is fixed and the algorithm then optimizes time span j + 1 . Note that the bus scheduling optimization model takes into account the bus state (location, remaining charge, etc.) from the previous window; thus, the overall schedule remains consistent. Once the last time span is optimized, a full bus schedule is obtained by merging each time span’s optimal schedule. Finally, the total weighted objective value is given by ψ = j = 1 J ψ j * . The detailed steps of our method are outlined in the pseudo-code in Algorithm 1.
Algorithm 1 Pseudo-Code of Integrating TT with EBSP.
1:
functionTT-EBSP
2:
    Input:
3:
         Ridership dataset
4:
         Shuttle bus network data
5:
         Electric bus specifications
6:
         Other required parameters and thresholds
7:
    Output:
8:
         Best balance between bus timetabling and scheduling
9:
       j 1
10:
     h h m i n
11:
    while  j | J |  do
12:
        while  h h m a x  do
13:
           Obtain the number of passengers for h based on Poisson distribution and the ridership dataset
14:
           Calculate total average waiting time for h, γ j h
15:
           Obtain passenger comfort for h, δ j h
16:
           Collect the list of trips for each headway
17:
           Optimize the scheduling of shuttle buses for h
18:
           Collect Z j h
19:
           Compute ψ j h
20:
            h h + 1
21:
        end while
22:
        Determine h j * and ψ j *
23:
        Update the SOC of electric buses for the next time slot
24:
        Update the starting and ending points of the first and last trips
25:
          j j + 1
26:
    end while
27:
    return  { h j * , j J } , ψ , and optimal schedule
28:
end function
The reason to decompose the problem is mainly to find a coherent way to calculate headways. We start by optimizing the first time span, after which we update the necessary inputs for the subsequent time span and proceed to solve the scheduling problem for the next iteration. Key parameters that require updating include the state of charge of the electric buses, which our model represents as the total travel distance of each bus. Updating these parameters is essential for the optimization model to resume effectively from where the last time span concluded, ensuring continuity and efficiency in our approach.

4. Case Study and Results

4.1. Case Study

Concordia University, located in Montreal, Canada, is home to two campuses: Sir George William (SGW) and Loyola. SGW Campus houses 40 buildings and Loyola Campus comprises 27 buildings. During the 2022–2023 academic year, the university hosted 35,404 undergraduates and 10,084 graduates, totalling 45,488 students [58]. Many students rely on public transportation, the university’s shuttle bus, or personal vehicles for their daily commute. The shuttle bus service, free for Concordia’s students and staff, facilitates travel between the SGW and Loyola campuses from Monday to Friday according to a set schedule. The route of the shuttle buses, the real-time location of buses, and trip details provided by Concordia University’s Facility Management are illustrated in Figure 2.
Concordia University is promoting sustainable transportation through its Climate Action Plan, which targets reducing the university’s carbon footprint and achieving climate neutrality within 20 years. This includes a commitment to fully electrify its campus transportation system by 2040, a move expected to cut 25% of its total emissions from 2014–2015 levels. The focus is on converting the shuttle bus fleets to electric, significantly lowering CO2 and greenhouse gas emissions. This study specifically addresses the Concordia University shuttle bus system, covering the operational and economic aspects of the service between SGW and Loyola campuses. It presents a strategic plan to transition to electric buses and optimize their schedule for efficiency and student convenience. The goal is to enhance service timetables, reduce student wait times, increase comfort, and minimize operational costs.
Facility Management at Concordia University is focused on developing operational strategies to ensure a smooth and efficient transition to electric buses for their shuttle service. This research aims to provide a method to establish the most effective timetables and schedules for the shuttle, determine the best type of EBs, identify the optimal number of EBs to lease, and outline the best headways to seamlessly integrate electric buses into the existing service.
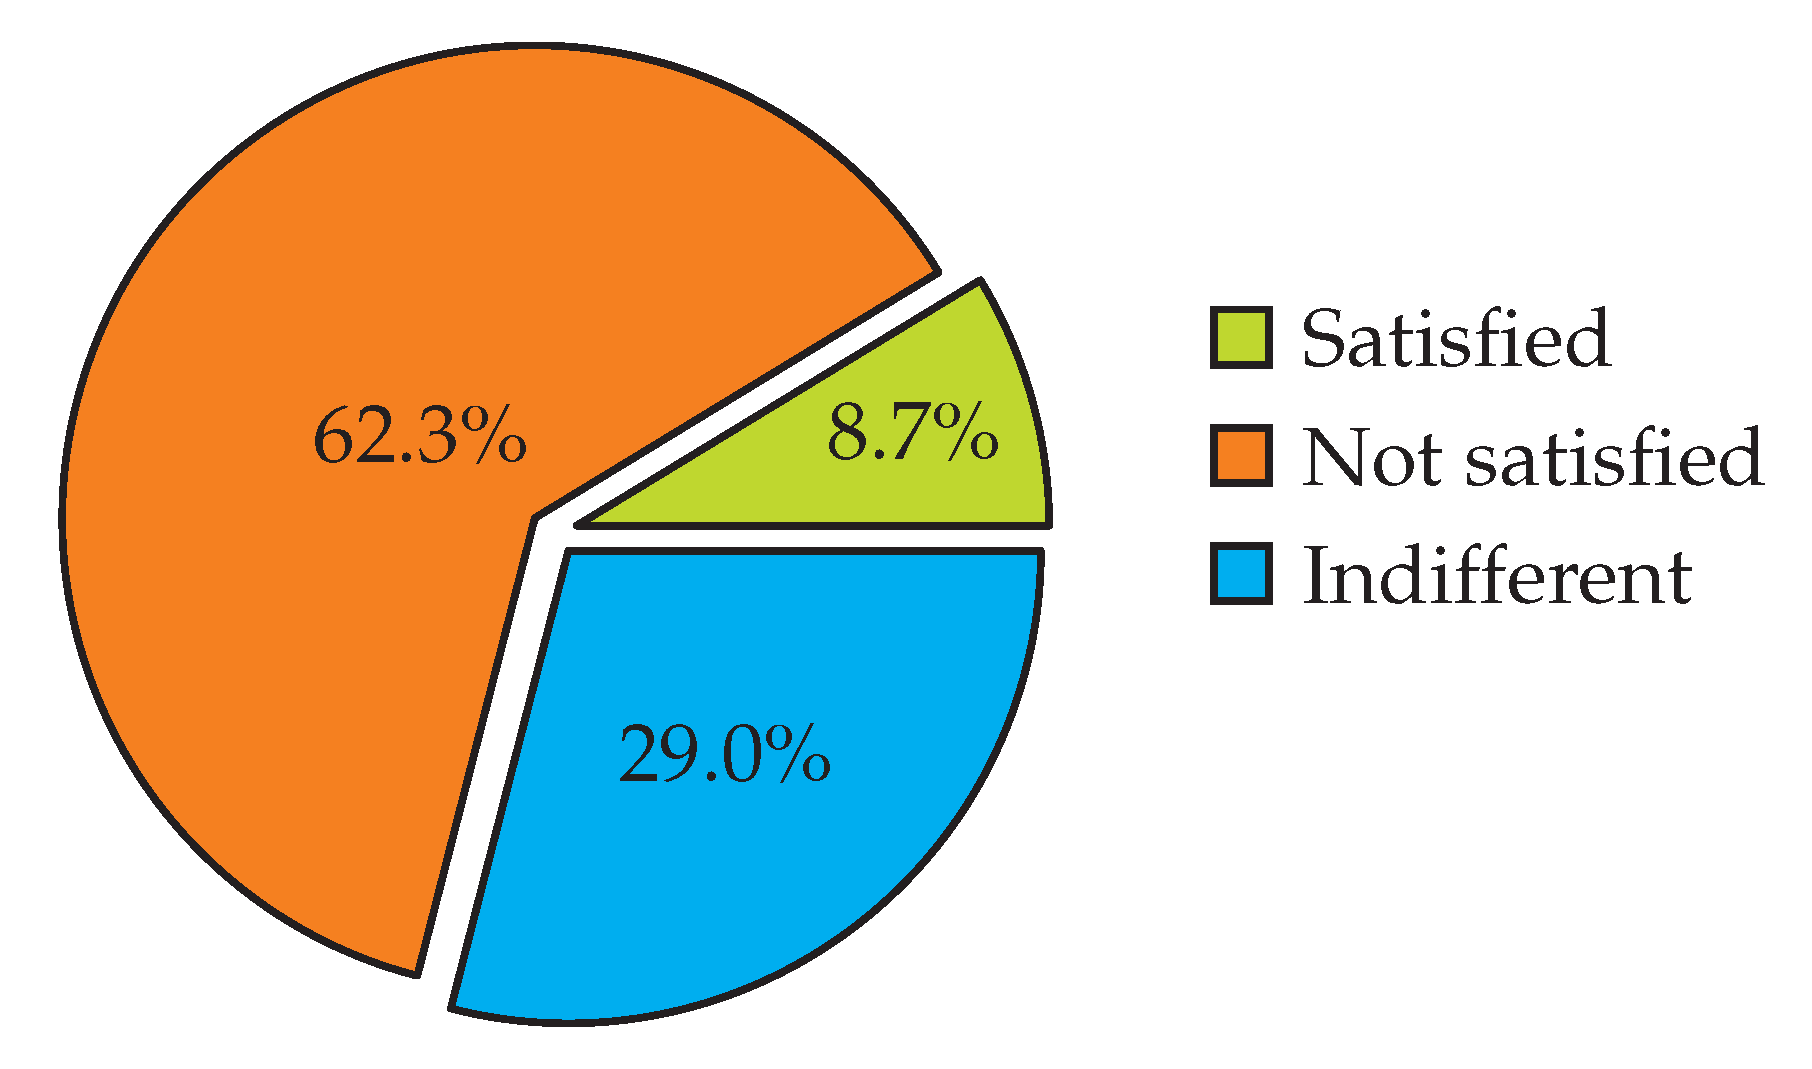
In an effort to evaluate the effectiveness and satisfaction levels associated with the Concordia shuttle bus service, a student-run social campaign conducted a detailed survey, gathering insights into student satisfaction, seat availability, and waiting times [59]. The survey data underscore the urgent need for operational improvements in the Concordia shuttle bus service. Addressing the issues of seat availability and wait times could greatly enhance user satisfaction. The findings reveal that only a small portion of students expressed full satisfaction with the shuttle service, suggesting considerable potential for improvement. According to Figure 3, a majority reported dissatisfaction and a notable fraction remained indifferent.
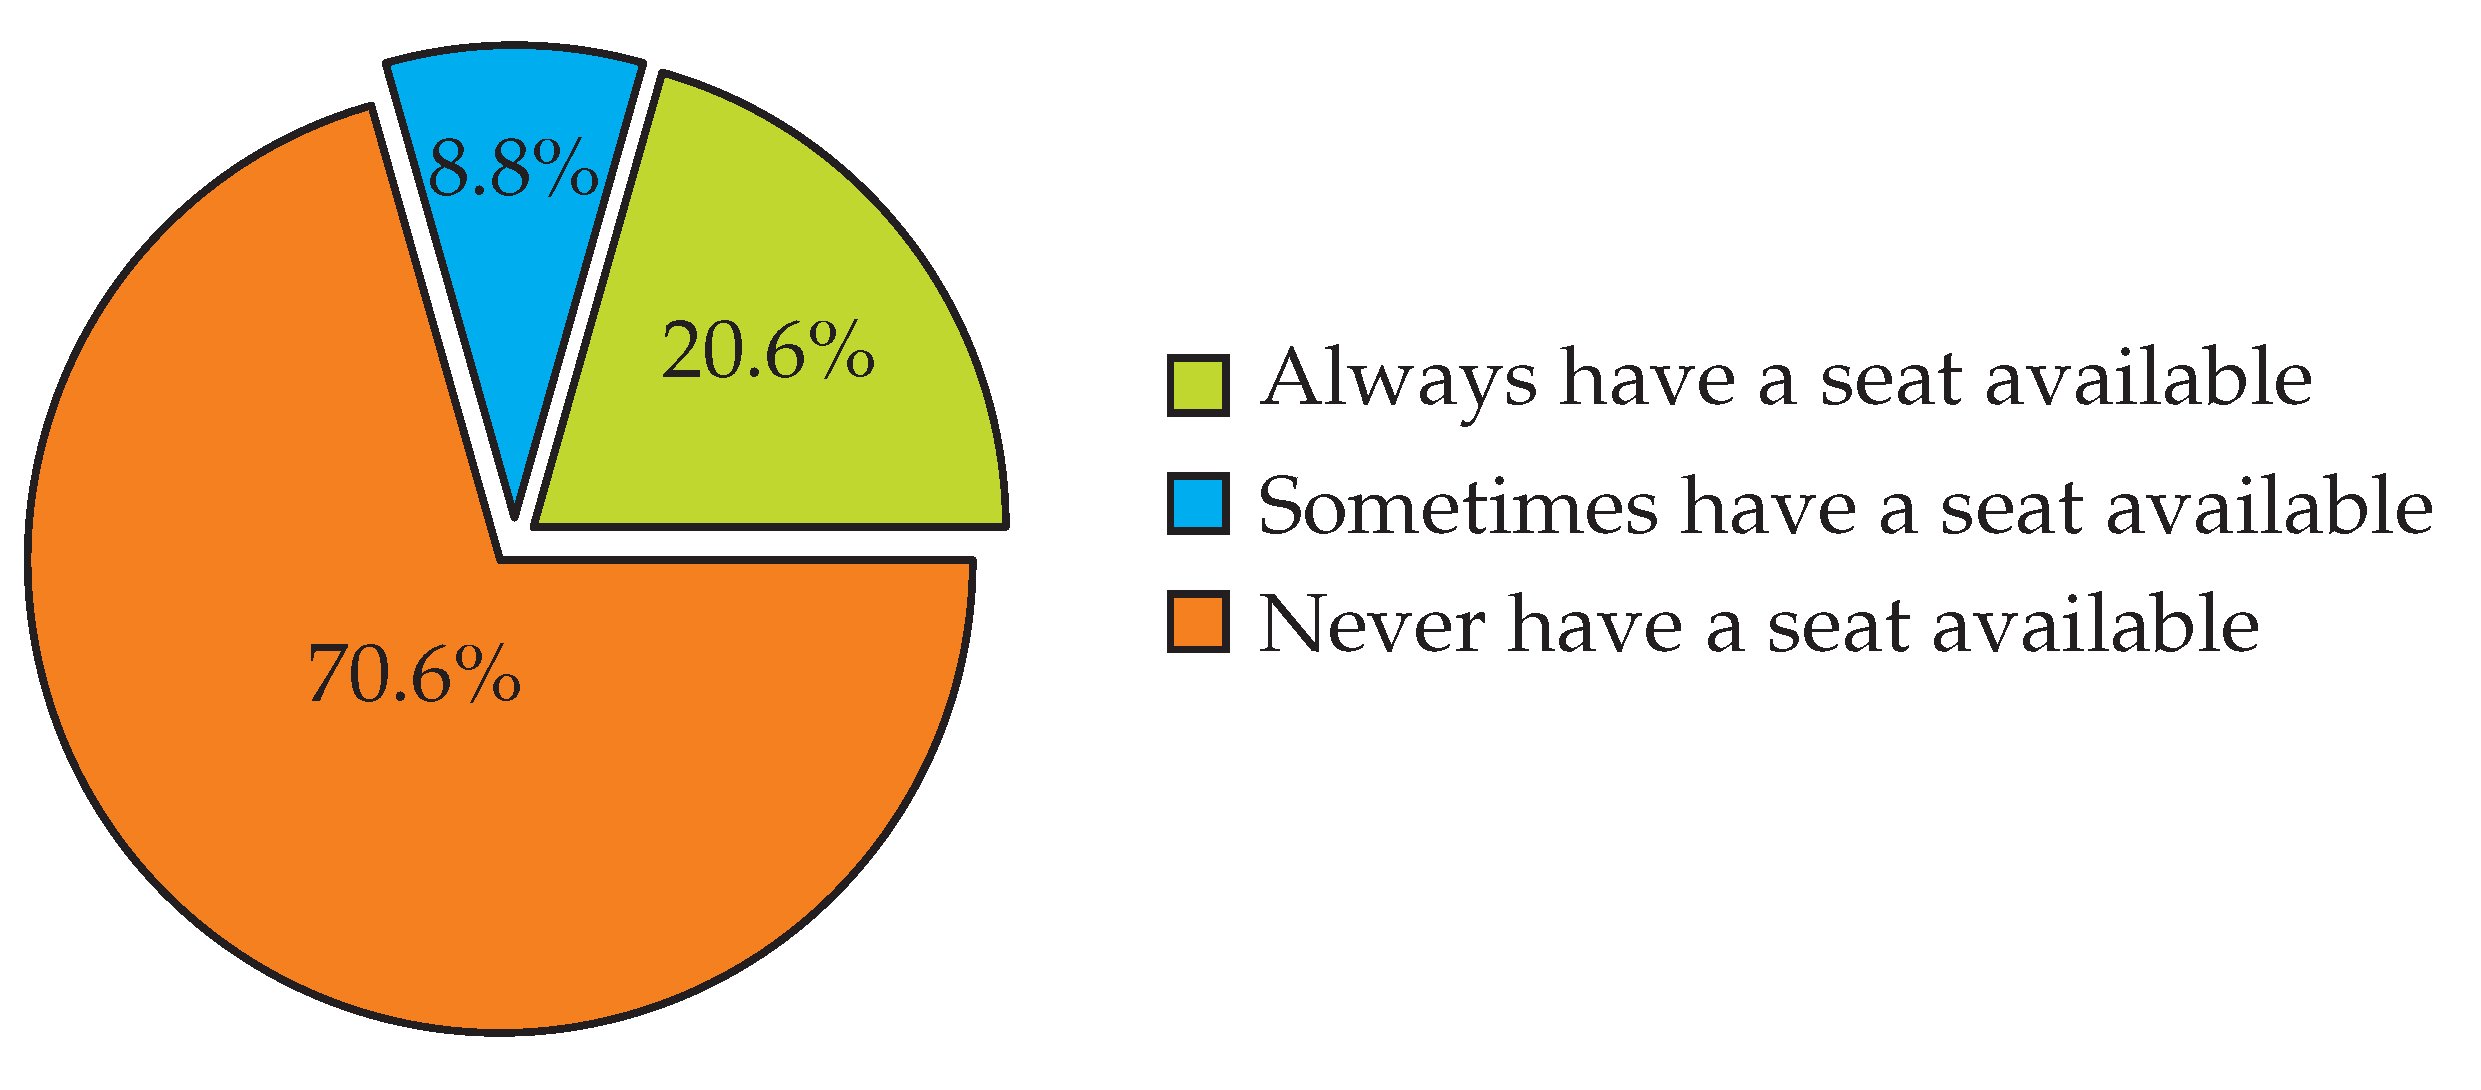
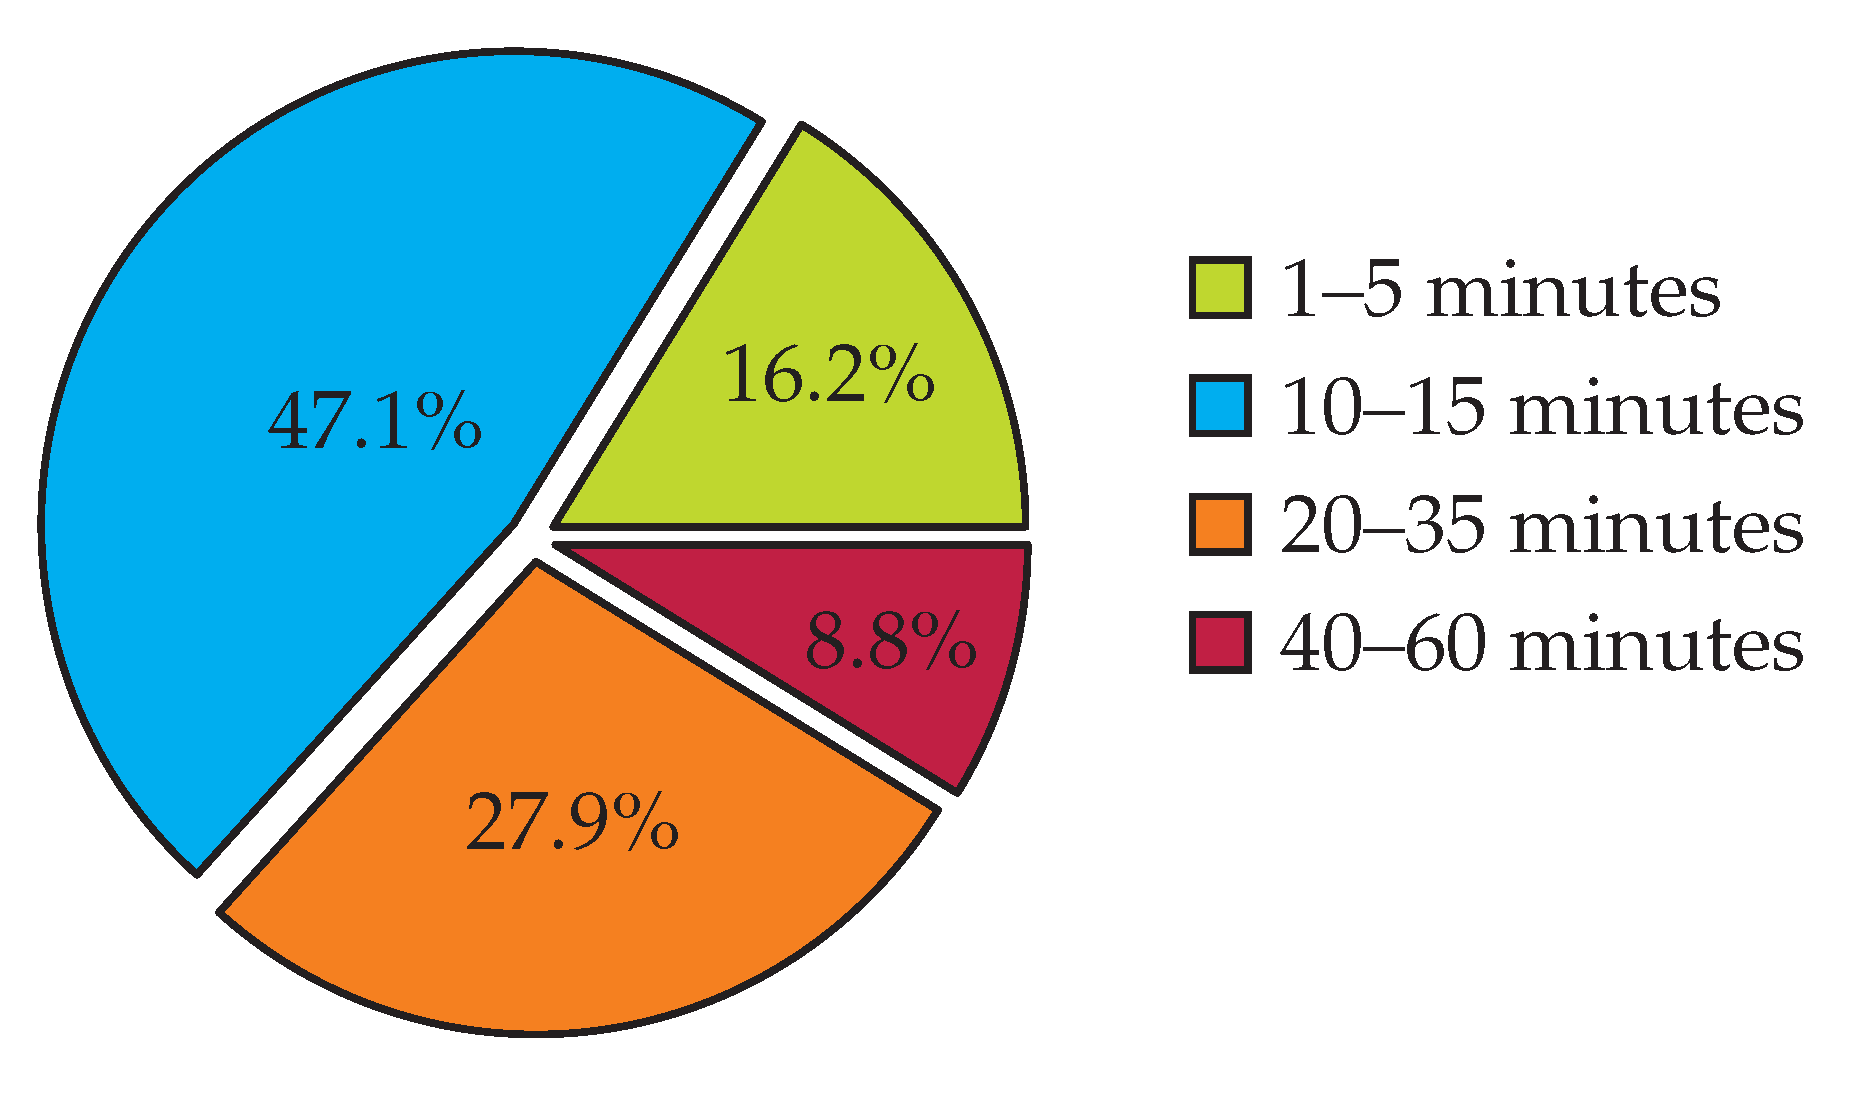
As shown in Figure 4, concerning seat availability, a substantial number of respondents indicated that they never find seats, highlighting a major issue with capacity that likely affects overall satisfaction and comfort. The distribution of responses presented in Figure 5, regarding waiting times shows that while most students wait for a moderate duration, a considerable percentage experience longer waits, and only a few enjoy minimal waiting times.
Concordia University has provided access to its 2022 shuttle bus ridership data. This dataset records the number of students who used the shuttle service throughout the year, detailing usage at different times of the day according to the current timetable. Given that the class schedule remains relatively consistent from year to year, the average ridership can be effectively used for planning in subsequent years. After receiving these data, we implemented our proposed solution approach to determine the optimal headways, aiming to reduce waiting times and enhance passenger comfort. Simultaneously, we optimized the schedule for electric buses to minimize total operational costs. This methodology enabled us to create and implement a more efficient and cost-effective timetable and schedule for the shuttle bus service.

4.2. Model Results Analysis

In this section, we detail the outcomes of optimizing the Concordia shuttle bus service and compare these results with the existing timetable. Additionally, we perform a sensitivity analysis to determine which type of EBs, with various characteristics, would be most suitable for the Concordia shuttle bus service.
The starting and ending points of the trips are the two main campuses of Concordia which are SGW and Loyola campus. Both the conventional shuttle buses and the new electric buses have the same seating capacity, which is 40 seats. The depot’s coordinates are provided, and the pantograph charging station is located at the Loyola campus near the bus stop. The annual usage cost for an EB is CAD 53,266 [60], which translates to approximately CAD 17,775 per shift. Based on [60], the capital cost of pantograph chargers is CAD 230,000. We assumed that the estimated lifespan of the buses is 15 years. Additionally, the annual usage cost of conventional shuttle buses, specifically the Nova Bus model currently used for the Concordia shuttle bus, is CAD 23,333, or approximately CAD 7777 per shift. According to [61], the operational cost per kilometer is CAD 0.662 for an EB and CAD 0.67 for conventional buses. Additionally, the maximum travel range for EBs is assumed to be 78 km. It is crucial to understand that the considered operational costs are based on the number of working days in a year, which are then annualized to facilitate direct comparison with the yearly costs associated with using new EBs. The weights assigned to waiting time, seat availability, and costs are 0.25, 0.25, and 0.5, respectively. Concordia University’s Facility Management has the flexibility to adjust these weights based on their preferences and can rerun the model as needed.
According to data provided by Concordia University’s Facility Management, the shuttle bus service annually consumes approximately 90,026.21 litres of fuel. The greenhouse gas emissions from this volume of fuel, estimated using emission factors of 2.681 kg/L for CO2, 5.1 × 10 5 kg/L for CH4, and 2.2 × 10 4 kg/L for N2O, result in annual emissions of 241.36 tonnes of CO2, 0.0046 tonnes of CH4, and 0.0198 tonnes of N2O. To account for their higher global warming potentials, methane and nitrous oxide emissions are converted to CO2 equivalent emissions using conversion factors of 86 kg CO2 for methane and 298 kg CO2 for nitrous oxide, resulting in additional emissions of 0.40 tonnes CO2 from CH4 and 5.90 tonnes CO2 from N2O [62]. The total emissions are then summed to yield 247.66 tonnes CO2 per year from the combustion of diesel fuel for the shuttle bus service. Also, the unit cost of diesel in Montreal is assumed to be 1.865 CAD/litre.
The comparison between the current Concordia shuttle bus service timetable and the proposed timetable from our study is detailed in Table 2. Note that the reported results are on an annual basis. The results of the current timetable are based on the assumption that the existing timetable and schedule of buses are being performed by current diesel buses. According to this table, our analysis shows that the proposed timetable offers improvements in both waiting times and seat availability across the given time spans when compared to the existing schedule. The computational time for the proposed algorithm across the three intervals totals 4690 s, which is approximately 78 min.
According to Table 2, both timetables maintain the same number of buses throughout the day. While the bus usage cost shows a substantial increase under the proposed timetable due to higher bus leasing costs, the fuel cost for current diesel buses is significantly higher than the electricity cost for EBs. It is important to note that the fuel costs for diesel buses include Quebec’s carbon tax, which is CAD 0.17 per litre of diesel [63]. Thus, the total operational costs for the proposed timetable using EBs are lower at different times of the day compared to the existing timetable with diesel buses. In terms of service quality, as shown in Figure 6, the proposed timetable slightly increases the waiting time in the morning but substantially reduces it in the afternoon and slightly in the evening, improving overall passenger satisfaction. Seat availability is significantly enhanced in the afternoon, suggesting better accommodation for peak-time ridership. Notably, the proposed timetable achieves zero carbon dioxide emissions, marking a significant step towards environmental sustainability. As a result, the proposed timetable and schedule not only aligns with environmental goals but also attempts to balance cost with improved level of service.
We can now compare the modified version of the current timetable to the proposed timetable. In this modified schedule, we still follow the current timetable but have optimized the shuttle bus scheduling to accommodate electric buses. The findings from this comparison are outlined in Table 3. This analysis demonstrates the enhancements offered by the proposed timetable, highlighting its effectiveness even when transitioning to EBs while maintaining the existing timetable.
The comparative analysis between the current and proposed timetables reveals several important differences. As shown in Table 3, the proposed timetable consistently utilizes four EBs across all three time spans—morning, afternoon, and evening—unlike the current timetable, which varies the number of EBs. This consistency in the number of buses simplifies fleet management and scheduling of drivers. While the total costs associated with the existing timetable are lower, the proposed timetable offers significant improvements in the total annual waiting time for students and seat availability. Notably, the waiting time for the morning shift under the existing modified schedule is the only period that shows better performance compared to the proposed timetable. However, for the afternoon and evening shifts, the proposed timetable achieves a substantial reduction in passenger waiting times, which outweighs the longer wait times experienced in the morning. This pattern of improvement is mirrored in the seat availability metric, where the proposed TT enhances the overall passenger experience significantly, suggesting better resource allocation during peak hours. These differences highlight the need to account for the EBs’ characteristics when generating the timetable. Indeed, using a standard timetabling approach, which does not account for the need for buses to recharge, can lead to suboptimal schedules, both in terms of costs and passenger satisfaction.
The headways from the current timetable of Concordia University’s shuttle bus service, alongside the headways derived from our proposed solution, are shown in Table 4. To make the timetable more practical, we have also included suggested headways, as three different scenarios rounded to the nearest multiple of 5. While rounding the headways from our optimization algorithm might slightly reduce efficiency and affect results, it simplifies the university’s scheduling and timetabling process. Furthermore, rounded headways make it easier for students to plan their trips with precise, consistent departure times.
The comparison of the considered objectives for the suggested and current headways, shown in Table 4, is detailed in Table 5.
The comparative analysis between the current and optimum timetables reveals significant improvements in key operational metrics. According to Table 5, the optimum timetable achieves a cost reduction of about 21% compared to the current setup. More notably, it reduces the waiting time by approximately 22%, significantly enhancing passenger convenience. Additionally, seat availability sees a substantial increase of approximately 42%, reflecting an improvement in service quality and capacity utilization. These enhancements contribute to a lower ψ value of 0.39 for the optimum timetable, compared to 0.68 for the current one, indicating a more efficient and balanced operation that better meets the objectives of cost efficiency, reduced waiting times, and improved passenger comfort. These percentages underscore the effectiveness of the optimum timetable in optimizing performance across multiple dimensions.
The comparison of the optimum and suggested timetables highlights the various trade-offs involved in balancing cost, waiting time, and passenger comfort. The goal is to find the headway scenario closest to the optimum timetable, which has the lowest ψ value and offers the best balance among these factors. Scenario 1 results in higher costs and longer waiting times, yielding a moderate ψ value. Scenario 2 improves seat availability and reduces waiting time but at a higher cost, leading to the highest ψ value of 0.53. In contrast, Scenario 3, despite having the highest total cost, provides the lowest waiting time and best seat availability, achieving a ψ value of 0.46—making it the closest to the optimum. This analysis shows that while the optimum timetable is the most efficient, Scenario 3 offers a practical alternative that comes closest to optimizing performance without significant compromises.
According to Table 5, the third scenario shows significant improvements in waiting time and seat availability compared to the current timetable. Although the transition to EBs involves high initial costs, the proposed timetable offers the most cost-efficient solution for Concordia University’s shuttle bus service after switching to EBs.
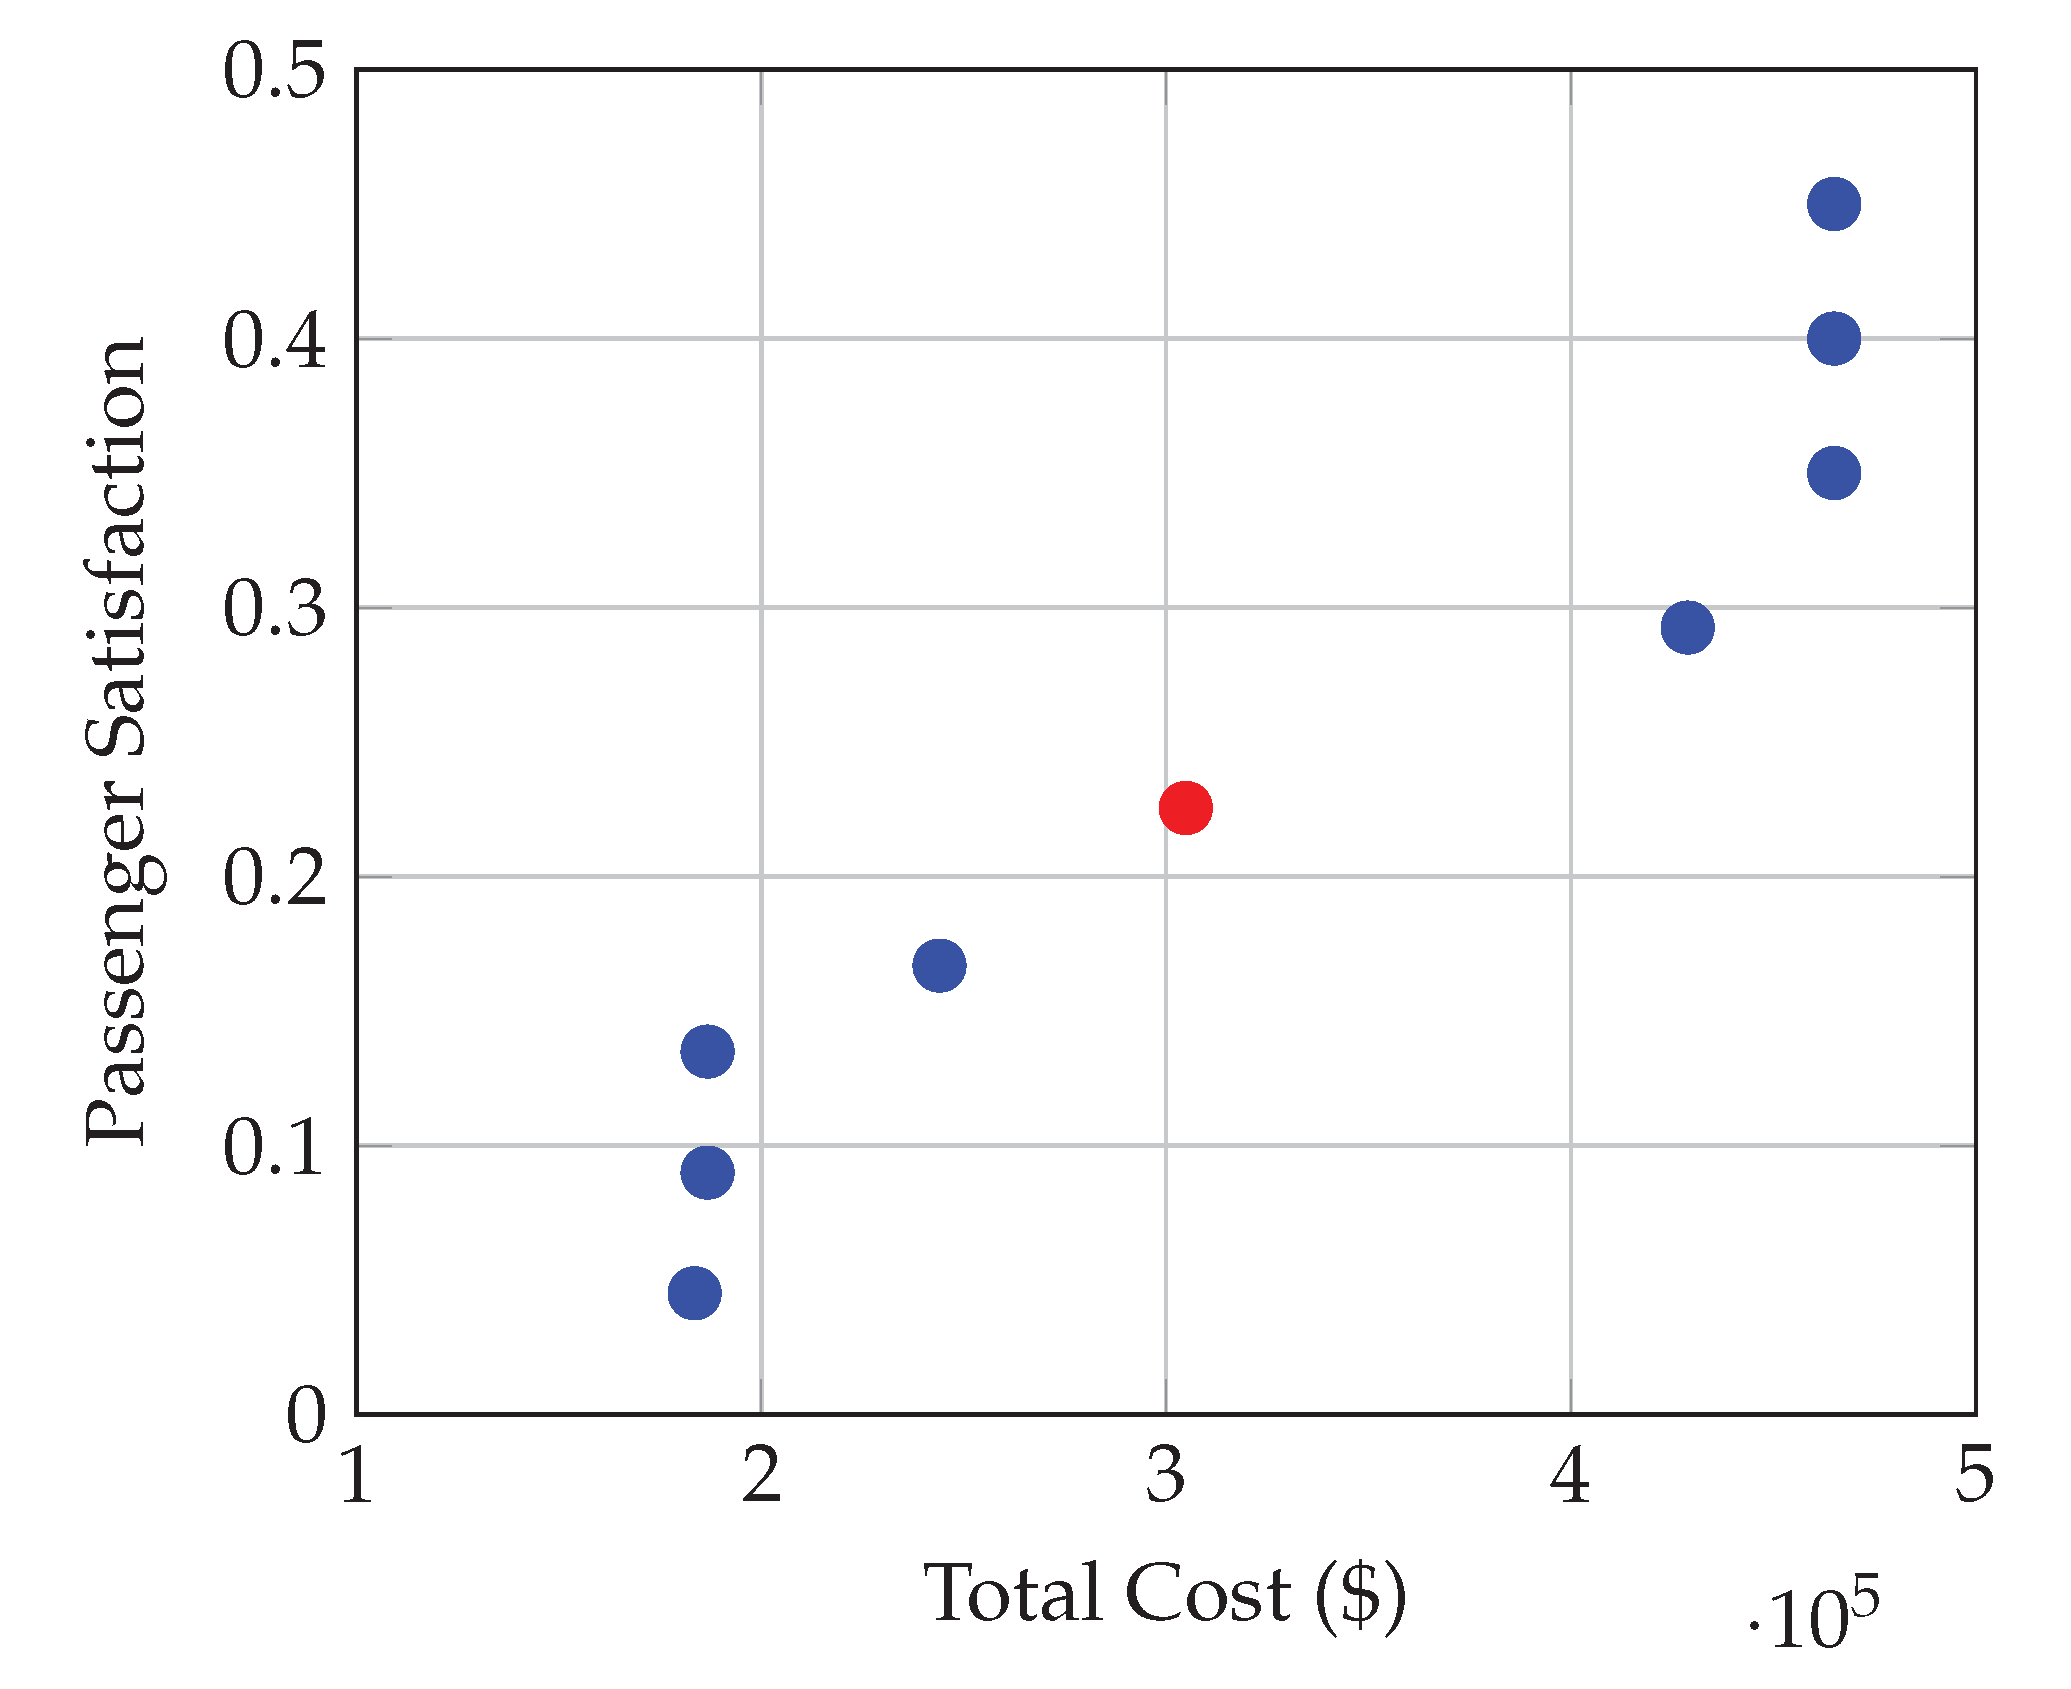
We now provide a Pareto front to illustrate the trade-off between operational costs and passenger satisfaction. The passenger satisfaction metric represents a normalized weighted sum of students’ waiting times and seat availability as ( γ j h min h ( γ j h ) ) max h ( γ j h ) min h ( γ j h ) ω γ and ( δ j h min h ( δ j h ) ) max h ( δ j h ) min h ( δ j h ) ω δ , respectively. This metric is crucial for evaluating the quality of service provided to passengers, with higher values indicating greater satisfaction. The Pareto front of the considered EB is depicted in Figure 7. On the x-axis, the cost represents the total expenses associated with operating EBs across optimum headways determined through our optimization algorithm. The Pareto front displays results from nine distinct combinations of weights, ranging from ω γ + ω δ = 0.9 and ω Z = 0.1 to ω γ + ω δ = 0.1 and ω Z = 0.9 , increasing by increments of 0.1. In all cases, ω γ and ω δ are equal.
Figure 7 effectively demonstrates how different scheduling strategies impact both cost and passenger satisfaction. Points closer to the bottom left of the graph indicate lower costs and lower passenger satisfaction, while points towards the top right suggest higher costs but improved passenger satisfaction. The point depicted in red is the solution that we have compared with the existing timetable and schedule of the shuttle bus. This visualization aids in identifying potential optimal points where the balance between minimizing operational costs and maximizing passenger satisfaction can be achieved, providing valuable insights for the Facility Management of Concordia University for its shuttle bus service.
In the Pareto front graph, a cluster of points near the bottom left corner represents scenarios where operational costs are minimized but at the expense of relatively low passenger satisfaction. However, a notable feature of this segment of the graph is that a slight increase in cost can lead to a significant improvement in passenger satisfaction. This suggests that small adjustments in budget allocation towards operating costs can yield substantial benefits in terms of service quality. Additionally, as we move away from these closely clustered points and ascend the curve, the data indicates that achieving even higher levels of passenger satisfaction requires progressively larger increases in operational costs. This portion of the graph illustrates the diminishing returns of investing in passenger satisfaction; while improvements can certainly be achieved, they come at an increasingly higher cost. This insight is crucial for Concordia University shuttle bus planners when considering optimizations that balance cost against service quality outcomes.

4.3. Sensitivity Analysis

4.3.1. EB Types Analysis

In this section, we evaluate the model’s performance and accuracy by examining the results for different types of electric buses. The variations among EB types stems from differences in their usage costs, number of seats, maximum travel ranges, and charging times. It is assumed that all EBs have a lifespan of 15 years. Table 6 shows the features of four real-world EB kinds. We run the model for each type of EB and report the findings. This analysis helps the Facility Management of Concordia University select the most suitable EB type for their shuttle bus service, taking into account factors such as cost-effectiveness and student satisfaction.
The results of comparing different EB models for the Concordia University shuttle bus service, considering total cost, waiting time, seat availability, and optimum headways, are presented in Table 7.
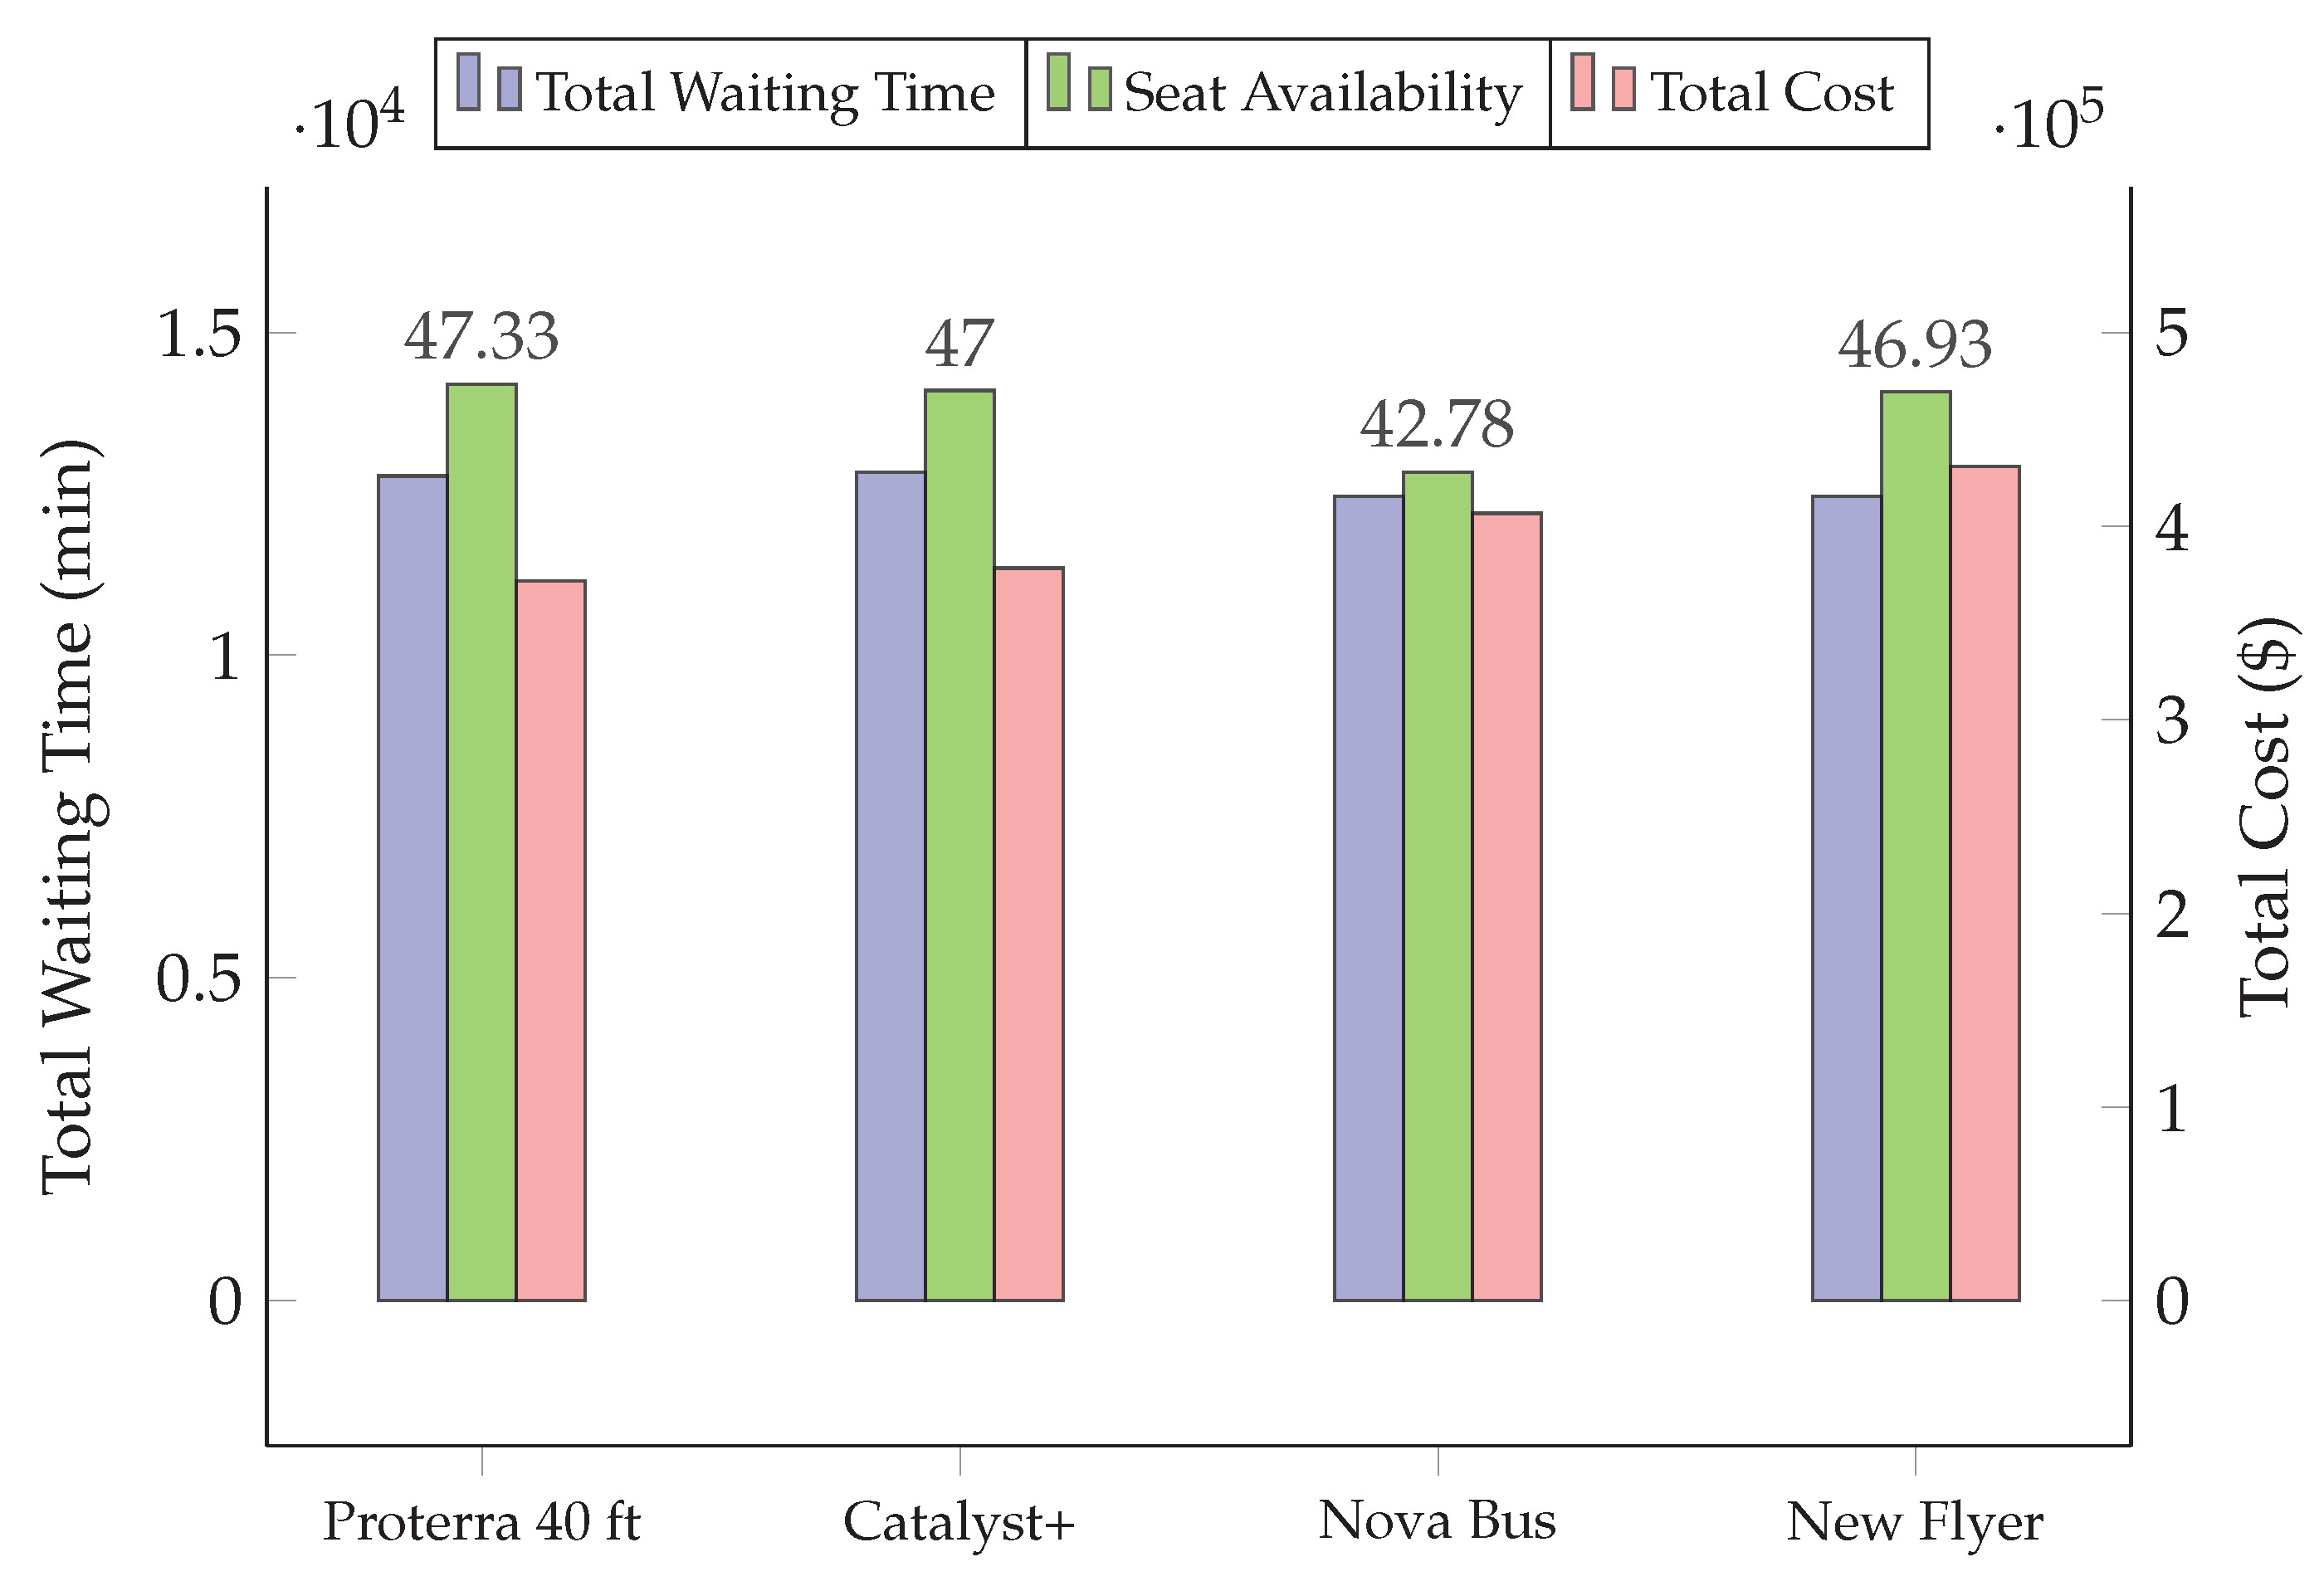
According to Table 7, Proterra buses exhibit superior overall performance relative to Nova Bus and New Flyer EB types based on their ψ values, where lower ψ values indicate better level of service and efficiency. The Proterra 40 ft and 40 ft Catalyst+ stand out with the lowest ψ value of 0.39, indicating top performance. While the Proterra 40 ft slightly outperforms the Catalyst+ in the three evaluated objectives, the differences are not significant enough to affect the ψ value, resulting in the same overall performance rating for both models. According to Figure 8, the Proterra 40 ft has the lowest total costs compared to other EB types, but it offers a relatively higher total waiting time compared to Nova Bus and New Flyer. In contrast, although Nova Bus and New Flyer models provide satisfactory waiting times and suggest stable service throughout the day, their significantly higher total costs and relatively lower seat availability make them less ideal for shuttle services. This analysis provides Concordia University with a valuable tool for determining the best EB type for their shuttle bus service. By applying the proposed model and conducting comprehensive evaluations, they can gain crucial insights to support informed decision-making when purchasing or expanding their bus fleet. This method also allows other institutions and organizations that use shuttle buses to choose an EB type that best meets their specific needs, leading to a more efficient, effective, and cost-efficient transportation system.

4.3.2. Pareto Fronts for EB Types

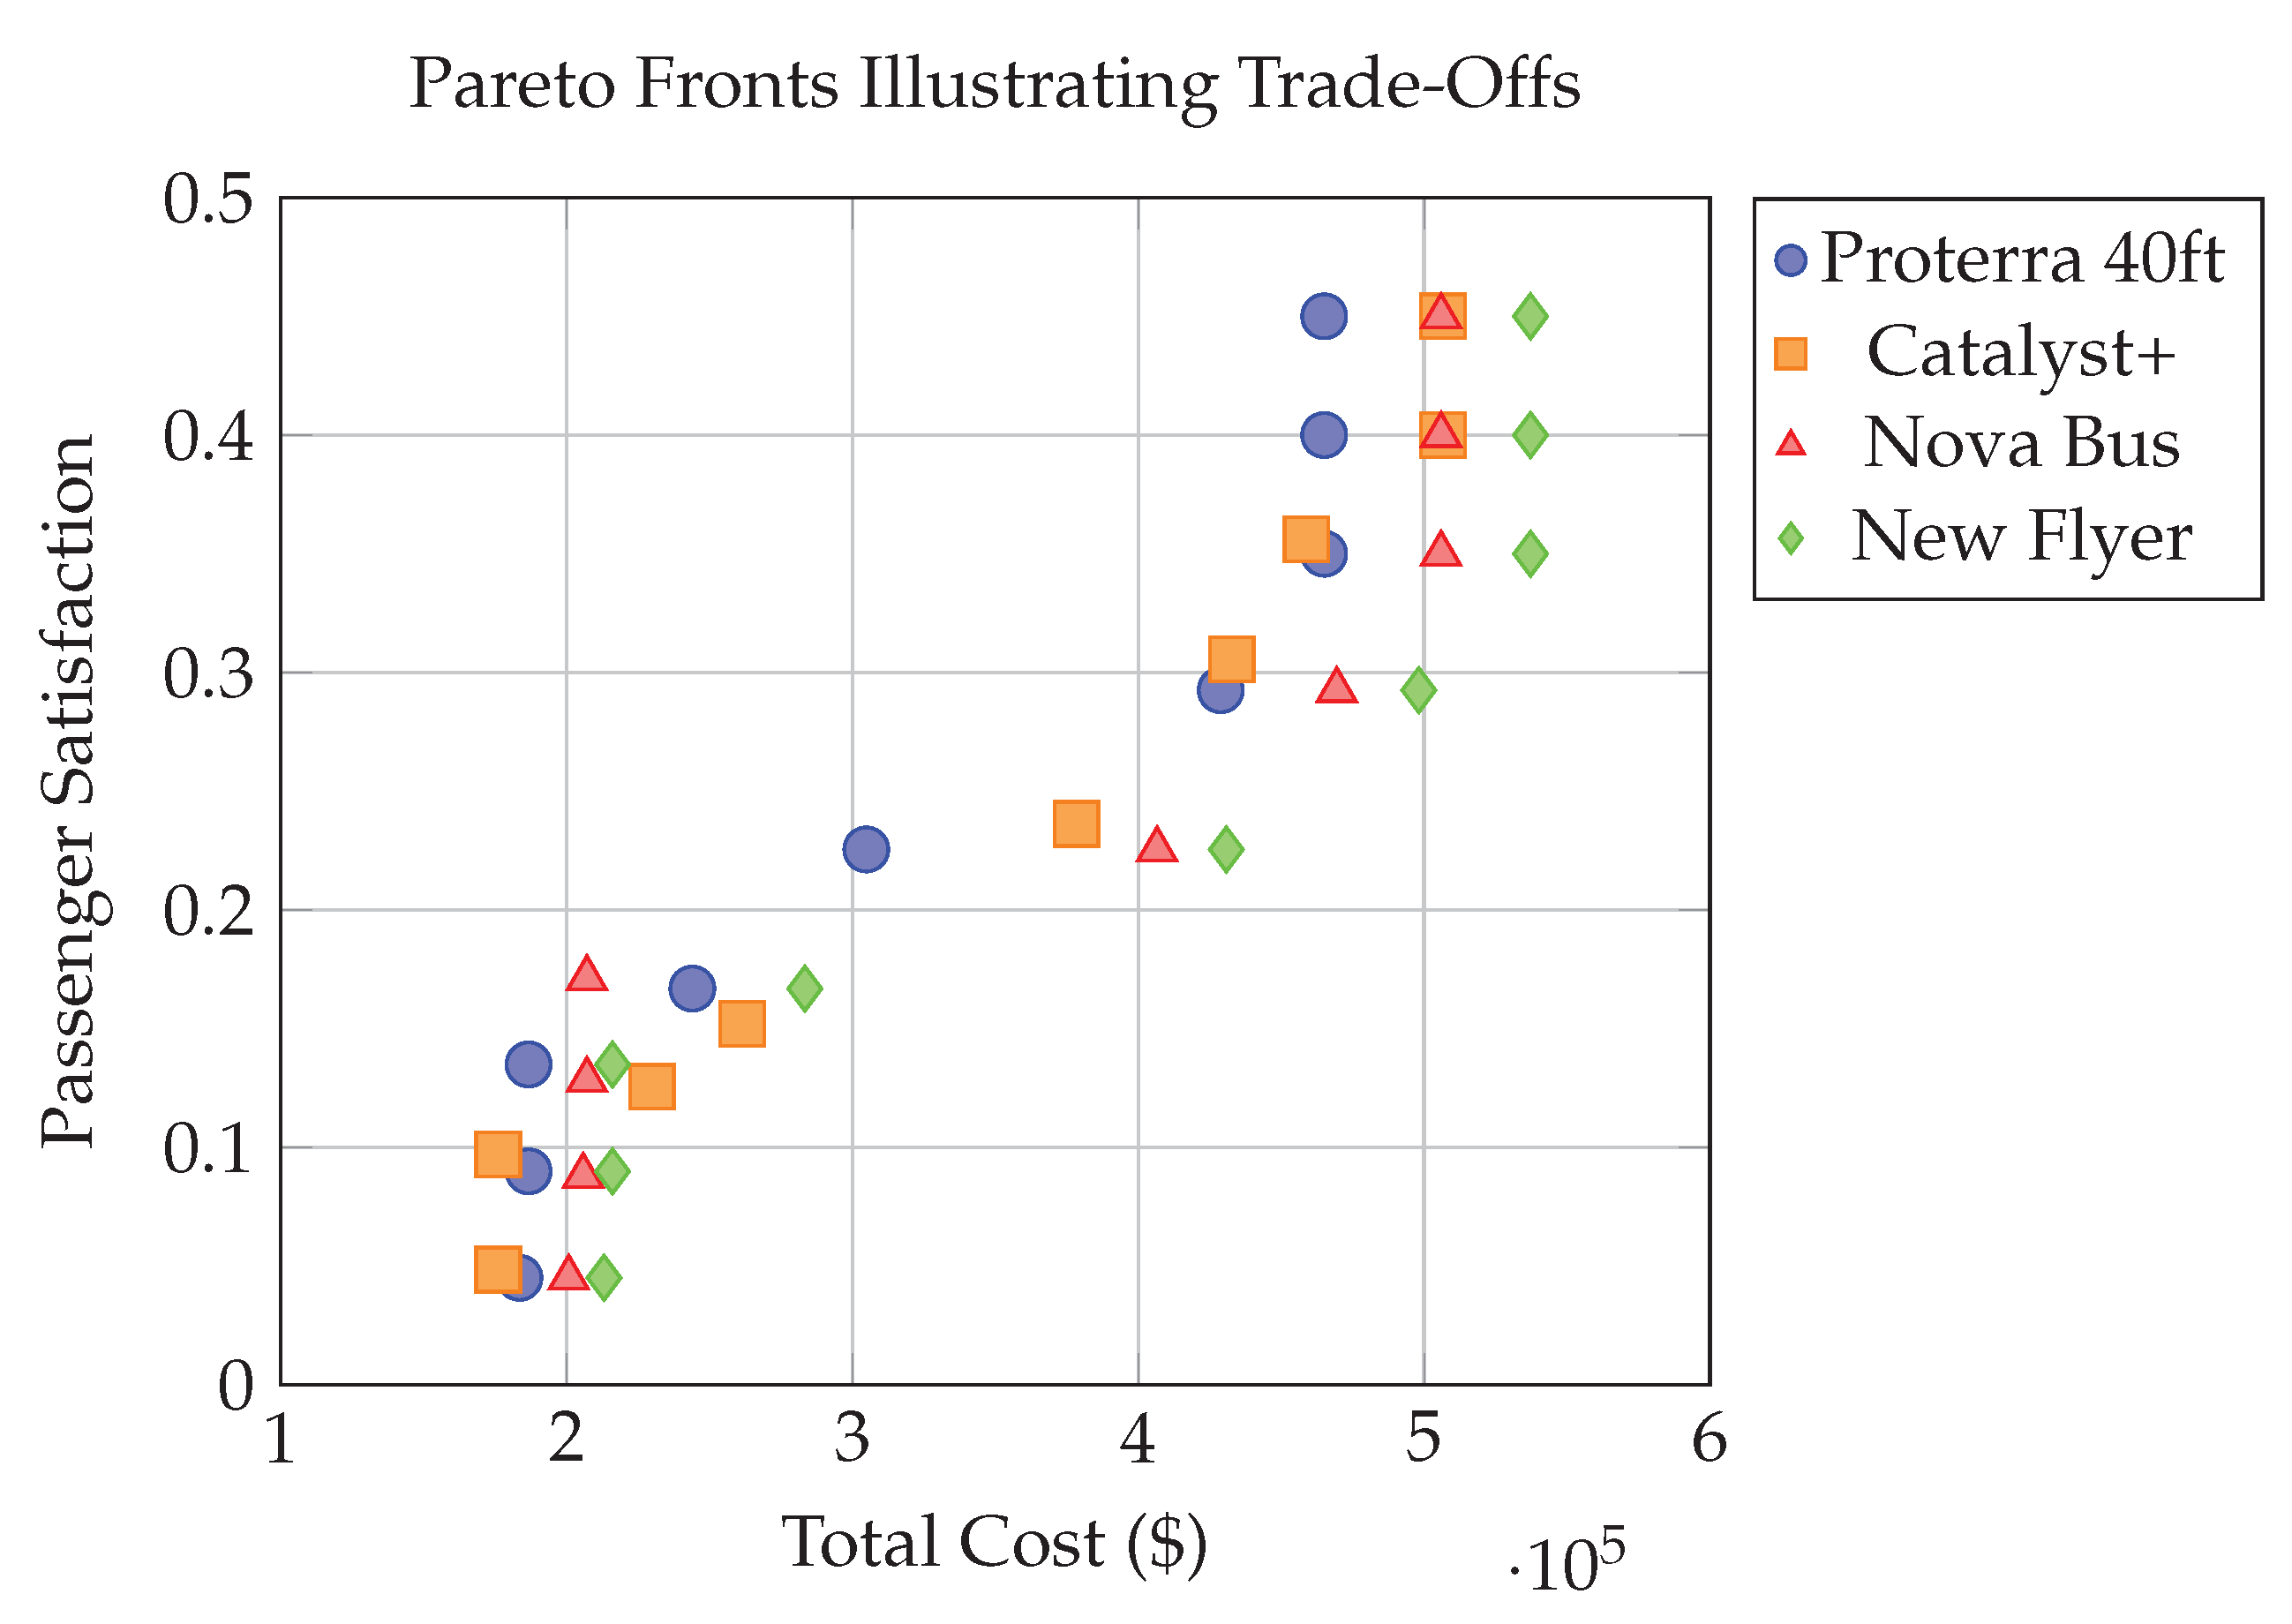
In this section, we assess the performance of various electric bus types detailed in Table 6, considering different weights for the three objectives. We will do this by adjusting the weights of the three main objectives. It is important to note that the results presented in Section 4.3.1 were based on specific weights for the objectives. Changing these weights could significantly affect the outcomes and influence which EB model is preferred. The Pareto fronts of the considered EB types are demonstrated in Figure 9. The Pareto fronts illustrate the results from nine different combinations of weights, varying from ω γ + ω δ = 0.9 and ω Z = 0.1 to ω γ + ω δ = 0.1 and ω Z = 0.9 , in increments of 0.1. In all scenarios, ω γ and ω δ are kept equal.
The Pareto front shown in Figure 9 illustrates the balance between scheduling costs and passenger satisfaction across different types of EBs, each marked with unique identifiers for easy comparison. Notably, the Catalyst+ and Proterra 40ft models generally provide higher passenger satisfaction at lower costs in most scenarios, whereas the Nova Bus and New Flyer models are less cost-effective. A critical observation is made at the fourth and fifth data points for each EB type, which represent significant trade-offs. These points demonstrate that increasing passenger satisfaction significantly raises costs. At the fourth data point, the Nova Bus stands out by offering higher passenger satisfaction at lower costs than other EB types. On the other hand, at the fifth data point, where costs increase substantially, the Proterra model tends to perform better than others.
This analysis is critical for the Facility Management of Concordia University as it assists in evaluating which bus models provide the best balance between cost efficiency and passenger satisfaction. The visual representation helps the university quickly assess which EB types meet specific operational goals or budget constraints, informing more strategic decision making in fleet selection and management. The analysis also opens the door to considering other electric vehicle options, such as trolley buses and trams. However, while these alternatives might have lower initial purchase costs compared to battery electric buses, they necessitate substantial infrastructure investment for overhead lines and tracks. Furthermore, given that Montreal lacks existing infrastructure for trolley or tram buses, and considering the regulatory and permitting challenges in the downtown area, these options have been excluded from the potential choices for upgrading the university’s shuttle bus service.

5. Conclusions and Future Studies

In conclusion, this study introduced a new algorithm that integrates timetabling and scheduling for electric shuttle buses using pantograph chargers to minimize operational costs and improve service levels. The research focuses on a real-world case study of a University shuttle bus service in Montreal, Canada, which aims to switch to a fully electric transit system. Our approach seeks to reduce students’ waiting times and enhance in-vehicle comfort by increasing seat availability, while offering a cost-efficient solution for the university’s shuttle bus service after switching to electric buses. We developed an integrated algorithm that calculates waiting times and seat availability across different headway values and uses a MILP model, solved with the Cplex solver, to optimize the schedule of EBs to minimize total costs. These costs include travel expenses, electricity consumption, and usage costs associated with electric buses. A normalized weighted sum technique was applied to address the multi-objective problem. The effectiveness of our methodology was demonstrated through significant improvements, including a 22% reduction in student waiting times, a 42% improvement in the seat availability criterion, and a 21% improvement in the total cost of scheduling the shuttle buses compared to the existing timetable. Additionally, our approach included the strategic selection of optimal electric bus models and was capable of accommodating varying bus travel times during peak and off-peak hours, further enhancing operational efficiency. By adjusting the timetable for fully electric buses, this research promotes a more sustainable approach to university transportation systems, setting a benchmark for similar initiatives at other institutions and contributing to the broader adoption of EBs in public transit networks. This initiative represents a significant advancement in adapting transportation infrastructure to support environmental sustainability and operational excellence.
The proposed study offers the potential to be improved in several ways. One critical enhancement is adapting the model to accommodate different charging technologies, which vary in establishment costs, charging power, and charging times. Further improvements could focus on integrating network design as a decision variable. This would involve optimizing shuttle bus routing and including it in the model. Additionally, future studies could integrate decisions regarding charging technology and the strategic placement of charging stations. Given that pantograph chargers can significantly impact electricity loads, it is crucial to assess the effects of these charging technologies on neighborhood energy supplies and the power grid during peak hours. Investigating power loss associated with integrating such infrastructure and its impact on energy sources could provide valuable insights for more sustainable electric bus operations. Introducing uncertainty into the model regarding the travel time and energy consumption of EBs is another promising area for improvement. Various factors can influence EB travel time, including passenger volume, driving behavior, traffic congestion, road conditions, and weather. By incorporating stochastic travel times, we can make the model more robust and reflective of real-world scenarios. Similarly, the energy consumption of EBs can vary based on factors like passenger load, battery life, and road conditions. Future research could focus on including these variables to enhance the model’s accuracy.

Author Contributions

Conceptualization, K.A., F.Q. and U.E.; methodology, K.A. and F.Q.; formal analysis, K.A.; investigation, K.A. and F.Q.; validation, K.A., F.Q. and U.E.; writing—original draft preparation, K.A.; writing—review and editing, F.Q. and U.E.; visualization, K.A.; supervision, F.Q. and U.E. All authors have read and agreed to the published version of the manuscript.

Funding

This research was undertaken, in part, thanks to funding from the “Bourses Action Climatique” award and the “Fonds de recherche du Québec-Nature et technologies” (FRQNT) Doctoral Research Scholarship (B2X) from Fonds de recherche du Québec (FRQ). This research was also supported, in part, thanks to the supervisor’s funding from the Canada Excellence Research Chairs Program with grant number CERC-2018-00005.

Data Availability Statement

The data presented in this study are available on request from the corresponding author and Concordia University approval. The data are not publicly available due to privacy or ethical restrictions imposed by the university.

Acknowledgments

The authors acknowledge that this research was supported by the Canada Excellence Research Chairs program and the “Bourses Action Climatique” award and the “Fonds de recherche du Québec-Nature et technologies” (FRQNT) Doctoral Research Scholarship (B2X) from Fonds de recherche du Québec (FRQ).

Conflicts of Interest

The authors declare no conflict of interest.

Abbreviations

The following abbreviations are used in this manuscript:
EBElectric bus
OECDEconomic consequences of outdoor air pollution
TTTimetable
BSPBus scheduling problem
VSVehicle scheduling
VSPVehicle scheduling problem
EBSPElectric bus scheduling problem
TCOTotal cost of ownership
CNGCompressed natural gas
GAGenetic algorithm
VSP-TWVehicle scheduling problem with time windows
TOUTime-of-use
SASimulated annealing
LNSLarge neighborhood search
ITTVSIntegrated timetabling and vehicle scheduling
NSGA-IINon-dominated sorting genetic algorithm II
PSOParticle swarm optimization
MILPMixed-integer linear programming
SOCState of charge
SGWSir George William
GHGGreenhouse gas
SAPSustainable action plan

References

  1. Nejat, P.; Jomehzadeh, F.; Taheri, M.M.; Gohari, M.; Majid, M.Z.A. A global review of energy consumption, CO2 emissions and policy in the residential sector (with an overview of the top ten CO2 emitting countries). Renew. Sustain. Energy Rev. 2015, 43, 843–862. [Google Scholar] [CrossRef]
  2. Margolis, J. China dominates the electric bus market, but the US is getting on board. PRI’s The World, 2 October 2019. [Google Scholar]
  3. Pelletier, S.; Jabali, O.; Mendoza, J.E.; Laporte, G. The electric bus fleet transition problem. Transp. Res. Part C Emerg. Technol. 2019, 109, 174–193. [Google Scholar] [CrossRef]
  4. Saner, C.B.; Wei, R.H.C.; Alkaff, S.A.; Zheng, L.W.; Wei, L.Y.; Trivedi, A.; Srinivasan, D. A Vehicle and Charging Scheduling Framework for Campus Shuttle Electric Buses. In Proceedings of the 2022 IEEE PES Innovative Smart Grid Technologies-Asia (ISGT Asia), Singapore, 1–5 November 2022; pp. 290–294. [Google Scholar]
  5. Lie, K.W.; Synnevåg, T.A.; Lamb, J.J.; Lien, K.M. The carbon footprint of electrified city buses: A case study in Trondheim, Norway. Energies 2021, 14, 770. [Google Scholar] [CrossRef]
  6. Quarles, N.; Kockelman, K.M.; Mohamed, M. Costs and benefits of electrifying and automating bus transit fleets. Sustainability 2020, 12, 3977. [Google Scholar] [CrossRef]
  7. Johnson, C.; Nobler, E.; Eudy, L.; Jeffers, M. Financial Analysis of Battery Electric Transit Buses; Technical Report; National Renewable Energy Lab. (NREL): Golden, CO, USA, 2020. [Google Scholar]
  8. Zhang, Y.; Hu, Q.; Meng, Z.; Ralescu, A. Fuzzy dynamic timetable scheduling for public transit. Fuzzy Sets Syst. 2020, 395, 235–253. [Google Scholar] [CrossRef]
  9. Bie, Y.; Hao, M.; Guo, M. Optimal electric bus scheduling based on the combination of all-stop and short-turning strategies. Sustainability 2021, 13, 1827. [Google Scholar] [CrossRef]
  10. Ceder, A. Public Transit Planning and Operation: Modeling, Practice and Behavior; CRC Press: Boca Raton, FL, USA, 2016. [Google Scholar]
  11. Zhang, S.; Ceder, A.A.; Cao, Z. Integrated optimization for feeder bus timetabling and procurement scheme with consideration of environmental impact. Comput. Ind. Eng. 2020, 145, 106501. [Google Scholar] [CrossRef]
  12. Shang, H.Y.; Huang, H.J.; Wu, W.X. Bus timetabling considering passenger satisfaction: An empirical study in Beijing. Comput. Ind. Eng. 2019, 135, 1155–1166. [Google Scholar] [CrossRef]
  13. Häll, C.H.; Ceder, A.; Ekström, J.; Quttineh, N.H. Adjustments of public transit operations planning process for the use of electric buses. J. Intell. Transp. Syst. 2019, 23, 216–230. [Google Scholar] [CrossRef]
  14. Ceder, A.; Hassold, S.; Dano, B. Approaching even-load and even-headway transit timetables using different bus sizes. Public Transp. 2013, 5, 193–217. [Google Scholar] [CrossRef]
  15. Ceder, A.; Philibert, L. Transit timetables resulting in even maximum load on individual vehicles. IEEE Trans. Intell. Transp. Syst. 2014, 15, 2605–2614. [Google Scholar] [CrossRef]
  16. Gkiotsalitis, K.; Alesiani, F. Robust timetable optimization for bus lines subject to resource and regulatory constraints. Transp. Res. Part E Logist. Transp. Rev. 2019, 128, 30–51. [Google Scholar] [CrossRef]
  17. Jiang, M.; Zhang, Y. A branch-and-price algorithm for large-scale multidepot electric bus scheduling. IEEE Trans. Intell. Transp. Syst. 2022, 15355–15368. [Google Scholar] [CrossRef]
  18. Teng, J.; Chen, T.; Fan, W. Integrated approach to vehicle scheduling and bus timetabling for an electric bus line. J. Transp. Eng. Part A Syst. 2020, 146, 04019073. [Google Scholar] [CrossRef]
  19. Wu, W.; Lin, Y.; Liu, R.; Jin, W. The multi-depot electric vehicle scheduling problem with power grid characteristics. Transp. Res. Part B Methodol. 2022, 155, 322–347. [Google Scholar] [CrossRef]
  20. Guo, J.; Xue, Y.; Guan, H. Research on the combinatorial optimization of EBs departure interval and vehicle configuration based on uncertain bi-level programming. Transp. Lett. 2023, 15, 623–633. [Google Scholar] [CrossRef]
  21. Zhang, A.; Li, T.; Zheng, Y.; Li, X.; Abdullah, M.G.; Dong, C. Mixed electric bus fleet scheduling problem with partial mixed-route and partial recharging. Int. J. Sustain. Transp. 2022, 16, 73–83. [Google Scholar] [CrossRef]
  22. Perumal, S.S.; Lusby, R.M.; Larsen, J. Electric bus planning & scheduling: A review of related problems and methodologies. Eur. J. Oper. Res. 2022, 301, 395–413. [Google Scholar]
  23. Alamatsaz, K.; Hussain, S.; Lai, C.; Eicker, U. Electric bus scheduling and timetabling, fast charging infrastructure planning, and their impact on the grid: A review. Energies 2022, 15, 7919. [Google Scholar] [CrossRef]
  24. Ceder, A. Efficient timetabling and vehicle scheduling for public transport. In Computer-Aided Scheduling of Public Transport; Springer: Berlin/Heidelberg, Germany, 2001; pp. 37–52. [Google Scholar]
  25. Chakroborty, P.; Deb, K.; Sharma, R.K. Optimal fleet size distribution and scheduling of transit systems using genetic algorithms. Transp. Plan. Technol. 2001, 24, 209–225. [Google Scholar] [CrossRef]
  26. Carosi, S.; Frangioni, A.; Galli, L.; Girardi, L.; Vallese, G. A matheuristic for integrated timetabling and vehicle scheduling. Transp. Res. Part B Methodol. 2019, 127, 99–124. [Google Scholar] [CrossRef]
  27. Kliewer, N.; Mellouli, T.; Suhl, L. A time–space network based exact optimization model for multi-depot bus scheduling. Eur. J. Oper. Res. 2006, 175, 1616–1627. [Google Scholar] [CrossRef]
  28. Ceder, A.A. Optimal multi-vehicle type transit timetabling and vehicle scheduling. Procedia-Soc. Behav. Sci. 2011, 20, 19–30. [Google Scholar] [CrossRef]
  29. Guihaire, V.; Hao, J.K. Transit network timetabling and vehicle assignment for regulating authorities. Comput. Ind. Eng. 2010, 59, 16–23. [Google Scholar] [CrossRef]
  30. Petersen, H.L.; Larsen, A.; Madsen, O.B.; Petersen, B.; Ropke, S. The simultaneous vehicle scheduling and passenger service problem. Transp. Sci. 2013, 47, 603–616. [Google Scholar] [CrossRef]
  31. Schmid, V.; Ehmke, J.F. Integrated timetabling and vehicle scheduling with balanced departure times. OR Spectr. 2015, 37, 903–928. [Google Scholar] [CrossRef]
  32. Weiszer, M.; Fedorko, G.; Čujan, Z. Multiobjective evolutionary algorithm for integrated timetable optimization with vehicle scheduling aspects. Perner’s Contacts 2010, 5, 286–294. [Google Scholar]
  33. Ibarra-Rojas, O.J.; Giesen, R.; Rios-Solis, Y.A. An integrated approach for timetabling and vehicle scheduling problems to analyze the trade-off between level of service and operating costs of transit networks. Transp. Res. Part B Methodol. 2014, 70, 35–46. [Google Scholar] [CrossRef]
  34. Lachhwani, K.; Dwivedi, A. Bi-level and multi-level programming problems: Taxonomy of literature review and research issues. Arch. Comput. Methods Eng. 2018, 25, 847–877. [Google Scholar] [CrossRef]
  35. Liu, T.; Ceder, A.A. Integrated public transport timetable synchronization and vehicle scheduling with demand assignment: A bi-objective bi-level model using deficit function approach. Transp. Res. Procedia 2017, 23, 341–361. [Google Scholar] [CrossRef]
  36. Liu, Z.g.; Shen, J.s. Regional bus operation bi-level programming model integrating timetabling and vehicle scheduling. Syst. Eng.-Theory Pract. 2007, 27, 135–141. [Google Scholar] [CrossRef]
  37. Xu, X.; Yu, Y.; Long, J. Integrated electric bus timetabling and scheduling problem. Transp. Res. Part C Emerg. Technol. 2023, 149, 104057. [Google Scholar] [CrossRef]
  38. Quttineh, N.H.; Häll, C.H.; Ekström, J.; Ceder, A.A. Integrated solution for electric bus timetabling and vehicle scheduling combined with choices of charging locations. J. Public Transp. 2023, 25, 100055. [Google Scholar] [CrossRef]
  39. Hulagu, S.; Atasayar, G.; Celikoglu, H.B. Green routing plan for university shuttle services using mixed integer linear programming. In Proceedings of the 2019 IEEE 5th International Forum on Research and Technology for Society and Industry (RTSI), Florence, Italy, 9–12 September 2019; pp. 471–476. [Google Scholar]
  40. Hulagu, S.; Celikoglu, H.B. Electrified location routing problem with energy consumption for resources restricted archipelagos: Case of buyukada. In Proceedings of the 2020 Forum on Integrated and Sustainable Transportation Systems (FISTS), Delft, The Netherlands, 3–5 November 2020; pp. 323–327. [Google Scholar]
  41. Wei, M.; Yang, C.; Liu, T. An integrated multi-objective optimization for dynamic airport shuttle bus location, route design and departure frequency setting problem. Int. J. Environ. Res. Public Health 2022, 19, 14469. [Google Scholar] [CrossRef] [PubMed]
  42. Liu, Z.; Wang, Q.; Sigler, D.; Kotz, A.; Kelly, K.J.; Lunacek, M.; Phillips, C.; Garikapati, V. Data-driven simulation-based planning for electric airport shuttle systems: A real-world case study. Appl. Energy 2023, 332, 120483. [Google Scholar] [CrossRef]
  43. Cao, Z.; Ceder, A.A. Autonomous shuttle bus service timetabling and vehicle scheduling using skip-stop tactic. Transp. Res. Part C Emerg. Technol. 2019, 102, 370–395. [Google Scholar] [CrossRef]
  44. Hulagu, S.; Çelikoglu, H.B. A multiple objective formulation of an electric vehicle routing problem for shuttle bus fleet at a university campus. In Proceedings of the 2019 6th International Conference on Models and Technologies for Intelligent Transportation Systems (MT-ITS), Cracow, Poland, 5–7 June 2019; pp. 1–5. [Google Scholar]
  45. Iclodean, C.; Cordos, N.; Varga, B.O. Autonomous shuttle bus for public transportation: A review. Energies 2020, 13, 2917. [Google Scholar] [CrossRef]
  46. Oargă, I.T.; Prunean, G.; Varga, B.O.; Moldovanu, D.; Micu, D.D. Comparative Analysis of Energy Efficiency between Battery Electric Buses and Modular Autonomous Vehicles. Appl. Sci. 2024, 14, 4389. [Google Scholar] [CrossRef]
  47. Papa, G.; Santo Zarnik, M.; Vukašinović, V. Electric-bus routes in hilly urban areas: Overview and challenges. Renew. Sustain. Energy Rev. 2022, 165, 112555. [Google Scholar] [CrossRef]
  48. Zhou, B.; Wu, Y.; Zhou, B.; Wang, R.; Ke, W.; Zhang, S.; Hao, J. Real-world performance of battery electric buses and their life-cycle benefits with respect to energy consumption and carbon dioxide emissions. Energy 2016, 96, 603–613. [Google Scholar] [CrossRef]
  49. Suh, I.S.; Lee, M.; Kim, J.; Oh, S.T.; Won, J.P. Design and experimental analysis of an efficient HVAC (heating, ventilation, air-conditioning) system on an electric bus with dynamic on-road wireless charging. Energy 2015, 81, 262–273. [Google Scholar] [CrossRef]
  50. Al-Ogaili, A.S.; Al-Shetwi, A.Q.; Al-Masri, H.M.; Babu, T.S.; Hoon, Y.; Alzaareer, K.; Babu, N.P. Review of the estimation methods of energy consumption for battery electric buses. Energies 2021, 14, 7578. [Google Scholar] [CrossRef]
  51. Aamodt, A.; Cory, K.; Coney, K. Electrifying Transit: A Guidebook for Implementing Battery Electric Buses; Technical Report; National Renewable Energy Lab. (NREL): Golden, CO, USA, 2021. [Google Scholar]
  52. Gao, Z.; Lin, Z.; LaClair, T.J.; Liu, C.; Li, J.M.; Birky, A.K.; Ward, J. Battery capacity and recharging needs for electric buses in city transit service. Energy 2017, 122, 588–600. [Google Scholar] [CrossRef]
  53. Pereirinha, P.G.; González, M.; Carrilero, I.; Anseán, D.; Alonso, J.; Viera, J.C. Main trends and challenges in road transportation electrification. Transp. Res. Procedia 2018, 33, 235–242. [Google Scholar] [CrossRef]
  54. Al-Saadi, M.; Bhattacharyya, S.; Tichelen, P.V.; Mathes, M.; Käsgen, J.; Van Mierlo, J.; Berecibar, M. Impact on the Power Grid Caused via Ultra-Fast Charging Technologies of the Electric Buses Fleet. Energies 2022, 15, 1424. [Google Scholar] [CrossRef]
  55. Zhou, Y.; Wang, H.; Wang, Y.; Yu, B.; Tang, T. Charging facility planning and scheduling problems for battery electric bus systems: A comprehensive review. Transp. Res. Part E Logist. Transp. Rev. 2024, 183, 103463. [Google Scholar] [CrossRef]
  56. Zhang, L.; Wang, Y.; Gu, W.; Han, Y.; Chung, E.; Qu, X. On the role of time-of-use electricity price in charge scheduling for electric bus fleets. Comput.-Aided Civ. Infrastruct. Eng. 2024, 39, 1218–1237. [Google Scholar] [CrossRef]
  57. McLeod, F. Estimating bus passenger waiting times from incomplete bus arrivals data. J. Oper. Res. Soc. 2007, 58, 1518–1525. [Google Scholar] [CrossRef]
  58. Concordia in Numbers. 2023. Available online: https://www.concordia.ca/about/fast-facts.html (accessed on 26 April 2024).
  59. Improve Concordia University Shuttle Bus. 2024. Available online: https://improvecushuttle.ca/ (accessed on 7 April 2024).
  60. Bloomberg New Energy Finance. Electric Buses in Cities: Driving towards Cleaner Air and Lower CO2. On Behalf of: Financing Sustainable Cities Initiative, C40 Cities, World Resources Institute, Citi Foundation. Energy Innovations Institute. 2018. Available online: https://data.bloomberglp.com/professional/sites/24/2018/05/Electric-Buses-in-Cities-Report-BNEF-C40-Citi.pdf (accessed on 13 November 2023).
  61. Li, J.Q. Transit bus scheduling with limited energy. Transp. Sci. 2014, 48, 521–539. [Google Scholar] [CrossRef]
  62. Environment and Climate Change Canada. National Inventory Report 1990–2018: Greenhouse Gas Sources and Sinks in Canada. Part 1. Ottawa, ON, Canada. 2020. Available online: https://publications.gc.ca/collections/collection_2020/eccc/En81-4-2018-1-eng.pdf (accessed on 8 May 2024).
  63. Fuel Charge Rates—Canada.ca. Available online: https://www.canada.ca/en/revenue-agency/services/forms-publications/publications/fcrates/fuel-charge-rates.html (accessed on 8 May 2024).
  64. Proterra Electric Vehicle Technology Manufacturer. 2016. Available online: https://www.proterra.com/wp-content/uploads/2016/08/Proterra-Catalyst-Vehicle-Specs.pdf (accessed on 15 November 2023).
  65. Gallo, J.B.; Bloch-Rubin, T.; Tomić, J. Peak Demand Charges and Electric Transit Buses; U.S. Department of Transportation Tech. Rep.; U.S. Department of Transportation Federal Transit Administration: Washington, DC, USA, 2014. [Google Scholar]
  66. Nova Bus LFSe. Available online: https://novabus.com/wp-content/uploads/2017/09/2018_LFSE_EN_REV.pdf (accessed on 16 November 2023).
Figure 1. Arc-based network for three time spans.
Energies 17 03149 g001
Figure 2. Concordia shuttle bus route and the real-time location of buses.
Energies 17 03149 g002
Figure 3. Students’ satisfaction with Concordia Shuttle bus service.
Energies 17 03149 g003
Figure 4. Students’ response regarding seat availability.
Energies 17 03149 g004
Figure 5. Students’ waiting time for the shuttle bus.
Energies 17 03149 g005
Figure 6. Comparing the current and proposed TT on waiting time and seat availability metrics.
Energies 17 03149 g006
Figure 7. Pareto front illustrating the trade-off between scheduling cost and passenger satisfaction.
Energies 17 03149 g007
Figure 8. Comparison of the considered objectives for different EB types.
Energies 17 03149 g008
Figure 9. Pareto fronts showing scheduling cost and passenger satisfaction trade-offs for EB types.
Energies 17 03149 g009
Table 1. Indicating the effects of different charging technologies on BSP and TT.
Depot ChargingFast-ChargingWireless ChargingContinuous ChargingBattery Swapping
TT--
BSP-
Table 2. Comparative analysis of current TT using conventional buses vs. proposed TT.
Current TimetableProposed Timetable
MorningAfternoonEveningMorningAfternoonEvening
Number of buses444444
Bus usage cost (CAD)31,10831,10831,10871,10071,10071,100
Electricity/fuel cost (CAD)64,12077,86141,220440910,4714409
Travel cost (CAD)38,51646,77024,76018,39638,10615,768
Total cost (CAD)133,744155,73997,08893,905119,67791,277
Waiting time (min)6292925581071255292361
Seat availability10.914.38.06.329.012.0
Table 3. Comparative analysis of current TT using EB vs. proposed TT.
Current TT with Modified ScheduleProposed Timetable
MorningAfternoonEveningMorningAfternoonEvening
Number of buses533444
Bus usage cost (CAD)88,87553,32553,32571,10071,10071,100
Electricity cost (CAD)220477166062440910,4714409
Travel cost (CAD)10,51223,65222,33818,39638,10615,768
Total cost (CAD)101,59184,69381,72593,905119,67791,277
Waiting time (min)6292925581071255292361
Seat availability10.914.38.06.329.012.0
Table 4. Comparing headways values for the current, optimum and suggested scenarios.
Time SpanHeadway
CurrentOptimumScenario 1Scenario 2Scenario 3
Morning15 min19 min20 min20 min15 min
Afternoon30 min18 min20 min15 min15 min
Evening30 min19 min20 min20 min15 min
Table 5. Comparing the objective functions of the current, optimum and suggested headways.
TimetableCost (CAD) ( Z ) Waiting Time ( γ ) Seat Availability ( δ ) ψ
Current386,57116,357 min33.240.68
Optimum304,85912,778 min47.330.39
Scenario 1297,18813,340 min40.960.50
Scenario 2332,30012,007 min48.960.53
Scenario 3381,66910,027 min60.830.46
Table 6. Characteristics of four well-known electric bus types [64,65,66].
BrandModelAnnual Usage Cost (CAD)Maximum Travel Range (km)Charging Time (min)Number of Seats
Proterra40 ft. Catalyst53,266781040
Proterra40 ft. Catalyst+66,6661001340
Nova Bus40 ft80,00037537
New Flyer40 ft86,66672640
Table 7. Comparison of results for various types of electric buses used in shuttle bus services.
BrandTotal Cost (CAD)Total Waiting TimeSeat Availability ψ Optimum Headways
Proterra 40 ft371,55612,778 min47.330.3919, 18, 19
Proterra 40 ft Catalyst+378,35212,833 min47.000.3919, 19, 16
Nova Bus406,59212,465 min42.780.4218, 18, 18
New Flyer430,83212,465 min46.930.4318, 18, 18
Disclaimer/Publisher’s Note: The statements, opinions and data contained in all publications are solely those of the individual author(s) and contributor(s) and not of MDPI and/or the editor(s). MDPI and/or the editor(s) disclaim responsibility for any injury to people or property resulting from any ideas, methods, instructions or products referred to in the content.