Article

Numerical Investigation of a Novel Type of Rotor Working in a Palisade Configuration

1
Department of Cryogenics and Aerospace Engineering, Wrocław University of Science and Technology, 50-370 Wroclaw, Poland
2
VP System, 45-839 Opole, Poland
*
Author to whom correspondence should be addressed.
Energies 2024, 17(13), 3093; https://doi.org/10.3390/en17133093
Submission received: 26 April 2024 / Revised: 16 June 2024 / Accepted: 19 June 2024 / Published: 23 June 2024

Abstract

:
This paper explores an interesting approach to wind energy technology, focusing on a novel type of drag-driven vertical-axis wind turbines (VAWTs). Studied geometries employ rotor-shaped cross-sections, presenting a distinctive approach to harnessing wind energy efficiently. The rotor-shaped cross-section geometries are examined for their aerodynamic efficiency, showcasing the meticulous engineering behind this innovation. The drag-driven turbine shapes are analyzed for their ability to maximize energy extraction in a variety of wind conditions. A significant aspect of these turbines is their adaptability for diverse applications. This article discusses the feasibility and advantages of utilizing these VAWTs in fence configurations, offering an innovative integration of renewable energy generation with physical infrastructure. The scalability of the turbines is highlighted, enabling their deployment as a fence around residential properties or as separators between highway lanes and as energy-generating structures atop buildings. The scientific findings presented in this article contribute valuable insights into the technological advancements of rotor-shaped VAWTs and their potential impact on decentralized wind energy generation. The scalable and versatile nature of these turbines opens up new possibilities for sustainable energy solutions in both urban and residential settings, marking a significant step forward in the field of renewable energy research and technology. In particular, it was shown that among the proposed rotor geometries, the five-blade rotor was characterized by the highest efficiency and, working in a palisade configuration with a spacing of 10 mm to 20 mm, produced higher average values of the torque coefficient than the corresponding Savonius turbine.

1. Introduction

The worldwide demand for renewable energy technology is rising rapidly. According to the Global Wind Energy Council, since the year 2000, the use of wind energy alone has increased significantly, reaching 906 GW of overall capacity and is on its way to finally breaking the milestone of 1 TW [1]. The overall global capacity of wind power energy has grown 98 times when compared to the results from the past two decades [2,3]. This correlates with the fact that that the global wind energy market is expected to grow by around 15% each following year from now on [1].
Wind turbines can be classified into two main groups based on the rotors axis of rotation, the horizontal-axis wind turbines (HAWTs) and vertical-axis wind turbines (VAWTs). HAWTs’ axis of rotation is virtually parallel to the wind stream and horizontal to the ground. The majority of wind turbines utilized worldwide fall within this category nowadays [4]. This directly corresponds to the fact that the majority of wind energy production comes from on-shore horizontal-axis wind turbines (HAWTs), which utilize high-velocity winds and minimize the ground effect by positioning wind turbine hubs high above the ground level [1].
While large wind turbines are the main source of wind power generation globally, their performance is hindered by scalability factors, mainly the influence of the aerodynamic wake, which has a sizeable effect on wind farms’ efficiency [5]. If the wind turbines are placed too close to each other or improperly towards the direction of the wind, the turbines that are located in the downstream are subject to worse wind velocities and more turbulent flow. This results in the term known as the “wake-induced power loss”. This in turn may lead to a considerable energy production reduction and lower the wind power plants’ viability [6,7]. Lift-driven turbines may also experience heightened losses attributable to the susceptibility of lift generation to blade erosion and contamination [8]. On the contrary, this concern does not occur for drag-driven turbines.
As can be deducted, the assessment of wind turbine farm performance has historically relied on substantial experience with HAWTs. Developers of wind farms typically aim to achieve maximum spacing for HAWTs to optimize their performance. Common guidelines for the design of HAWT wind farms include maintaining a separation between the turbines equal to three rotor diameters at least and ten rotor diameters in the downstream [9,10].
Recent research indicates that VAWTs in wind farm configuration might exhibit superior performance compared to a separated VAWTs configuration. This stands in contrast to the observations of HAWTs wind farms. This distinction implies that the VAWTs wind farm might provide better efficiency than wind farms consisting of HAWTs [9,11]. VAWTs have mostly been attributed to a niche segment of the wind turbine market. Their main advantage has always been the fact that they have the ability to generate power regardless of the wind direction, while HAWTs need yaw mechanisms to face the wind. Despite this obvious advantage over HAWTs, most VAWT designs have too low efficiency to compete on both economic ground and the power coefficient side when compared to HAWTs [9].
In addition to large HAWTs farms, wind energy technology is also a viable energy production alternative for households and suburban applications [12]. Usually due to HAWTs immense sizes, noise generation, aesthetic and safety concerns, these wind turbines are typically out of scope in the urbanized environment and for the private sector prosumers [13,14]. This is where small VAWTs are gaining popularity [15]. Based on the principle of operation, typical VAWT solutions are either drag-driven, lift-driven, or a combination of both. Two most popular of VAWTs are Darrieus and Savonius turbines [4,9,10,13,16,17]. The towers of VAWTs are structurally simpler and both generators with gearboxes may be positioned close to the ground level, which means that maintenance is also easier.
However, VAWTs also have some major disadvantages when compared to HAWTs. The Savonius rotor has a major drawback in its low efficiency, typically reaching up to 35% in experimental rotors. Additionally, it cannot harness higher wind velocities due to installation on shorter towers. Similar to HAWTs, Savonius turbines need more materials per unit power rating [10,13]. Moreover, most VAWTs are not considered self-starting, except the designs like Savonius rotors, which are solely drag-driven. Another negative aspect is that, when the rotor finishes its full rotation around the axis, usually there is a moment when the blades are in the aerodynamic dead zone, which lowers the overall system efficiency [4,16,17].
In the recent years, roofs became an increasingly accepted concept as a viable location for small wind turbines [18,19,20,21]. When compared to conventional tower-mounted turbines in open areas, high buildings are essential for roof turbines to compensate for overall lower wind speeds in the urban environment and are crucial to achieve satisfactory energy yields [22]. An ideal wind turbine for this environment should be compact and offer architectural freedom for easier integration into structures. Important factors for manufacturers specializing in small-scale vertical axis installations is to capitalize on advantages of VAWTs while mitigating the weaknesses found in the original Savonius and Darrieus designs. The focus should lie on delivering quiet systems, which are capable of receiving omnidirectional wind with minimal maintenance requirements. Considering the seasonal limitations of photovoltaic installations, combining solar and wind power emerges as a natural solution to ensure continuous energy production throughout the year [23].
Current research indicates noteworthy progress in enhancing the efficiency of drag-driven wind turbines. Researchers found that the overlapping of Savonius rotors can yield a power coefficient C P exceeding 0.35. Hybrid combinations of Savonius and Darrieus rotors have also been studied. By leveraging the strengths of both designs and minimizing space requirements, it turned out that they can outperform their individual variations. This is especially true in rapidly fluctuating wind velocities, where these hybrid designs demonstrate superior performance compared to their standalone designs. The hybrid turbine provides better power and has a decreased startup time. Overall, it has been found that the hybrid Savonius–Darrieus turbines may achieve a remarkable maximum C P of 0.51 in favorable conditions [24,25].
In recent years, a number of studies have been carried out to improve the performance of well-known Savonius and Darrieus wind turbines, including geometric optimization of the shape of the blade tip [26], optimization of the shape of entire Savonius blades [27,28,29,30], addition of new elements to the rotor [31,32], or even new types of VAWTs based on the Savonius concept [33,34]. Another interesting solution for an eccentric vertical-axis wind turbine that had features of both drag- and lift-based turbines was developed by Rudrapal and Acharya [35]. The authors showed that it could produce 15.57% more power than a Darrieus rotor with H-shaped blades.
Of particular importance and interest in the context of this study are studies showing improvements of VAWTs working in groups. In work by Hansen et al. [36], it was found that the interaction of VAWTs can improve the efficiency of a pair of turbines, giving a 15% increase in power output compared to the considered turbine operating in isolation. The study carried out by Chen et al. [37] showed that the optimal installation orientation of a Savonius turbine array can increase power output by more than 20% compared to an isolated turbine. It should be noted that the improvement was only possible for a specific wind direction that was not far from orthogonal to the row of wind turbines.
The preceding research review highlights the ongoing interest and exploration of drag-based turbines, with a predominant focus on established Savonius and Darrieus solutions. However, there appears to be a limited exploration of novel rotor designs in current research endeavors. This article, however, focuses on expanding on the topic of VAWTs, but in a sense of proposing a new rotor geometry, which could be an input to a highly scalable system of wind turbines that can manage low wind velocities economically and produce energy even at wind velocities below 5 m/s, while also taking advantage of proximity to other rotors to improve overall system performance. Based on the known disadvantages of VAWTs, it was crucial that the proposed rotor geometry holds self-starting capabilities and produces a more constant torque when compared to drag-driven solutions, such as the Savonius rotor. Our aim was to propose a rotor geometry, which should be suitable for a fair amount of applications and locations, such as:
-
On top of flat roofs, office buildings or factories;
-
On the parking lots, bridges, highways or near railways;
-
In the vicinity of airports;
-
Combined with photovoltaic farms;
-
As a replacement for a fence around private households or industrial areas.
The proposed rotor geometry is a first step towards a proposition for a highly scalable system. During the design phase, build installation time was an important factor, but also the fact that modules should be easily combinable and expandable in an approachable manner both technically and economically. Due to the fact that recycling is complex for renewable energy systems, our goal was to design a system that could be reprocessed or recycled more than 80% in order to produce new rotor modules. Other wind turbine disadvantages, such as wind turbine noise or visual aspects, were also carefully considered. The proposed and tested rotor geometry is intended for operation at low wind speeds and has a filled cross-section, which consequently ensures no flickering and low operating noise. Potential applications should also blend perfectly with a natural landscape, due to the rotor’s simple principle of operation and form factor.

2. Materials and Methods

2.1. Mathematical Model

In this study, flow simulations were modeled by solving the incompressible Reynolds-averaged Navier–Stokes (RANS) equations along with the eddy viscosity assumption:
u t + · ρ u u = p + · μ + μ t u + ( u ) T 2 3 ρ k I
and the continuity equation, stated as
· u = 0
where u = ( u x , u y ) is the vector of the averaged velocity field, ρ is the fluid density, p is the pressure, μ is the viscosity, μ t is the turbulence eddy viscosity, k is the turbulence kinetic energy, and I is the identity matrix [38]. In order to avoid interference with the streaming flow, the gravity term is absent in Equation (1) [39]. Equations (1) and (2) underwent discretization through the finite volume method (FVM) approach. The numerical simulations were computed using OpenFOAM 8, a C++ open-source toolbox, designed primarily for the development of customized numerical solvers. Additionally, OpenFOAM provides preprocessing and post-processing utilities for addressing problems related to continuum mechanics [40,41,42]. The simulations conducted in this study employed the Semi-Implicit Method for Pressure Linked Equations (SIMPLE) solver algorithm [43,44,45] and the PIMPLE algorithm, a combination of the PISO (Pressure Implicit with Splitting of Operator) and SIMPLE algorithms. The chosen turbulence model was the k- ω shear stress transport (SST), which is widely recognized as an industry standard [46,47,48] and combines the strengths of both the Wilcox k- ω model and the k- ϵ model, utilizing a blending function. The convective form of equations for the transient k- ω SST model is expressed as follows [49,50]:
k t + · ( u k ) = P ρ β * ω k + · ( ν + σ k ν t ) k
ω t + · ( u ω ) = γ μ t P β ω 2 + · ( ν + σ ω ν t ) ω + 2 ( 1 F 1 ) σ ω 2 ω k ω
where ρ is the fluid density, k is the turbulent kinetic energy, ω is the specific dissipation rate, u is the fluid velocity vector, μ t is the turbulent eddy viscosity, ν is the kinematic viscosity, ν t is the turbulent kinematic viscosity, σ k is the turbulent Prandtl number for k, σ ω is the turbulent Prandtl number for ω , P is the production term, and F 1 is the blending function.

2.1.1. Measurable Quantities and Results Interpretation

Torque coefficient C T , power coefficient C P , power P, tip–speed ratio (TSR) λ , and rotational speed Ω were defined as follows:
C T = T A r e f · R · p d = 2 · T A r e f · l r e f · p d
P = C P · ρ r e f · u m a g 3 · A r e f 2
A r e f = D · H = l r e f · H
p d = ρ r e f · u m a g 2 2
C P = C T · λ
λ = ω · R u m a g = ω · l r e f u m a g · 2
Ω = 60 · u m a g · λ π · l r e f
where T is the torque acting around the axis of rotation, A r e f is the rotor swept area, and l r e f is the diameter of the rotor. The components of the dynamic pressure p d are the reference density ρ r e f and the velocity magnitude u m a g . Tip–speed ratio (TSR) λ is the ratio of the blade tip speed to the wind speed, ω is the angular velocity, R is the rotor radius and Ω is the rotational speed, measured in revolutions per minute. In incompressible cases, Equation (5) is solved with the use of kinematic pressure p k = p d / ρ [51].

2.1.2. Mathematical Model Validation

The mathematical model used in this study was first validated based on materials from NASA [52] and the OpenFOAM websites [53]. The validation process utilized a NACA 0012 symmetrical airfoil, the k- ω SST turbulence model, and an imported FAMILY II (2-D) 897 × 257 NASA mesh. This validation was previously conducted in studies on airfoil [54] and aircraft aerodynamics [55], demonstrating satisfactory accuracy when compared to experimental data [54,56,57].
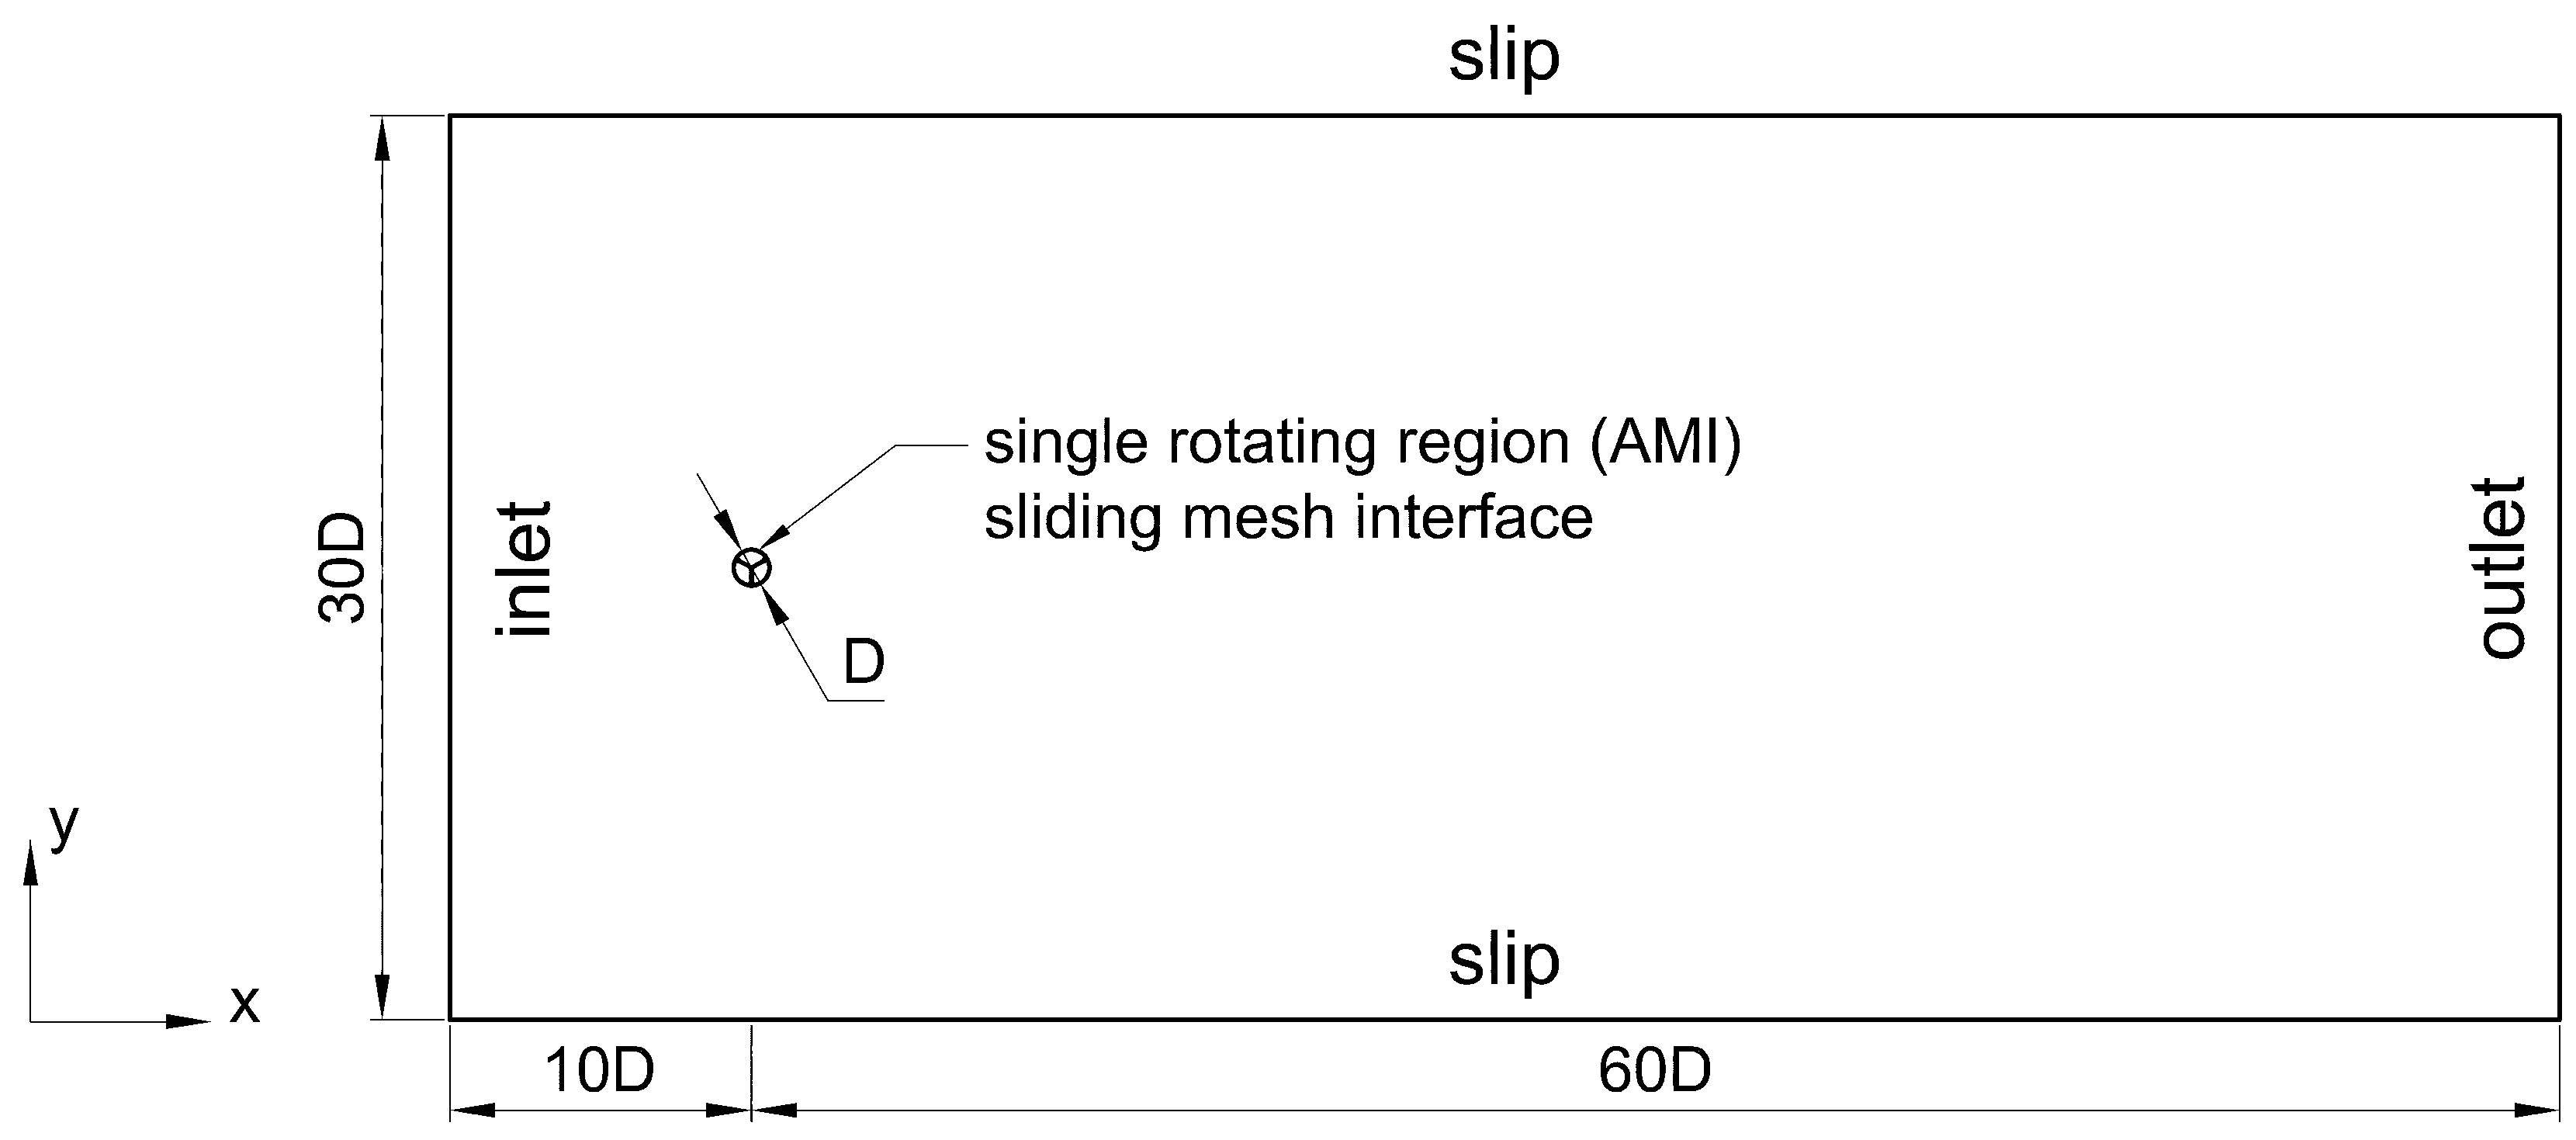
The objects of this study utilize aerodynamic forces to generate the rotating motion of the vertical-axis wind turbine (VAWT), by pushing the blades and producing torque around the main shaft of the rotor. Therefore, for the purpose of this paper, the mathematical model validation was extended to include torque coefficient validation ( C T ) for a Darrieus wind turbine. The investigation for the Darrieus wind turbine was based on work conducted by Hansen et al. [36], which involved a sliding mesh approach. The authors of that study demonstrated that the numerical grid they developed and analyzed provided sufficient accuracy for the momentum coefficient. The VAWT used in the study had three blades incorporating NACA 0018 symmetric airfoils, with an angular spacing of 120 between each blade. The diameter of the rotor was 20 m. The rotor geometry dimensions are presented in Figure 1. The domain dimensions were derived based on work performed by Balduzzi et al. [58,59] to replicate open-field-like atmospheric conditions for the Darrieus rotor. The computational domain used in the validation study is shown in Figure 2.
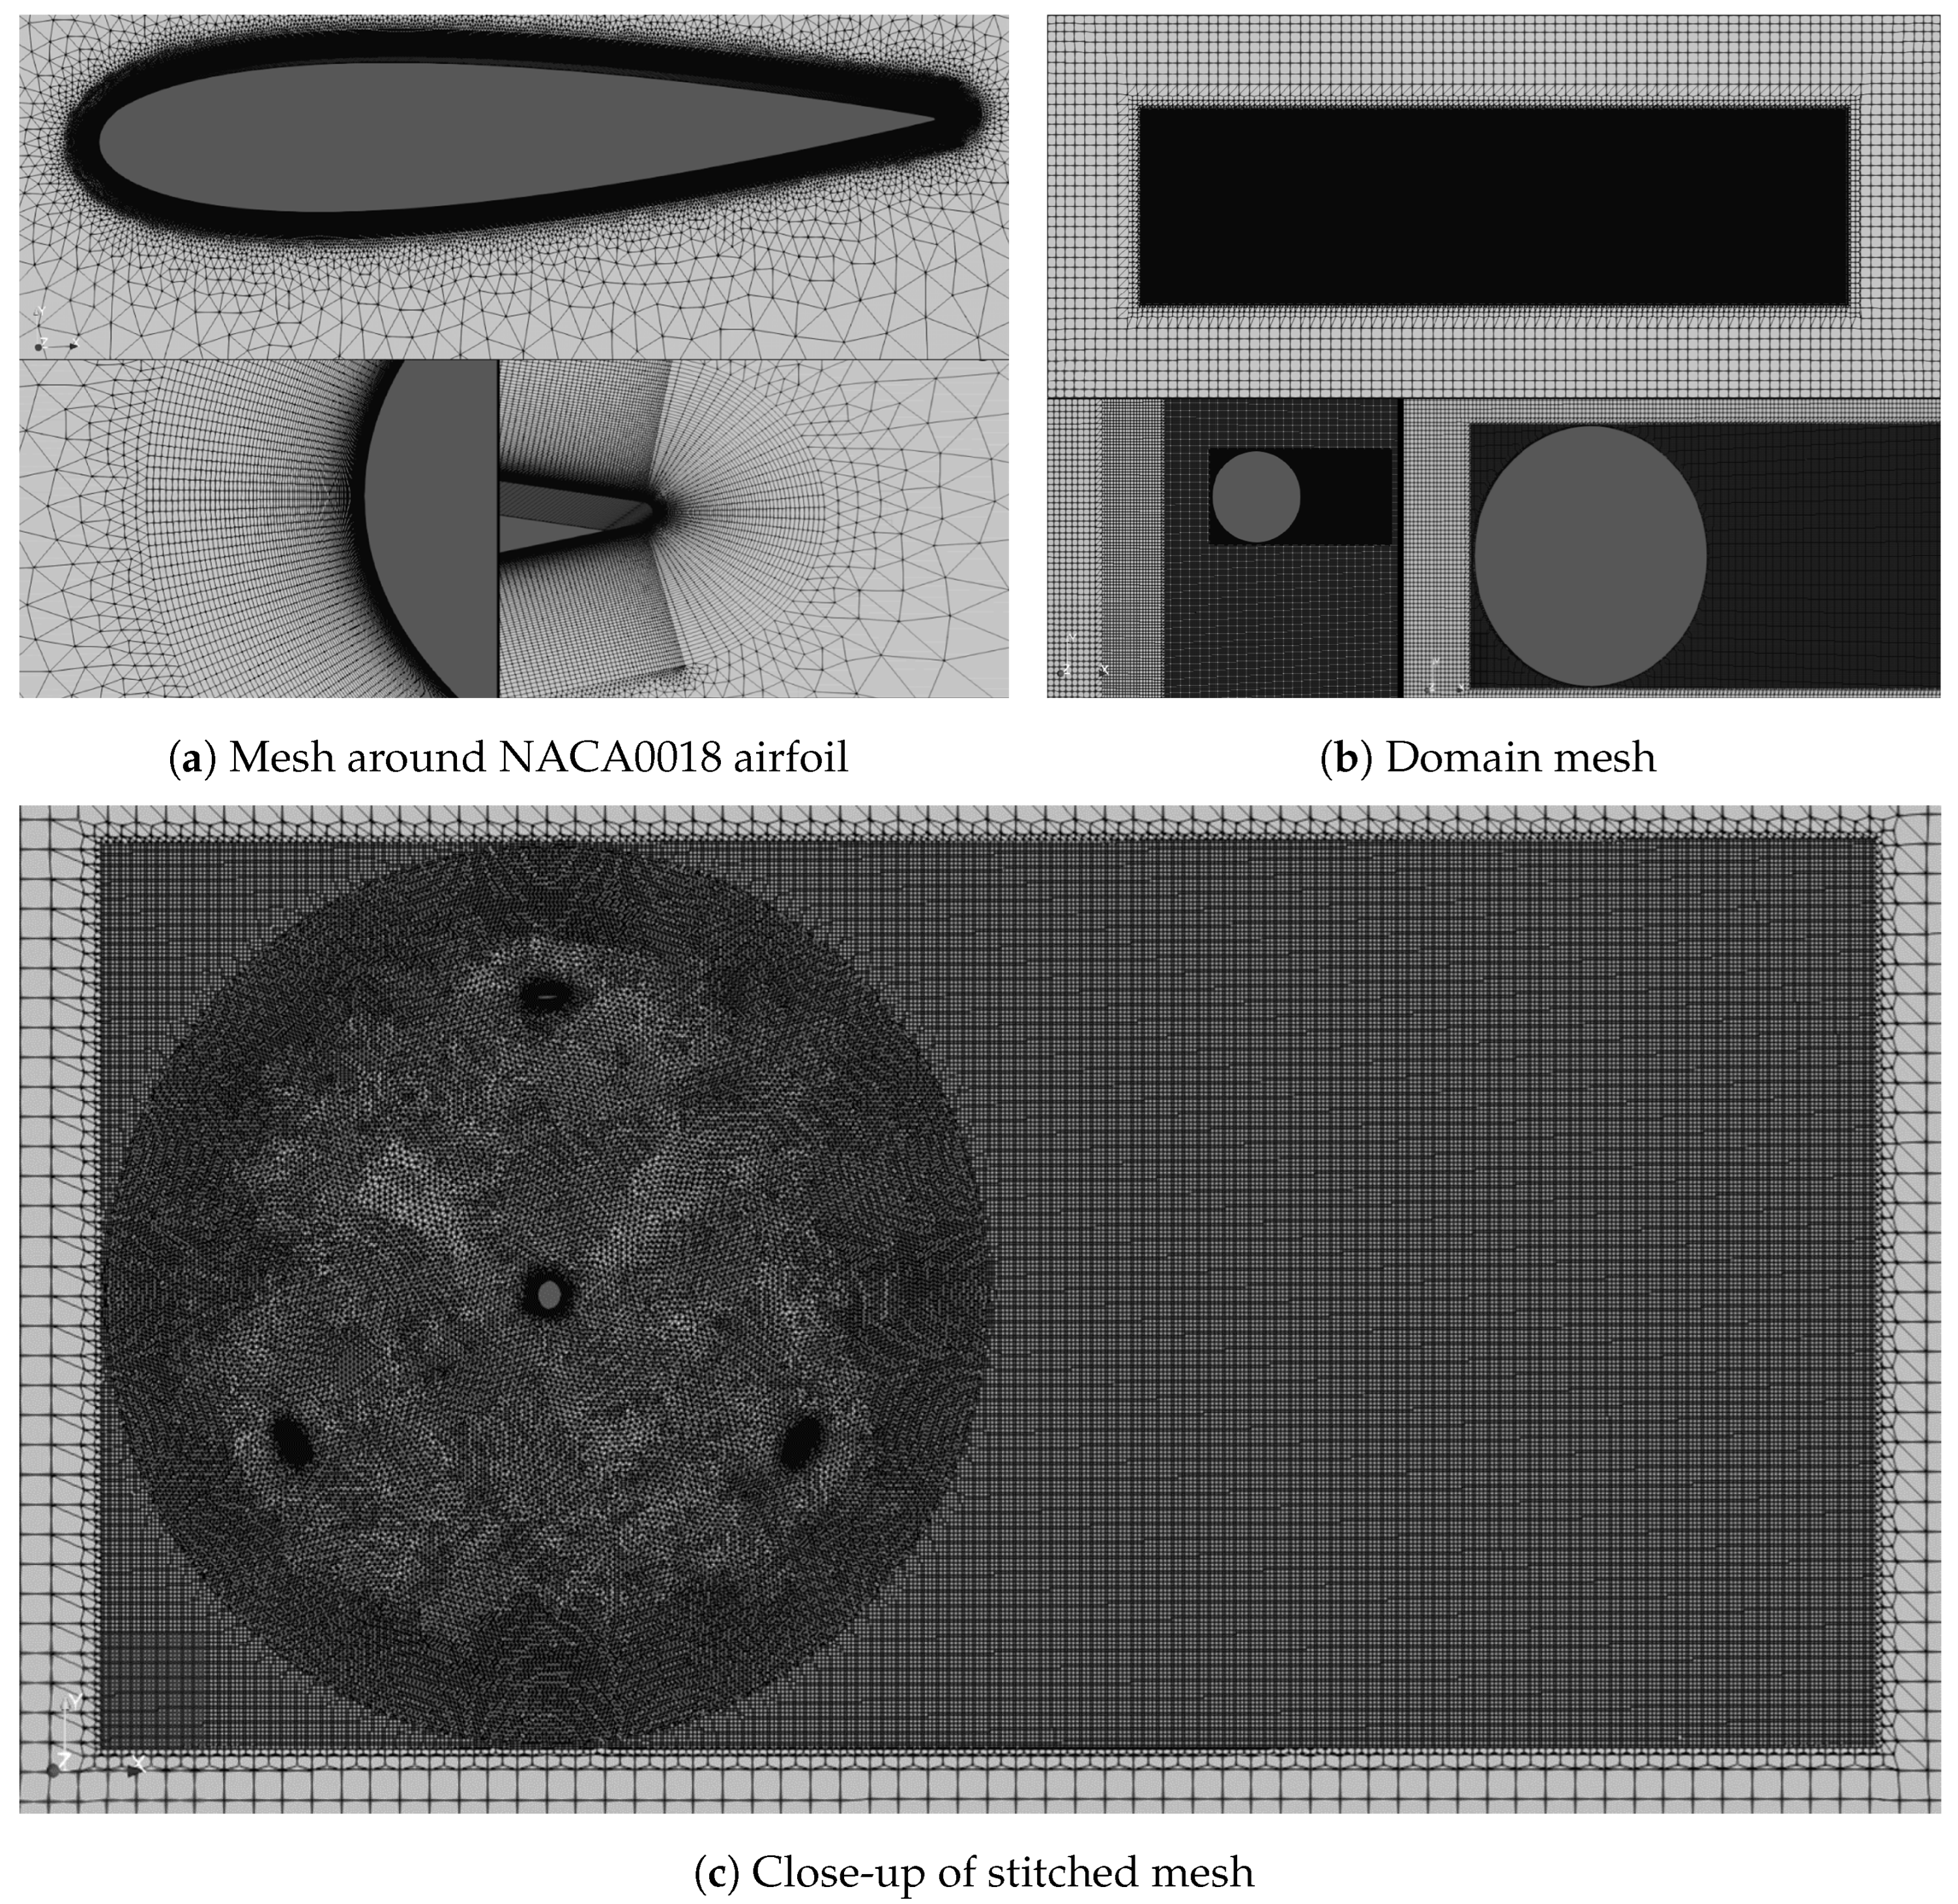
In this study, Salome 9.9.0 software was used to generate the rotating cell zone containing the Darrieus wind turbine geometry. The maximum number of prism layers allowed by Salome, n = 99 , with an inflation ratio of Δ y = 1.03 , were generated on the wall surfaces to ensure smooth capture of pressure and velocity gradients in the near-wall zone. The height of the first layer was y = 5.41 × 10 5 m. The domain grid was meshed using the snappyHexMesh utility built into OpenFOAM. Upon completing the simulation, the values of the dimensionless wall distance were y min + = 0.035 , y max + = 4.067 , and y avg + = 0.8241 . These values satisfied the requirements for capturing the viscous sublayer. The numerical grid for the validation study is presented in Figure 3 and the flow characteristics are shown in Table 1.
The boundary conditions used to accurately model the natural environment of the VAWT workplace are presented in Table 2 and Table 3. The inlet velocity was set to u x = 10 m/s, and to ensure stable fluid flow, a constant pressure outlet boundary condition was implemented. The top and bottom walls of the computational domain were set to a slip condition, allowing flow to exit the domain without causing unnecessary blockage. The turbulence intensity was set to I = 1 % , and the angular velocity of the rotating cell zone was ω = 3.5 rad/s [36].
Equations for k, ω , and ω w a l l are presented below [50]:
k = 3 2 ( u I ) 2
ω = k 0.5 C μ 0.25 · L
ω w a l l = 6 ν β 1 y 2
where velocity magnitude is deemed as u , turbulence intensity is I, L is the reference length scale, ν is the kinematic viscosity, and y is the normal wall distance. The last two quantities of C μ and β 1 are constants of 0.09 and 0.075, respectively.
The simulation utilized 2nd order schemes, maximum inner iterations of n i n n e r = 3 , and a Δ t = 0.0005 s basic time step with a Courant number limit of m a x C o = 1 [60]. Convergence criteria consisted of residual control for velocity components u x | u y 1 × 10 6 and kinematic pressure p 1 × 10 5 . Due to computational power and time limitations, the total simulation time of t = 21.1 s was achieved, which captured 11 full revolutions.
Figure 4 shows a comparison of the results obtained in the state-of-the-art work [36] with the validation results obtained in this work. It can be clearly seen that the compliance is very high and satisfactory throughout the entire rotation cycle of the rotor.

2.2. Geometry for the CFD Case Study

The geometries analyzed in the study are shown in Figure 5. As a reference point, simulations were also carried out for the optimal shape of the Savonius turbine without and with the deflector, which improves the flow around the rotor. Rotor diameters varied between D = 115–131 mm and were divided by the number of blades (recesses). The geometry of the Savonius rotor had a maximum diameter of D = 115 mm and was designed according to the recommended optimal sizing [61]. More detailed information on the rotor geometries can be found in Table 4.
The studied rotor cross-sections are similar in shape to a cylinder, equipped with a specific number of recesses of varying depths. Therefore, the shape of the geometry and its operating principle are somewhat similar to an undershot water wheel. Preliminary wind tunnel tests showed a high susceptibility of rotor rotational speed to increasing flow velocity, indicating a potential for power production by the designed geometries. Furthermore, tunnel testing also demonstrated a positive impact on rotational speed when the rotors were arranged in a palisade formation. On the other hand, wind tunnels are subject to certain errors compared to real conditions in which these rotors would operate. Conducting tests in real conditions would incur further costs related to producing multiple palisades with different sizes and types of rotors, as well as measurement setups. Therefore, it is reasonable to apply numerical methods, including computational fluid dynamics, to optimize the rotor shape and minimize costs in the prototype phase.

2.2.1. Computational Domain Scenarios

The modeling of rotational motion utilized the arbitrary mesh interface (AMI), which enables the rotation of a specified part of the numerical mesh within the computational domain [62]. Two dynamic mesh functions were employed. The first one imparted inertia [63] to the central rotor in order to examine the start-up characteristics, while the most outward turbines are stagnant. The second one provided angular velocity to all geometries [64] in the domain to investigate power characteristics. Figure 6 illustrates a conceptual shape of the computational domain of those scenarios with marked distances and dimensions. The length of the domain was defined as L = 15 D , and its height as H = 12 D . The domain dimensions were chosen based on the wind tunnel investigation, but enlarged in the y-axis in order to minimize the impact of boundary conditions on the channel flow.
To create a two-dimensional (2D) scenario simulating an infinite array of turbines with infinite height, a domain similar in shape to the previous case was used, but the height of the computational domain was reduced to ensure that the boundary conditions imposed on the upper and lower surfaces of the domain reflected the condition of infinite array of rotors. This was achieved with the use of a cyclic boundary condition (BC), which connects the top and bottom BCs together. The development of the numerical mesh was divided into two parts: the computational domain and the circular shape containing the turbine.
The computational domain mesh had three openings where the numerical mesh of individual turbines was subsequently inserted and stitched together. This solution allowed for easy rotation of turbines and the creation of stationary computational cases for rotation angles of θ = ( 0 350 ) . Torque coefficient characteristics, C T , were obtained per each 10 step. The conducted simulations were significantly less time-consuming compared to nonstationary simulations with a moving mesh and variable time step based on Courant number. Simulations were performed for three types of spacings between turbines s = ( 10 , 20 , 30 ) mm.
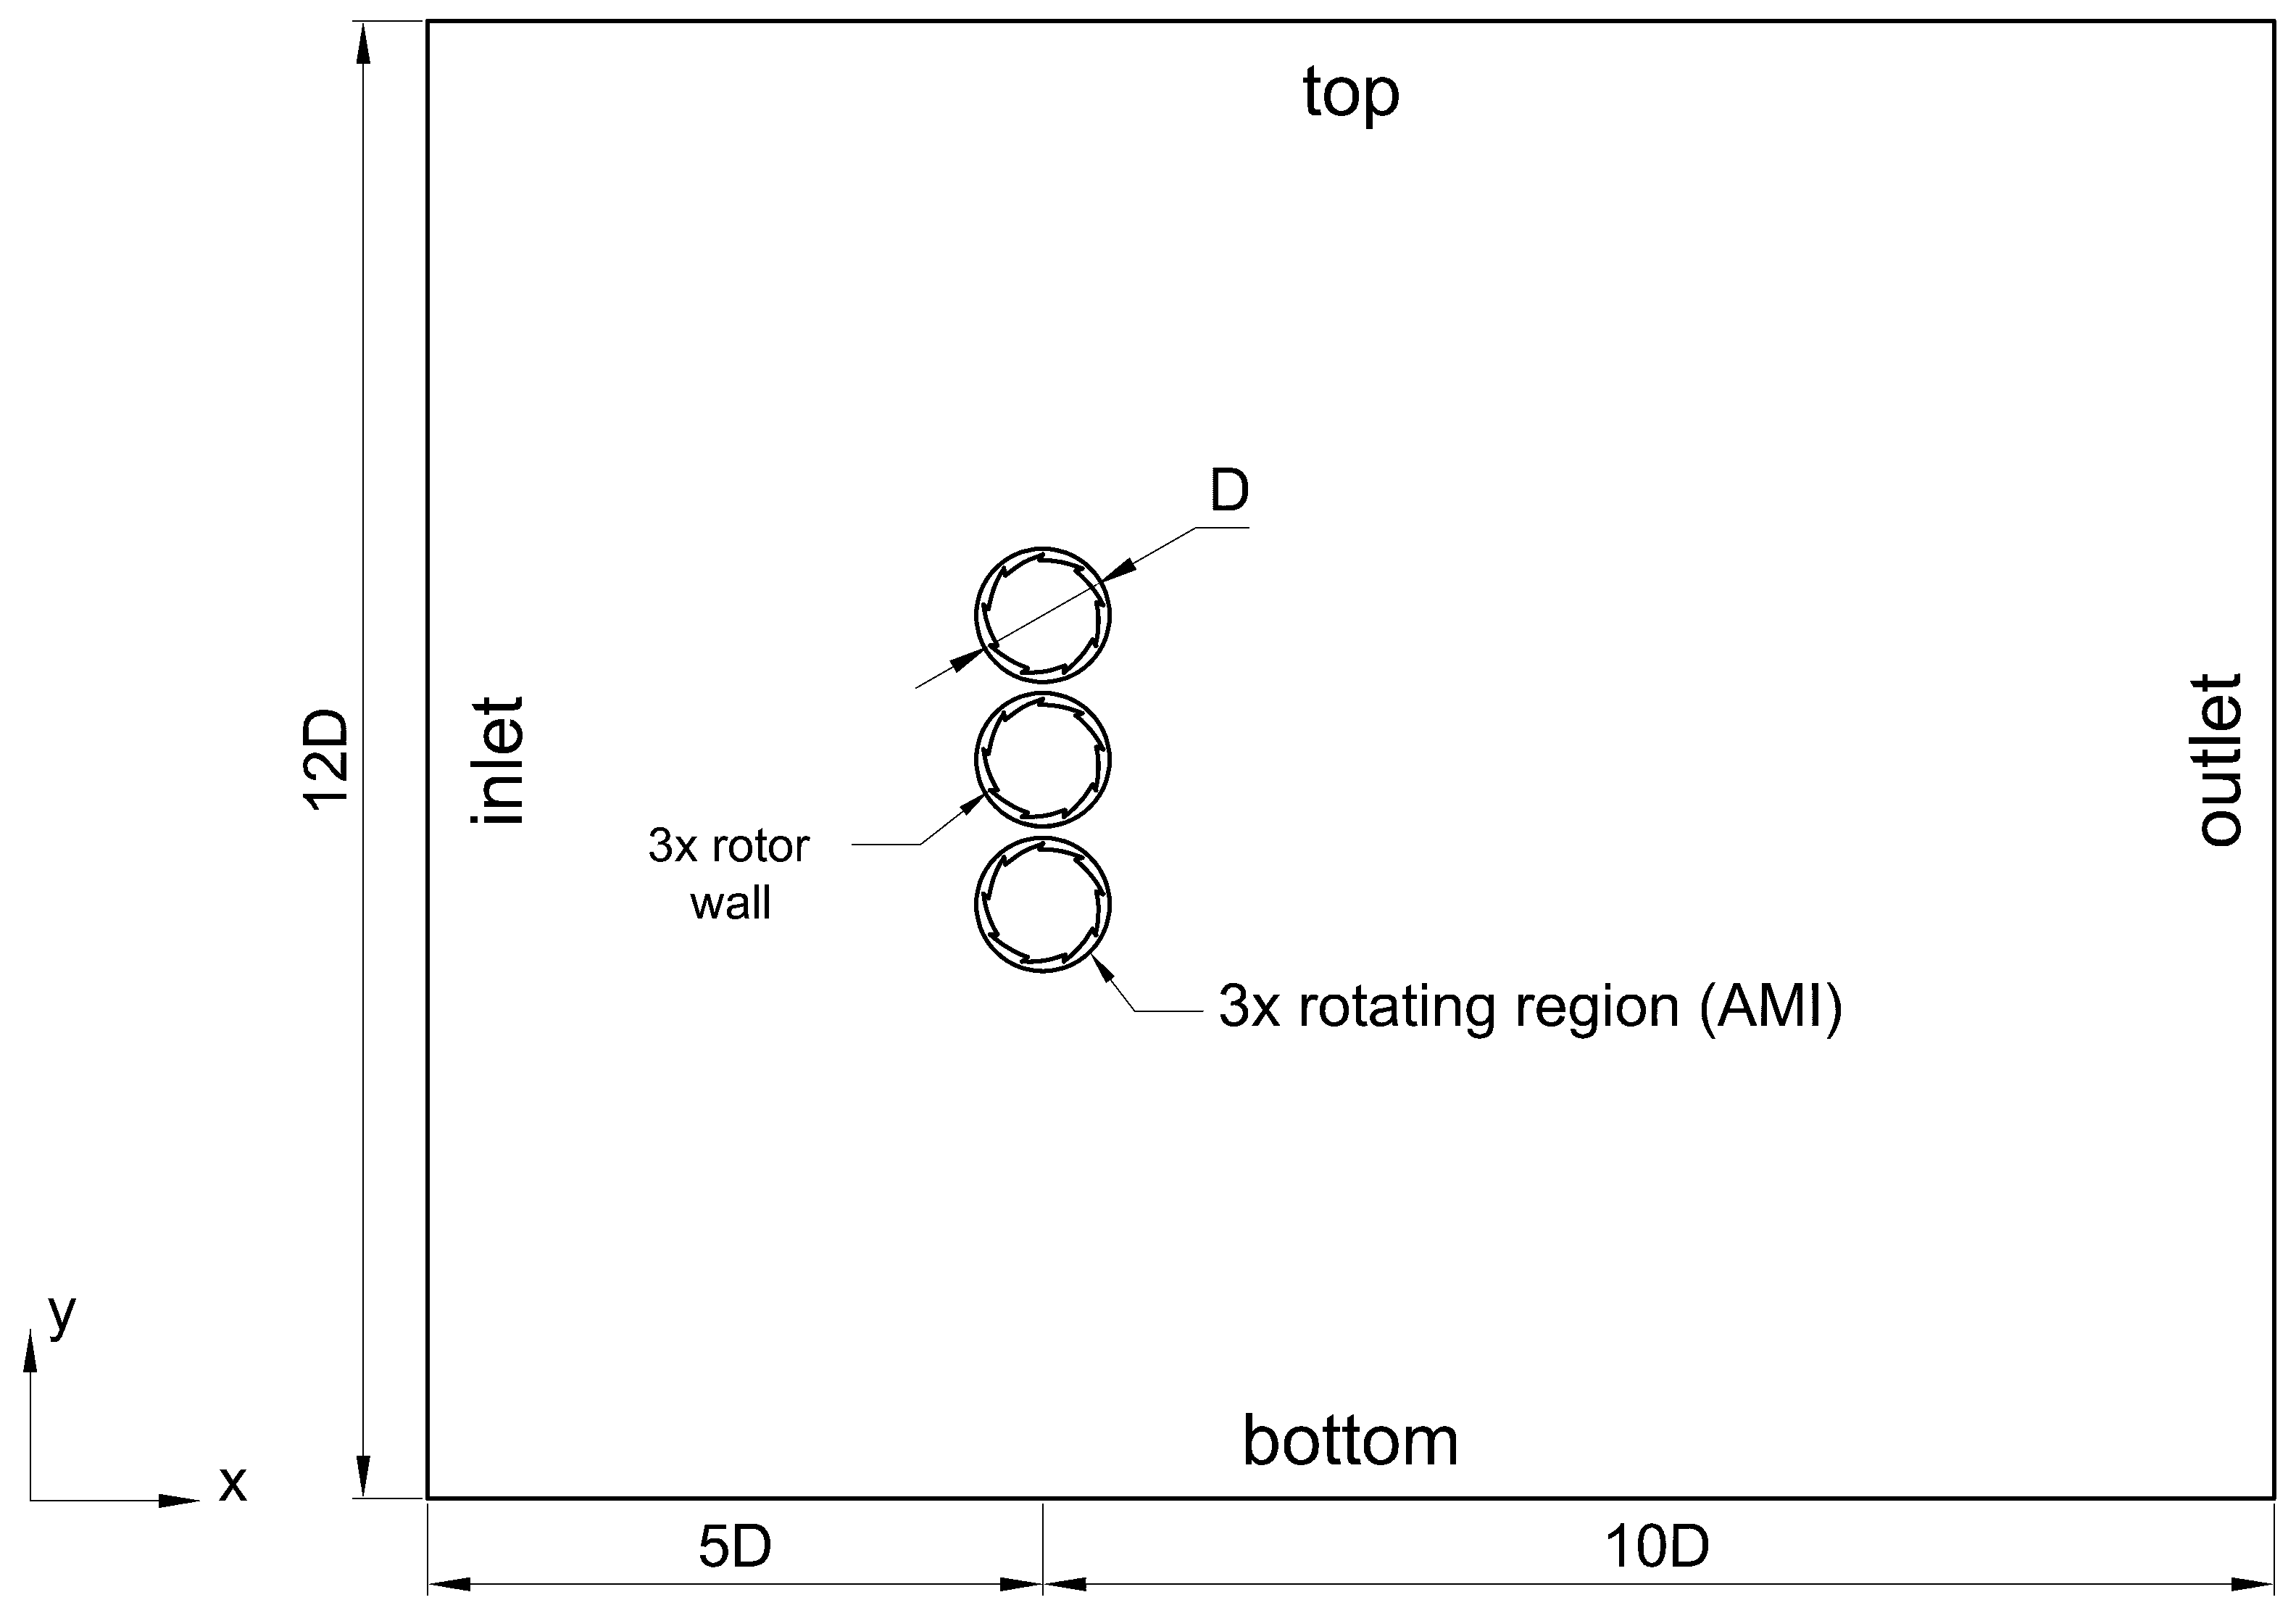
Figure 7 illustrates a conceptual shape of the computational domain with marked distances and dimensions. The length of the domain stayed the same and its height corresponds to the diameter of three rotors and the spacing between them H = 3 D + 3 s .
The third iteration of simulations included various starting angle positions. The idea was to examine the offset starting angles of the turbines and to conclude whether fixed angle offset positions improve the overall flow around given geometries and provide better power coefficients. Two configurations of = ( 10 , 0 , 20 ) and = ( 20 , 0 , 40 ) were compared.
Figure 8 represents the fourth iteration of the computational domain, which aimed to simulate an offset configuration of infinite array of turbines with infinite height. The settings and dimensions were virtually the same as in the case of the second approach, but the domain height was changed to accommodate only two rotor geometries. One of the rotors was also offset in the x-axis direction by c = ( 10 , 20 ) mm.
In the first scenario, apart from the Savonius turbine, only Y22 and W22 rotors were tested, as these were the geometries that provided the best results during wind tunnel testing. The third and fourth scenarios revolved only around a Z22 geometry, in order to explore the variations in the results that come out of the starting positions and offsets. However, the majority of geometries were tested in the second scenario, and these were Savonius, J22, K22, N22, M22, P22, S22, X22, Z22, U22, L22, T22, and Y22 rotors. These simulations consumed the least amount of time due to stationary computations and were a good basis for comparison.

2.2.2. Numerical Grids

The calculation was carried out on high-quality structural grids consisting of orthogonal cubic cells. Grids were meshed using snappyHexMesh, which is a high-quality mesh utility integrated within OpenFOAM. The tool creates 3D hex-dominant meshes from surface geometries triangulated in stereolithography (STL) format, and integrates layers during the final stage of the meshing procedure.
The numerical grid was regularly refined in the area around the rotating rotors and in their aerodynamic slipstream. Additionally, the region near the rotor blades also underwent refinement. The length of the edges of the base cells was 10 mm, and the cell refinement in the domain was performed with an expansion factor E = δ t δ b , where δ t is the ratio of the cell height at the top of the grid block to the cell height at the bottom of the grid block δ b . For the lower grid block, E b = 4 , and for the upper grid block, E t = 1 4 . The developed 2D numerical grids with a single cell in the z-axis direction comprised 400,000–500,000 cells. To represent the viscous sublayer, n = 10 layers with an inflation factor of Δ y = 1.05 were generated. The thickness of the first layer was y = 5.927 × 10 5 m, ensuring a dimensionless wall distance y + < 1 for all geometries. Grids for further phases utilized the exact same mesh settings, except the dimensions in the y-axis direction were changed and the top/bottom boundary conditions reflected a cyclic (connected) condition.
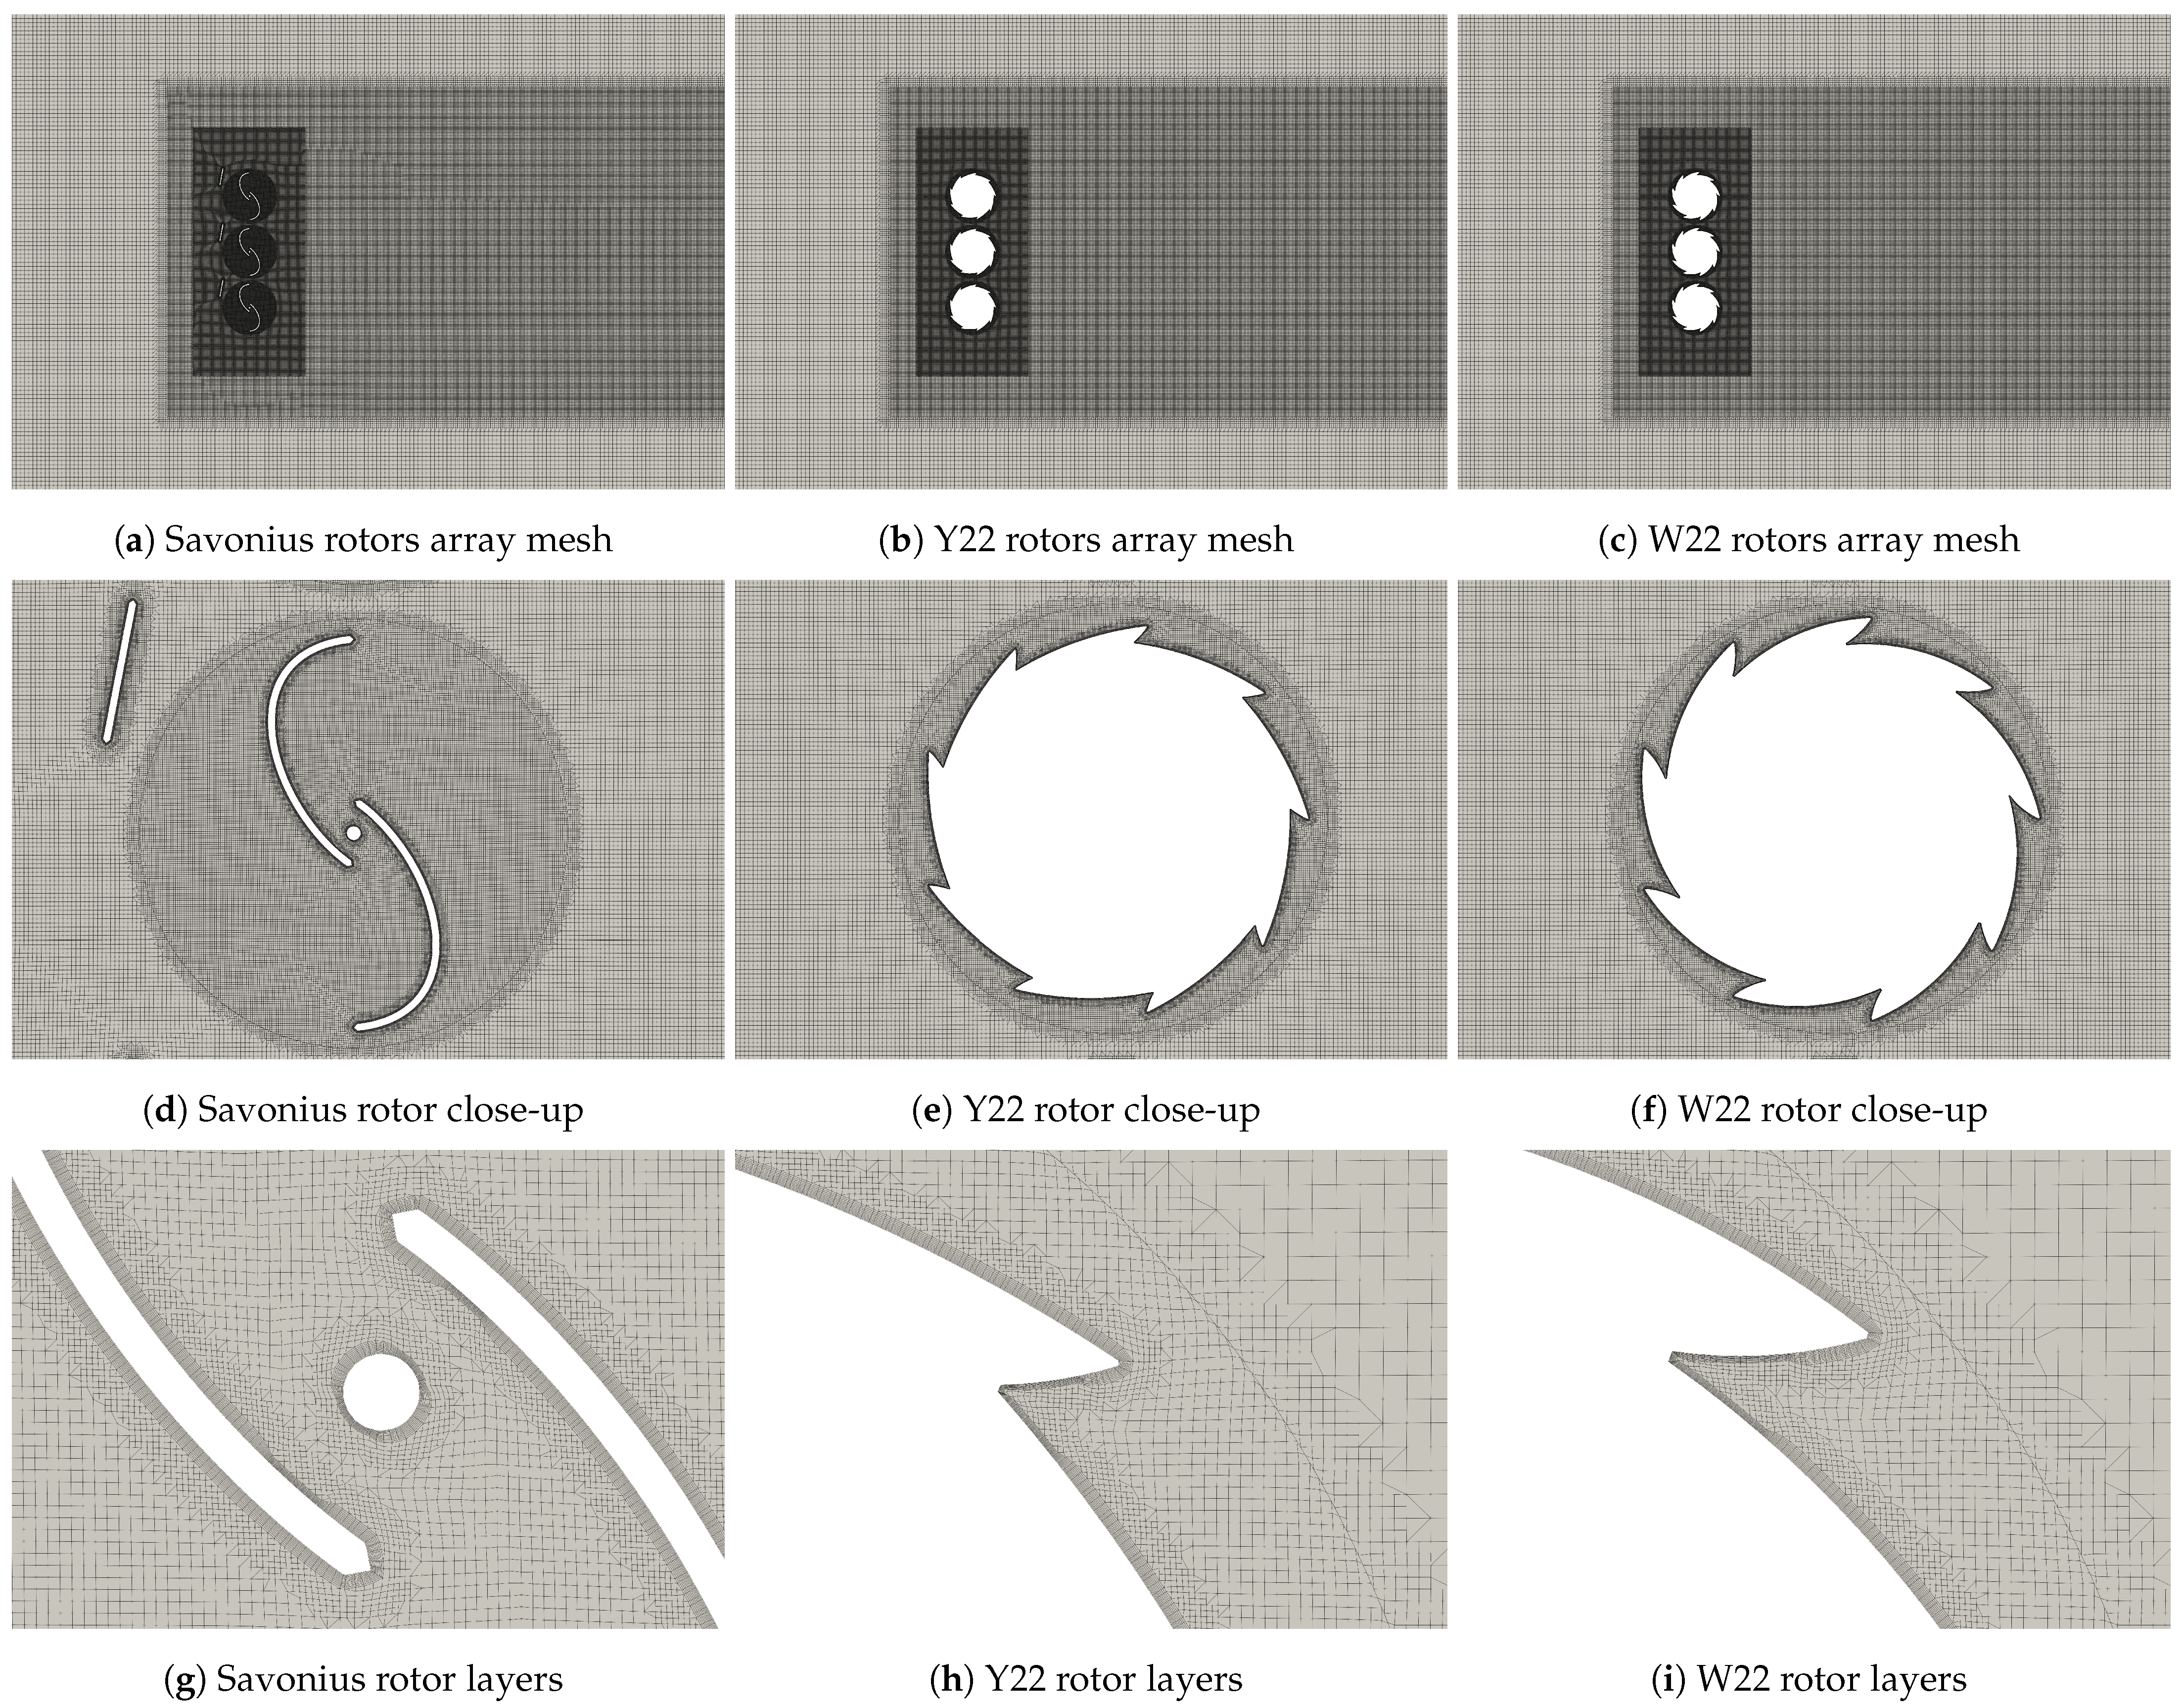
Figure 9 depicts lateral projections of the grids used in the first phase of the study.
Table 5 provides a comprehensive breakdown of which geometries were tested under which conditions.

2.3. Flow Characteristics, Configurations, and Boundary Conditions

Numerical studies simulated 2D aerodynamics around turbine cross-section geometries in transient and steady state. The flow was deemed as subsonic with very low Mach or Reynolds numbers. Material settings were the same as is the case for air at international standard atmospheric conditions at 15   C. The material was single-phase, nonreacting, and incompressible Newtonian fluid. Flow characteristics can be found in Table 6.
When working with external aerodynamic flows, a good practice is to choose a low turbulence intensity value. Wind tunnels of pristine quality may provide turbulence values as low as 0.05%. In the case of this study, I = 5 % was selected [65]. Another essential parameter that required specification was the ratio of eddy viscosity, denoted as μ t / μ . For external aerodynamic flows, this parameter typically falls within the range of 0.2 to 1.3 . Therefore, a value of μ t / μ = 1.3 was chosen. Equations (12)–(14) [50] were used to calculate the k and ω initial values. Table 7 and Table 8 represent the boundary conditions (BCs) for transient-state simulations and Table 9 and Table 10 contain BCs for the steady-state cases.
Dirichlet fixedValue boundary conditions were used for velocity u , turbulent kinetic energy k and turbulent specific dissipation ratio ω at the inlet, outlet pressure p, and velocity u at the rotor walls. Neumann zeroGradient boundary conditions were used for pressure p at the inlet and turbulent kinetic energy k at the outlet. This boundary condition applies a zero-gradient condition from the patch internal field onto the patch faces. Mixed inletOutlet boundary conditions were used for velocity and turbulent specific dissipation ratio ω at the top, bottom, and outlet patches. This boundary condition provides a generic outflow condition, with specified inflow for the case of return flow. Empty boundary condition was applied for left/right walls, which reduced the dimension of the case to 2D.
Additionally, the arbitrary mesh interface boundary condition cyclicAMI was used for the rotating cell zone region’s outer boundary of the mesh and the inner boundaries of the circular cutouts in the domain mesh. cyclicAMI is a coupling condition used between a pair of patches that share the same outer bounds but may have dissimilar inner constructions. This allows for the seamless transfer of flow information across the interface, despite the relative motion between the meshes, and is often utilized in sliding mesh cases [62,66].
Convergence criteria for transient-state simulations utilized residual control for velocity u 4 × 10 6 and kinematic pressure p 1 × 10 5 in combination of outer corrector residual control for velocity u 1 × 10 3 and kinematic pressure p 1 × 10 3 . A total time calculated for each transient simulation equaled t = 2 s. Ideally, it is recommended to keep the Courant number below 1 in order to ensure the stability of the numerical schemes and accuracy of the solution [60]; therefore, simulations utilized the maximum Courant number of m a x C o = 0.8 . For simulations involving cylindrical rotors, the average number of time steps ranged from 175,000 to 230,000, and for simulations involving Savonius rotors, the average number of time steps was approximately 300,000.
Convergence criteria for steady-state simulations utilized residual control for velocities u x | u y 1 × 10 4 , kinematic pressure p 1 × 10 3 , turbulent kinetic energy, and specific dissipation rate k | o m e g a 1   ×   10 4 . This means that simulations automatically stopped when all residuals reached the specified threshold. If these criteria were not satisfied, a backup convergence criterion was set at a total number of iterations n = 25,000.

3. Results

In the initial phase of the numerical investigations, six simulations were conducted with the parameters outlined in Table 11. The domain used was the one shown in Figure 6, and the nonstationary simulations went on for 2 s in order to confirm if the proposed geometries hold any wind energy harvesting capabilities in open field conditions.

3.1. Nonstationary Results

These simulations were significantly more time-consuming compared to stationary numerical calculations due to the utilization of a moving mesh and variable time step. However, they were imperative for examining the start-up characteristics and potential power production capabilities of cylindrical rotors from a standstill. The choice of open field conditions was deliberate, aiming to compare the capabilities of cylindrical barbed shapes against an optimized Savonius turbine geometry [61], particularly under unfavorable flow conditions where the palisade is finite and air flow is unrestricted around it.

3.1.1. Results for Central Y22 and W22 Rotor Start-Up

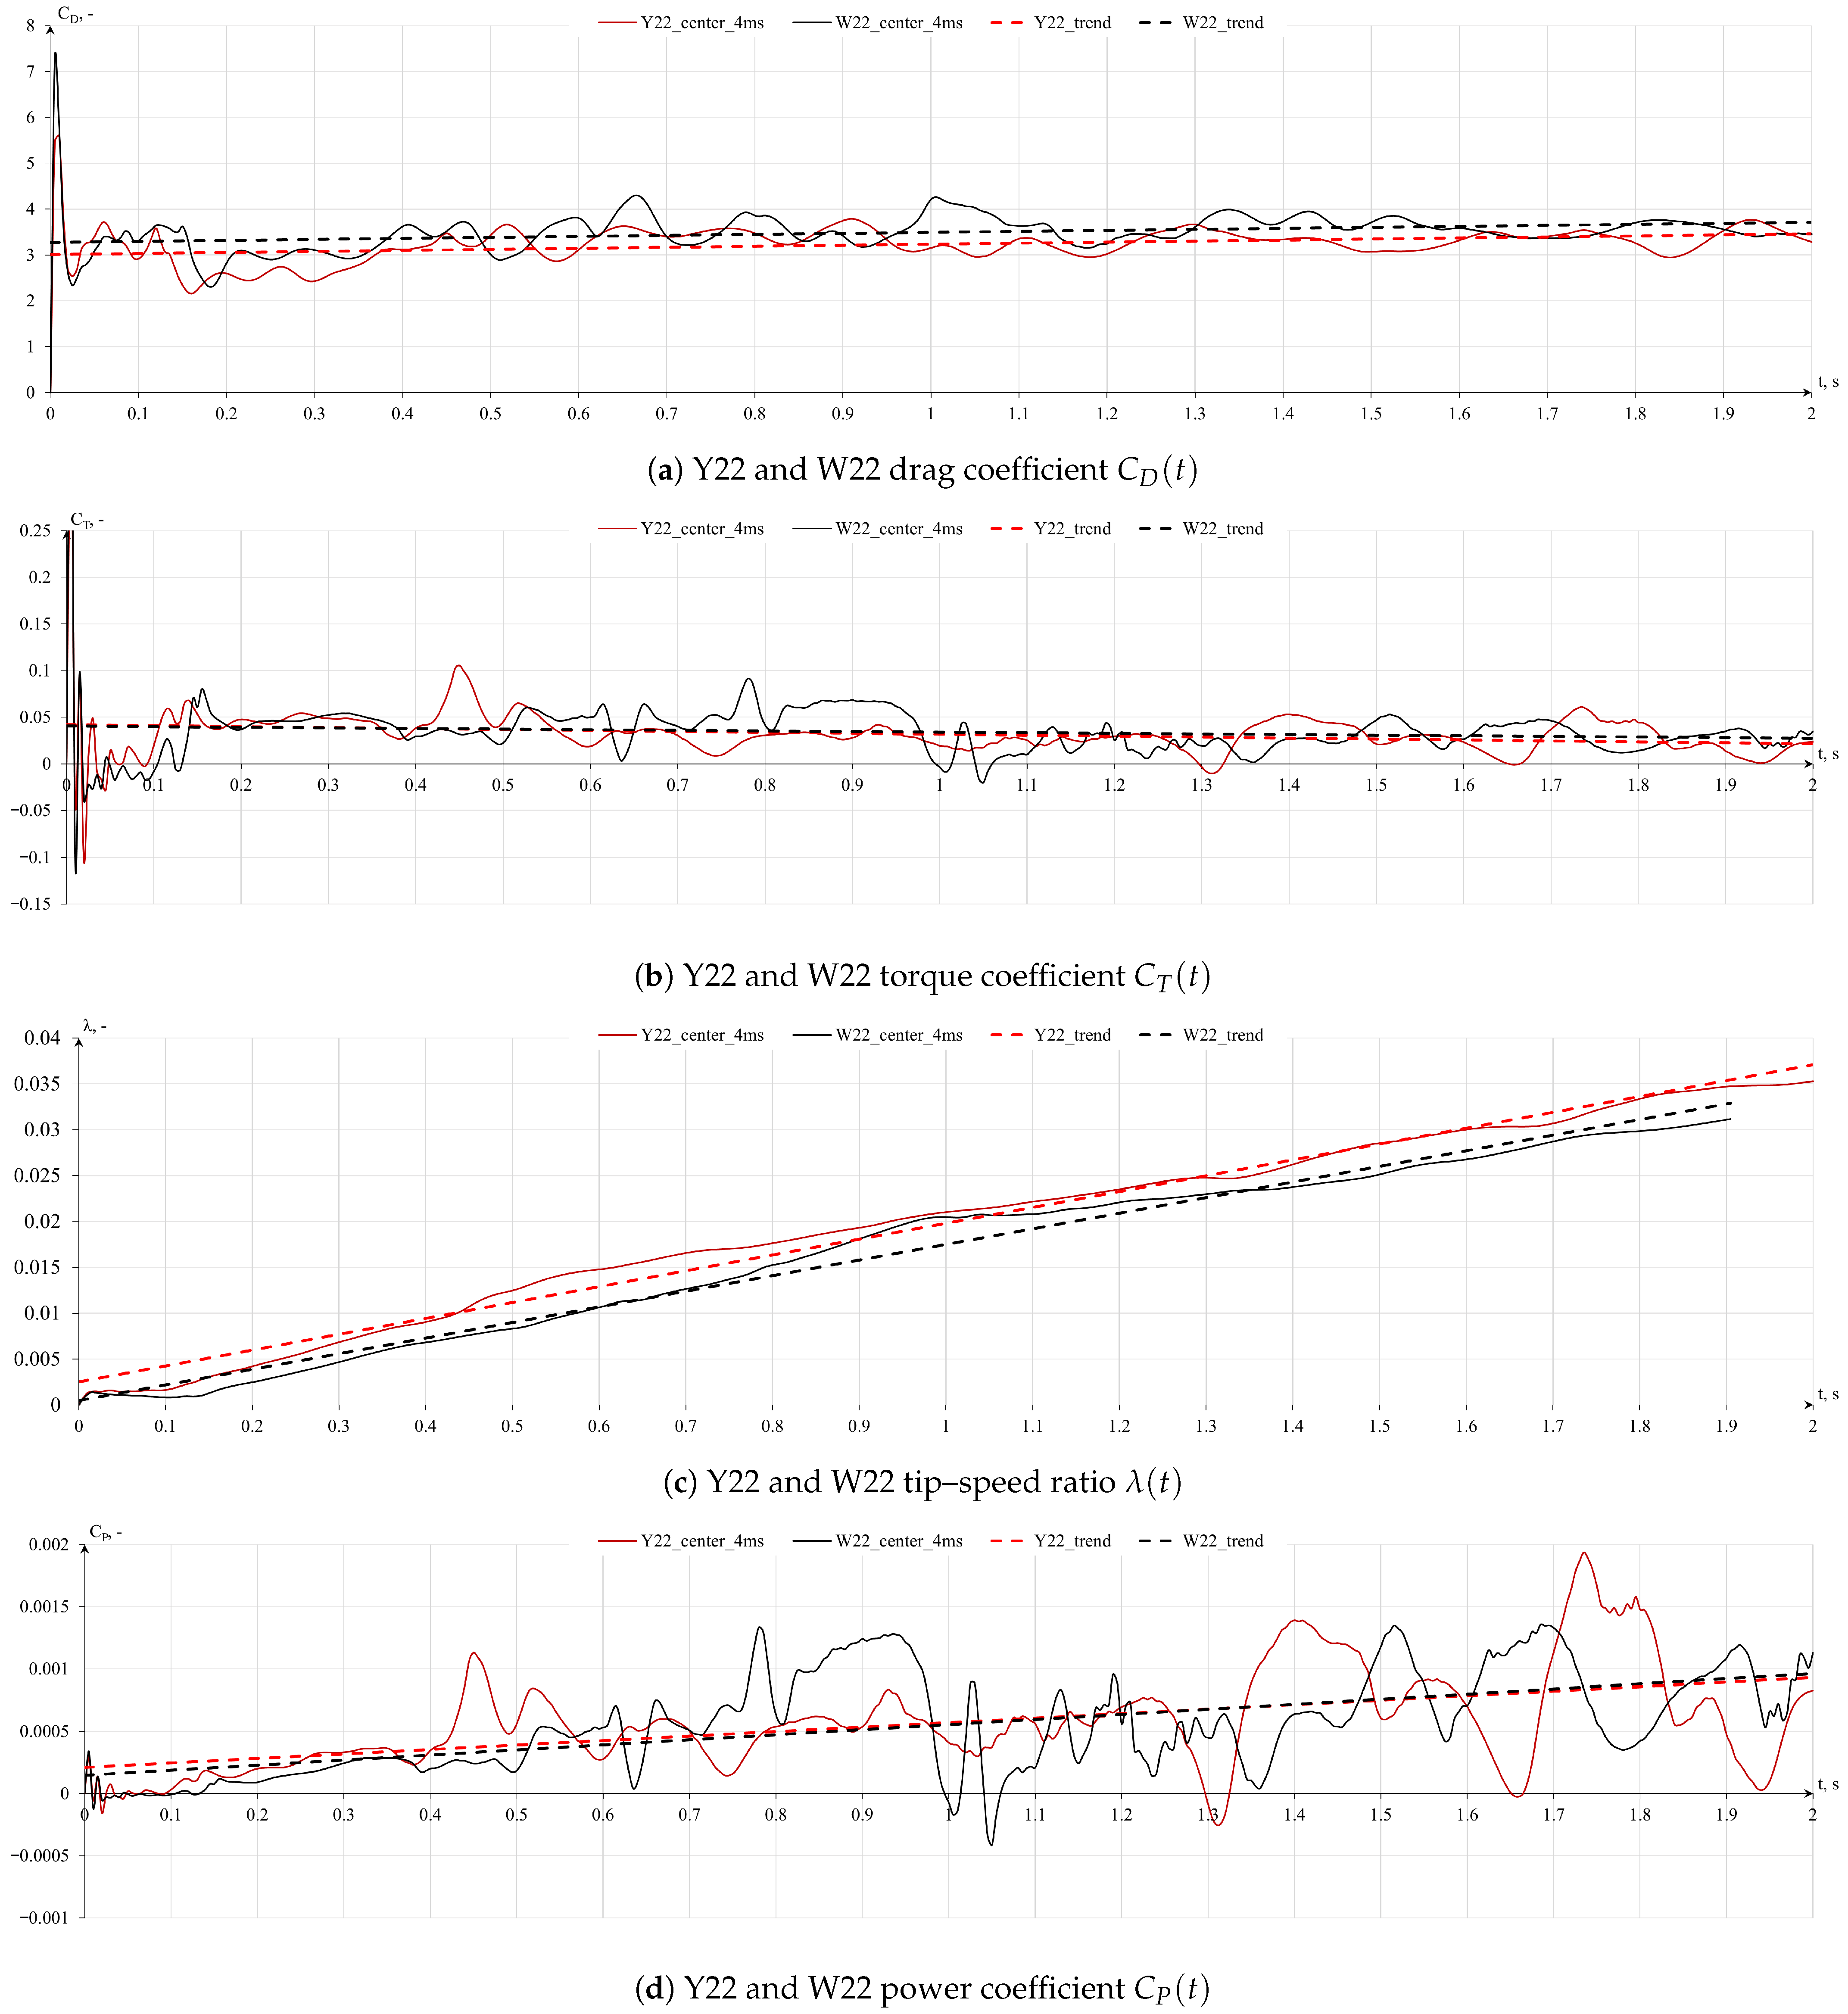
The comparison of Y22 and W22 geometries for central rotor start-up simulations is presented in Figure 10. Figure 10a,b depict a comparison of the drag and torque coefficient, while Figure 10c,d represent a comparison of the power coefficient and calculated tip–speed ratio, respectively. Trend lines are represented by dashed lines.
Upon initial observation, it was noted that during central rotor start-up conditions, the Y22 geometry demonstrated lower drag forces compared to the W22 rotor. This discrepancy is likely attributable to the shallower cavities inherent in the Y22 geometry. This reduces the effective surface area exposed to the incoming wind and leads to lower aerodynamic resistance. Additionally, the less-pronounced cavities create less turbulence and vortex shedding, which also contributes to a decrease in drag force. This results in a smoother airflow over the rotor, reducing the overall drag compared to rotors with deeper cavities. Furthermore, the overall drag of both rotor types tends to increase over time during VAWT start-up conditions. This aligns with established principles indicating that drag force tends to rise with angular velocity and tip–speed ratio for cylindrical geometries [67,68].
The torque coefficient C T tends to lower values with increasing tip–speed ratio λ , although during the startup conditions, the decrease is barely noticeable. The decline in C T with increasing λ can be attributed to the reduction in effective drag differential, increased aerodynamic losses, and complex flow interactions around the blades at higher rotational speeds. These factors collectively lead to a less efficient torque generation at higher λ , causing the torque coefficient to decline. This is also true for Savonius rotors and can be seen in various publications [31,61]. Overall, the findings suggest that the Y22 rotor, despite having shallower cavities than the W22 rotor, exhibits slightly greater susceptibility to gaining rotational speed from the incoming wind.
However, the torque coefficient shows no significant increasing trend, remaining relatively low throughout the simulation. This could raise concerns regarding power coefficient and overall power output. The power coefficient values imply questionable feasibility for energy production in open field conditions during the self-starting phase. The tip–speed ratio depicted in Figure 10c indicates that these geometries require more time to reach operational conditions.

3.1.2. Results for Three Y22 Turbines Rotating with λ = 0.5

After confirming the potential wind power generation capabilities of these cylindrical rotors, a comparative analysis was undertaken to assess their performance against an optimal Savonius wind turbine geometry, recognized as a prominent drag-driven vertical-axis wind turbine (VAWT). The simulations were conducted at a wind velocity of u x = 4 m/s and a tip–speed ratio value of λ = 0.5 . These simulations are particularly suited for power determination as they portray the rotor characteristics under steady operational conditions. The outcomes are depicted in Figure 11, and Table 12 delineates the mean coefficient values across two time ranges, with the t = 1–2 s interval being more precise due to exclusion of initial iterations.
Derived from the findings, it can be inferred that within a finite palisade configuration, the central rotor emerges as the most efficient, yielding the highest power coefficient and power output. Serving as a representative of all turbines within the palisade, the central rotor’s performance marginally surpasses that of the upper rotor. Conversely, the bottom-most turbine fares the least favorably in the comparison, encountering the most adverse flow conditions due to the presence of turbines positioned above it. Nevertheless, the power produced by Y22 turbines with a height of H = 2 m at λ = 0.5 and u x = 4 m/s falls within the range of P = 0.2 0.35 W, which shows poor power generation capabilities.

3.1.3. Results for Three W22 Turbines Rotating with λ = 0.5

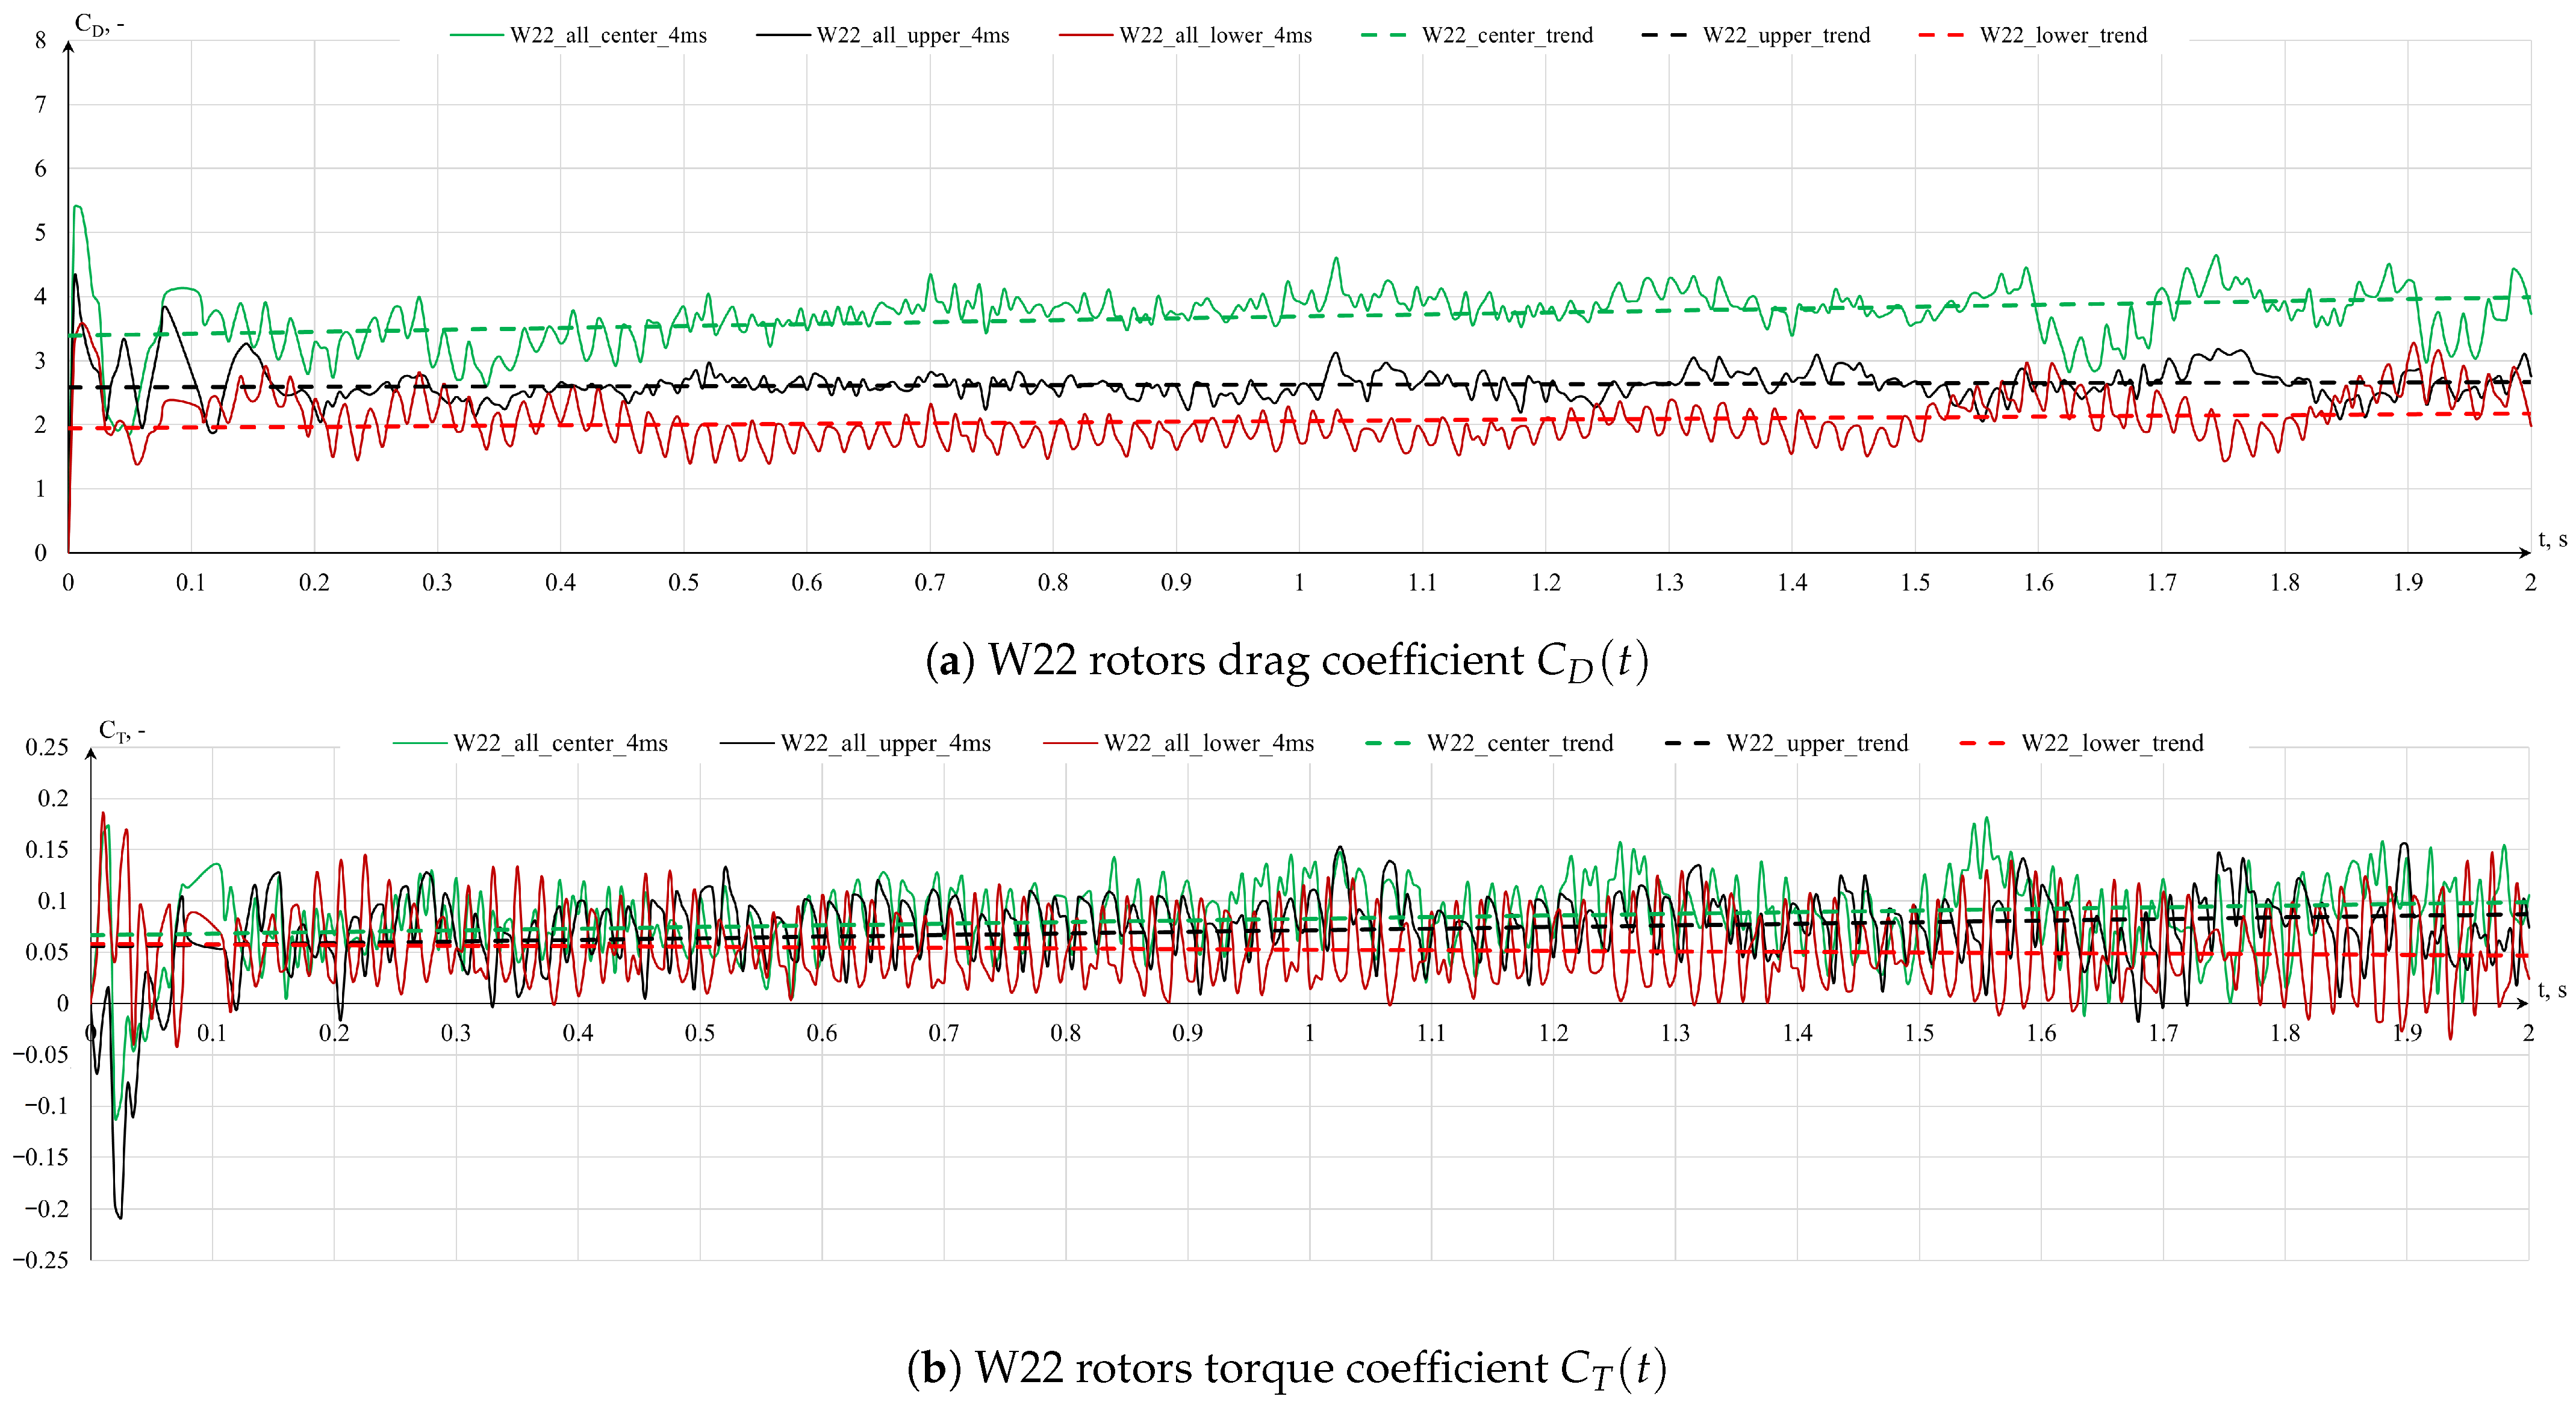
The findings for the W22 design, shown in Figure 12, mirror those of the Y22 configuration, with the lower rotor experiencing the least favorable flow conditions and the central rotor demonstrating the highest efficiency in terms of drag force and torque generation. Table 13 delineates the mean coefficient values of the rotors across two time intervals.
In terms of power generation, the central rotor again outperforms others, exhibiting the highest C P and P output. Conversely, the upper rotor’s performance is slightly inferior. Analogous to the Y22 setup, the bottom rotor exhibits the least efficiency, largely due to adverse flow conditions induced by overhead turbines. The conclusions regarding power generation for the W22 design remain consistent with those for the Y22 variant. However, slight changes are observed in the power output of W22 turbines with a height of H = 2 m, which, at λ = 0.5 and u x = 4 m/s, falls within the range of P = 0.23–0.43 W. This represents a marginally improved outcome compared to the P output of Y22 rotors. Nevertheless, considering scalability effects, the palisade is anticipated to yield low energy production under these flow conditions. Even at higher wind speeds u x , both the C P and P output will remain within the same order of magnitude, underscoring the imperative for geometry refinement or optimization to augment the rotor’s effective surface area.
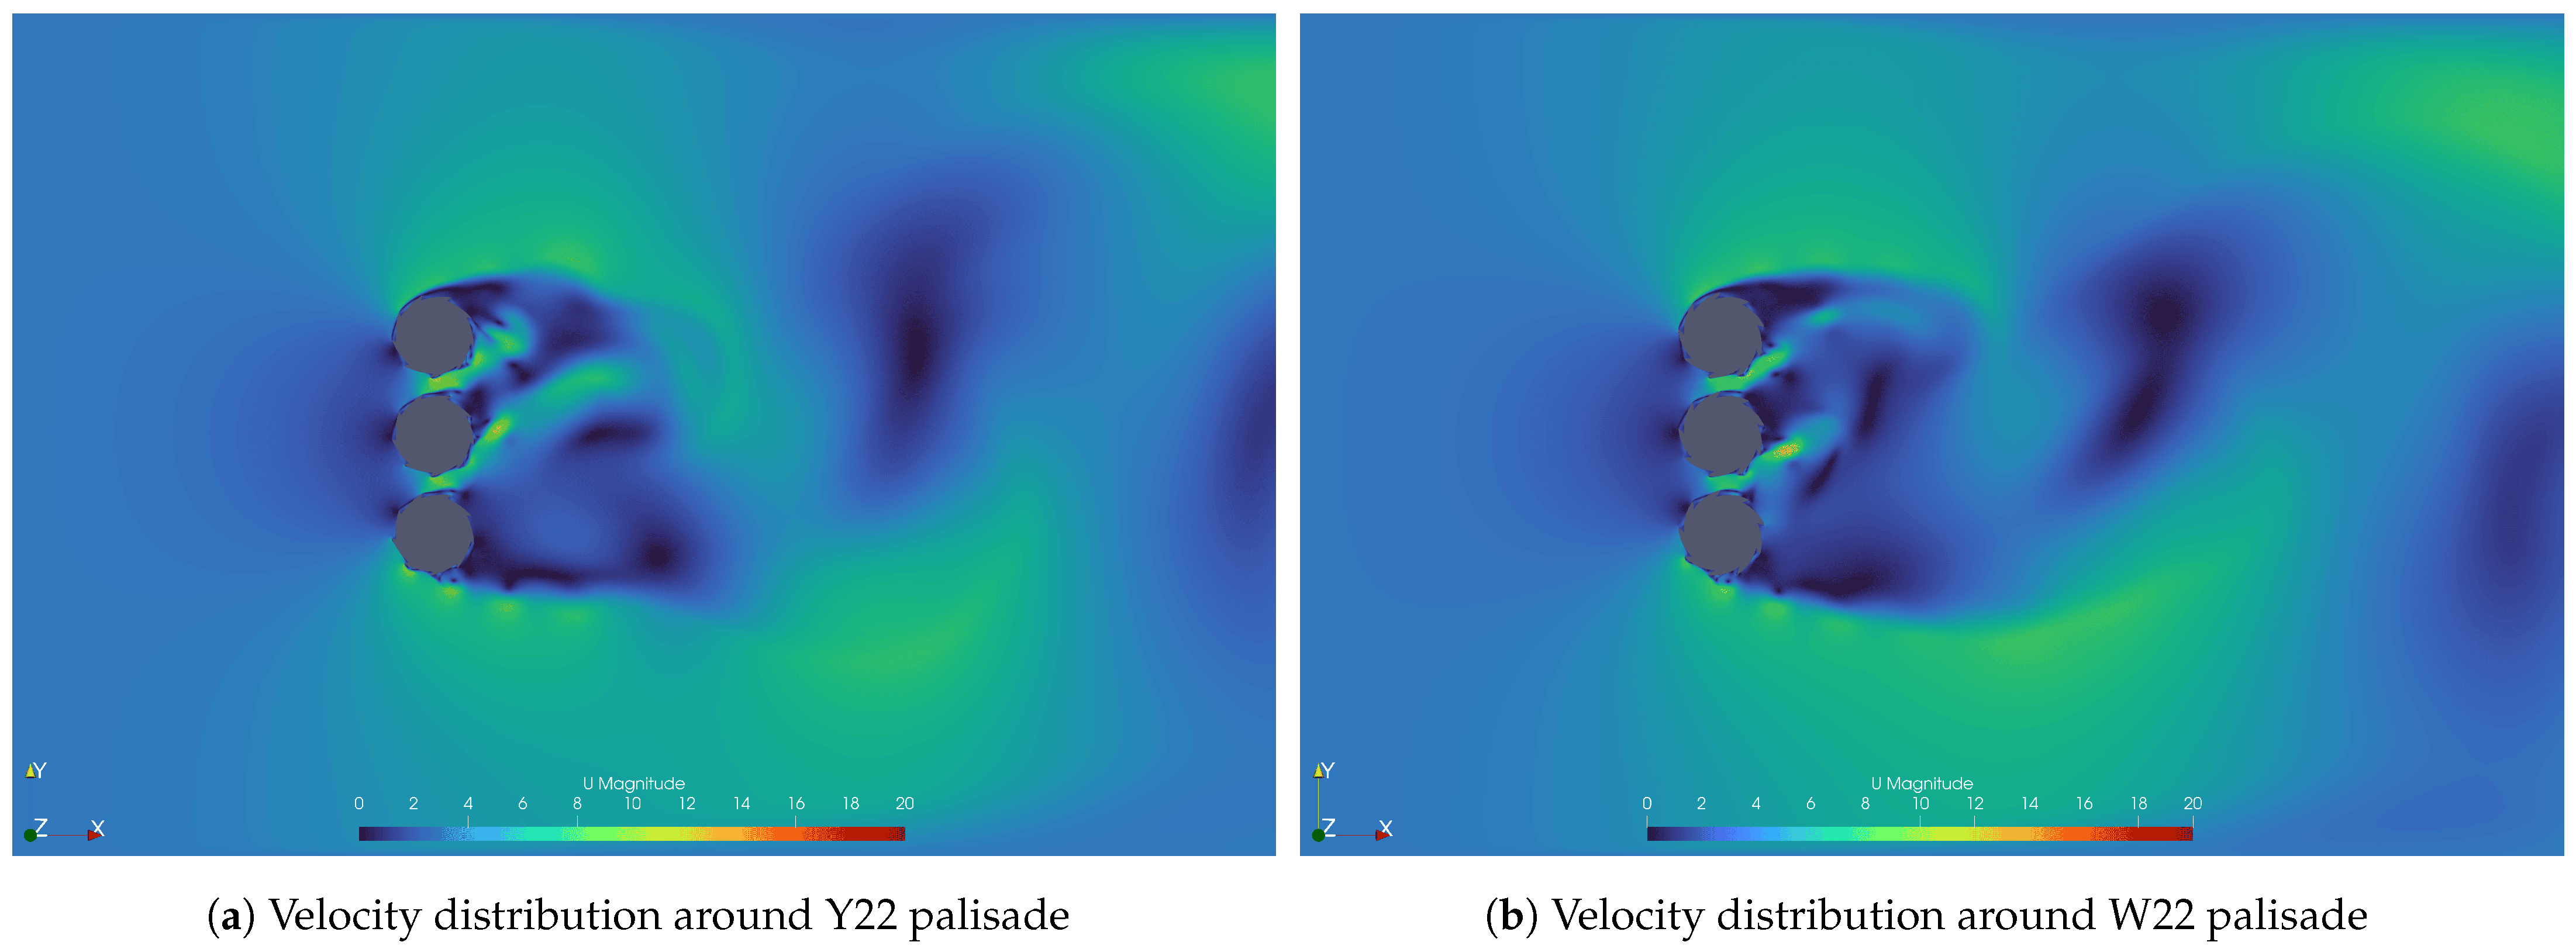
The velocity distributions around the Y22 and W22 rotors are presented in Figure 13.
The cylindrical turbines in this study were rotating counterclockwise, which redirects the wake flow upward, creating unfavorable conditions for the bottom-most rotor. This phenomenon occurs due to the Magnus effect, where the rotation of the cylindrical turbines generates a lift force perpendicular to the wind flow [67]. As the counterclockwise rotation interacts with the wind, the flow velocity increases on one side of the cylinder and decreases on the other, resulting in an upward deflection of the wake. This upward redirection reduces the effective wind speed and turbulence available to the bottom-most rotor, thereby diminishing its performance and efficiency [68].

3.1.4. Results for Three Savonius Turbines Rotating with λ = 0.5

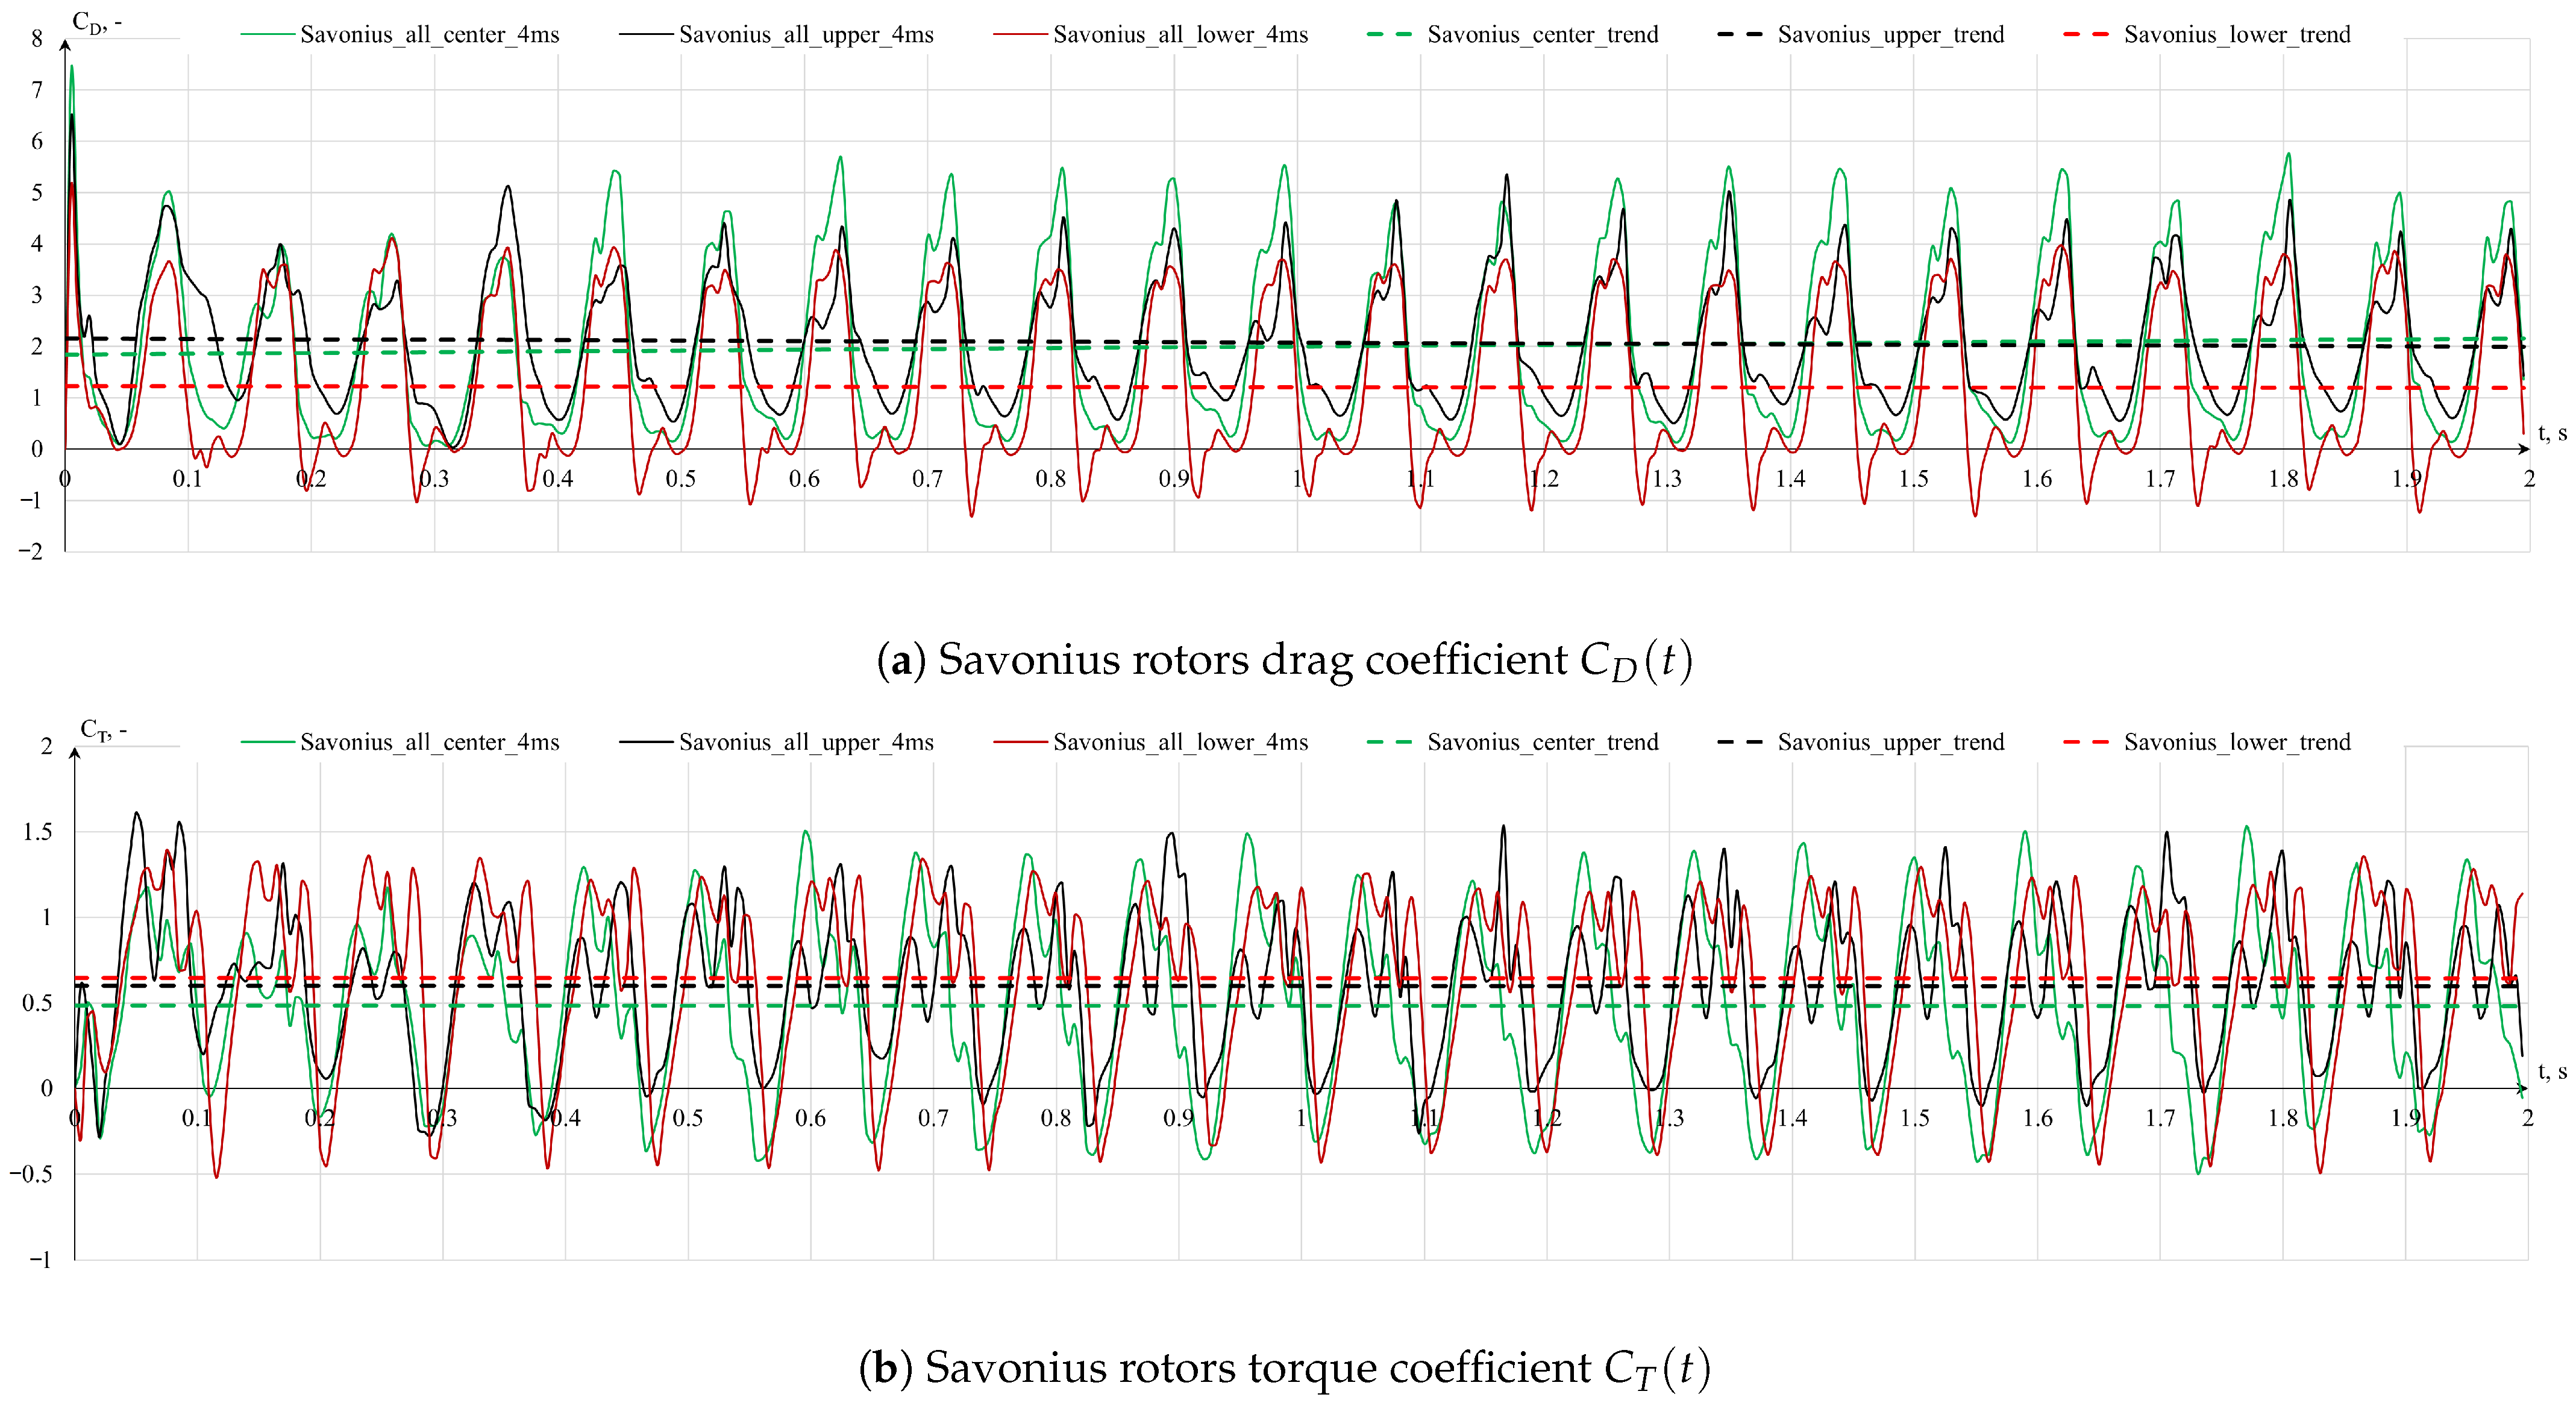
The outcomes for the Savonius geometry are shown in Figure 14, and Table 14 presents the mean coefficient values of the rotors for two time ranges.
The results diverge not only in magnitude but also in amplitude compared to those for the Y22 and W22 geometries. This can be attributed, among other factors, to the configuration of two large blades in the Savonius design, in contrast to the nine shallow cavities in the preceding cylindrical geometries. The velocity distribution for the finite Savonius palisade is presented in Figure 15.
The primary difference observed with the Savonius turbine, when compared to the analyzed cylindrical rotor geometries, is the fact that the most effective rotor is the lower one, yielding the highest torque, while the upper rotor exhibits the highest drag force. Conversely, the central rotor, theoretically expected to be the most efficient, surprisingly demonstrates the lowest torque production.
Based on the velocity distribution within the domain, it is evident that the bottom-most turbine benefits from the least turbulent wind supply for its advancing blade, resulting in relatively undisturbed flow conditions. The upper rotor experiences slightly less favorable conditions due to turbulence generated by the central rotating rotor, particularly from its retreating blade. The central rotor’s canted deflector also influences the flow dynamics; it both shields the central rotor’s retreating blade and redirects the flow towards the active blade of the upper rotor. Consequently, the central rotor encounters the highest level of turbulence within the entire palisade. This turbulence distribution significantly impacts the performance, especially compared to cylindrical rotors that leverage the Magnus effect.
At this juncture, identifying the precise factors, which could improve the Savonius palisade design, poses a challenge. It is plausible that, at this scale, deflectors adversely affect the central rotor. Other potential reasons could include inadequate spacing between the rotors, both in y-axis and x-axis directions. The power coefficient’s magnitude aligns with expectations for the given tip–speed ratio λ = 0.5 and corroborates existing findings in the literature [61].

3.2. Stationary Results

The stationary studies focused primarily on measuring the torque coefficient, as it has the greatest impact on VAWT power generation capabilities besides the tip–speed ratio. These studies assumed conditions of an indefinite palisade in two-dimensional flow and a constant wind inflow at a speed of u x = 4 m/s. While these conditions differ from real open field scenarios, they effectively model more constrained turbine applications, such as those in enclosed channels or ducts within buildings or various infrastructure settings. The investigations involved examining the torque coefficient at specific angular positions, expressed by θ = (0–350 ) with C T characteristics obtained for each 10 step.

3.2.1. Results for Indefinite Y22, Z22, and Savonius Rotor Palisade

This subsection compares the previously tested Y22 geometry with Z22 and Savonius rotors. The Z22 geometry served as the comparative analysis basis for stationary simulations, as it was analyzed in all simulation variants. In addition to the standard indefinite palisade, angular and x-axis offset configurations were also examined. The Z22 geometry had fewer recesses than W22 rotor, but of a greater depth. Inferring from the previously obtained results, it should, therefore, provide higher C T values than the Y22 geometry. The results for these three types of rotors are presented in Figure 16 and Figure 17.
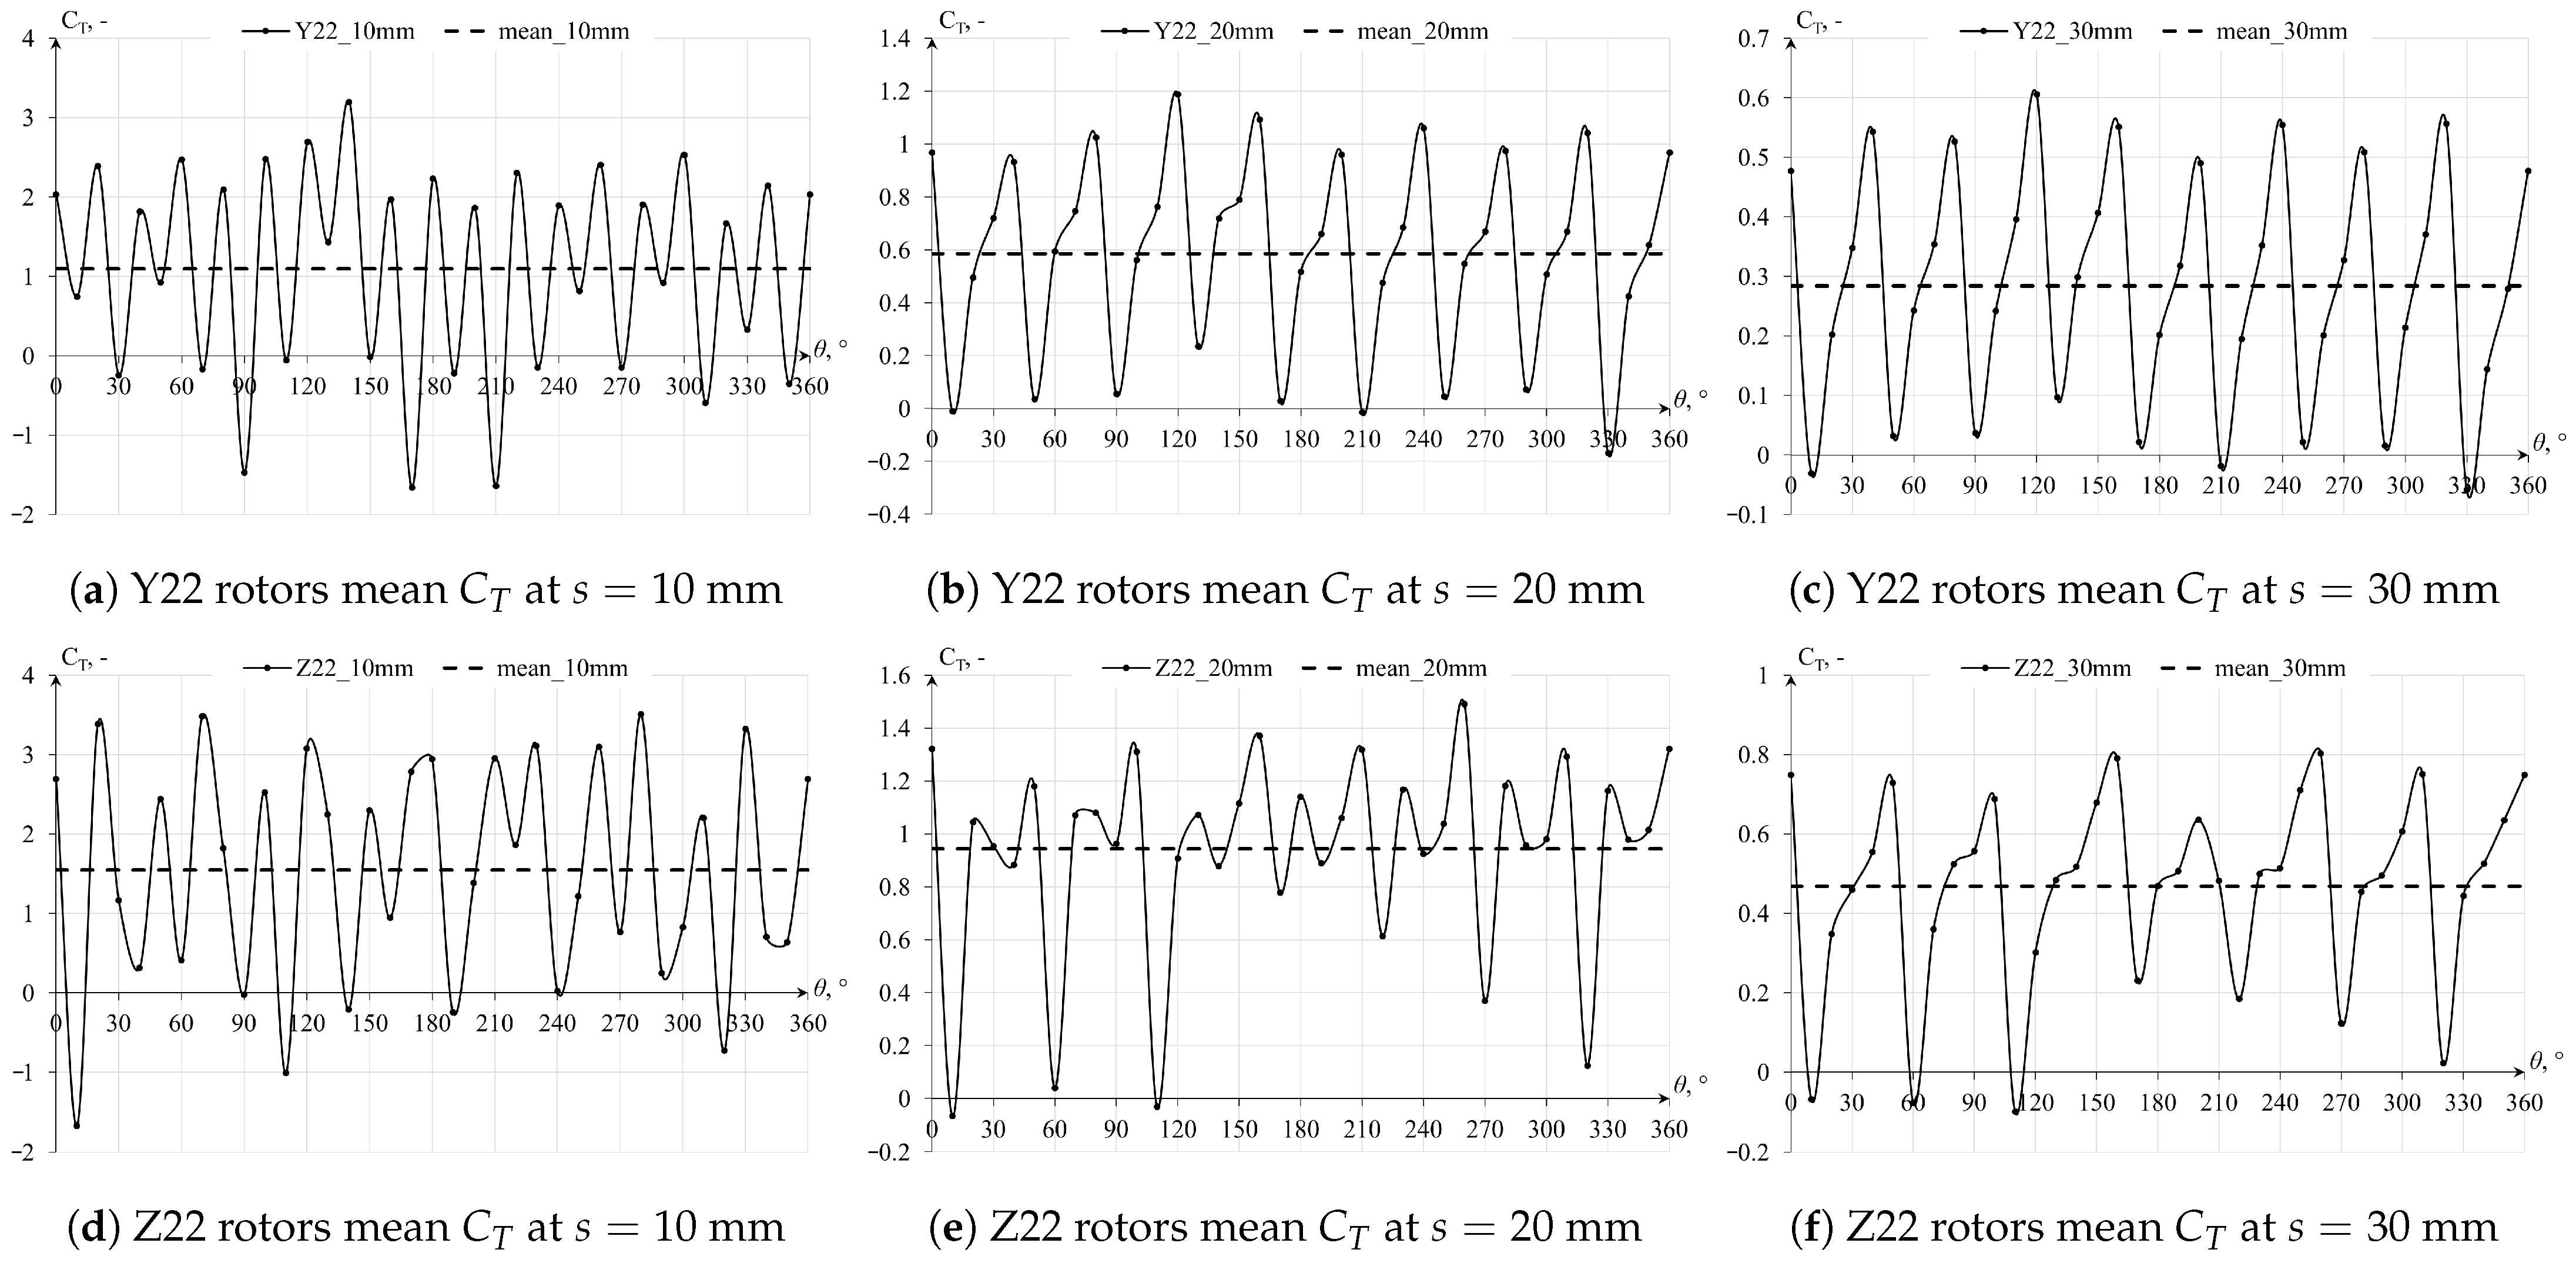
As evident from Figure 16, the Y22 palisade exhibits significantly inferior performance compared to the Savonius palisade. Moreover, certain angular positions display negative C T values, suggesting a reverse rotational trend. While this phenomenon may also manifest in Savonius wind turbines, it typically occurs only at specific positions, typically between θ = ( 170 and 180 ) , where the blade surface area is minimal, oriented approximately at 90 with respect to the incoming wind direction.
In the ensuing airflow scenario, air is constrained to flow exclusively between the rotors. This closely simulates conditions akin to those prevalent in a wind tunnel, where the flow is constrained and compelled towards the exit. In such simulations, a decrease in spacing between the rotors results in an augmented torque. This relationship is intuitive, given that air can only flow between the rotors. A reduced gap leads to higher static pressure in front of the rotors and, consequently, an increased flow velocity between the rotors. In comparison to prior simulations, the introduction of an additional simplification led to an increase in C T values by an order of magnitude. The likely cause for such outcomes is the introduction of nonphysical flow conditions. This implies that in reality, besides flowing between rotors, air could also bypass the palisade above and around the rotors. Based on the conclusions drawn from the preceding sections, it is apparent that a Savonius rotor should theoretically generate C T values significantly higher than geometries resembling cylindrical shapes. However, in these simulations, the C T results for Savonius geometries fall within the same order of magnitude as those for Y22 and Z22 rotors. The combination of two simplifications—indefinite palisade length and rotor height—significantly alters the comparative scale of the problem. Table 15 presents the mean torque coefficient results for Y22, Z22, and Savonius rotors with spacing of s = 10 , 20 , 30 mm. The Δ η designation present in Table 15 and Table 16 is the ratio of the C T m e a n obtained in a given scenario to the highest observed C T m e a n for the particular rotor. This metric highlights the loss in torque production efficiency as the spacing between rotors increases.
In constrained flow conditions, cylindrical rotors exhibit higher C T values by an order of magnitude when compared to free-flow conditions. However, as the spacing between the rotors increases, these cylindrical rotors lose efficiency in torque generation much more rapidly than the two-bladed Savonius rotor.
For the Y22 geometry, a respective decline of 46.6% and 74.1% in C T is observed between spacing of s = 10 , 20 , 30 mm. Z22 rotors achieve slightly better results with C T losses of 39% and 69.7%, respectively.
In contrast, Savonius rotors not only produce higher C T values but also experience significantly less C T reduction of 22.7% and 34.7% for respective spacing. This underscores that as flow conditions approach free flow, cylindrical rotors experience a considerable reduction in power generation efficiency, making them more suitable for forced-flow applications.

3.2.2. Results for Offset Z22 Palisade Configurations

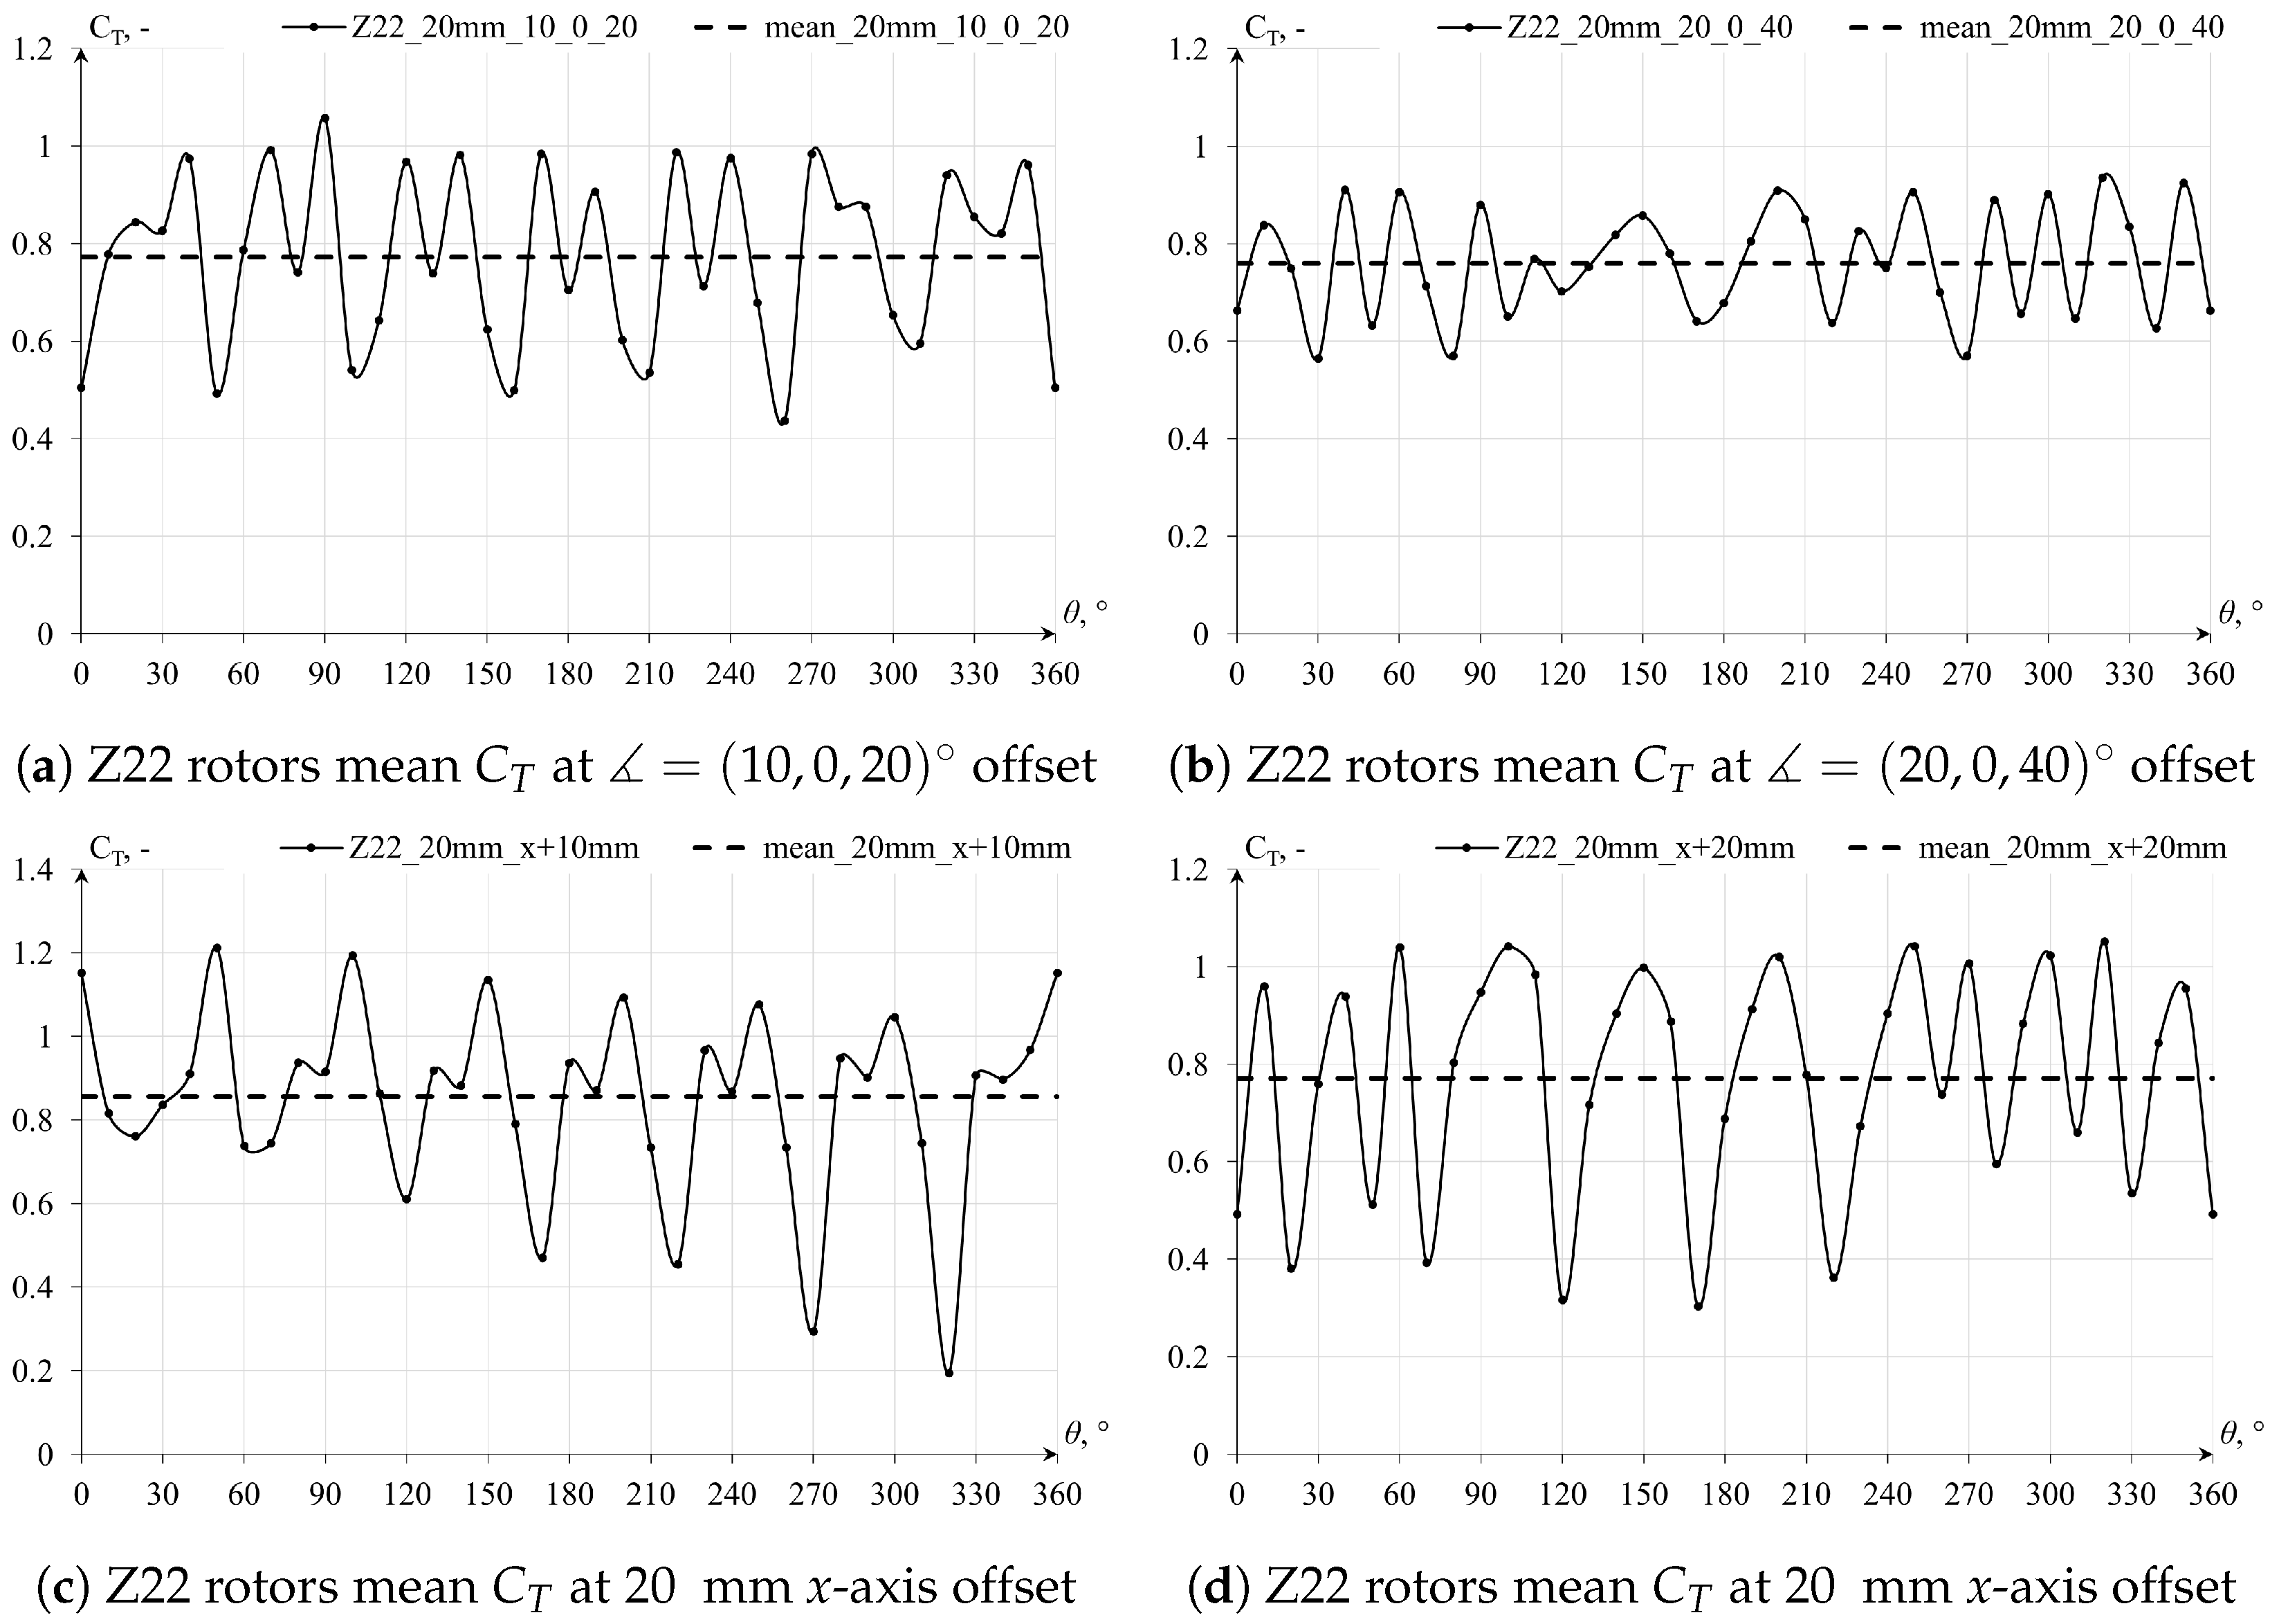
Part of the study explored whether angular and x-axis offsets of specific rotors could enhance torque production. Previous results revealed a high-amplitude trend of C T due to unfavorable angular positions. For this analysis, the Z22 geometry was selected because it yielded better results than the Y22 geometry. The results of the angular offset scenarios are depicted in Figure 18 and are compared in Table 16.
No significant improvements were observed with the alterations to the palisade, except for a much smaller C T amplitude for angular offset and slightly smaller amplitude for the offset in the x-axis direction. However, the occurrence of negative C T at certain positions was eliminated. Apart from that, the C T values deteriorated. As expected, the offsets increased the basic spacing between the rotors, reducing both the pressure ahead of the palisade and the wind velocity passing between the rotors.
At this point, the optimization process of the cylindrical rotor geometries commenced, involving adjustments to the number and depth of recesses. The outcomes of these modifications are discussed in detail in the subsequent section.

3.2.3. Rotor Optimization Process

Based on the findings, it is evident that the rotor geometries exhibit suboptimal power and torque coefficients compared to the established industry standard, the drag-driven Savonius wind turbine. Particularly in open-field conditions, the results were unfavorable. However, simulations under forced-flow conditions suggested potential applications in settings such as air ducts within or between buildings.
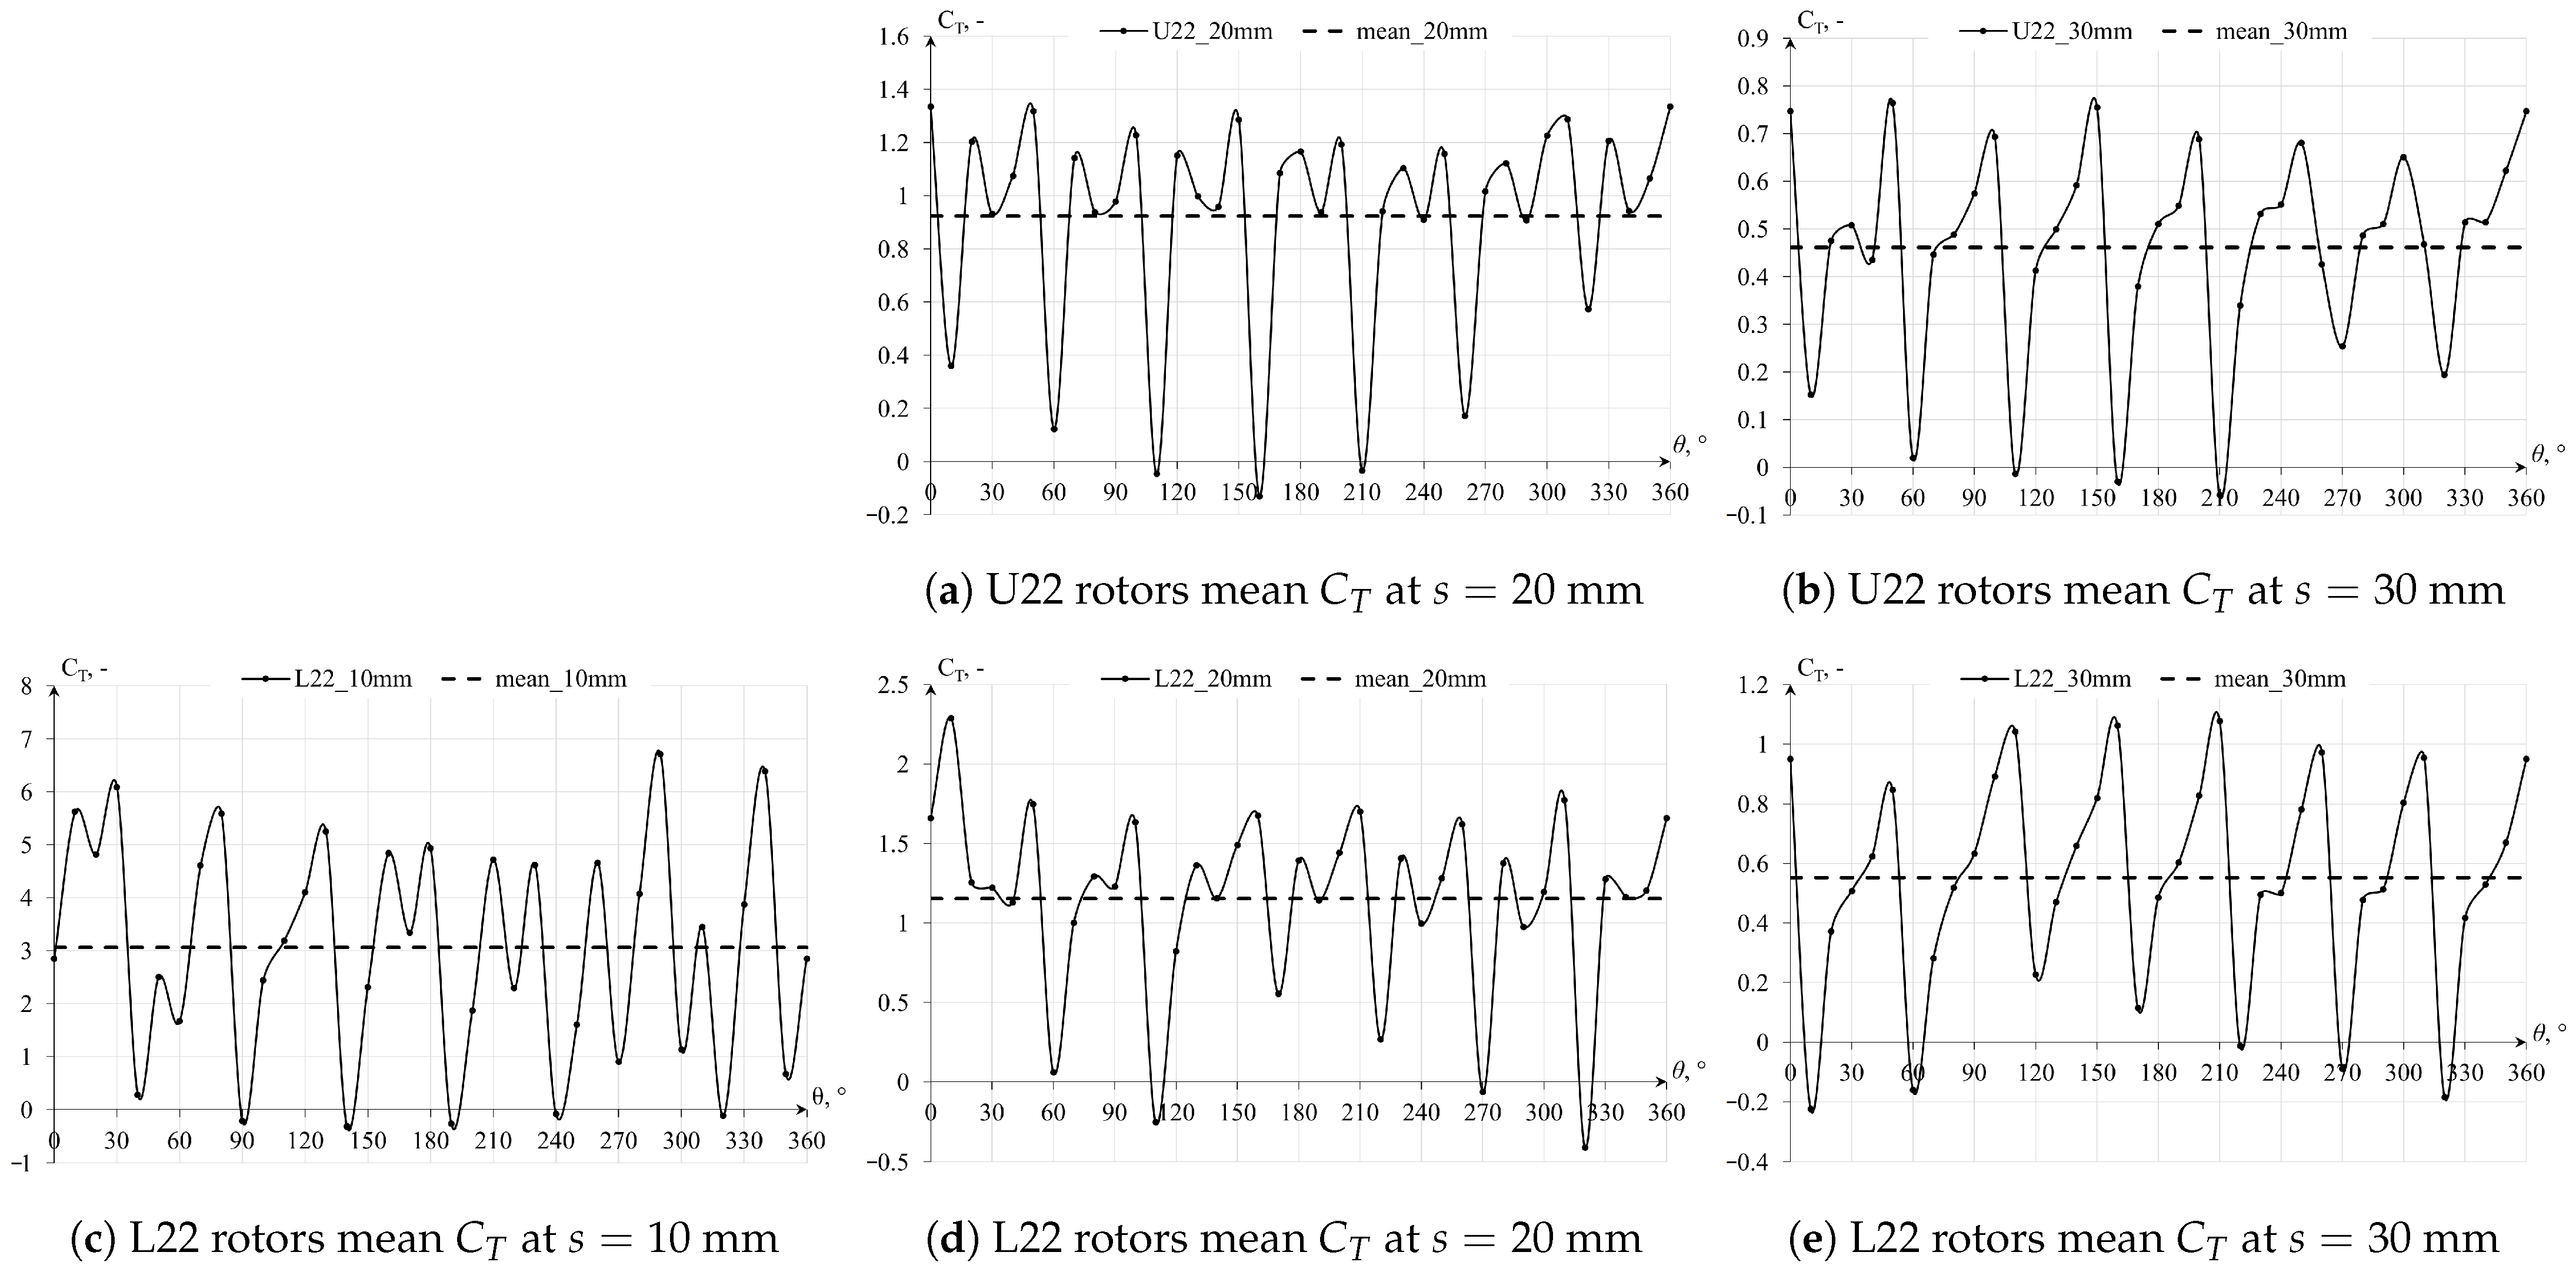
The optimization process aimed to develop a rotor geometry capable of achieving mean static torque coefficients comparable to those of a Savonius turbine across the entire angular spectrum. Parameters subject to modification included overall diameter, blade number and shape, and cavity depth. Figure 19, Figure 20, Figure 21 and Figure 22 depict the results sorted from least to most favorable. The final optimized geometry, the S22 rotor, represents the culmination of this process.
Since a spacing of s = 10 mm resulted in overly unrealistic flow conditions, the optimization process primarily focused on spacings of s = 20 mm and s = 30 mm. As depicted in Figure 19, Figure 20, Figure 21 and Figure 22, the optimization process proved to be successful, with four types of five-bladed rotors exhibiting similar or superior stationary torque coefficients at s = 20 mm when compared to the Savonius rotor. Specifically, the X22, P22, M22, and S22 five-bladed rotors demonstrated the highest mean torque coefficients among the provided geometries. A comprehensive summary of the stationary torque coefficients, sorted by spacing and mean torque coefficient, is provided in Table 17.

4. Discussion

Through means of nonstationary simulations, the preliminary Y22 and W22 geometries demonstrated low potential for harnessing wind energy, primarily due to the shape of the rotors with a large number of shallow recesses. As a result, the working surface area of these rotors is rather insignificant, due to the fact that only 3–4 recesses, which are measuring only a few millimeters, are responsible for their rotation within a given unit of time. The obtained power coefficient C P and generated power P values were approximately 5–12 times lower when compared to the Savonius turbine at a fixed tip–speed ratio of λ = 0.5 , as concluded in Table 12, Table 13 and Table 14. Further studies were carried with the use of steady-state simulations, particularly due to the very computationally demanding nature of transient CFD simulations. These simulations also confirmed that the suggested preliminary geometries are a less-than-ideal choice for drag-driven VAWTs. The results, which are concluded within Table 15 and Table 16, showed that even in ideal configurations, these turbine geometries do not provide the desired C T values. Moreover, their power generation capabilities seemed to diminish with the growing spacing between the rotors, which shifted the torque coefficients towards values previously obtained from transient simulations.
By performing the rotor geometry optimization process, which involved modifications of the shape, number, and depth of recesses, the rotor efficiency in torque production was enhanced, albeit predominantly under more constrained conditions with an indefinite number of rotor palisades of indefinite height. Among the configurations explored, the five-bladed geometries emerged as the most efficient. In scenarios with spacing ranging from s = 10 mm to s = 20 mm, these geometries exhibited higher mean torque coefficient ( C T m e a n ) values than the Savonius turbine. However, under the s = 30 mm scenario, they still yielded inferior results to the Savonius rotor, although showing an improvement of over threefold compared to the preliminary Y22 rotor geometry.
The findings indicate that torque production reductions are significantly more pronounced for the proposed cylindrical geometries as the spacing between the turbines increases in the forced-flow simulations. When adequately spaced apart, torque values quickly approach the magnitude order observed in open-field conditions simulations. Forced-flow simulations simplify the physics of the problem by assuming rotors with indefinite height and palisade length, effectively reducing the analysis to a two-dimensional (2D) forced flow. Despite these simplifications, they allow for the observation of conditions under which these turbines could be applied. To generate power effectively in a palisade configuration of cylindrical rotors, a constant inflow or forced airflow is required. This could be achieved by placing the turbines in a duct, creating pressure differences in front and behind the palisade, or by supplementing with a constant wind inflow. However, such conditions are challenging to achieve in real-world scenarios. A key difference between the cylindrical rotor geometries and the Savonius geometry is air permeability during rotation. Cylindrical geometries exhibit significantly lower air permeability, primarily dependent on the gaps between them. This leads to higher static pressure in front of the palisade, causing deceleration of air streams and resulting in the bypass effect over or around the rotors, as seen in open-field conditions simulations. In contrast, the Savonius rotor more effectively harnesses wind energy due to its larger working surface area and its ability to allow freer airflow, particularly at rotation angles θ = ( 0 , 180 , 360 ) . This contributes to the superior performance of the Savonius rotor in capturing wind energy compared to cylindrical geometries.

5. Conclusions

Our study delved into the feasibility of utilizing cylindrical rotor geometries for vertical-axis wind turbines (VAWTs) configured in a palisade arrangement. The results shed light on contrasting performance outcomes contingent upon environmental conditions and flow constraints.
In open-field free flowing conditions, characterized by unimpeded airflow, the cylindrical rotor geometries exhibited notably low torque coefficients. This limitation is largely attributable to their inherent cylindrical shape and poor airflow permeability. Consequently, their capacity to generate power under such conditions is severely restricted. However, a significant shift in performance dynamics was observed when these geometries were subjected to more confined environments, such as forced-flow conditions. Our findings revealed that under such circumstances, the cylindrical rotor geometries demonstrated remarkable performance, particularly in terms of torque coefficients. Surprisingly, the torque coefficients observed in forced-flow conditions surpassed those of the industry-standard Savonius turbine. This disparity underscores the pivotal role of environmental factors and flow constraints in shaping the efficacy of cylindrical rotor geometries. While their potential in open-field free flowing conditions appears limited, they exhibit promising prospects in more controlled environments with constrained airflow. Moreover, the study aligns with existing research indicating the efficacy of similar geometries in gravitational water vortex power plants (GWVPPs), which harness the kinetic energy of water by creating a vortex in a cylindrical chamber, driving a turbine connected to a generator [69,70,71]. Suitable for low-head sites, these plants divert water into a chamber where it forms a vortex, spinning a turbine to produce electricity. This design is environmentally friendly, requires low maintenance, and is ideal for remote or rural electrification. The cylindrical geometries discussed in this study could be effectively utilized in such forced-flow conditions, where the structured flow and minimal elevation differences enhance their performance. There are several companies across the globe that are already producing GWVPPs that utilize cylindrical geometries, similar in shape to those discussed in this study [72,73]. This direction may offer valuable insights for future studies on cylindrical turbine geometries. The unique working conditions of vortex water turbines could provide greater opportunities for the utilization of cylindrical turbines compared to open-field atmospheric conditions.
These insights emphasize the importance of contextualizing the evaluation of rotor geometries within specific application contexts and environmental conditions. While cylindrical rotor geometries may not universally excel, their exceptional performance in constrained flow conditions suggests potential applications in niche settings, such as vortex water turbines or other forced-flow systems. Future research endeavors could explore optimization strategies aimed at further enhancing the performance of cylindrical rotor geometries across diverse environmental conditions. Additionally, investigations into alternative applications beyond VAWTs, such as in vortex water turbine systems, may uncover additional opportunities for leveraging their unique characteristics and capabilities.
The main advantage of these cylindrical rotors could be the simplicity of the production process, where rotors consist of one single element. This can be achieved through manufacturing processes such as extrusion or molding. Another advantage is the minimized fluttering effect, meaning that rotating turbines visually mimic the form of a static geometry, which is one of the main visual concerns for urban wind turbines. As far as scalable power generation capabilities go, this study confirms that cylindrical rotor geometries can indeed effectively harness power from the wind, but only under specific flow conditions, which are difficult but possible to reproduce.
However, it is essential to recognize that the outcomes from nonstationary 3D simulations encompassing the entire finite palisade may deviate from the results obtained. While such simulations demand significantly higher computational resources, conducting them could offer valuable insights by providing a comparative analysis with the 2D simulations performed. A potentially more feasible and practical approach to address this would involve constructing a physical testbed for real-world experimentation, such as deployment on the rooftop of a building.
In light of the obtained results and formulated conclusions, further studies should utilize the readily available S22 geometry, while placing emphasis on the following aspects:
Introducing a hollow structure to enhance air permeability;
Incorporating steering vanes to optimize airflow within the turbine structure;
Implementing nonlinear rotor configurations to mitigate the fluttering effect;
Exploring external designs to further enhance torque and power coefficients;
Performing 3D nonstationary simulations and/or creating an experimental testbed.

6. Patents

Patent application numbers: P.443825 (Polish patent); EP23177914.1 (European patent); WIPO136348 (Industrial design).

Author Contributions

Conceptualization, Ł.M., Z.M., B.B. and R.J.; methodology, Ł.M., Z.M. and B.B.; software, Ł.M. and B.B.; validation, Ł.M. and Z.M.; formal analysis, Ł.M. and R.J.; investigation, Ł.M., Z.M. and R.J.; resources, Ł.M., B.B. and R.J.; data curation, Ł.M.; writing—original draft preparation, Ł.M.; writing—review and editing, Z.M. and R.J.; visualization, Ł.M.; supervision, Z.M.; project administration, Z.M. and R.J.; funding acquisition, Z.M. All authors have read and agreed to the published version of the manuscript.

Funding

The work was financed by the statutory funds of the Department of Cryogenics and Aerospace Engineering of the Wrocław University of Science and Technology and by VP System Poland as part of cooperation with Wrocław University of Science and Technology, project number 42RP/0011/22.

Data Availability Statement

The original contributions presented in the study are included in the article, further inquiries can be directed to the corresponding author.

Acknowledgments

The authors would like to thank Maciej Marczak for his help in validating the presented numerical methodology.

Conflicts of Interest

The authors declare no conflicts of interest.

Abbreviations

The following abbreviations are used in this manuscript:
2DTwo-dimensional
3DThree-dimensional
AMIArbitrary mesh interface
BCBoundary condition
CDDrag coefficient
CFDComputational fluid dynamics
CTTorque coefficient
CPPower coefficient
GWVPPGravitational water vortex power plant
HAWTHorizontal-axis wind turbine
ISAInternational Standard Atmosphere
OpenFOAMOpen Source Field Operation and Manipulation
PISOPressure-Implicit with Splitting of Operators
RANSReynolds-averaged Navier–Stokes
SIMPLESemi-Implicit Method for Pressure Linked Equations
SSTShear stress transport
STLStereolithography
TSRTip–speed ratio
VAWTVerical-axis wind turbine

References

  1. Hutchinson, M.; Zhao, F. Global Wind Report 2023; Technical Report; Global Wind Energy Council: Brussels, Belgium, 27 March 2023; Available online: https://gwec.net/wp-content/uploads/2023/03/GWR-2023_interactive.pdf (accessed on 31 May 2024).
  2. Sousa de Oliveira, W.; Fernandes, A.J. Global Wind Energy Market, Industry and Economic Impacts. Energy Environ. Res. 2012, 2, 79. [Google Scholar] [CrossRef]
  3. International Renewable Energy Agency—Wind Energy Data. Available online: https://www.irena.org/Energy-Transition/Technology/Wind-energy (accessed on 31 May 2024).
  4. Mathew, S.; Philip, G.S. Comprehensive Renewable Energy-2.05-Wind Turbines: Evolution, Basic Principles, and Classifications; Elsevier: Amsterdam, The Netherlands, 2012; Volume 2, pp. 104–123. [Google Scholar] [CrossRef]
  5. Lissaman, P.B.S.; Gyatt, G.W.; Zalay, A. Critical issues in the design and assessment of wind turbine arrays. In Proceedings of the 4th International Symposium onWind Energy Systems, Stockholm, Sweden, 21 September 1982; Volume 2, pp. 411–423. [Google Scholar]
  6. Malecha, Z. Economic analysis and power capacity factor estimation for an offshore wind farm in the Baltic Sea. Instal 2023, 1, 4–11. [Google Scholar] [CrossRef]
  7. Malecha, Z.; Dsouza, G. Modeling of wind turbine interactions and wind farm losses using the velocity-dependent actuator disc model. Computation 2023, 11, 213. [Google Scholar] [CrossRef]
  8. Malecha, Z.; Sierpowski, K. Numerical studies of the influence of erosion and blade contamination on the operation of a wind turbine. Instal 2023, 7/8, 7–13. [Google Scholar] [CrossRef]
  9. Whittlesey, R. Vertical Axis Wind Turbines. Wind Energy Engineering; Academic Press: Cambridge, MA, USA, 2017; pp. 185–202. [Google Scholar] [CrossRef]
  10. Hau, E.; von Renouard, H. Wind Turbines; Springer: Berilin, Germany, 2006. [Google Scholar] [CrossRef]
  11. Dabiri, J. Potential order-of-magnitude enhancement of wind farm power density via counter-rotating vertical-axis wind turbine arrays. J. Renew. Sustain. Energy 2011, 3, 043104. [Google Scholar] [CrossRef]
  12. Toja-Silva, F.; Colmenar-Santos, A.; Castro-Gil, M. Urban wind energy exploitation systems: Behaviour under multidirectional flow conditions—Opportunities and challenges. Renew. Sustain. Energy Rev. 2013, 24, 364–378. [Google Scholar] [CrossRef]
  13. Wood, D. Introduction to Wind Turbine Technology; Springer: London, UK, 2012; pp. 3–7. [Google Scholar] [CrossRef]
  14. Kumar, R.; Raahemifar, K.; Fung, A.S. A critical review of vertical axis wind turbines for urban applications. Renew. Sustain. Energy Rev. 2018, 89, 281–291. [Google Scholar] [CrossRef]
  15. Aslam Bhutta, M.M.; Hayat, N.; Farooq, A.U.; Ali, Z.; Jamil, S.R.; Hussain, Z. Vertical axis wind turbine—A review of various configurations and design techniques. Renew. Sustain. Energy Rev. 2012, 16, 1926–1939. [Google Scholar] [CrossRef]
  16. Johari, M.K.; Jalil, M.; Shariff, M.F.M. Comparison of horizontal axis wind turbine (HAWT) and vertical axis wind turbine (VAWT). Int. J. Eng. Technol. 2018, 7, 74–80. [Google Scholar] [CrossRef]
  17. Eriksson, S.; Bernhoff, H.; Leijon, M. Evaluation of different turbine concepts for wind power. Renew. Sustain. Energy Rev. 2008, 12, 1419–1434. [Google Scholar] [CrossRef]
  18. Bahaj, A.S.; Myers, L.; James, P.A.B. Urban energy generation: Influence of micro-wind turbine output on electricity consumption in buildings. Energy Build. 2007, 39, 154–165. [Google Scholar] [CrossRef]
  19. Grieser, B.; Sunak, Y.; Madlener, R. Economics of small wind turbines in urban settings: An empirical investigation for Germany. Renew. Energy 2015, 78, 334–350. [Google Scholar] [CrossRef]
  20. Müller, G.; Jentsch, M.F.; Stoddart, E. Vertical axis resistance type wind turbines for use in buildings. Renew. Energy 2009, 34, 1407–1412. [Google Scholar] [CrossRef]
  21. Peace, S. Wind alternatives: Why not vertical axis? Refocus 2003, 4, 30–33. [Google Scholar] [CrossRef]
  22. Mertens, S. The Energy Yield of Roof Mounted Wind Turbines. Wind. Eng. 2003, 27, 507–518. [Google Scholar] [CrossRef]
  23. Riegler, H. HAWT versus VAWT: Small VAWTs find a clear niche. Refocus 2003, 4, 44–46. [Google Scholar] [CrossRef]
  24. Pope, K.; Naterer, G.F.; Dincer, I.; Tsang, E. Power correlation for vertical axis wind turbines with varying geometries. Int. J. Energy Res. 2011, 35, 423–435. [Google Scholar] [CrossRef]
  25. Gupta, R.; Biswas, A.; Sharma, K.K. Comparative study of a three-bucket Savonius rotor with a combined three-bucket Savonius–three-bladed Darrieus rotor. Renew. Energy 2008, 33, 1974–1981. [Google Scholar] [CrossRef]
  26. Jiang, Y.; He, C.; Zhao, P.; Sun, T. Investigation of Blade Tip Shape for Improving VAWT Performance. J. Mar. Sci. Eng. 2020, 8, 225. [Google Scholar] [CrossRef]
  27. Saeed, H.A.H.; Elmekawy, A.M.N.; Kassab, S.Z. Numerical study of improving Savonius turbine power coefficient by various blade shapes. Alex. Eng. J. 2019, 58, 429–441. [Google Scholar] [CrossRef]
  28. Dewan, A.; Tomar, S.S.; Bishnoi, A.K.; Singh, T.P. Computational fluid dynamics and turbulence modelling in various blades of Savonius turbines for wind and hydro energy: Progress and perspectives. Ocean. Eng. 2023, 283, 115168. [Google Scholar] [CrossRef]
  29. Lin, J.; Yang, X.; Niu, S.; Yu, H.; Zhong, J.; Jian, L. Inflatable Savonius wind turbine with rapid deployment and retrieval capability: Structure design and performance investigation. Energy Convers. Manag. 2024, 310, 118480. [Google Scholar] [CrossRef]
  30. Al-Gburi, K.A.H.; Alnaimi, F.B.I.; Al-quraishi, B.A.J.; Tan, E.S.; Kareem, A.K. Enhancing Savonius Vertical Axis Wind Turbine Performance: A Comprehensive Approach with Numerical Analysis and Experimental Investigations. Energies 2023, 16, 4204. [Google Scholar] [CrossRef]
  31. Layeghmand, K.; Ghiasi Tabari, N.G.; Zarkesh, M. Improving efficiency of Savonius wind turbine by means of an airfoil-shaped deflector. J. Braz. Soc. Mech. Sci. Eng. 2020, 42, 528. [Google Scholar] [CrossRef]
  32. Altan, B.D.; Gultekin, G.S. Investigation of Performance Enhancements of Savonius Wind Turbines through Additional Designs. Processes 2023, 11, 1473. [Google Scholar] [CrossRef]
  33. Pope, K.; Rodrigues, V.; Doyle, R.; Tsopelas, A.; Gravelsins, R.; Naterer, G.F.; Tsang, E. Effects of stator vanes on power coefficients of a zephyr vertical axis wind turbine. Renew. Energy 2010, 35, 1043–1051. [Google Scholar] [CrossRef]
  34. Moreno-Armendáriz, M.A.; Duchanoy, C.A.; Calvo, H.; Ibarra-Ontiveros, E.; Salcedo-Castañeda, J.S.; Ayala-Canseco, M.; García, D. Wind Booster Optimization for On-Site Energy Generation Using Vertical-Axis Wind Turbines. Sensors 2021, 21, 4775. [Google Scholar] [CrossRef] [PubMed]
  35. Rudrapal, D.; Acharya, S. Characterization of a novel lift-drag-driven air-activated hybrid vertical axis wind turbine. Sustain. Energy Technol. Assess. 2023, 59, 103415. [Google Scholar] [CrossRef]
  36. Hansen, J.T.; Mahak, M.; Tzanakis, I. Numerical modelling and optimization of vertical axis wind turbine pairs: A scale up approach. Renew. Energy 2021, 171, 1371–1381. [Google Scholar] [CrossRef]
  37. Chen, Y.; Zhang, D.; Qi, W.; Guo, P.; Li, J. Power prediction of a Savonius wind turbine cluster considering wind direction characteristics on three sites. J. Clean. Prod. 2023, 423, 138789. [Google Scholar] [CrossRef]
  38. Kajishima, T.; Taira, K. Computational Fluid Dynamics: Incompressible Turbulent Flows; Springer: Cham, Switzerland, 2017; pp. 73–145. [Google Scholar] [CrossRef]
  39. Andersson, B.; Andersson, R.; Hakansson, L.; Sudiyo, R.; Wachem, B. Computational Fluid Dynamics for Engineers; Cambridge University Press: New York, NY, USA, 2012; pp. 8–112. [Google Scholar] [CrossRef]
  40. About OpenFOAM. Available online: https://cfd.direct/openfoam/about/ (accessed on 31 May 2024).
  41. OpenFOAM Overview. Available online: https://www.openfoam.com/governance/overview (accessed on 31 May 2024).
  42. OpenFOAM History. Available online: https://openfoam.org/company-history/ (accessed on 31 May 2024).
  43. OpenFOAM: User Guide—simpleFOAM. Available online: https://www.openfoam.com/documentation/guides/latest/doc/guide-applications-solvers-incompressible-simpleFoam.html (accessed on 31 May 2024).
  44. Steady-State Solution. Available online: https://doc.cfd.direct/notes/cfd-general-principles/steady-state-solution (accessed on 31 May 2024).
  45. The SIMPLE Algorithm in OpenFOAM. Available online: https://openfoamwiki.net/index.php/OpenFOAM_guide/The_SIMPLE_algorithm_in_OpenFOAM (accessed on 31 May 2024).
  46. K-omega Turbulence Models. Available online: https://www.simscale.com/docs/simulation-setup/global-settings/k-omega-sst/ (accessed on 31 May 2024).
  47. Menter, F.R. Zonal two equation k-ω turbulence models For aerodynamic flows. In Proceedings of the 23rd AIAA Fluid Dynamics, Plasmadynamics, and Lasers Conference, Orlando, FL, USA, 6–9 July 1993. [Google Scholar] [CrossRef]
  48. Menter, F.R. Two-equation eddy-viscosity turbulence models for engineering applications. Am. Inst. Aeronaut. Astronaut. J. 1994, 32, 1598–1605. [Google Scholar] [CrossRef]
  49. The Menter Shear Stress Transport Turbulence Model. Available online: https://turbmodels.larc.nasa.gov/sst.html (accessed on 31 May 2024).
  50. K-omega Shear Stress Transport (SST). Available online: https://www.openfoam.com/documentation/guides/v2112/doc/guide-turbulence-ras-k-omega-sst.html (accessed on 31 May 2024).
  51. Force Coefficients. Available online: https://www.openfoam.com/documentation/guides/latest/doc/guide-fos-forces-force-coeffs.html (accessed on 31 May 2024).
  52. 2D NACA 0012 Airfoil Validation Case. Available online: https://turbmodels.larc.nasa.gov/naca0012_val.html (accessed on 31 May 2024).
  53. Turbulent Flow Over NACA0012 airfoil (2D). Available online: https://www.openfoam.com/documentation/guides/latest/doc/verification-validation-naca0012-airfoil-2d.html (accessed on 31 May 2024).
  54. Marciniuk, M.; Piskur, P.; Kiszkowiak, Ł.; Malicki, Ł.; Sibilski, K.; Strzelecka, K.; Kachel, S.; Kitowski, Z. Aerodynamic Analysis of Variable Camber-Morphing Airfoils with Substantial Camber Deflections. Energies 2024, 17, 1801. [Google Scholar] [CrossRef]
  55. Malicki, Ł.; Malecha, Z.; Tomczuk, K. Leading-Edge Vortex Controller (LEVCON) Influence on the Aerodynamic Characteristics of a Modern Fighter Jet. Energies 2023, 16, 7590. [Google Scholar] [CrossRef]
  56. McCroskey, W.J. A Critical Assessment of Wind Tunnel Results for the NACA 0012 Airfoil; NASA-TM-100019; National Aeronautics and Space Administration, Ames Research Center: Moffett Field, CA, USA, 1987. Available online: https://ntrs.nasa.gov/citations/19880002254 (accessed on 31 May 2024).
  57. Ladson, C.L. Effects of Independent Variation of Mach and Reynolds Numbers on the Low-Speed Aerodynamic Characteristics of the NACA 0012 Airfoil Section; NASA-TM-4074; National Aeronautics and Space Administration, NASA Langley Research Center: Hampton, VA, USA, 1988. Available online: https://ntrs.nasa.gov/citations/19880019495 (accessed on 31 May 2024).
  58. Balduzzi, F.; Bianchini, A.; Maleci, R.; Ferrara, G.; Ferrari, L. Critical issues in the CFD simulation of Darrieus wind turbines. Renew. Energy 2016, 85, 419–435. [Google Scholar] [CrossRef]
  59. Bianchini, A.; Balduzzi, F.; Bachant, P.; Ferrara, G.; Ferrari, L. Effectiveness of two-dimensional CFD simulations for Darrieus VAWTs: A combined numerical and experimental assessment. Energy Convers. Manag. 2017, 136, 318–328. [Google Scholar] [CrossRef]
  60. What Is a Courant Number? Available online: https://www.simscale.com/knowledge-base/what-is-a-courant-number/ (accessed on 31 May 2024).
  61. Mohamed, M.; Janiga, G.; Pap, E.; Thevenin, D. Optimal blade shape of a modified savonius turbine using an obstacle shielding and returning blade. Energy Convers. Manag. 2010, 52, 236–242. [Google Scholar] [CrossRef]
  62. Arbitrary Mesh Interface. Available online: https://openfoam.org/release/2-1-0/ami/ (accessed on 31 May 2024).
  63. DynamicMeshDict. Available online: https://openfoamwiki.net/index.php/DynamicMeshDict (accessed on 31 May 2024).
  64. Dynamic Meshes in OpenFOAM. Available online: https://cfd.direct/openfoam/free-software/dynamic-meshes/ (accessed on 31 May 2024).
  65. Goetten, F.; Finger, D.; Marino, M.; Bil, C.; Havermann, M.; Braun, C. A review of guidelines and best practices for subsonic aerodynamic simulations using RANS CFD. In Proceedings of the 11th Asia-Pacific International Symposium on Aerospace Technology (APISAT), Gold Coast, Australia, 4–6 December 2019. [Google Scholar]
  66. OpenFOAM Standard Boundary Conditions. Available online: https://www.openfoam.com/documentation/user-guide/a-reference/a.4-standard-boundary-conditions (accessed on 31 May 2024).
  67. Bai, X.; Ji, C.; Grant, P.; Oza, U.; Avital, E.J.; Williams, J.J.R. Turbulent flow simulation of a single-blade Magnus rotor. Adv. Aerodyn 2021, 3, 19. [Google Scholar] [CrossRef]
  68. Luo, D.; Huang, D.; Wu, G. Analytical solution on Magnus wind turbine power performance based on the blade element momentum theory. J. Renew. Sustain. Energy 2011, 3, 033104. [Google Scholar] [CrossRef]
  69. Rahman, M.M.; Tan, J.H.; Fadzlita, M.T.; Wan Khairul Muzammil, A.R. A Review on the Development of Gravitational Water Vortex Power Plant as Alternative Renewable Energy Resources. In IOP Conference Series: Materials Science and Engineering; IOP Publishing: Bristol, UK, 2017; Volume 217. [Google Scholar] [CrossRef]
  70. Timilsina, A.B.; Mulligan, S.; Bajracharya, T.R. Water vortex hydropower technology: A state-of-the-art review of developmental trends. Clean Technol. Environ. Policy 2018, 20, 1737–1760. [Google Scholar] [CrossRef]
  71. Nishi, Y.; Inagaki, T. Performance and Flow Field of a Gravitation Vortex Type Water Turbine. Int. J. Rotating Mach. 2017, 2017, 2610508. [Google Scholar] [CrossRef]
  72. Gravitational Water Vortex Power Plant, A Water Turbine Adapted to Small Height Differences. Available online: https://jalca.gifu-shinoda.co.jp/en/energy/suiryoku/ (accessed on 31 May 2024).
  73. Gravitational Water Vortex Power Plants. Available online: http://www.zotloeterer.com/welcome/gravitation-water-vortex-power-plants/ (accessed on 31 May 2024).
Figure 1. Darrieus rotor geometry for the validation study.
Energies 17 03093 g001
Figure 2. Domain dimensions for the Darrieus VAWT validation study.
Energies 17 03093 g002
Figure 3. Validation study computational grid for Darrieus wind turbine.
Energies 17 03093 g003
Figure 4. Numerical results comparison for Darrieus wind turbine validation [36].
Energies 17 03093 g004
Figure 5. Rotor geometries analyzed in the study.
Energies 17 03093 g005
Figure 6. Computational domain for free-flow simulations.
Energies 17 03093 g006
Figure 7. Computational domain for infinite palisade.
Energies 17 03093 g007
Figure 8. Computational domain for offset infinite palisade.
Energies 17 03093 g008
Figure 9. Numerical grids for arrays of three Savonius, Y22, and W22 rotors.
Energies 17 03093 g009
Figure 10. Comparison of Y22 and W22 rotors for central rotor start-up conditions.
Energies 17 03093 g010
Figure 11. Three Y22 rotors rotating with tip–speed ratio λ = 0.5 .
Energies 17 03093 g011
Figure 12. Three W22 rotors rotating with tip–speed ratio λ = 0.5 .
Energies 17 03093 g012
Figure 13. Velocity distribution around cylindrical turbines rotating with tip–speed ratio λ = 0.5 .
Energies 17 03093 g013
Figure 14. Three Savonius rotors rotating with tip–speed ratio λ = 0.5 .
Energies 17 03093 g014
Figure 15. Velocity distribution around Savonius turbines rotating with tip–speed ratio λ = 0.5 .
Energies 17 03093 g015
Figure 16. Mean results for Y22 and Z22 rotors stationary C T at spacing s = 10 , 20 , 30 mm.
Energies 17 03093 g016
Figure 17. Mean results for Savonius rotors stationary C T at spacing s = 10 , 20 , 30 mm.
Energies 17 03093 g017
Figure 18. Mean results for Z22 offset rotors stationary C T at spacing s = 20 mm.
Energies 17 03093 g018
Figure 19. Mean results for eight-bladed T22 rotors at spacing s = 20 , 30 mm.
Energies 17 03093 g019
Figure 20. Mean results for seven-bladed U22 and L22 rotors at spacing s = 10 , 20 , 30 mm.
Energies 17 03093 g020
Figure 21. Mean results for three-bladed K22, N22, and J22 rotors at spacing s = 20 mm.
Energies 17 03093 g021
Figure 22. Mean results for five-bladed M22, X22, P22, and S22 rotors at spacing s = 10 , 20 , 30 mm.
Energies 17 03093 g022
Table 1. Validation case flow characteristics.
LabelQuantity
TypeTransient 2D aerodynamics
FluidNewtonian, single-phase, incompressible
MaterialAir
Dynamic viscosity μ = 1.8551 × 10 5   Pa · s
Density ρ = 1.225   kg m 3
Turbine diameterD = 20 m
Flow velocity u = 10 m s
Reynolds numberRe = 13,500,000
Table 2. Validation case BCs for velocity and pressure.
BC/Field u , m s p, m 2 s 2
Inlet u x = 10 p n = 0
Outlet u n = 0 and u x = 0 p = 0
Top/bottomslip p n = 0
Left/rightemptyempty
AMI domain/rotorcyclicAMIcyclicAMI
Blades/shaft u = 0 p n = 0
Table 3. Validation case BCs for turbulent kinetic energy, dissipation ratio, and kinematic viscosity.
BC/Fieldk, m 2 s 2 ω , 1 s ν t , m 2 s
Inlet k = 0.015 ω = 0.1118 solved by k- ω model
Outlet k n = 0 ω n = 0 solved by k- ω model
Top/bottom k n = 0 ω n = 0 ν t n = 0
Left/rightemptyemptyempty
AMI domain/rotorcyclicAMIcyclicAMIcyclicAMI
Blades/shaft k w a l l function ω w a l l function ν t w a l l function
Table 4. Rotor dimensions.
Rotor Geometry
ParameterSavoniusJ22K22N22M22P22S22X22Z22U22L22T22Y22W22
No. of blades23335555777899
Diameter, mm115131131131131131130130119118129118115119
Blade length/depth, mm6418.7201817.415.118.820.79.610.216.29.65.67.5
Table 5. Simulation types breakdown.
DomainSimulationRotor Geometry
TypeTypeSav.J22K22N22M22P22S22X22Z22U22L22T22Y22W22
Nonstationary open domain 20 mm spacingStart-up
TSR = 0.5
Stationary cyclic domain same starting angles = 10 mm
s = 20 mm
s = 30 mm
Stationary cyclic domain 20 mm spacing offsets = ( 10 , 0 , 20 )
= ( 20 , 0 , 40 )
10 mm x-axis
20 mm x-axis
Table 6. Flow characteristics.
LabelQuantity
TypeTransient/steady-state 2D aerodynamics
FluidNewtonian, single-phase, incompressible
MaterialAir-ISA at 15   C
Reynolds numberRe = 31,500
Mach numberMa = 0.012
Speed of sounda = 340.3 m s
Streamwise far-field flow speed u = (4,0,0) m s
Characteristic length (rotor diamater)D = 0.115 m
Kinematic viscosity of fluid ν = 1.461 × 10 5   m 2 s
Table 7. Transient-state BC for velocity and pressure.
BC/Field u , m s p, m 2 s 2
Inlet u x = 4 p n = 0
Outlet/top/bottom u n = 0 and u x = 0 p = 0
Left/rightemptyempty
AMI domain/rotorcyclicAMIcyclicAMI
Rotors u = 0 p n = 0
Table 8. Transient-state BC for turbulent kinetic energy, dissipation ratio, and kinematic viscosity.
BC/Fieldk, m 2 s 2 ω , 1 s ν t , m 2 s
Inlet k = 0.06 ω = 2.536 solved by k- ω model
Outlet/top/bottom k n = 0 ω n = 0 and ω = 0 solved by k- ω model
Left/rightemptyemptyempty
AMI domain/rotorcyclicAMIcyclicAMIcyclicAMI
Rotors k w a l l function ω w a l l function ν t w a l l function
Table 9. Steady-state BC for velocity and pressure.
BC/Field u , m s p, m 2 s 2
Inlet u x = 4 p n = 0
Outlet u n = 0 and u x = 0 p = 0
Top/bottomcyclicAMIcyclicAMI
Left/rightemptyempty
AMI domain/rotorcyclicAMIcyclicAMI
Rotors u = 0 p n = 0
Table 10. Steady-state BC for turbulent kinetic energy, dissipation ratio, and kinematic viscosity.
BC/Fieldk, m 2 s 2 ω , 1 s ν t , m 2 s
Inlet k = 0.06 ω = 8 solved by k- ω model
Outlet k n = 0 ω n = 0 and ω = 0 solved by k- ω model
Left/rightemptyemptyempty
Top/bottomcyclicAMIcyclicAMIcyclicAMI
AMI domain/rotorcyclicAMIcyclicAMIcyclicAMI
Rotors k w a l l function ω w a l l function ν t w a l l function
Table 11. Considered nonstationary computational scenarios.
RotorSimulation TypeTSRWind VelocitySpacing
Y22Central rotor-4 m/s20 mm
W22start-up-4 m/s20 mm
SavoniusRotating0.54 m/s20 mm
Y22with0.54 m/s20 mm
W22TSR0.54 m/s20 mm
Table 12. Mean parameter values for Y22 rotors.
Rotor C D , C T , C P , P , W Time Range, s
Y22 upper2.7650.0590.0300.2680–2
2.7980.0630.0320.2861–2
Y22 center3.7000.0740.0370.3320–2
3.7580.0760.0380.3441–2
Y22 lower2.1970.0460.0230.2060–2
2.2400.0470.0240.2131–2
Table 13. Mean parameter values for W22 rotors.
Rotor C D , C T , C P , P , W Time Range, s
W22 upper2.6910.0720.0360.3340–2
2.6720.0790.0390.3681–2
W22 center3.7870.0830.0410.3860–2
3.8600.0920.0460.4271–2
W22 lower2.1310.0500.0250.2340–2
2.1390.0510.0260.2361–2
Table 14. Mean parameter values for Savonius rotors.
Rotor C D , C T , C P , P , W Time Range, s
Savonius upper2.0800.6180.3092.7880–2
2.0150.6070.3042.7391–2
Savonius center2.0290.5270.2632.3760–2
2.0090.5090.2552.2971–2
Savonius lower1.2370.6610.3312.9810–2
1.1770.6530.3262.9441–2
Table 15. Mean torque coefficient values for Y22, Z22, and indefinite Savonius palisades.
Rotors, mm C T upper , C T center , C T lower , C T mean , Δ η
101.1021.0981.0821.0941
Y22200.5640.5920.5970.5840.534
300.2680.2800.3030.2840.259
101.6181.4991.5181.5451
Z22200.9490.9370.9430.9430.61
300.4650.4700.4700.4680.303
101.9331.8821.9001.9051
Savonius201.4831.4321.5011.4720.773
301.2751.2371.2221.2440.653
Table 16. Mean torque coefficient values for offset Z22 palisades.
Rotors, mmOffset C T upper , C T center , C T lower , C T mean , Δ η
10-1.6181.4991.5181.5451
20-0.9490.9370.9430.9430.61
2010 mm x-axis-0.8800.8310.8560.554
Z2220 ( 10 , 0 , 20 ) 0.8740.7970.6450.7720.500
2020 mm x-axis-0.8040.7390.7710.499
20 ( 20 , 0 , 40 ) 0.7120.7150.8510.7600.492
30-0.4650.4700.4700.4680.303
Table 17. Summary of mean torque coefficient values of the steady-state simulations.
RotorNo. of BladesDiameter, mmBlade Length, mms, mm C T upper , C T center , C T lower , C T mean ,
Y2291155.6101.1021.0981.0821.094
Z2271199.6101.6181.4991.5181.545
Savonius211564101.9331.8821.9001.905
S22513018.8102.9642.8812.8102.885
P22513115.1102.9402.9602.9252.942
L22712916.2103.1193.0612.9993.059
T2281189.6200.5380.4810.5660.528
Y2291155.6200.5640.5920.5970.584
U22711810.2200.9270.9170.9250.923
Z2271199.6200.9490.9370.9430.943
L22712916.2201.1311.1531.1781.154
K22313120201.3341.1481.3261.269
N22313118201.2561.2981.3071.287
J22313118.7201.5231.3721.4041.433
Savonius211564201.4831.4321.5011.472
X22513020.7201.5611.5421.5671.557
P22513115.1201.6111.5731.5691.584
M22513117.4201.5931.5781.6091.593
S22513018.8201.6301.5941.6351.620
T2281189.6300.2630.2370.2340.244
Y2291155.6300.2680.2800.3030.284
U22711810.2300.4750.4600.4500.461
Z2271199.6300.4650.4700.4700.468
L22712916.2300.5480.5400.5650.551
P22513115.1300.8950.8980.8960.896
S22513018.8300.9480.9230.9240.932
Savonius211564301.2751.2371.2221.244
Disclaimer/Publisher’s Note: The statements, opinions and data contained in all publications are solely those of the individual author(s) and contributor(s) and not of MDPI and/or the editor(s). MDPI and/or the editor(s) disclaim responsibility for any injury to people or property resulting from any ideas, methods, instructions or products referred to in the content.