1. Introduction
The safety performance and energy saving of mining equipment have always been among the important indicators for the evaluation of safe coal mine production [
1], and frequency conversion speed regulation technology can be widely used on many occasions in the underground coal mine environment because of its superior energy-saving benefits. China Coal Research Institute of Science and Technology conducted research on the operation of a new safety monitoring system in several coal mines, such as Jizhong, China, and Shendong, China; it conducted field tests and analyses on interference problems and found that most abnormal working conditions of the safety monitoring system were caused by interference generated by the nearby frequency converter [
2]. Mine frequency converters generally include rectifier and converter links to realize AC-DC-AC conversion. There will be harmonics in the rectification process of the frequency converter, and due to the high current change rate and high voltage change rate generated in the converter, they will affect the surrounding electromagnetic environment. The high-frequency pulse will also act on the distributed capacitance and inductor in the circuit, thus increasing the degree of electromagnetic interference. As a result, the data transmitted by the monitoring system are not the actual values that should be displayed. If the gas data values transmitted are larger than the actual values and exceed the allowable values for the gas concentration in the mine, a false alarm will be generated, and the normal and safe operations of the mine will be affected.
In recent years, there has been more research on harmonic interference generated by frequency conversion equipment in coal mines, and relevant prevention and control measures have been proposed [
3,
4,
5]. In the above stage, research on the electromagnetic radiation of mine converters has been based on measured data. With the enrichment of electromagnetic field calculation methods and improvements in hardware computing ability, the application of electromagnetic simulation software is gradually maturing, and the dimension and accuracy of calculation models have improved. In recent years, most scholars have begun using simulation software to build models, select suitable electromagnetic field calculation methods to solve the model field, and analyze the simulation results to further master the characteristics of electromagnetic radiation. Several teams have modeled interference sources and their propagation [
6,
7,
8,
9]. Other scholars have simulated and analyzed the electromagnetic radiation of switching power supplies, inverters, electric vehicles, traction converters, converter valves and other devices and obtained many research results [
10,
11,
12,
13,
14,
15,
16]. Yang. Y from Liaoning Technical University built a frequency converter antenna model in the electromagnetic field simulation software FEKO by combining the MOM and antenna theory, simulated and analyzed the interference characteristics of the speed regulation system at steady state, and verified the feasibility of using the MOM to solve and study the antenna model of a mine frequency converter [
17]. However, there are still some limitations in the current research on measures for the suppression of radiation interference from frequency converters used in coal mines. Therefore, based on a simulation analysis of the radiation interference characteristics of coal mines, this paper investigated potential suppression measures.
2. Analysis of Electromagnetic Radiation Interference Mechanism of Mine Frequency Converters
The rectifier and transformer of the frequency converter belong to the nonlinear load in the power grid, and there will be a certain number of harmonics. The converter link adopts sinusoidal pulse width modulation (SPWM). In the process of repeated high-frequency power switching by an IGBT device with a set frequency and amplitude, the switching frequency doubles the high amplitude of the harmonic components. At the same time, high-frequency pulse signals with large d
u/d
t and d
i/d
t will be generated when the IGBT switches its switching state quickly. According to electromagnetic wave theory, the electromagnetic wave will be generated by the time-varying charge or the time-varying current. Dr. Zhang designed an experiment to analyze the electromagnetic radiation level of an IGBT in a modular multilevel converter (MMC) sub-module based on research on the MMC’s electromagnetic radiation disturbance characteristics and verified that the IGBT is the source of radiation interference from a frequency converter [
18].
For a frequency converter, its own wiring, metal casing, etc., can be used as coupling paths to radiate electromagnetic waves. The high-frequency du/dt pulse generated by frequent IGBT on–off switching will act on the parasitic capacitance, and the high-frequency di/dt pulse will act on the parasitic inductance. These parasitic parameters also provide a coupling path for the voltage and current generated by conducting electromagnetic interference and then generate radiation interference.
The electromagnetic environment in an underground coal mine is complex, and the sensitive equipment in coal mines mainly includes monitoring, communication and other systems, as well as sensors and other equipment.
5. Radiation Interference Simulation and Experiment of Mine Frequency Converter
Compared with the IGBT, the structure of the frequency converter is more complex. There are many capacitors, inductors and other elements inside, and there are also metal structures, such as cases. The simulation model in this paper is a 1:1 model based on the actual structure and size. The overall size is 1500 mm × 896 mm × 986 mm. This paper sets the same number of welded IGBT devices in the converter as in the ZJT series inverter, so the electromagnetic field characteristics of the converter simulation model and the actual model are highly similar. The IGBT model follows the above model, and the capacitor, inductance and resistance in the frequency converter are equivalent to those in a surface antenna. The material was set as a perfect conductor. The size parameters of the frequency converter’s metal case were set according to the actual size. The whole case is also equivalent to the surface antenna. The simulation model of the frequency converter is shown in
Figure 10. At the same time, the ground was added to the model, which was set as a perfect conductor. The origin of the coordinates is placed at the center of the bottom of the frequency converter case.
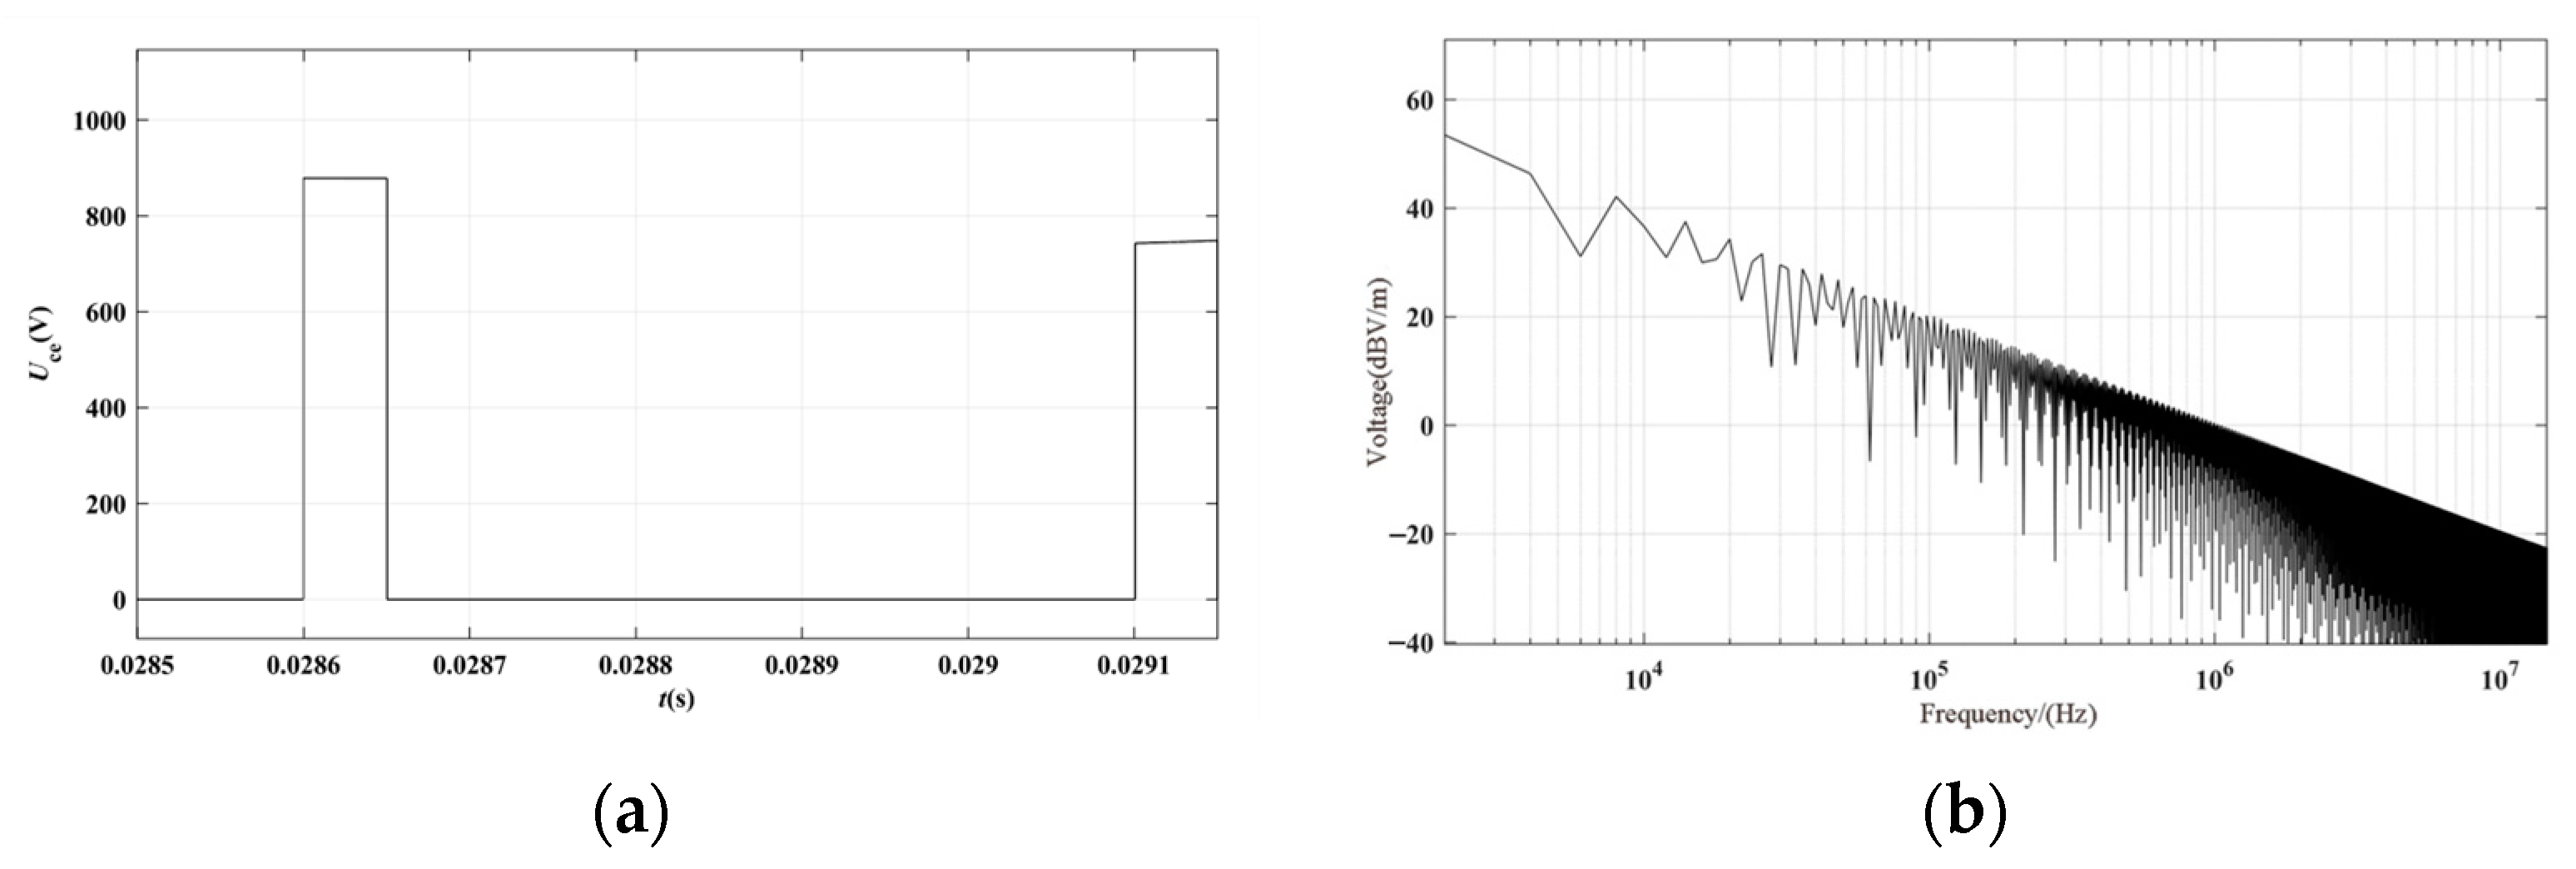
A line port was set on the aluminum bonding line in the IGBT model in the frequency converter, and a voltage source was applied as an excitation. The amplitude is the frequency-domain voltage signal in the IGBT breaking process corresponding to each solving frequency. Considering the actual situation, three voltage source excitations were applied to the three IGBT modules on the right side of the frequency converter.
The solution method uses the MOM, and the triangular mesh method is used to divide the model, as shown in
Figure 11. The meshes at the frequency converter model are relatively dense, while the meshes at the ground edge are large and sparse.
After establishing the model, the near-field solver and far-field solver were added to the model. Three near-field solvers were set according to the actual situation, as shown in
Figure 12.
5.1. Cuboid Solver
A 2000 mm × 2500 mm × 1200 mm cuboid solver was used with steps of 100 mm in the X-axis, Y-axis and Z-axis, and 21 YZ planes, 26 XZ planes and 13 XY planes were calculated. This paper only presents some of the near-field radiation diagrams.
We select the XY plane with Z = 300 mm at different frequency points, and the simulation results are shown in
Figure 13.
The electric field radiation trends in other directions are the same as the simulation results in the XY plane at Z = 300 mm. The simulation results show that the intensity of the radiated field inside the frequency converter is greater than the intensity outside the frequency converter, and the frequency converter case has a shielding effect on the electromagnetic radiation generated by the internal circuit. According to the simulation results, it can be seen that the radiated electric field intensity of the frequency converter case decreases as the frequency increases.
5.2. Linear Solver
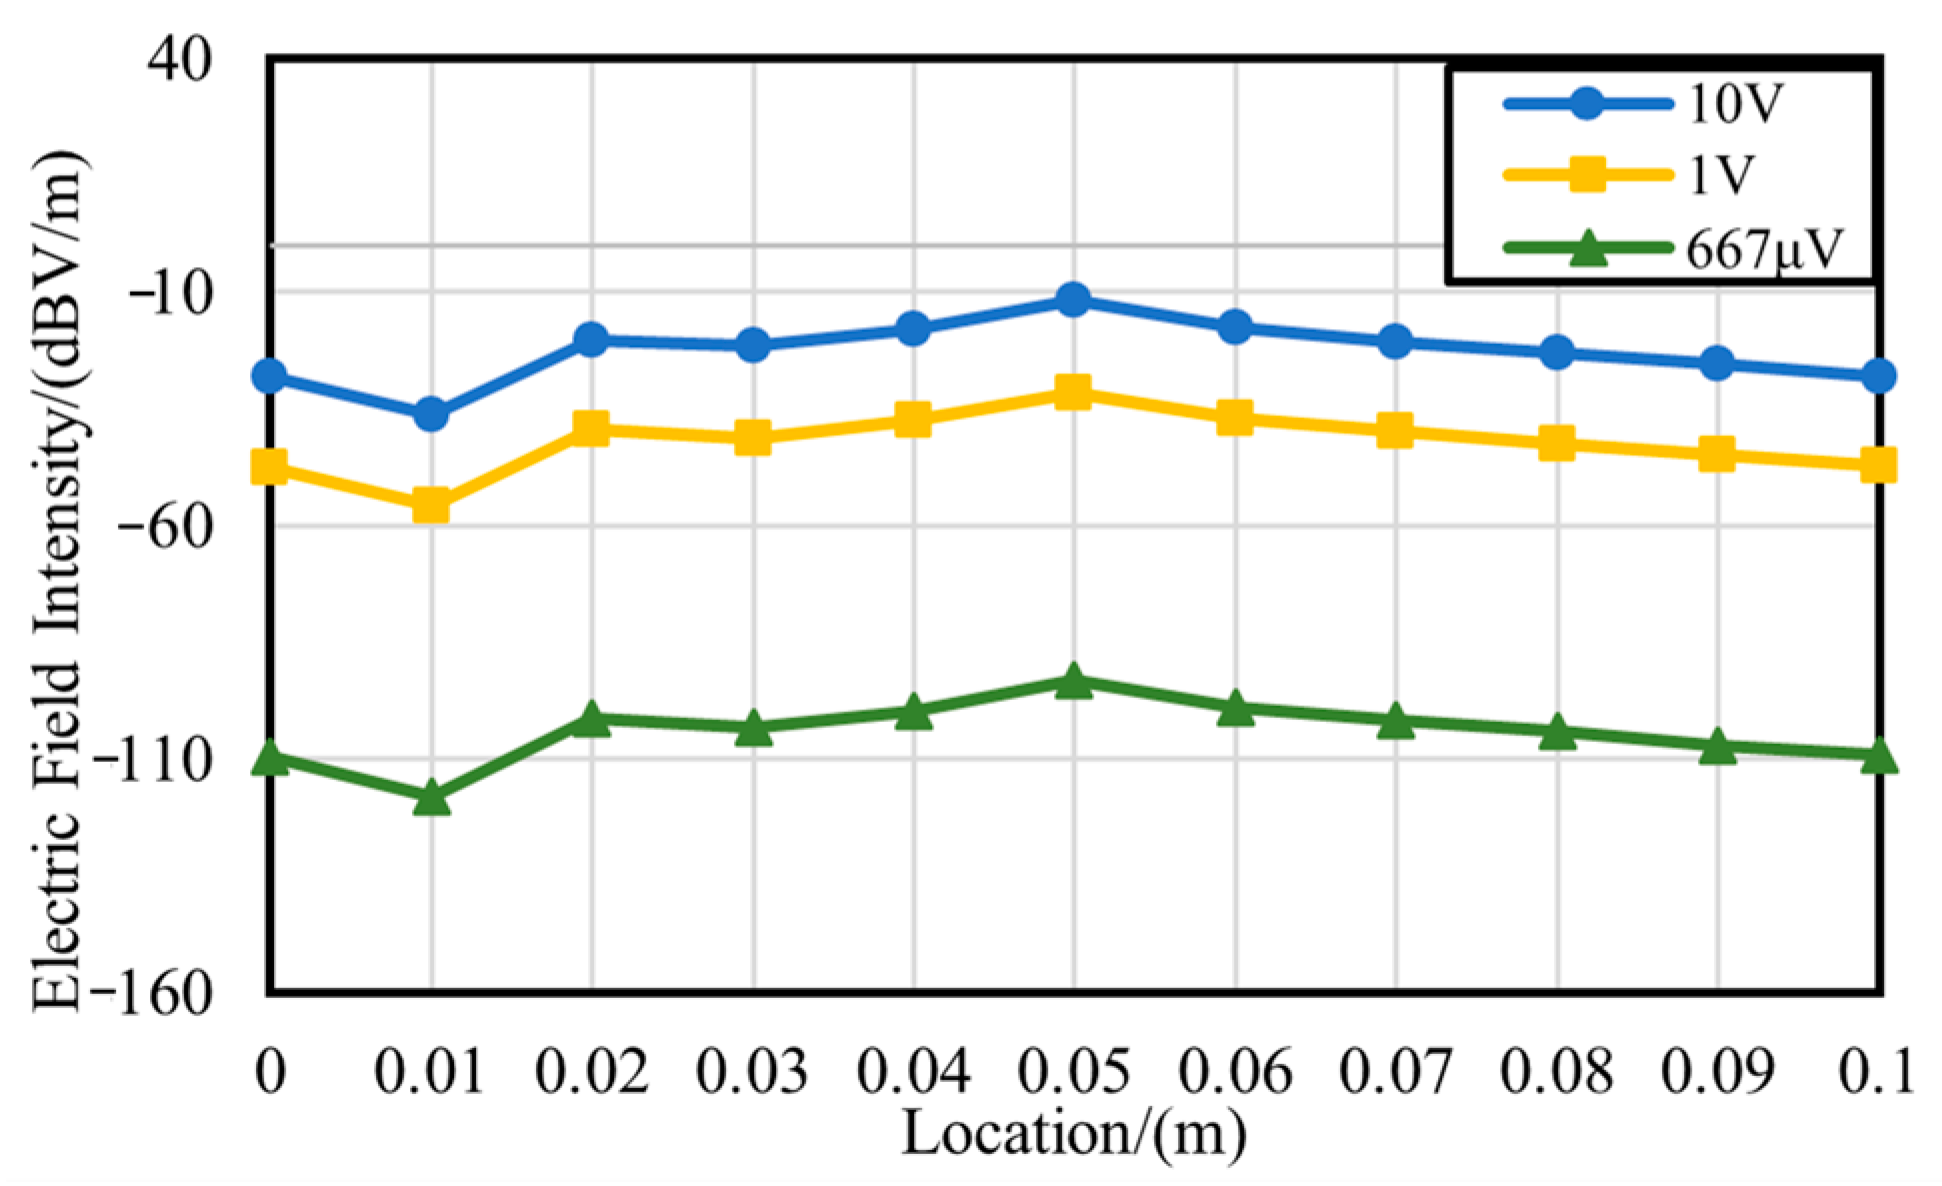
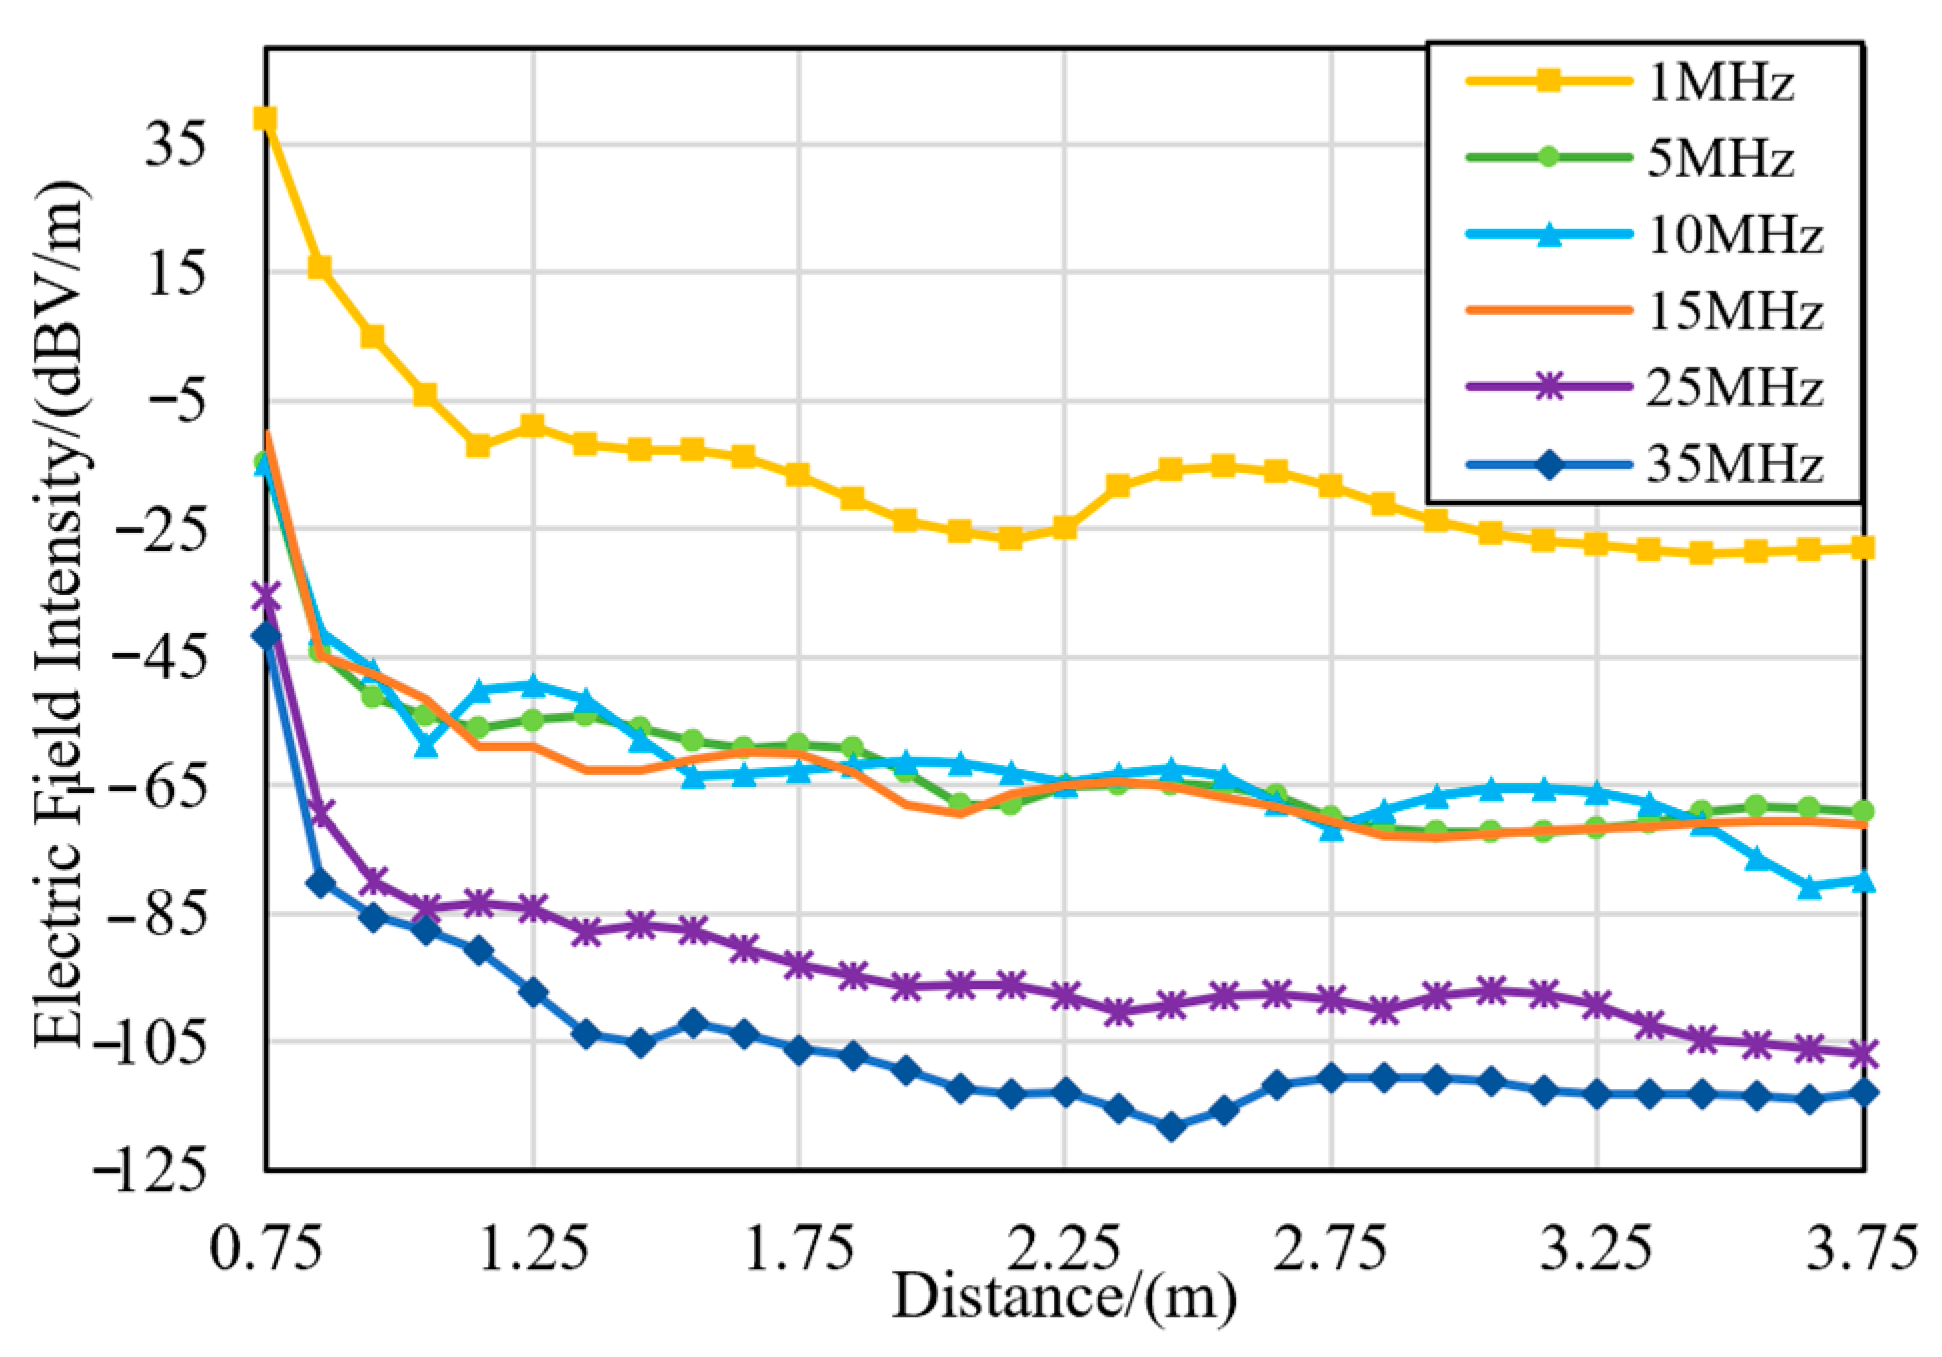
A linear solver with a length of 3 m was set in the center position on the right side of the converter case along the positive direction of the Y-axis. The solution area is (X = 0 mm, 750 mm ≤ Y ≤ 3750 mm, Z = 375 mm), and the solution step is 0.1 m. Thus, there are 31 positions in total. We can observe the electric field radiation level at a distance of 3 m around the case of the frequency converter. The simulation results for each frequency point are shown in
Figure 14. The case is located at 0.75 m. The electric field radiation at the case is the largest. Although some frequency points fluctuate in a small range, the field intensity tends to decrease with the increase in distance. The radiation levels at the 5 MHz and 15 MHz frequency points at field points that are 1.3 m away from the case are similar.
5.3. Point Solver
A single field point solver was set near the output cable of the frequency converter case, located at coordinates (235, 840, 740), to calculate the electric field radiation intensity of the field point. The model accuracy is verified by comparing the results with the experimental data in the following text. No analysis will be presented here.
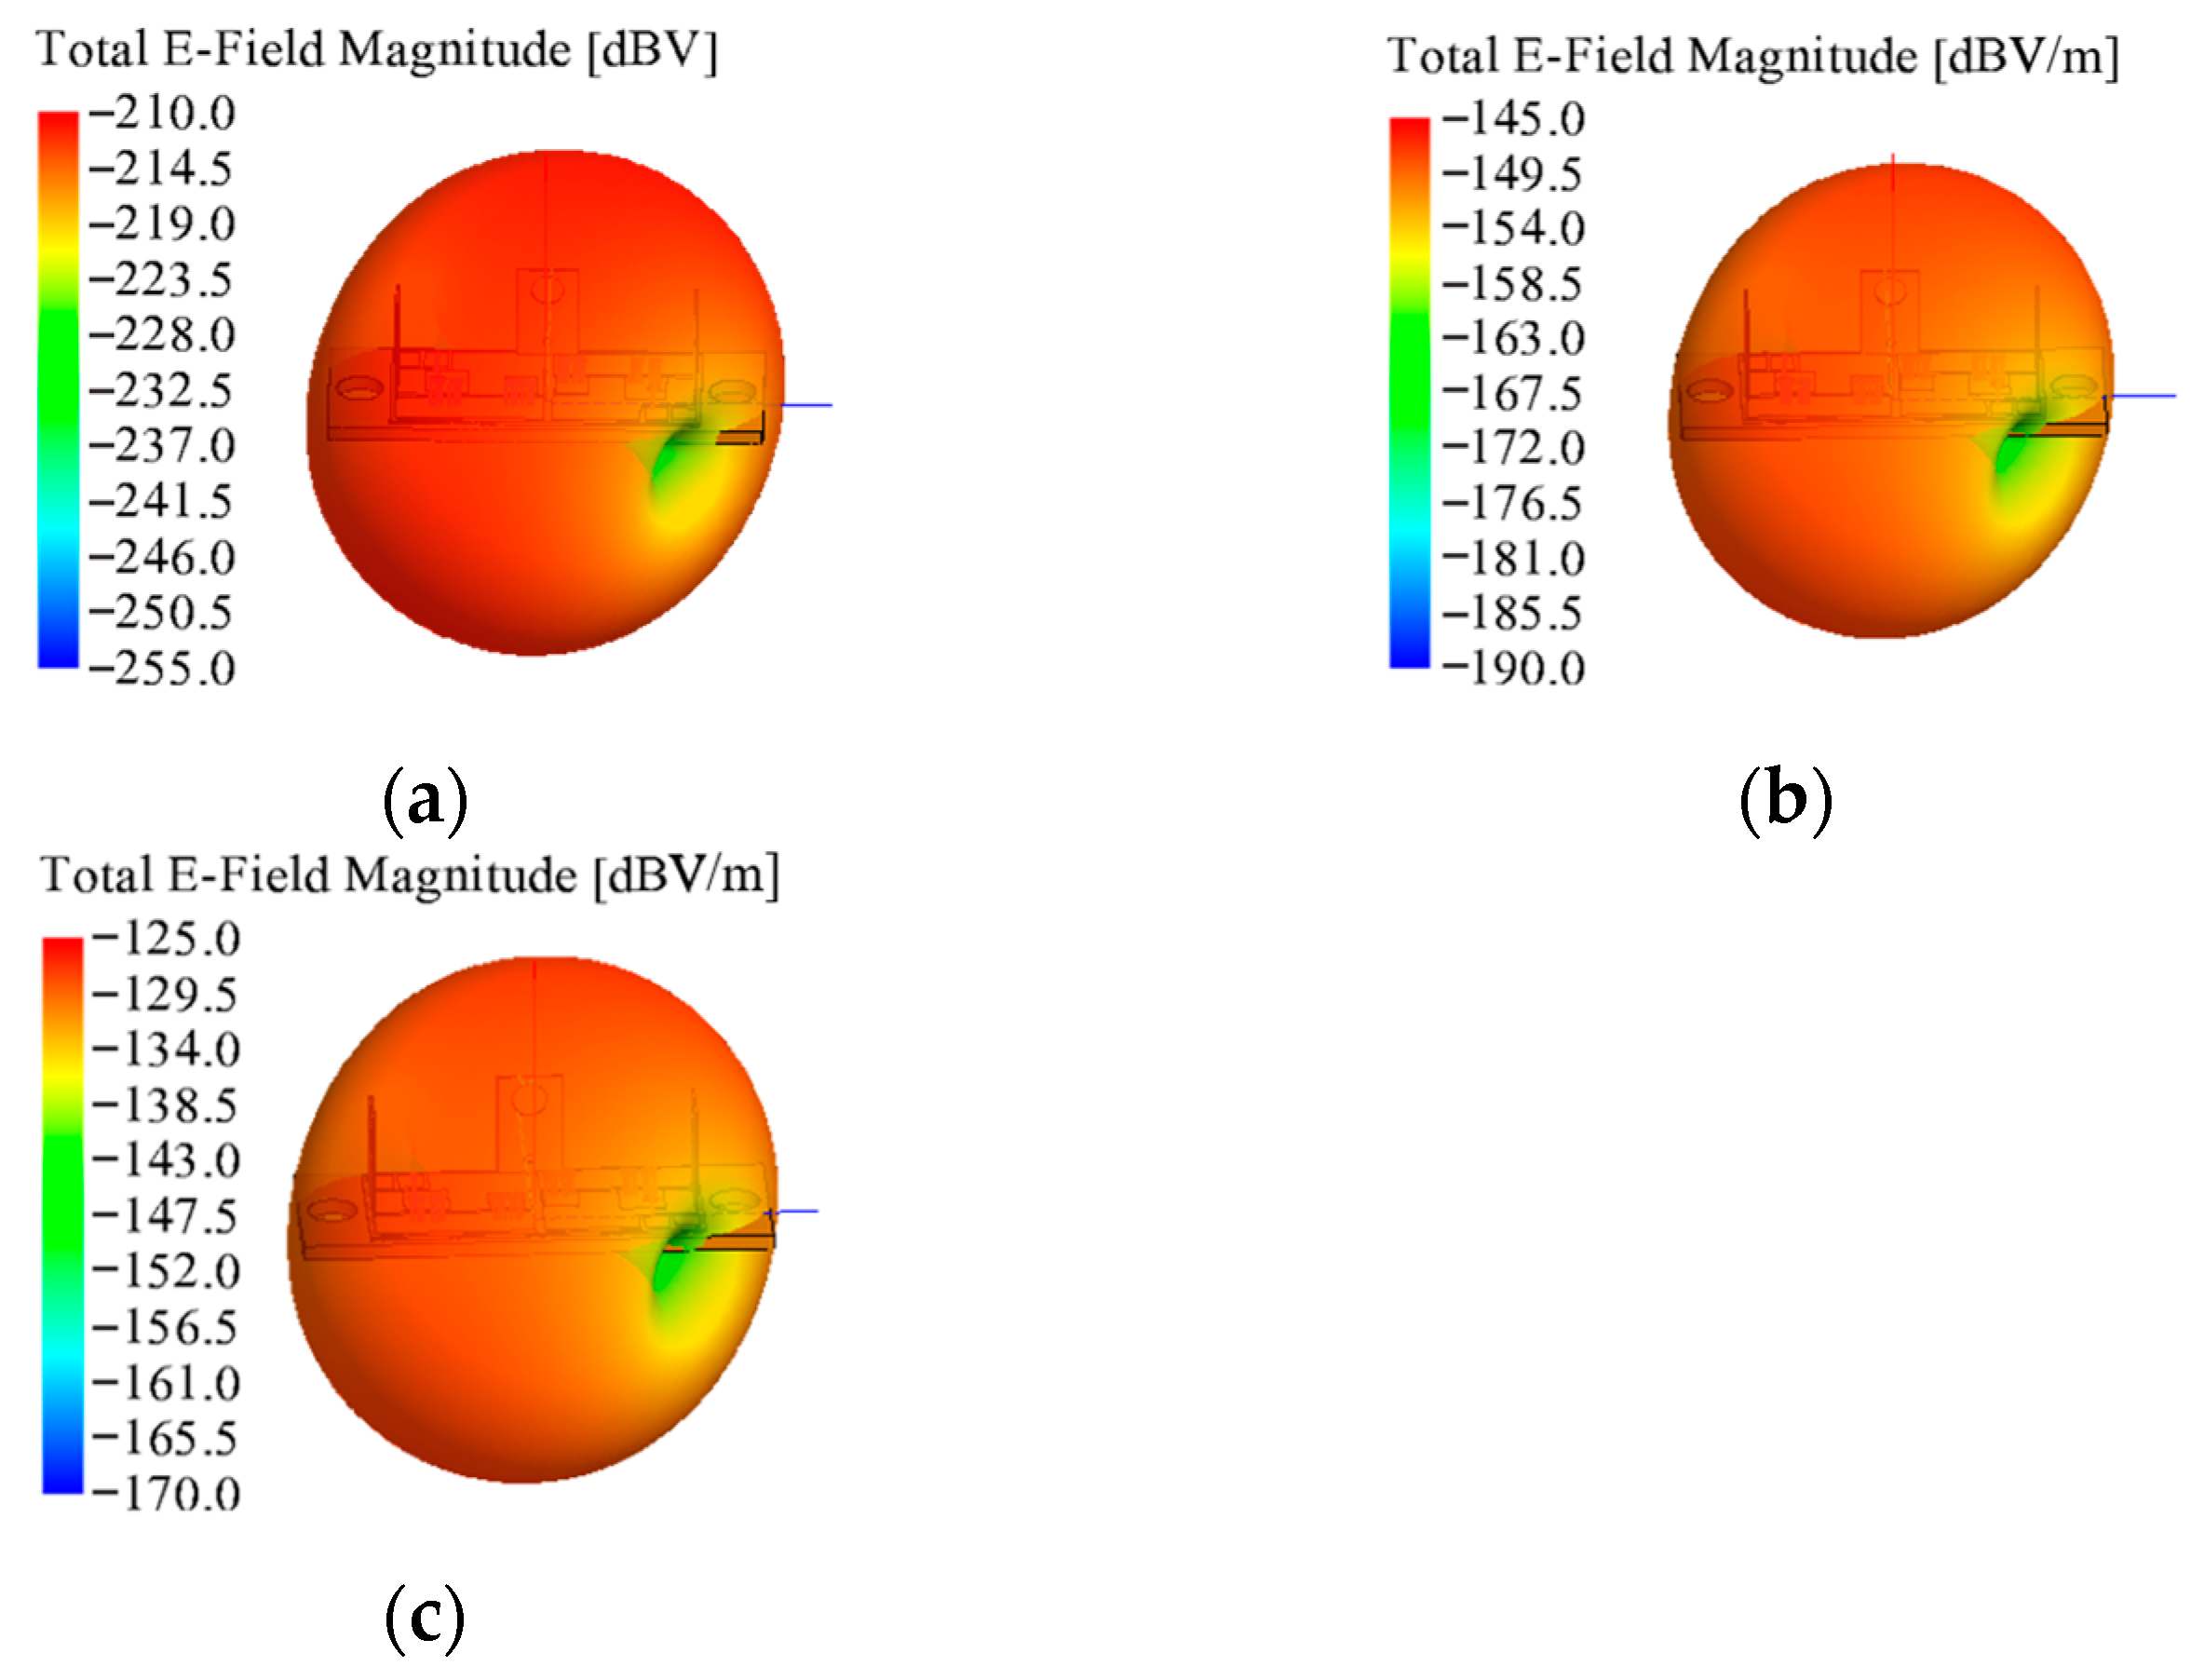
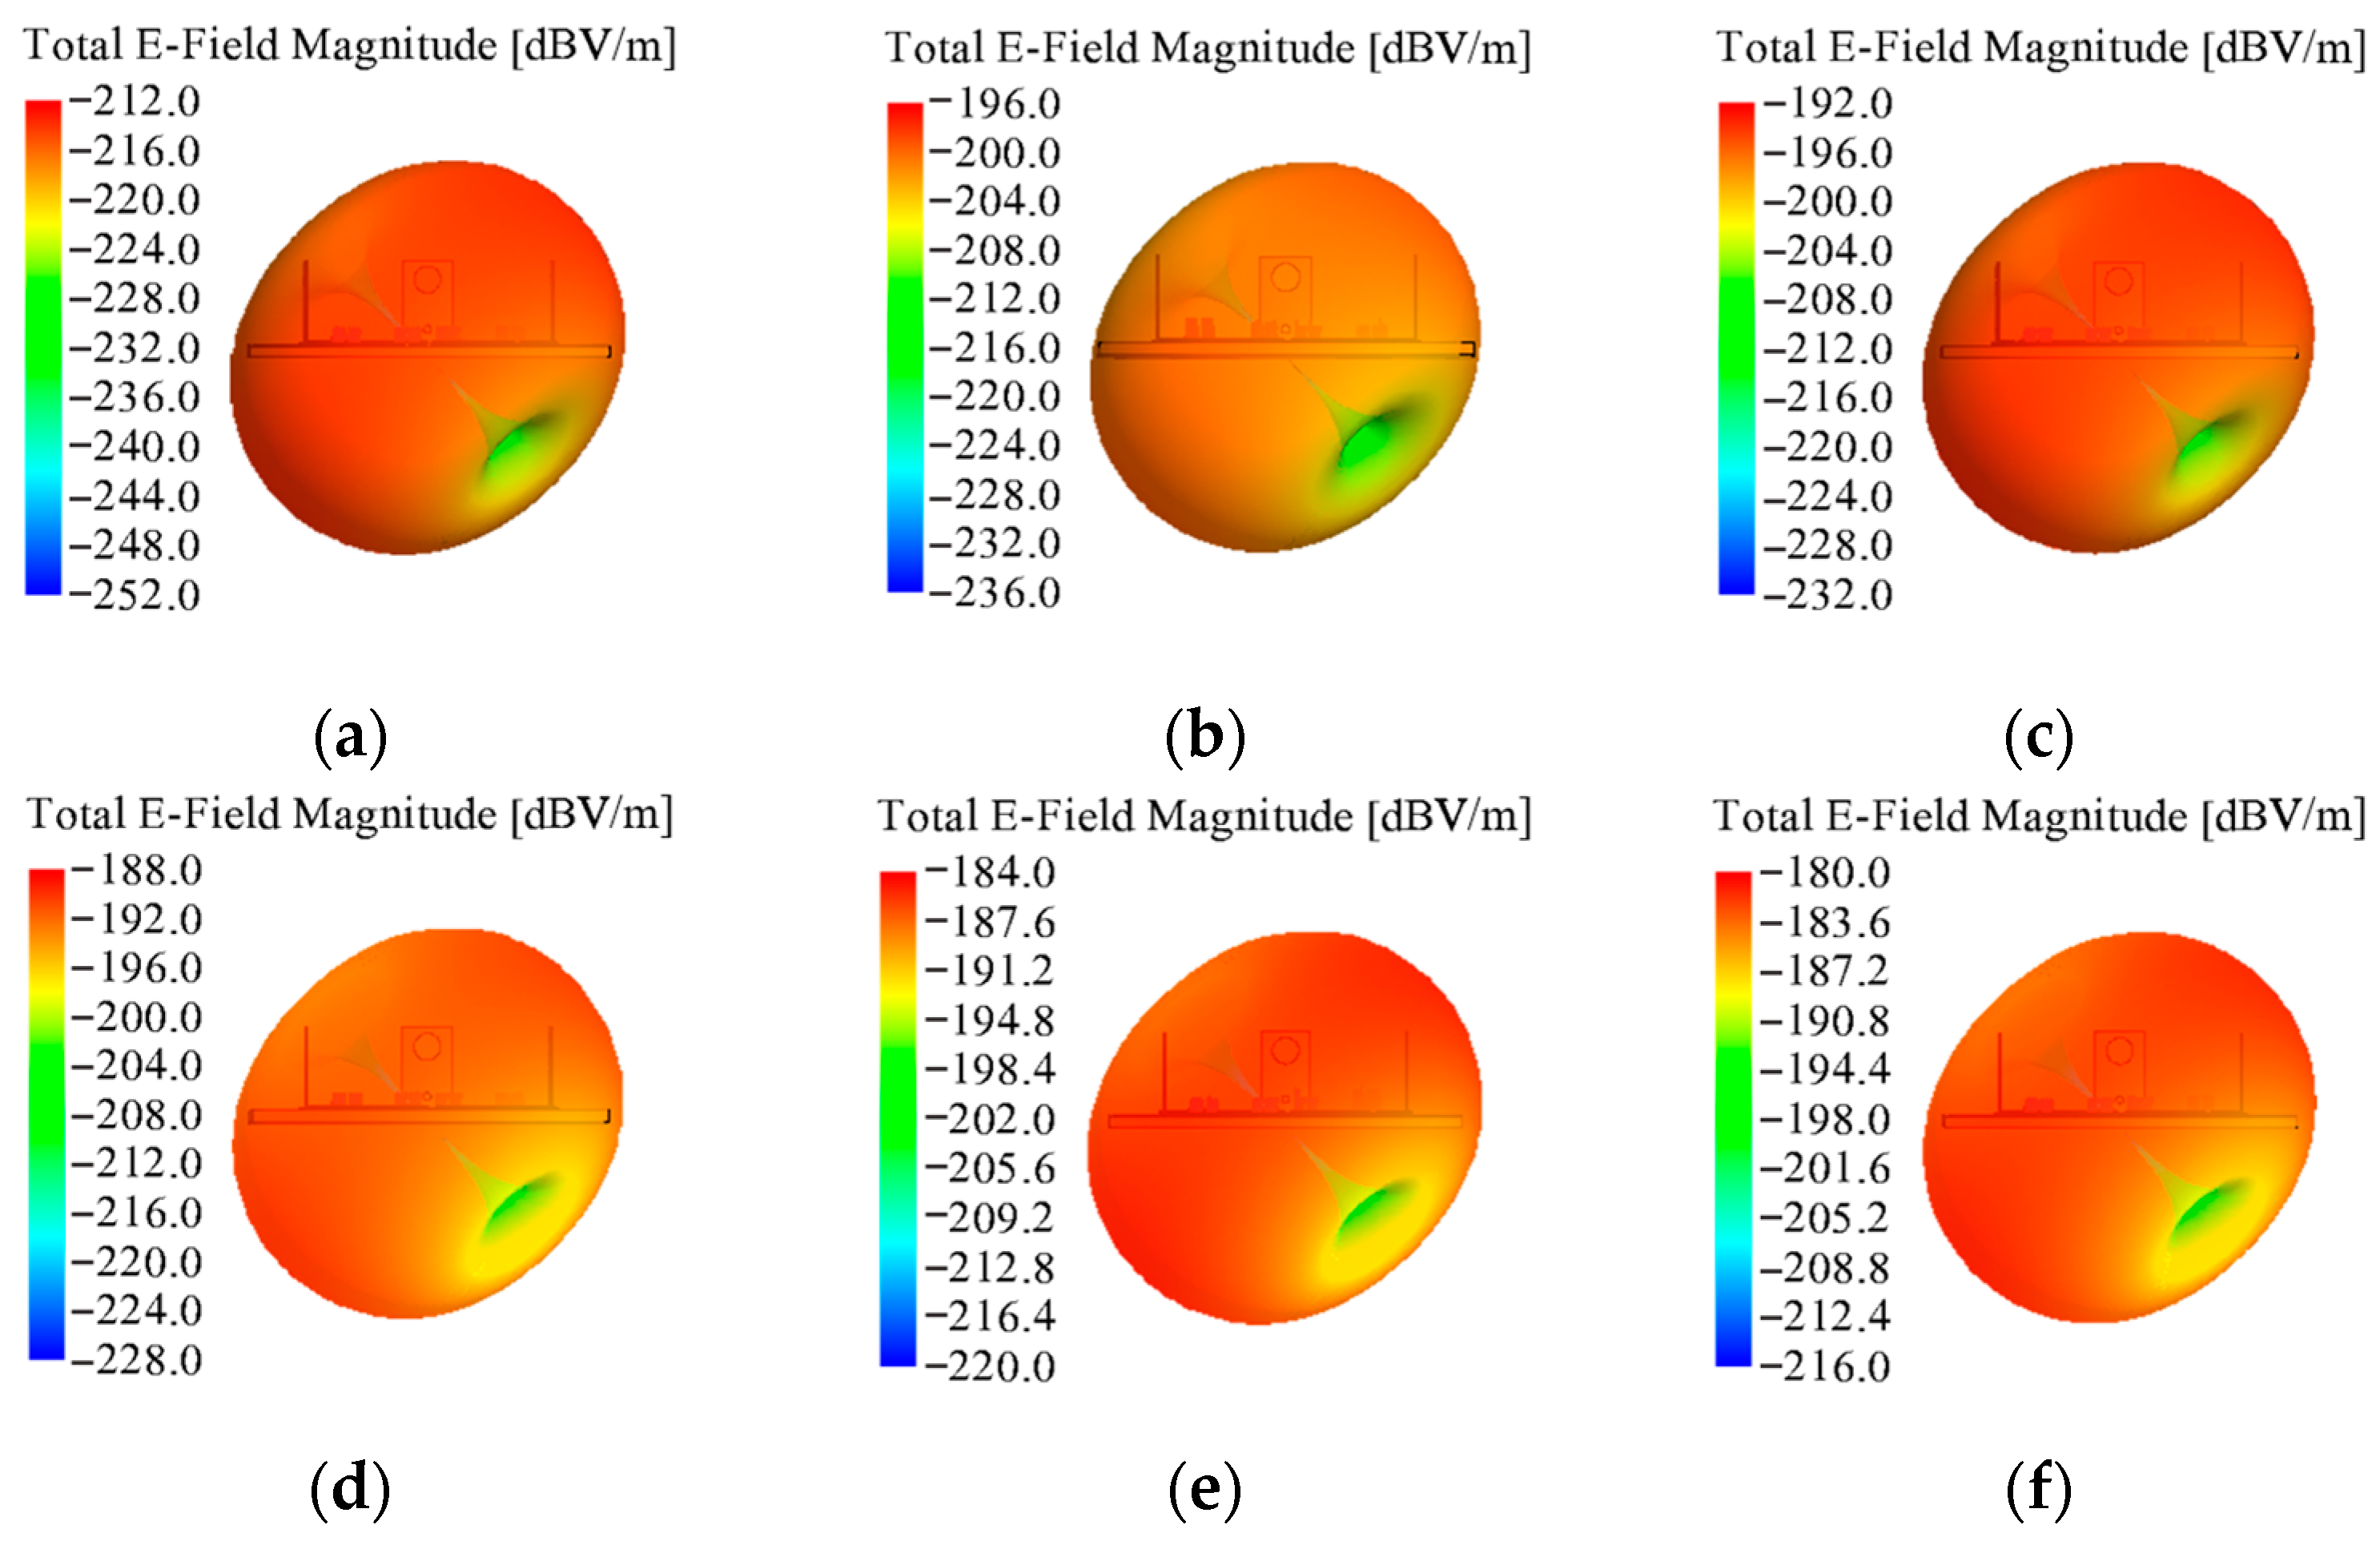
The simulation results of the far-field solver are shown in
Figure 15. We observed the trend of electromagnetic radiation in a certain direction at an infinite distance according to the diagram.
According to the far-field distributions of the listed typical frequency points, the distribution of high field intensity at the 1 MHz frequency point and 5 MHz frequency point is scattered, and the distribution of high field strength at subsequent frequency points is concentrated and continuous. The color is used to simulate the field intensity distribution in the software. From the color distribution, the field intensity values at 10 MHz, 15 MHz, 25 MHz and 35 MHz frequency points transition from the top to the bottom.
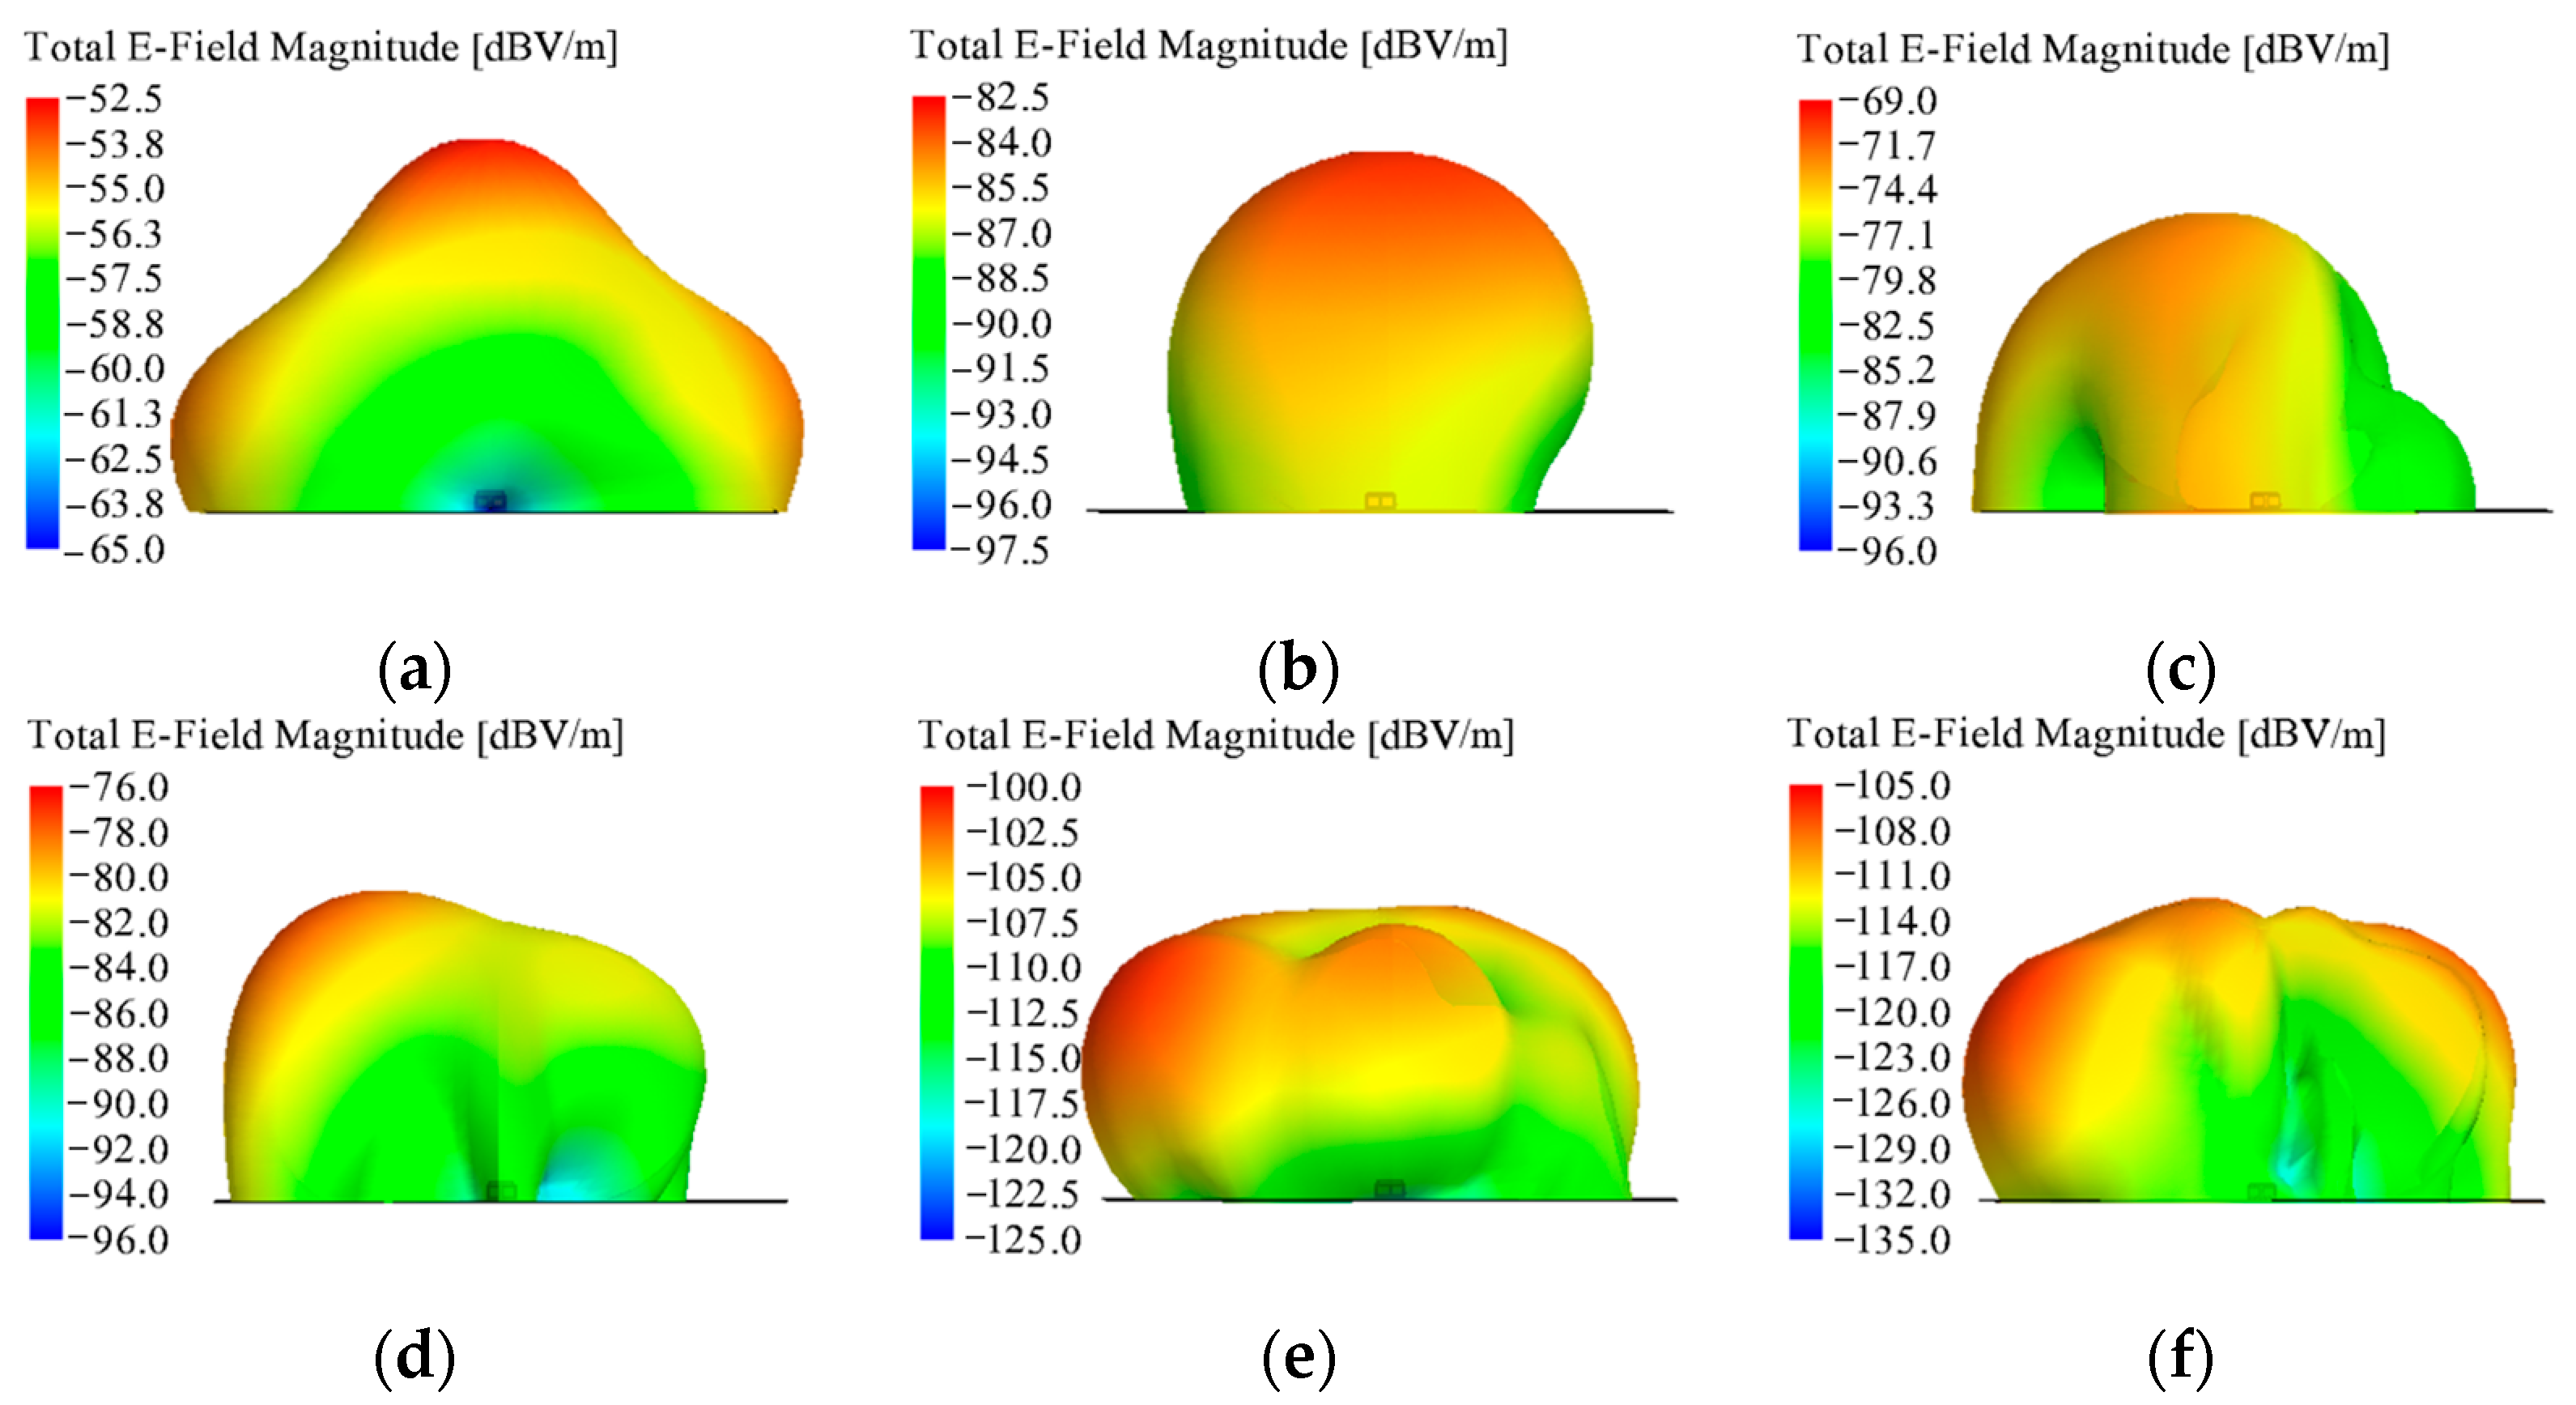
In
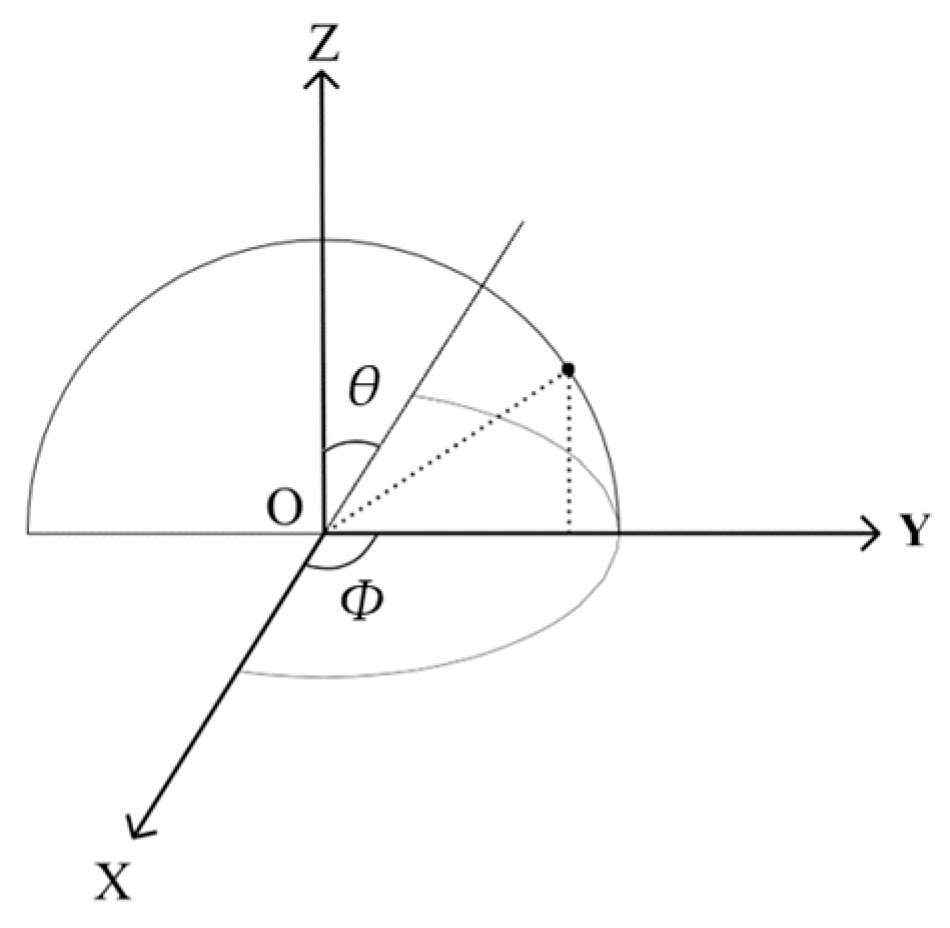
Figure 16, there are three lobes in far-field radiation at a frequency of 1 MHz: the major lobe is
θ = 0°, and the side lobes are located at
θ = 70° and
θ = −70°. The difference between the maximum field intensity of the major lobe and the side lobes is about 2 dBV/m. The far-field radiation with a frequency of 5 MHz is as follows: when
Φ varies between 50° and 95°, the far-field lobes appear in the three places where the directions are
θ = 0°, 60° and 300°. And, there is a maximum electric field intensity in the direction of 0°. In the process of
Φ changing from 0° to 180°, the maximum value of far-field radiation intensity at 10 MHz frequency always appears in the range of
θ from −10° to 10°. Overall, the field intensity decreases from the top to the bottom. The far-field radiation at a frequency of 15 MHz is roughly the same as that at a frequency of 10 MHz. In the process of
Φ changing from 0° to 180°, the radiation field intensity between −45° and 30° is at a high level. The distribution range of the high field intensity area at the 15 MHz frequency point is larger than that at the 10 MHz frequency point, but the field strength value slightly decreases. The high-amplitude field intensity region at the 25 MHz frequency point corresponds to the range of
θ from −25° to −5°. The far-field radiation intensity level at the 35 MHz frequency point is lower, and the main radiation direction is
θ = −45°~−5°. The field intensity is the largest in the direction of
Φ = 0°,
θ = −40°. When arranging cables or secondary equipment, laying them in an area with a strong radiation field from the frequency converter should be avoided.
5.4. Radiation Interference Experiment on Mine Frequency Converter
The measurement of the electromagnetic radiation level of the frequency converter in this paper is mainly carried out according to the domestic standard GB 12668.3-2012 [
23]. The test environment in this paper can be arranged with reference to the measurement environment specified in the standard for the radiated emission measurement of class C3 equipment, and the test results are compared with the emission limits of each frequency band and ports of class C3 equipment in the standard.
The tested equipment in this paper is a ZJT-75/660SF mining frequency converter, which is used to control a local ventilator, and the physical object is shown in
Figure 17. The measuring equipment is an N9342C American Keysight handheld spectrum analyzer with a frequency range of 9 KHz~7 GHz and a resolution bandwidth of 2 MHz, and the selected antenna, R&S
®HE300, is a basic handheld directional antenna, which is suitable for locating transmitters and interference sources, covering the frequency band range of 9 KHz~7.5 GHz.
The test points are arranged around the case near the output cable, corresponding to the field point of the near-field solver located at the case near the output cable of the frequency converter. In the simulation process, some frequency points within 1~36 MHz were selected to obtain the radiation field intensity distribution at each frequency point. After unit conversion, the data were compared with a group of measurement results obtained when the output frequency of the frequency converter was 20 Hz, as shown in
Figure 18.
Comparison and analysis show that, at most frequency points, the simulation results are very close to the measured data. The calculated values of field intensity at 1~3 MHz frequency points are greater than the measured values, and the difference between the simulation results and the measured data at 1 MHz frequency point is 64.68 dBμV/m, corresponding to 0.0017 V/m. The simulation data for some frequency points are smaller than the measured data, and the difference is the largest at the 21.5 MHz frequency point, about 16.74 dBμV/m, corresponding to 6.8 × 10⁻⁶ V/m. The reason that the results at these frequency points are higher or lower than the measured values is that the position of the excitation source is fixed in the software simulation. In actual operation, the upper and lower tubes of the three half-bridge circuits are alternately connected, and the position of the excitation source is changed. So, the IGBT interference signal obtained in the simulation is different from the actual measurement. In addition, during the operation of the frequency converter, the voltage signal output by the IGBT is not a uniform periodic pulse. Although the single waveform selected during the simulation is typical, it cannot represent the situation of each on–off waveform.
According to the provisions of the national standard GB 12668.3-2012 on the radiation limit of a case port of an electric drive system, in combination with the test results in this paper, the electromagnetic radiation levels at frequency points after 30 MHz are all within the allowable limit of 90 dBμV/m or less. While ensuring the rationality of the frequency points studied in this paper, it is determined that coal mine converter equipment can still be judged by the GB standard.
6. Suppression Measures of Electromagnetic Radiation Interference
Nowadays, the heat dissipation holes of a frequency converter are mostly rectangular, which affects the effectiveness of the housing in shielding electromagnetic radiation. To study the influence of the shape of the heat dissipation holes on electromagnetic radiation and ensure the same heat dissipation effect, the traditional rectangular heat dissipation holes were improved and replaced with a 3 × 12 rectangular heat dissipation hole array and round heat dissipation holes.
In order to verify the influence of different heat dissipation hole shapes on the heat dissipation effect of the housing, the heat dissipation effects of housing with rectangular heat dissipation holes, a 3 × 12 rectangular hole array and circular heat dissipation holes were analyzed by using thermodynamic data, mainly involving the heat transfer equation, heat loss equation and boundary heat dissipation equation, as shown in Equations (5)–(7), respectively:
In Equations (5)–(7), is the heat flux of the physical model’s heat conduction, is the heat flux of convection heat dissipation, is thermal conductivity, is temperature, is object density, is specific heat capacity, is time (seconds), is the node displacement velocity of the model and, in this paper, , is the heat source, is the heat dissipation direction, is heat transfer coefficient, and is the external temperature.
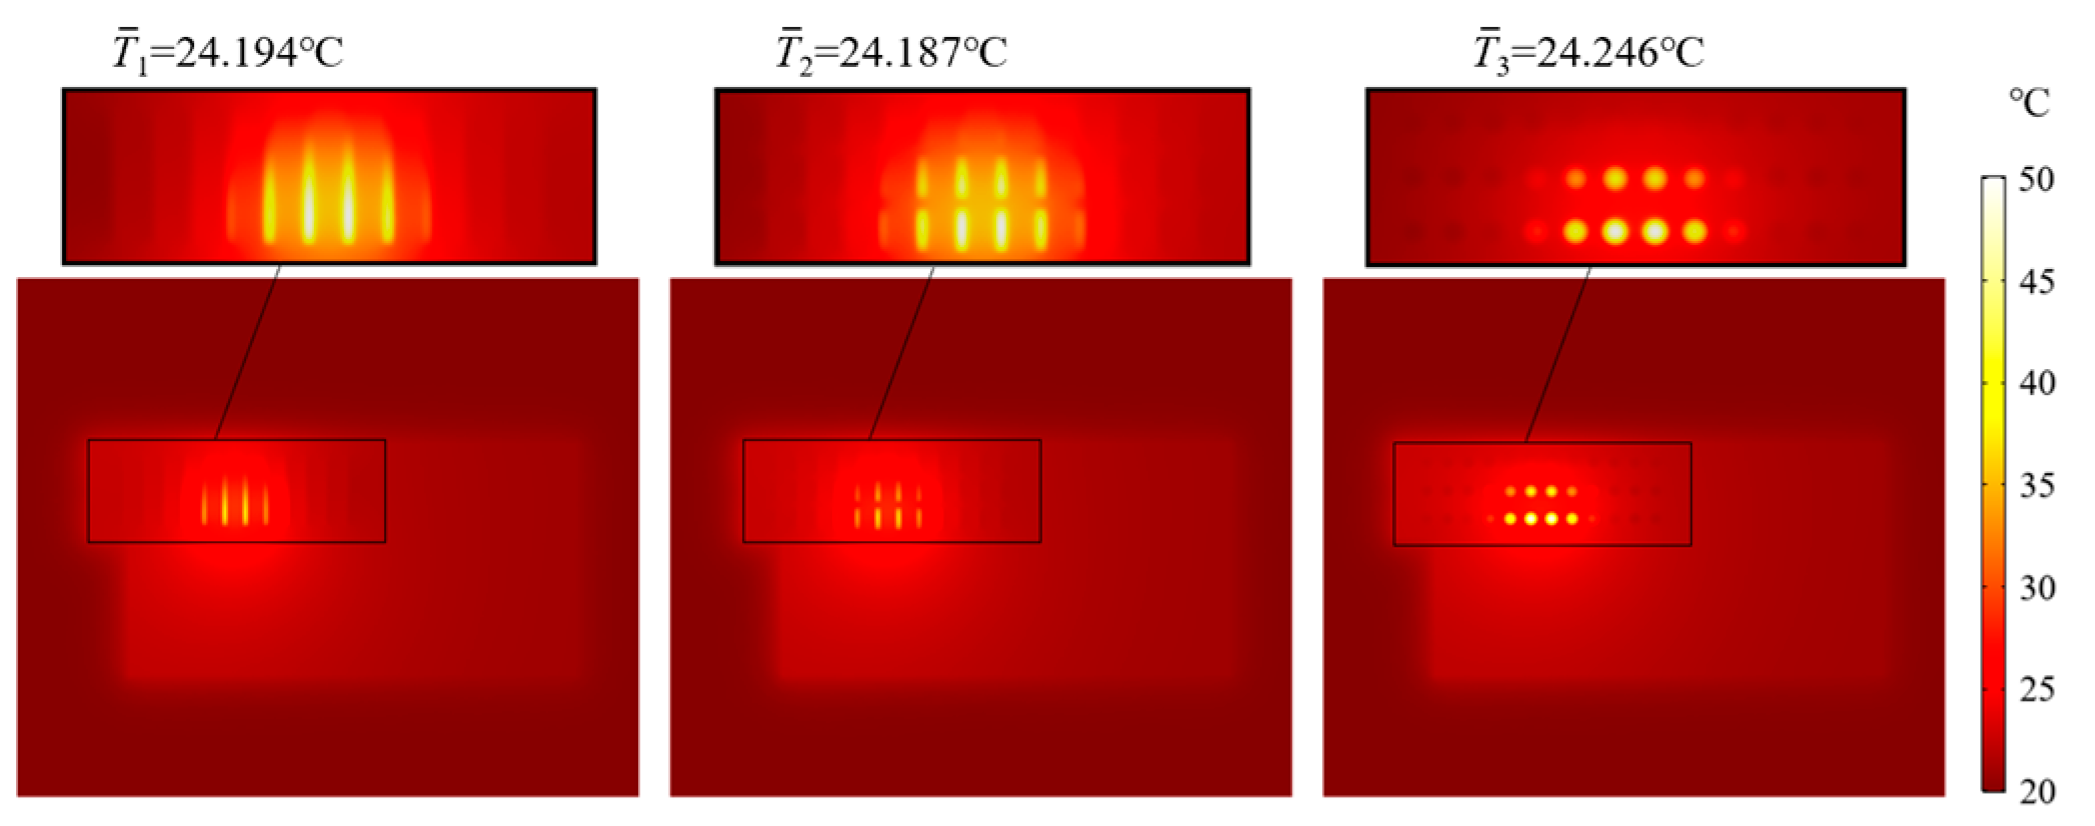
Then, the heat dissipation performance of three kinds of frequency converter models with heat dissipation holes was studied. The heat source in this study was the IGBT module with an additional structure such as the binding line simplified, which was simplified by replacing it with a rectangle of equal volume located inside the converter housing. The heating source was set to 10 W, and the cross-section of the heat dissipation hole was selected in the temperature-solving plane. Through the simulation of its steady-state temperature, the simulation results for the rectangular hole, the 3 × 12 rectangular hole array and the circular hole were obtained, as shown in
Figure 19. In order to compare the cross-section temperatures more clearly, the average temperature of each cross-section is listed at the top of the figure.
As can be seen from the temperature simulation results for the housing’s heat dissipation hole section in
Figure 19, the three kinds of heat dissipation holes all have good heat dissipation effects, and the heat mainly radiates outward along the lower heat dissipation holes. The average cross-section temperatures of the three kinds of heat dissipation holes are 24.194 °C, 24.187 °C and 24.246 °C. The relative error percentages between the average temperatures of the two improved heat dissipation holes and that of the traditional rectangular heat dissipation holes are 0.029% and 0.21%. It can be inferred that the steady-state average temperatures of the heat dissipation holes are basically the same.
In order to understand the heat dissipation process with different heat dissipation hole shapes in detail, the influence of three heat dissipation hole shapes on the heat dissipation process was compared. The change curves of the average junction temperature of the IGBT, the average cross-section temperature of the heat dissipation hole of the frequency converter shell and the average cross-section temperature 2 m outside the frequency converter were each measured over time. The initial temperature was room temperature, 20 °C, and the normal working time of the IGBT was 1000 s. The thermal power was 10 W, and after 1000 s, the IGBT stopped working and carried out natural heat dissipation. The total simulation time was 2000 s, and the change in the average junction temperature of the IGBT was monitored over time. The average temperature change curve of the heat dissipation hole section of the converter housing and the average temperature change curve of the section 2 m outside the converter are shown in
Figure 20.
It can be seen in
Figure 20a that the junction temperature of the IGBT shows a trend of periodic increase and decrease. It can be seen in
Figure 20b that when the temperature is rising, the average temperature of the shell interface of the circular heat dissipation hole is slightly higher than those of the other two types of heat dissipation holes, while when the temperature is steadily falling, the average temperature of the shell interface of the circular heat dissipation hole is slightly lower than those of the other two types heat dissipation holes. Similar temperature results can be obtained from
Figure 20c.
The heat dissipation capacity of the three kinds of heat dissipation holes is basically the same, so the electromagnetic radiation disturbance characteristics with the three kinds of heat dissipation holes can be further analyzed.
Field points 5 cm outside the ventilation holes on both sides of the frequency converter were taken, and the coordinates were (−197,−68,200), denoted as point A. Several typical frequency points were taken, and the moment method was used to calculate the radiation interference of the frequency converter.
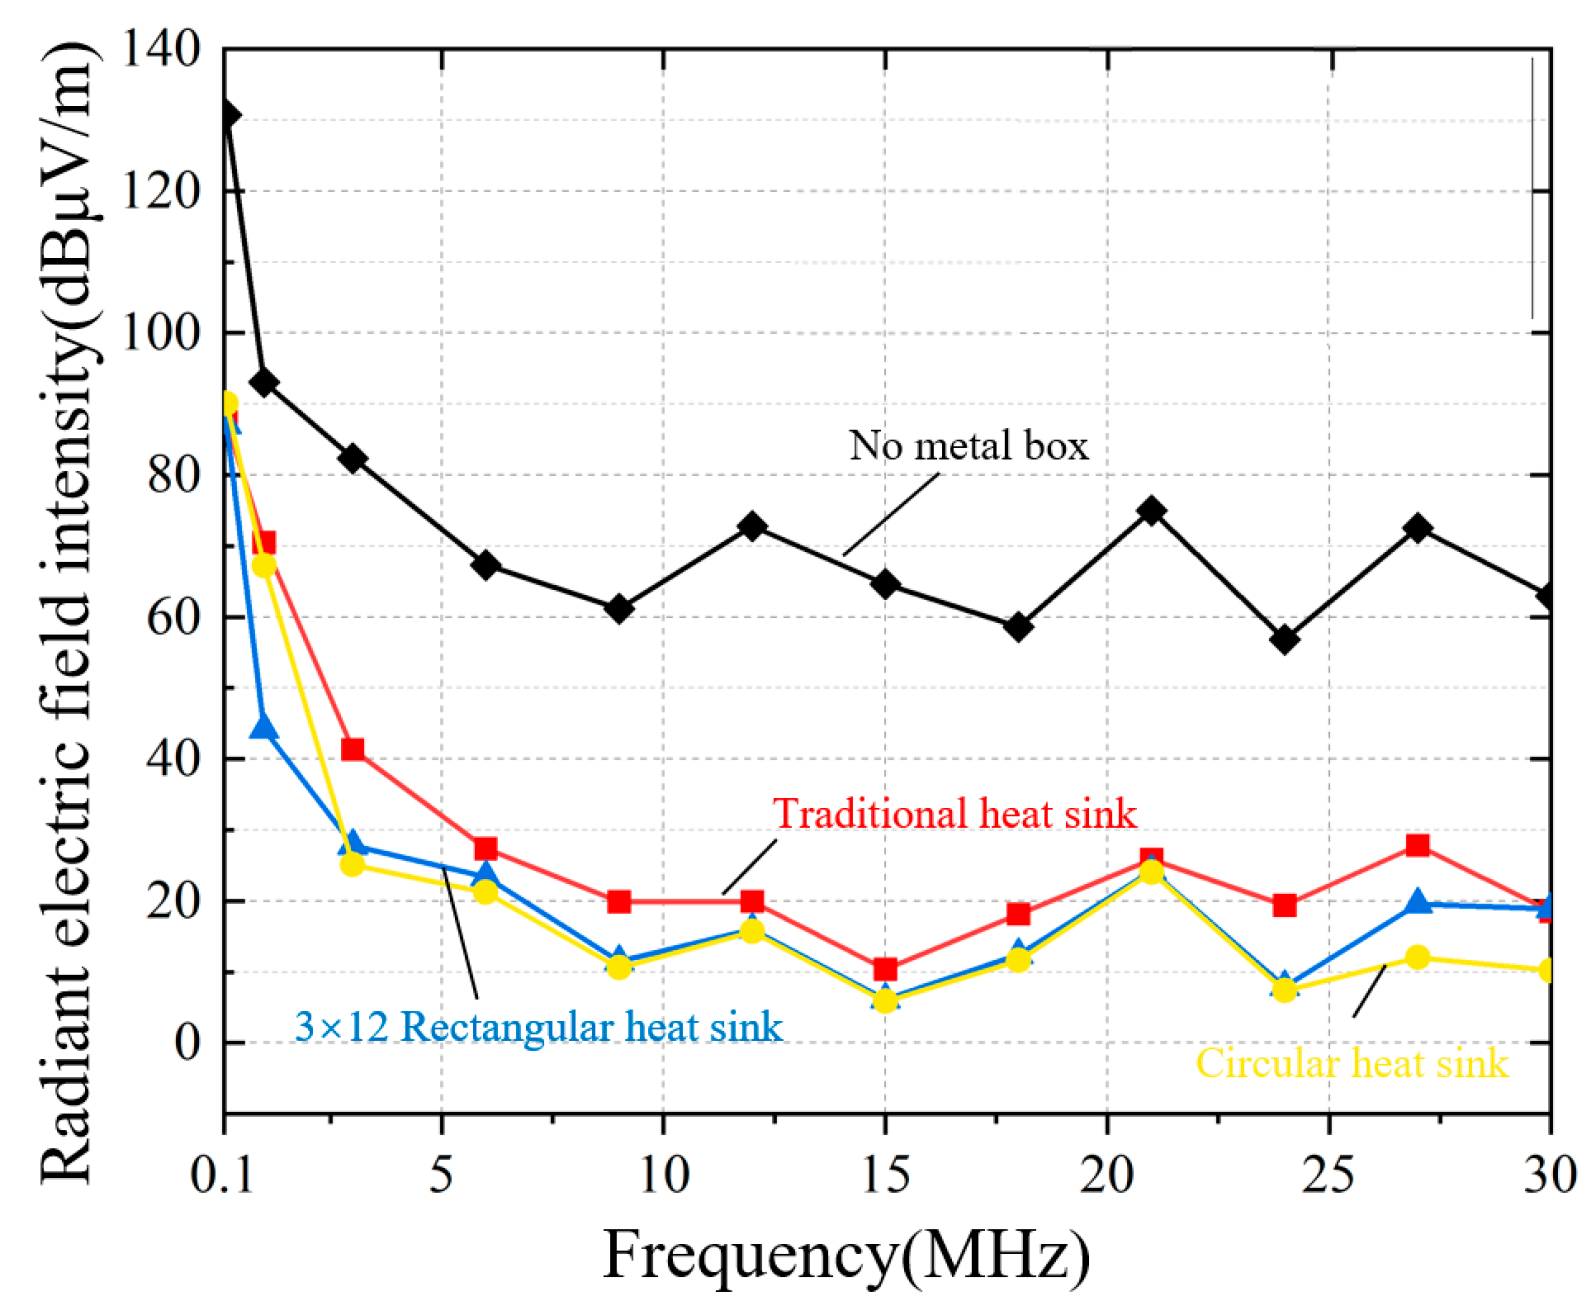
Table 1 shows the simulation results of the radiated electric field intensity at two points, A and B, without a metal shell or with three different types of heat dissipation holes.
According to
Figure 21 and
Table 1, compared with the housing with traditional rectangular heat dissipation holes, the housing with the 3 × 12 rectangular heat dissipation hole array can reduce the radiated electric field intensity by 10~40%, and that with the circular heat dissipation holes can reduce the radiated electric field intensity by 20~60%.
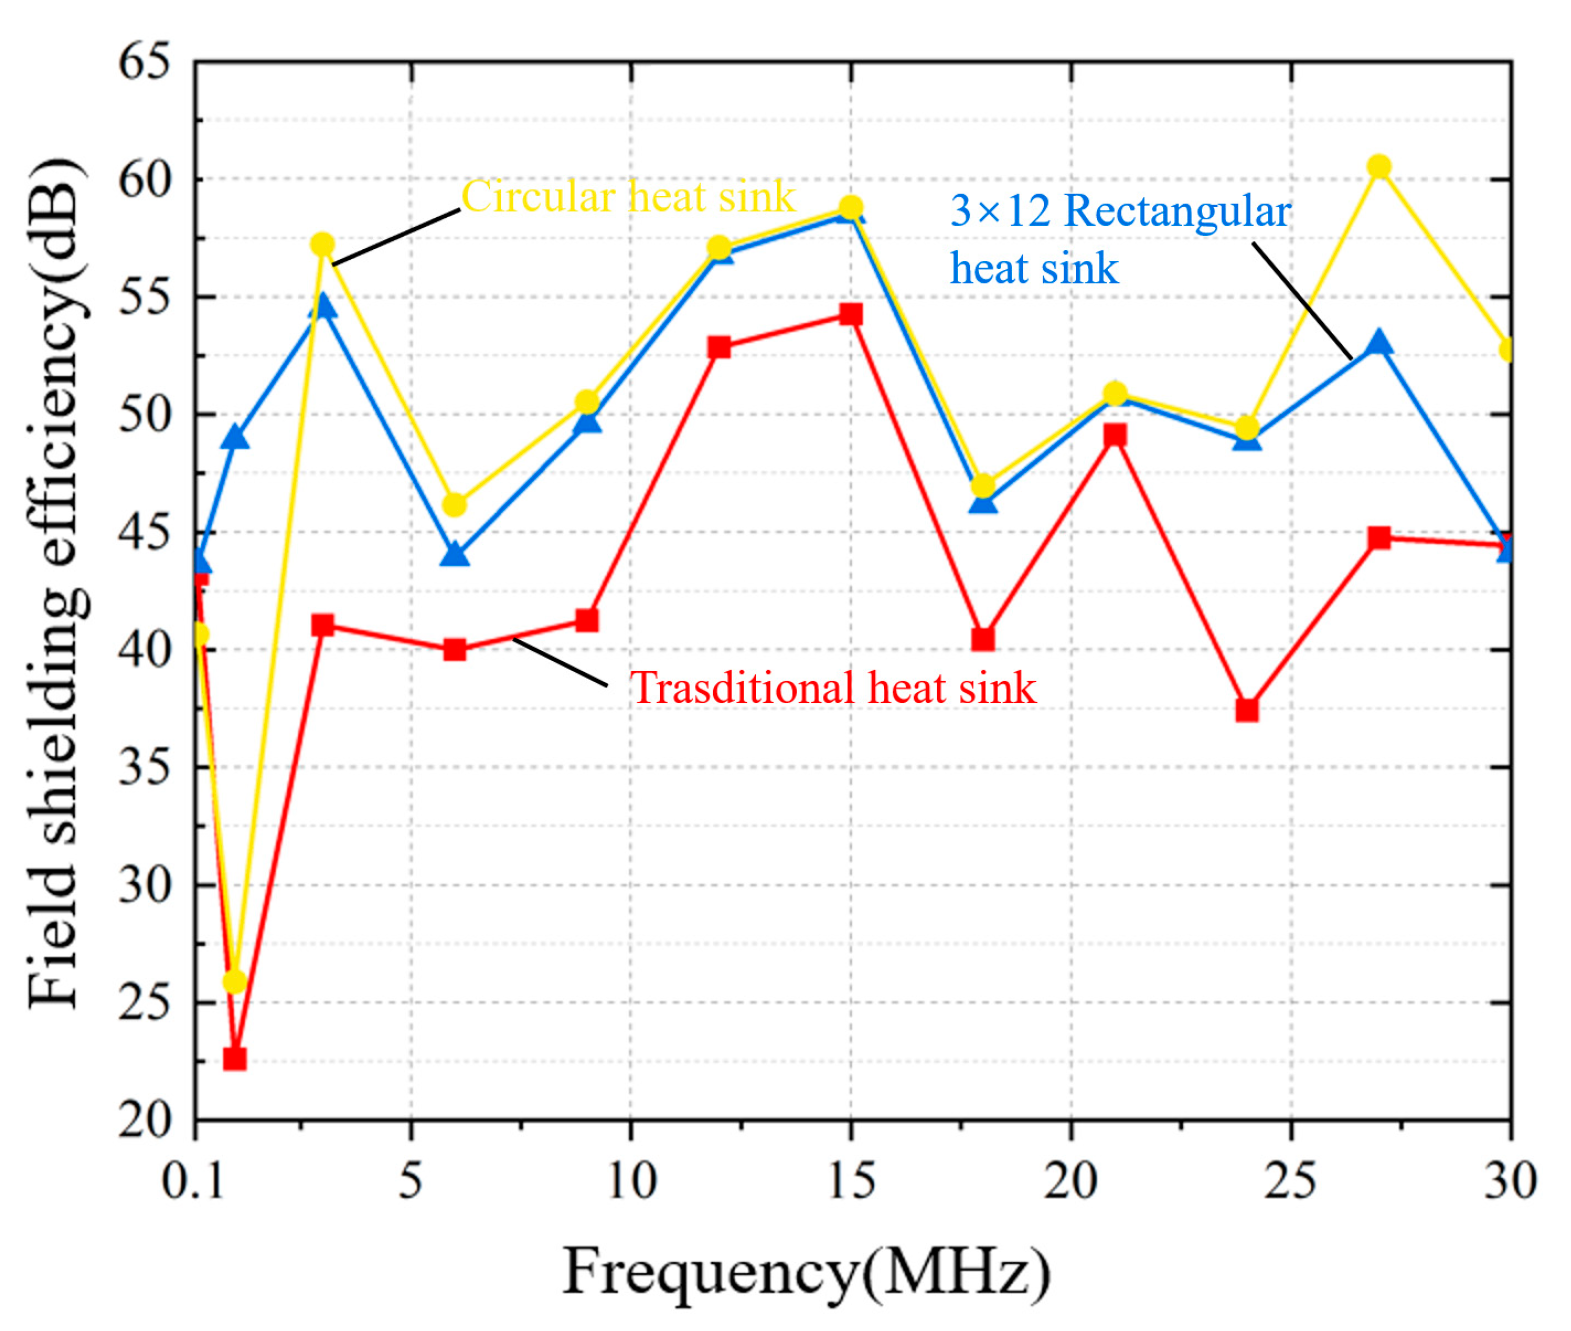
Then, the shielding efficiency was introduced to calculate the degree to which the converter’s shell attenuates electromagnetic waves. The equation for calculating the efficiency of electric field shielding is
In Equation (8),
is the field-shielding efficiency.
is the transmission coefficient, and its value is the ratio of the electric field strength in the presence of a shield to the electric field strength in the absence of a shield.
is the strength of the electric field without the shield, and
is the electric field strength in the presence of a shield. The shielding-efficiency comparison graph is shown in
Figure 22.
If the maximum aperture size is an integer multiple of a half-wavelength of the system, the electromagnetic wave energy radiated from the aperture reaches the maximum, so the maximum aperture size of the shield box should be less than /10~/100. For the suppression of electromagnetic radiation interference from the frequency converter, in addition to keeping the holes away from the source of radiation disturbance, we can improve the design of the heat dissipation holes in the housing using the following two methods: one is to avoid the use of large holes as far as possible and use a hole array instead; the second is to shorten the length-to-width ratio of the rectangular hole or to minimize the use of the rectangular hole, possibly by replacing the rectangular vent with a circular vent, which can reduce the electromagnetic disturbance of the converter in the mine environment by approximately 21%.

