1. Introduction
The escalating demand for primary energy is driven by global population growth and socioeconomic development, which can be regarded as directly correlated with a country’s economic progress. In fact, the research conducted by Vogel et al. [
1] demonstrates this correlation through data from over one hundred countries where economic expansion and extractive activities, including fossil fuel extraction, are associated with increased energy needs. Over the last five decades, worldwide energy consumption has surged by more than 200% [
2], consequently elevating greenhouse gas (GHG) emissions and intensifying global warming effects [
3]. Recent records show that the average global temperature reached an all-time high in November 2023 [
4], alongside rising fossil fuel consumption across all sectors, further worsening GHG emissions and their global warming impacts [
3,
5]. These developments have stimulated international efforts such as the Paris Agreement [
6], which was endorsed by 196 countries with the goal to limit global warming below 2 °C relative to pre-industrial levels. Despite these efforts, challenges in reducing GHG emissions persist, threatening the attainment of this target [
7]. Recorded climate anomalies and extreme environmental events underscore the urgent need for sustainable solutions, prompting a global shift towards renewable energy sources as a long-term strategy to mitigate climate change impacts [
8].
On top of that, a recent global energy crisis has been driven by disruptions in the supply chain and soaring energy prices, exacerbated by the post-COVID-19 economic recovery and the beginning of the Russia/Ukraine war in February 2022 [
9]. This led to a significant increase in energy prices compared to pre-pandemic levels and an increase in coal consumption [
9,
10]. The European Union (EU) responded to a reduction in Russian gas supply with a strategy outlined in a report [
10] that includes enhancing energy efficiency in industries and buildings and accelerating the deployment of renewable energy. The EU has established intermediate deadlines to achieve carbon neutrality by 2050, such as the EU 2030 target plan [
11], which outlines ambitious and cost-effective measures, besides fostering job creation in green sectors. A crucial component of this plan is the “Fit for 55” package [
12], aiming to reduce GHG emissions by at least 55% from 1990 levels by 2030. The mentioned package details how the EU climate goals will be translated into actionable legislation, affecting key aspects such as energy efficiency, building performance, and the deployment of renewable energy sources [
12].
The discussed scenario underscores the critical need for spending less primary energy and the widespread adoption of renewable energy sources. Energy communities (ECs) have emerged as a significant strategy within the scientific discourse for enhancing energy efficiency across various building types and incorporating diverse renewable energy technologies [
13,
14,
15,
16,
17,
18]. As defined by the EU [
19], ECs strengthen the sustainability and resilience of distributed energy systems (DES) by promoting shared energy production, distribution, and management through the use of polygeneration technologies, including solar panels, cogeneration units, and thermal energy storage (TES). Consequently, ECs offer a promising pathway to reduce greenhouse gas (GHG) emissions and elevate energy efficiency within the building sector.
Polygeneration systems are critically valuable in such a context since they have the potential of enhancing the energy performance of buildings, as evidenced by their significant role in the integration of energy processes [
18,
20,
21,
22,
23]. These systems are designed to effectively manage and optimize multiple energy conversion processes within a cohesive framework. Thus, the primary goal of polygeneration systems is to concurrently generate diverse forms of energy (such as electricity, heat, and cooling) typically from a single energy source. This method of simultaneous production is aimed at optimizing overall efficiency and improving the interactions between various energy streams. Through meticulous design and management of these technological interactions, polygeneration systems strive for a sustainable and economically efficient use of resources.
Various studies have explored the integration of polygeneration systems within energy communities (ECs) to enhance energy efficiency and increase the use of renewable energy sources. For instance, a previous study conducted by our research group [
18] investigated the integration of such systems in an EC consisting of nine tertiary sector buildings in a city in the northeast of Italy. The findings indicated not only reductions in overall costs and CO
2 emissions but also significant primary energy savings due to the implementation of a DHCN and peer-to-peer electricity sharing. This approach has significantly reduced the amount of electricity demanded from the main grid, taking advantage of cogenerated and peer-to-peer sharing electricity. A review of the literature, summarized in
Table 1, reveals that most studies on ECs did not include district heating and cooling networks (DHCN), peer-to-peer electricity sharing, or cooling energy storage. Only three studies [
18,
24,
25] considered the implementation of a DHCN. The work developed by Bartolini et al. [
25] provides an analysis of what they called a renewable energy community, where residential buildings are able to share heat and cooling through a set of pipelines, as well as electricity through a local electricity grid. However, the study lacks two important aspects: (i) no solar thermal technologies were considered, which prevents the systems from producing heating services from renewable sources, and (ii) the analysis was made based on a single-objective optimization, which makes it hard to analyze the solution(s) from other viewpoints (e.g., the environmental aspect), besides the economic one. Zeng et al. [
24] analyzed the optimization of a DHCN, but the only type of adopted technology was heat pumps, besides being a single-objective study. Liu et al. [
26] focused on different energy storage types and the utilization of solar and geothermal resources, excluding DHCN and peer-to-peer electricity sharing. Conversely, Vand et al. [
27], Dal Cin et al. [
28], and Herenčić et al. [
29] examined peer-to-peer electricity sharing, observing economic benefits, though they did not incorporate a DHCN. The only work that considered the adoption of heating and cooling storages simultaneously (besides our previous work [
18]) was the one developed by Pinto et al. [
23]. However, they did not incorporate DHCN technologies, peer-to-peer electricity sharing, or a multi-objective optimization. Furthermore, studies by Buoro et al. [
30], Haikarainen et al. [
31], Delangle et al. [
32], and Lamaison et al. [
33] concentrated on the deployment of polygeneration systems with an emphasis on designing and managing DHCNs, without considering peer-to-peer electricity sharing. Lastly, although the work conducted by Piacentino et al. [
34] adopted most of the technologies implemented by and used the same methodology used by this present work, their study lacks most of the main features highlighted for this present work including a multi-objective optimization, DHCN, cooling storage, peer-to-peer electricity sharing, and the consideration of renewable energy sources.
The depicted literature shows the attention that the EU has paid to the development of directives and plans in the direction of net GHG emissions reductions and energy transition by the middle of this century. Such directives and plans revolve around key aspects regarding the EU climate goals, including energy supply systems efficiency and buildings performance enhancement. The state-of-the-art presented in this introduction shows the interest of the scientific community in presenting solutions that optimally integrate polygeneration systems into energy communities in order to achieve not only lower costs and lower GHG emissions, but also lower levels of primary energy consumption. However, to the best of the authors’ knowledge, no work has analyzed the abovementioned integration from a multi-objective optimization point of view and dealt, at the same time, with key aspects such as DHCN implementation, heat and cooling storage, peer-to-peer energy sharing among EC members, solar energy as the renewable source, and detailed description of the MILP model and input data. Therefore, the contributions and novelties from the research developed within this present work are:
Optimization of an EC dealing, at the same time, with a district heating and cooling network (DHCN) of pipelines connecting the buildings, a central unit to support the buildings, thermal and cooling storage, management, and distribution of self-produced and purchased electricity among the buildings and between the EC and the national electric grid, integration of solar technologies, hourly electricity purchase price, hourly electricity selling price, and hourly CO2 emissions factors.
Single-objective optimization detailing the optimal energy supply system structure of each building, DHCN pipelines, and central unit, plus the optimal technologies operation with all annual energy flows within the building, through pipelines, and within the central unit.
Multi-objective optimization presenting a range of trade-off solutions through which it is possible to have important pieces of information about installed capacities, structure for the DHCN pipelines, total annual costs and CO2 emissions, cost of moving from one solution to another, and cost of choosing a more environmentally friendly solution.
Presentation of an effective tool to optimally design and operate polygeneration systems integrated to ECs, which can be easily adapted to different case studies, such as the residential–commercial buildings sector, as well as the industrial sector.
This paper is organized according to the following structure:
Section 2 presents the superstructure for the entire EC and for each building;
Section 3 provides the input data regarding energy demands, adopted technologies, as well as economic and environmental aspects; the mathematical model is provided through
Section 4, with the support of the
Supplementary Material; the results and discussions are presented in
Section 5, where the single- and multi-objective optimization solutions are explained in detail;
Section 6 offers the conclusions of the work; and, finally,
Appendix A presents some extra results regarding the single-objective optimization from the economic perspective.
2. Energy Community Superstructure
In the initial synthesis stage, defining the energy supply system’s superstructure is fundamental. This superstructure comprises possible technologies and their interconnections, personalized to meet the due energy demand. Then, after the optimization process, the superstructure is updated to an optimal form containing the layout of the optimized energy supply system consisting of the pieces of installed equipment (model, size, and number of pieces) as well as their interconnections. Accordingly, specific conditions should be defined in order to express the boundaries of the case study analyzed in this work. Such conditions comprise not only the energy demand profiles of each building, but also the locally available energy resources. With such pieces of information, the technologies can be selected according to optimal interactions between them. This will determine the proper fulfillment of the energy demands.
In order to better understand the superstructure of the entire EC under analysis, it should be divided into two main parts: (i) the EC superstructure, i.e., an overview of the EC superstructure showing all the EC buildings and the possible energy interconnections among them, and (ii) the superstructure of a given building (EC member).
2.1. Overview of the EC Superstructure
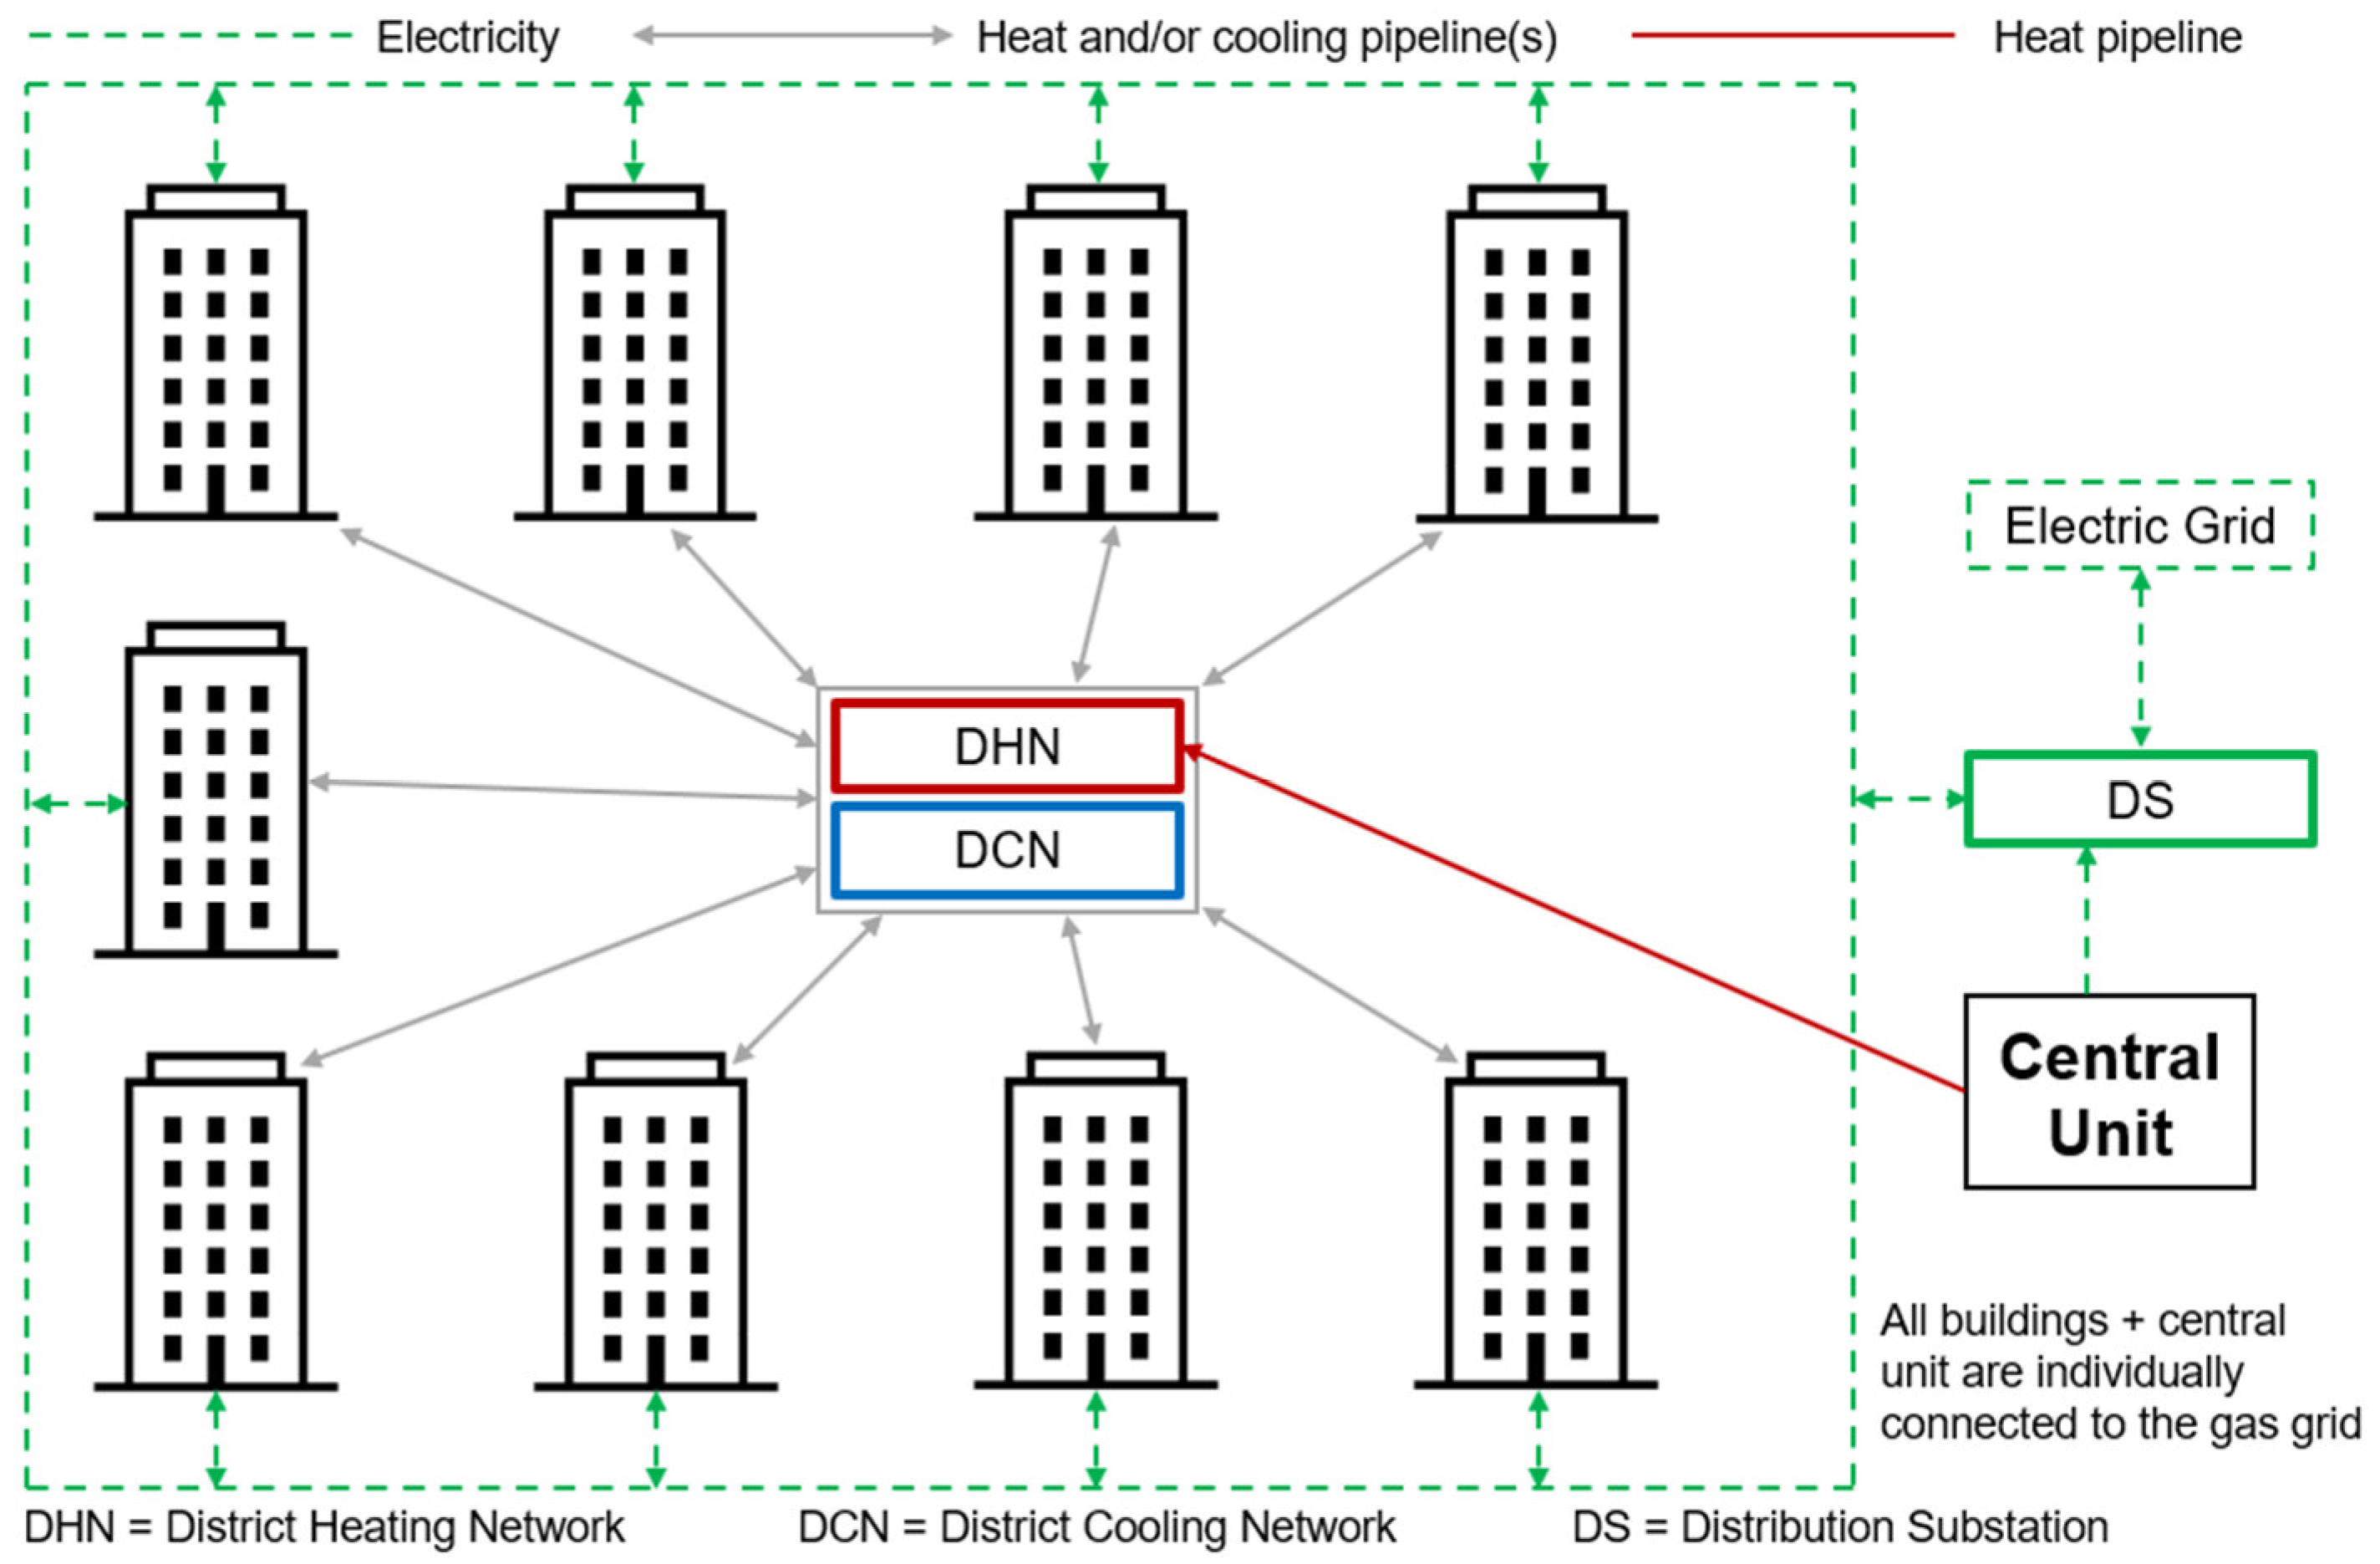
The EC superstructure is depicted in
Figure 1. As observed, this representation is intended to illustrate all possible connections between the buildings in terms of heating, cooling, and electricity. When it comes to heating and cooling, the buildings can connect to each other through the district heating network (DHN) and the district cooling network (DCN). The central unit is also connected to the EC through a heating pipeline (there is no cooling produced in the central unit). An observation should be made at this point that a given building cannot possibly connect to all the other buildings, due to physical distance constraints.
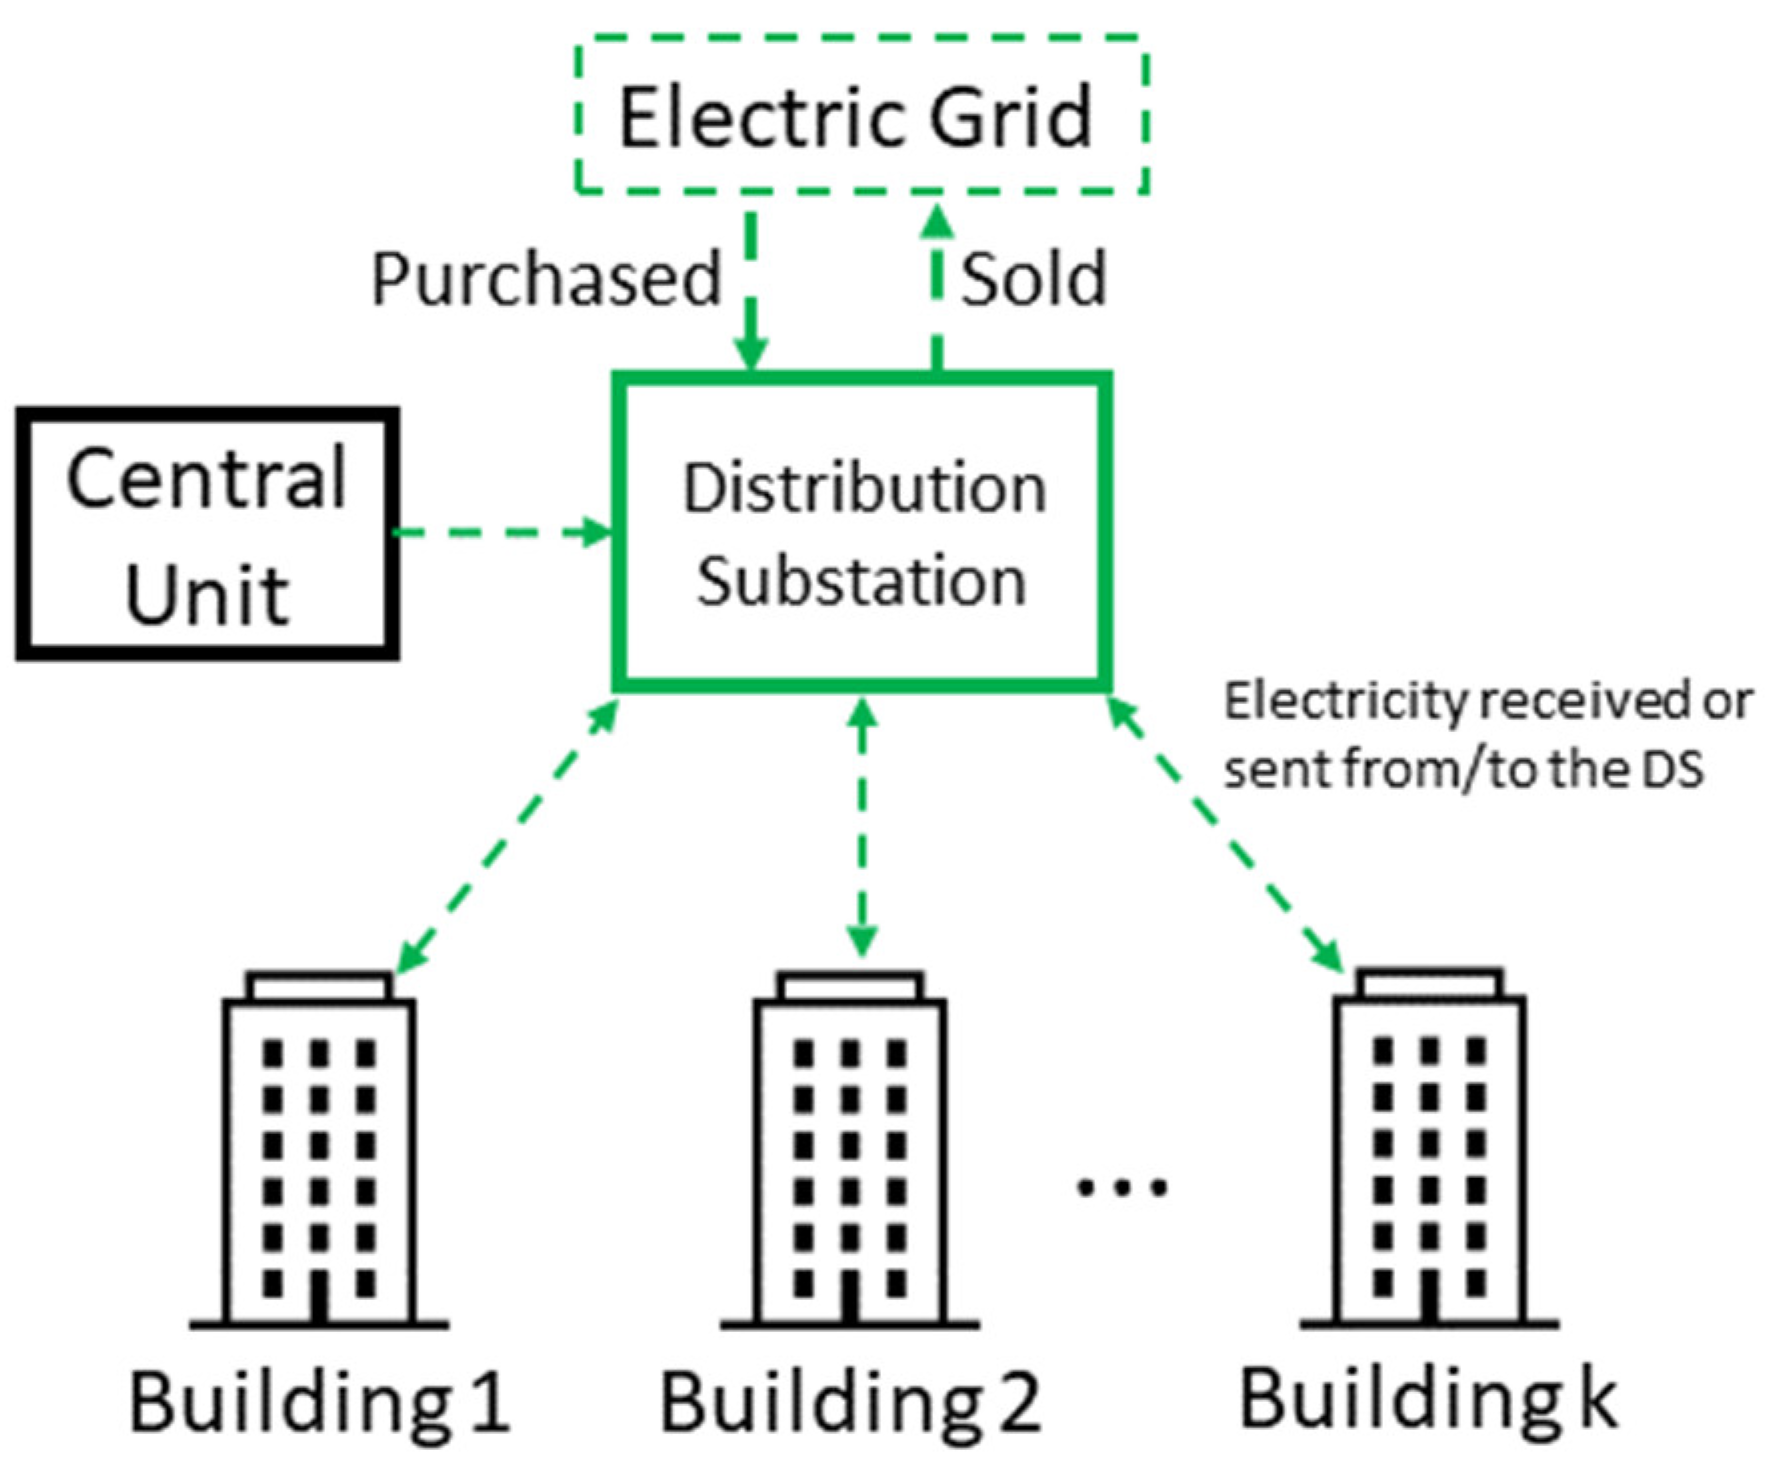
Regarding the electricity connections, the EC is designed to concentrate the communication with the national electric grid through a distribution substation (DS). This means that the buildings are not directly connected to the national electric grid. Instead, the buildings are connected to the DS which has the role of managing the electricity balance among the buildings and between the EC and the national electric grid.
The DS electricity balance management is one of the main details of the EC superstructure.
Figure 2 illustrates the main idea behind the DS balance management. As mentioned before, the buildings are not directly connected to the national electric grid. Instead, they are connected to the DS. Such connection is set to function in both directions (not at the same time), i.e., depending on the obtained solution, a given building will be: (i) sending electricity to the DS at some hours of the year (self-production surplus), (ii) receiving electricity from the DS at some other hours of the year (self-production deficit), or (iii) neither receiving nor sending electricity from/to the DS at some other hours of the year (self-production is equal to the electricity demand at these hours). The central unit does not have an electricity demand. For this reason, all produced electricity would be sent to the DS. Then, in agreement with the objective function of the EC model, the DS will (i) purchase (or not) the necessary amount of electricity from the national electric grid, or (ii) sell (or not) the total surplus of self-produced electricity by the entire EC, after having satisfied the electricity demand of each building.
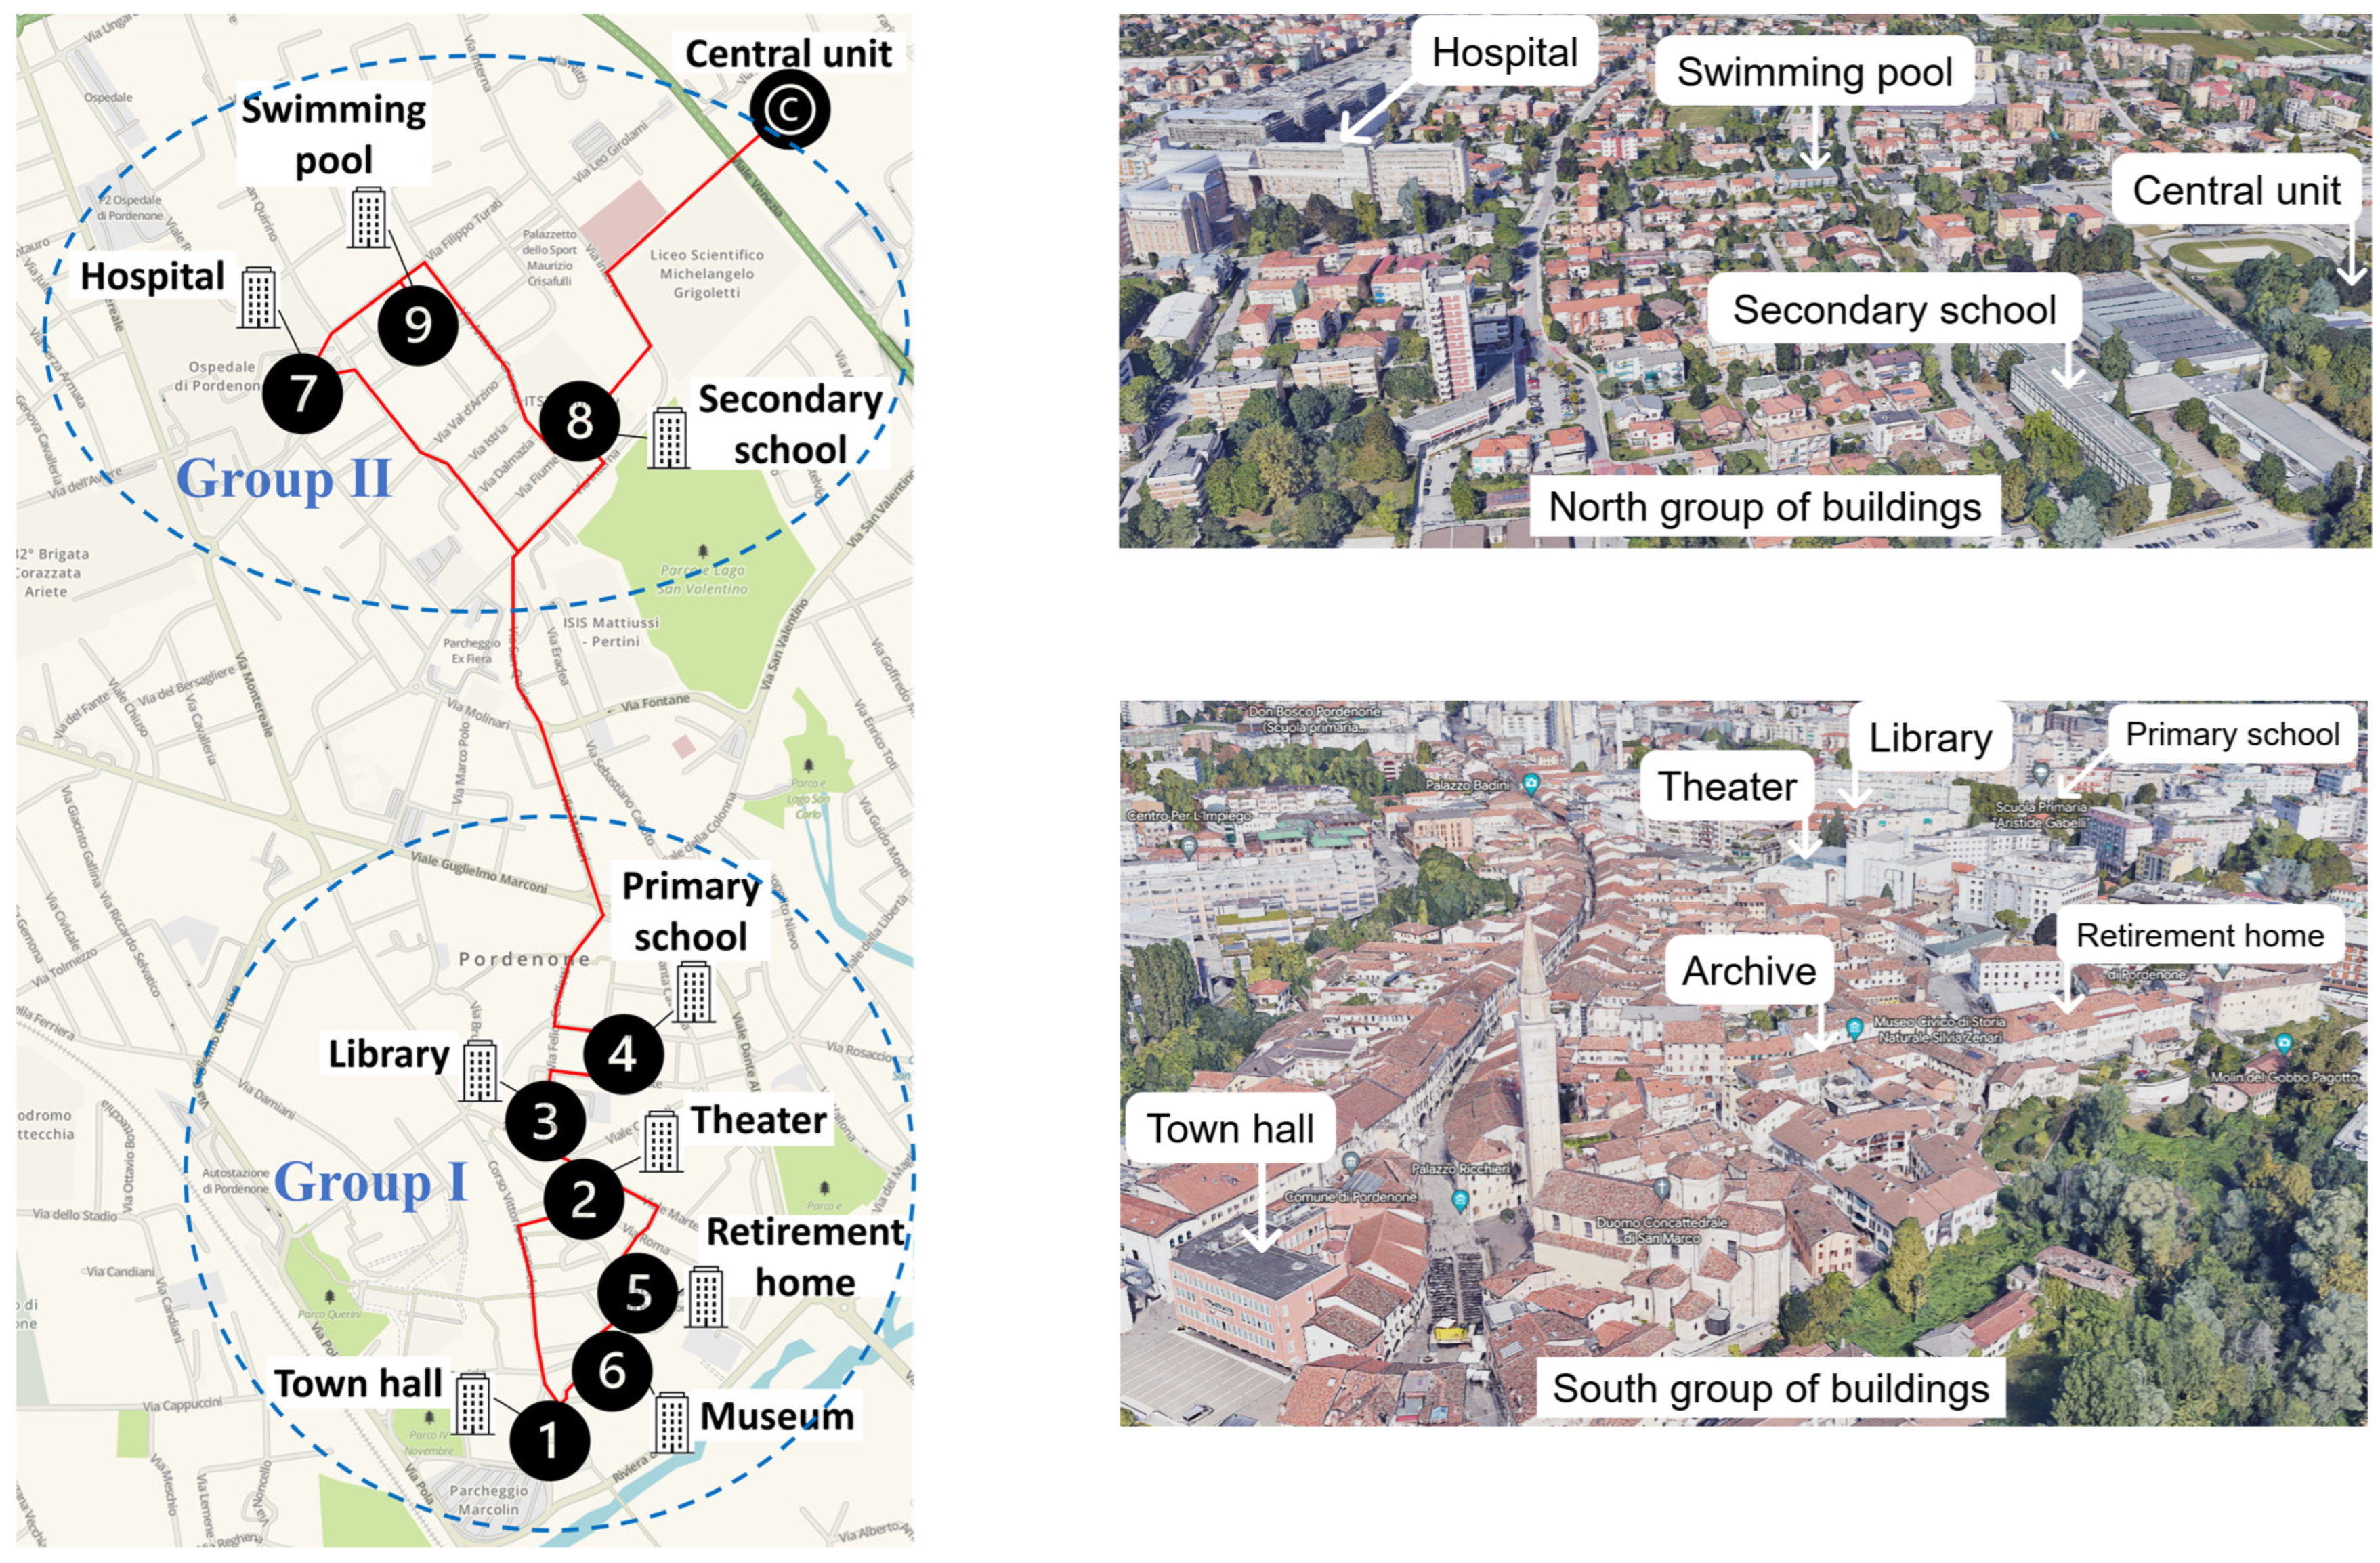
Figure 3 provides the actual location of each EC building and the possible DHCN connections.
2.2. Building and Central Unit
The superstructure of a given building is presented in
Figure 4. This figure can be thought of as a “zoom-in” of a given building of
Figure 1. For the better understanding of the reader, the analysis of
Figure 4 can be focused on the five main details specified in the figure itself: (i) the building k superstructure, i.e., all the pieces of equipment (components) that could be installed in a given building k; (ii) the central unit superstructure; (iii) the three possible ways of connecting the buildings in terms of electricity, heating, and cooling, that is, DS, DHN, and DCN; (iv) all the other EC buildings but k, i.e., the representation of the other EC buildings; and (v) the available energy resources.
2.2.1. Building k Superstructure
The building k superstructure comprises the following technologies.
Solar technologies: photovoltaic and flat-plate solar thermal panels (PV and ST).
Natural gas cogeneration units: micro gas turbine (MGT) and internal combustion engine (ICE).
Natural gas auxiliary boiler (BOI).
Cooling technologies: single-effect absorption chiller (ABS) and compression chiller (CC).
Heat pump (HP).
Thermal energy storage: hot water storage (HST) and chilled water storage (CST).
The heating can be produced by natural gas-fed technologies (MGT, ICE, and BOI), solar irradiation-driven technology (ST), and/or electricity-driven technology (HP)—when working in heat mode. In particular, the electricity for the HP can be from the cogeneration units, PV, or electric grid. Then, after the balance of the produced heat between these five technologies (at a given hour) and the building heat demand (at the same hour), the system will have two options (in the case of a heat surplus): (i) store it in the HST, and/or (ii) send it to another building through the DHN. In the case of a heat deficit, the building will need to receive heat from another building.
Electricity surplus can be derived from the cogeneration units, PV panels, other buildings, and/or electric grid. At this point it is important to highlight that the EC model separates the building electricity demand from the CC and HP electricity demands. After balancing the electricity, the building can (i) send the surplus to the DS, (ii) require electricity from the DS, in the case of a deficit, or (iii) neither send nor require electricity to/from the DS (self-sufficiency).
The cooling demand can be provided by the ABS, CC, and/or HP (working under cooling mode). The ABS is allowed to be fed only by heat from the cogeneration units and/or ST. Then, in a way analogous to the heat production, after the balance of the produced cooling between these three technologies (at a given hour) and the building cooling demand (at the same hour), the system will have two options (in the case of a cooling surplus): (i) store it in the CST, and/or (ii) send it to another building through the DCN. In the case of a cooling deficit, the building will need to receive cooling from another building.
2.2.2. Central Unit Superstructure
As observed in
Figure 4, the available technologies for the central unit are:
Natural gas auxiliary boiler (BOIc).
Natural gas internal combustion engine (ICEc).
Seasonal hot water storage (HSTc).
Flat-plate solar thermal field (STc).
The natural gas powered ICEc is intended to send electricity to the DS (if needed) and the cogenerated heat can be stored or sent to the DHN. The BOIc can support the EC heat demand in the case of no installed ICEc (or if it is off at the time) or during the night. The HSTc is able to store a great amount of heat and the solar thermal field (STc) allows the EC to increase its percentage of renewable energy sources. The heat produced by the central unit is then sent to the EC buildings, which have the opportunity to produce less heat from natural gas.
2.2.3. DS, DHN, and DCN
As already mentioned, the distribution substation, district heating network, and district cooling network provide all EC buildings with the opportunity to share the three demanded utilities, namely electricity, heat, and cooling. In this way, the EC model is allowed to search for favorable solutions by producing the needed utility where its production will be more advantageous for the EC, according to the objective function.
2.2.4. Representation of the Other EC Buildings
All the other EC buildings, depicted in
Figure 4, have the same superstructure of building k, i.e., available energy resource types, technologies, and DS, DHN, and DCN connections.
2.2.5. Available Energy Resources
Solar energy, natural gas, and electricity from the national electric grid.
3. Data Gathering
The data gathering phase is essentially composed by three categories: buildings, technologies, and general related data. This phase represents an initial step in which all the necessary input data for the development of the optimization model phase are searched, collected, evaluated, and organized. Since the MILP model requires linear equations only, the phase of data gathering should identify non-linear equations and perform the due linearization, which will approximate the non-linear behavior of the performance curve of some technologies to a linear one.
Therefore, this section is intended to describe the gathered input data that are used in the EC model. This section is organized as follows:
Section 3.1 gives a brief description of the buildings, while
Section 3.2 provides the energy demands for each building. The technical data of the technologies considered for the building superstructure are presented in
Section 3.3.
Section 3.4 presents the economic data for both technologies and energy resources, and, lastly,
Section 3.5 specifies the adopted environmental data.
3.1. Set of Buildings
The EC comprises nine buildings, which can be divided into two groups (
Figure 3): (i) the south group, composed of the town hall, theater, library, primary school, retirement home, and museum; and (ii) the north group, comprising the hospital, secondary school, swimming pool, and central unit. Depending on the found solution, these two groups might be interconnected through the DHCN or not. Differently from residential buildings, the buildings under analysis are characterized by very different energy demand profiles, as shown in the next section.
3.2. Energy Demands
When it comes to energy supply systems optimization for buildings, the energy demand profile is one of the most important pieces of information regarding the building. This information determines the technology that the model should install, the capacity it should have, and the operational strategy according to the hourly energy demand profile. For the specific case of the EC and bearing in mind the energy demand profiles of each building, the DHCN connections between buildings, and the objective function under analysis, at some hours the optimizer might find more interesting solutions where the energy production takes place in a different building.
The energy demands of the buildings consist of electricity, heating, and cooling, as detailed below.
The heat demand is intended to comprise sanitary hot water (SHW) and space heating (SH). However, due to the lack of more detailed data, the heat demand of the building is composed by one hourly values corresponding to the composition of SHW plus SH. Moreover, the heat demanded by the ABS is not included in the heat demand of the building; instead, the ABS heat demand depends on the optimal solution of the MILP model.
The electricity demand of each building is composed of (i) consumption due to electricity-driven equipment, lighting, etc., which is an input of the model, and (ii) consumption of CC and HP (if installed), which is calculated by the optimal solution of the MILP model.
For what concerns the cooling demand, there are three main aspects to bear in mind: (i) the majority of the cooling demand of the EC buildings is concentrated from June to August (as is the case for cooling demand profiles of buildings located in the Northern Hemisphere), (ii) not all the buildings have cooling demand during the mentioned months (e.g., the schools and swimming pool), and (iii) the hospital maintains a cooling demand level even in the cold months due to specific equipment and procedures.
The EC model was developed to cover a period of one year represented by 24 typical days for each building. Such a group of typical days is composed by two typical days (with hourly resolution) per month representing one working day (Monday to Friday) and one non-working day (Saturday and Sunday). Since the EC under study is composed by tertiary sector buildings, the following assumptions were adopted regarding their energy demand profiles: (i) working days have the same-order-of-magnitude energy demands, and (ii) the same logic for non-working days. Therefore, two energy demand profiles were considered (per building and per month): one representing all working days and another one representing all non-working days. Then, the model transforms, for each month, the two typical days into four weeks of five working days and two non-working days. Thus, each month comprises 28 days and the whole year is composed of 8064 h, instead of 8760 h.
The model is based on 24 typical days for all variables, except for the ones related to the thermal energy storages—TES (heat and cooling). Therefore, these cannot be based on the typical days. This is because every single day of the year needs to be connected to each other in order to properly represent the energy flows in and out of the TES, i.e., the charging and discharging phases.
The energy demand for the typical days and for each building was defined based on: (i) search in the literature, technical reports, etc., (ii) from pieces of information found on webpages related to the respective buildings, and (iii) direct contact with the building administration. The
Supplementary Material (Section S1) provides a detailed description of the procedure for obtaining the buildings’ energy demands.
Table 2 presents the total annual energy demands for each building individually, as well as the peak demand. The values are the summation of the 8064 h considered for this study.
3.2.1. Electricity Demand
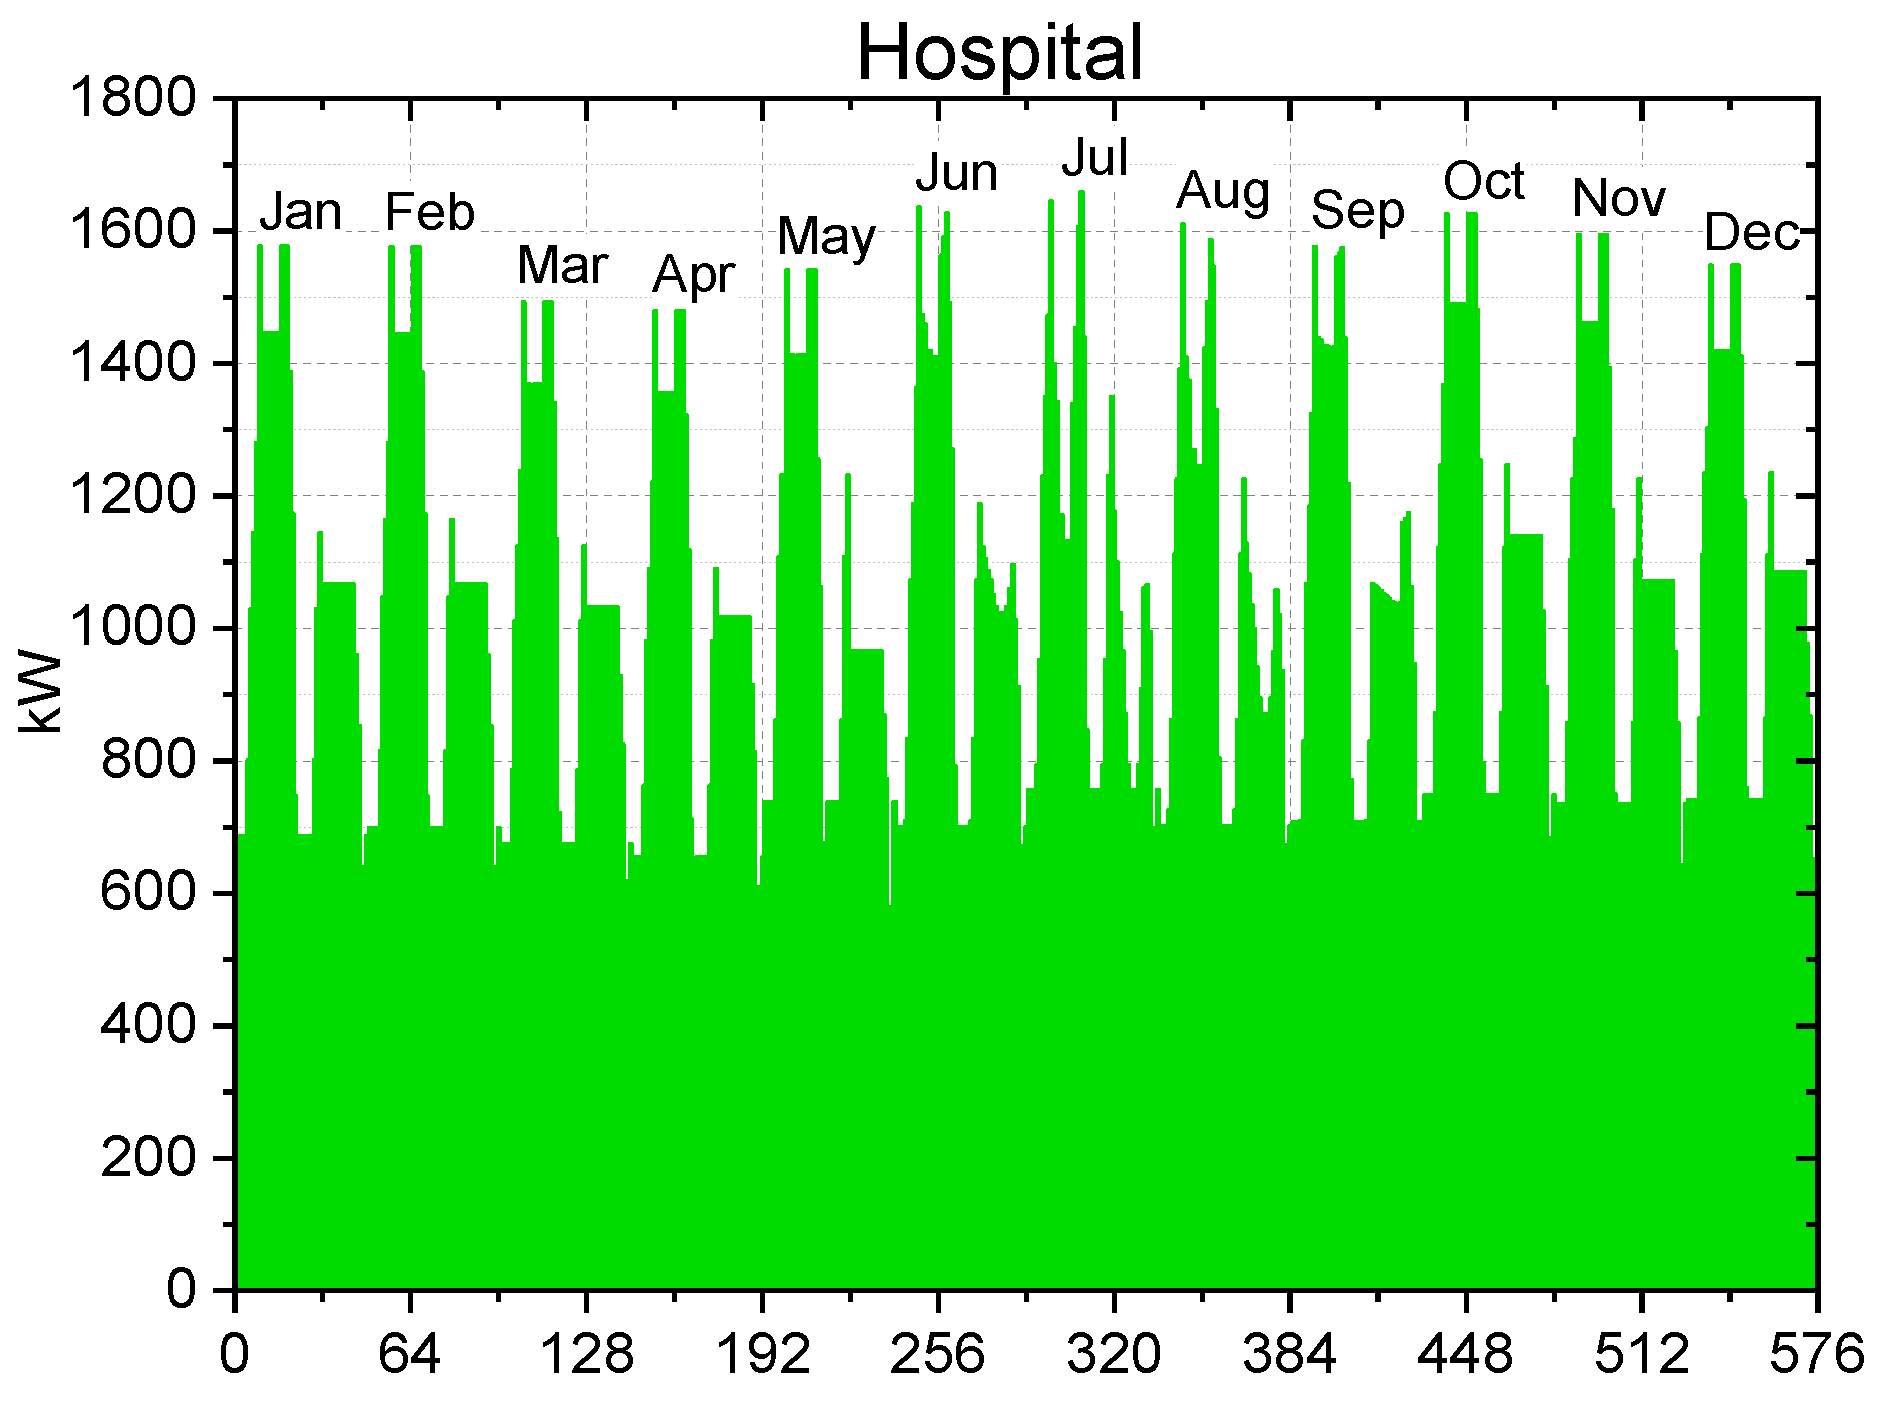
Figure 5 shows the hourly electricity demand for the hospital and for each typical day (the reader may find the electricity demand for all the other buildings in the
Supplementary Material, Section S1). The horizontal axis represents two 24 h typical days per month. As observed, electricity is demanded throughout the whole year, for the majority of the buildings. For some buildings such as the library, schools, and swimming pool, the electricity demand follows the occupancy levels, i.e., it is higher during the school year (from September to June). The theater and hospital have an approximately constant electricity demand throughout the year since their occupancy level does not depend on vacation or non-vacation periods. The town hall, retirement home, and museum are buildings that should operate during the entire year. For this reason, they also have electricity demand throughout the entire year, but with lower levels during the period of daylight-saving time.
3.2.2. Heating Demand
Figure 6 shows the hourly heating demand for the hospital and for each typical day (the heating demand for all the other buildings is also provided in the
Supplementary Material, Section S1). The horizontal axis represents two 24 h typical days per month. As can be seen, heating is demanded throughout the whole year, for most of the buildings, and the heating demand level follows the seasons of the year. It is worth remembering that the heating demand during summer represents the sanitary hot water (SHW) demand; also, during the cold months, the heating demand is higher due to the composition of SHW plus space heating (SH) demands. The retirement home and hospital are buildings with 24/7 heating demand during the cold months of the year. During the end of spring, summer, and the beginning of autumn the heating demand is due only to SHW.
3.2.3. Cooling Demand
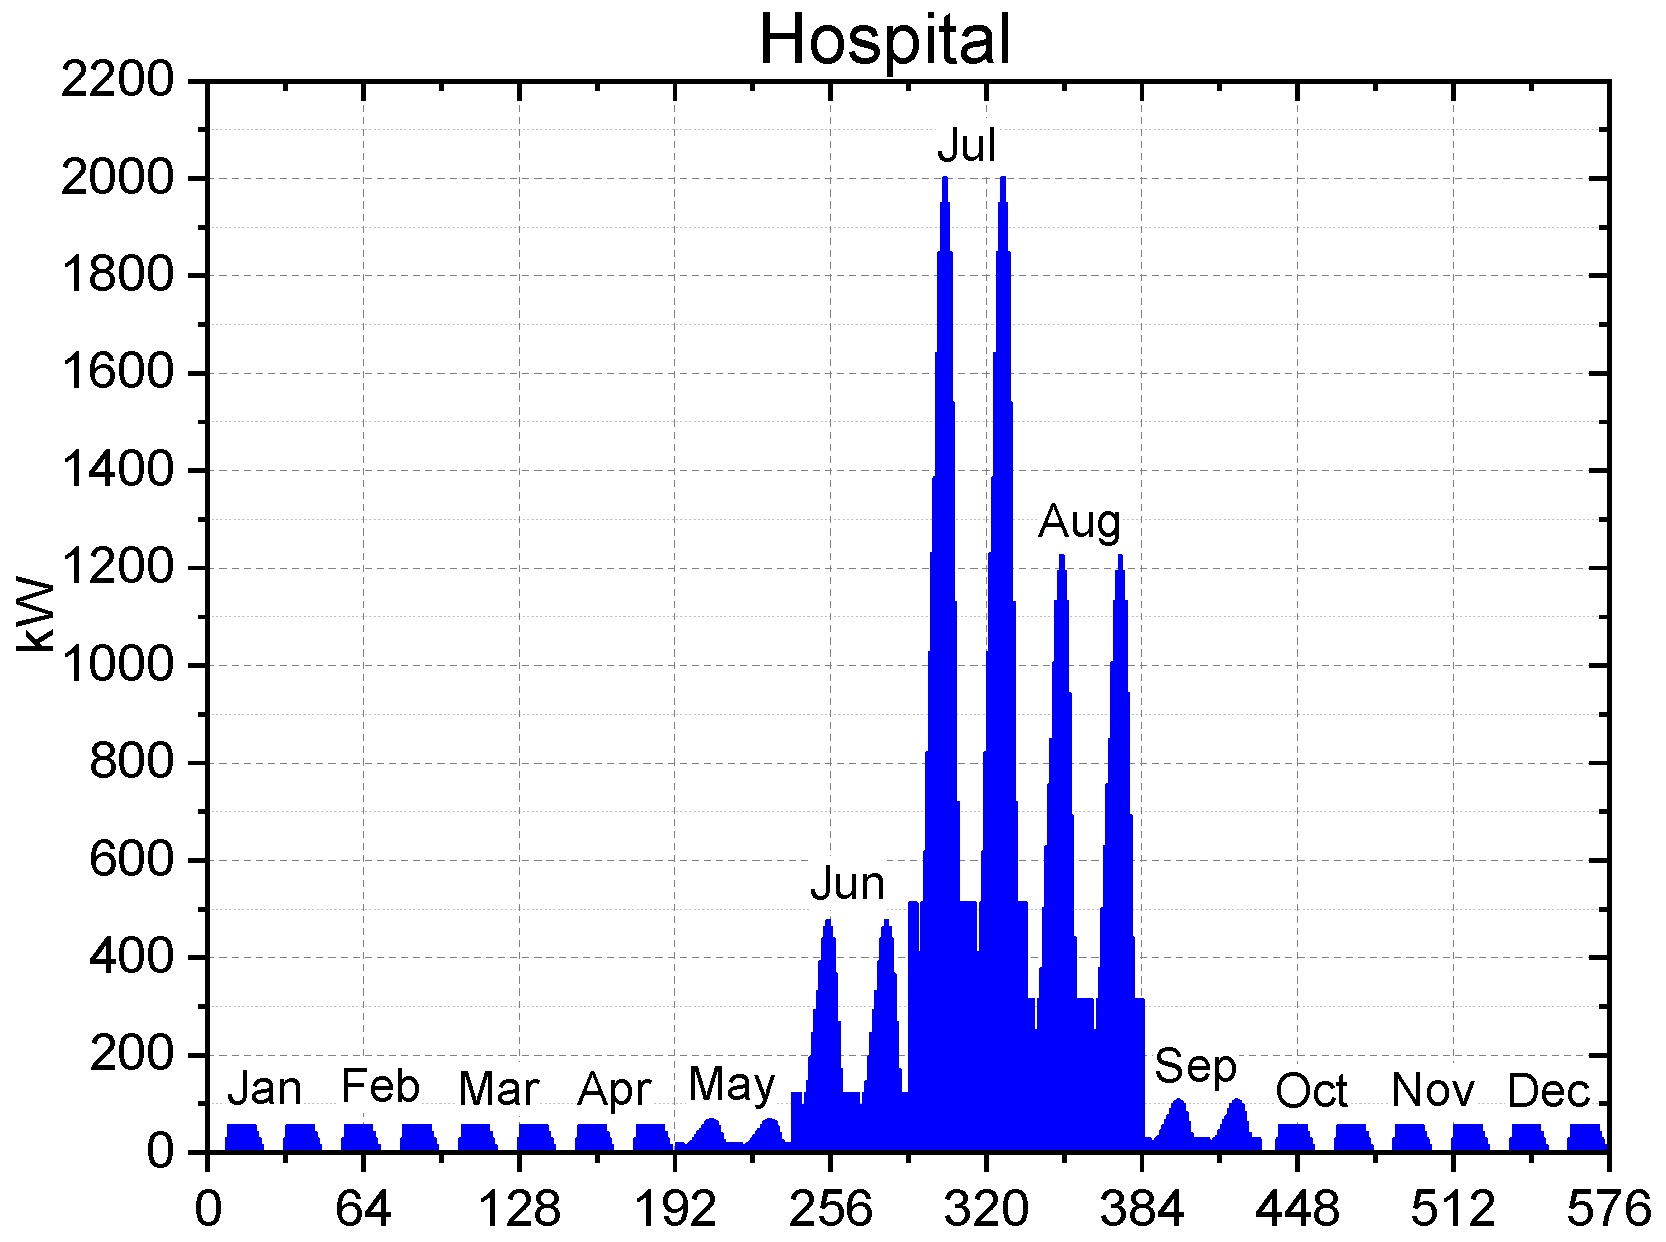
Figure 7 presents the hourly cooling demands for the hospital and for each typical day (the cooling demand for all the other buildings is also provided in the
Supplementary Material, Section S1). The horizontal axis represents two 24 h typical days per month. At a first glance, one can observe two main aspects from
Figure 7 (and also from
Figures S19–S27, in the Supplementary Material): (i) there are three buildings with no cooling demand, and (ii) one of the buildings has cooling demand even during the cold months. The buildings with no cooling demand are the schools and the swimming pool. Such buildings do not work during the hot months of the year (vacation period). Besides during the hot months, the hospital also demands cooling throughout the whole year due to specific procedures that are out of the scope of the present work.
3.3. Technical Related Data
The technical data of the technologies involved in the superstructure of each building plus the central unit are another very important set of input data to the EC model. Bearing in mind the fact that the EC model is based on a MILP algorithm and that all equations must be linear, the performance of all technologies must be expressed through linear equations. However, the performance of some technologies is described by intrinsically non-linear behavior. This is the case of the micro gas turbine (MGT), internal combustion engine (ICE), absorption chiller (ABS), and heat pump (HP). Therefore, the performance curves of these technologies were approximated to a linear behavior through linearization. This procedure as well as the obtained results are explained in more detail in the
Supplementary Material (Section S2). Besides the data regarding the installed technologies for each building, the data concerning the DHCN pipelines are another crucial element for the model.
For this reason,
Section 3.3.1 and
Section 3.3.2 briefly provide the main technical data related to, respectively, the (i) candidate technologies for the building k superstructure (see
Figure 4) plus the central unit and (ii) DHCN pipelines.
3.3.1. Building k Superstructure Technologies
The technical data of the MGT, ICE, ABS, and HP are based on real and commercially available equipment, which are presented in detail in
Section S2 (Supplementary Material). For these technologies, different nominal capacities were selected, according to the energy demand magnitude of each building.
Table 3 shows the nominal installed capacities that are allowed to be installed in each building. Then, the optimization model is allowed to install up to six components in a given building.
Table 4 provides the electric and thermal efficiencies for the ICE and MGT, while
Table 5 presents the COP values for the ABS.
Table 6 provides the COP values regarding the heating and cooling modes of the HP throughout the year. As observed, the COP values of the HP varies according to the ambient temperature.
The solar technologies production was simulated for the city of Pordenone, Italy, through the System Advisor Model (SAM) software (version 2022.11.21), from the National Renewable Energy Laboratory [
35]. The production for both PV and ST were calculated per square meter of the installed technology (detailed information in the
Supplementary Material, Section S2.5). The maximum total available rooftop area was set to 200 m
2 per building. Both PV and ST compete between them to occupy such space; however, it is the MILP algorithm that will decide the installed percentage of each one or even to not install at all.
For what concerns the boiler (BOI) and compression chiller (CC), they are based, respectively, on the typical efficiency and COP of such technologies. Their optimal installed capacities are essentially based on the fuel cost, technology purchase cost, maintenance cost, and other installed technologies providing the same product. The thermal energy storage technologies (HST and CST) are essentially based on a dissipation factor and a maximum installed capacity.
Table 7 presents the main technical data regarding these technologies.
Regarding the central unit superstructure, it is possible to highlight the following details about the technical data: (i) larger capacity technologies are needed here, since the central unit is intended to support (in terms of electricity and/or heat) the entire or part of the EC, (ii) the ICE is based on typical electricity and heat efficiencies for larger capacity components, (iii) the BOI, ST, and HST follow the same logic as those considered for the buildings.
Table 8 provides the technical details regarding the central unit technologies.
3.3.2. DHCN Technical Data
The technical data regarding the pipelines of the district heating and cooling network are essentially based on: (i) maximum and minimum capacities of each pipeline, i.e., the minimum and maximum amount of heat (or cooling) that a given pipeline is allowed to transport, (ii) the length of the pipeline between two buildings, and (iii) the loss factors regarding heat or cooling dissipation.
Table 9 presents the minimum and maximum capacities for pipelines between buildings as well as for the pipeline between the central unit and buildings.
Table 10 shows the actual pipeline length between the buildings. Zero values mean that the model is not allowed to connect the buildings with pipelines. As observed, there are two main highlights in this table: (i) one building cannot send thermal energy (heat and/or cooling) to itself, and (ii) one building cannot connect to another one due to very long distances (e.g., buildings 1 and 7) or simply because it can connect to another building through a third building (e.g., buildings 2 and 4 connecting through building 3). For a graphical aid visualization, the reader may refer to
Figure 3. The
Supplementary Material (Section S2.6) provides the dissipation factors for heating and cooling pipelines. These factors represent a percentage loss per unit of length (8% for heating and 5% for cooling pipelines).
3.4. Economic Data
The economic data relating to the EC comprise a fixed component, concerning the investment costs and maintenance factors of technologies, and a variable component, concerning the hourly operation cost (for more details, the reader may refer to the
Supplementary Material, Section S3). Moreover, the price of resources is another very important type of economic input data, which, in this case, is related to natural gas and electricity.
Energy Resources Economic Data
The available energy resources for the EC are solar energy, natural gas, and electricity from the national grid. The EC purchases natural gas, from the main gas grid, and is allowed to purchase and sell electricity from/to the main electric grid. This section aims to provide the data related to the input natural gas price, as well as the electricity price for both purchasing and selling.
Table 11 provides the natural gas purchase price. In Italy, this price is composed of (i) natural gas expenses, i.e., the cost of various activities carried out by the seller before suppling natural gas to the end customer, (ii) transportation and metering management expenses, (iii) system charges expenses, which is an amount used by the state to support expenditures and works in the public interest, such as the incentive for renewable sources or economic support for disadvantaged households, and (iv) tax expenditures [
36].
Another important detail regarding natural gas prices in Italy is an incentive to self-producers who adopt cogeneration devices into their own energy systems [
37]. Such an incentive allows a gas price reduction of 25% (
Table 11) for the amount of gas used in the mentioned devices.
Regarding electricity prices, the data were taken from the Italian energy markets manager [
38]. Some calculations were made in order to estimate what would be the electricity bill value, which is the actual electricity price input to the EC model.
Table 12 provides the hourly values (according to the time bands in force for Italy) for the whole year. The reader may refer to the
Supplementary Material (Section S3.3) for detailed information.
For the price of the electricity sold to the grid (
Table 13), the data regarding the “Dedicated collection” or
Ritiro Dedicato managed by [
39] were considered. This is an Italian simplified available procedure for producers selling self-produced electricity to the grid. Detailed information can be found also in the
Supplementary Material (Section S3.3).
3.5. Environmental Data
Another important aspect when it comes to the set of input data for the EC model is the environmental impact considered for the system. For this study, it concerns only the operation phase, i.e., the consumption of natural gas and electricity from the main grid, which is expressed by the total annual CO2 emissions. Therefore, it is necessary to determine the CO2 emissions associated with such consumption.
The CO
2 emission factor associated with the local consumption of natural gas was assumed to be constant throughout the entire year and equal to 0.202 kg CO
2/kWh [
40].
The hourly CO
2 emissions from the generated electricity in Italy is not publicly available, as it is for other European countries such as Spain. The truth is that, for most European countries, current official reports provide only annual estimates for their national CO
2 emissions [
41]. Therefore, in order to provide the model with hourly CO
2 emissions data for Italian generated electricity, two main pieces of information were needed: (i) the hourly generated electricity in Italy (from the entire electricity mix), and (ii) the hourly CO
2 emissions from the Italian power sector. The first one was obtained from the European Network of Transmission System Operators for Electricity [
42], which is an association for cooperation among the European transmission system operators (TSOs). On their webpage, it is possible to obtain the hourly electricity generation from all primary energy sources divided by country. The Italian data were selected. The second piece of information was obtained from the online application “Figshare” or “Carbon Monitor Europe” [
43], which provides the daily average CO
2 emissions divided by sector for all European countries. Thus, the data regarding the Italian power sector were selected. As noted, there is a divergence between both pieces of data, i.e.,
hourly generated electricity and
daily CO
2 emissions. Bearing in mind that the EC model was developed considering two typical days per month, the procedure to converge both types of data was to (i) calculate the average daily CO
2 emissions corresponding to the working days of each month, (ii) perform the same procedure for non-working days, (iii) assume that CO
2 emissions are constant for the 24 h of a given working day and equal to the value obtained in step (i), and (iv) assume that CO
2 emissions are constant for the 24 h of a given non-working day and equal to the value obtained in step (ii).
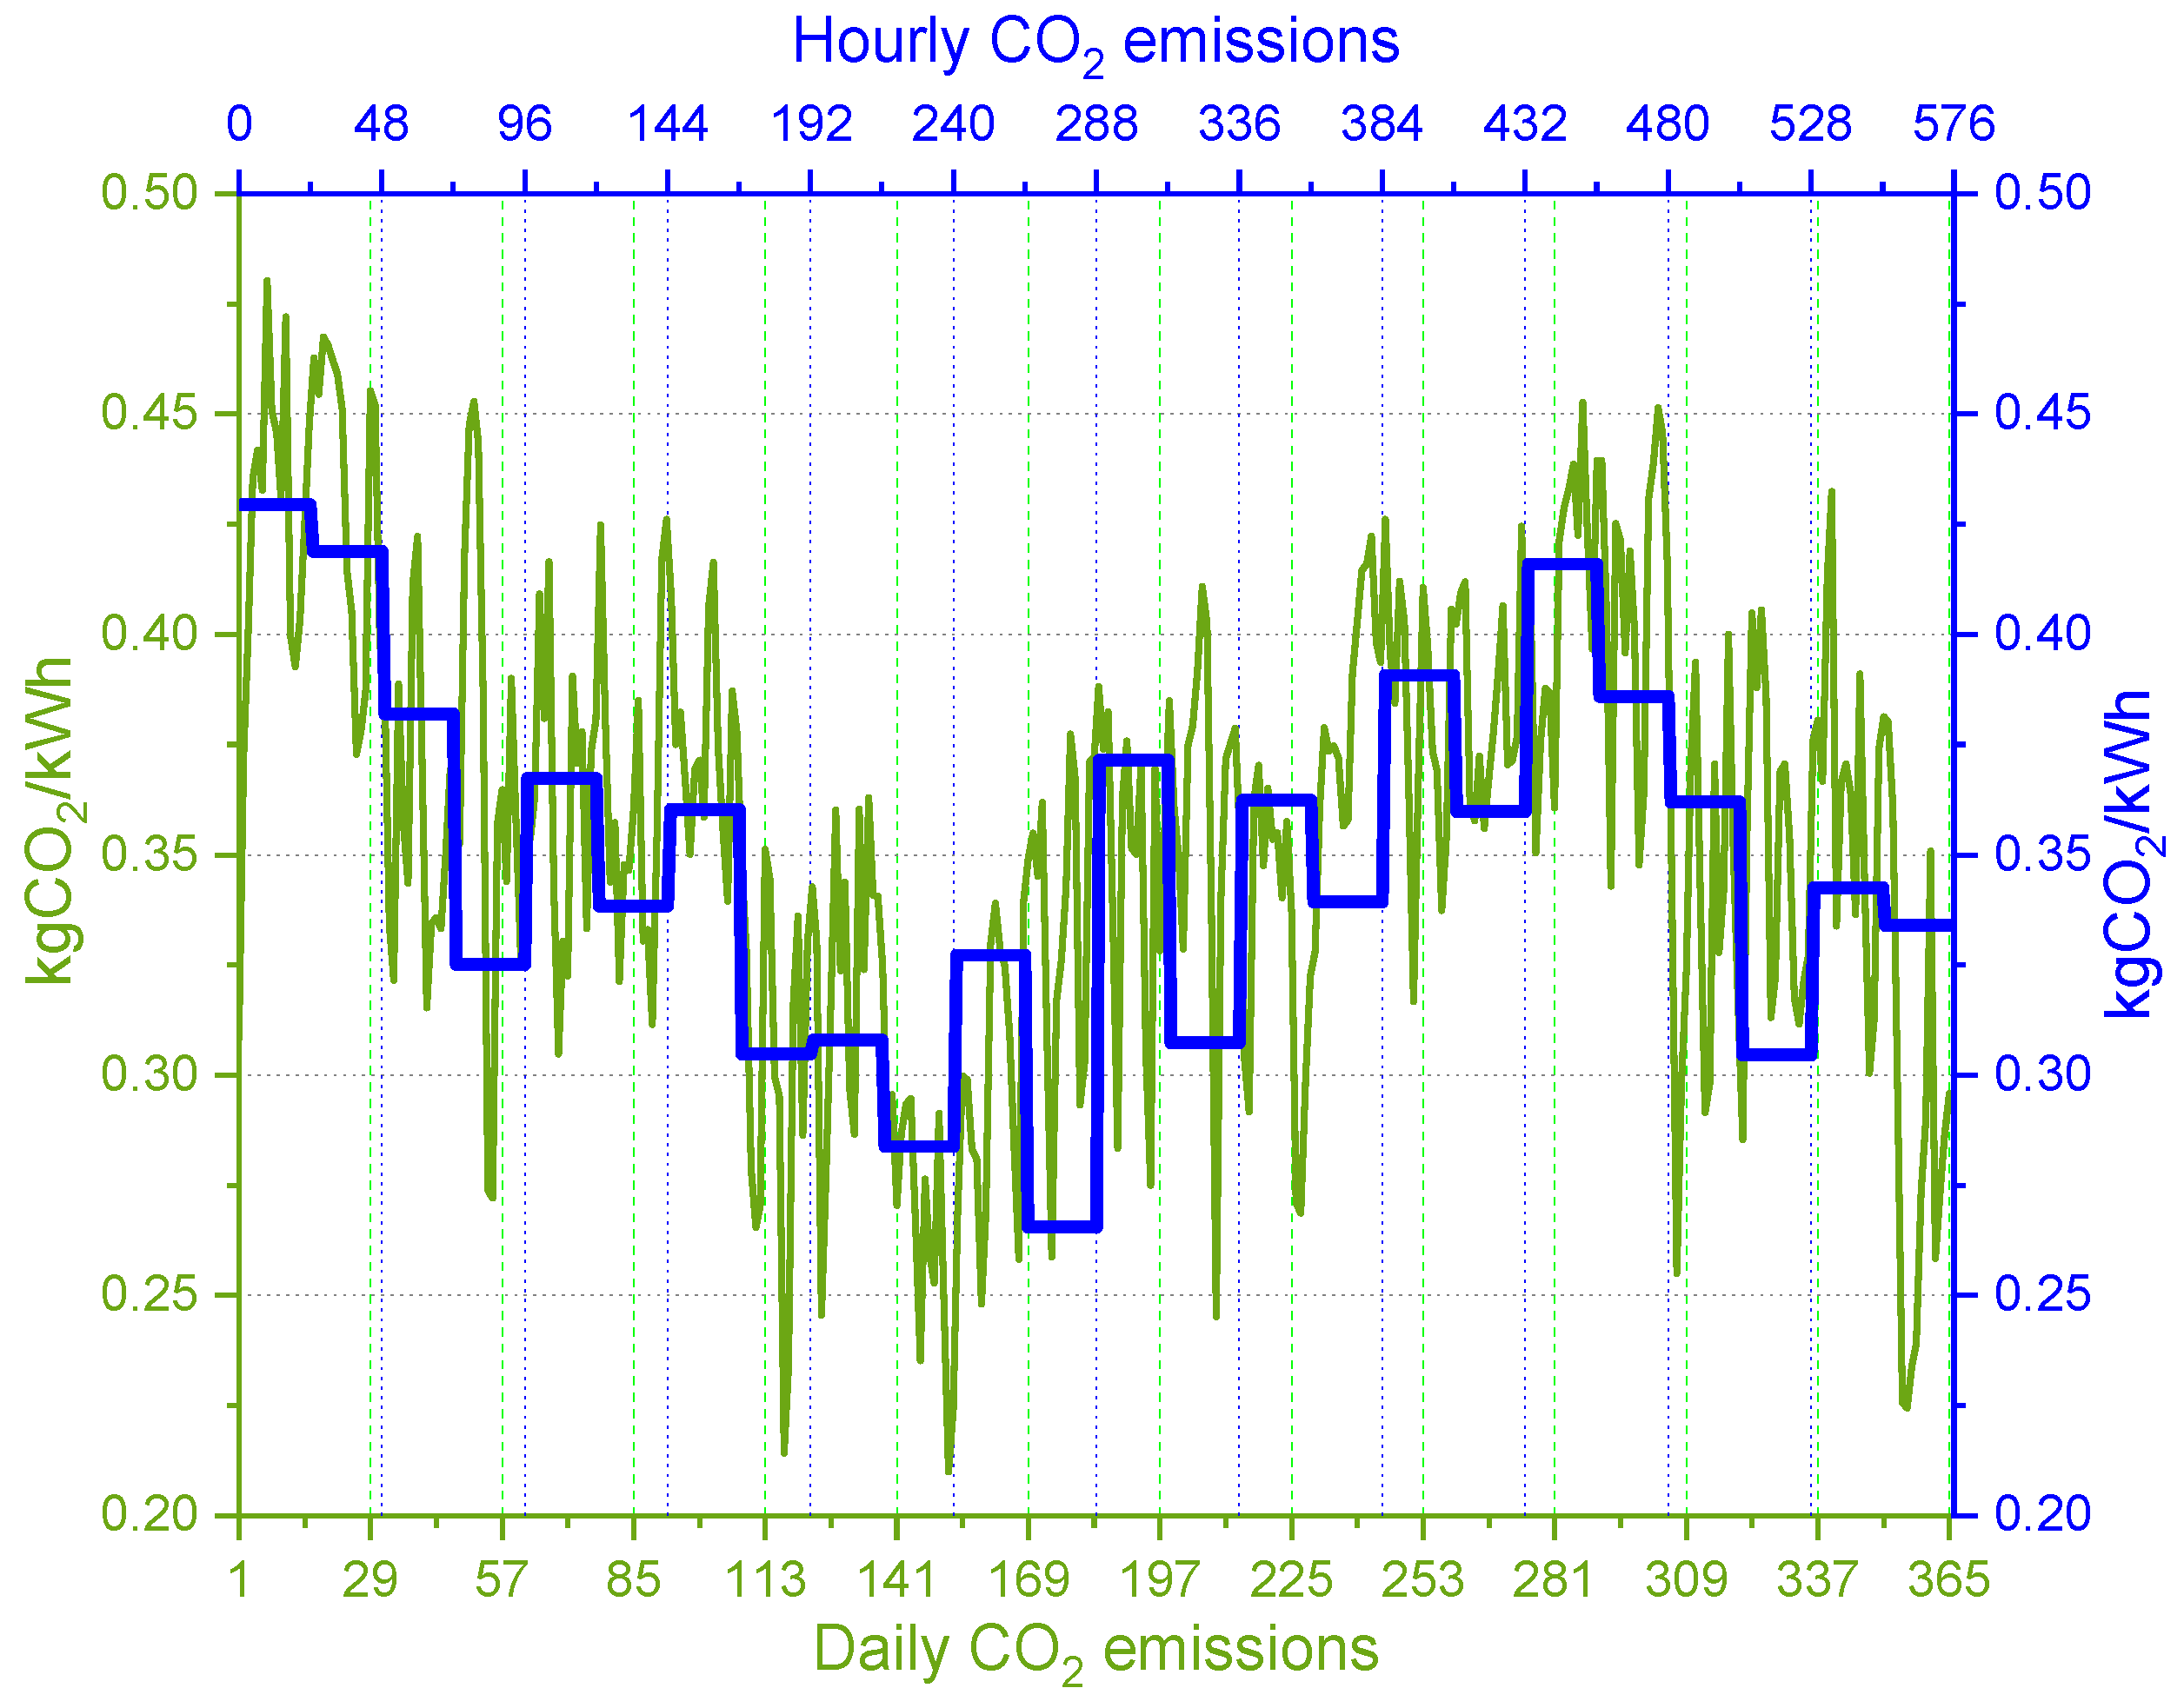
Figure 8 shows the daily CO
2 emissions obtained from Carbon Monitor Europe [
43] and the hourly CO
2 emissions calculated for this work, which are the data representing the environmental impacts associated with the electricity available in the Italian electric grid for each hour of each typical day. The data were obtained from the year 2019 in order to be coherent with the electricity price data.
Table 14 provides the exact CO
2 emission values for each typical day (working and non-working day) of each month.
4. Mathematical Model
Section 2 and
Section 3 provided, respectively, the superstructure of the entire EC and the necessary input data for the EC model. The next step is the development of the mathematical model representing (i) the essential aspects regarding behavior and performances of technologies, (ii) the boundaries of the system, and (iii) the targeted objective functions.
For this work, a MILP model was developed to identify the optimal system configuration, including installed technologies and their capacities, along with the optimal hourly operation strategy throughout the year from economic and environmental perspectives. The MILP model incorporates binary variables to enforce specific conditions on the system’s structure (e.g., permission to install technologies in the superstructure) and operation (e.g., operation modes of the heat pump and flat-plate solar thermal collectors). Additionally, continuous variables are employed to represent energy, economic, and environmental flows. The MILP model was implemented and solved using FICO XPress software (version 3.6.2) [
44].
Before diving into the mathematical expressions of the model, it is important to bear in mind the assumptions that have been made in order to keep an acceptable balance between the accuracy of the model and computational effort:
Hourly energy demands, solar radiation, energy prices, and CO2 emission factors are known before-hand and are considered constant in each time interval.
TES units (heating and cooling) work as a buffer in which thermal energy is stored (with losses) and consumed later at the same temperature level.
The typical days have been defined considering the energy demand profiles of each building, i.e., working days and non-working days.
This section is subdivided as follows:
Section 4.1 presents and describes the considered objective functions, i.e., the minimum total annual cost and minimum total CO
2 emissions regarding the entire EC;
Section 4.2,
Section 4.3 and
Section 4.4 provide the equations representing the boundaries of the model, i.e., constraints, energy balances, and structural and operational restrictions.
4.1. Objective Functions
Equation (1) provides the economic objective function which minimizes the total annual cost
(
) for the entire EC and is composed by the total annual operation cost (
), total annual maintenance cost (
), total annual investment cost (
), total annual purchased electricity cost via distribution substation (
), and total annual sold electricity revenue via distribution substation (
) (for a better understanding of the last two terms, in the context of this work, the reader may refer to
Figure 2).
The total annual operation cost is expressed by Equation (2), which calculates the total costs with purchased gas for boilers and/or cogeneration technologies. The reader may refer to the
Supplementary Material (Section S4.1) for further details about Equations (2)–(4).
In Equation (2),
is the total annual operation cost regarding the central unit and
is the total annual operation cost of each building
B. Equation (3) represents the total annual maintenance cost,
where
is the total annual maintenance cost regarding the central unit and
is the total annual maintenance cost of each building
B.
Equation (4) expresses the total annual investment cost of the EC,
where
is the total annual investment cost regarding the central unit,
is the total annual investment cost of the DHCN pipelines, and
is the total annual investment cost of each building
B.
As explained in
Section 2.1, only the distribution substation (DS) is allowed to communicate with the national electric grid and, for this reason, all purchased and/or sold electricity is concentrated in the DS. Therefore, all electricity purchase expenses should be accounted by the variable
(Equation (5)) while all electricity selling revenues are computed by the variable
(Equation (8)).
In Equation (5),
is the hourly electricity cost (in €, Equation (7)) for all 24 h
h of each one of the 2 typical days
d and for each one of the 12 months
m of the year. The
term (non-dimensional), represented by Equation (6), expresses the transformation of a given variable (calculated for the typical days) into a specific number of days representing the whole year. In another words, the term
plays a crucial role in transforming a given variable (excluding the ones representing the TES charging and discharging), calculated for two typical days in a month, into a value representing a standardized month of 28 days. The operational mechanism of term
involves a two-step process. Firstly, the term
multiplies the value of a given variable (calculated for a working day) by 5, producing the variable’s value associated with one week from Monday to Friday. Secondly, the term
multiplies the value of the same given variable (calculated for a non-working day) by 2, resulting in the variable’s value associated with one weekend. This process effectively computes the given variable for a whole 7-day week. Subsequently, the computed values (both for a 5-day week and a 2-day weekend) are multiplied by 4 to arrive at the equivalent values for a month encompassing 28 days. This entire procedure is iteratively applied for each month throughout the year, resulting in an annual representation of the given variable based on a standardized month. This methodology ensures a comprehensive evaluation over the span of a year, amounting to 336 days or 8064 h.
In Equation (4), corresponds to the matrix . It means that, since varies from 1 to 2, when , which represents 20 weekdays; when , which represents 8 weekend days.
The hourly expenses regarding the purchased amount of electricity are given by Equation (7), where
, in €/kWh, is the hourly electricity price provided in
Table 12 while
is the hourly amount of purchased electricity, in kWh.
The electricity selling revenues, in €, are calculated by Equation (8),
where
is the hourly electricity revenue (in €, Equation (9)) for all 24 h
h of each one of the 2 typical days
d and for each one of the 12 months
m of the year. The
term is equal to the one in Equation (5).
In Equation (9),
, in €/kWh, is the hourly electricity selling price provided in
Table 13 while
is the hourly amount of sold electricity, in kWh.
The second objective function is the total annual environmental emissions (
), expressed by Equation (10), in kg CO
2/y. As explained before, the emissions considered in this work are due only to the operation of the system. Therefore,
is equal to the total annual operation emissions
, in kg CO
2/y, which is composed of total annual emissions due to natural gas consumption (
), total annual emissions due to electricity purchased from the grid (
), and total annual emissions compensation due to electricity sold to the grid (
).
The
term is composed of the CO
2 emissions generated from the gas consumption in the central unit and buildings, represented by Equation (11).
The terms
(Equation (12)) and
(Equation (14)) are both dependent on the hourly CO
2 emissions
, provided by
Figure 8, and on the purchased
and sold electricity
, respectively.
4.2. Models of the Adopted Technologies
The energy production as well as the boundary of the system are two of the main details considered in the models of each adopted technology. Therefore, the models of each technology presented in the superstructure of the EC (see
Figure 4) are provided in the
Supplementary Material (Section S4.2), both for the buildings and central unit.
4.3. Energy Balances
The energy balance equations are given from Equations (16)–(22). For this section, the reader should bear in mind that, in these equations, the hourly dependency of the variables, represented by m (month), d (day), and h (hour), is replaced by for simplicity.
The hourly heat balance for a given building is calculated through Equation (16),
where
is the hourly heat demand of a given building,
and
are the variables that express the amount of heat transported through the DHN pipelines and represent, respectively, the hourly heat received by a building
(from a building
) and the hourly heat sent to a building
(by the building
).
is the term that expresses the pipeline heat losses, which was set to impose a 5% heat loss for each kilometer of pipeline length. The hourly central unit heat supply is represented by
, while the variable
represents the hourly wasted heat in each building. The variables carrying the subscripts MGT, ICE, HP, BOI, and ST represent the hourly amount of heat provided by such technologies, whereas the variable with the subscript ABS represents the hourly amount of heat received by the absorption chiller. The variable with HST as the subscript represents the in/out heat flow of the hot water storage; for charging mode the variable is positive and for discharging mode it is negative.
The hourly heat balance of the central unit is expressed by Equation (17).
The hourly cooling balance for a given building is determined through Equation (18),
where
is the hourly cooling demand of a given building,
and
are the variables that express the amount of transported cooling through the DCN pipelines and represent, respectively, the hourly cooling received by a building
(from a building
) and the hourly cooling sent to a building
(by the building
).
is the term that expresses the pipeline cooling losses, which was set to impose an 8% cooling loss for each kilometer of pipeline length. Variables carrying the subscripts ABS, HP, and CC represent the hourly cooling provided by such technologies, whereas the variable with the subscript
waste represents the cooling waste from each building. The variable with CST as the subscript represents the in/out cooling flow of the chilled water storage; for charging mode the variable is positive and for discharging mode it is negative.
The electricity balance is made up of two parts: (i) balance within each building (Equation (19)), and (ii) balance regarding the distribution substation plus the central unit (Equation (20)). The first part assures that the electricity demand of each building is fulfilled, while the second part guarantees that the electricity demand of the entire EC is fulfilled and that the electricity management between the EC and electric grid is performed in an optimal way.
In Equation (19),
is the hourly electricity demand of a given building and
is the hourly amount of electricity that building
receives from the DS (if negative) or sends to the DS (if positive). It will depend on the optimal solution. Variables with the subscripts MGT, ICE, and PV represent the hourly electricity produced by such technologies, whereas the variables with the subscripts HP and CC represent the electricity consumed by these technologies. The constraints showed in Equations (21) and (22) specify to the model that such variables should not assume negative values.
4.4. DHCN Pipeline Models
As introduced in the previous section,
is the hourly amount of heat transported through the DHN pipelines. Nevertheless, it should be highlighted that this variable is restricted to a certain limit. The same goes for
. Therefore, Equations (23) and (24) provide the boundary for those two variables,
where
and
are, respectively, the maximum amount of heat and cooling (both in kW) that a pipeline connection between building
k and
B can transport. These variables are also decision variables, i.e., it is up to the optimization engine to decide the optimal size of the pipeline. For this reason, the limits for these sizes are introduced through Equations (25) and (26),
where,
,
, and
and
are the binary variables expressing the existence (or not) of a pipeline connection between two buildings.
It is also important to specify to the model that a pipeline connection between two buildings (whether it is part of the DHN or DCN) is allowed to exist only in one direction. This is the purpose of Equations (27) and (28).
In order to assure that the model will not install pipelines between two buildings that cannot physically connect, Equations (29) and (30) are set up for every zero value in
Table 10.
5. Results and Discussion
A primary step before starting the single- or multi-objective optimizations is the definition of a reference case with the aim of evaluating the enhancement provided by the optimization process. Therefore,
Section 5.1 is intended to describe the considered reference case and provide the obtained results from such a scenario. Then,
Section 5.2 and
Section 5.3 provide the results and discussions regarding the single-objective and multi-objective optimizations, respectively.
5.1. Reference Case
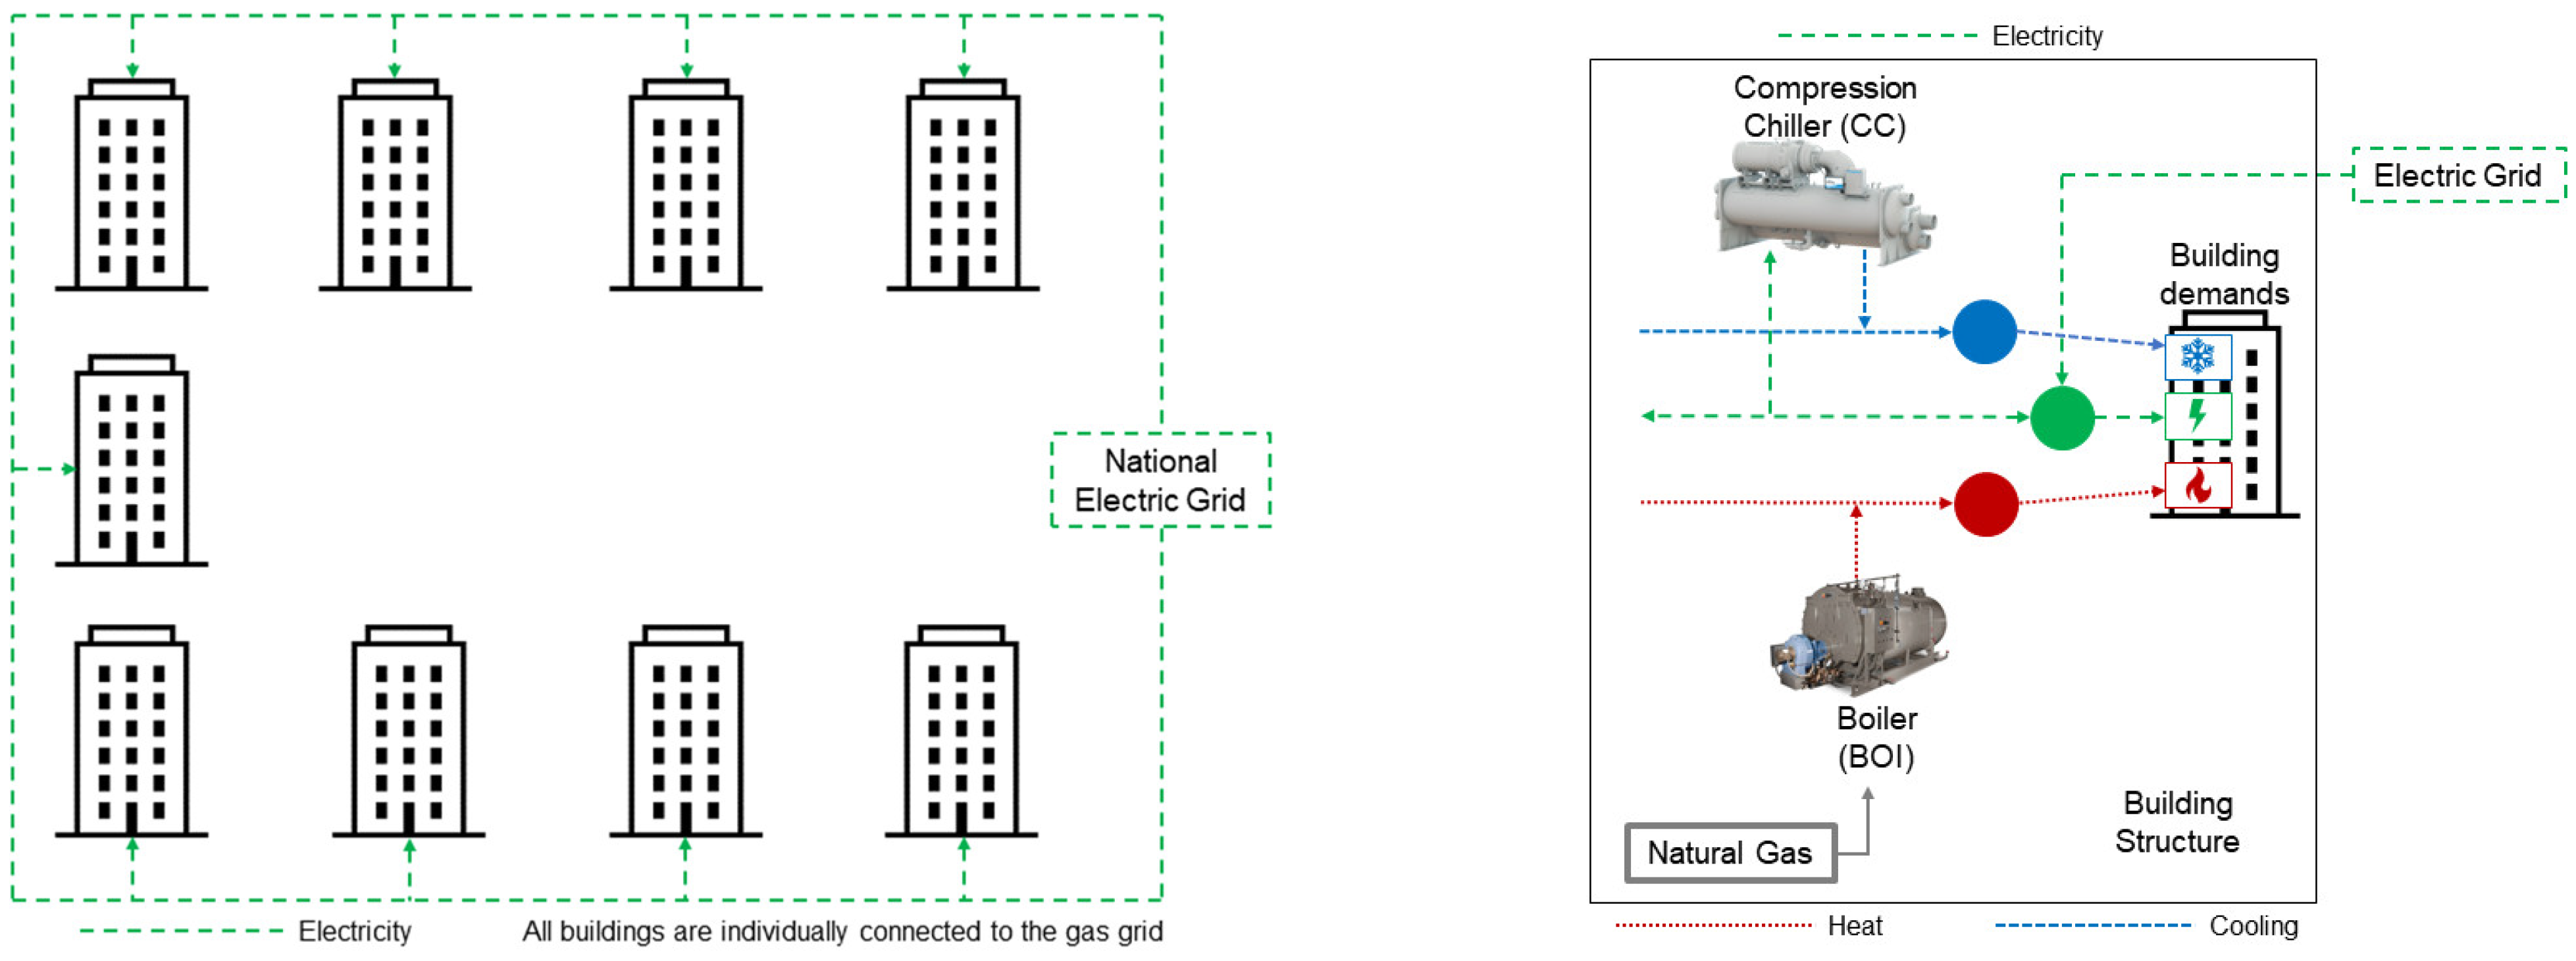
The reference case scenario (or conventional solution, as it is often called in the literature) is characterized by the buildings (the same ones composing the EC) individually fulfilling their energy demands. Neither DHCN pipelines nor the central unit are considered in this scenario. In other words, the reference case represents how the energy demands are fulfilled in most of the cases, i.e., total electricity demand purchased from the national electric grid, heat demand covered by a gas boiler, and cooling demand fulfilled by an electric chiller.
Figure 9 illustrates the individual electricity connections, where the buildings are allowed to only purchase electricity (they cannot sell electricity), and the technologies to cover the energy demands.
Table 15 provides the main results obtained from the reference case scenario, i.e., the annual expenses due to operational, maintenance, and amortization costs as well as the total expenses regarding the total amount of electricity purchased from the grid and the total revenue from the electricity sold to the grid. These are the parameters used to calculate the total annual cost (4.6 M€/y). The total annual emissions are composed of emissions due to gas and electricity consumption, and was equal to 7.1 kt CO
2/y.
5.2. Single-Objective Optimization
Before diving into the multi-objective optimization analysis, this section provides the results of the objective functions analyzed separately. Such results offer essential insights when (i) compared to the results of the reference case, and (ii) compared between themselves (which is a preliminary step towards the multi-objective optimization).
Table 16 and
Table 17 provide the main results obtained by separately evaluating the objective functions, i.e., total annual cost and total annual CO
2 emissions.
5.2.1. Optimal Economic Solution
The present section has the aim of digging deeper into the results by detailing, for each building, the following aspects: (i) which technologies were in fact installed, (ii) the installed capacity of each technology, (iii) the energy flows regarding primary energy sources, electricity, heating, and cooling, (iv) the distribution of electricity among the EC buildings, and (v) which buildings are interconnected through the DHCN pipelines. For the sake of briefness, only the figures regarding the optimal structures of buildings 2 and 7 are presented here; the reader may find the figures regarding the other buildings in the
Supplementary Material (Section S5).
Building 1—Town Hall
Figure S32 (Supplementary Material) depicts the optimal energy supply system structure for the town hall. The reader should bear in mind that all energy flows are annual values. As observed, only the ABS, MGT, and ICE were not installed. This means that, in terms of electricity, the whole demand (building demand + HP + CC) is covered by PV (only 4%) and electricity coming from the distribution substation (DS). Most of the heat demand is produced by the HP due to three main reasons: (i) electricity is cheaper than natural gas, (ii) HP is more efficient than BOI, and (iii) there is a space limitation for installing more ST panels. When it comes to cooling, the entire demand is covered by CC (38%) and HP (62%).
In this solution, the town hall was the only building that does not have any heating or cooling pipeline connection with other building(s). According to the results data and observing the buildings’ location in
Figure 3, the solution went in the direction of concentrating a substantial amount of heat production in building 2 (theater) and distributing that heat to buildings 3, 4, 5, and 6 through the DHN pipelines. Building 1 (town hall) was probably left behind due to the distance between it and building 2, i.e., installing the pipelines between them and accounting for the heat losses would be more costly than the self-production scenario for building 1.
Building 2—Theater
Observing
Figure 3, it is possible to note that building 2 is located between two couples of buildings: 3 and 4 to the north and 5 and 6 to the south. Moreover, the distances between building 2 and the mentioned buildings are less than 300 m. Therefore, this group of buildings has the opportunity to cover their energy needs by sharing thermal energy (heating and cooling) through the DHCN pipelines since the installed pipeline length will be less (than between buildings 1 and 2) and, consequently, heat losses will be lower.
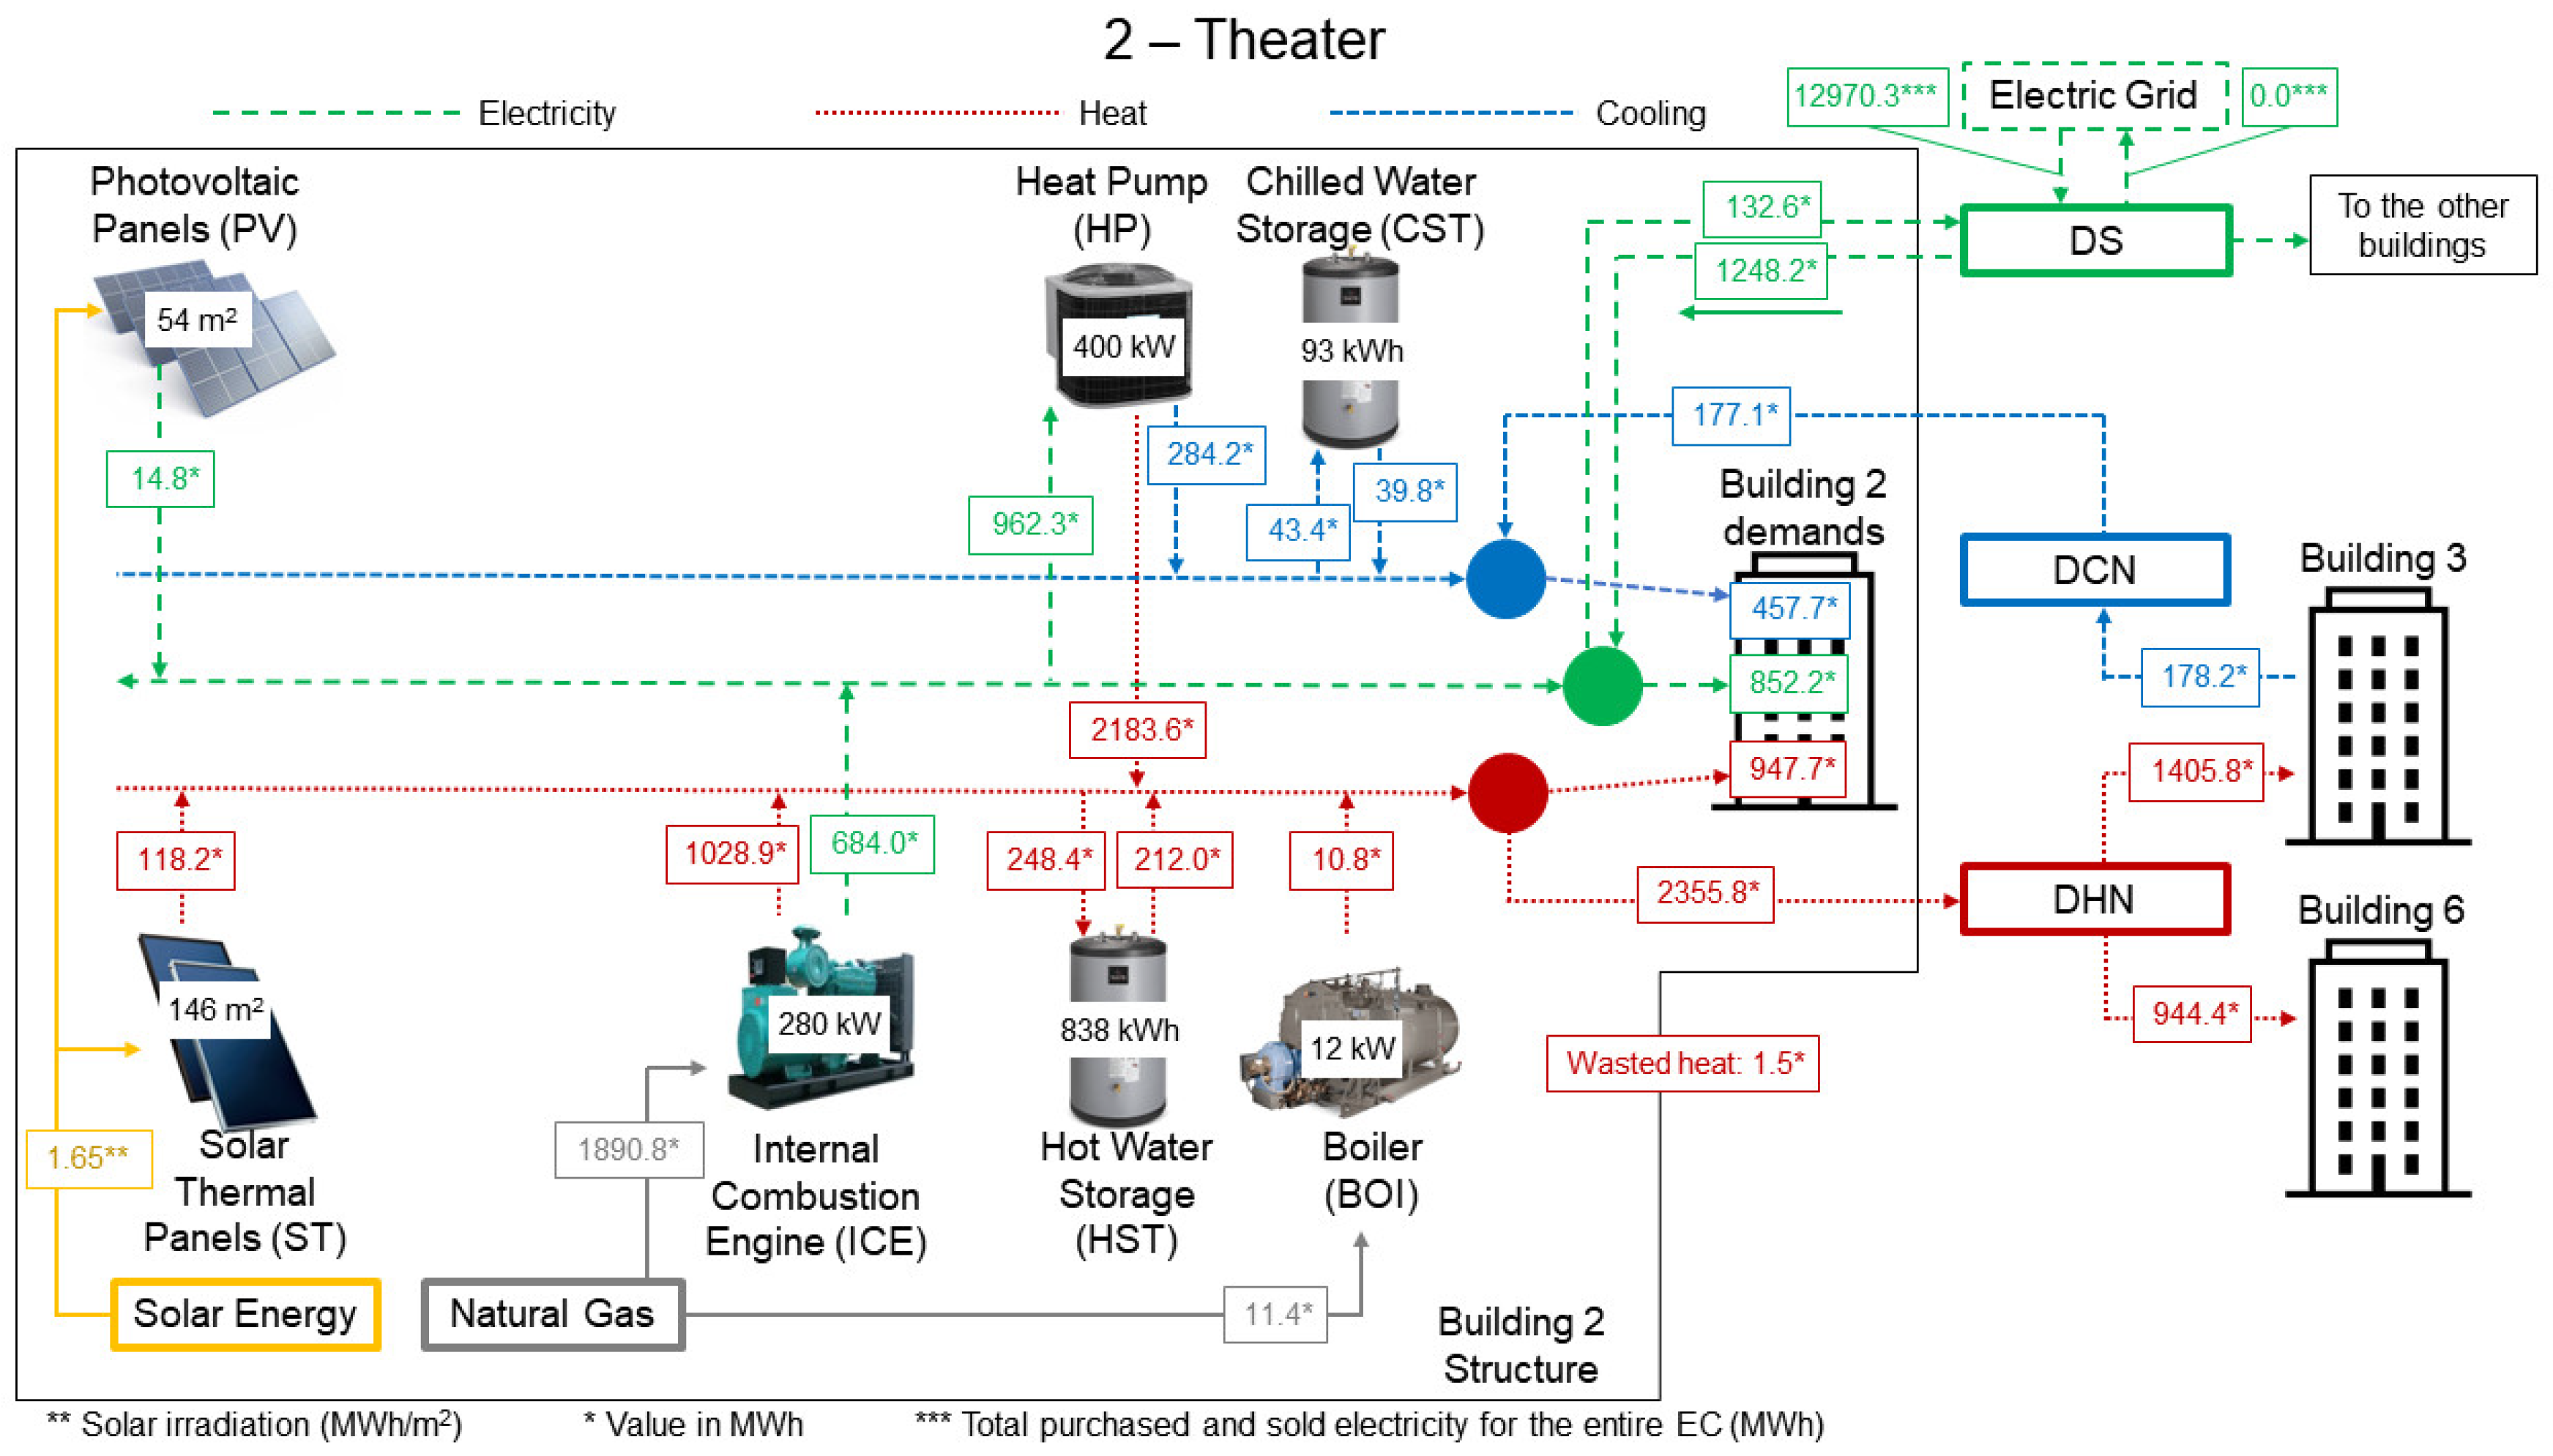
As observed in
Figure 10, building 2 does not have an ABS, CC, or MGT, but it was granted the installation of two 140 kW ICEs. In this way, the group of buildings benefit not only from the self-generated electricity, but also by the substantial amount of cogenerated heat. Besides, focusing on the heat balance (same figure), it is possible to note three main aspects: (i) when it comes to the solar technologies, the optimal solution prioritized ST over PV (indicating that, in this case, building 2 needs to produce large amounts of heat), (ii) the HP is responsible for 65% of the total heat produced (indicating the search for more efficient ways to produce the heat), and (iii) 71% of the total produced heat is sent to the buildings 3 and 6.
Another interesting detail regards the cooling balance. The only technology responsible for producing the building 2 demanded cooling is the HP. Since building 2 is allowed to install up to four 100 kW HPs, the other options would be either installing a CC and/or an ABS. Installing a CC would imply less electricity sent to the DS, which would have to be produced in another building or purchased from the grid. Installing an ABS would imply an additional heat demand or less heat being sent to buildings 3 and 6. Therefore, the optimal solution took advantage of installing an HP in building 3 (which has a lower cooling demand) by connecting both buildings (2 and 3) through a DCN pipeline. Since these buildings are only 80 m away from each other, the cost of installing the pipes and the low heat losses would be more attractive from the economic viewpoint.
Building 3—Library
Figure S33 (Supplementary Material) illustrates the optimal structure of building 3, which includes only PV panels, CC, HP, and CST. Also, there are heating and cooling pipelines with buildings 2 and 4. As seen, the installed HP supplies only 10% of the total library heat demand, while providing more than double the demanded cooling. This is because part of the produced cooling is sent to building 2. Moreover, taking into account the heat provided by the HP, only 34% of the heat received from building 2 is consumed by building 3; the remaining goes to building 4. The available area for installing solar technologies is fully occupied by PV panels. However, they provide only 6% of the total demanded electricity.
Building 4—Primary School
First, this building has no cooling demand (
Figure S34 (Supplementary Material)) since the school is closed during summer vacations. Moreover, this school has one of the lowest electricity demands among the EC buildings and, for that reason, the electricity supply is focused on (i) self-production through PV panels (49% of the total demand), and (ii) electricity imported from DS. Also, during some periods of the year, especially in summer, the building is able to send part of the self-produced electricity (or even the full amount in June, July, and August) to the DS. For what concerns heat demand, the heat received from building 3 covers almost all the heat needs, with only a tiny amount left for the BOI.
Building 5—Retirement Home
The optimal structure of building 5 is illustrated through
Figure S35 (Supplementary Material). As observed, 87% of its heat demand is received from building 6. This explains the fact that no MGT or ICE was installed and, hence, no ABS. The installed CC and HP capacities produce 44% more cooling than the internal demand, which is sent as surplus to building 6 (which is only 30 m away). For what concerns the electricity balance, 6% is covered by PV panels while the major part is imported from the DS.
Building 6—Museum
The museum optimal structure is pictured through
Figure S36 (Supplementary Material). As noted, the only installed technology for cooling production is the CC, which contributes only 7% of the cooling demand. The remaining amount comes from building 5 as previously explained. For what concerns solar technologies, the solution prioritized the installation of PV panels, which contribute 43% of the museum electricity demand. The self-produced heat (ST and BOI) constitutes only 3% of the total heat demand of building 6. The remaining portion is received from building 2. However, only 40% of that heat remains at the museum. The other part is sent to building 5.
Building 7—Hospital
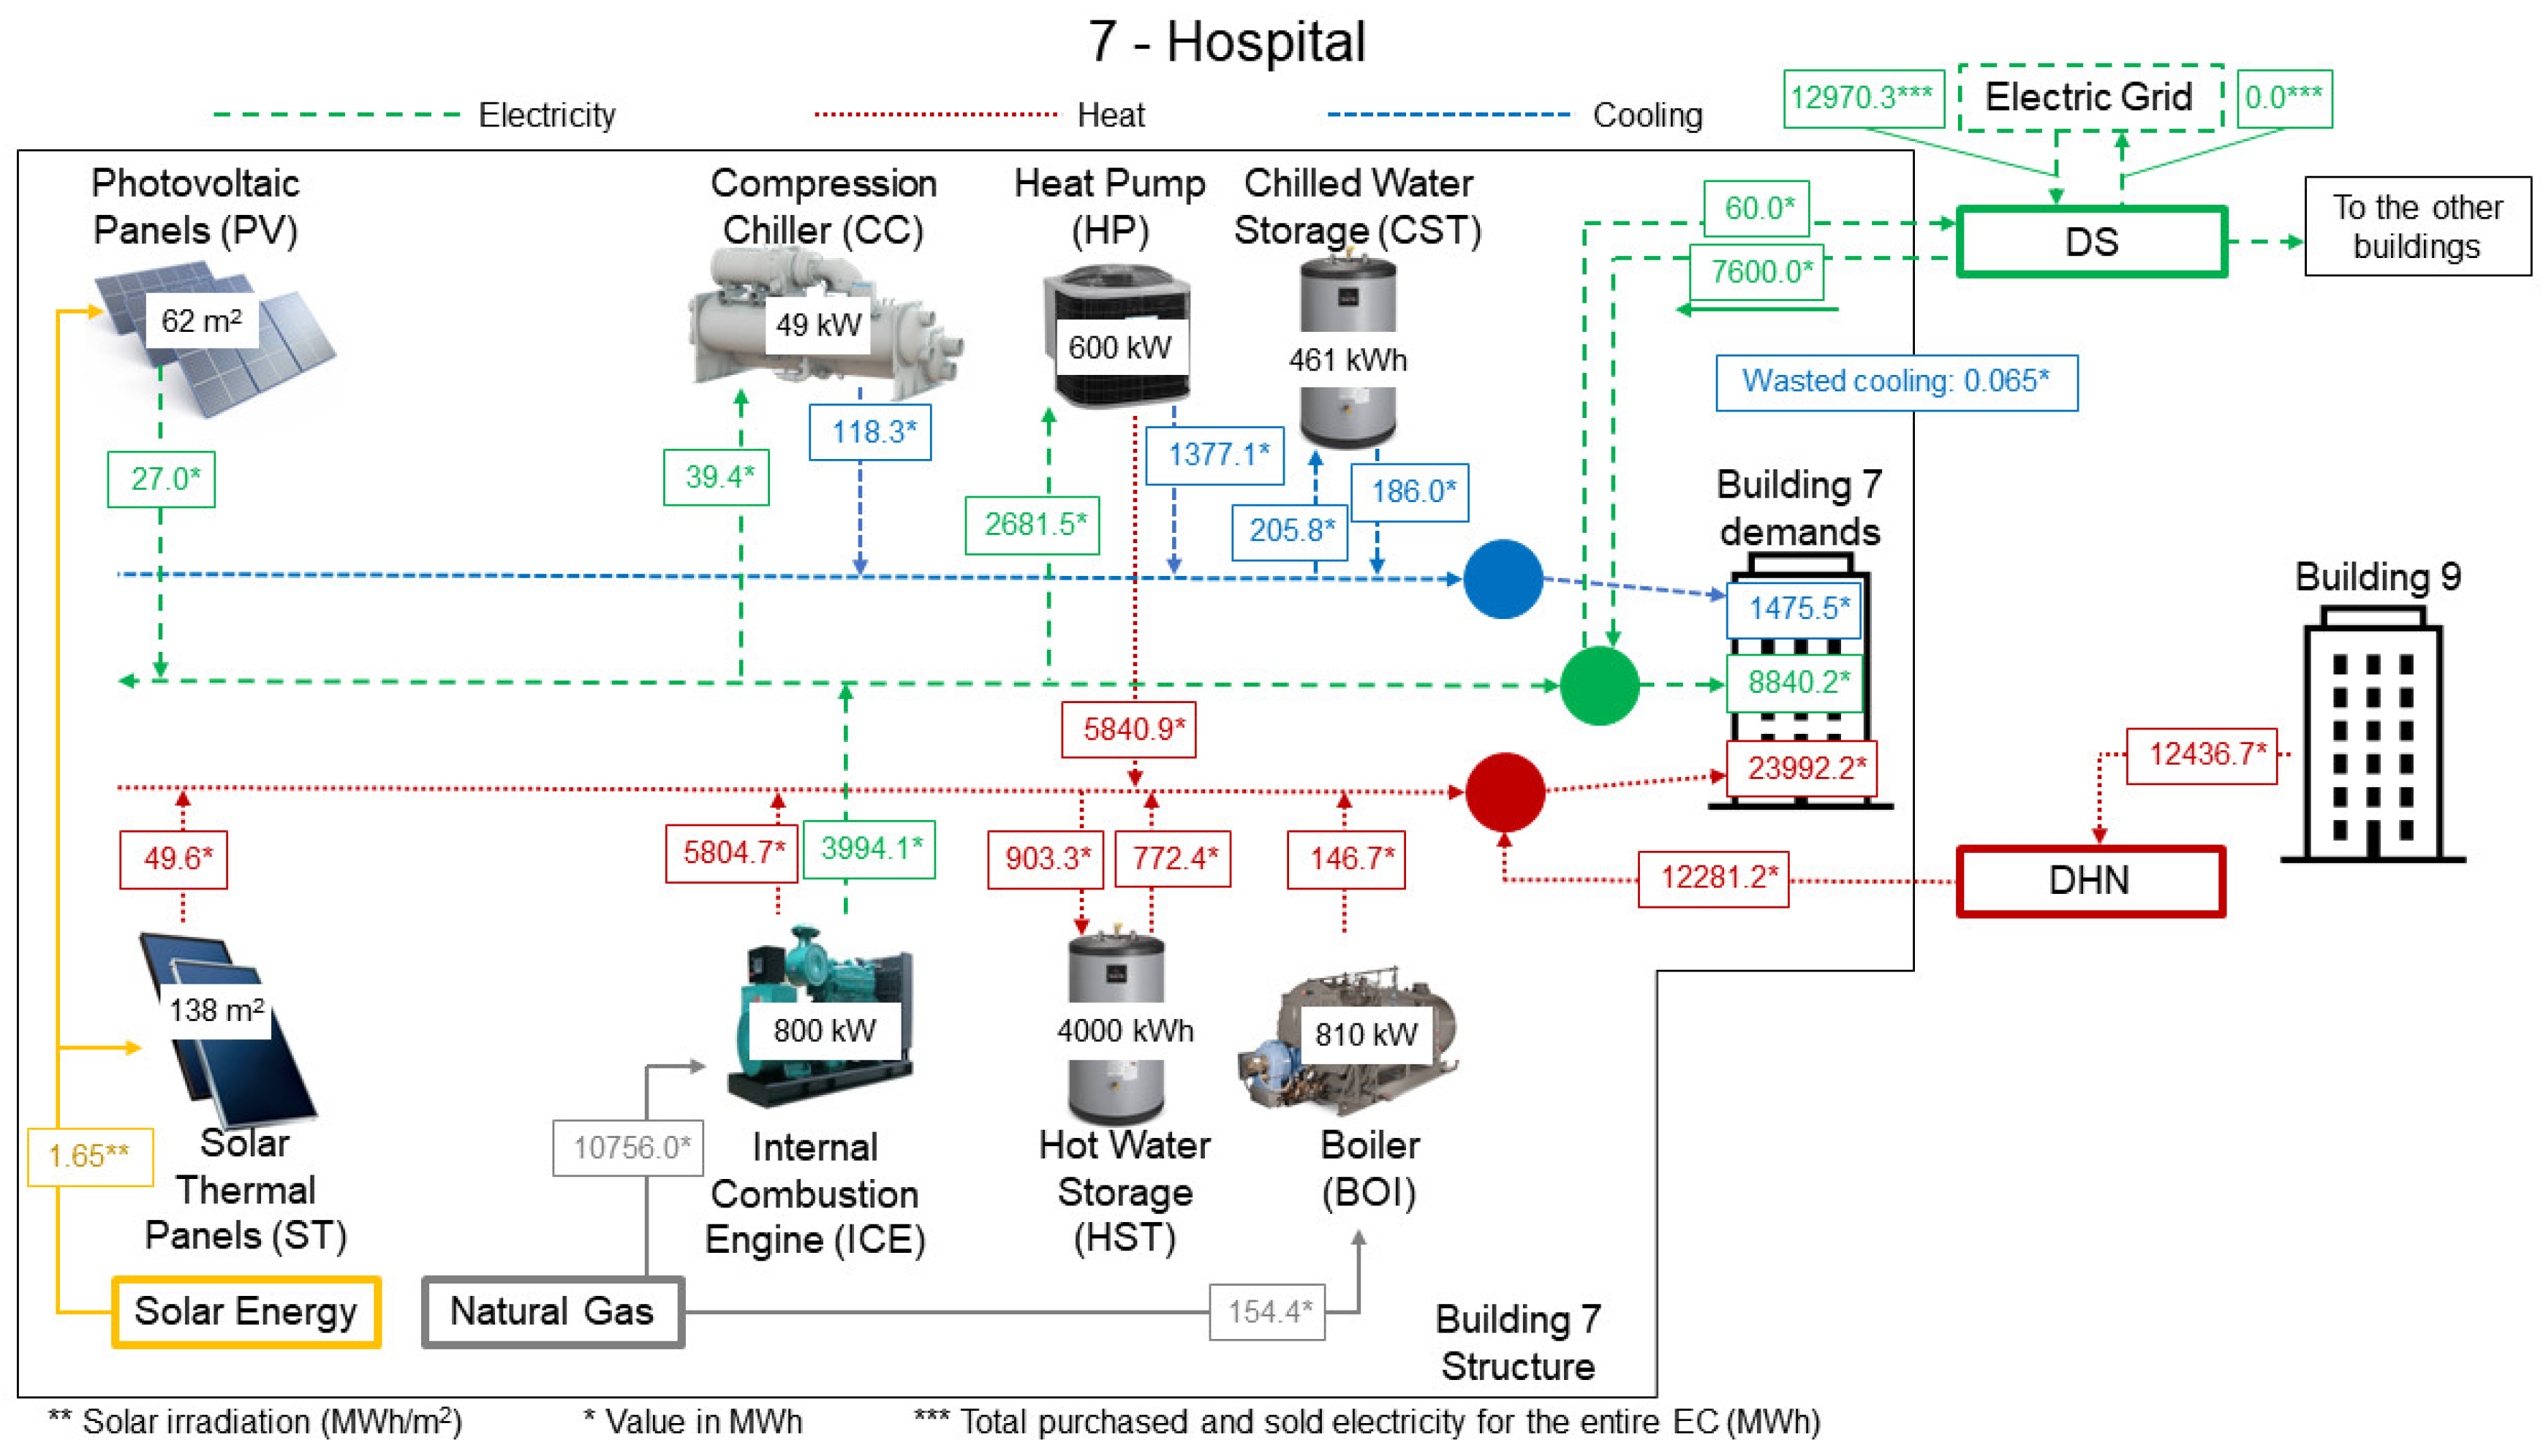
Building 7 is the greatest energy consumer in the EC. It is responsible for 75.4%, 74.9%, and 60.3% of the total electricity, heating, and cooling demands of the EC, respectively. As observed in
Figure 11, the only technologies not installed were MGT and ABS. The following installed technologies have reached their full allowed capacity (or have come very close): (i) solar technologies, where ST panels were prioritized by covering 70% of the available area, (ii) ICE, with four 200 kW installed units (max. six), (iii) HP, with six 100 kW installed units, and (iv) HST, with 4000 kWh.
Focusing on the cooling balance, the total cooling demand is covered by the CC and HP, with the latter contributing 93% of the demand. The most likely reasons for a full HP installed capacity are (i) the hospital has an extremely high heat demand and therefore it needs all the self-produced heat available, and (ii) installing an ABS would require an additional amount of heat, and the cooling produced would not be obtained as efficiently as that obtained by means of the HP.
When it comes to the electricity balance, it is worth noting that (i) self-produced electricity covers 35% of the total electricity demand (the remaining part comes from the DS), and (ii) the solution could have installed two additional 200 kW ICE units to obtain not only more electricity, but also more heat.
The heat balance shows that self-produced heat covers about half (49%) of the total heat demand. In the case of one additional ICE installed unit, such a percentage would be higher. However, the cost of purchasing, maintaining, and operating this additional unit would be higher than importing heat from another building. Moreover, most of the heat received through the DHN pipeline comes from the central unit, where it is produced by means of ST panels.
Building 8—Secondary School
The secondary school (
Figure S37 (Supplementary Material)) has no cooling demand. With regard to electricity balance, only 2.5% of the total electricity demand is covered by PV panels, while the remaining part is imported from the DS. Six HP units of 80 kW each are installed to cover 69% of the total heat demand of building 8 while the remaining part of the heat comes from the central unit. The central unit supplies a considerable amount of heat, derived from solar thermal panels, which is internally used by building 8 (22%) and the remaining heat is sent to building 9.
Building 9—Swimming Pool
The swimming pool has no cooling demand (
Figure S38 (Supplementary Material)) either since it is closed during the summer vacation period. The main highlight for this building is the installation of five 100 kW HP units, with an annual heat production of 2609.1 MWh, which is seven times higher than the heat demand of building 9. Such an additional amount of heat covers the internal heat demand and complements the heat coming from building 8 in order to be sent to building 7. The main reasons for such an additional amount of heat production are:
As observed in
Table 10, the only possible DHCN pipeline connections for building 7 (hospital) are with buildings 4 and 9. Building 4 is 1400 m away from building 7, a fact that does not make it economically attractive. Therefore, the only remaining option for building 7 is building 9 (250 m away).
Since the optimal solution installed all the permitted HP capacity (six 100 kW units) for building 7 (hospital), the only remaining options to produce more heat (within building 7) would be a higher BOI capacity, one additional ICE unit, and/or installing an MGT. However, these options are substantially more expensive than HP, in terms of investment and operation costs. Therefore, installing these technologies in building 7 would be more expensive than installing additional HP capacity in building 9 and sending the heat to building 7.
5.2.2. Energy Balances for the Entire EC
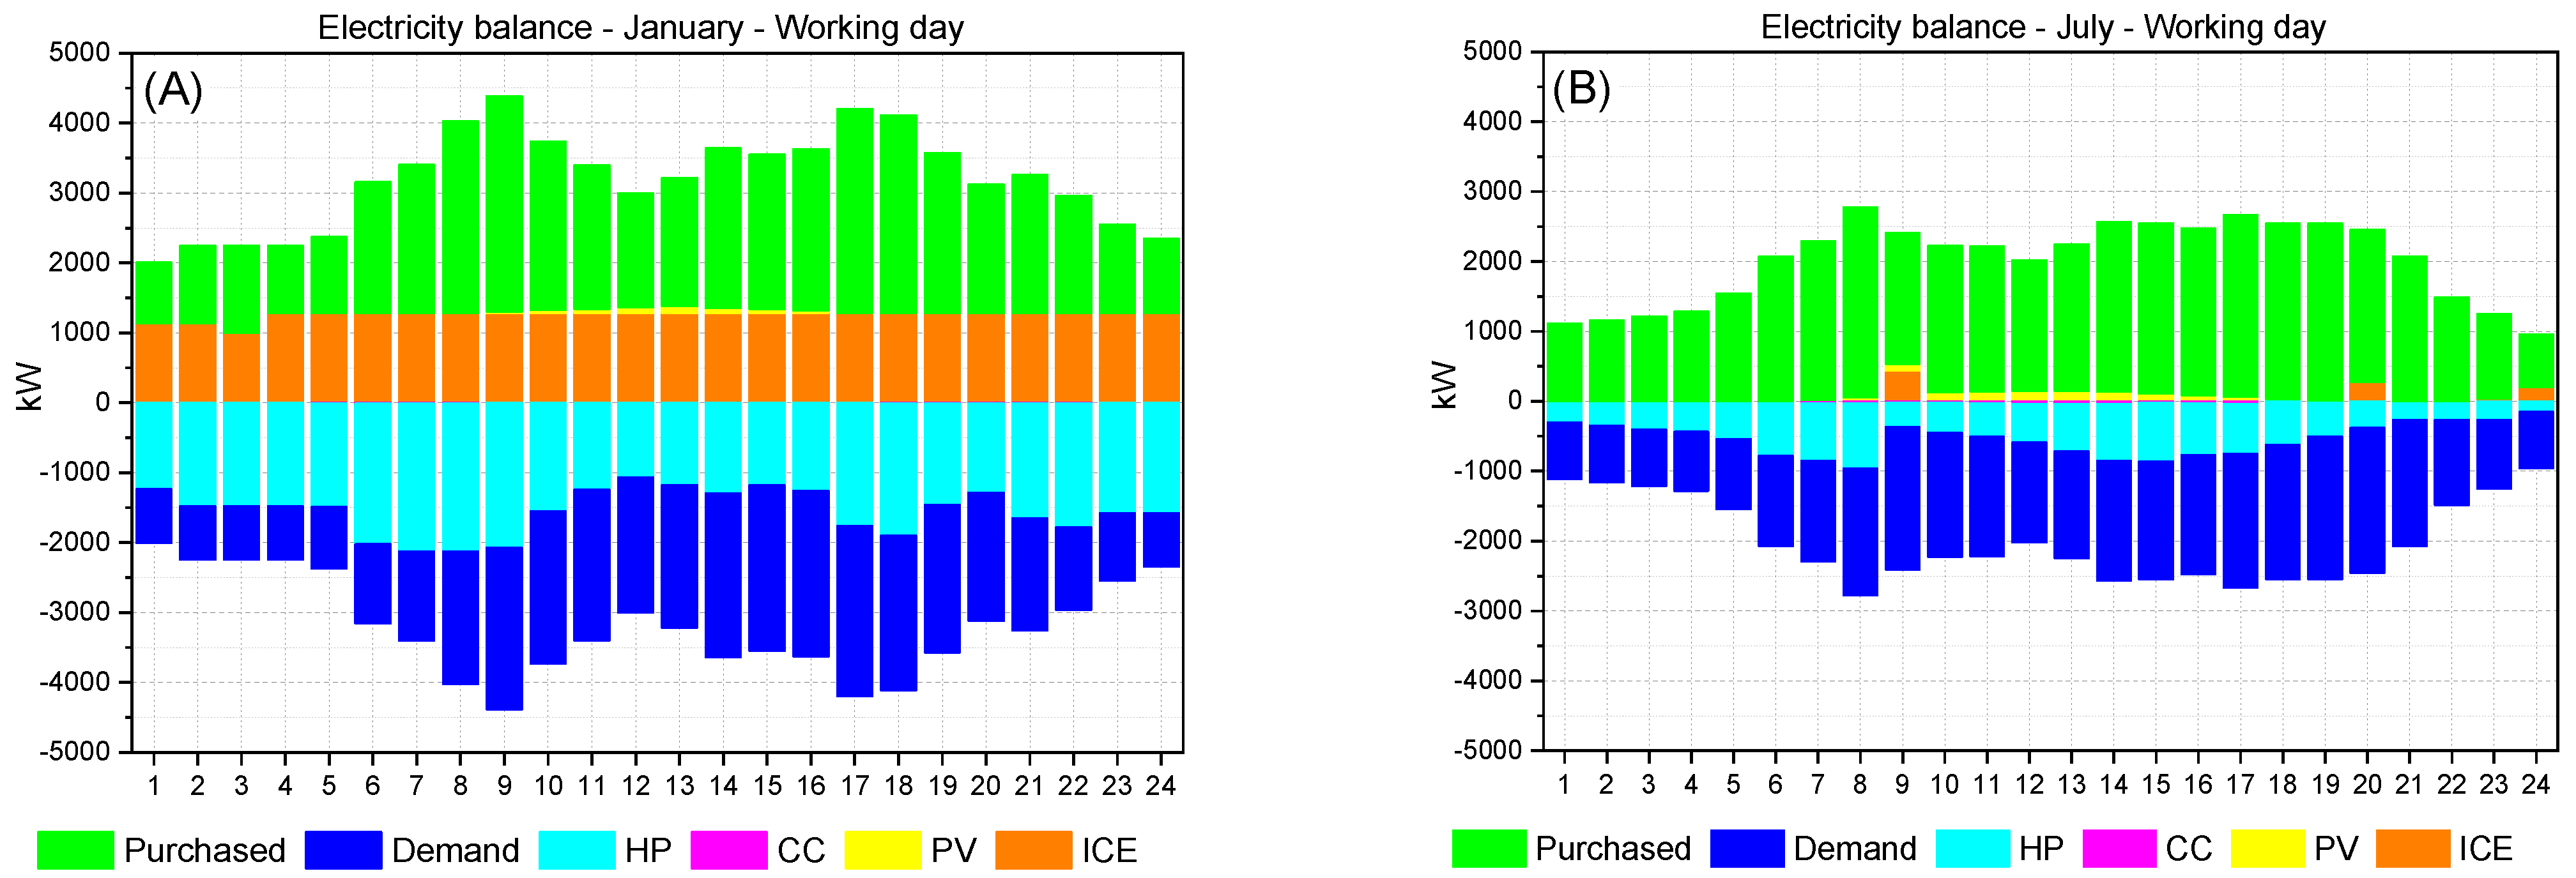
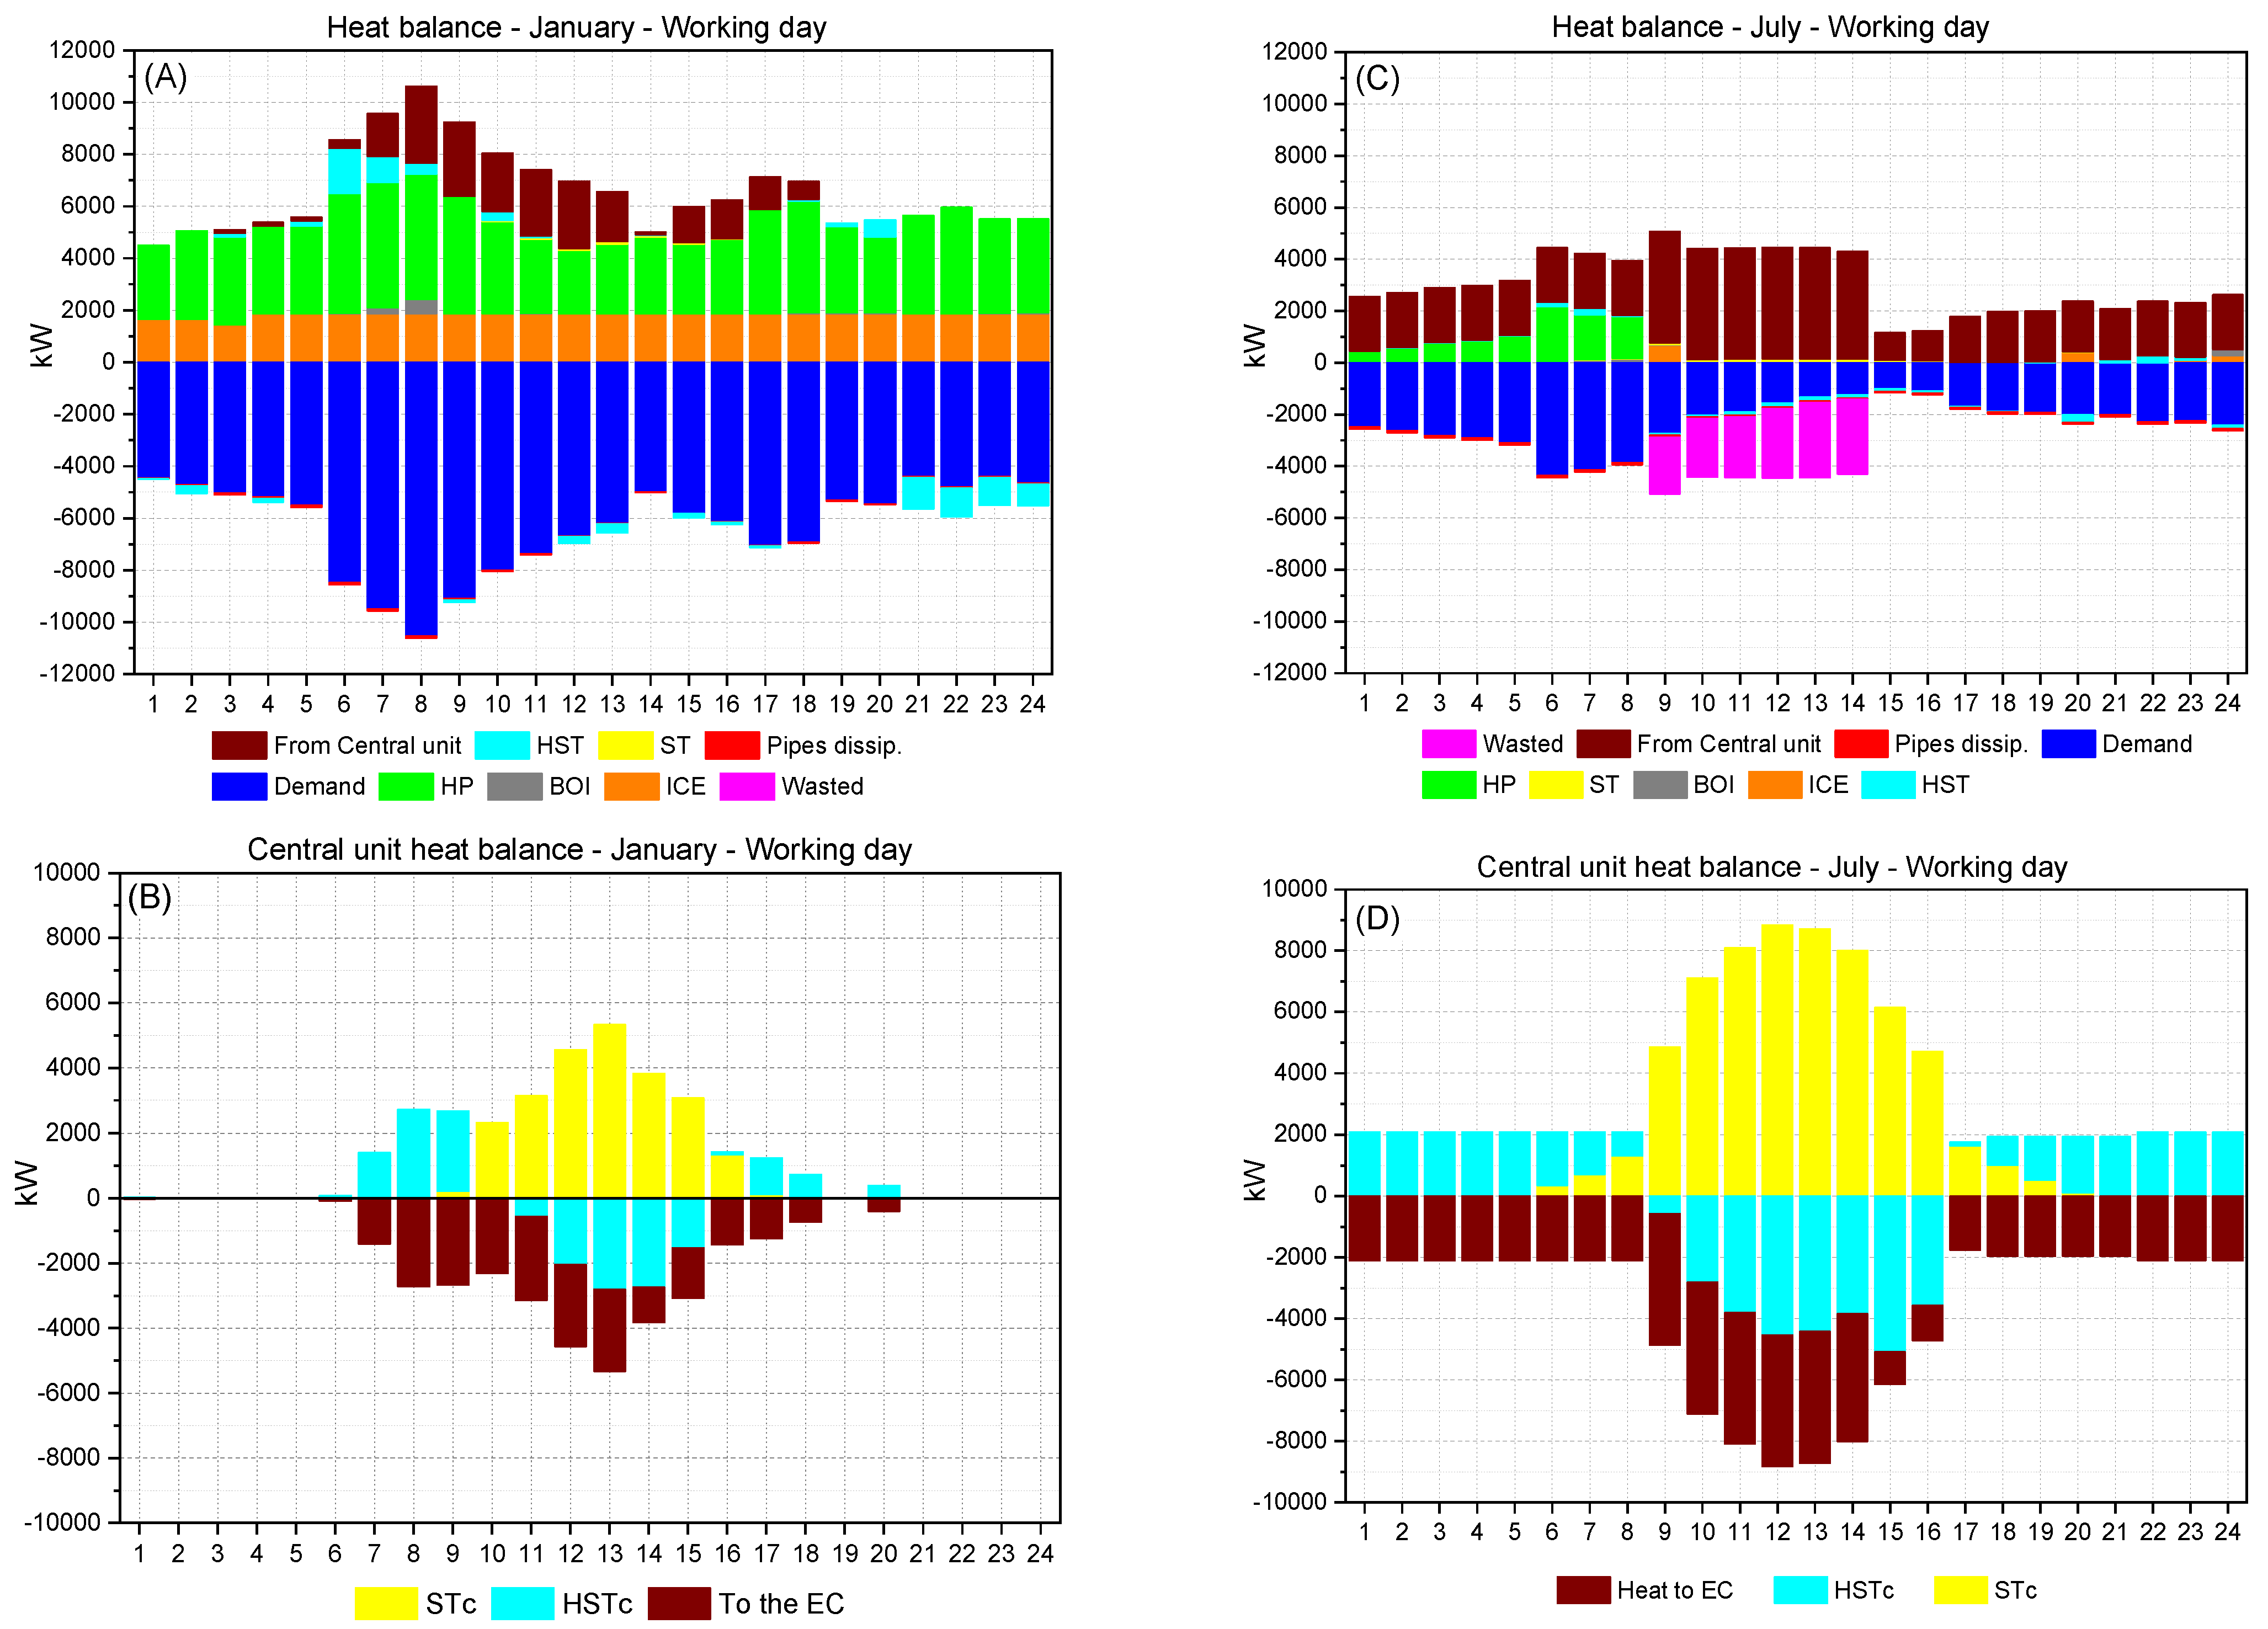
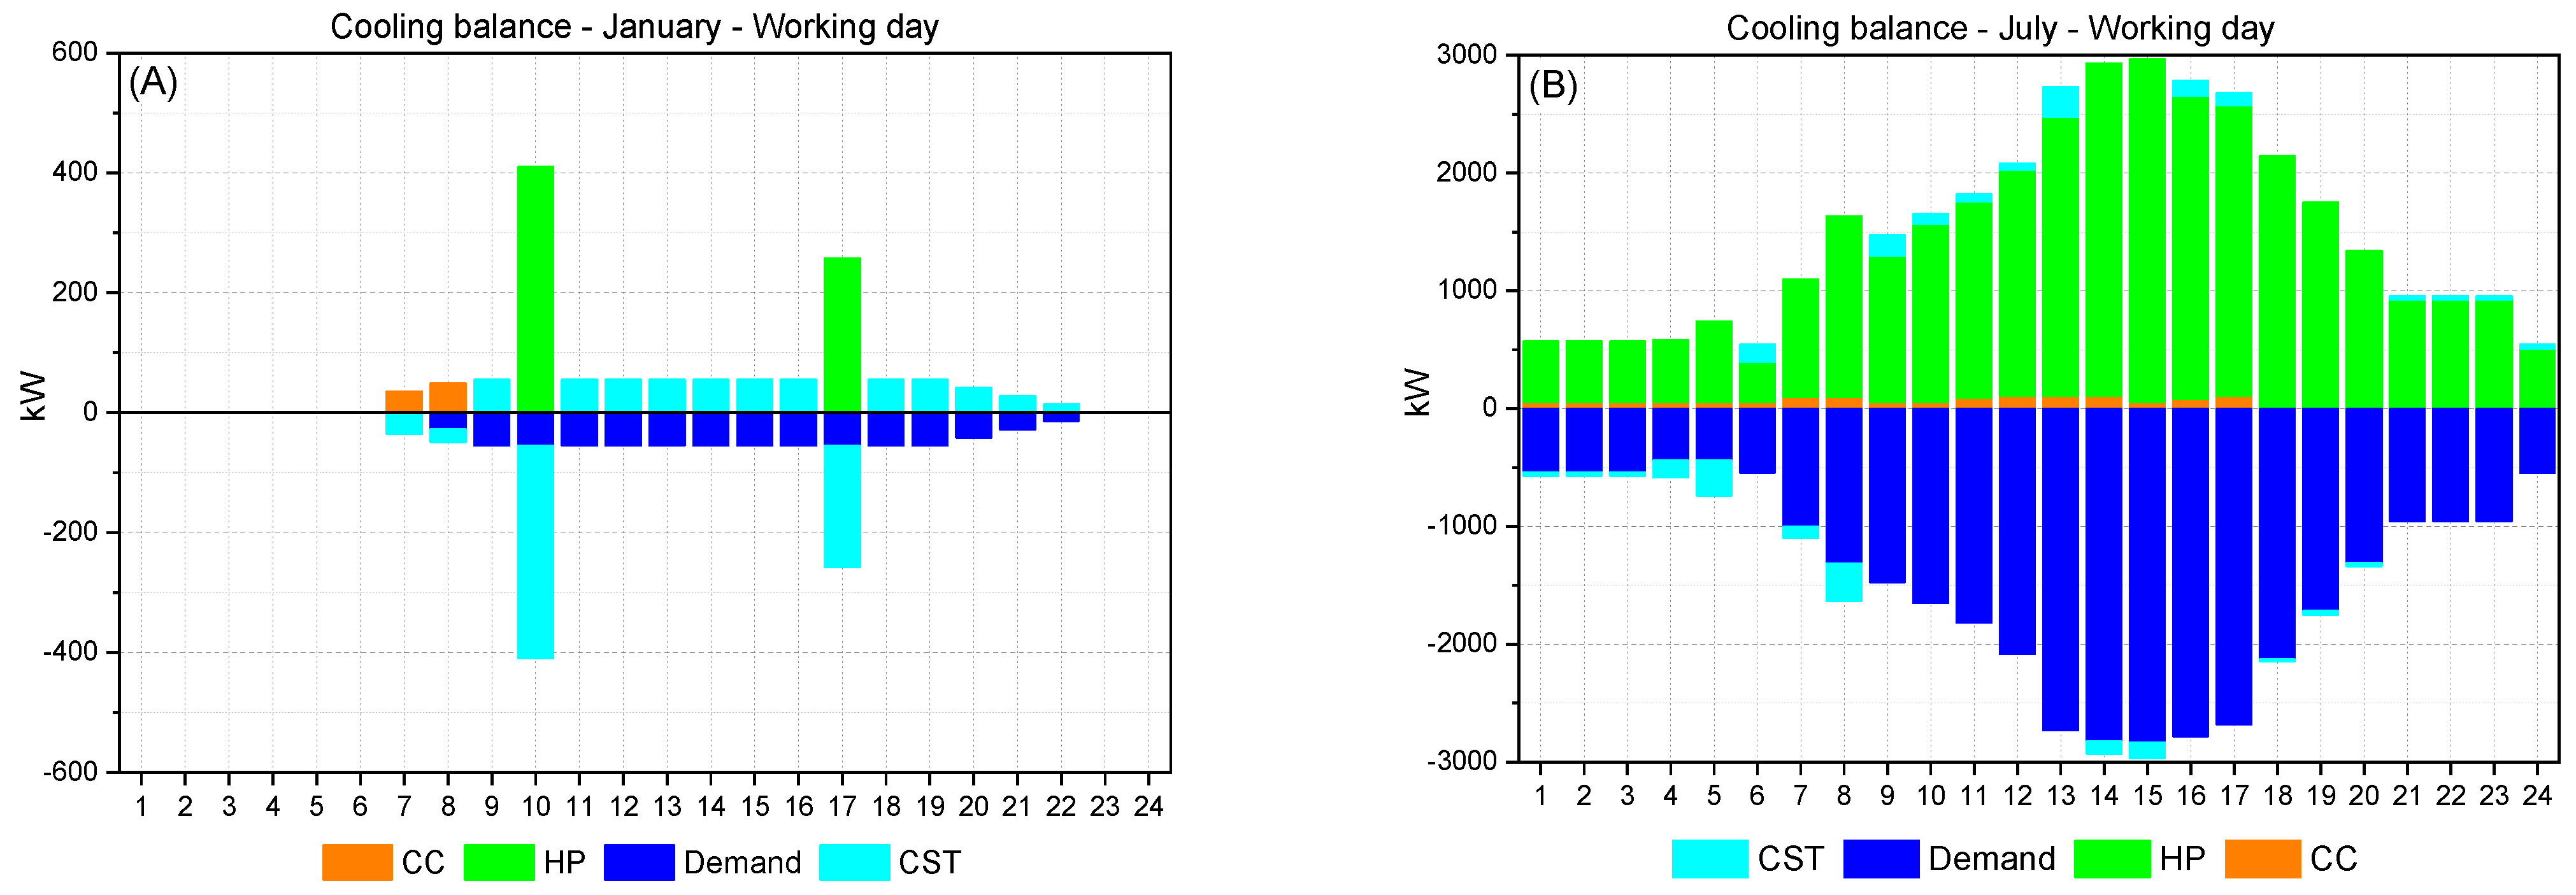
This section aims to provide the reader with a graphic visualization of the electricity, heat, and cooling balances for the entire EC and for one typical day in January and July (which can be found in
Appendix A). It should be noted that the balances are the results of the energy balances of all buildings together. Obviously, in this way there is no possibility to evaluate the energy magnitudes within each building, but it is possible to have an idea about (i) which technologies play the most important roles in the EC, (ii) the extent to which the renewable energy source (solar) is supporting the energy demand fulfilment, and (iii) the differences between the energy demand profiles in January (winter) and July (summer).
5.3. Multi-Objective Optimization
Real-world problems are rarely dependent on one objective only. Instead, they generally depend on two or more conflicting objectives. The resolution of such conflicting objectives, exemplified by the simultaneous minimization of total annual cost and total annual CO2 emissions, is addressed through a multi-objective optimization approach. In this type of optimization, a singular optimal solution, satisfying both objectives, is not possible. Instead, a group of trade-off solutions forms the Pareto front, in which enhancing one objective requires compromising the other.
In this study, the ε-constraint method is employed to determine the solutions in the Pareto front. This method optimizes the single objective function, while upper (in the case of minimization) bounds (ε-constraints) are established for the remaining function. Then, the problem is iteratively solved for different ε values, yielding the trade-off solutions comprising the Pareto front.
By designating the total annual cost as the primary objective function, the secondary objective function is transformed into an inequality constraint, establishing an upper limit on the total annual CO
2 emissions. The single-objective optimization solutions detailed in
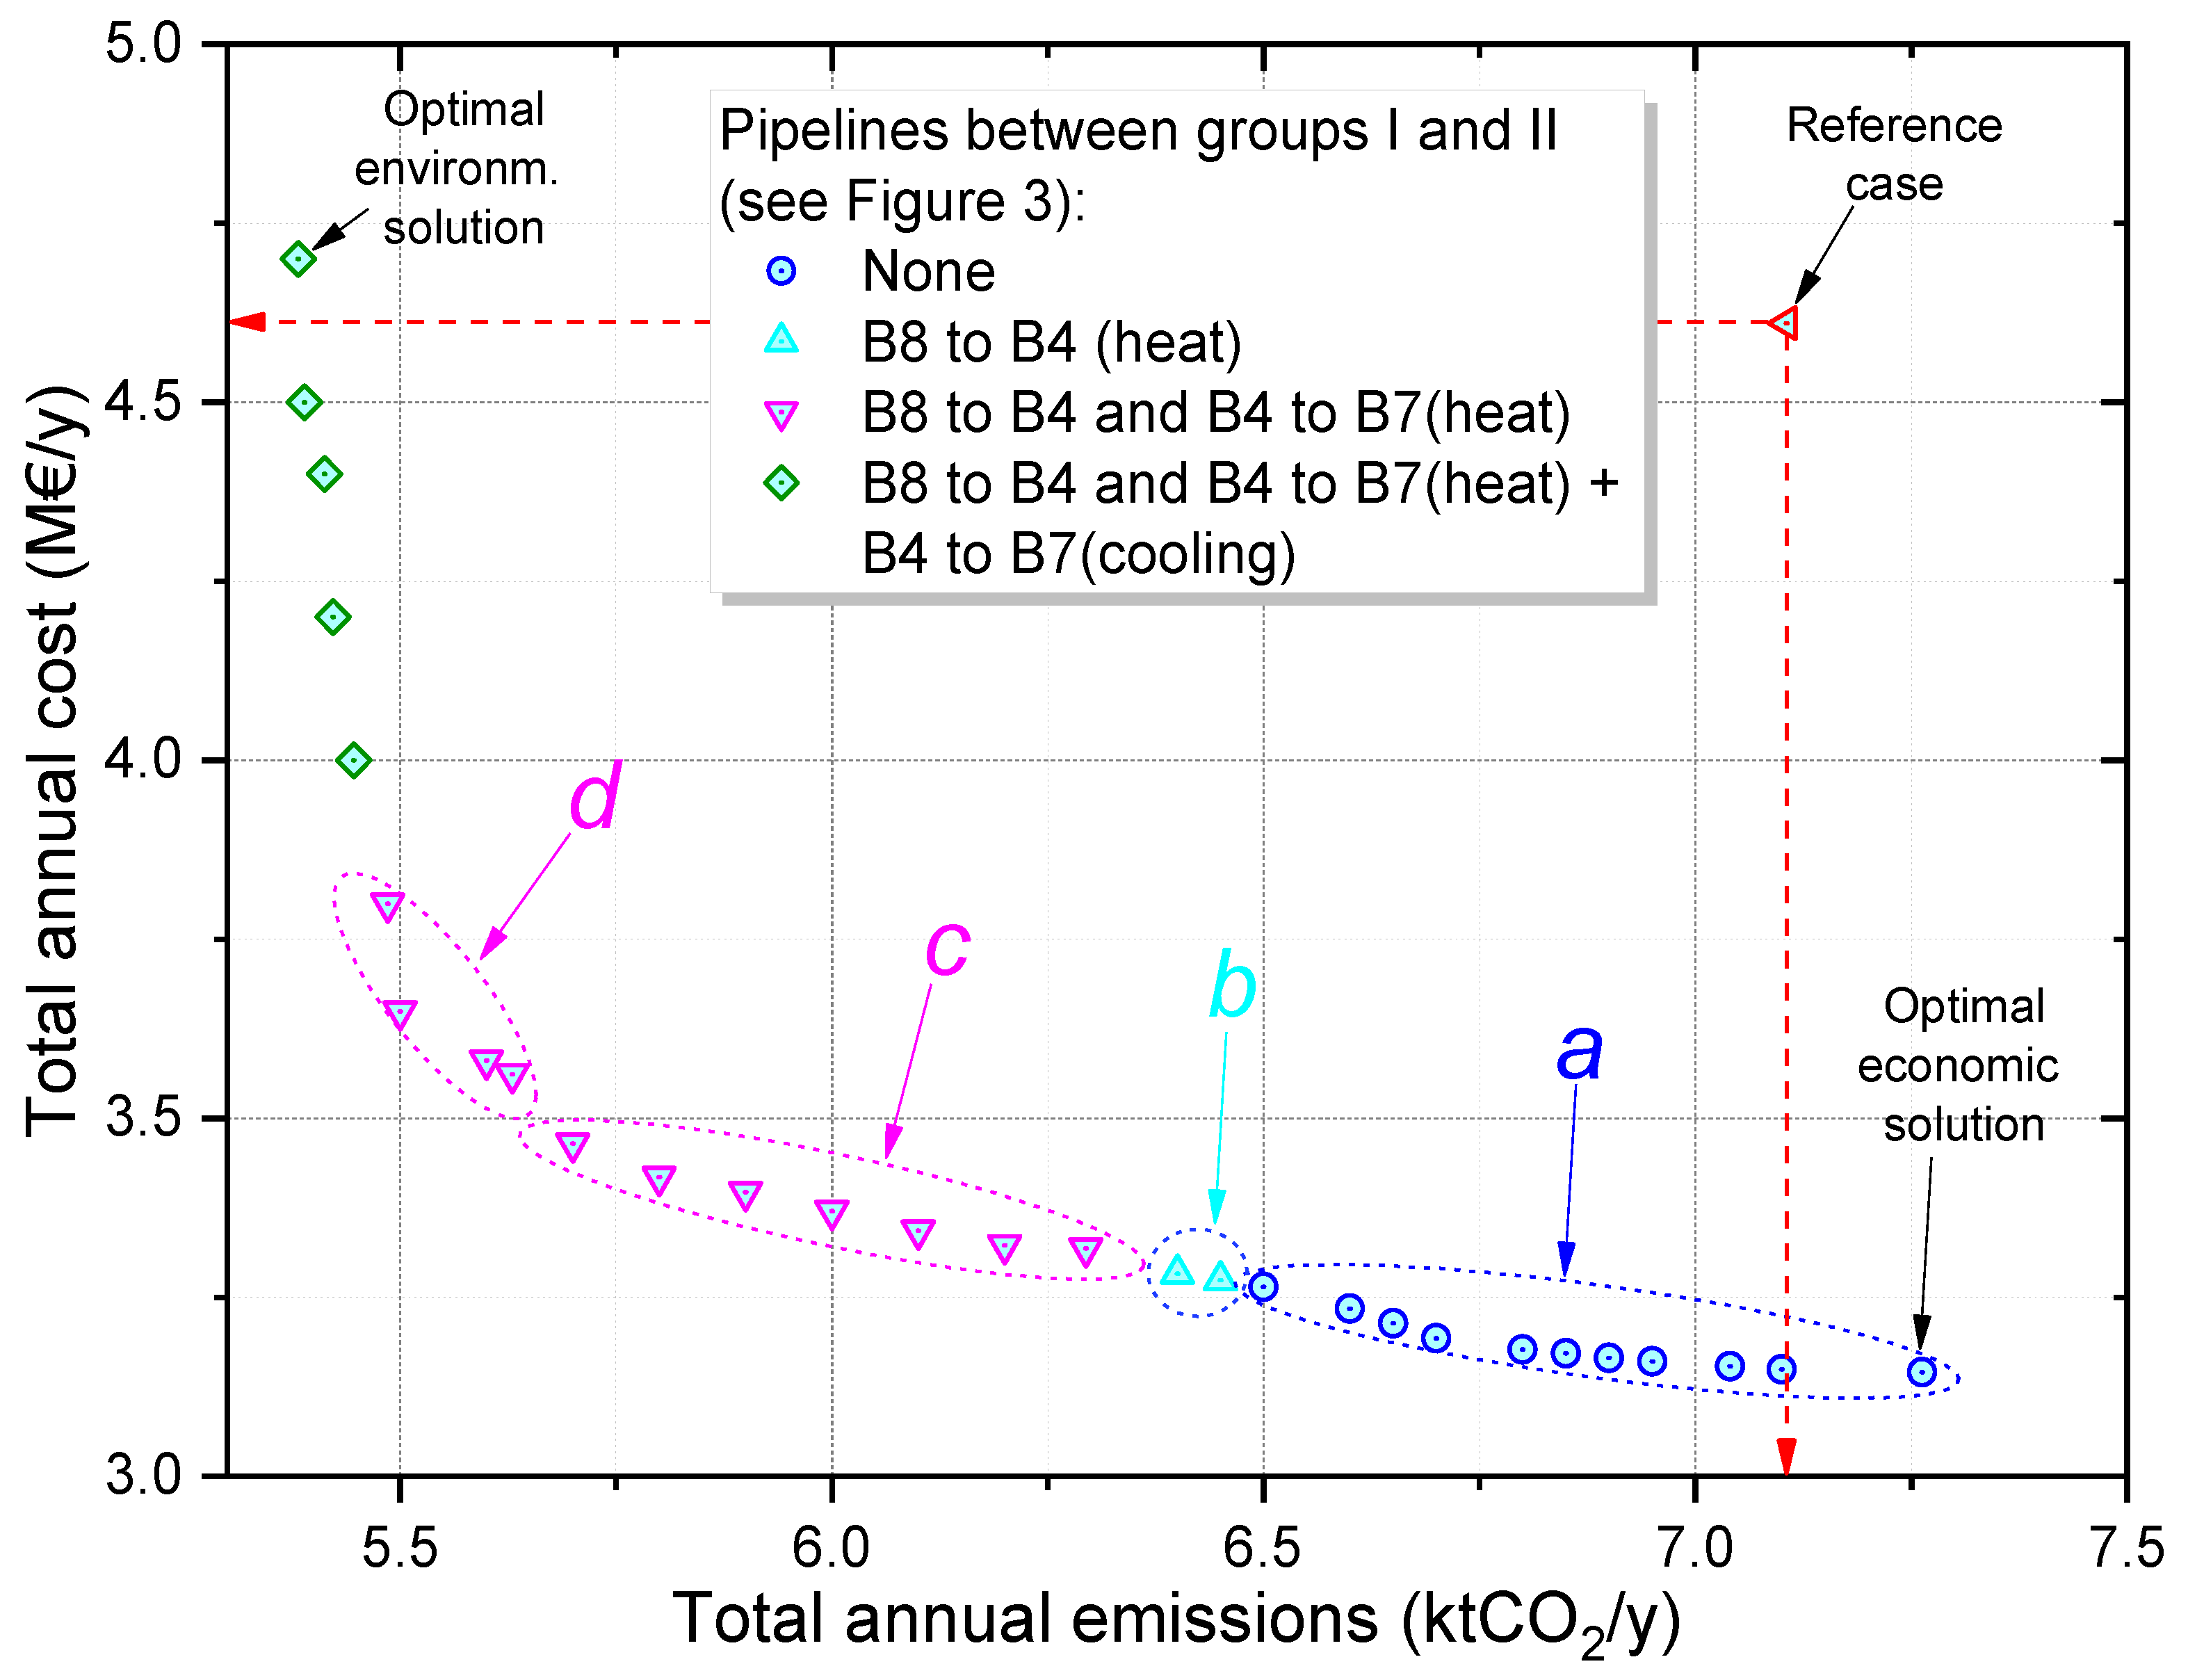
Section 5.2 delineate the boundaries of the Pareto front. As illustrated in
Figure 12, the Pareto front is confined within an upper limit of 7.26 kt CO
2/y (regarding the optimal economic solution) and a lower limit of 5.38 kt CO
2/y (regarding the optimal environmental solution).
Table 18 presents the results derived from successively solving the EC model for different ε values. The process started with the optimal economic solution and went all the way to the other end of the Pareto front, i.e., the optimal environmental solution. In this case, the ε values were consecutively lower total annual CO
2 emissions and the consequence was the Pareto front depicted in
Figure 12 with 29 solutions and different energy supply system structures as well as installed capacities. As indicated in the same figure, there are four sets of solutions (
a,
b,
c, and
d) which will be explained in the following paragraph.
It is interesting noting that the EC buildings can be divided into two groups of buildings: Group I in the south and Group II in the north (
Figure 3). The distances between buildings within each group are never more than 450 m. However, the distance between these two groups of buildings can reach up to 1800 m. This means more investment costs with pipelines and more heat losses, which consequently increases the overall operation cost. For that reason, the optimal economic solution (
Figure 12) and the following ten solutions (solutions
a) do not install any DHCN pipeline connection between the two groups of buildings. On the other hand, starting from solutions
b, the optimization installs pipelines between the two groups of buildings. In both points, within solutions set
b, a heat pipeline connection between buildings 8 and 4 is installed, which means that the heat produced by the solar thermal panels, in the central unit, starts to benefit not only buildings in Group II, but also the buildings in Group I.
The set of solutions c installs not only the heat pipeline connection between buildings 8 and 4, but also between buildings 4 and 7. It is worth noting that building 8 is already connected to building 7 through building 9. However, in the solutions c, the pipelines between buildings 8–9–7 are at full load. For that reason, if building 7 needs an additional amount of heat, it should come from building 4 (if it is more optimal than installing additional capacity for self-produced heat). Solutions d have the same characteristics as solutions c in terms of pipeline connections between the two groups of buildings. Nevertheless, they differ in two main aspects: (i) the installed capacities of STc and HSTc start to substantially increase in the central unit, and (ii) the installed capacities of two very-expensive technologies start to increase in the buildings—ICE and ABS. The remaining set of solutions, in the Pareto front (including the optimal environmental solution), have considerably high marginal costs when compared with the preceding solutions.
Another interesting analysis from
Figure 12 is the comparison between the reference case solution and the optimal economic and environmental solutions. As observed in the figure, from the reference case viewpoint, the optimal economic solution provided a much lower total annual cost with a slight increase in the total annual CO
2 emissions. The optimal environmental solution, in turn, showed a high potential of reducing the total annual CO
2 emissions with a slight increase in the total annual cost. Although the optimal economic solution (Sol. #1—
Table 18) is much cheaper (compared to the reference case), it emits 2.2% (or 157 t CO
2/y) more CO
2 per year. On the other side, the optimal environmental solution (Sol. #29—
Table 18) emits much less CO
2 than the reference case but is 1.9% (or 89 k€/y) more expensive.
Solution #2 presents approximately the same CO2 emissions level as the reference case but generates a total annual cost 32% lower (or 1,460,856 €/y less) than that of the reference case. Focusing on the points from the same set of solutions a (Sol. #2 to #11), Solution #11 requires an increase in the total annual cost, of 3.6% (or 115.1 k€/y), while providing a reduction of 8.4% (or 600 t CO2/y) in the total annual CO2 emissions, when compared to Sol. #2. Solutions b (Sol. #12 and #13) do not provide a substantial enhancement in terms of total annual costs and CO2 emissions when compared to Sol. #11. Moreover, solutions b would require the installation of almost 2 km of DHN pipeline between buildings 8 and 4.
The set of solutions
c (Sol. #14 to #20) comprises the results in which the total annual cost remained under 3.5 M€/y (
Figure 12). Comparing Sol. #20 with Sol. #14, the increase in the total annual cost was 4.4% (or 146.5 k€/y) while the total annual CO
2 emissions decreased by 9.4% (or 594.3 t CO
2/y). By analyzing
Table 18, it is possible to note that the main reason for this was the gradual decrease (down to zero) in the BOI installed capacity and the gradual increase in the STc and HSTc installed capacities in the central unit. Since, for these solutions, the buildings are better interconnected through DHN pipelines, the central unit is able to distribute its heat to the whole EC.
By analyzing the set of solutions
d (
Figure 12), Sol. #21 to #24, it is possible to note that the CO
2 emissions reductions start to become very expensive due to the fact that the installed capacities of ICE, BOI, ABS, and HSTc started to sharply increase. Thus, from those solutions on, the trade-off between costs and CO
2 emissions starts to become imbalanced.
Still analyzing
Table 18, some other key aspects are worth commenting on, although a more in-depth discussion is compromised by the fact that this table presents the installed capacities of all the buildings together. The comments are separated into bullet points as follows:
The MGT and ABS are not installed for the majority of the solutions; they are installed only when the optimization model is not too “worried” about total costs. The MGT is an alternative cogeneration component to the ICE. However, MGTs are more expensive and less efficient compared to ICE. A similar reasoning applies to ABS. As an alternative technology for cooling production, it is more expensive and less efficient than HP and CC. Moreover, heat from MGT, ICE, and/or ST should be available to feed the ABS. Therefore, since there is plenty of heat coming from the central unit in Solution #23, the self-produced heat within the buildings can be used to drive the ABS. MGT remains a non-optimal choice up to the last solution.
Solar technologies are implemented in every solution, whether it be in the buildings (PV + ST) or in the central unit. In the buildings, PV and ST share the available rooftop area in nearly every single solution. However, as observed in
Table 18, the solutions near the optimal economic one prioritize PV over ST, while the solutions near the optimal environmental one prioritize ST over PV. In the first case, an MGT is not installed, and the ICE has a relatively low installed capacity. For that reason, there are only two remaining options to cover electricity demand: purchase from the grid and PV. In the second case, the ICE installed capacities are around double those of the first case. For that reason, there is no need for additional electricity production from PV.
6. Conclusions
This work presented the development of a multi-objective optimization model, based on the MILP method, for an energy community (EC) consisting of a group of nine buildings plus a central unit sharing electricity, heating, and cooling among each other. The EC buildings (from the tertiary sector) are located in the city of Pordenone, northeast of Italy. One of the main objectives of the model was the integration of cogeneration systems and renewable energy technologies in order to reduce overall annual costs and CO2 emissions. In fact, the objective functions were the total annual cost (related to maintenance, investment, and hourly operation) and total annual CO2 emissions (related to the hourly operation). As a preliminary step, this paper provided the superstructure for both the buildings and central unit, the gathering of the input data, the mathematical model, and the reference case scenario.
The main contributions provided by this work can be summarized in the following bullet points:
Optimal synthesis and operation of polygeneration systems for ECs, characterized by complex integrated processes and dealing, at the same time, with: (i) a district heating and cooling network (DHCN) of pipelines connecting the buildings, (ii) a central unit to support the buildings’ energy demands, (iii) heat and cooling storage, (iv) management and distribution of self-produced and purchased electricity among the buildings and between the EC and the national electric grid, (v) integration of solar technologies, (vi) hourly electricity purchasing price, (vii) hourly electricity selling price, and (viii) hourly CO2 emissions factors.
Multi-objective optimization of the EC presenting a range of trade-off solutions through which it is possible to have important pieces of information about installed capacities, structure for the DHCN pipelines, total annual costs and CO2 emissions, cost of moving from one solution to another, and cost of choosing a more environmentally friendly solution.
Therefore, from a qualitative point of view and in accordance with the objective function, the results from the model indicated the optimal (i) energy supply system structure within each building, (ii) hourly operation of each technology, (iii) connections between buildings in terms of DHCN pipelines, (iv) distribution (among the buildings) of self-produced electricity and electricity purchased from the grid, and (v) energy supply system structure and hourly operation for the central unit. Moreover, the range of trade-off solutions provided by the results from the multi-objective optimization offers a set of information that allows decision makers to go in a direction that best suits their interests.
A quantitative analysis of the results obtained from the single-objective optimization of the EC case study shows the possibility of reducing the total annual costs by 31.9% (about 1.47 M€/year) with an increase of 2.2% in the total annual CO2 emissions (about 0.16 kt CO2/year), when the optimal economic solution is compared to the reference case. When considering the optimal environmental solution only, it shows a potential of reducing the total annual CO2 emissions by 24.3% (about 1.72 kt CO2/year) while increasing the total annual costs by 1.9% (about 0.09 M€/year), when compared to the reference case.
From the multi-objective optimization point of view, the solutions in the Pareto front offered options to reduce the total annual CO2 emissions from 2% (about 0.16 kt CO2/year) up to 26% (about 1.88 kt CO2/year), although reductions beyond 24% start to sharply increase the total annual costs, when compared to the optimal environmental solution. The total annual cost for such a reduction in the total CO2 emissions varied from 0.004 M€/year to 0.65 M€/year. Reductions in the total CO2 emissions beyond 25% can increase the total annual cost by over 1.0 M€/year, for the same comparison with the optimal environmental solution.
The EC model developed in this study offers a flexible and effective tool for optimally designing and operating polygeneration systems within energy communities (ECs), easily adaptable to various sectors including residential–commercial and industrial areas. This research has proven the model’s applicability in optimizing polygeneration systems across different types of buildings, establishing it as an effective instrument for the optimal design and operation of integrated energy systems. Future studies will focus on further extending the model by examining the impacts of aspects such as escalating costs, policy changes, technology degradation, and life cycle assessment of technologies. These expansions will enhance the understanding of the economic and environmental sustainability of polygeneration systems in ECs, focusing on critical factors that affect their long-term viability and effectiveness.
