Article

Data-Driven Occupancy Profile Identification and Application to the Ventilation Schedule in a School Building

by
Kristina Vassiljeva
1,2,*,
Margarita Matson
1,3,
Andrea Ferrantelli
1,4,5,
Eduard Petlenkov
1,2,
Martin Thalfeldt
1,6 and
Juri Belikov
1,3
1
FinEst Centre for Smart Cities (Finest Centre), Tallinn University of Technology, 19086 Tallinn, Estonia
2
Department of Computer Systems, Tallinn University of Technology, 12618 Tallinn, Estonia
3
Department of Software Science, Tallinn University of Technology, 12618 Tallinn, Estonia
4
Department of Mechanical Engineering, Aalto University, 00076 Espoo, Finland
5
Department of Civil Engineering, Aalto University, 00076 Espoo, Finland
6
Department of Civil Engineering and Architecture, Tallinn University of Technology, 19086 Tallinn, Estonia
*
Author to whom correspondence should be addressed.
Energies 2024, 17(13), 3080; https://doi.org/10.3390/en17133080
Submission received: 16 May 2024 / Revised: 14 June 2024 / Accepted: 18 June 2024 / Published: 21 June 2024
(This article belongs to the Section G: Energy and Buildings)

Abstract

:
Facing the current sustainability challenges requires reduction in building stock energy usage towards achieving the European Green Deal targets. This can be accomplished by adopting techniques such as fault detection and diagnosis and efficiency optimization. Taking an Estonian school as a case study, an occupancy-based algorithm for scheduling ventilation operations in buildings is here developed starting only from energy use data. The aim is optimizing the system’s operation according to occupancy profiles while maintaining a comfortable indoor climate. By relying only on electricity meters without using carbon dioxide or occupancy sensors, we use the historical data of a school to develop a DBSCAN-based clustering algorithm that generates consumption profiles. A novel occupancy estimation algorithm, based on threshold and time-series methods, then creates 12 occupancy schedules that are either based on classical detection with an on-off method or on occupancy estimation for demand-controlled ventilation. We find that the latter replaces the 60% capacity of current on-off schedules by 30% or even 0%, with energy savings ranging from 3.5% to 66.4%. The corresponding costs are reduced from 18.1% up to 62.6%, while still complying with current national regulations for indoor air quality. Remarkably, our method can immediately be extended to other countries, as it relies only on occupancy schedules that ignore weather and other location-specific factors.

1. Introduction

1.1. Motivation

Buildings account for a substantial 40% of global energy consumption and contribute nearly 35% of greenhouse gas emissions [1]. In the EU, around 35% of buildings are over 50 years old, with almost 75% of them lacking energy efficiency [2]. Therefore, prioritizing building renovations becomes crucial to improve energy efficiency while maintaining indoor climate quality through the implementation of new control and maintenance techniques. Techniques such as fault detection and diagnosis, efficiency optimization, and promoting sustainable changes in consumer behavior can play a significant role in reducing energy use in buildings, to align with the European Green Deal by 2050 [3]. Furthermore, post-occupancy evaluations have shown that work productivity strongly correlates with factors like thermal conditions, indoor air quality (IAQ), humidity, and lighting [4]. Recent findings have revealed a significant “performance gap” between calculated and actual energy use in buildings, often exceeding 300%, primarily due to the neglect of occupants’ behavior in simulations and calculations [5,6,7]. This highlights the importance of optimizing the scheduling of air handling units (AHUs) to meet the occupants’ demand for a more comfortable and flexible indoor climate while reducing energy consumption [8].
AHUs, which are key components of heating, ventilation, and air conditioning (HVAC) systems, can account for up to 50% of a building’s total energy consumption [9]. By adjusting AHU operations to align with occupancy patterns, energy waste can be minimized. This involves setting temperature and ventilation levels based on occupancy and the building’s thermal properties. For example, during winter, scheduling AHUs to lower the temperature in unoccupied areas during off-peak hours and restoring it to a comfortable level before occupants arrive can significantly reduce energy consumption. Similarly, in summer, raising the temperature in unoccupied areas and cooling them before occupants arrive can lead to energy savings.
Effective AHU scheduling requires a comprehensive understanding of occupancy patterns, thermal properties, and ventilation systems in the building [10]. The benefits are multifaceted, as it not only reduces energy consumption and operating costs but also enhances occupant comfort. By matching the HVAC system’s operations to occupancy patterns, occupants can enjoy a comfortable indoor environment while minimizing energy waste. Consistent temperature and ventilation levels in occupied areas can avoid discomfort caused by temperature fluctuations and drafts. Furthermore, optimizing scheduling can extend the lifespan of AHU equipment by reducing its workload, resulting in reduced maintenance costs.
Additionally, optimizing AHU scheduling helps buildings comply with energy regulations and avoid penalties or fines. Many countries and jurisdictions have energy efficiency targets for buildings, and by optimizing AHU operations, building owners and managers can meet these requirements while achieving energy savings and sustainability goals.

1.2. Background/Existing Solutions

Connecting AHU scheduling with occupancy estimation enables energy optimization, demand-based ventilation, comfort optimization, flexibility, and integration with other smart building systems. Occupancy-centric controls are gaining traction in building automation and energy management systems. Occupancy significantly impacts energy consumption, with variations of 30% to 150% depending on building use and occupant behavior. However, many state buildings still rely on centralized systems and static schedules, resulting in energy waste. Personalized occupancy profile models and machine learning algorithms can optimize building system operations based on specific occupant behavior, improving efficiency and adaptation over time [11].
Occupancy can be classified into two categories: occupancy detection and occupancy estimation. Occupancy detection determines whether someone is present in a space, while occupancy estimation aims to estimate the number of occupants. Additionally, considering the occupant activity level is crucial for building energy management systems. This information helps to estimate internal gains from occupants, optimizing building systems like AHUs and lighting for energy efficiency and occupant comfort [12].
However, achieving accurate occupancy solutions remains a challenge. Typically, occupancy count estimates are derived by combining data from various sensors, including CO 2 , vibration, ultrasonic, infrared, floor pressure, camera-based, and audio-based sensors [13]. These sensors provide valuable input for occupancy estimation, and the data fusion process enhances the accuracy of the occupancy count. Despite ongoing advancements, achieving a completely error-free solution is still an area of active research.
Traditional motion sensors, like passive infrared (PIR) sensors, have limitations in reliably detecting immobile occupants and may require a direct line of sight [14,15]. In large spaces like classrooms, a system of sensors may be needed, leading to higher installation and maintenance costs compared to RF-based systems [16,17]. Wi-Fi-based occupancy detection has gained popularity due to the prevalence of Wi-Fi-enabled devices [18,19] using device-free passive (DfP) detection or channel state information (CSI) methods, but careful consideration is necessary of privacy and safety concerns in settings like kindergartens and schools. CO 2 sensors combined with building models have been used for occupancy estimation, but their accuracy can be affected by various factors, and accurately determining CO 2 production for different age groups is challenging [20,21,22]. Cameras offer high precision for occupancy estimation, but privacy concerns, computational complexity, and lighting conditions can limit their effectiveness in certain situations [23,24,25].
Occupancy detection methods vary and are chosen based on building type, privacy, cost, and accuracy needs. Using multiple sensors or hybrid approaches can improve occupancy estimation, aiding building automation and energy management.
The advanced metering infrastructure (AMI) is key in analyzing building performance and enhancing occupant service. Studying load consumption profiles helps reduce peak-hour energy use, predict consumption, and detect anomalies. These profiles reflect electrical load variations over time due to on/off-peak usage and seasonal changes [26].
Electricity consumption data are increasingly used for occupancy detection in buildings due to their cost-effectiveness and insight potential. Analyzing these patterns can identify occupied and unoccupied areas [27,28,29].
One commonly used technique is the threshold method, where a threshold value is set for the power consumption of a specific area or zone. If the power consumption exceeds the threshold, it is assumed that the area is occupied, and if it falls below the threshold, it is assumed that the area is unoccupied. Determining the threshold value involves analyzing power consumption patterns during known occupancy and non-occupancy periods, calculating the average power consumption for each state, and setting the threshold accordingly [30,31].
Using electricity data and clustering techniques, we can detect occupancy based on power consumption patterns, offering a cost-effective way to understand occupancy dynamics and optimize operations. Unsupervised data mining or machine learning can identify similar behavioral patterns, providing insights into energy usage patterns and facilitating prediction.
When dealing with time-series data for energy usage and occupancy, it is crucial to consider seasonal changes, weather patterns, and external factors, like the COVID-19 pandemic, that can impact energy demand.
Various time-series analysis methods can be applied to extract features and patterns from individual consumer load data. Techniques such as K-means clustering, fuzzy C-means, hierarchical clustering algorithms, self-organizing maps (SOM), support vector machines (SVM), and density-based spatial clustering of applications with noise (DBSCAN) can help identify patterns and group similar load profiles together [32,33,34,35]. These methods enable a more comprehensive understanding of energy consumption behavior, taking into account factors such as hours of operation, weekdays versus weekends, seasonal variations, and holidays [36,37].
Forecasting future occupancy patterns within a building has become a significant trend, as it can inform advanced AHU controls and resource management strategies like targeted energy management and demand response. Recursive algorithms, such as the one developed by Schwartz et al. for daily occupancy forecasting, are used to predict occupancy patterns based on historical data. These forecasts can assist in optimizing building operations and energy usage [38].
However, existing research in AHU scheduling often relies on CO 2 sensors for occupancy detection, which can be limiting for buildings without such sensors and may not account for the impact of ventilation on CO 2 levels. Additionally, some approaches incorporate external features, like weather information, which may not be applicable as the heating system is independent of ventilation, and air conditioning is not always present in all buildings.

1.3. Problem Statement and Novelty of the Study

In this paper, we propose an approach that aims to fully automate the AHU scheduling process by utilizing electricity meters for occupancy detection instead of CO 2 sensors, making it applicable to buildings without specialized sensors. Moreover, we eliminate the reliance on external features and focus on computationally efficient algorithms that leverage existing information, such as electricity consumption profiles, to enable informed decision-making for optimizing the AHU system operation.
Although the approach of this study is relatively formal, our aim is very practical. For example, if the occupancy schedule indicates that the building (here, the school) is unoccupied during weekends or vacations, the scheduling algorithm can adjust the settings to reduce energy consumption, resulting in energy savings and cost reduction. On the other hand, if the occupancy schedule indicates that the building is occupied during workdays, the AHU scheduling algorithm can ensure that the building is comfortable and adequately ventilated during those times. By effectively managing the AHU schedule based on the occupancy timetable, the proposed method can help improve the energy efficiency, comfort, and cost-effectiveness of the building techno-system. Our methodology ensures that all algorithms are computationally efficient as well as based on data that are readily available and easily accessible, as the system needs to be able to recompute for multiple buildings.

2. Methods

2.1. Proposed Solution and Algorithms

The proposed occupancy-based ventilation scheduling method comprises multiple steps (illustrated in Figure 1). Historical data are first collected and stored from available electricity meters (Step I, see Section 2.2), then pre-processed and cleaned from outliers (Step II, Section 2.3). A clustering algorithm is then trained using a subset of the historical data (Step III, see Section 2.4) to generate consumption profiles for the system. These consumption profiles are then fed into an occupancy detection or estimation algorithm (Step IV, Section 2.5) to construct occupancy profiles. By labeling future time periods as workday, weekend, or vacation, and applying the occupancy profiles in conjunction with the labels, an occupancy schedule can be created (Step V, see Section 2.6) to describe the presence of people in the building. Based on the occupancy schedule, adjustments to the AHU schedule can be made to maintain a comfortable indoor climate without any disruption (Step VI, Section 2.7).

2.2. Step I: Data Sources and Data Collection

Metered data were obtained from a school in Estonia that underwent renovations and was completed in August 2020. Smart electricity meters were used to collect data at an hourly resolution scale, which could be accessed through a building management system (BMS). The measuring points included those denoted the Main Meter1 and the Kitchen Main Meter2, as well as ventilation units (SV01–SV11).
To gain a better understanding of the occupants’ behavior at the school, the total lighting and plug loads were also added. To determine the electricity usage of non-air-conditioning loads, such as plugs and lighting in a building, a simple yet effective method is to subtract the total energy usage of all AHU systems from the readings of the main meter. This approach provides a convenient way to estimate the energy consumption of all other electrical devices and appliances within the building, including lighting, computers, and other office equipment.

2.3. Step II: Data Cleaning

Firstly, missing data, outliers, and noise were removed to ensure accurate clustering analysis. Additional data engineering was needed to correct errors, like the significant peak in August 2021 due to a sensor disconnection and subsequent main meter calibration. This outlier was replaced with the last accurate value. For comparing consumption across buildings, data scaling/normalization was also necessary to capture temporal variations over absolute values [33].

2.4. Step III: Creating Usage Profiles: Clustering

The choice of clustering method is crucial for a smart platform for educational buildings, impacting accuracy and reliability. K-means is commonly used but has drawbacks, like pre-determined cluster numbers and initial centroids, leading to suboptimal results with diverse load profiles. Outliers also influence centroids, requiring data preprocessing [36,39].
Incorrect cluster numbering can affect the platform’s effectiveness in optimizing energy usage and ventilation schedules. To address these issues, DBSCAN, an alternative clustering method, should be considered. It identifies clusters of different shapes and sizes and isolates outliers, which is relevant for educational buildings with various load profiles and anomalies [40,41].
In general, a minimal number of points n min to core point identification can be set as
n min D + 1 ,
where D is the number of dimensions in the dataset and
p N ϵ ( q ) , | N ϵ ( q ) | > n min ,
N ϵ ( p ) = { q D dist ( p , q ) ϵ } ,
where N ϵ ( p ) is the ϵ -neighborhood of the point p, q is a dataset point, and dist ( p , q ) is the according distance function [42].
Selecting the appropriate values for ϵ and n min according to the specific dataset is now crucial. To start with, we typically set n min to a value between 3 and 5, depending on the size of the dataset. For larger datasets, we recommend selecting a higher value for n min .

Electricity Usage Profiles

Our approach defines a consumption profile P F as an hourly time series for a single day, with each hour denoted by a value P F ( h ) , measured in kilowatt-hours (kWh), representing the typical usage of “plugs and lighting” for that day. We distinguish between separate profiles for workdays— P F ( w d ) , weekends— P F ( w e ) , COVID period— P F ( c o v ) , and school vacation— P F ( v a c ) . To obtain any profile P F , we apply the clustering method described above to train data that include examples of previous behavior for the same types of days. For instance, to obtain the workday profile P F ( w d ) , the training data should only contain workdays. The resulting profile will be the centroid of the cluster.
In cases where there are additional clusters with more centroids, the centroid that most accurately describes the training data should be selected based on the mean absolute percentage error (MAPE):
M = 100 % n t = 1 n A t C t A t ,
where A t is the explicit day consumption value and C t is the centroid value.

2.5. Step IV: Creating Occupancy Profiles: Occupancy Detection and Estimation

Occupancy detection (or estimation) based on load monitoring uses smart meter data and load monitoring technology to determine occupancy patterns in buildings. By analyzing the power consumption of appliances and devices within a building, it can provide valuable insights into when and how spaces are being used [43].
To create occupancy profiles, we propose two methods as follows: First, occupancy detection (Section 2.5.1), which involves using algorithms to detect the presence or absence of occupants in a building based on the so-called threshold approach. The second method, occupancy estimation (Section 2.5.2), involves using algorithms to estimate the number of occupants in a building based on the power consumption data.
Both methods can be applied to the previously computed “plugs and lighting” consumption profiles (see Section 2.2).

2.5.1. Occupancy Detection

The process of determining whether people are present or absent in a space is commonly referred to as occupancy detection. In our proposed approach, we utilize a threshold-based method for occupancy detection, which involves setting a pre-determined threshold for the “plugs and lighting” electrical consumption. For each single day, an occupancy profile is defined as a time series with binary hourly values O ( h ) . Each value in this series indicates whether the space is occupied or unoccupied during a specific hour, and it is computed using a threshold-based method, where we compare the power consumption value Q e ( h ) at a given hour to a calculated threshold value defined as Q e m i n + ( Q e m a x Q e m i n ) · δ . Here, Q e m a x and Q e m i n represent the maximum and minimum values of the consumption time series over a pre-determined period (such as daily or weekly). The user-defined threshold value  δ is determined through a process of experimentation and analysis. It is essential to set δ at a level that is sufficiently high to distinguish between occupied and unoccupied states but low enough to avoid false positives. After rigorous testing, we found that δ = 0.4 provided the best fit for the consumption curve.
A monthly dataset was used to create two electricity usage profiles: weekdays and weekends. The occupancy detection algorithm analyzed these daily profiles, effectively capturing daily occupancy variations. This method was found to be well suited for the application.
The binary values in the resulting occupancy profile O ( h ) are straightforward: when the power consumption at a given hour exceeds the calculated threshold value, O ( h ) is set to 1, indicating occupancy during that hour. Conversely, if the consumption falls below the threshold, O ( h ) is set to 0, signifying that the space is unoccupied at that time.
O ( h ) = 1 , if Q e ( h ) > Q e m i n + ( Q e m a x Q e m i n ) · δ 0 , otherwise

2.5.2. Occupancy Estimation

Occupancy estimation involves estimating the number of people that are present in a given space or area. However, here we do not aim to estimate the exact number of people. Instead, we define the occupancy profile N ^ as a time series with values N ^ ( h ) for each hour, where N ^ ( h ) [ 0 , 1 ] represents the estimated occupancy level for that hour. The value of N ^ ( h ) is calculated via the formula
N ^ ( h ) = Q e ( h ) Q e m i n Q e m a x Q e m i n ,
where Q e m a x and Q e m i n represent the maximum and minimum values of the consumption time series over a pre-determined period (daily). The resulting value of N ^ ( h ) is between 0 and 1, representing the ratio of full occupancy at that particular hour.

2.6. Step V: Creating an Occupancy Schedule

To generate an occupancy schedule, we need to consider two main components: occupancy profiles and a designated labeled time period for which the schedule will be generated. The set of labels used to label the time period is denoted as L = { w d , w e , c o v , v a c } , representing workday, weekend, COVID, and vacation, respectively.
The labeled time period for which we are scheduling is defined as:
S c h L = { L 0 , L 1 , , L n } ,
where
  • n is the length of the scheduled period in days, and
  • L 0 , L 1 , , L n are labels from the set L used to denote each day of the scheduled period.
The occupancy schedule is then defined as the concatenation of occupancy profiles with respect to the labels of the period:
O Sch = { O L 0 , O L 1 , , O L n } ,
where O L 0 , O L 1 , , O L n are occupancy profiles obtained from the occupancy detection algorithm. Similarly, for the occupancy estimation schedule, we have the following definition:
N ^ Sch = { N ^ L 0 , N ^ L 1 , , N ^ L n } ,
where N ^ L 0 , N ^ L 1 , , N ^ L n are occupancy profiles obtained from the occupancy estimation algorithm.

2.7. Step VI: Creating Ventilation Schedules

The proposed air exchange timetables cover two cases: classical—based on occupancy detection, and the demand-controlled ventilation (DCV) strategy—based on occupancy estimation. The choice between these two methods for ventilation scheduling depends on the specific needs of the building, available resources, the desired level of control, and legislation applied in specific regions.

2.7.1. Classical Approach Based on Occupancy Detection

When using occupancy detection with simple presence detection, the AHU schedule can be based on turning the ventilation on or off depending on the presence or absence of occupants as indicated in the occupancy schedule O Sch .
Additionally, it is possible to consider maximum and minimum air flows for scheduling, so the O Sch values will correspond to a specific airflow. In occupancy detection, “0” represents the minimum airflow rate required for the basic ventilation and “1” represents the maximum airflow rate that will be set for ventilation,
A O Sch = { A O L 0 , A O L 1 , , A O L n } ,
where A O L 0 , A O L 1 , , A O L n are the corresponding airflow rates as a percentage of the maximum airflow q max associated with these occupancy levels.
However, the AHU scheduling is also influenced by compliance with legal requirements or regulations related to ventilation, like minimum ventilation rates, fresh air intake regulations or specific guidelines for indoor air quality [44], or by the building’s design, location, and orientation. Adjustments may be needed for climate factors or features like large windows that allow natural ventilation.

2.7.2. Demand-Controlled Ventilation Strategy Based on Occupancy Estimation

In demand-controlled ventilation (DCV), the airflow rates are dynamically adjustable based on the number of occupants or demand of the space. It aims to provide ventilation in proportion to the number of occupants or the level of pollutants that are present, rather than relying on fixed ventilation rates.
Occupancy estimation can be one method used within a DCV to estimate the number of occupants in a room. To generate an AHU schedule based on occupancy estimation within a DCV system, the air flow of the AHU can be adjusted as a percentage, denoted by N ^ Sch , of its maximum airflow, namely,
A N ^ Sch = { A N ^ L 0 , A N ^ L 1 , , A N ^ L n } ,
where A N ^ L 0 , A N ^ L 1 , , A N ^ L n are airflow adjustments (as a percentage of the maximum airflow) for a specific day.
To comply with legal regulations or requirements, the AHU schedule may need to be further adjusted. This could include setting a minimum airflow rate to meet ventilation standards (ANSI/ASHRAE Standard 62.1-2019 [45], EN 16798-1:2019 [46] and Estonian Regulation RT I, 10.01.2023, 12 [47].

2.7.3. Determination of Minimum Airflow Rate for Scheduling Procedure

Even with no occupants ( q min = 0 [ l / s ] ), maintaining minimum ventilation is recommended for air quality. This depends on local building rules and guidelines. Adherence to these standards when unoccupied prevents issues related to poor air quality [48].
Studies suggest that an effective approach is to operate the continuous fan airflow at a fraction of the baseline rate, typically between 13 and 40%. Implementing this strategy during unoccupied periods can strike a balance between maintaining air quality and reducing energy consumption [49].

2.7.4. Pre- and Post-Occupancy Flush Out

Pre-occupancy flush-out periods can be a beneficial strategy to enhance indoor air quality, reducing the recovery period and potentially saving energy. This approach involves rapidly ventilating the rooms with fresh outdoor air before occupants return, effectively purging any stagnant or potentially polluted air [49].
Occupant peak exposure reduction, shorter recovery periods, and energy savings can thus be realised, particularly when no ventilation air is provided during unoccupied hours. During the flush-out period, the ventilation system is typically set to a maximum airflow rate to achieve a high air exchange rate within the space and remove the contaminants that may have accumulated during unoccupied periods. It is noteworthy that the Estonian regulation on indoor climate in non-residential buildings [47] requires the application of this precise strategy.

2.7.5. Schedule Scenarios

Based on the techniques that were proposed in Section 2.7.1 and Section 2.7.4, a variety of ventilation scheduling scenarios were created. These scenarios encompass different techniques and combinations to calculate general energy consumption.
The approaches include (Table 1):
  • Classical occupancy detection with on-off method (Schedule 1).
  • Classical occupancy detection with reduced minimum airflow corresponding to the value used in a specific AHU, see Schedule 2.
  • Classical occupancy detection with reduced minimum airflow set to 30% of the maximum level, see Schedule 3.
  • Schedules 4 to 6 involve combining the corresponding Schedules 1 to 3 with a pre- and post-occupancy detection flush strategy.
  • Schedules 7 to 12 replicate the approaches 1 to 6, but instead of using classical occupancy detection, they utilize occupancy estimation techniques for DCV.
Table 1. Schedule scenarios.
ScenarioBase MethodMinimal Allowed AirflowFlush
Schedule 1ClassicalUnoccupied
Schedule 2ClassicalReduced
Schedule 3ClassicalReduced 30%
Schedule 4ClassicalUnoccupiedFlush
Schedule 5ClassicalReducedFlush
Schedule 6ClassicalReduced by 30%Flush
Schedule 7DCVUnoccupied
Schedule 8DCVReduced
Schedule 9DCVReduced by 30%
Schedule 10DCVUnoccupiedFlush
Schedule 11DCVReducedFlush
Schedule 12DCVReduced by 30%Flush

2.7.6. AHU Demand/Air Flow Relation

To calculate the AHU demand by taking into account the air flow, several equations can be utilized. First, if P AHU and P fan are, respectively, the powers of the air handling unit and of the fan, we can write
P AHU = P fan · 2 .
The AHU is in fact usually composed of two ventilation systems, one for supply and one for exhaust. Typically, the energy consumption of both systems is kept at the same level, meaning that the total power consumption of the AHU can be divided by two. However, if there is a difference in the consumption of the inflow and outflow systems, the total power consumption can be proportionally split based on the energy consumption of each system, namely,
P max fan = S F P fan · q max fan ,
where S F P is a specific fan power. On the other hand, the maximum consumption of the fan can be found by using the cube law for fans, stating that the power required to operate a fan is proportional to the cube of the air volumetric flow rate q. Thus, if a maximum q max is known, P max fan can be calculated as follows [50]:
P max fan = R fan · q max fan 3 .
From Equations (11)–(13), we can derive the flow resistance R fan as
R fan = P max fan q max fan 3 ,
and finally,
P fan = R fan · q fan 3 = R fan · A · q max fan 3 ,
where A is the air flow coefficient from the AHU schedule.

3. Results

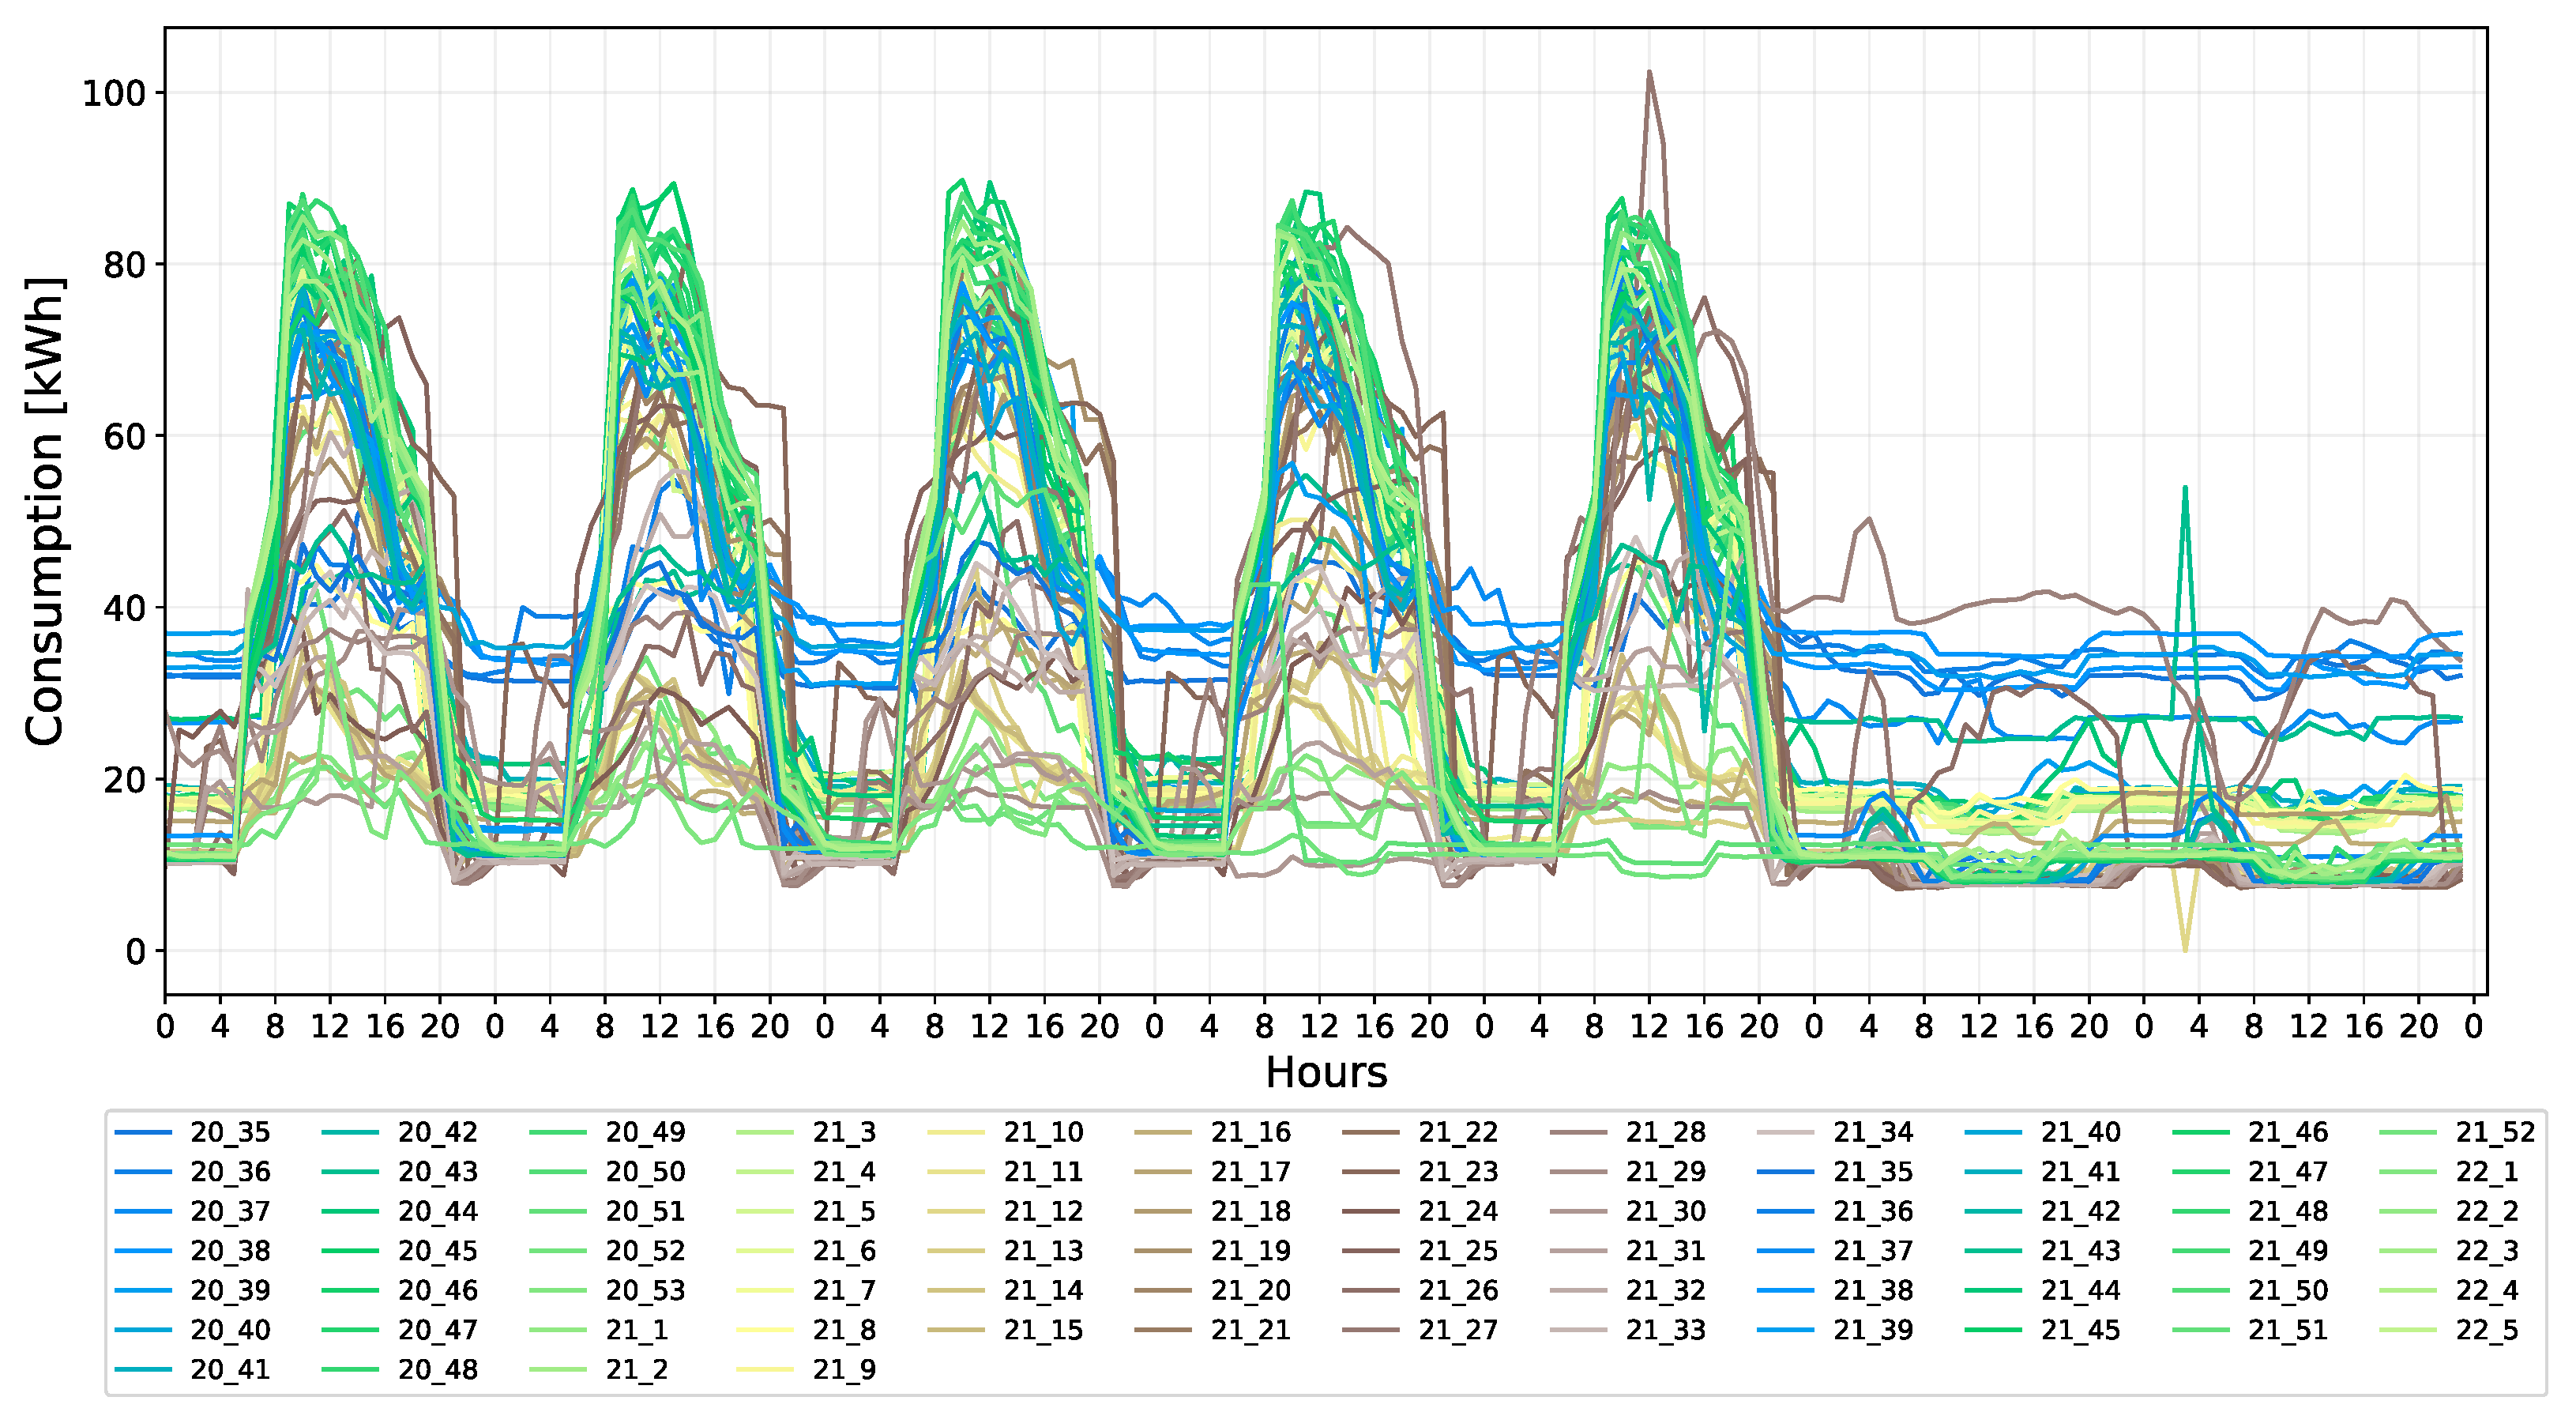
The data prepared in Section 2.2 were first aggregated by reshaping the raw time series into segments that cycle weekly, as shown in Figure 2, to comprehend the impact of specific days of the week on daily electricity load patterns (DELPs) [51]. It provides an overview of load patterns over longer time spans, aiding in capacity planning, trend identification, and managing demand response programs. However, it may lose fine-grained details and obscure patterns at lower levels.
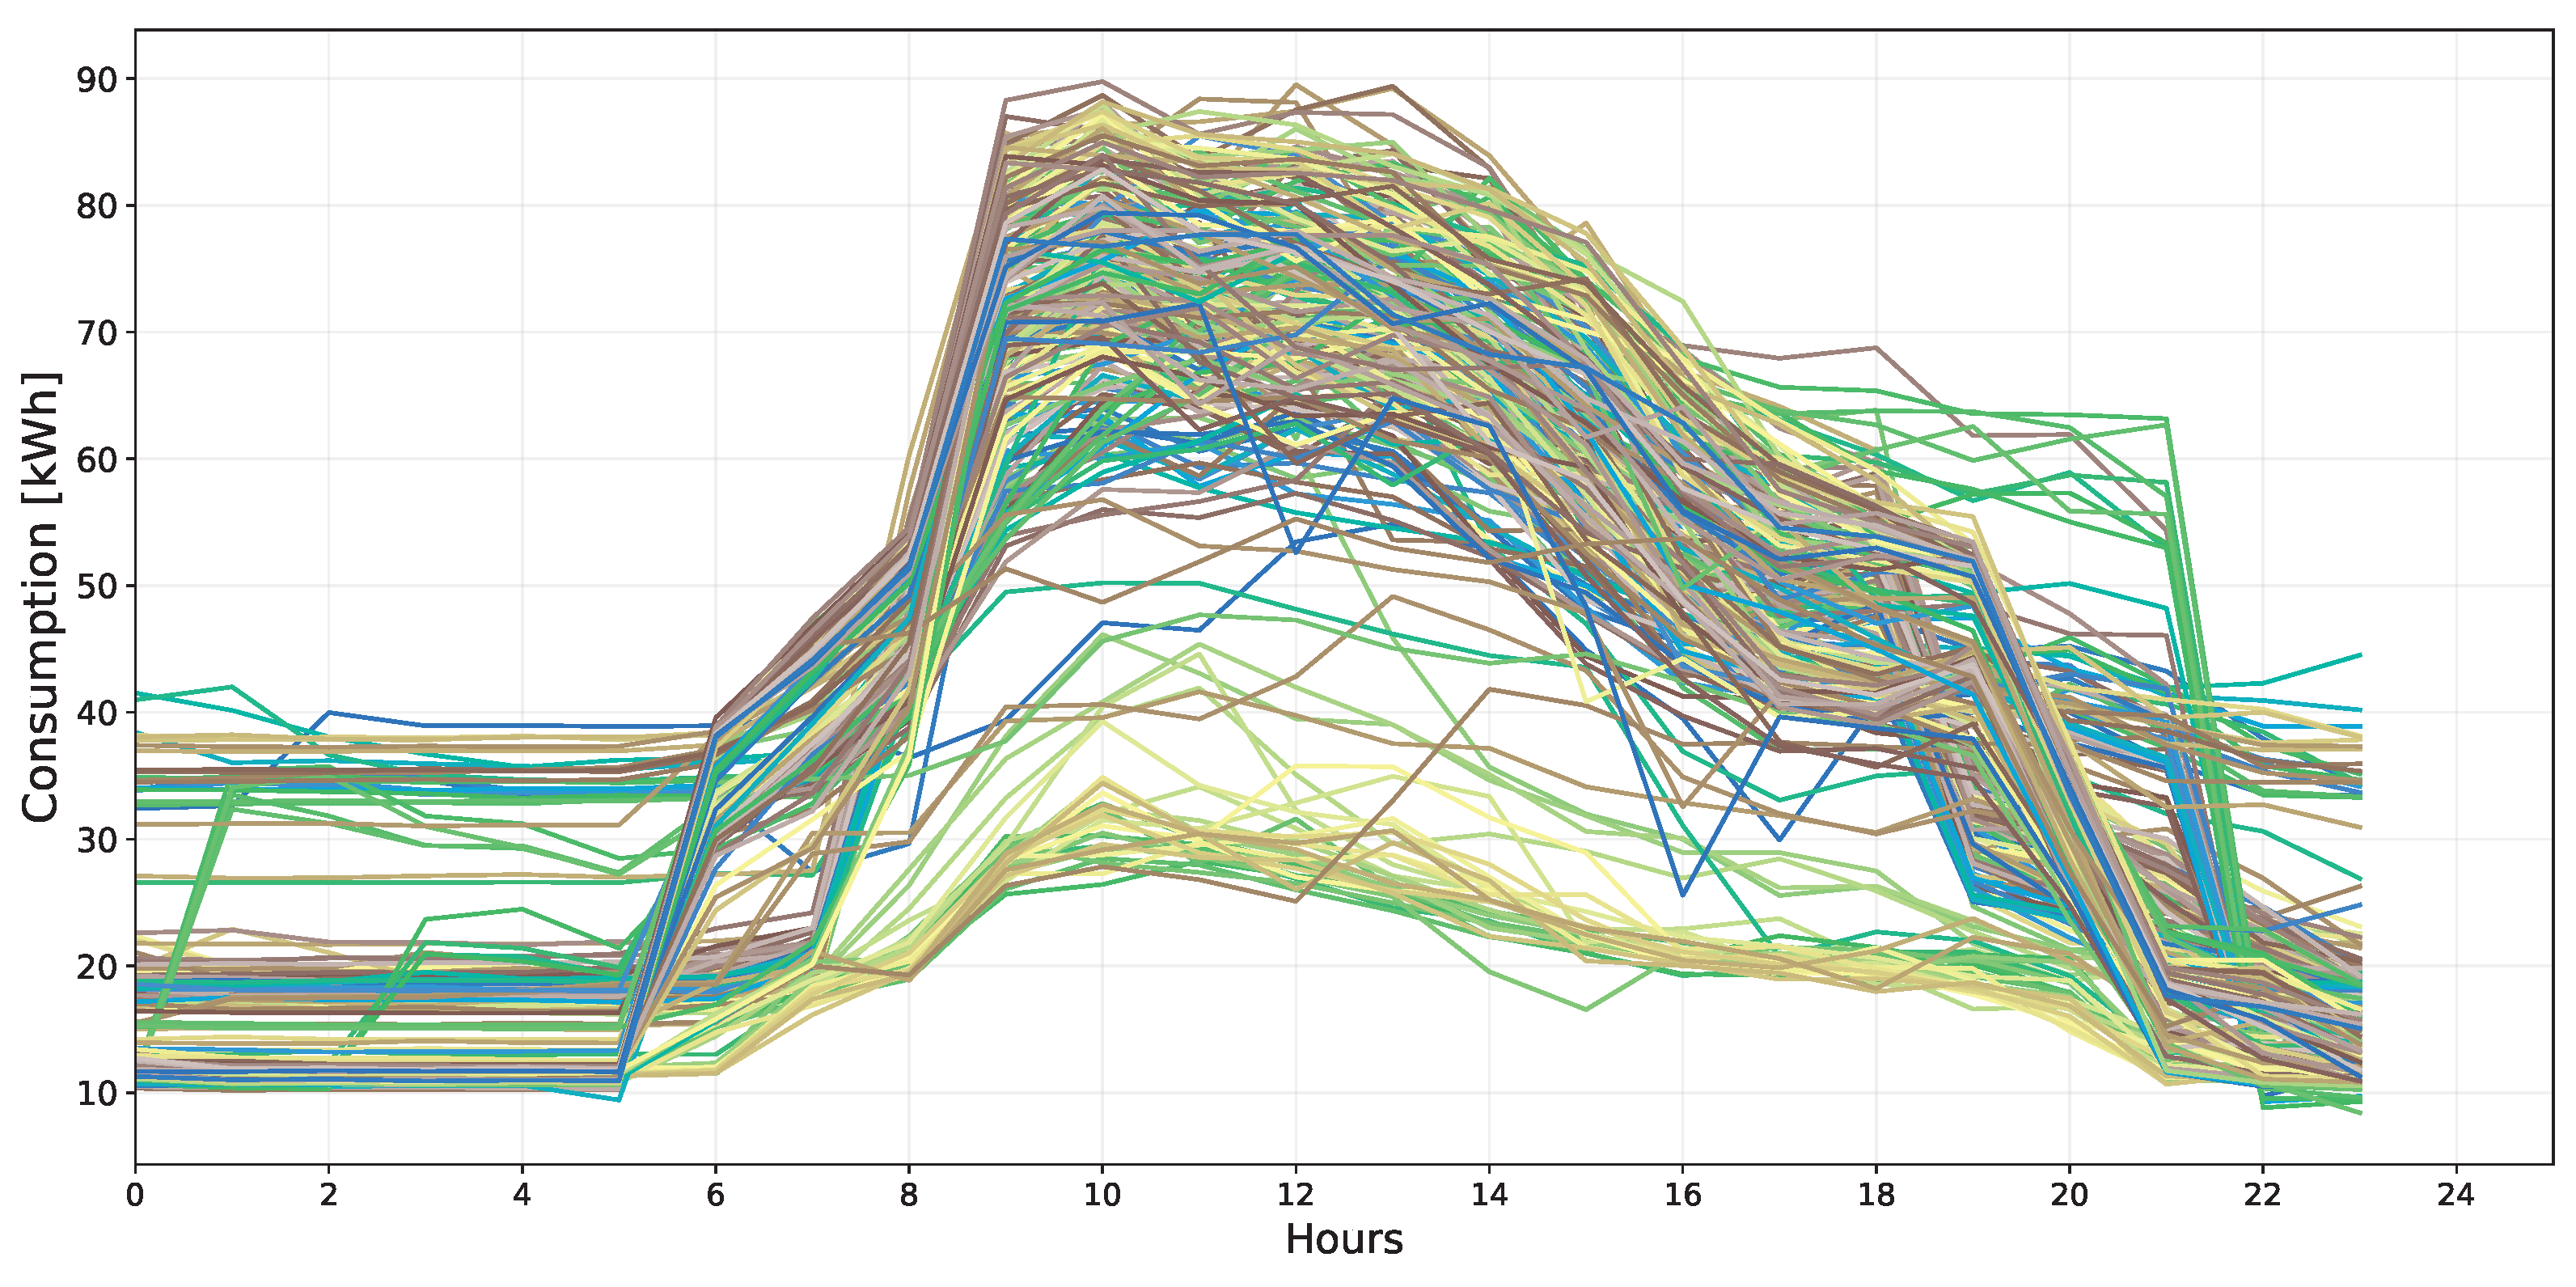
In contrast, DELP (see Figure 3) focuses on daily variations, enabling real-time adjustments, addressing intra-day peaks, which correspond to the occupancy patterns of the building, and capturing fine-grained patterns.
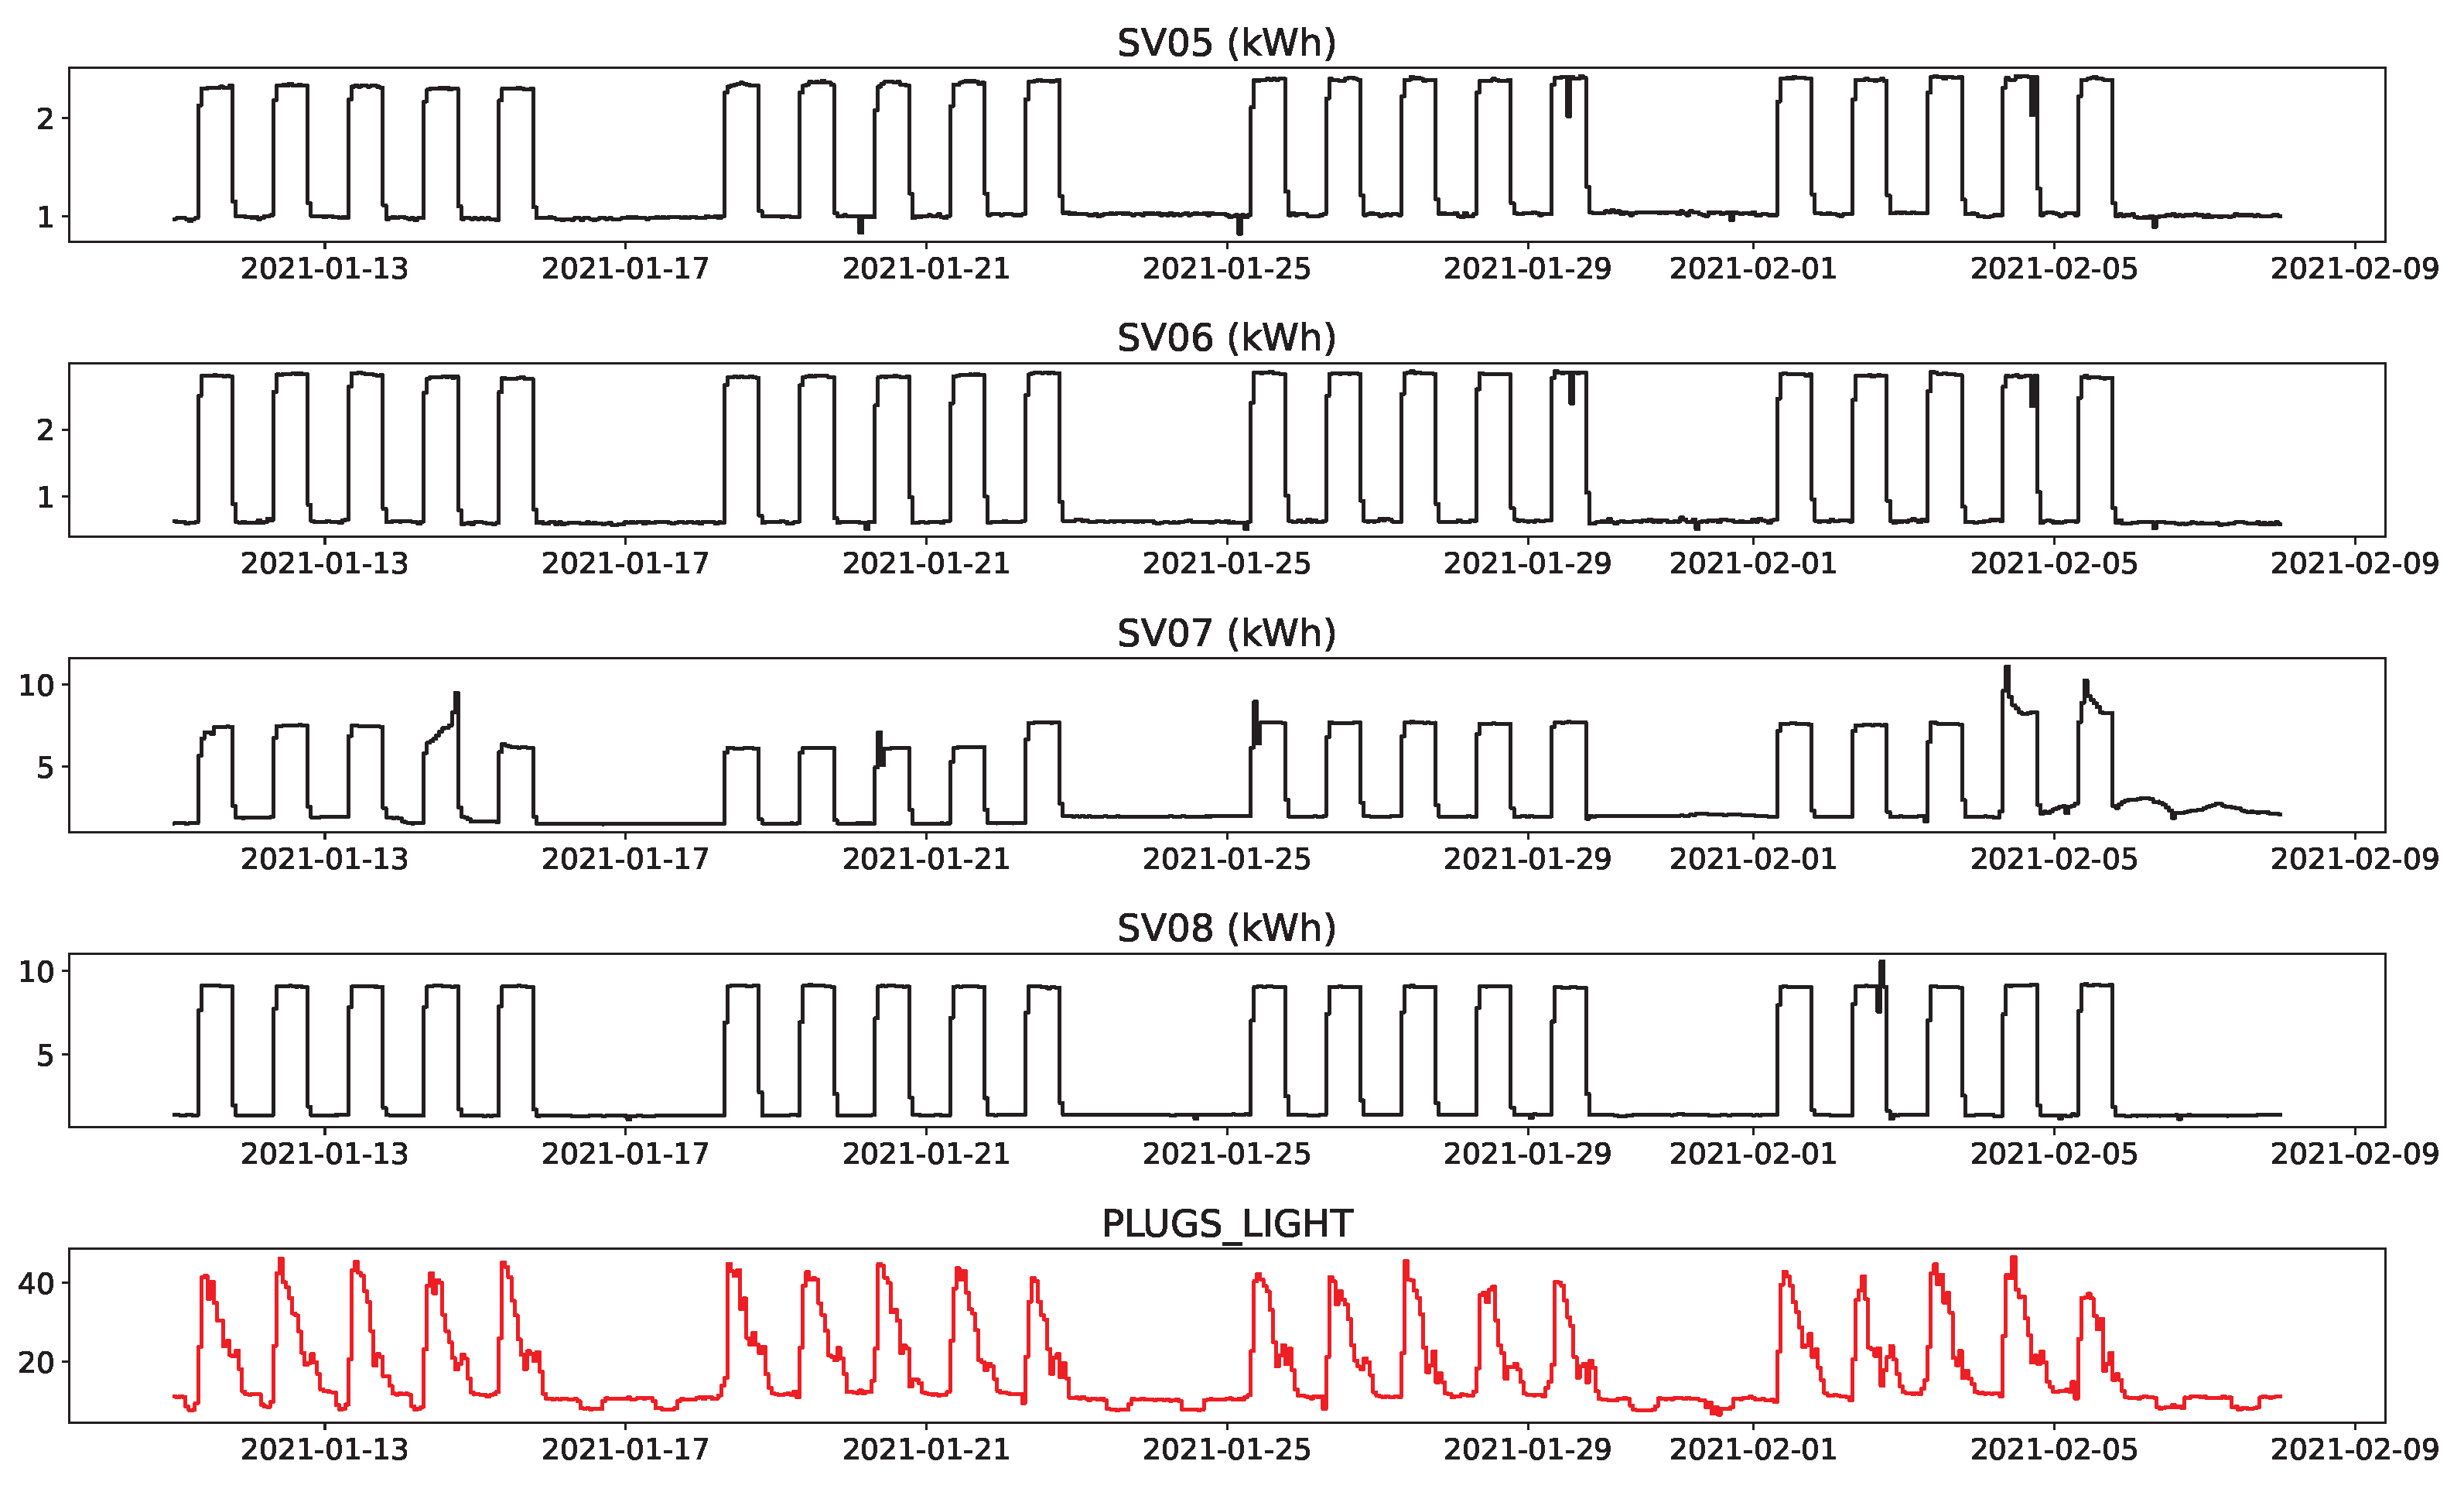
The proposed method can be illustrated with a numerical example that follows all the steps of the algorithm (see Section 2.1). In the first two steps, historical data collection and cleanup were followed by a calculation of the “plugs and lighting” consumption. Based on Figure 4, we then used training data to establish electricity consumption profiles for a four-week time frame, ranging from 11 January 2021 to 7 February 2021. These were deemed to be representative of a typical working profile, contrary to other 2021 periods that contained unusual school working weeks due to vacation or COVID-related behaviors. Moreover, as we aimed at designing a typical profile for February, these weeks reflected the correct seasonality.
Figure 4 shows the ventilation units consumption for the four selected weeks. With rare exceptions, a specific ventilation unit operates at constant power most of the time, regardless of the day of the week or the number of building occupants. The bottom graph of the figure (in red) shows the “plug and lighting” parameter used for training. For clarity, we will construct a one-week ventilation schedule using the typical school week 8–14 February 2021, our testing dataset. This “plug and lighting” consumption parameter will be used in all subsequent steps of this application.

3.1. Consumption Profiles

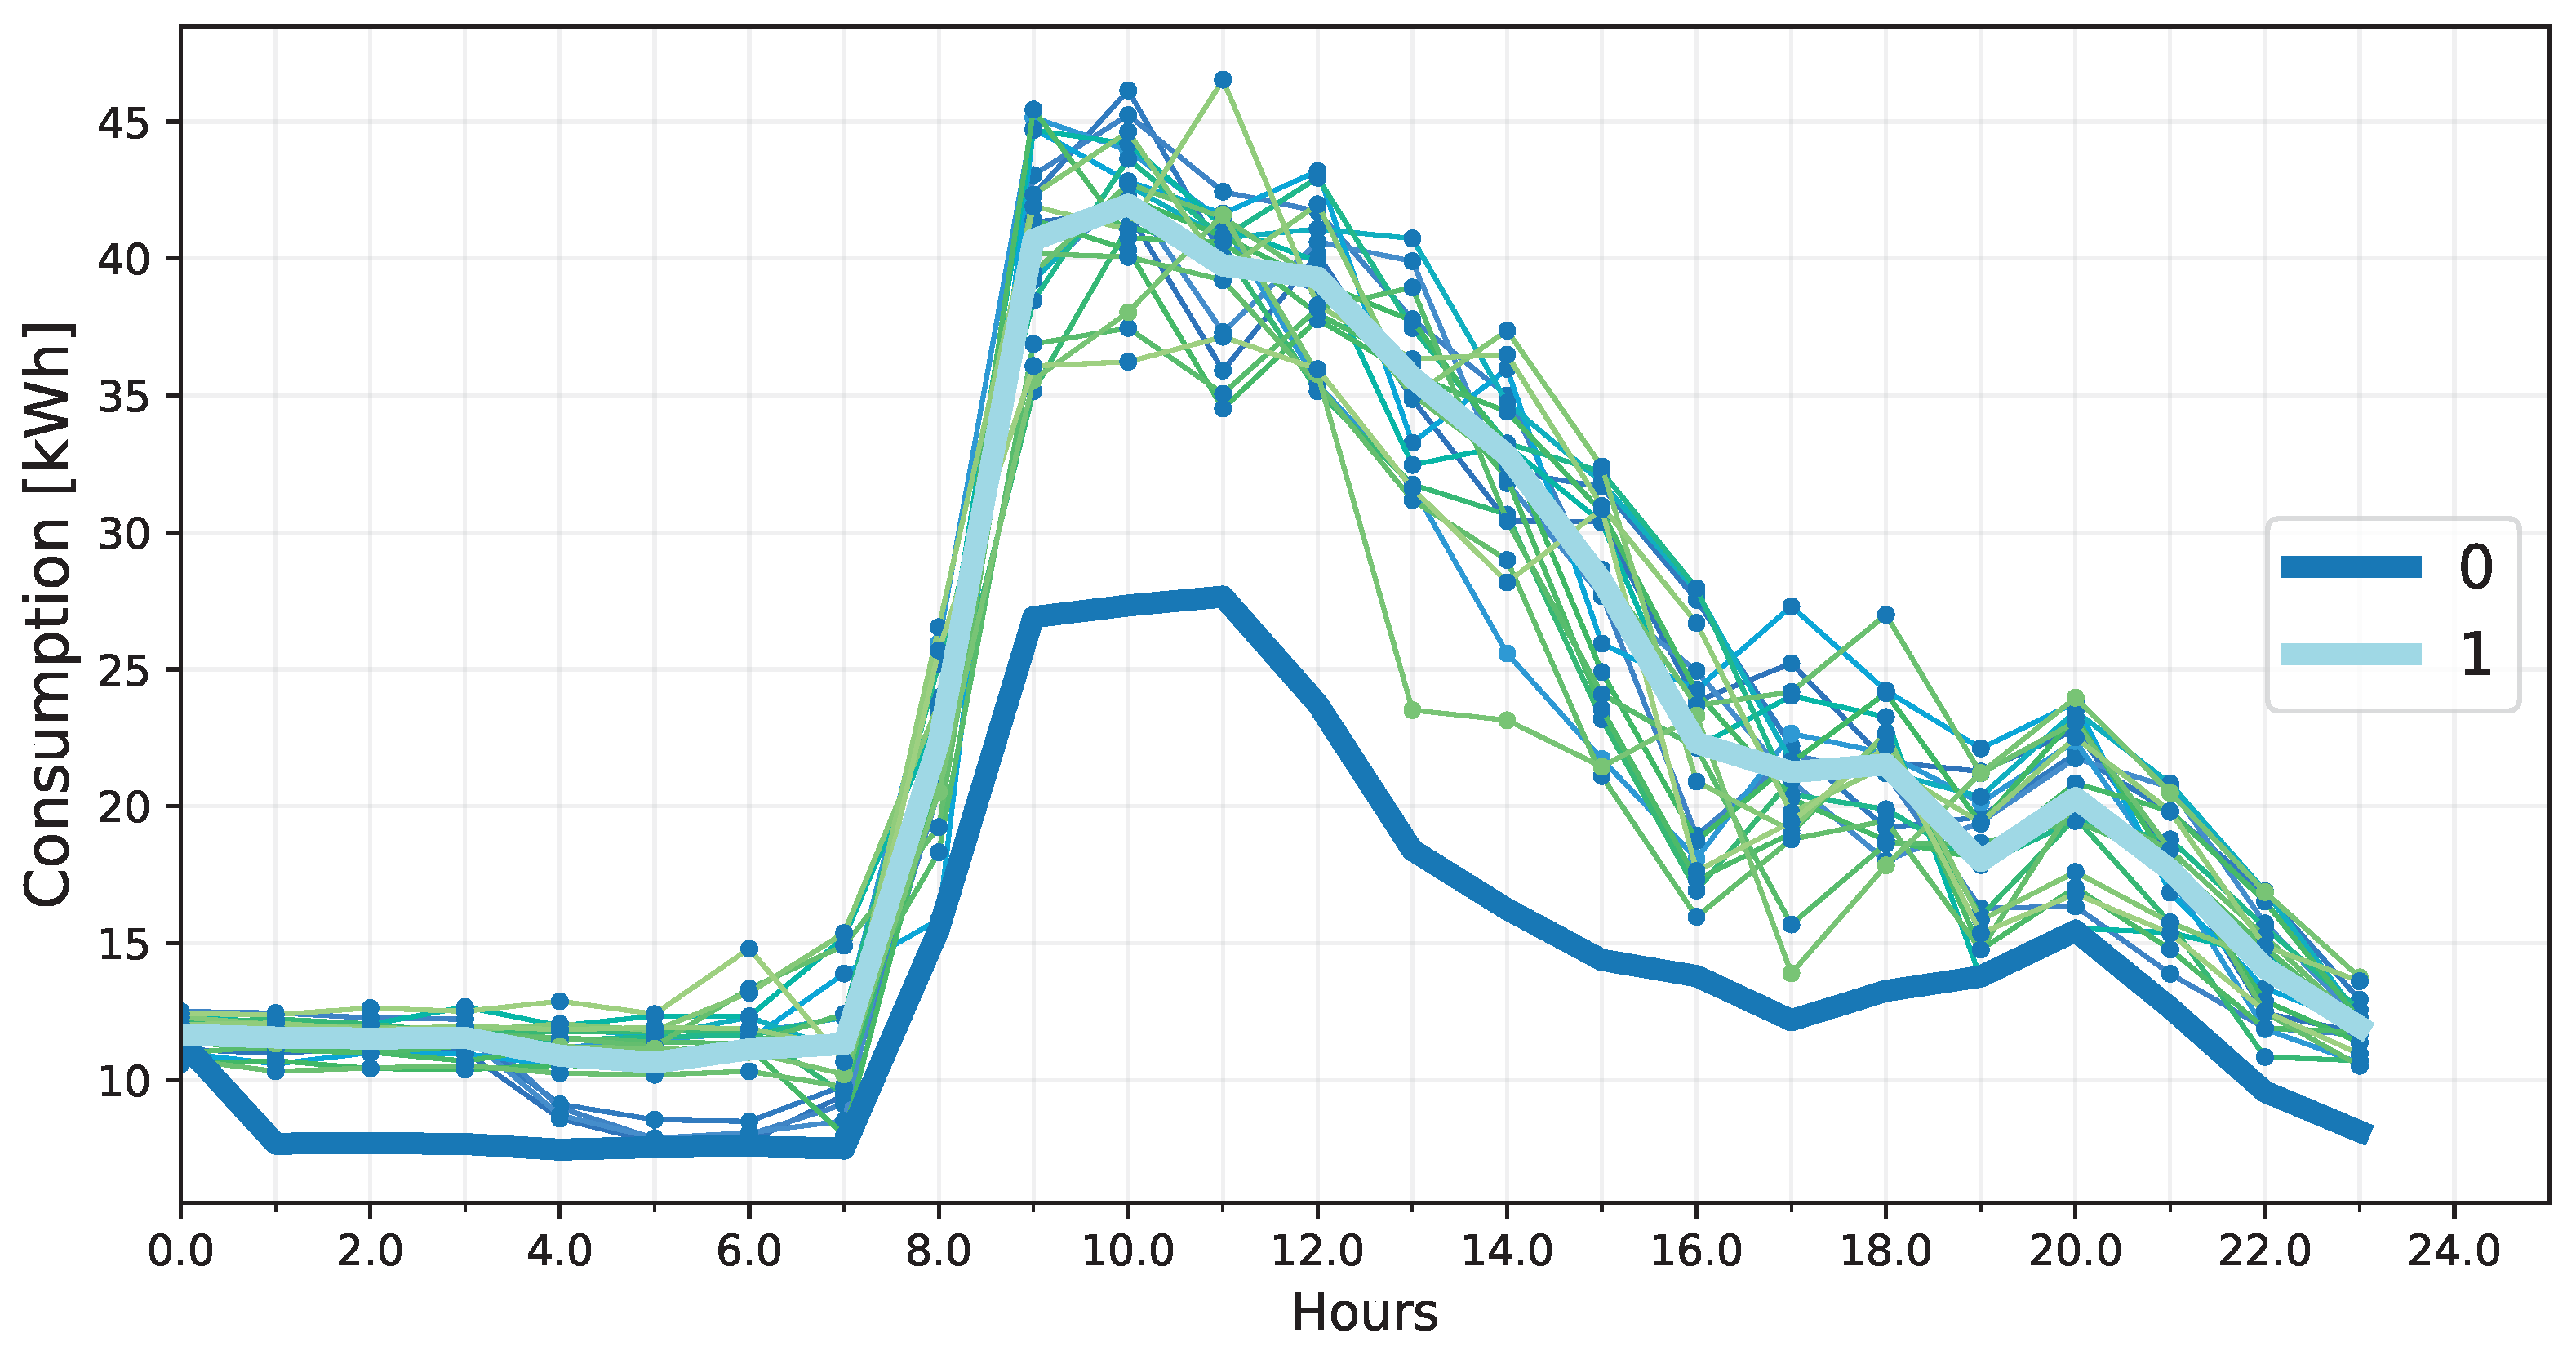
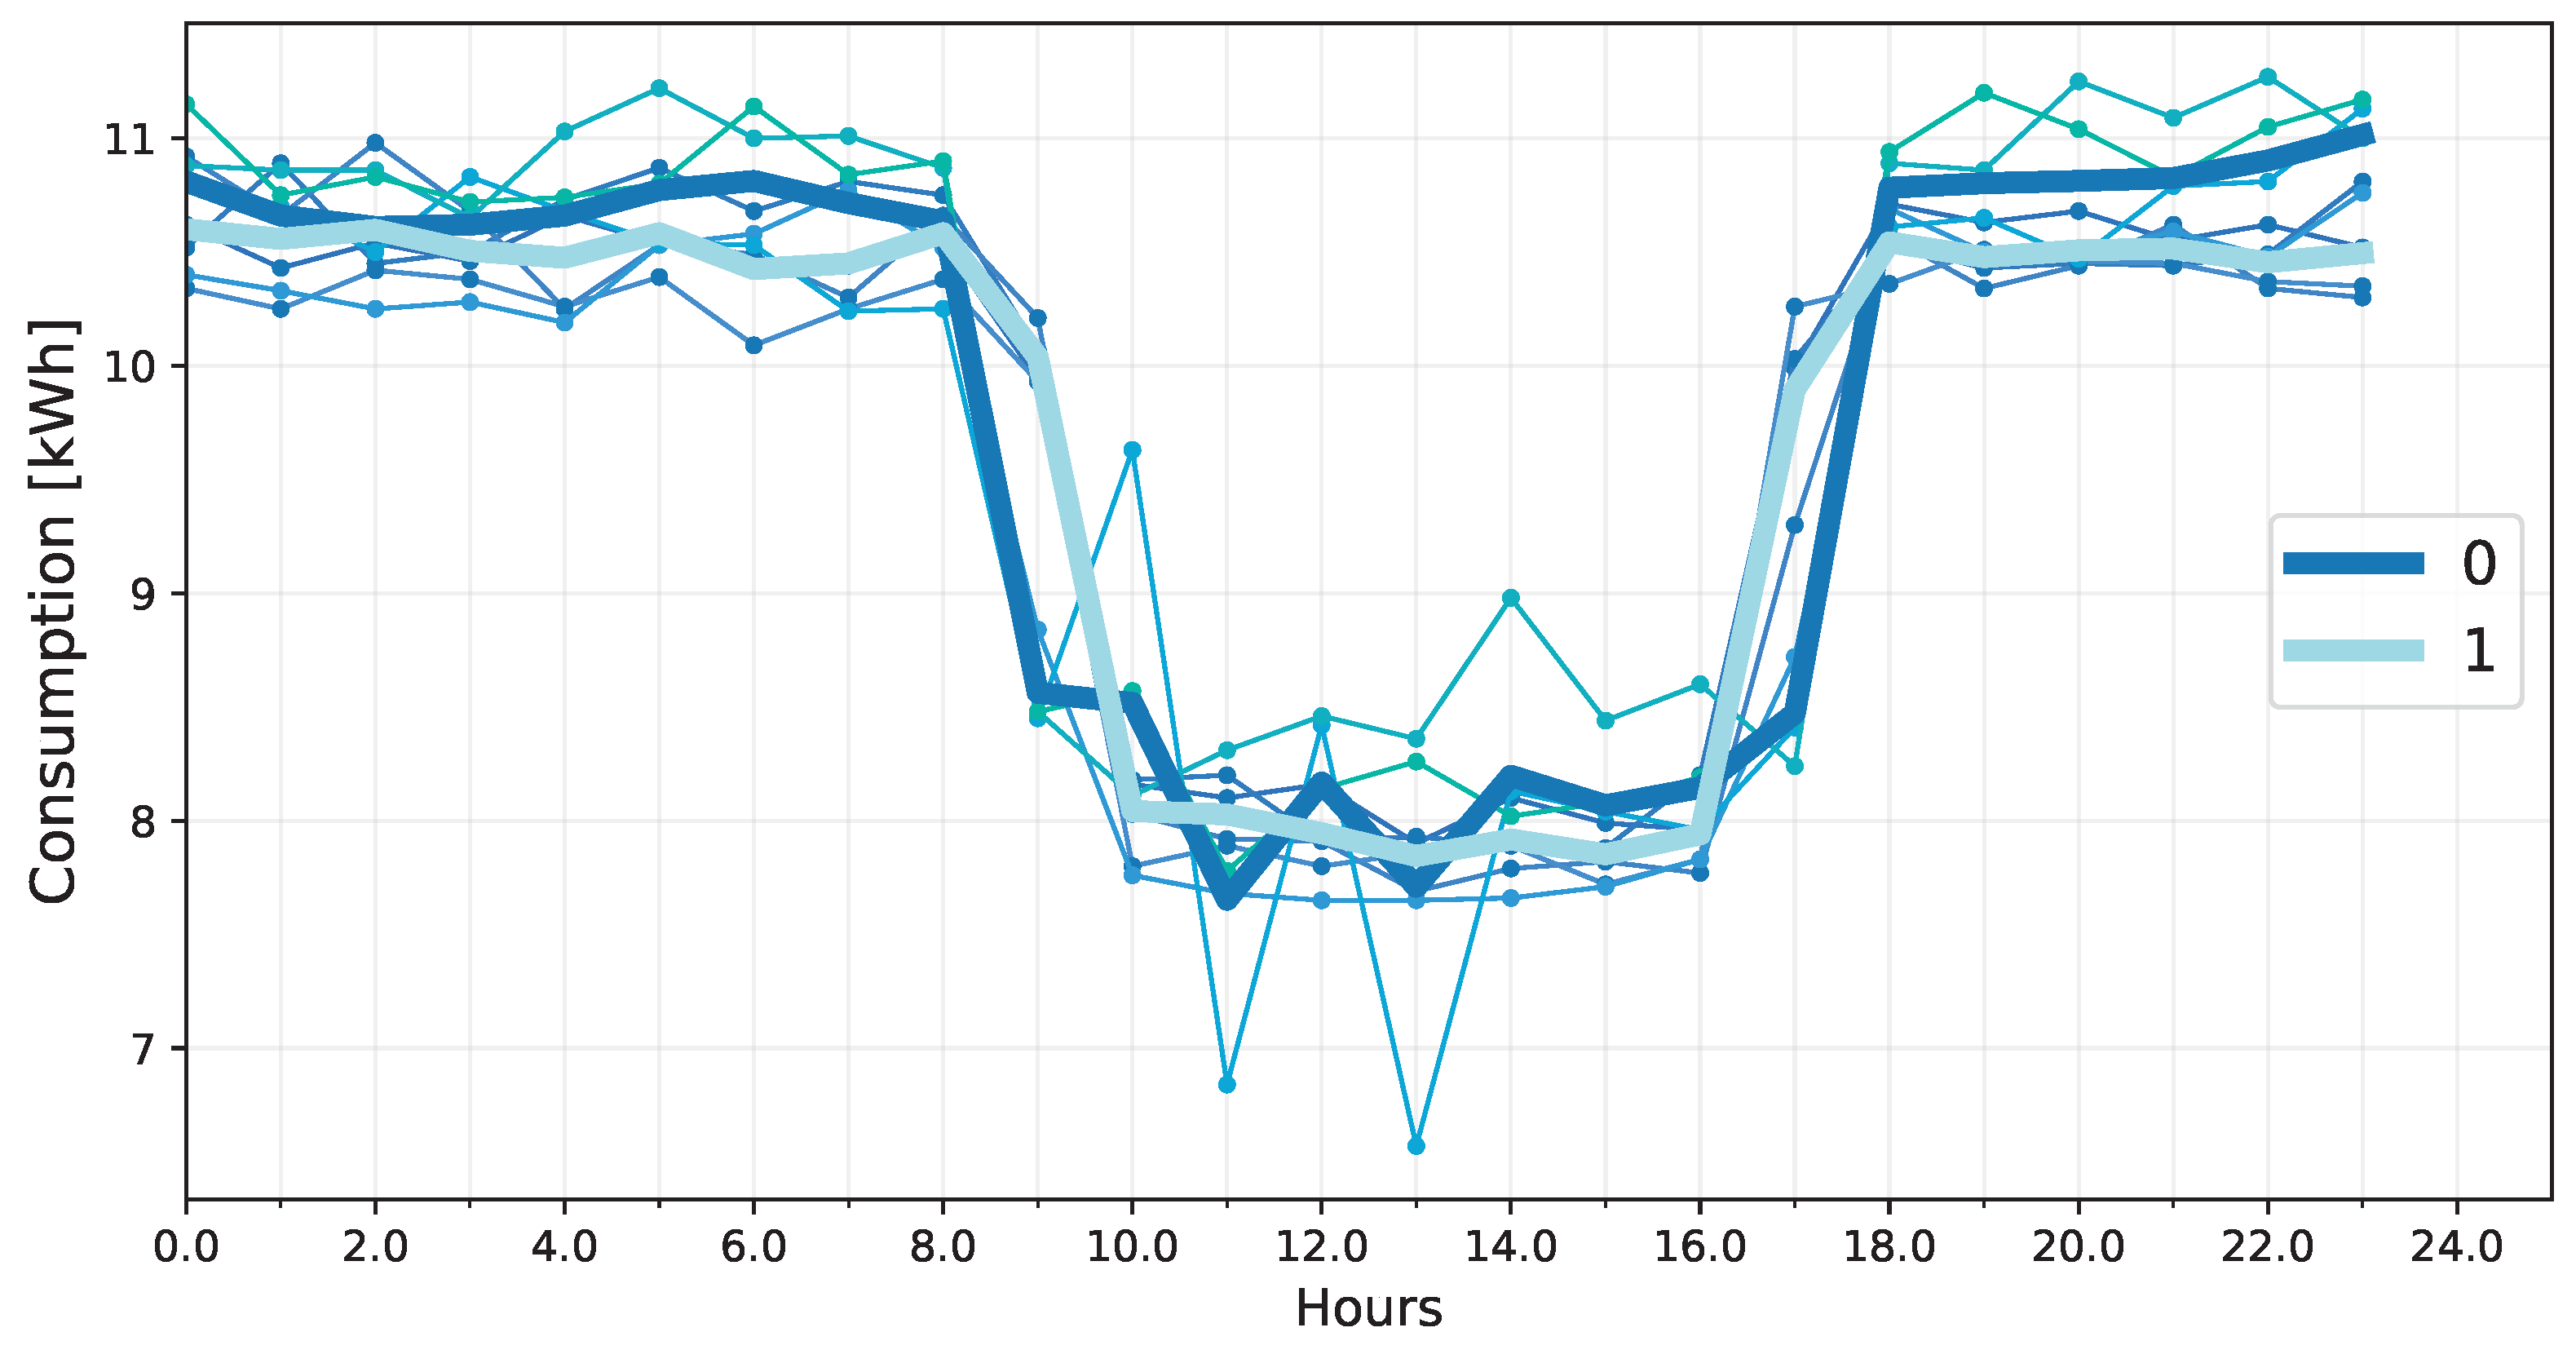
The clustering algorithm described in Section 2.4 is here applied to the training data that were defined in Section 2.3. The typical school week has only two types of days, workdays and weekends; thus, only two profiles are needed: P F ( w d ) and P F ( w e ) . Based on this, one can generate two distinct profile types, as shown in Figure 5 and Figure 6.
In Figure 5, we can observe two clusters, one with centroid “0” and another with centroid “1”. The cluster with centroid “0” is typically regarded as the cluster for outliers and can be disregarded [52]. The hourly consumption profile for workdays P F ( w d ) is determined from the centroid of cluster “1”. The situation is similar for Figure 6: the cluster “0” is used to identify outliers, while the centroid of cluster “1” represents the hourly consumption profile for weekends P F ( w e ) .

3.2. Occupancy Profiles

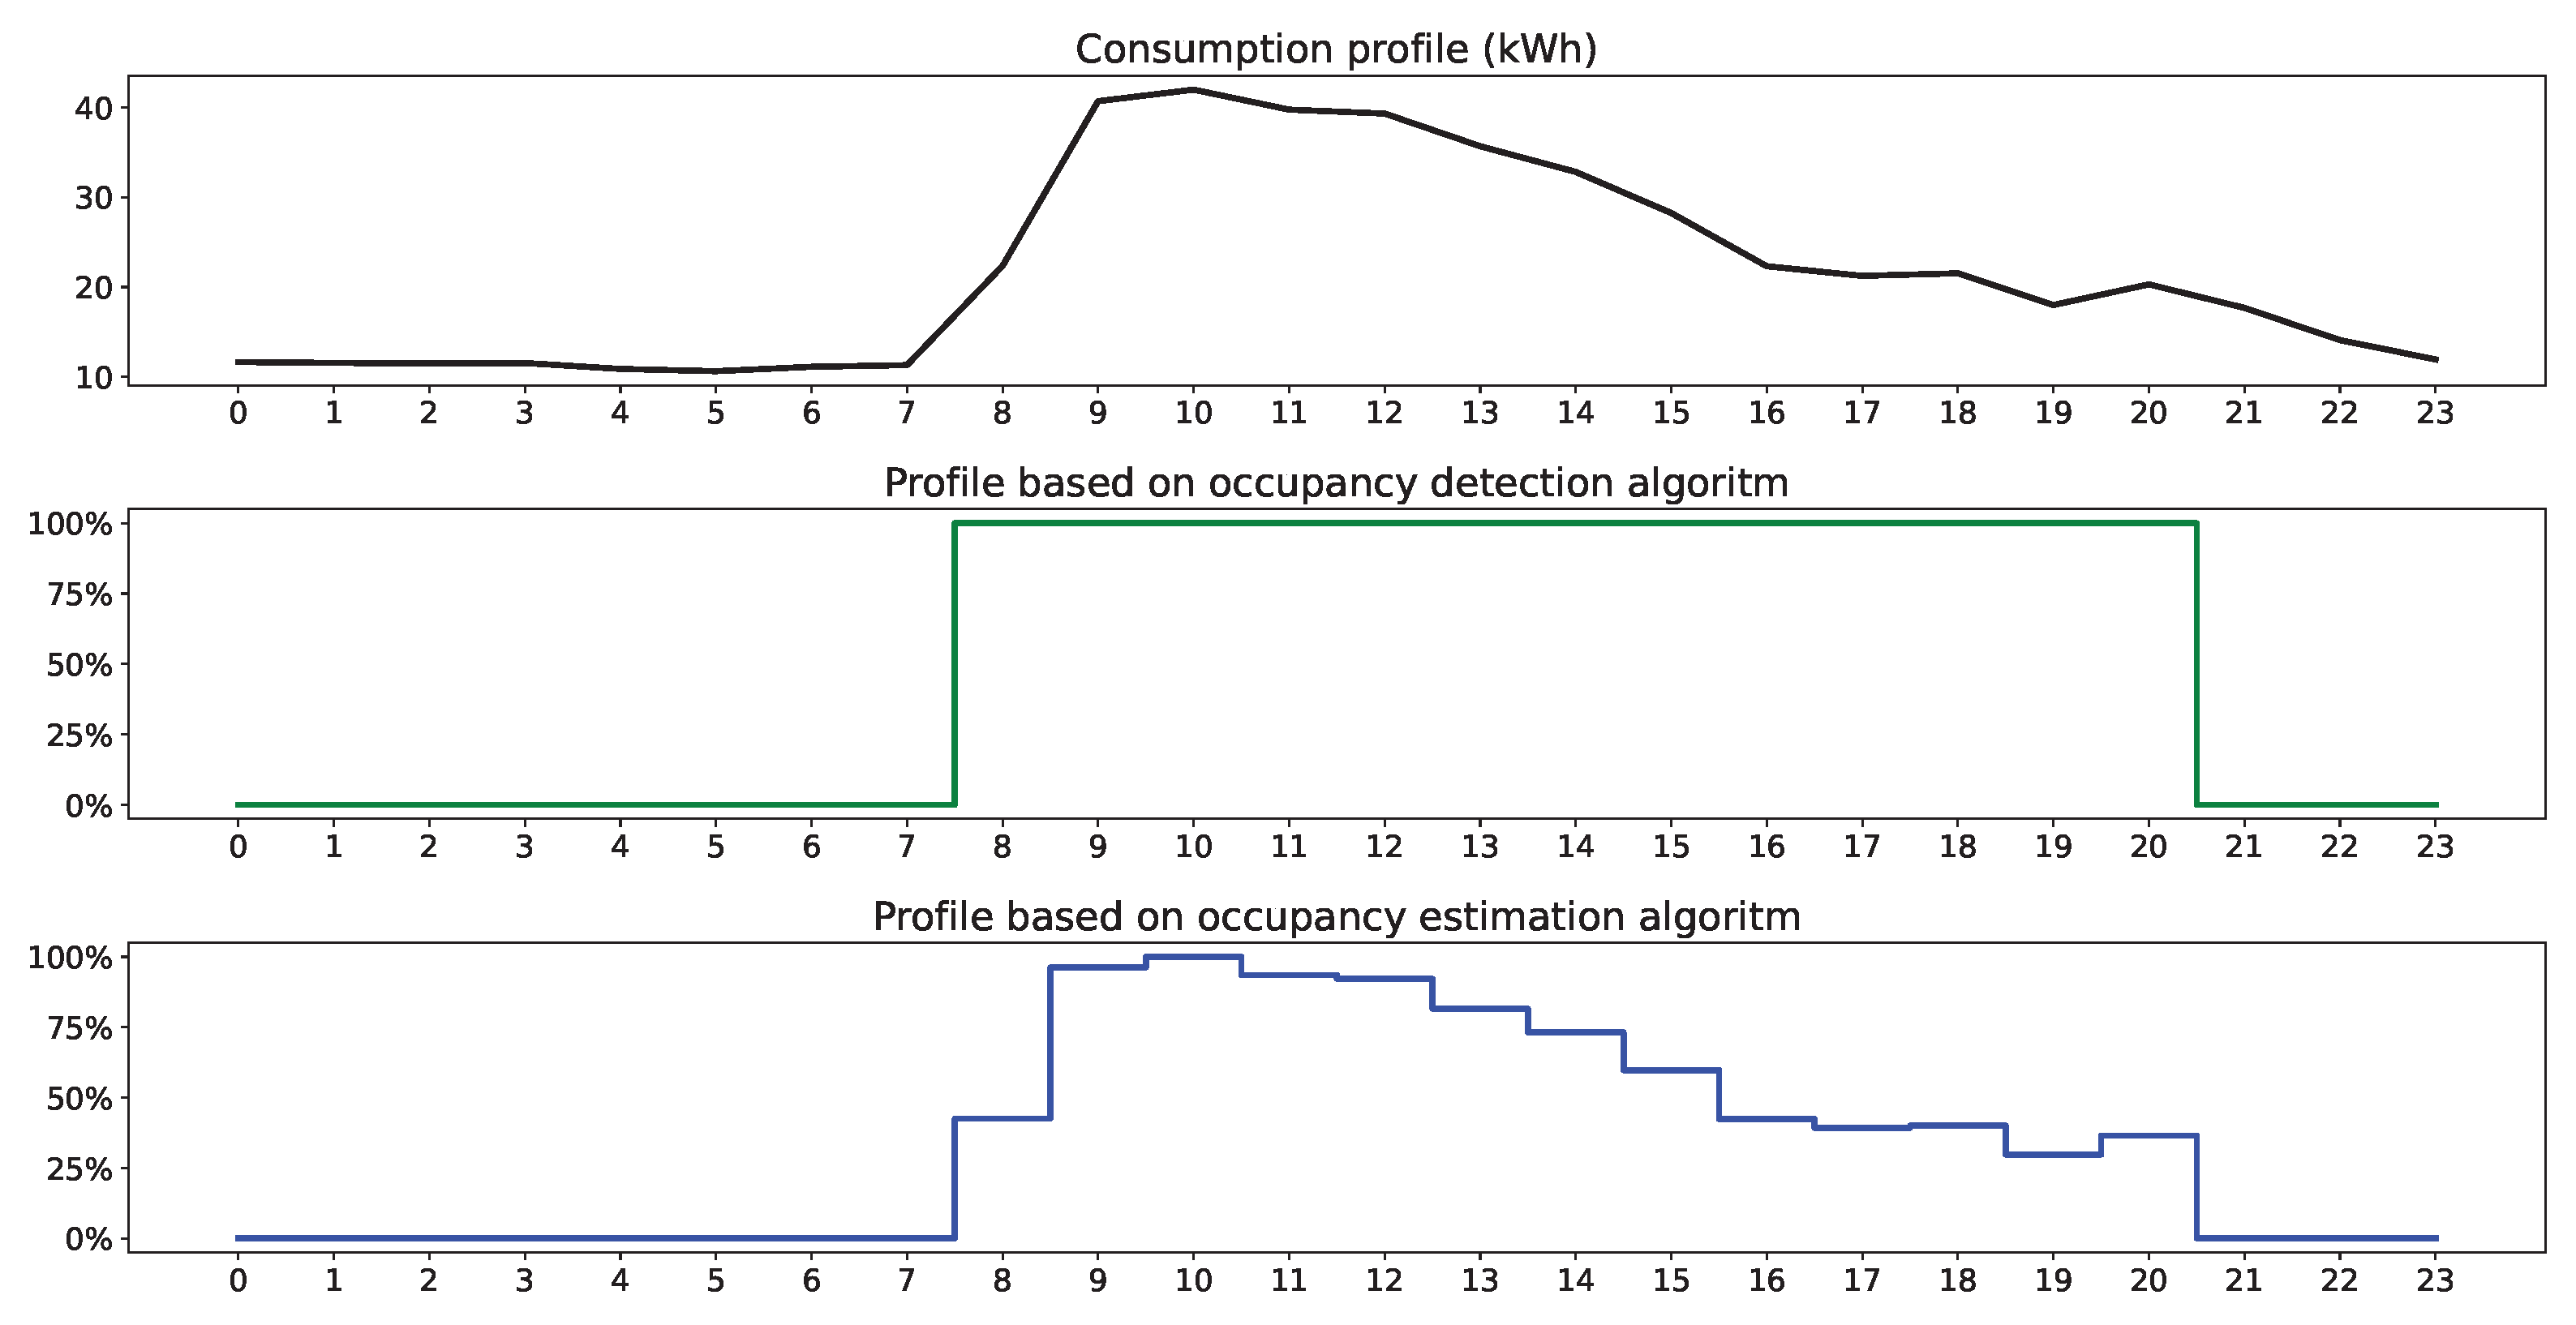
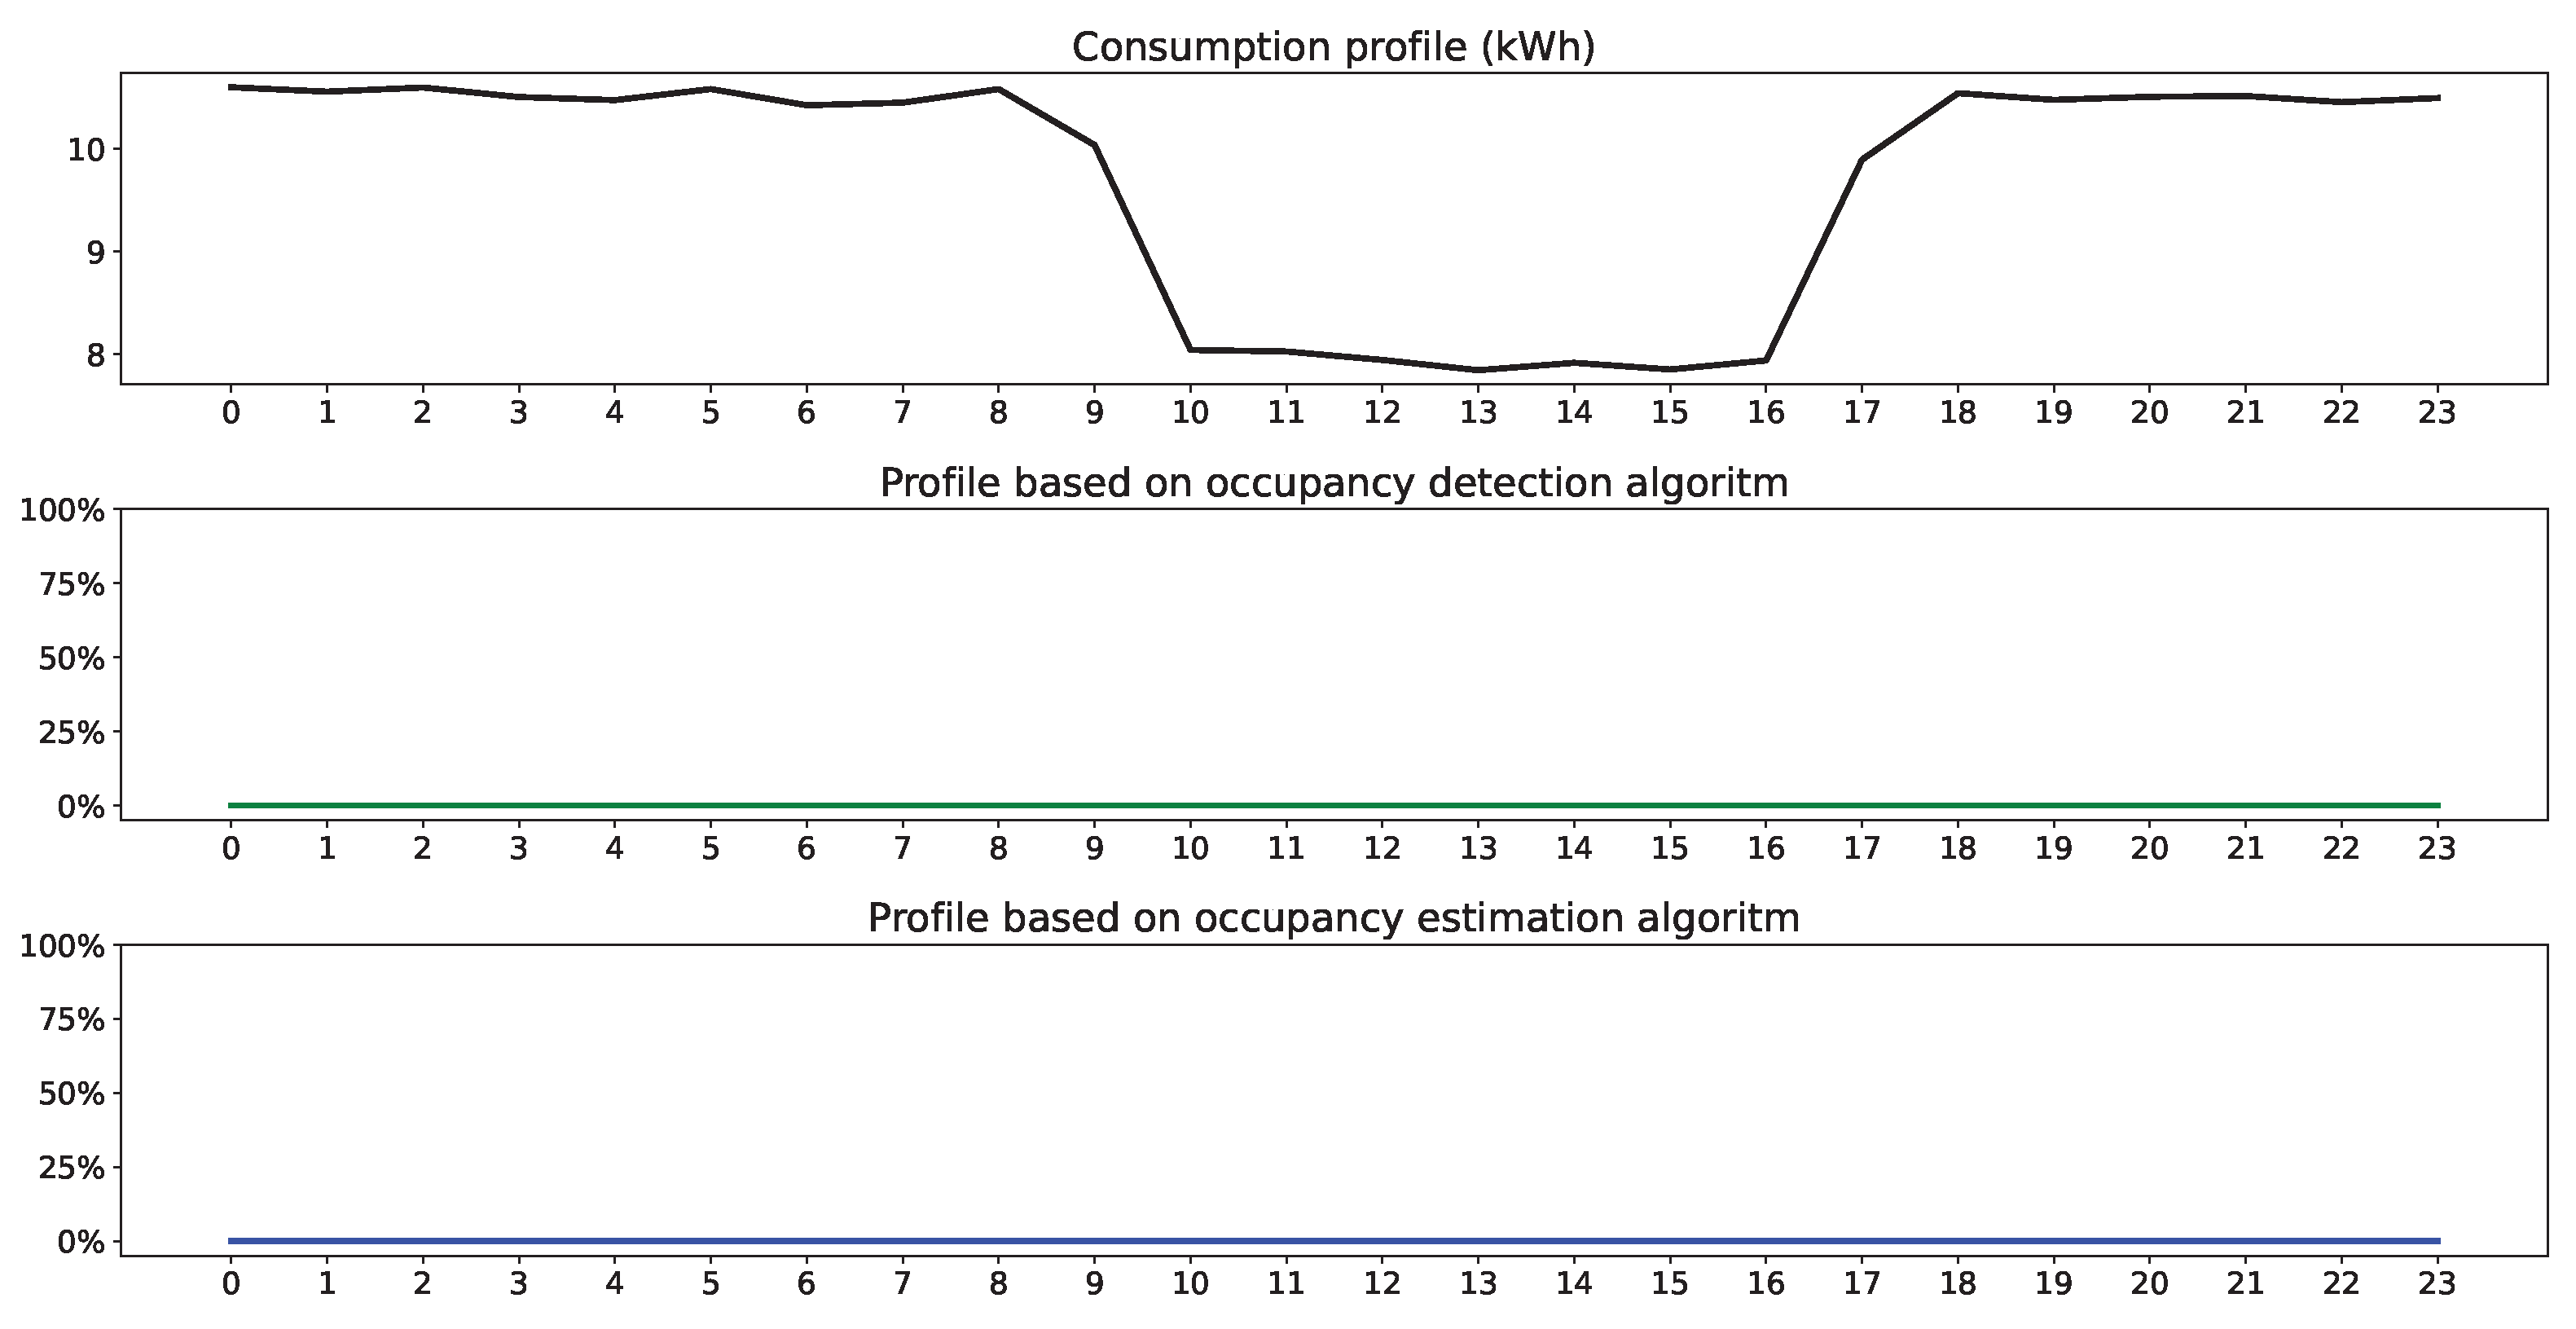
In our example, we generate two occupancy profiles, namely, occupancy detection O and occupancy estimation N ^ , based on the consumption profiles P F that were calculated above for workdays ( P F w d ) and for weekends ( P F w e ). The corresponding profiles are O w d and N ^ w d for workdays, and O w e and N ^ w e for weekends.
As described in Section 2.5.1, the numerical value δ = 0.4 that is used in the occupancy detection algorithm was selected through fine-tuning. Figure 7 shows the profiles for workdays, with the top image representing P F w d , and the middle and bottom images representing O w d and N ^ w d , respectively. Similarly, Figure 8 shows the profiles for weekends and follows the same layout as Figure 7.

3.3. Occupancy Schedules

To generate the occupancy schedule for the typical school week on 8–14 February 2021, we label the days as follows:
S c h L = { w d , w d , w d , w d , w d , w e , w e } .
Based on this labeling, we create the occupancy schedule as follows:
O Sch = { O w d , O w d , O w d , O w d , O w d , O w e , O w e } ,
and
N ^ Sch = { N ^ w d , N ^ w d , N ^ w d , N ^ w d , N ^ w d , N ^ w e , N ^ w e } .
Both schedules are illustrated in Figure 9, with O Sch shown on top and N ^ Sch on the bottom.

3.4. Ventilation Schedules

The proposed air exchange timetables (in Figure 10, Figure 11, Figure 12 and Figure 13) cover two cases: the classical approach based on occupancy detection (green solid and dashed lines) and the demand-controlled ventilation strategy based on occupancy estimation (blue solid and dashed lines). These examples are specifically provided for AHU#7 and AHU#8, which are the most powerful air-handling units in the A-building of the school, accommodating classrooms for children aged 9 and above. The value of R fan in (14) can be obtained from the technical specifications of the AHU#7, which indicate q max fan = 3.59 m 3 / s and P max fan = 1.43 kW m 3 / s . Once values of R fan and P fan are known, air flows can be calculated, as shown in (15).
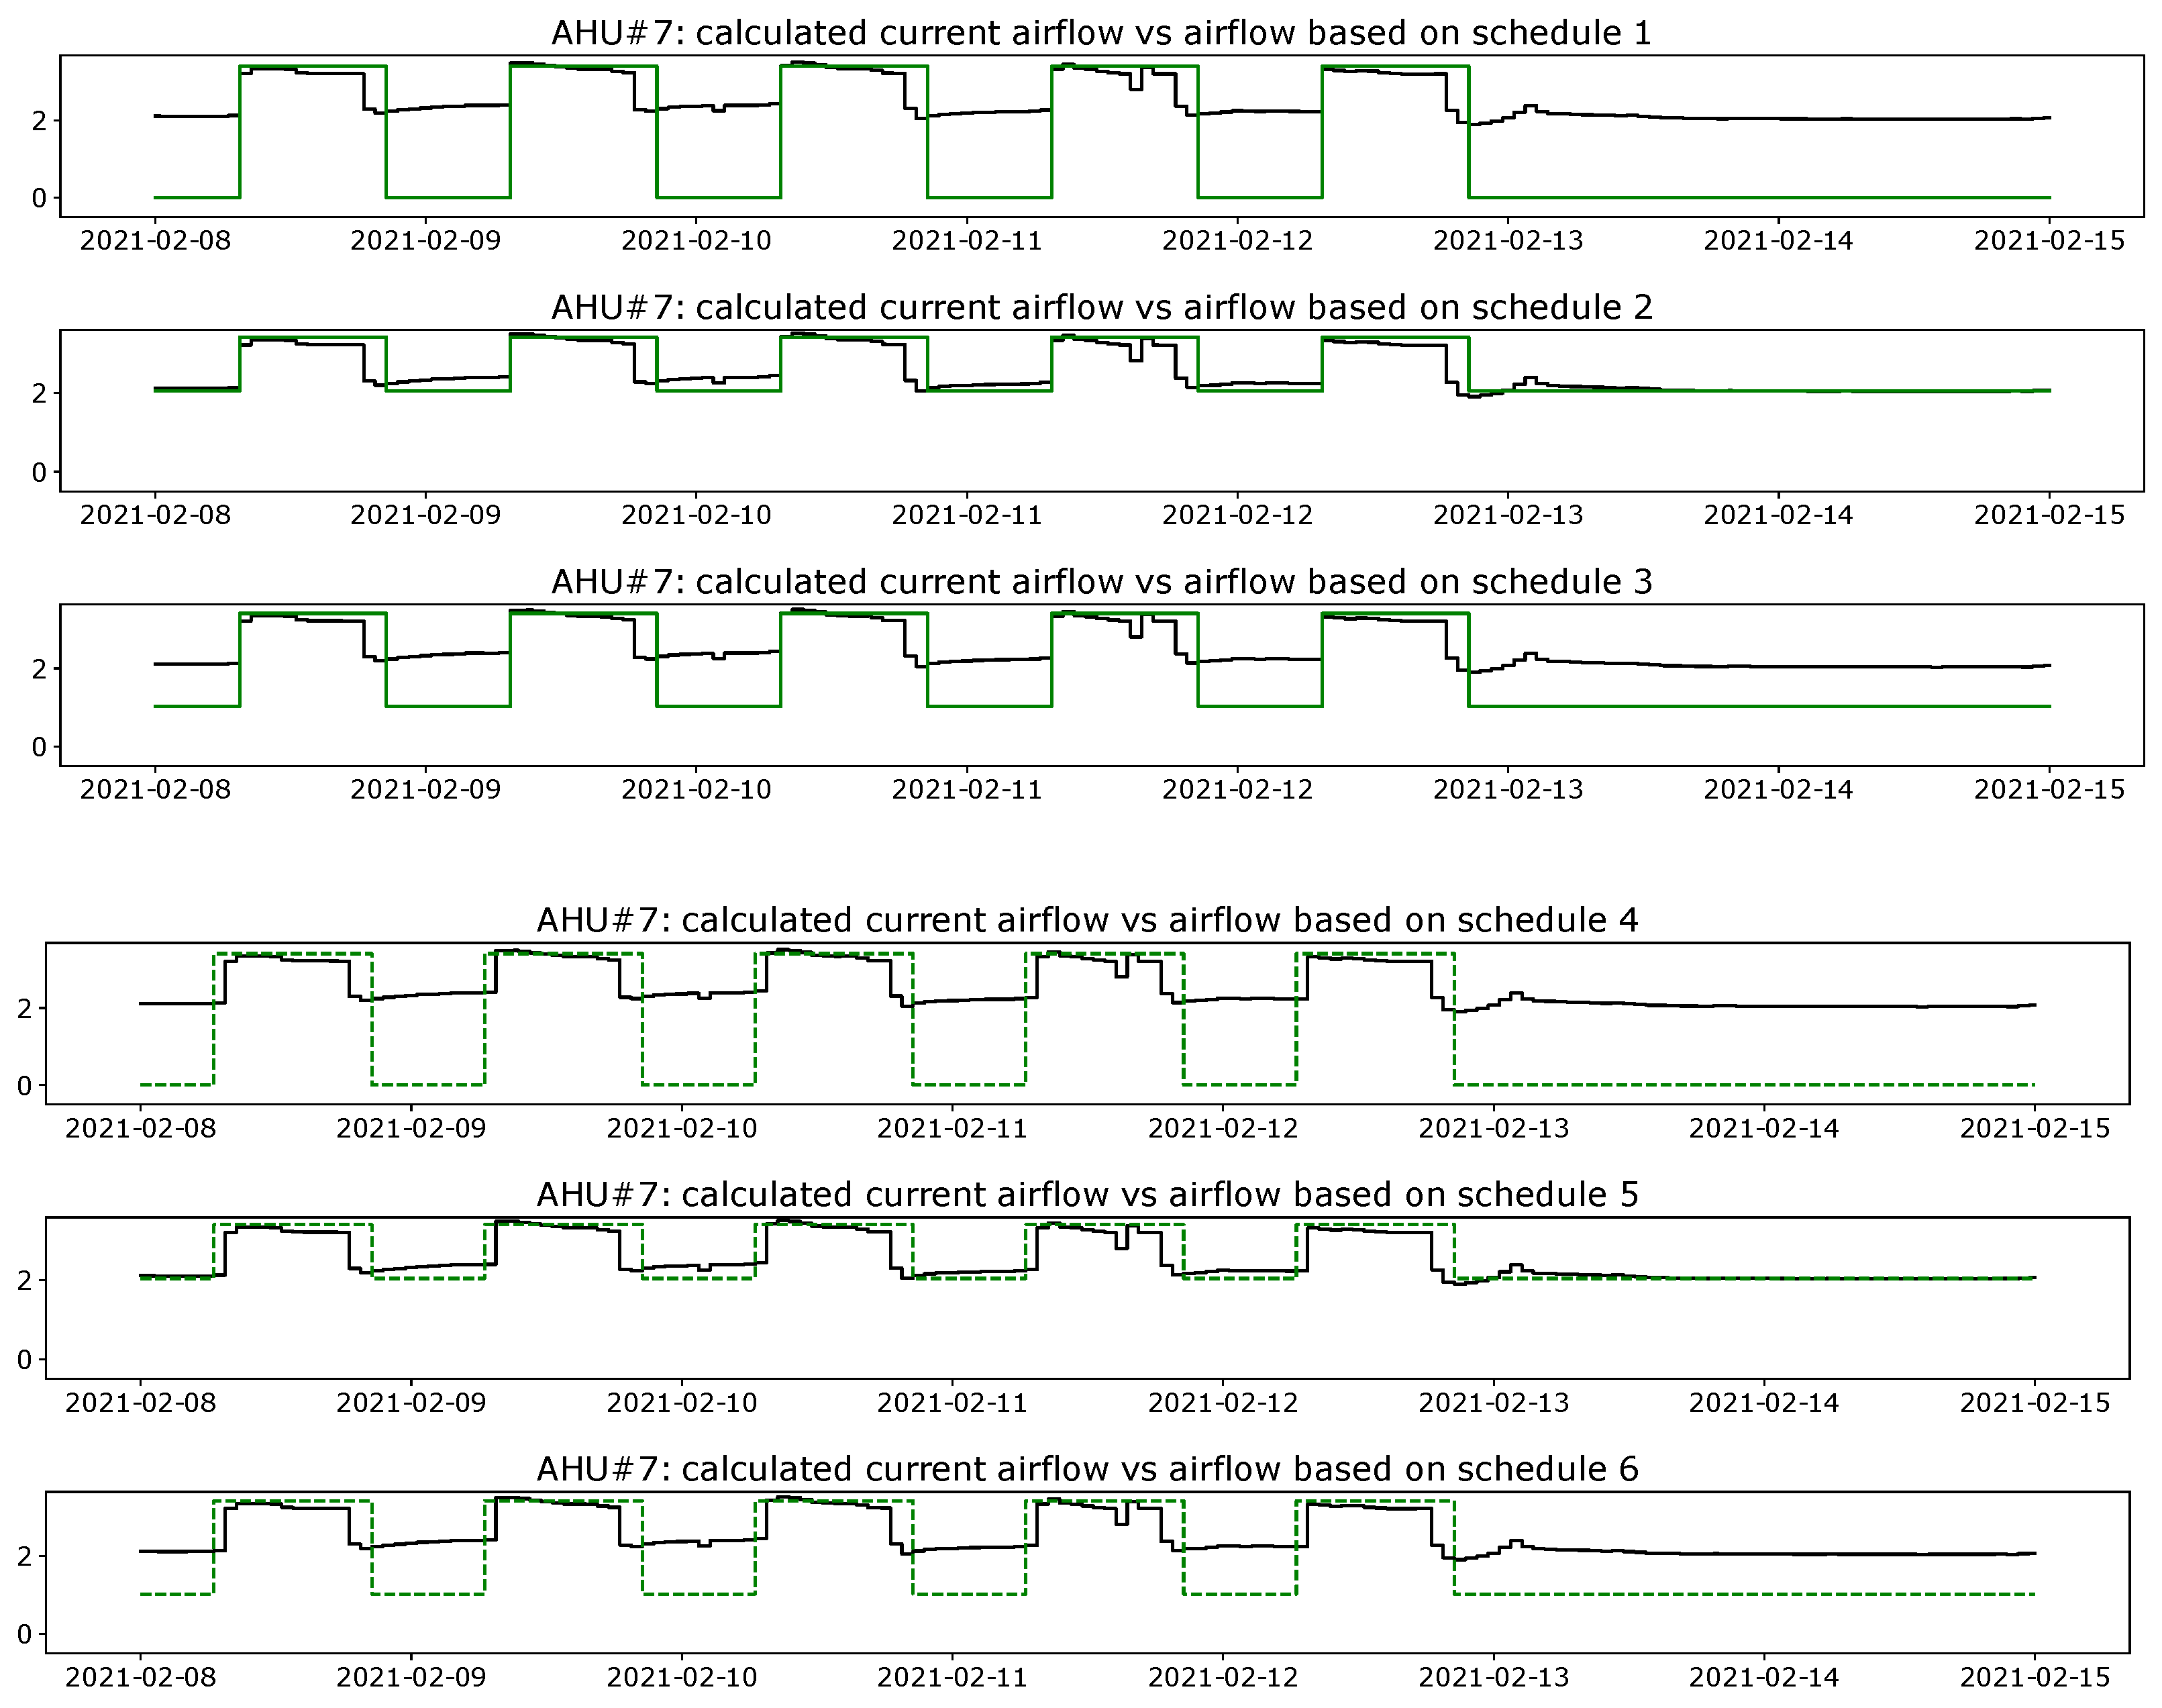
Figure 10 (top) illustrates a comparison of timetables between the current school schedule for AHU#7 and the proposed Scenarios 1–3 (as in Table 1). In this comparison, the minimum airflow q min values are taken into account. For AHU#7, in the current schedule, the minimum airflow rate is set to 60%, indicating that the ventilation system operates at 60% of its maximum airflow capacity during unoccupied periods.
In contrast, the proposed Scenarios 1 and 3 suggest a revised minimum airflow as 0% and 30% correspondingly. The figure allows for a visual comparison of the timetables, and highlights the differences in ventilation levels during unoccupied periods.
Figure 10 (Schedules 4–6) represents a comparison of timetables between the current schedule implemented in the school for AHU#7 and the proposed Scenarios 4–6 in Table 1. The comparison is based on the minimum airflow values q min that are considered in each scenario. Additionally, a pre- and post-occupancy flush-out strategy is applied, ensuring rapid ventilation of the building with fresh outdoor air before and after occupancy periods.
Based on the current Estonian regulations that are effective since 13 January 2023, Schedule 4 in Figure 10 (Schedules 4–6) should be implemented to ensure compliance with minimum indoor air quality standards (i.e., pre- and post-occupancy flush out with one hour shift) [47].
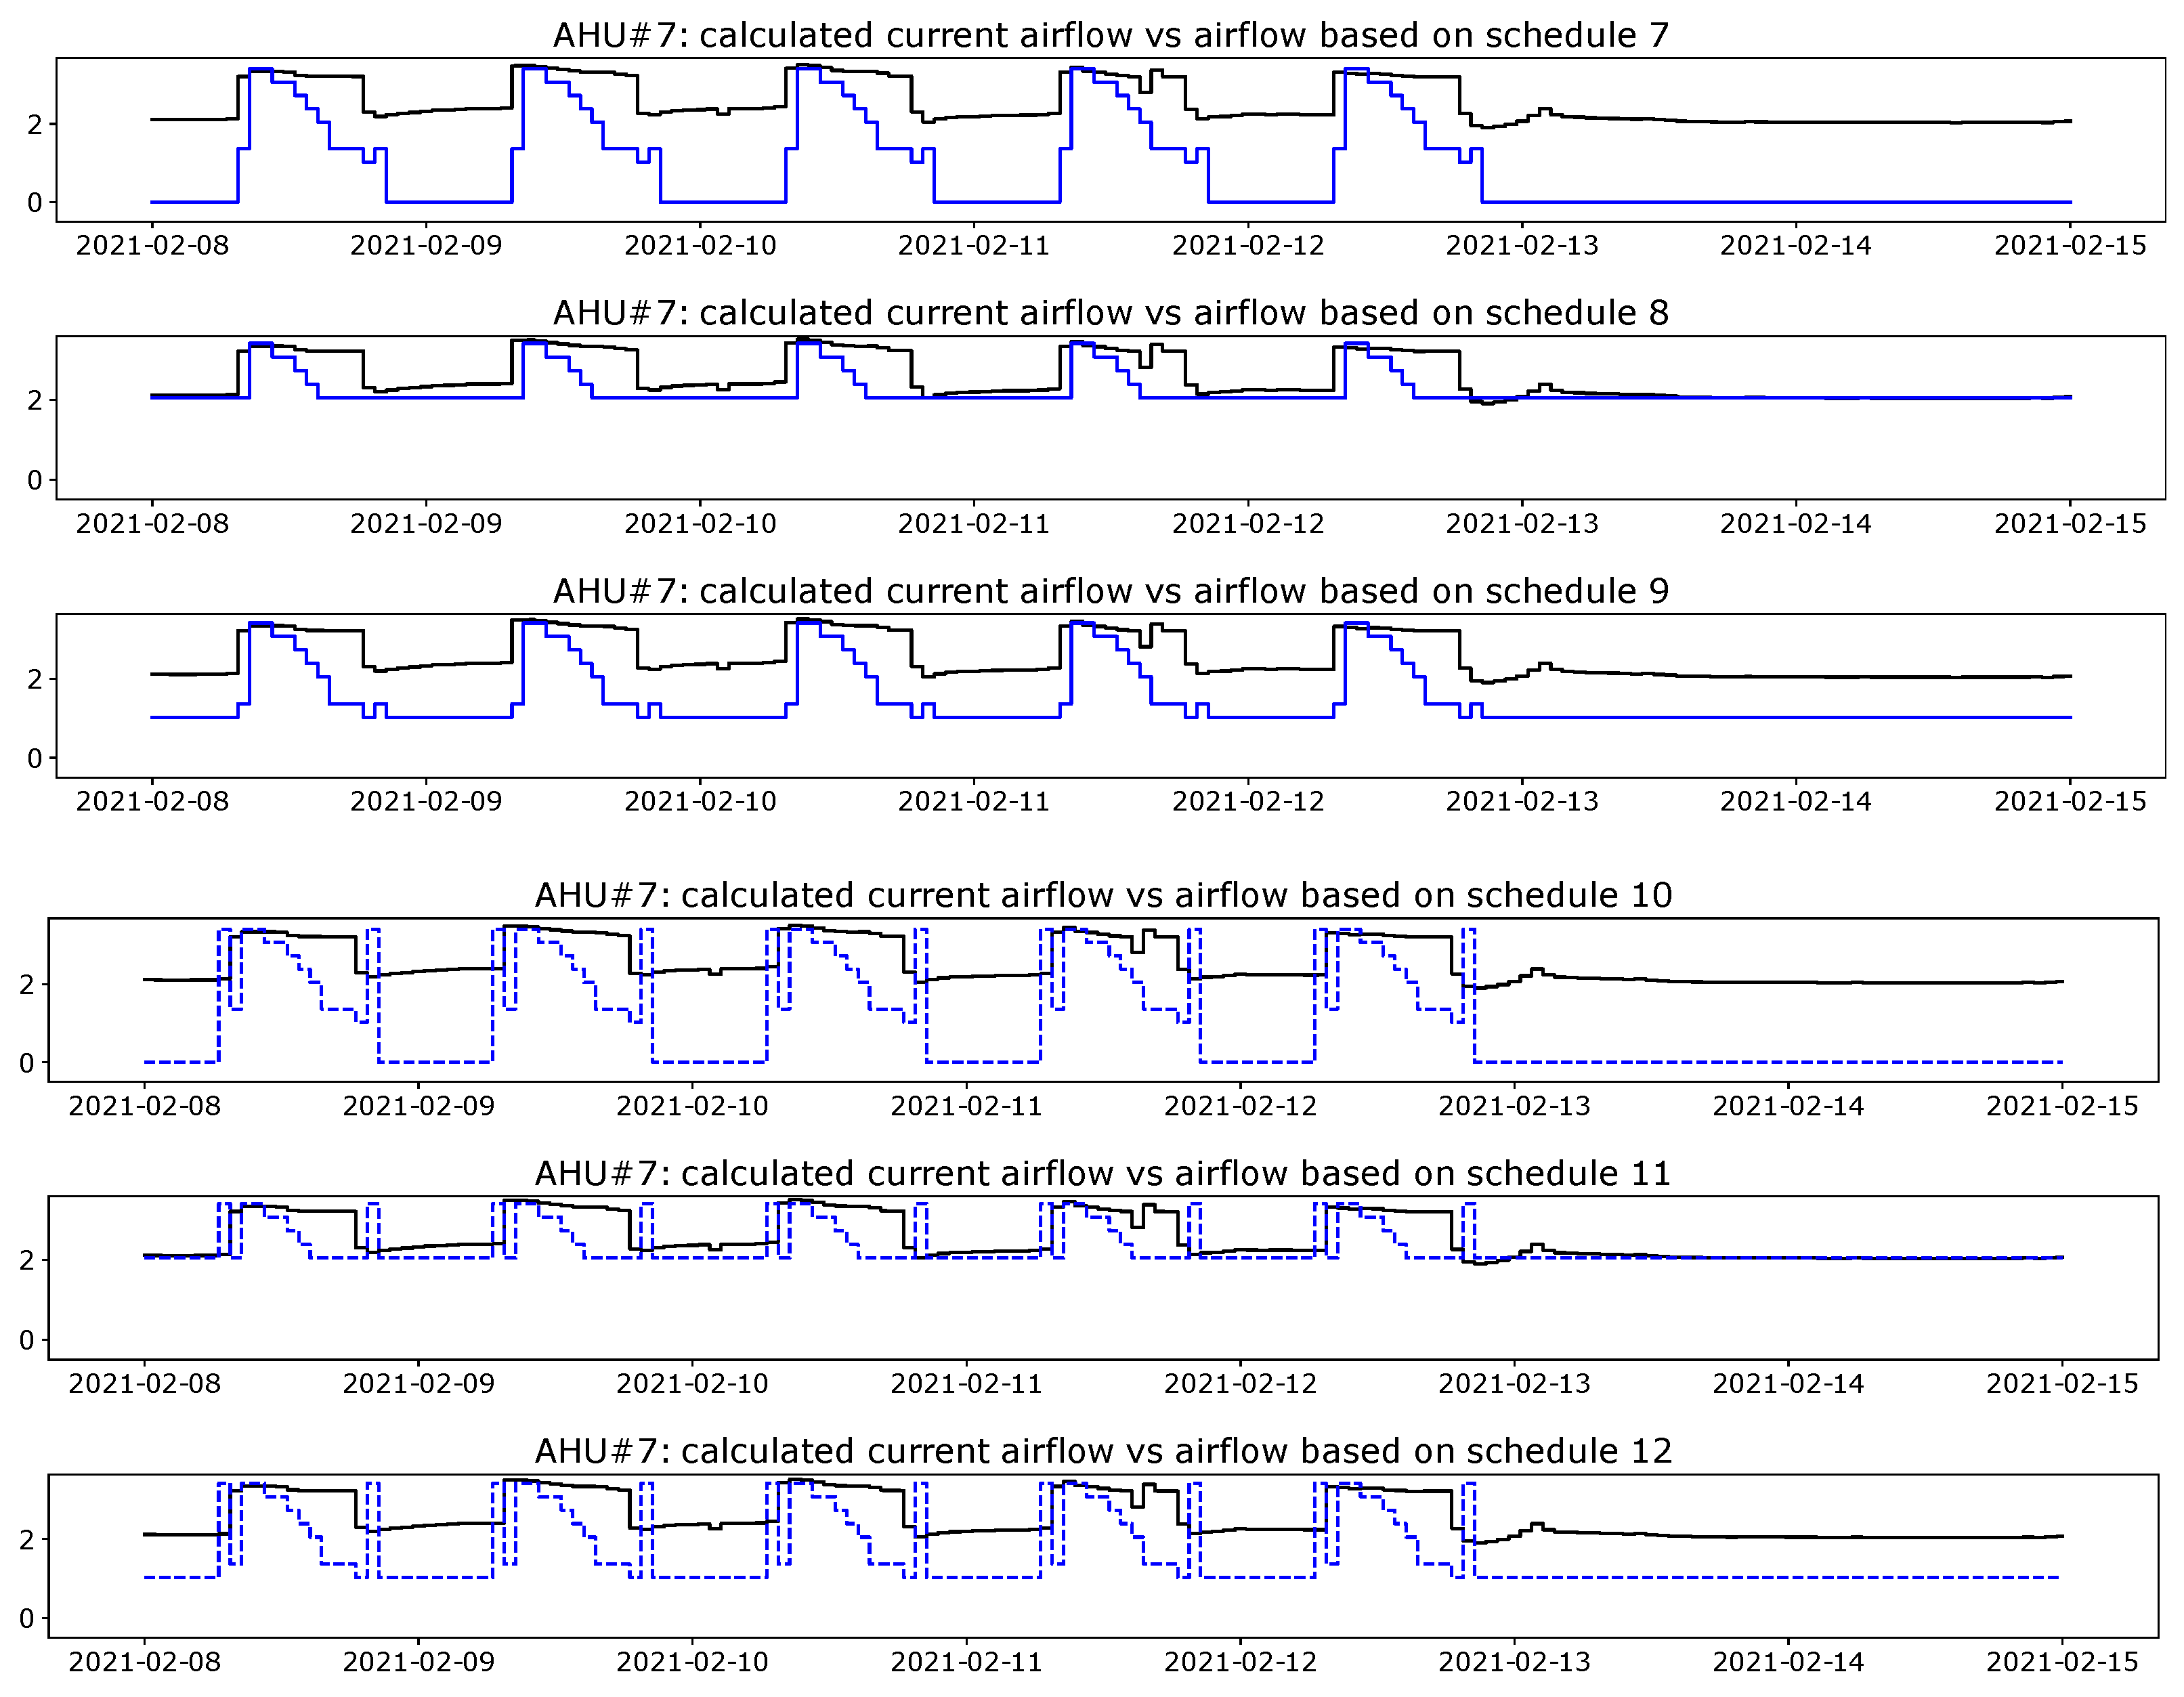
Figure 11 (Schedules 7–9) provides a comparison between the actual airflow of AHU#7 at the school and the proposed DCV approach with three different minimum ventilation rates q min : 0 % , 60 % , 30 % . Schedules 10–12 then provide additional flush-out periods of 1 h before and 1 h after the occupancy times.
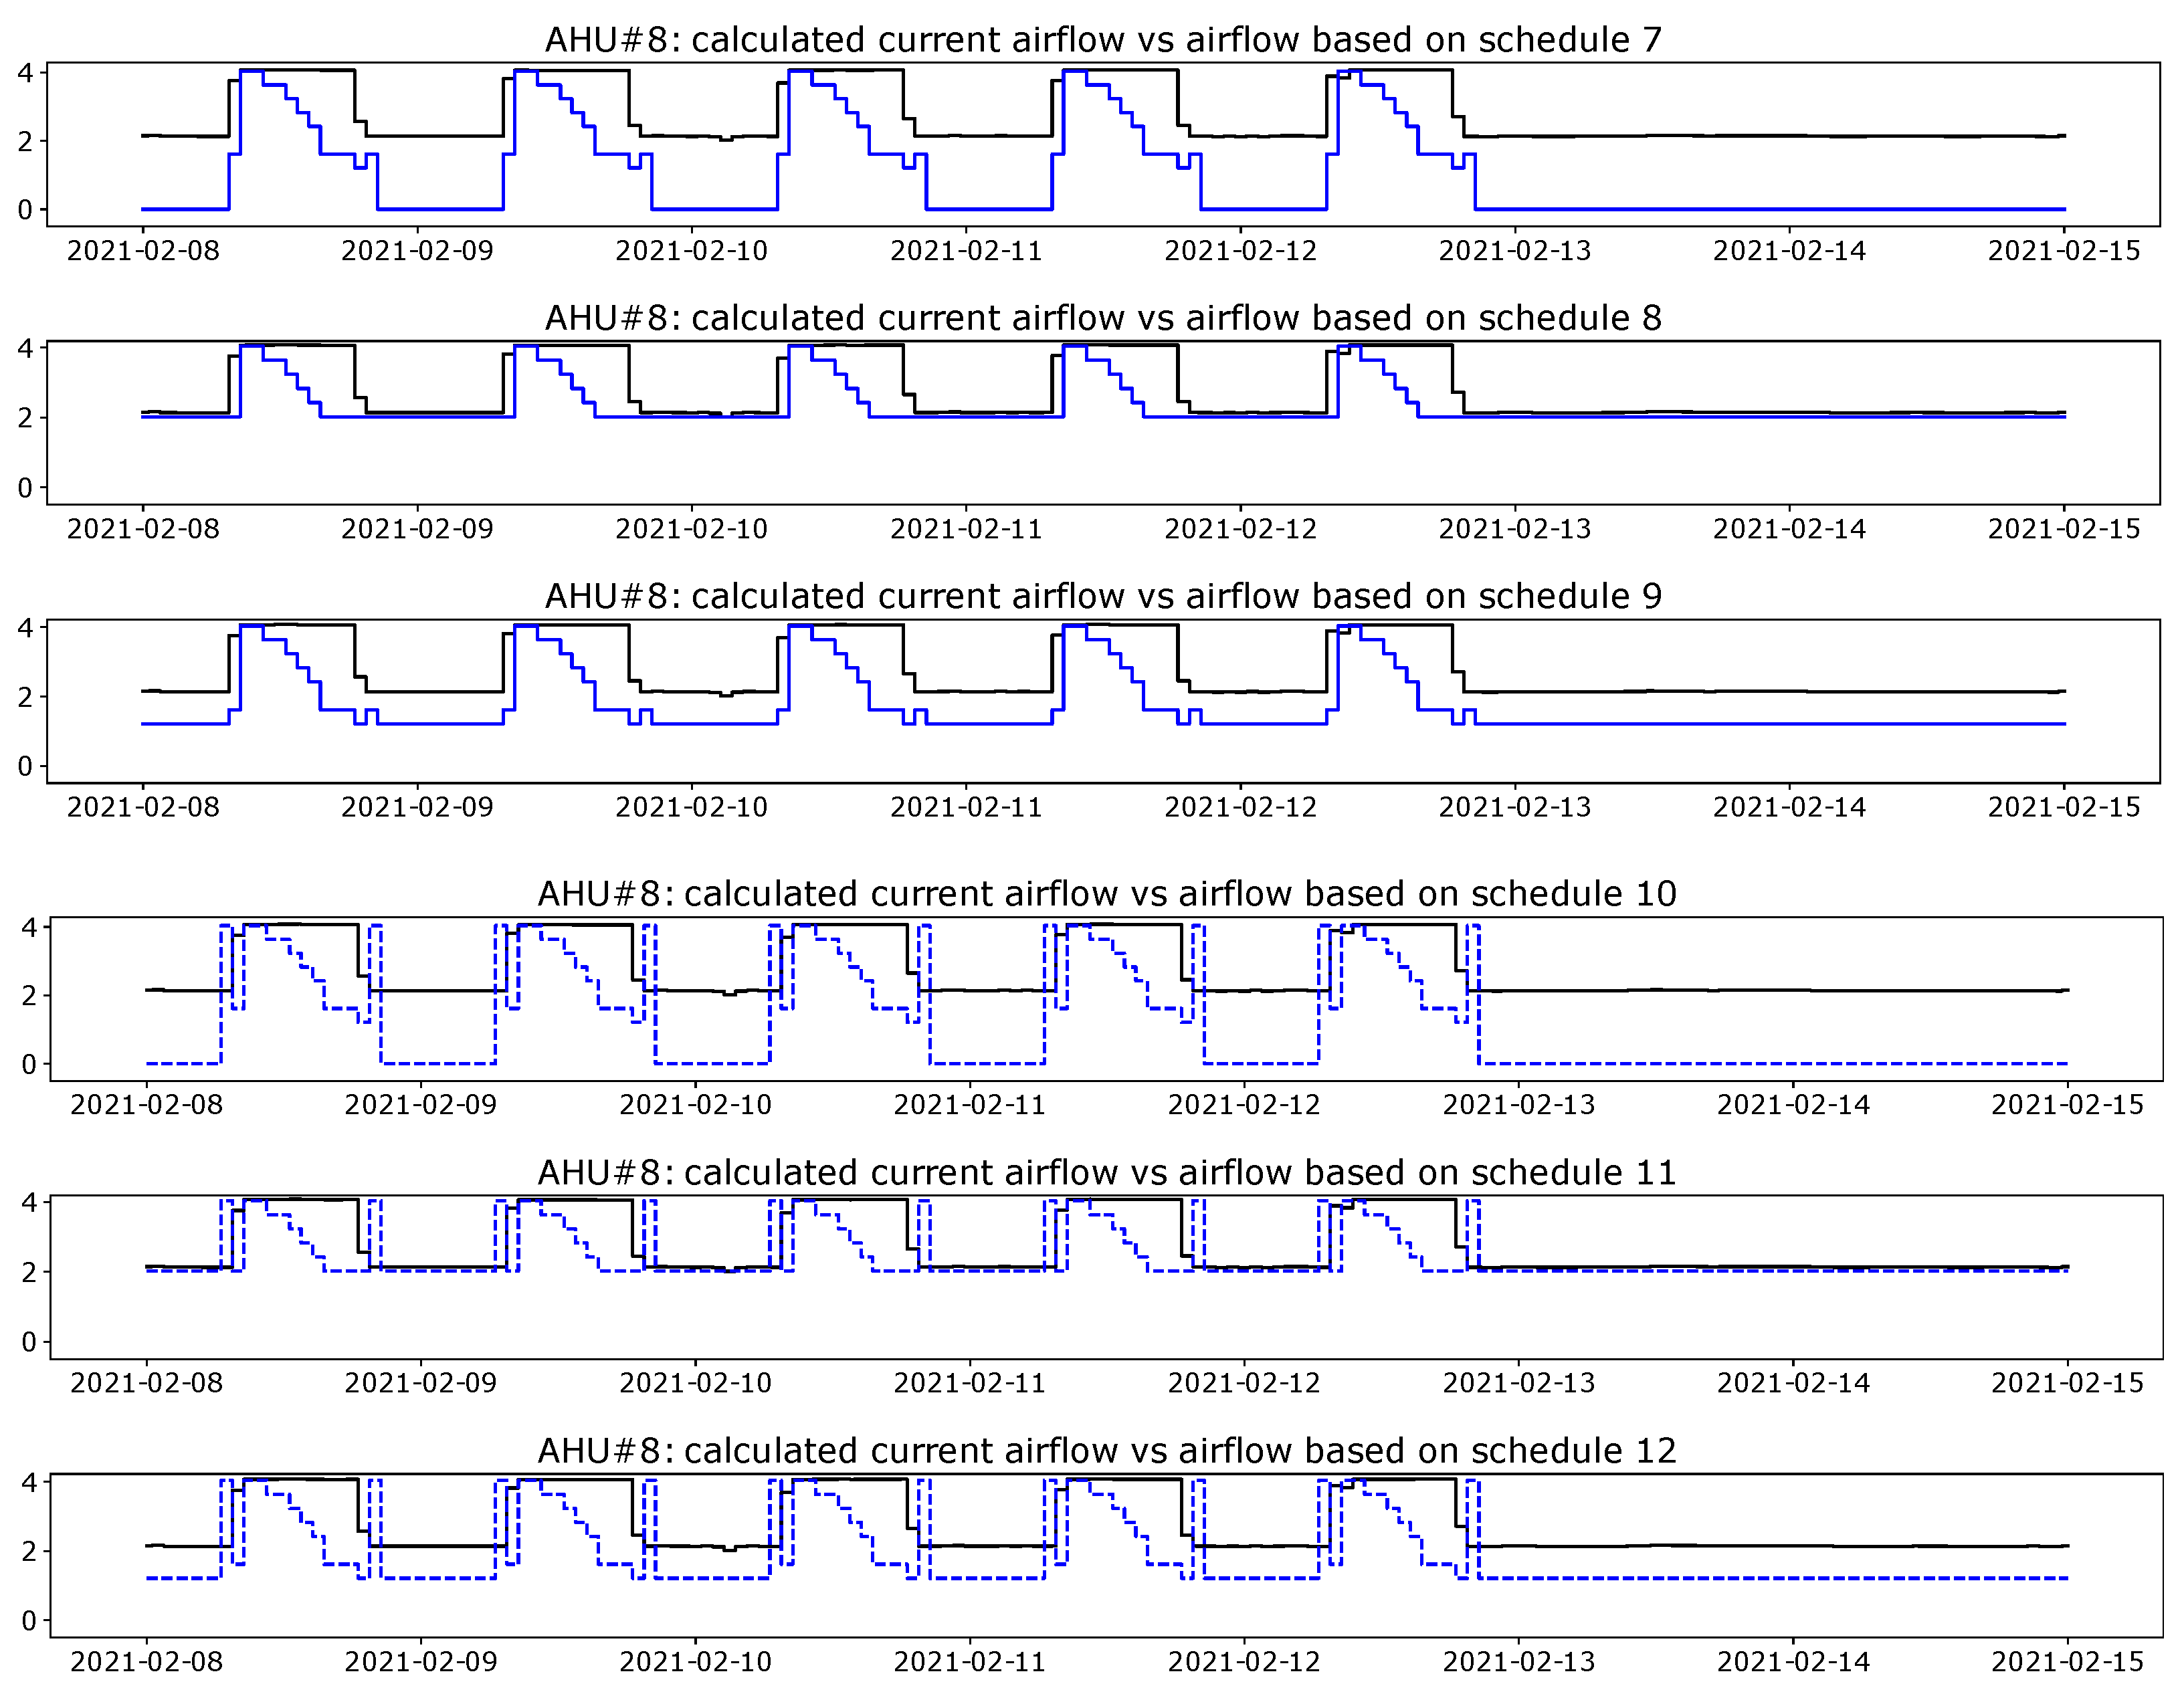
To calculate the value of R fan , the maximum airflow rate q max fan = 4.75 m 3 / s and maximum power consumption per unit airflow P max f a n = 1.54 kW m 3 / s are obtained from the technical documentation of the AHU#8. Based on Figure 12 and Figure 13, it appears that AHU#8 was not operating at its maximum flow capacity. The figures represent different scenarios for ventilation scheduling, namely, q min = 0 % , 30 % , 50 % (current), and to a maximum of 85 % of the maximum airflow rate q max fan .
To assess the influence of the ventilation system on energy consumption and the school’s budget, electricity prices per specific hours were considered (i) for the time when the representative week took place, and (ii) for the following two years. The selected dates were chosen to closely match the week of the year that was used for the analysis [53].
Table 2 shows the electricity use in kWh for a specific week, for all the 12 scheduling scenarios (labeled by either “CL”, thus “classical approach”, or “DCV”) and what was actually measured for the current ventilation scheduling in the school. For each year, the electricity price for each hour of that week was used to calculate how much should be paid for ventilation during that week. Moving on to the next year 2022, we then used hourly prices that were closest to the original week; the same process was repeated for the year 2023.
Finally, Table 3 reports a breakdown of the energy consumption for each different scenario, compared against the current scheduling that is portrayed by the measured data. We conclude this section by observing that indoor air quality was not overlooked in the analysis. The schedules were designed with the intention of maintaining good IAQ within the school environment by following the standards and directives.

4. Discussion

As a main, general point here, our method allows defining effective AHU scheduling by requiring a minimal diversity of data. This is accomplished by inferring occupancy from only the electricity consumption of the building, namely, from information that is always available regardless of construction type or geographical area. As such, the procedure presented in this paper is immediately applicable to any building that requires HVAC for indoor environmental comfort.
Regarding the input data and their time-series arrangement, in Section 3.1, Figure 5 shows the expected qualitative difference between weekday and weekend consumption. The “0” centroid (outliers) and“1” centroid (consumption) are quite distinct during weekdays, portraying the typical large variance of different daily occupants’ schedules. Weekends, as they have nearly zero or very little occupancy, exhibit little variance and thus show overlapping curves.
A clear advantage of using Schedules 1 to 3, which are based on occupancy detection, is portrayed in Figure 10. The 60% capacity of the current schedule during unoccupied hours is replaced by, respectively, 0% and 30% for Scenarios 1 and 3, with evident energy savings. Taking this a bit further, and in order to comply with the 2023 Estonian regulations about indoor air quality, one can apply Schedule 4 in Figure 10 that prescribes pre- and post-occupancy flush out with a one hour shift. In addition to these energy considerations, the above results and figures prove that the proposed algorithm for occupancy detection is capable of reproducing an actual scheduling profile in the school. It is, therefore, well validated.
Moving on to the occupancy estimation, this represents one more degree of difficulty compared to the bare (binary) detection. One can see that in Figure 11, the same validation of our method is present, together with some energy-saving potential capabilities from the calculated curves (Schedules 7 to 12). Qualitatively, there is no difference in validation whether one chooses AHU#7 or AHU#8.
Table 2 and Table 3 constitute our main result from the point of view of applications. First, Table 2 quantifies in absolute values how our scenarios will affect expenses by different prices (which have increased). One only needs to keep in mind that this consumption is only based on one week since the idea is to create schedules for the week or the month ahead, taking into account profiles from the closest weeks and similar ones from previous years.
An even clearer view of the benefit that can be reached through a more flexible schedule is given in Table 3. For instance, Scenario 1 provides 10.4% energy saving compared to the measured consumption. However, the fact that in 2021, it costs 4.1% more, shows how establishing a dynamical schedule that would (i) closely reflect occupancy changes, (ii) comply with national regulations, and (iii) save energy at the same time is not an easy task.
The relative percentages over the actual schedule’s cost in Table 3 manifestly show that Scenarios 1 to 6 (occupancy detection with or without flush out) exhibit larger costs than the reference actual profile from the school. The reason for increased energy consumption in these cases is the utilization of maximum airflow during occupied periods and the same minimum airflow as in the original schedule.
On the other hand, Scenarios 7 to 12 are systematically and substantially cheaper than the actual schedule, reaching 61.2% savings for AHU#8 for the reference week. It, therefore, seems that a more sophisticated algorithm that is based on occupancy estimation is more rewarding. This is another clear confirmation of the cost-effectiveness of DCV ventilation.
We should remark that the above considerations are drawn from somewhat crude estimations that are based only on one single week. Over the whole year, the percentages in Table 3 might thus change. As the week considered here for testing is typical, and, therefore, representative of the school’s normal operation, we do not expect substantial deviations from these results, which are still valid, at least qualitatively.
It is also worth noticing that Scenario 6, although consuming circa 1 kWh more energy, ensures compliance with both ANSI/ASHRAE Standard 62.1-2019 [45], EN 16798-1:2019 [46], along with the Estonian regulation (RT I, 10.01.2023, 12) [47] for IAQ. Conversely, strictly adhering to the Estonian legislation, where ventilation is completely turned off during unoccupied hours, will result in lower energy consumption. However, this approach may not lead to significant cost savings as market prices tend to be higher during the beginning of the working day and evenings when the flush-out strategy is applied.
To summarize, all the applied DCV schedules with occupancy estimation (Scenarios 7 to 12) lead to decreased energy consumption and lower total bills, considering both energy consumption and cost savings. It is, therefore, important to strike a balance between meeting ventilation standards and optimizing energy efficiency. By selecting an appropriate DCV strategy, we have shown that it is possible to achieve both reduced energy consumption and lower overall expenses.
The method described above has several limitations that should be taken into consideration. First, if the system has only one main meter for cumulative readings and lacks individual readings for the AHUs at a given measurement frequency, it becomes challenging to accurately aggregate the “plugs and lighting” feature. This can lead to less accurate occupancy detection and estimation.
Secondly, the method assumes predictable behavior patterns. However, significant disruptions like the COVID-19 pandemic can compromise the accuracy of occupancy detection and estimation. Unforeseen events or behavior shifts can challenge occupancy prediction, especially initially. The pandemic-induced shift to remote work and school closures altered electricity usage, rendering models based on historical patterns less effective.
Third, the clustering procedure that is used for occupancy estimation requires some minimum amount of data. If the system was just installed, thus is lacking sufficient data, performing clustering becomes almost impossible, resulting in lower overall accuracy.
It is also important to note that behavioral patterns and schedules derived from data are typically effective for shorter periods, ranging from one week to one month. This is because behavior can be influenced by seasonal shifts, the occurrence of seasonal diseases, and other factors. As a result, it is not recommended to rely on longer-term schedules without regular updates to account for changing patterns and circumstances. Understanding and acknowledging these limitations is crucial for implementing accurate and effective occupancy-based ventilation strategies, and it highlights the need for continuous monitoring and adaptation to maintain optimal indoor air quality and energy efficiency.
Lastly, we should point out that the present investigation is currently focused on control algorithm optimization and computer simulations. The actual experiments are planned to be conducted in different settings, such as offices or shopping malls. Whilst occupancy inference and the subsequent AHU control algorithm are trained on real-world data from the school, we have certain constraints in conducting experiments in facilities primarily used by children due to ethical considerations. As our estimates in Table 2 and Table 3 are, however, encouraging, an immediate development of this study will involve a full experimental assessment to validate and fine-tune such estimates against a school’s AHU automation control that integrates our algorithm.

5. Conclusions

Defining a ventilation schedule in schools that would guarantee good IAQ, satisfy national standard requirements, save energy, and be cost-effective at the same time is a rather involved task. Demand-controlled ventilation seems to be a valid tool for use towards this aim; nevertheless, its implementation requires knowledge of the amount of occupants in the enclosures. More often than not, installing in classrooms the necessary sensors for occupancy detection or estimation is not possible.
In this paper, we have attempted to circumvent this difficulty by establishing a novel statistical method that is based on advanced data-clustering techniques and measured energy use from a school in Estonia during the years 2020 and 2021. Using only energy consumption data of the air handling units, the algorithm is able to either simply predict whether occupants are present in the space, or to estimate their number. Such predictions were used to implement 12 schedules for the operation of ventilation systems in the school. These schedules cover different techniques and combinations to calculate general energy consumption, and vary from classical occupancy detection with an on-off method to occupancy estimation for demand-controlled ventilation.
We have found that by considering occupancy detection, the 60% capacity of current schedules can be replaced by 30% or even 0%, resulting in evident energy savings that can range from 3.5% to 66.4%. While the schedules that are based on the classical detection method exhibit a wide range of energy consumption, with half of them inducing equal or larger energy use than with the actual scheduling, the more sophisticated DCV-based occupancy estimation methods induce systematic savings in terms of both energy and costs.
A cost analysis with energy price estimations running from 2021 to 2023 returns substantial economic savings if DCV-occupancy estimation is realized, from 18.1% to even 62.6%. This further supports the usage of DCV in ventilation systems’ operation. Remarkably, these schedules also comply with the 2023 Estonian regulations about indoor air quality, which makes them applicable and immediately ready for implementation into standards after further successful testing.
Some limitations of the method here introduced do, however, exist. Aggregating the “plugs and lighting” feature could be problematic in certain buildings, due to lack of meters; behavior patterns might not be easily predictable; the clustering procedure that was used for occupancy estimation requires a minimum amount of data; and finally, behavioral patterns and data-derived schedules are usually effective for shorter periods, from one week to one month, needing dataset updates for addressing longer time periods. These all constitute further inputs for consideration in future work.

Author Contributions

Conceptualization, K.V., M.M. and A.F.; methodology, K.V., M.M., A.F. and M.T.; software, K.V. and M.M.; validation, K.V., M.M., A.F. and M.T.; formal analysis, J.B. and E.P.; investigation, K.V., M.M. and A.F.; resources, J.B., E.P. and M.T.; data curation, K.V. and M.M.; writing—original draft preparation, K.V., M.M. and A.F.; writing—review and editing, J.B., E.P. and M.T.; visualization, K.V., M.M. and A.F.; supervision, J.B., E.P. and M.T.; project administration, M.T.; funding acquisition, J.B., M.T. and E.P. All authors have read and agreed to the published version of the manuscript.

Funding

This work was partly supported by the Estonian Research Council grants no. PRG1463, PRG658, and PSG409, by the Estonian Ministry of Education and Research and European Regional Development Fund (grant 2014-2020.4.01.20-0289), and by the European Commission through the H2020 project Finest Twins (grant No. 856602), by the European Union’s Horizon Europe research and innovation programme under the grant agreement No 101120657, project ENFIELD (European Lighthouse to Manifest Trustworthy and Green AI), and by the Estonian Centre of Excellence in Energy Efficiency, ENER (grant TK230) funded by the Estonian Ministry of Education and Research, European Commission through LIFE IP BUILDEST (LIFE20 IPC/EE/000010), European Union and Estonian Research Council via project TEM-TA78.

Data Availability Statement

The raw data supporting the conclusions of this article will be made available by the authors on request.

Acknowledgments

We thank Tuule Mall Parts for useful discussions.

Conflicts of Interest

The authors declare no conflicts of interest.

References

  1. Economidou, M.; Todeschi, V.; Bertoldi, P.; D’Agostino, D.; Zangheri, P.; Castellazzi, L. Review of 50 years of EU energy efficiency policies for buildings. Energy Build. 2020, 225, 110322. [Google Scholar] [CrossRef]
  2. COM(2021)802—Directive; Energy Performance of Buildings (Recast). European Commission: Brussels, Belgium, 2021.
  3. European Commission. Energy Efficiency in Buildings; European Commission: Brussels, Belgium, 2020. [Google Scholar]
  4. McArthur, J.; Powell, C. Health and wellness in commercial buildings: Systematic review of sustainable building rating systems and alignment with contemporary research. Build. Environ. 2020, 171, 106635. [Google Scholar] [CrossRef]
  5. Hong, T.; Taylor-Lange, S.C.; D’Oca, S.; Yan, D.; Corgnati, S.P. Advances in research and applications of energy-related occupant behavior in buildings. Energy Build. 2016, 116, 694–702. [Google Scholar] [CrossRef]
  6. Ferrantelli, A.; Kuivjõgi, H.; Kurnitski, J.; Thalfeldt, M. Office Building Tenants’ Electricity Use Model for Building Performance Simulations. Energies 2020, 13, 5541. [Google Scholar] [CrossRef]
  7. Delzendeh, E.; Wu, S.; Lee, A.; Zhou, Y. The impact of occupants’ behaviours on building energy analysis: A research review. Renew. Sustain. Energy Rev. 2017, 80, 1061–1071. [Google Scholar] [CrossRef]
  8. Martinaitis, V.; Zavadskas, E.K.; Motuzienė, V.; Vilutienė, T. Importance of occupancy information when simulating energy demand of energy efficient house: A case study. Energy Build. 2015, 101, 64–75. [Google Scholar] [CrossRef]
  9. Maasoumy, M.; Sangiovanni-Vincentelli, A. Smart Connected Buildings Design Automation: Foundations and Trends. Found. Trends® Electron. Des. Autom. 2016, 10, 1–143. [Google Scholar] [CrossRef]
  10. Trivedi, D.; Badarla, V. Occupancy detection systems for indoor environments: A survey of approaches and methods. Indoor Built Environ. 2020, 29, 1053–1069. [Google Scholar] [CrossRef]
  11. Lu, X.; Bhattacharya, S.; Sharma, H.; Adetola, V.; O’Neill, Z. Sensor impact evaluation in commercial buildings: The case of occupancy-centric controls. Energy Build. 2022, 267, 112134. [Google Scholar] [CrossRef]
  12. Kjærgaard, M.B.; Ardakanian, O.; Carlucci, S.; Dong, B.; Firth, S.K.; Gao, N.; Huebner, G.M.; Mahdavi, A.; Rahaman, M.S.; Salim, F.D.; et al. Current practices and infrastructure for open data based research on occupant-centric design and operation of buildings. Build. Environ. 2020, 177, 106848. [Google Scholar] [CrossRef]
  13. Sun, K.; Zhao, Q.; Zou, J. A review of building occupancy measurement systems. Energy Build. 2020, 216, 109965. [Google Scholar] [CrossRef]
  14. Gul, M.S.; Patidar, S. Understanding the energy consumption and occupancy of a multi-purpose academic building. Energy Build. 2015, 87, 155–165. [Google Scholar] [CrossRef]
  15. Khan, D.S.; Kolarik, J.; Hviid, C.A.; Weitzmann, P. Method for long-term mapping of occupancy patterns in open-plan and single office spaces by using passive-infrared (PIR) sensors mounted below desks. Energy Build. 2021, 230, 110534. [Google Scholar] [CrossRef]
  16. Li, N.; Calis, G.; Becerik-Gerber, B. Measuring and monitoring occupancy with an RFID based system for demand-driven HVAC operations. Autom. Constr. 2012, 24, 89–99. [Google Scholar] [CrossRef]
  17. Daniel, O.C.; Ramsurrun, V.; Seeam, A.K. Smart Library Seat, Occupant and Occupancy Information System, using Pressure and RFID Sensors. In Proceedings of the 2019 Conference on Next Generation Computing Applications (NextComp), Port Louis, Mauritius, 19–21 September 2019; IEEE: Piscataway, NJ, USA, 2019; pp. 1–5. [Google Scholar] [CrossRef]
  18. Wang, Y.; Shao, L. Understanding occupancy pattern and improving building energy efficiency through Wi-Fi based indoor positioning. Build. Environ. 2017, 114, 106–117. [Google Scholar] [CrossRef]
  19. Wang, W.; Wang, J.; Chen, J.; Huang, G.; Guo, X. Multi-zone outdoor air coordination through Wi-Fi probe-based occupancy sensing. Energy Build. 2018, 159, 495–507. [Google Scholar] [CrossRef]
  20. O’Neill, Z.D.; Li, Y.; Cheng, H.C.; Zhou, X.; Taylor, S.T. Energy savings and ventilation performance from CO2-based demand controlled ventilation: Simulation results from ASHRAE RP-1747 (ASHRAE RP-1747). Sci. Technol. Built Environ. 2020, 26, 257–281. [Google Scholar] [CrossRef]
  21. Franco, A.; Leccese, F. Measurement of CO2 concentration for occupancy estimation in educational buildings with energy efficiency purposes. J. Build. Eng. 2020, 32, 101714. [Google Scholar] [CrossRef]
  22. Wei, Y.; Wang, S.; Jin, L.; Xu, Y.; Ding, T. Indoor occupancy estimation from carbon dioxide concentration using parameter estimation algorithms. Build. Serv. Eng. Res. Technol. 2022, 43, 419–438. [Google Scholar] [CrossRef]
  23. Chen, Z.; Jiang, C.; Xie, L. Building occupancy estimation and detection: A review. Energy Build. 2018, 169, 260–270. [Google Scholar] [CrossRef]
  24. Petersen, S.; Pedersen, T.H.; Nielsen, K.U.; Knudsen, M.D. Establishing an image-based ground truth for validation of sensor data-based room occupancy detection. Energy Build. 2016, 130, 787–793. [Google Scholar] [CrossRef]
  25. Zou, J.; Zhao, Q.; Yang, W.; Wang, F. Occupancy detection in the office by analyzing surveillance videos and its application to building energy conservation. Energy Build. 2017, 152, 385–398. [Google Scholar] [CrossRef]
  26. Capozzoli, A.; Piscitelli, M.S.; Brandi, S. Mining typical load profiles in buildings to support energy management in the smart city context. Energy Procedia 2017, 134, 865–874. [Google Scholar] [CrossRef]
  27. Kleiminger, W.; Beckel, C.; Staake, T.; Santini, S. Occupancy Detection from Electricity Consumption Data. In Proceedings of the 5th ACM Workshop on Embedded Systems For Energy-Efficient Buildings, Rome, Italy, 11–15 November 2013; ACM: New York, NY, USA, 2013; pp. 1–8. [Google Scholar] [CrossRef]
  28. Kleiminger, W.; Beckel, C.; Santini, S. Household occupancy monitoring using electricity meters. In Proceedings of the 2015 ACM International Joint Conference on Pervasive and Ubiquitous Computing, Osaka, Japan, 7–11 September 2015; ACM: New York, NY, USA, 2015; pp. 975–986. [Google Scholar] [CrossRef]
  29. Pereira, D.; Castro, R.; Adão, P. Occupancy detection and prediction from electricity consumption data in smart homes: Application to a Portuguese case-study. Intell. Build. Int. 2022, 14, 690–709. [Google Scholar] [CrossRef]
  30. Gunay, H.B.; O’Brien, W.; Beausoleil-Morrison, I.; Gilani, S. Modeling plug-in equipment load patterns in private office spaces. Energy Build. 2016, 121, 234–249. [Google Scholar] [CrossRef]
  31. Chong, A.; Augenbroe, G.; Yan, D. Occupancy data at different spatial resolutions: Building energy performance and model calibration. Appl. Energy 2021, 286, 116492. [Google Scholar] [CrossRef]
  32. Satre-Meloy, A.; Diakonova, M.; Grünewald, P. Cluster analysis and prediction of residential peak demand profiles using occupant activity data. Appl. Energy 2020, 260, 114246. [Google Scholar] [CrossRef]
  33. Liu, X.; Ding, Y.; Tang, H.; Xiao, F. A data mining-based framework for the identification of daily electricity usage patterns and anomaly detection in building electricity consumption data. Energy Build. 2021, 231, 110601. [Google Scholar] [CrossRef]
  34. Tien, P.W.; Wei, S.; Darkwa, J.; Wood, C.; Calautit, J.K. Machine Learning and Deep Learning Methods for Enhancing Building Energy Efficiency and Indoor Environmental Quality—A Review. Energy AI 2022, 10, 100198. [Google Scholar] [CrossRef]
  35. Ferrando, M.; Marchenko, A.; Erba, S.; Causone, F.; Carlucci, S. Pattern Recognition And Classification For Electrical Energy Use In Residential Buildings. In Proceedings of the 16th IBPSA Conference, Rome, Italy, 2–4 September 2019. [Google Scholar] [CrossRef]
  36. Toussaint, W.; Moodley, D. Clustering Residential Electricity Consumption Data to Create Archetypes that Capture Household Behaviour in South Africa. S. Afr. Comput. J. 2020, 32, 1–34. [Google Scholar] [CrossRef]
  37. Wei, Y.; Zhang, X.; Shi, Y.; Xia, L.; Pan, S.; Wu, J.; Han, M.; Zhao, X. A review of data-driven approaches for prediction and classification of building energy consumption. Renew. Sustain. Energy Rev. 2018, 82, 1027–1047. [Google Scholar] [CrossRef]
  38. Schwartz, Z.; Uysal, M.; Webb, T.; Altin, M. Hotel daily occupancy forecasting with competitive sets: A recursive algorithm. Int. J. Contemp. Hosp. Manag. 2016, 28, 267–285. [Google Scholar] [CrossRef]
  39. Yang, J.; Ning, C.; Deb, C.; Zhang, F.; Cheong, D.; Lee, S.E.; Sekhar, C.; Tham, K.W. k-Shape clustering algorithm for building energy usage patterns analysis and forecasting model accuracy improvement. Energy Build. 2017, 146, 27–37. [Google Scholar] [CrossRef]
  40. Mahdi, M.A.; Hosny, K.M.; Elhenawy, I. Scalable Clustering Algorithms for Big Data: A Review. IEEE Access 2021, 9, 80015–80027. [Google Scholar] [CrossRef]
  41. Deb, C.; Frei, M.; Hofer, J.; Schlueter, A. Automated load disaggregation for residences with electrical resistance heating. Energy Build. 2019, 182, 61–74. [Google Scholar] [CrossRef]
  42. Ester, M.; Kriegel, H.P.; Sander, J.; Xu, V. A Density-Based Algorithm for Discovering Clusters. In Proceedings of the Second International Conference on Knowledge Discovery in Databases and Data Mining, Portland, OR, USA, 2–4 August 1996; AAAI Press: Washington, DC, USA, 1996; pp. 223–231. [Google Scholar]
  43. Adeogun, R.; Rodriguez, I.; Razzaghpour, M.; Berardinelli, G.; Christensen, P.H.; Mogensen, P.E. Indoor Occupancy Detection and Estimation using Machine Learning and Measurements from an IoT LoRa-based Monitoring System. In Proceedings of the 2019 Global IoT Summit (GIoTS), Aarhus, Denmark, 17–21 June 2019; pp. 1–5. [Google Scholar] [CrossRef]
  44. Murphy, J.; Sturm, E. Demand-Controlled Ventilation. Trane Engineers Newsletter LIVE Series. 2018, pp. 1–50. Available online: https://www.trane.com/content/dam/Trane/Commercial/global/products-systems/education-training/continuing-education-gbci-aia-pdh/APP-CMC067-EN.pdf (accessed on 15 May 2024).
  45. ANSI/ASHRAE Standard 62.1-2019; Ventilation for Acceptable Indoor Air Quality. ASHRAE Customer Service: Atlanta, GA, USA, 2019.
  46. EN 16798-1:2019; Energy Performance of Buildings—Ventilation for Buildings—Part 1: Indoor Environmental Input Parameters for Design and Assessment of Energy Performance of Buildings Addressing Indoor Air Quality, Thermal Environment, Lighting and Acoustics—Module M1-6. CEN: Brussels, Belgium, 2019.
  47. Majandus-ja Taristuminister; Riigi Teataja. Hoolekandeasutuse Hoone ja Sisekliima Tagamisega Mitteelamu Ventileerimise ja Tuulutamise Nõuded; Technical Report; Riigi Teataja: Tallinn, Estonia, 2023. [Google Scholar]
  48. Khovalyg, D.; Kazanci, O.B.; Halvorsen, H.; Gundlach, I.; Bahnfleth, W.P.; Toftum, J.; Olesen, B.W. Critical review of standards for indoor thermal environment and air quality. Energy Build. 2020, 213, 109819. [Google Scholar] [CrossRef]
  49. Clark, J.D.; Less, B.D.; Dutton, S.M.; Walker, I.S.; Sherman, M.H. Efficacy of occupancy-based smart ventilation control strategies in energy-efficient homes in the United States. Build. Environ. 2019, 156, 253–267. [Google Scholar] [CrossRef]
  50. Tödtli, J. The impact of control on the energy use of fans in building ventilation systems. Rehva Eur. Hvac J. 2015, 52, 50–57. [Google Scholar]
  51. Ding, Y.; Brattebø, H.; Nord, N. A systematic approach for data analysis and prediction methods for annual energy profiles: An example for school buildings in Norway. Energy Build. 2021, 247, 111160. [Google Scholar] [CrossRef]
  52. Degirmenci, A.; Karal, O. Efficient density and cluster based incremental outlier detection in data streams. Inf. Sci. 2022, 607, 901–920. [Google Scholar] [CrossRef]
  53. Elering. Elering LIVE: Börsihinnad. 2023. Available online: https://dashboard.elering.ee/et/nps/price?period=days&show=table&interval=minute&start=2024-06-18T16:00:00.000Z&end=2024-06-19T15:59:59.999Z (accessed on 15 May 2024).
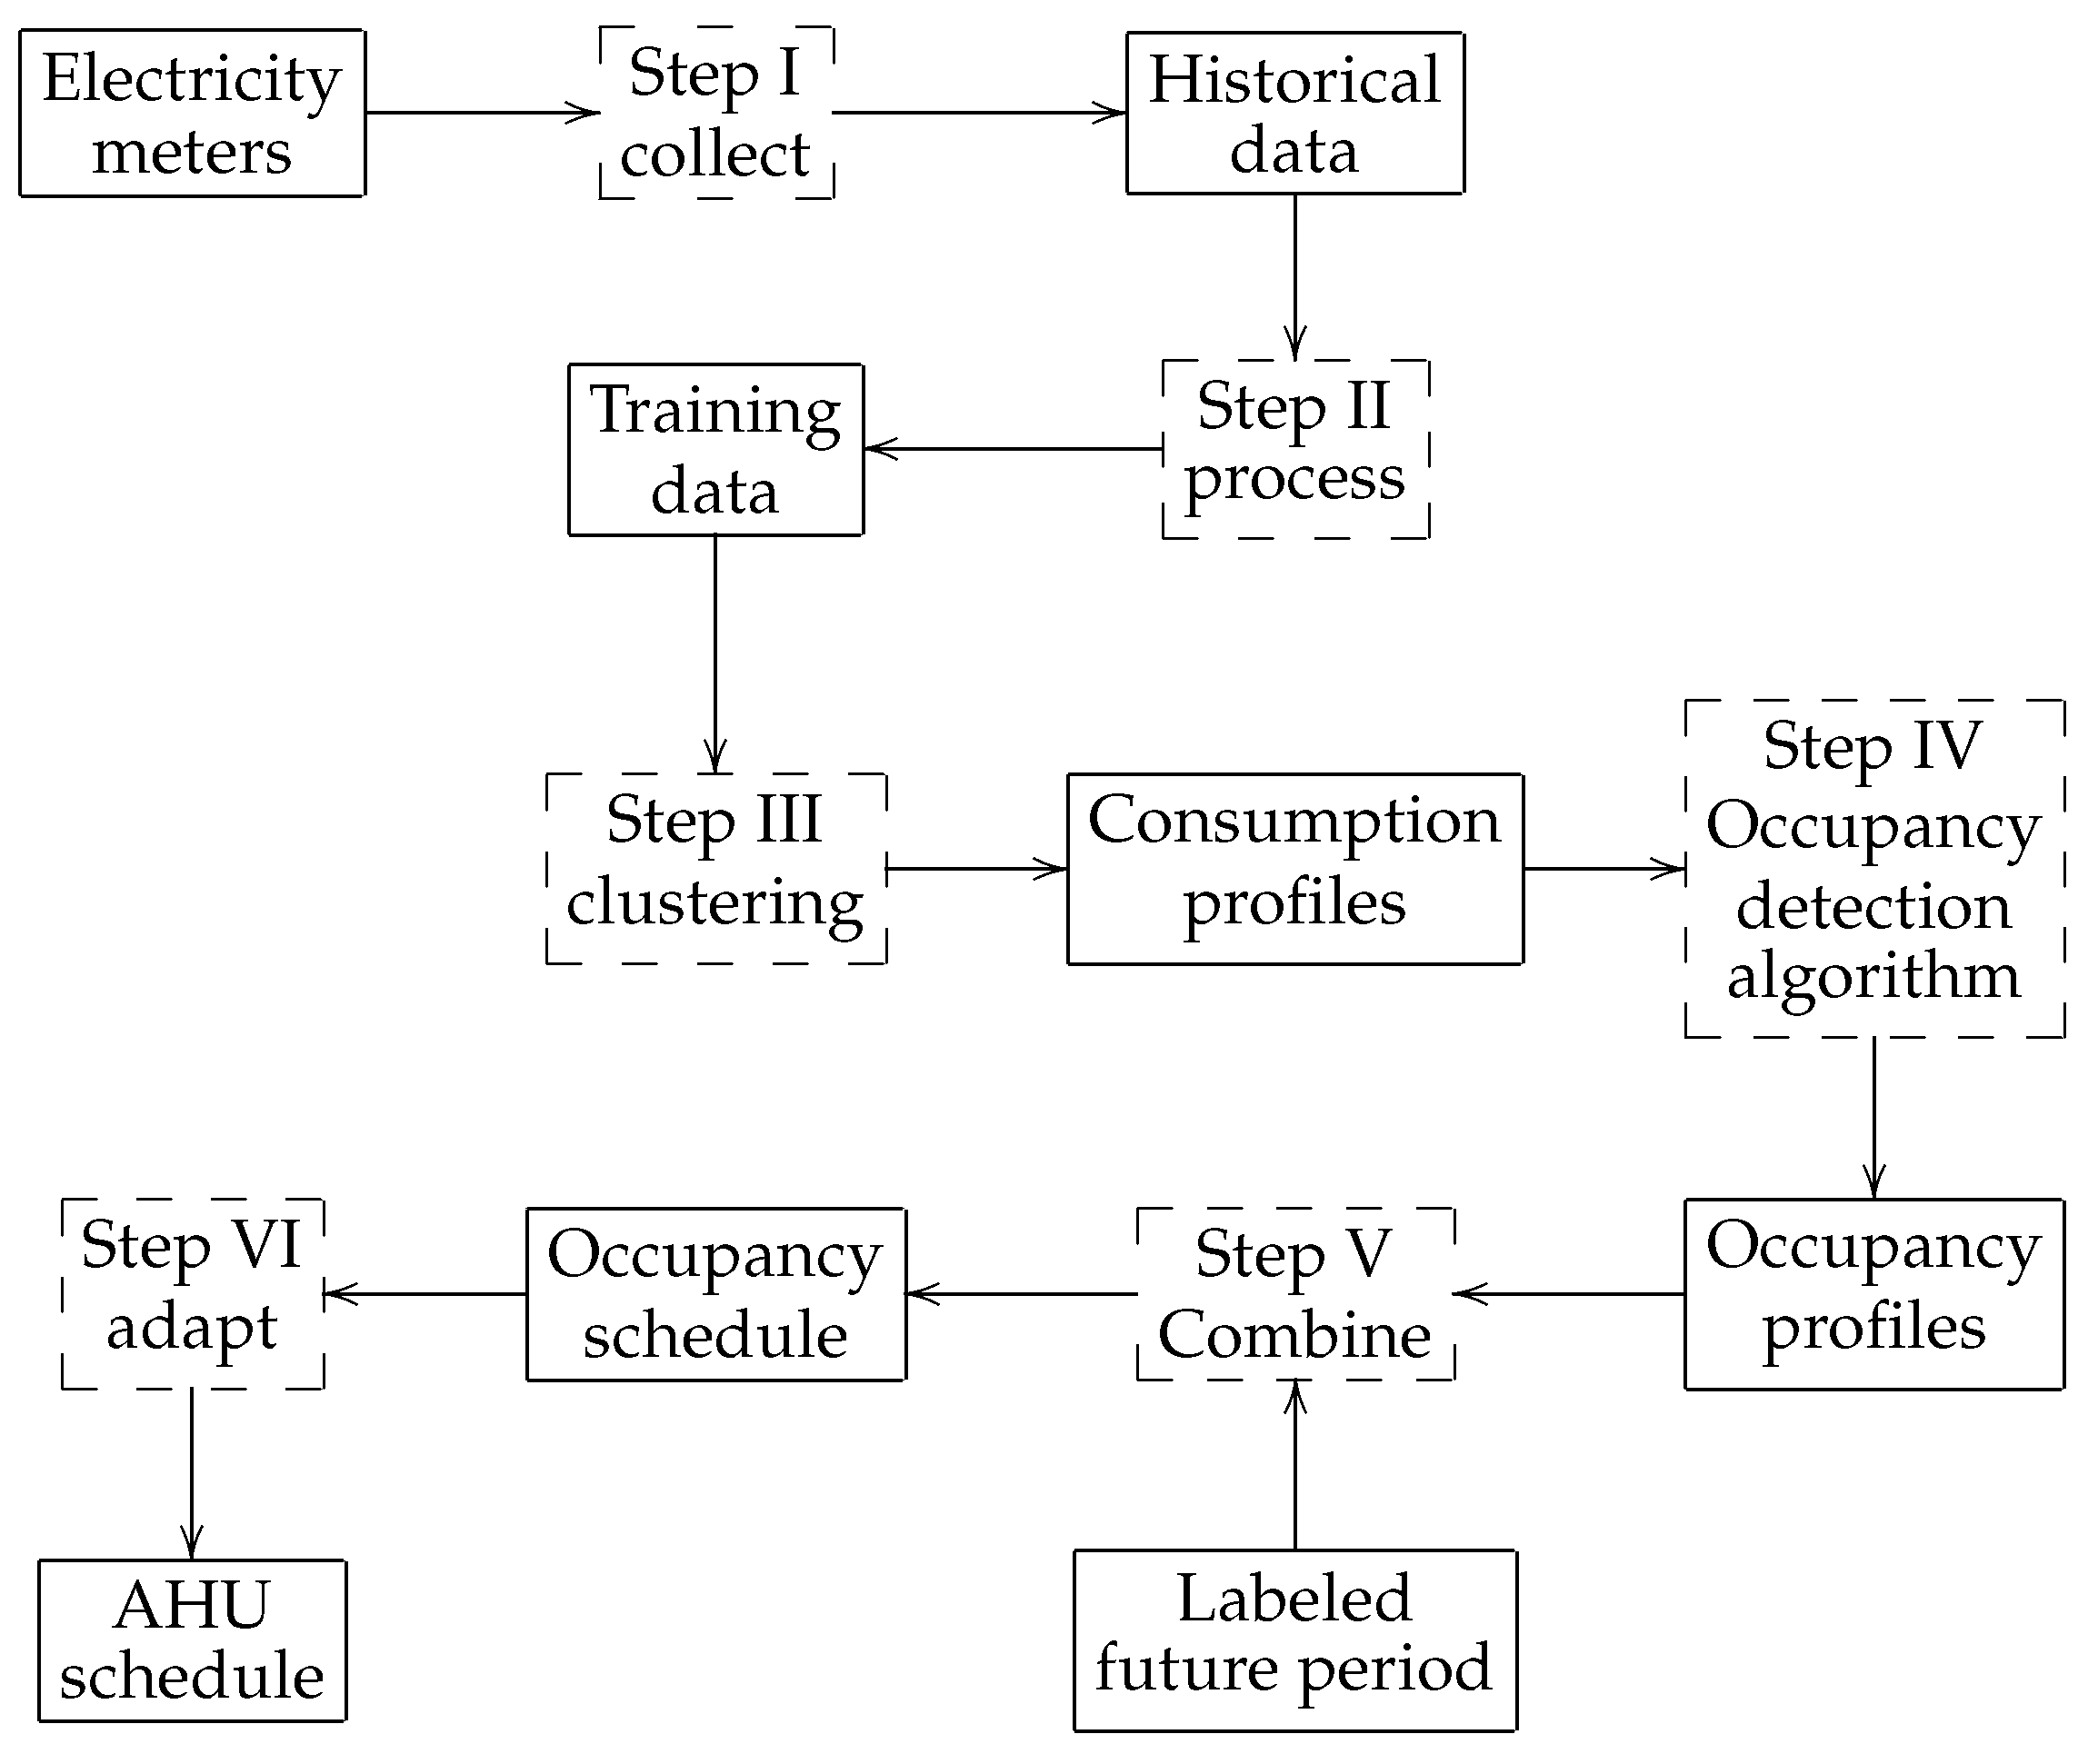
Figure 1. Main steps of the algorithm.
Energies 17 03080 g001
Figure 2. Electricity load patterns for the whole period; the labels show year and week number, where close weeks have close colors and the coloring cycle repeats in one year.
Energies 17 03080 g002
Figure 3. Daily electricity load patterns for school working days only during the whole available period; the coloring scheme is the same as in Figure 2.
Energies 17 03080 g003
Figure 4. Training data for creating electricity consumption profiles.
Energies 17 03080 g004
Figure 5. Workday consumption profile: each thin line represents a specific day that satisfies a given criterion, the dots on the thin lines indicate the cluster to which that specific day belongs, and the thick lines in the figure correspond to the representatives of each cluster.
Energies 17 03080 g005
Figure 6. Weekend consumption profile: each thin line represents a specific day that satisfies a given criterion, the dots on the thin lines indicate the cluster to which that specific day belongs, and the thick lines in the figure represent the representatives of each cluster.
Energies 17 03080 g006
Figure 7. Workday occupancy profiles.
Energies 17 03080 g007
Figure 8. Weekend occupancy profiles.
Energies 17 03080 g008
Figure 9. Occupancy schedules.
Energies 17 03080 g009
Figure 10. Comparison of current schedule (black) and proposed Schedules 1–3 (green) based on occupancy detection and comparison of current schedule (black) and proposed Schedules 4–6 (dashed green) based on occupancy detection with flush out, AHU#7.
Energies 17 03080 g010
Figure 11. Comparison of current schedule (black) and proposed Schedules 7–9 (blue) based on occupancy estimation and comparison of current schedule (black) and proposed Schedules 10–12 (dashed blue) based on occupancy estimation with flush out, AHU#7.
Energies 17 03080 g011
Figure 12. Comparison of current schedule (black) and proposed Schedules 1–3 (green) based on occupancy detection and comparison of current schedule (black) and proposed Schedules 4–6 (dashed green) based on occupancy detection with flush out, AHU#8.
Energies 17 03080 g012
Figure 13. Comparison of current schedule (black) and proposed Schedules 7–9 (blue) based on occupancy estimation and comparison of current schedule (black) and proposed Schedules 10–12 (dashed blue) based on occupancy estimation with flush out, AHU#8.
Energies 17 03080 g013
Table 2. Weekly energy consumption and costs as induced by the proposed schedules in comparison with those measured (energy) or estimated (costs) with the current school scheduling. Consumption [kWh] in bold.
ScenarioAHU 7AHU 8
Cons.202120222023Cons.202120222023
kWhkWh
1, CL627.959.8590.2291.96583.755.6483.8785.48
2, CL843.1771.3106.2110.37699.0661.7792.4395.35
3, CL654.6861.2792.2194.25608.4256.9585.787.6
4, CL676.263.6596.9798.15628.659.1790.1591.24
5, CL881.0274.28111.49115.22738.3664.8797.93100.39
6, CL701.6864.9798.78100.27652.1260.3991.8193.2
7, DCV235.5525.4235.2135.23219.123.6432.7532.77
8, DCV496.7241.1857.5860.44352.3631.4743.845.28
9, DCV262.3326.8537.1937.52352.3631.4743.845.28
10, DCV329.0532.8148.1347.26306.030.5144.7643.95
11, DCV572.4247.1768.0470.19430.9637.6954.6655.4
12, DCV354.5334.1449.9449.39329.5231.7346.4345.91
Measured700.7857.5185.6789.55650.5656.1284.2587.49
Table 3. Weekly energy consumption and prices for different years: comparison of the proposed schedules with the actual school schedule in terms of percentage difference. Consumption in bold.
ScenarioAHU 7 [%]AHU 8 [%]
Cons.202120222023Cons.202120222023
1, CL−10.44.15.32.7−10.3−0.9−0.5−2.3
2, CL20.324.023.923.27.510.09.79.0
3, CL−6.66.57.65.2−6.51.41.70.1
4, CL−3.510.613.29.6−3.45.47.04.3
5, CL25.729.130.128.613.515.516.214.7
6, CL0.112.915.211.90.27.58.96.5
7, DCV−66.4−55.8−58.9−60.7−66.3−57.9−61.2−62.6
8, DCV−29.1−28.5−32.8−32.6−45.8−44.0−48.1−48.3
9, DCV−62.6−53.4−56.6−58.1−45.8−44.0−48.1−48.3
10, DCV−53.0−43.0−43.9−47.3−53.0−45.7−46.9−49.8
11, DCV−18.3−18.1−20.7−21.7−33.8−33.0−35.2−36.8
12, DCV−49.4−40.7−41.8−44.9−49.4−43.6−45.0−47.6
Disclaimer/Publisher’s Note: The statements, opinions and data contained in all publications are solely those of the individual author(s) and contributor(s) and not of MDPI and/or the editor(s). MDPI and/or the editor(s) disclaim responsibility for any injury to people or property resulting from any ideas, methods, instructions or products referred to in the content.