1. Introduction
In the marine industry, energy efficiency plays a critical role in mitigating manufacturing and operating expenses, as well as environmental impact. Today’s shipbuilders and operators need to completely rethink the ship design, manufacturing, and operation process to meet the demands of cost-effectiveness and global competition.
The International Maritime Organization (IMO) enacted the Energy Efficiency Design Index (EEDI) [
1] for new ship design and, more recently, the Carbon Intensity Indicator (CII) [
2] for ships in operation. Energy efficiency is a key factor in the marine industry in reducing manufacturing and operational costs as well as the impact on the environment. In the face of global competition and cost-effectiveness concerns, shipbuilders and operators today require a major overhaul in the entire ship design, manufacturing, and operation process to achieve these goals [
3].
The changes to MARPOL Annex VI [
2] came into effect on 1 November 2022, paving the way for implementing the CII, starting from 1 January 2023. This new regulatory framework aims to restrict and decrease the operational carbon intensity of certain types of vessels while encouraging operators to prioritise fuel efficiency.
Regulation 26 of the revised Annex VI strengthens the obligations that a vessel’s Ship Energy Efficiency Management Plan (SEEMP) must meet. A new section, called “Part III”, was introduced to cover the calculation and execution of the Annual Operational CII.
Regulation 28 of the revised Convention outlines the application and requirements of the CII for specific vessel types with a gross tonnage (GT) of 5000 and above. This regulation mandates the calculation of a Required Annual Operational CII, which will serve as the baseline for determining the Operational Carbon Intensity Rating. Each ship will receive an annual rating, represented by one of five grades (A, B, C, D, or E), based on their Attained Annual Operational CII. These grades indicate varying performance levels, ranging from major superior to minor superior, moderate, minor inferior, and inferior. The guidelines for CII estimation are included in the Resolution of MEPC [
4,
5,
6,
7].
After performing the procedure for assessing CII, the ship receives a Statement of Compliance (SoC). Ships consistently rated as D for three consecutive years or have received a single E rating must create a Corrective Action Plan to reach the Required Annual Operational CII, the midpoint of a C rating.
After the MEPC 81 session of the International Maritime Organization (IMO) (18 to 22 March 2024), the possible amendments in 2025 could consist of the following [
8]: the adjustment of CII reduction demands from 2026 to 2030 to align them with the updated objectives of the GHG Strategy; the introduction of correction factors and/or supplementary metrics; the enhancement of the enforcement mechanism and the implementation of guidelines related to Life Cycle Assessment (LCA).
The requirements for the Carbon Intensity Indicator are challenging even for research studies. Recently, an optimisation model was proposed [
9] to improve the annual full load distance of five very large crude oil carriers (VLCCs), reallocating proportions of different speed ranges and adjusting their average values. A genetic algorithm is employed to solve this model. The results show that after optimisation, there is a notable improvement of 5% to 8% in the annual full load distance while maintaining a CII rating of C or better in a specific year.
An optimisation model has been developed to ensure that all ships from a heterogeneous fleet of 40 containerships with TEU capacities ranging from 5688 to 21,237 meet the CII ratings [
10]. The main objective of this model was to maximise the fleet’s annual profit. The case study’s findings indicated that, on average, the sample ships need to reduce their speed by 7%. In some instances, the highest speed reduction required can go as high as 20.6%. It is worth mentioning that according to the study, optimising speed and routes significantly contributes to enhancing the ship’s CII.
A risk-based approach to retrofitting has been developed in [
3], where the Weibull probabilistic model to consider the uncertainties in input parameters was used. The probability of failure time and the monetary consequences were used to determine the risk. The study used the CII threshold estimation to analyse the cost efficiency of ageing container ship propulsion systems for a fleet of 107 containerships operating in the Black Sea. Considering the required significant capital investment, it was concluded that the most advantageous ship age for retrofitting is one greater than 12 years. Furthermore, considering the time required for retrofitting and the limited availability of specialised shipyards, it may be possible to postpone the ship age retrofitting even further.
According to a study examining the effects of speed reduction on carbon emissions and carbon intensity of time charter ships [
11], it was found that decreasing speed by 10%, 20%, and 30% can lead to reductions in carbon emissions by 27.1%, 48.8%, and 65.7%, respectively. These speed reductions can also decrease carbon intensity by 19%, 36%, and 51%, respectively. The investigation was conducted on four distinct types of bulk carriers, ranging from Handy size to Capsize.
Calculations comparing CII based on DWT and actual cargo carried, using data from EU MRV (
https://mrv.emsa.europa.eu/ accessed on 5 February 2024) for 2019 [
12], revealed an average difference of 30% between the CII calculated using actual cargo carried and the one computed using DWT. This difference was observed across various ship types, including bulk carriers, container ships, tankers, and general cargo ships. The effectiveness of using the DWT following the CII requirements exceeds that of using the specific cargo transported. This difference for Ro-Ro vehicle carriers was 90%. The utilisation of GT as a measurement for determining the CII of this vessel type may not be suitable, as GT may not accurately represent the cargo transportation features.
The present study analyses vehicle carriers included in the EU MRV database. The main vehicle carrier operators are primarily located in Korea and Japan, responsible for shipping vehicles produced in these countries to North America and Europe and vice versa. The number of electric vehicle (EV) shipments from China experienced a significant increase, rising from 600,000 units in 2020 to 3 million units in 2023 [
13]. This surge in export volumes has resulted in a shortage of Pure Car and Truck Carriers (PCTCs) used to transport automobiles. Because of this tight supply, freight rates for car carriers have skyrocketed, with prices for a 6500 CEU (car equivalent unit) jumping from
$16,271 in 2020 to
$115,000 in January 2024.
Meanwhile, fires and accidents have become more frequent with this type of ship in recent years. Summarising the facts shows [
14] that from 2017 to 2023, ten ship fires have been registered for vehicle carriers. According to Allianz Global Corporate & Specialty [
15], there are growing concerns that fires are caused by faults in the Li-ion batteries in electric vehicles. Various measures related to the production of electric vehicles are proposed, such as the optimal state of charge (SoC) for transportation, which should be in the range of 30% to 50%. There are also questions related to the structural features of vehicle carriers and their suitability for transporting electric vehicles.
The short and long-term behaviour of ship CII rate, with a discrete set of states, will be investigated using Markov chains, which is one specific example of the Markov process [
16,
17,
18]. The behaviour of a stochastic system state of the ship CII rate, where the start of the subsequent state depends only on the system’s immediate prior state, will be described by the Markov process. In practice, most problems involving Markov processes are expressed using Markov chains with discrete or continuous time [
19,
20,
21,
22,
23]. In this study, only Markov processes with discrete states are considered. This study established a methodology for estimating the ship CII rates and various operational parameters of vehicle carrier transition matrices using proportions data when there is a lack of available data. This methodology can serve as a foundation for risk-based models that use the CII rate as an input to determine the best ship energy efficiency management strategy. The methodology used in the present study requires limited data, and a wide range of conditions and problems could be addressed.
The objective of the study is to develop a Markov chain formulation for evaluating the CO2 produced by ships in operation and their evolution over time, contingent on the applicable laws. During the service life, any potential deep repairs, retrofits, or improvements to the ship’s propulsion system or route operational characteristics are not taken into consideration. Based on ship operations and the CO2 history of the carbon intensity indicator rates for A, B, C, D, and E, the Markov transition matrix is defined. The survey data’s transition between various CII rate states is utilized to calculate the likelihood that the examined ships will also transition between various CII grades. Furthermore, the transition matrices can be used as input into risk-based models to determine the optimal ship energy efficiency management plan.
2. CII Estimation
According to [
4], the most simple form for annual operational CII rates of individual ships is calculated as follows:
where:
is the total mass of
emissions,
is the transport work,
is the fuel oil type,
is the total mass (in grams) of consumed fuel oil of type
,
is the fuel oil mass to
mass conversion factor for fuel oil type
,
is the ship’s capacity (for vehicle carriers, gross tonnage (GT) should be used), and
is the total distance travelled (in nautical miles, nm).
In this study, instead of detailed calculations of emissions, the total quantity included in the EU MRV database is used.
According to [
5], for a vehicle carrier, the reference line is formulated as follows:
where
The required annual operational CII rate, according to [
6], is:
where
Z is the general reference to the reduction factors for 2023–2030 relative to 2019. The reduction factor (
Z%) for 2023–2026 is 5%, 7%, 9%, and 11%, respectively.
Z factors for the years 2027–2030 will be further strengthened and developed considering the review of the short-term measures.
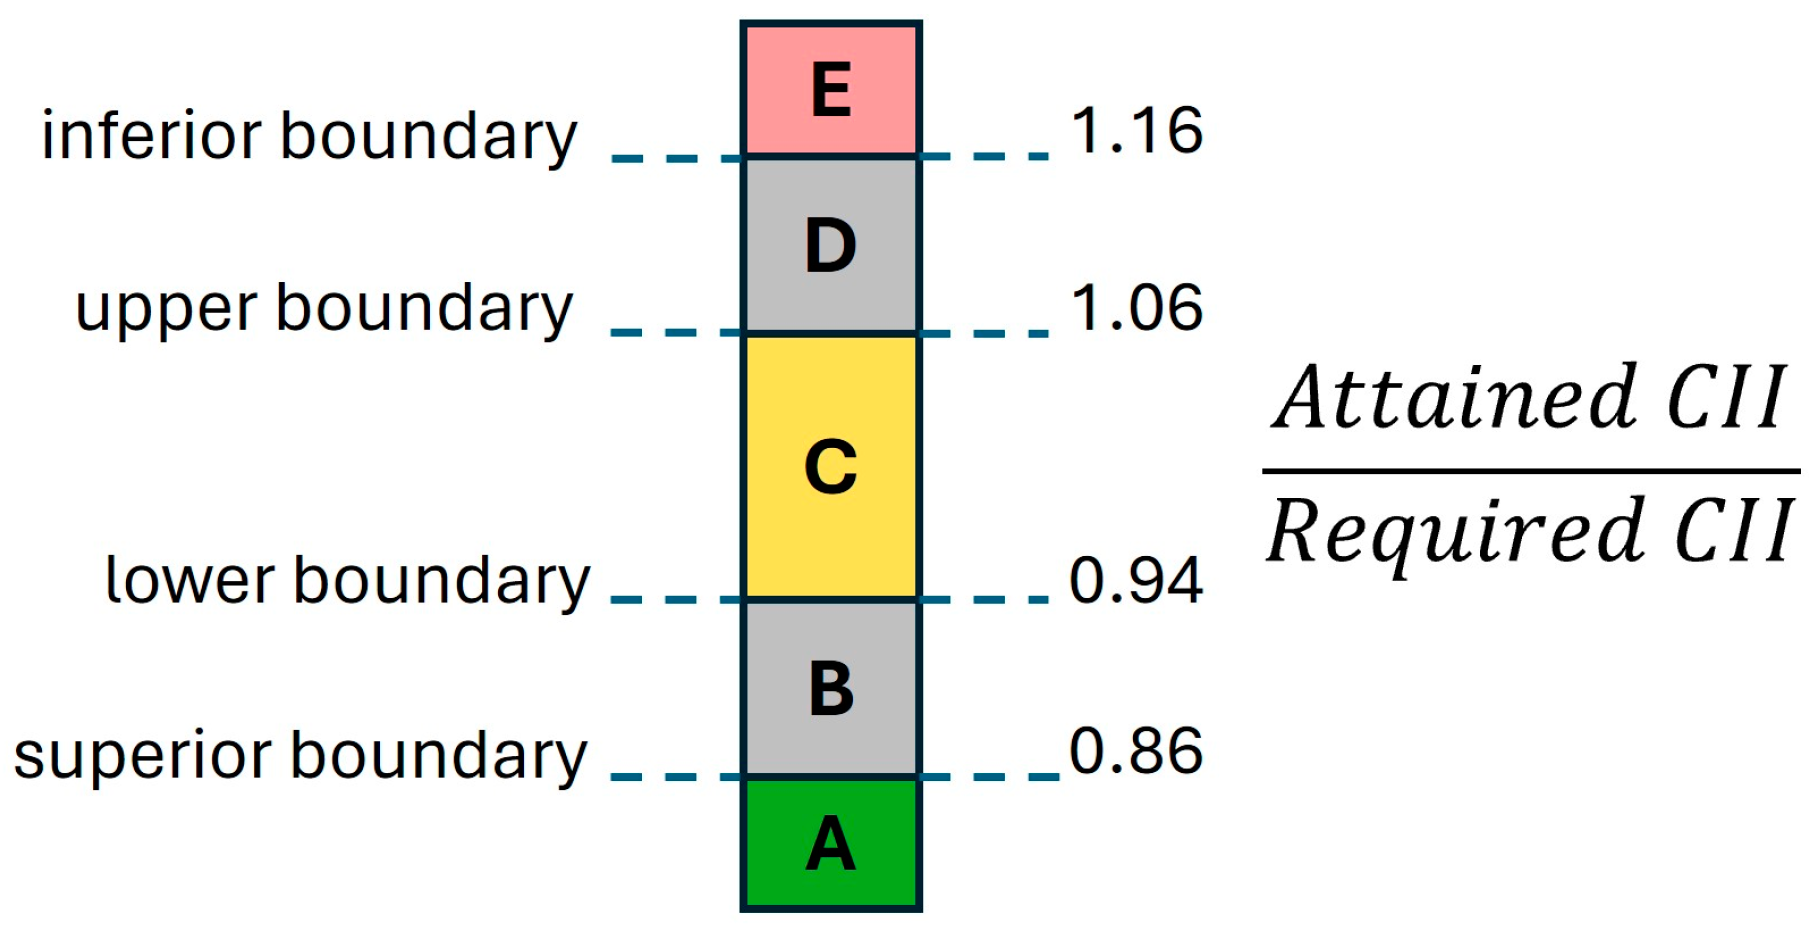
Finally, the corresponding rating is obtained depending on the relation between the attained and required CII is shown in
Figure 1.
The standard calculation of CII does not include variation in the actual operational conditions. The variation in the actual operational conditions is an important issue that was considered as an example in [
24], and it is not a part of the objectives here.
However, the primary objective of EU MRV (Monitoring, Reporting, Verification) emissions collection and reporting is to evaluate the environmental consequences of maritime transportation and to establish a foundation for determining the carbon taxes via the EU ETS and Fuel EU Maritime regulations. The EU MRV applies to vessels with a gross tonnage exceeding 5000 on voyages related to the European Union. An independent and accredited verifier (such as DNV, for example) verifies a vessel’s Monitoring Plan (MP). The EU MRV regulation controls the predefined content of the MP, which includes a description of the chosen method to monitor and report emissions. The Emissions Report provides data on fuel consumption, distance covered, and cargo transported during voyages to, between, and from ports in the European Union (EU).
The procedure is similar for the respective databases organized by IMO Data Collection System (DCS) and UK-MRV.
The EU ETS (Emission Trading System) is an integral part of the EU MRV and UK MRV initiatives, establishing a comprehensive decarbonization framework. In addition to their vessels’ Emission Reports, companies will also be obliged to submit a Company Emission Report under the EU ETS, which provides an overview of their entire fleet’s performance for verification.
The CII trend is accurate enough for the study. However, any installed onboard measurement system may enhance the reported information.
3. Long-Run Prediction of CII Transition Using Markov Chain
To model the CII rate transition, the Markov [
16] chain can be employed. The information required to specify the chain as a set of states
, with a probability mass function for the start configuration and a conditional probability mass function.
The probability mass function can be presented as follows:
which denotes the unconditional probability of being in state
at the time
or being in state
after
transition. A particular case exists for
where
denotes the probability of starting in the state
. If there are
states
, a
-dimensional initial probability vector
can be constructed as follows:
The conditional probability mass function is defined as:
where
represents the probability of being in state
at the time
conditional on being in the state
j at the time
. If the chain is stationary, the notation is
. For
, it is a one-step transition probability.
The transition matrices provide the evolution based on a Markov transition probability model and are used to simulate the transition of the ship fleet CII rate. All ship CII estimates fall into one of five discrete CII rate ranges or states, which form the basis of the Markov transition probability model. The matrix of probabilities indicates the possibility of the ship’s CII rate remaining constant or shifting to any of the other categories over a specific time horizon and can be used to build a transition matrix in the case of discrete categories into which all estimated CII can be arranged. Every entry in the matrix, , displays the likelihood that the CII rate will equal at the time and j at the time .
If there are
states in the chain, there will be
one-step transition probability. For the Markov chain with state space
, the matrix is presented as:
A simple Markov structure on the transition probabilities is applied, which leads to the first stationary Markov processes. When a ship’s CII rate is categorised as a ship propulsion system and operational profile degrading, it cannot be reclassified as an acceptable category if retrofitting is not performed or the operational profile is improved to restore the CII rate to an acceptable level.
If the CII rate changes gradually and slowly, the first-order Markov process assumption for CII rate transitions can be limited. In such cases, using a longer time horizon or a higher-order Markov process might be more appropriate, which will significantly increase the complexity and the amount of data needed and might not be acceptable with a restricted time series. In general, the latent CII rate could be modelled with hidden Markov chains. Unfortunately, for this approach, massive amounts of data are also required. The elements of the transition matrix have the following properties:
Estimating the transition matrix is a straight procedure when the states for each transition are defined. The likelihood of a number of ships changing their CII rating can be determined, for instance, if their rates are known at the start of one year and again at the beginning of the following year. The likelihood that ships
will have a specific CII rate
at the period
and will have a CII rate
in the period
can be estimated as a ratio of the total number of ships that started at year
to the number of ships that concluded at year
with the same CII rate. If
represents the collection of ships in the state
in the period
and the state
in the period
, the transition matrix components in the case of a number of ships should also satisfy the following conditions when limited information about the transition between different states exist:
and
can be estimated as:
The probability of transition of a number of ships with a CII rate that began in the state and finished in the state , divided by the total number of ships that began in the state , represents the probability of transitioning from any given state . The estimate provided in Equation (16) is the maximum likelihood that is consistent, but it is biased, with the bias tending toward zero as the sample size rises.
The chain, after
transitions, makes it possible to compute the accumulated probability for all transition segments terminated after
transitions. The information of the status after
transition steps is stored in the unconditional probability vector:
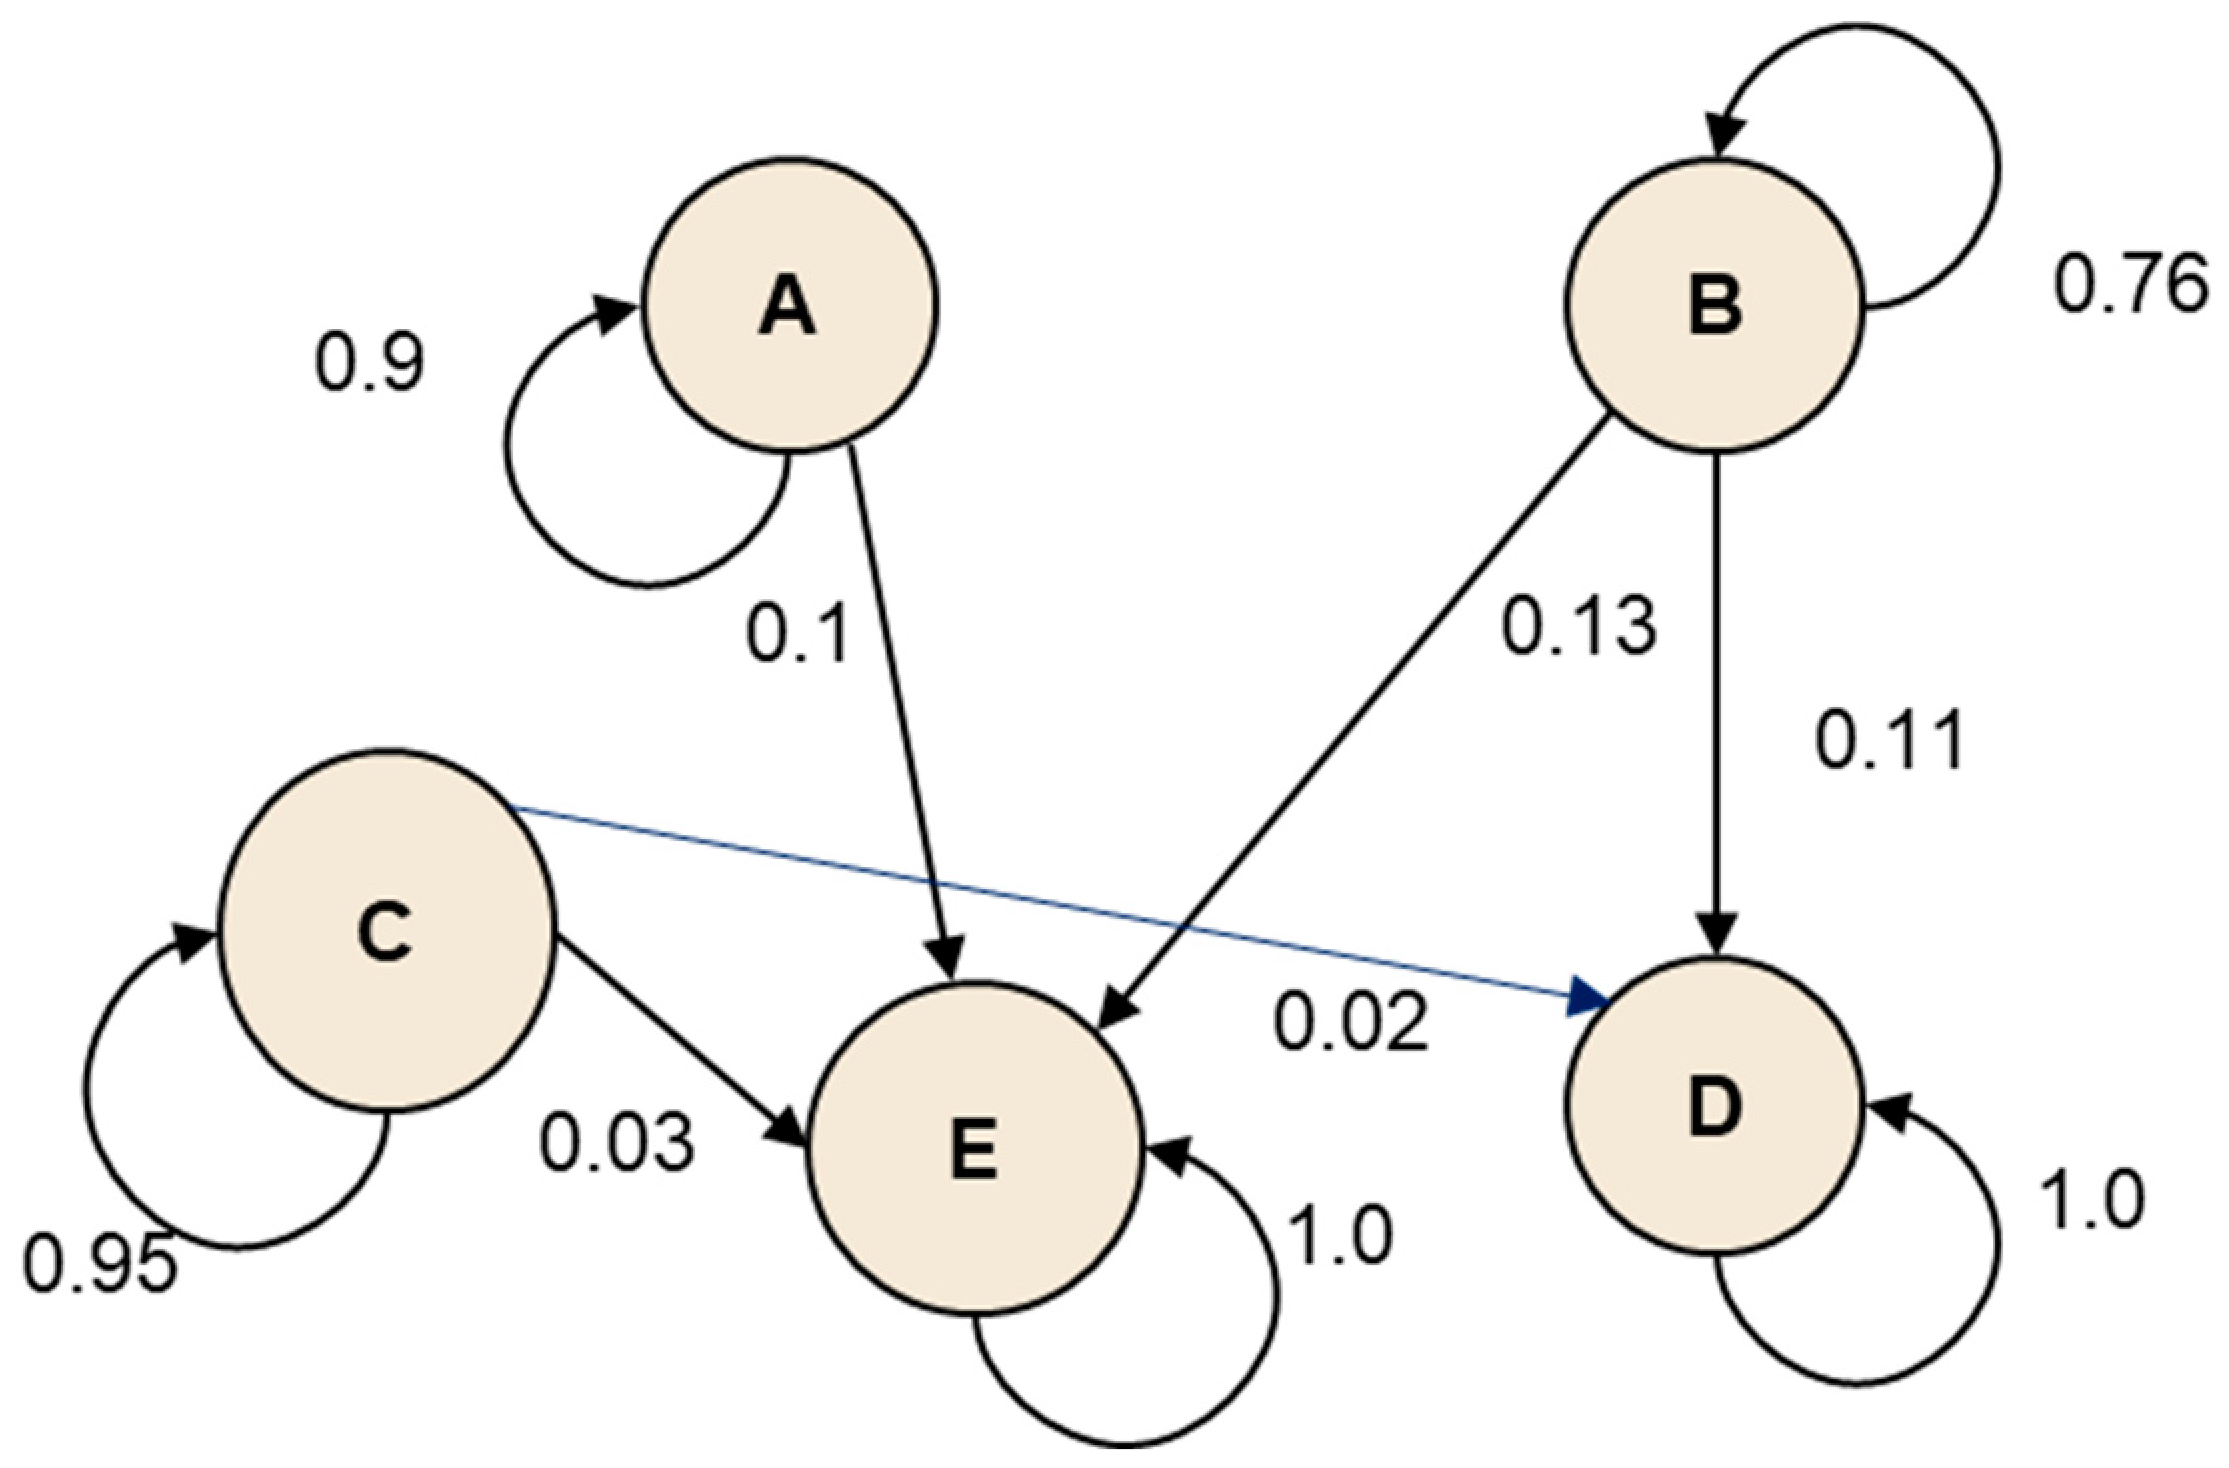
A convenient way of representing the Markov chain for CII transitions is by its transition diagram, which consists of a number of states representing the events (A, B, C, D, and E—CII rates) with a probability representing the probability of making a transition from state to state .
The directed graph, also known as the transition matrix, is represented in
Figure 2. It consists of a collection of directed edges (arcs) connecting the vertices (nodes) in the set. The connections between nodes are depicted by the arcs.
To ensure that the calculated probabilities accurately represent the average likelihoods and are not too sensitive to the choice of sample period or operation region, it is appropriate for the CII rate transition matrices to be generated using data from a complete service period or ocean region of operation for different operational characteristics. On the other hand, there can be situations in which it makes sense to condition the transition matrices at a specific time of operation criterion. The conditions of the data collected would affect the conditional outcomes and the likelihood of migrations.
4. Transition Analysis
Taking into consideration that the CII rate legislation will gradually change, starting from 2023 and continuing to 2026, it will be interesting to analyse how this will reflect on CII identification of analysed ships during the consecutive years.
The information for the vehicle carriers analysed has been extracted from the EU MRV database, while some ship characteristics were extracted from the Vessel Finder website (
https://www.vesselfinder.com/ accessed on 30 February 2024). The database contains complete data for 449 vehicle carriers. The sailing distance is calculated using the data for the Total fuel consumption (m tonnes) and Annual average Fuel consumption per distance (kg/nm).
It must be pointed out that the estimated CII will tend to lag the actual evolution because the data depend on registered information rather than real-time measurements. This is especially true under conditions of a declining economy, where fuel prices and energy efficiency are essential. Along with regulatory leniency, regulatory pressure also applies to CII rate classification. The data are collected and CII are computed following a standardised technique, based on the best available information for the ship traffic, despite these drawbacks.
The challenge of sample selection can occur when applying the CII rate approach to a specific dataset. A time-invariant transition probability model would be unacceptable if significant CII rate changes are noticed during deeper ship repair or retrofitting. In this case, a time-varying Markov approach for estimating the transition matrices can be used. However, the method requires a significant amount of additional data to be put into practice. The present study aims to provide a methodology that can be applied when data are scarce.
The estimation of the transition matrix may also encounter issues due to a limited time horizon for the data sample. It is frequently challenging to obtain lengthy periods of consistently derived data, as many regulatory bodies have recently started collecting trustworthy data on ship CII rates. Short-time horizons are a problem, but not as severe as structural change because they only impact how findings are interpreted, not the viability of the underlying model.
One way to assess the CII quality transition matrices is to use data on the ability of ships to meet energy efficiency criteria. The CII of each ship can be calculated as reported in
Section 3. Depending on the estimated CII, ships are classified into five groups from A to E. Then, by estimating the number of ships in each category in a specific year, the share of each CII category in the total number of ships can be calculated (see
Figure 3). Using these relationships, the probabilities of the transition matrix can be estimated.
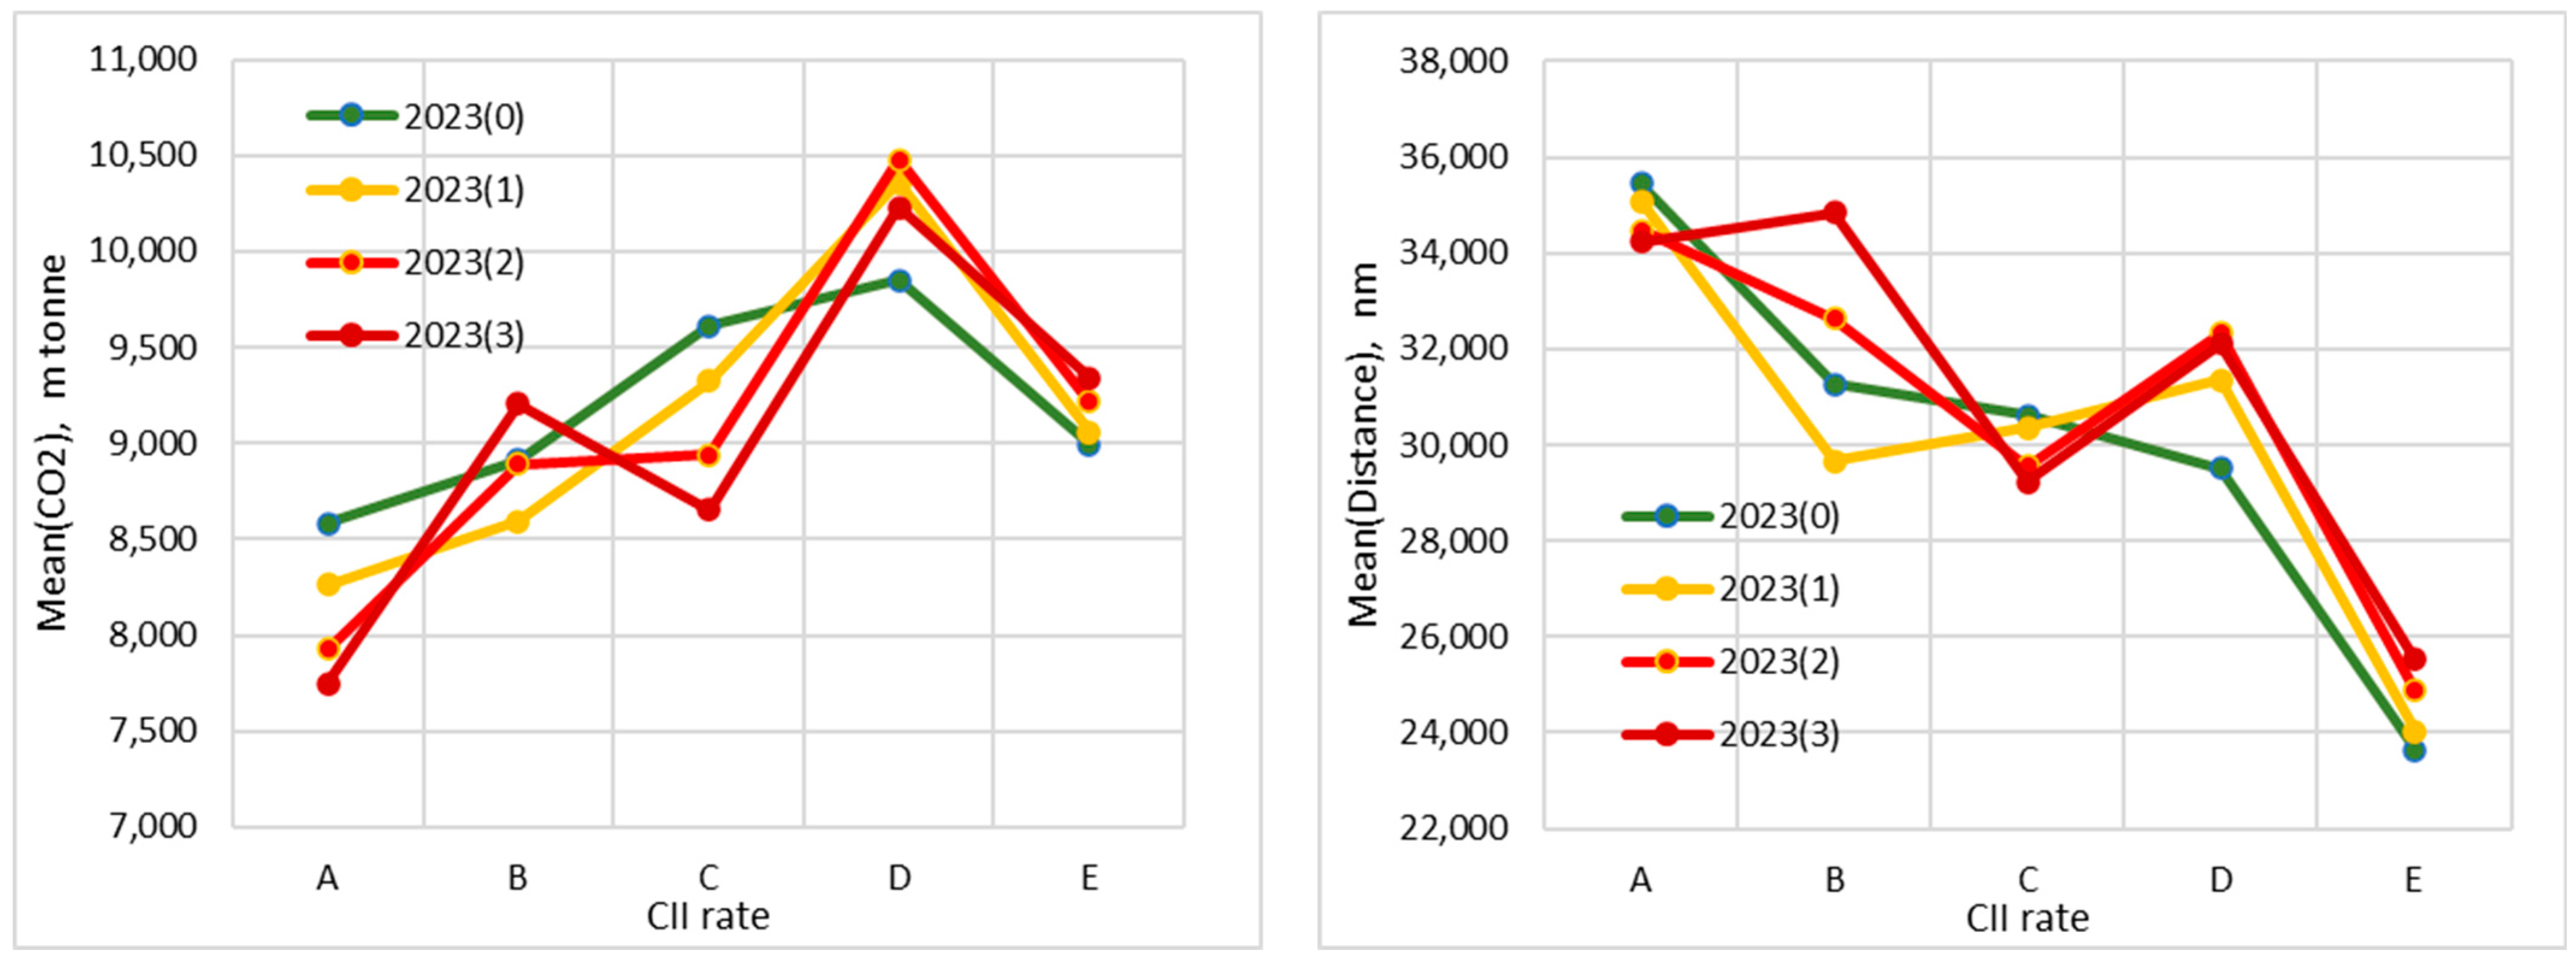
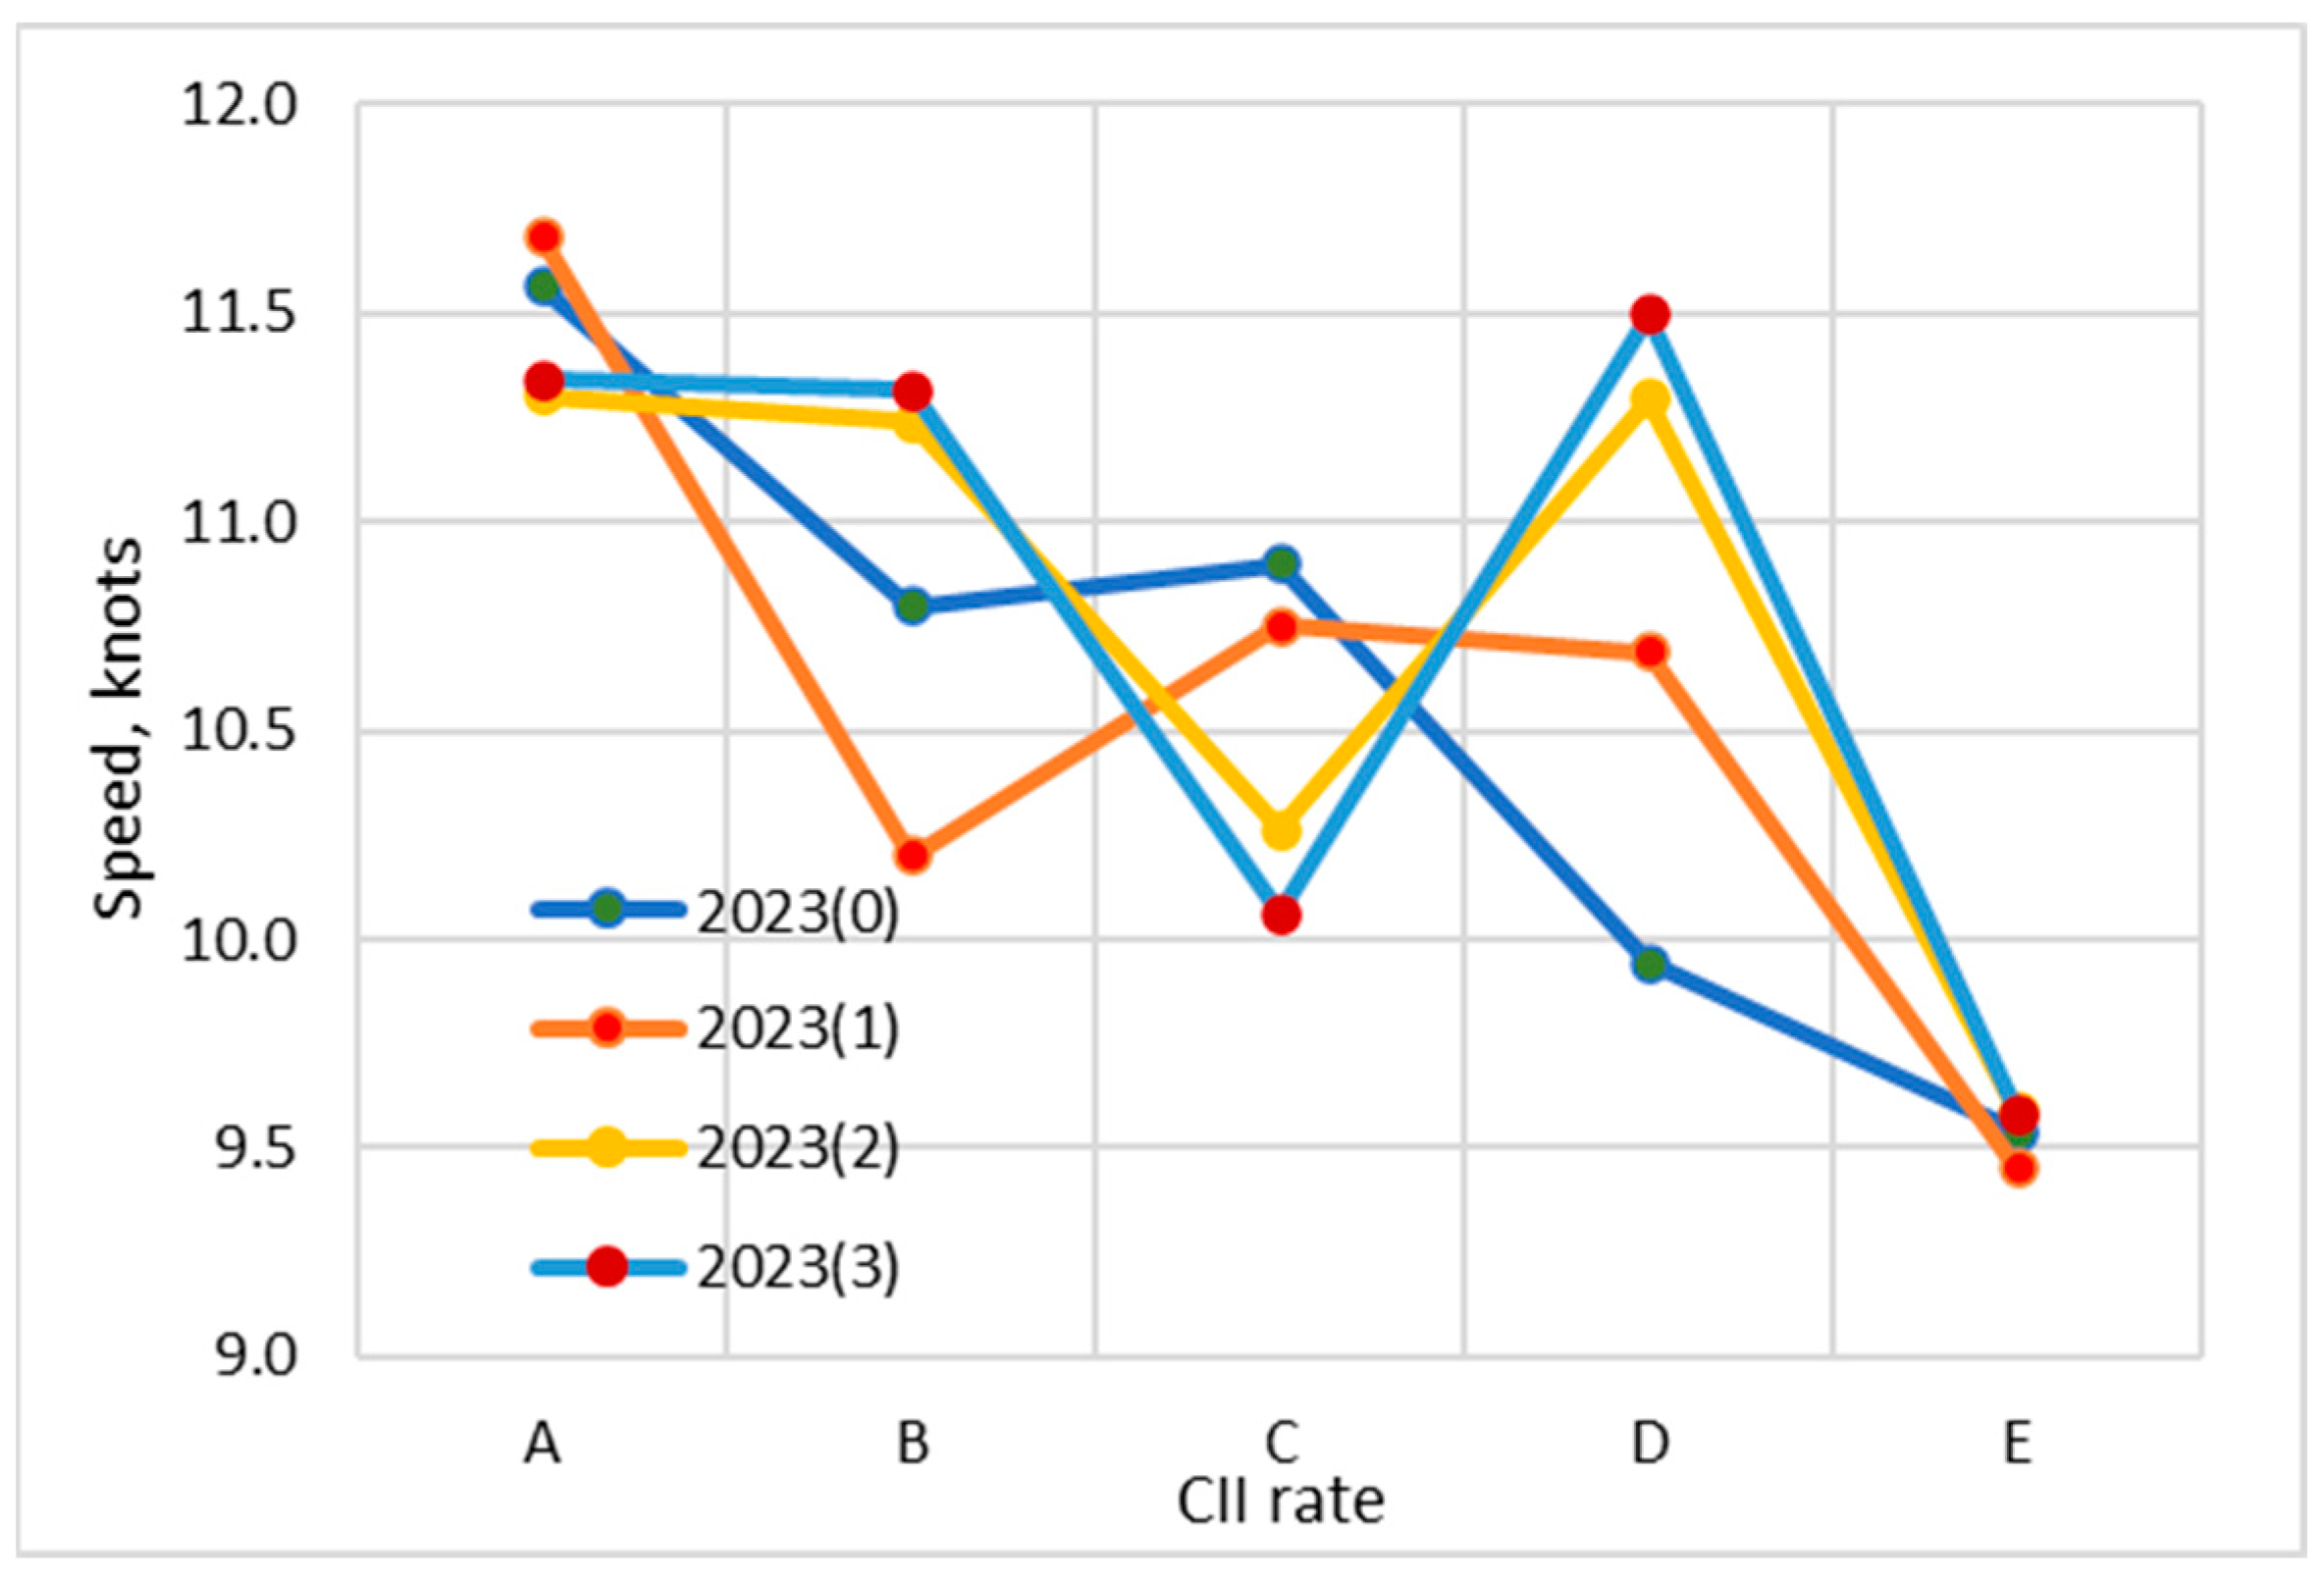
The
(m tonne), distance in operation (nm), number of ships, ship age (year), and average travel speed for the five CII rates (A, B, C, D, and E) are computed according to the current legislation for the year 2023, imposing the implementation of the progressive changing the constraints of the five CII classes defined as 2023(0), 2023(1), 2023(2), and 2023(3) and shown in
Figure 4,
Figure 5 and
Figure 6. However, due to higher uncertainties the voyage speed
is calculated as:
where
is the estimated upper 95% confidence limit travel distance for one year, assuming that, on average, the ships are operating 75% of the time underway, 20% of the time in the port, 4% at anchor, and 1% idle time.
As we can see, the trends all become more stable following a structural break close to the series’ middle around the C rate, according to statistical analyses. It must be pointed out that the C-rate is seen as one that is the upper limit of the CII rate. Above the C-rate, some measures to reduce it need to be taken.
The results of the present analysis can be confirmed by UNCTAD [
25], where it can be noticed that the percentage of the vehicle carriers with carbon intensity rates A, B, and C for 2022 compared to 2026 has a reduction of 59%. The same output can be seen from
Figure 5 (left) for the number of ships when employing the stipulated rules for the respective years of CII rates, for example, 153 ships Class C in 2023 and 95 ships Class C in 2026 leads to a reduction of 63%.
The analysis covers five CII range conditional to the fleet operational characteristics without any deep repairs and retrofitting for a year service period.
Table 1 shows the statistical descriptors of
.
The survey data have been used to generate the transition matrix for the probability of changing CII rate circumstances annually while analysing switching between distinct CII rate scenarios accounting for the legislative police. The shares
of the A cases are 11%, B case is 8%, C case is 34%, D case is 23%, and E case is 24% in the first year. For each CII instance, estimates are made for the projected shares in the upcoming years, and the long-term forecast is based on the data from the first year. The transition matrix
represents the number of ships (total of 449) located in different CII rates. Hence, after one year has elapsed, the probability of the state of the system is defined as:
After
years, the system’s state has elapsed, and the probability of the state of the system is defined as:
The results of how the number of ships,
, and travelled distance as a function of time, conditional on the CII annual legislation change, are shown in
Figure 7,
Figure 8,
Figure 9 and
Figure 10, and shows the normalised
and the travelled distances.
Figure 7,
Figure 8 and
Figure 9 show the strong correlation between
, the number of ships with a given CII rate, and the distance travelled over time, subjected to the legislation changes about the ship’s energy efficiency. The results show that the 2023(3) police are significantly more aggressive, which causes a large number of ships to move toward the upper bound of CII rates and shorter travel distances.
Cumulative charts displaying the number of ships, , and travelled distances indicate the precise quantity of each state’s transiting to a different CII rate at any given time (or model cycle). Furthermore, the disparity between various legislation policies is demonstrated by those parameters’ progression caused by ageing without introducing any enhancing measures.
The model predicts that after ten cycles (years), the generated by ships in operation will be distributed between A, B, C, D, and E categories, in the absence of enhancement measures, as follows: for 2023(1) at 4%, 1%, 18%, 30%, and 47%, for 2023(2) at 0%, 1%, 4%, 35%, and 60%, and for 2023(3) at 0%, 1%, 0%, 35%, and 64%, respectively, resulting into the fact that, following the legislation, police 2023(1) 77%, 2023(2) 95%, and for 2023(3) 99% of analysed ships will not comply with the requirements. Additionally, there will be a reduction in the travelled distances in the case of 2023(1) by 4%, 2023(2) by 6.4%, and 2023(3) by about 6.9%, which also leads to reduced voyage speed.
Such graphical presentations of the Markov model can be useful for validating the model with the legislation maker experts, as well as conducting an economic analysis. The analysts may want to consider presenting these results as a means of making the modelling process of CII progression predictions of the model explicit, before going on to consider the economic predictions of the model and establishing the most appropriate ship energy efficiency management plan.
Furthermore,
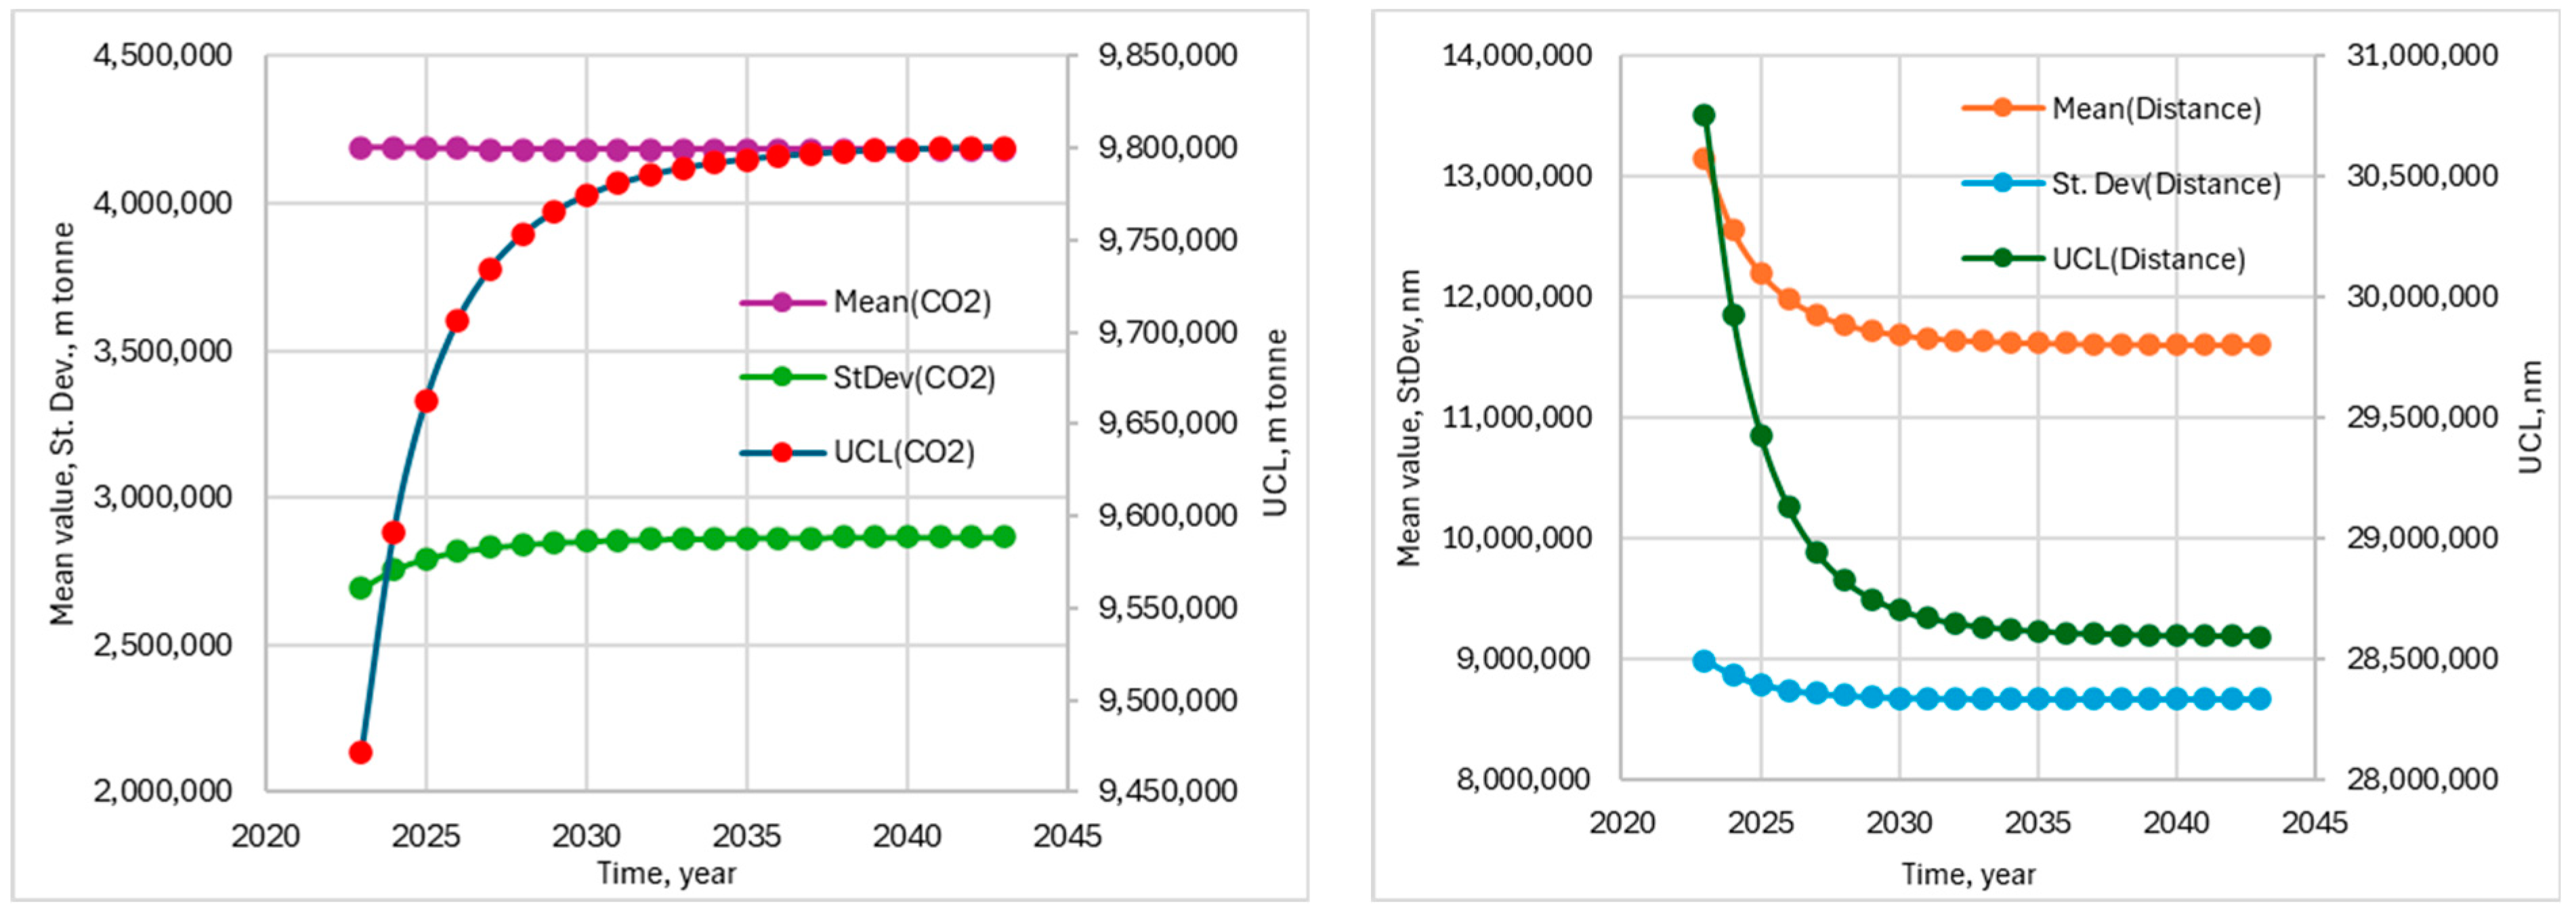
Figure 10 shows how the Mean value, St. Dev, and UCL progress of the total
and distance, conditional to 2023(3) CII annual rules with the ship’s ageing as the distances travelled decrease and
increases at the same time, all without any deeper repairs, retrofitting to the propulsion system, or routing optimization to improve operational performance.
The question about how emissions might change with the introduction of new ships and the retirement of older ones should be clear. However, the issues of renovating the existing fleet, retrofitting, and any other action that may improve the CII index of ships in operation are outside of the objective of this study.
