Article

Evaluating Electrification of Fossil-Fuel-Fired Boilers for Decarbonization Using Discrete-Event Simulation

1
Department of Industrial and Management Systems Engineering, West Virginia University, Morgantown, WV 26505, USA
2
Department of Mechanical, Materials and Aerospace Engineering, West Virginia University, Morgantown, WV 26505, USA
*
Author to whom correspondence should be addressed.
Energies 2024, 17(12), 2882; https://doi.org/10.3390/en17122882
Submission received: 15 April 2024 / Revised: 5 June 2024 / Accepted: 7 June 2024 / Published: 12 June 2024
(This article belongs to the Collection Energy Transition Towards Carbon Neutrality)

Abstract

:
Decarbonizing fossil-fuel usage is crucial in mitigating the impacts of climate change. The burning of fossil fuels in boilers during industrial process heating is one of the major sources of CO2 in the industry. Electrification is a promising solution for decarbonizing these boilers, as it enables renewable energy sources to generate electricity, which can then be used to power the electric boilers. This research develops a user-driven simulation model with realistic data and potential temperature data for a location to estimate boilers’ current energy and fuel usage and determine the equivalent electrical boiler capacity and energy usage. A simulation model is developed using the Visual Basic Application (VBA)® and takes factors such as current boiler capacity, steam temperature and pressure, condensate, makeup water, blowdown, surface area, and flue gas information as input. Random numbers generate the hourly temperature variation for a year for discrete-event Monte Carlo Simulation. The simulation generates the hourly firing factor, energy usage, fuel usage, and CO2 emissions of boilers for a whole year, and the result compares fossil-fuel and electrical boilers. The simulated data are validated using real system data, and sensitivity analysis of the model is performed by varying the input data.

1. Introduction to Decarbonization

The capacity of humans to convert energy into light, motion, and heat increased cultural as well as economic advancements and established energy as the global currency [1]. However, worldwide CO2 emissions continued to rise and reached approximately 9.14 billion tonnes in 2018 due to the combustion of fossil fuels [2]. The combustion of fossil fuels is the primary source of Greenhouse Gas (GHG) emissions. CO2 represents the majority of these emissions (76%). Methane (16%), nitrous oxide (6%), and fluorinated gases (2%) are responsible for the remaining quarter of the greenhouse gas effect [3]. Industrial activity in 2021 was directly responsible for emitting 9.4 Gt of CO2, accounting for a quarter of global emissions (not including indirect emissions from electricity used for industrial processes) [4]. The United States emitted 6.7 GtCO2-eq in 2018, distributed between transportation (28%), electricity (27%), industry (22%), commercial and residential (12%), and agriculture (10%) [5]. Drastic measures are called for to reduce Greenhouse Gas (GHG) emissions in order to mitigate the possibility of dangerous climate change. Between 2010 and 2019, the GHG emission growth rate of 1.3% per year was lower than the previous decade of 2.1% per year. However, in 2019 GHG emissions increased to 59 GtCO2-eq, which is an 8.9 GtCO2-eq increase from 2000 to 2009 and a 6.5 GtCO2-eq increase from 2010 to 2019. Nationally Determined Contributions (NDCs) are at the heart of the Paris Agreement [6] and include each country’s efforts to minimize national emissions and adapt to the impacts of climate change. Several reduction scenarios have been examined for possible pathways to reduce emissions. In a study on a pathway to reduce US greenhouse gases by 80% by 2030, 42% of the emissions reductions came from energy efficiency, 31% from a cleaner electric grid, and 23% from end-use electrification [7]. Nadel [8], in his study, addressed some of the opportunities, barriers, and policies for electrification in all of the transportation, buildings, and industrial sectors. The industry is considered one of the ‘harder to decarbonize’ sectors compared to the buildings and power sector because of the unique challenges involved. As per Zuberi et al. [9], the technical potential for reducing energy and CO2 emissions by 2050 is estimated to be 595 PJ and 200 MtCO2 per year, and electrifying electrical boilers has a prominent potential to decarbonize the country. Similarly, Schoeneberger et al. [10] found that, with a high renewables electric grid, GHG emissions could be decreased by 19 MMmtCO2e and 7 MMmtCO2e in the future. Figure 1 depicts the CO2 emissions from energy consumption by different source and sector in the USA, 2021 [11].
Brown et al. [12] proposed viability criteria for the transition to renewable energy-based electricity systems. They stress the significance of available resources and tested technologies. Loftus et al. [13] evaluated the potential contributions of each primary energy source to decarbonization by reviewing the existing decarbonization scenarios.

1.1. Decarbonization of Industrial Boiler Systems

It is generally fossil fuel that is burned in furnaces directly to heat the processes or materials or indirectly by generating steam from boilers, which then transfer the heat energy to the processes or materials. The steam is then used to provide process heat, space heat, mechanical power, and possibly electricity. Boilers consume roughly one-third of the fuel used for process heating in manufacturing [14]. Major energy-intensive industries allocate a significant part of their primary fuel consumption to steam generation: food processing (57%), paper and pulp (81%), petroleum refining (23%), chemicals (42%), and primary metals (10%) [15]. A large share of boiler-fuel use is from natural gas (34%) and coal (11%), but a majority (54%) comes from other fuels, including biomass and byproduct fuels, such as black liquor, still gas, and waste gas [14,16,17,18,19]. Switching from fossil-fuel-based boilers to electric boilers can provide a straightforward and substantial opportunity to reduce GHG emissions.
Several countries believe that decarbonization of electricity generation and electrification of energy end-uses are essential for achieving net-zero emissions by 2050 or before. The USA has set an ambitious goal to reach 100% carbon-free electricity by 2035 [20]. The end-use electrification has largely focused on transportation and building sectors so far [21,22,23], and limited opportunities have been investigated for the industrial sector. End-user heat demand typically contributes to two-thirds of the total energy required in the manufacturing industry [24].
Existing mature electrical boiler technologies can produce superheated steam with temperatures and pressures higher than 660 °F and 1015 psi, respectively. Electric boilers can have capacities of up to >70 Mwe. According to Madeddu et al. [25], electric boilers are 95–99% efficient, with very little radiation loss from the exposed surfaces. However, due to a number of technological and economic factors, such as the combustion of free or inexpensive byproduct fuels in some industries for the generation of steam, electric boilers only account for a small portion of the market for heat and steam generation in the US industry [26].
Bühler et al. [27], Wei et al. [28], Heinen et al. [29], and Wiertzema et al. [30] are among the few recent studies that pointed out that to achieve long-term decarbonization, it is essential to electrify industrial process heating, including the boiler system, combined with the transition to a renewable electrical grid. Lamon et al. [31] presented a thorough analysis of boiler retrofitting and decarbonization of existing buildings. Steinberg et al. [32] examined the scope of lowering CO2 emissions by electrifying end-use processes and decarbonizing the electricity sector throughout the US economy. They evaluated a few electrification technologies, such as electric boilers, for the industry sector and assumed that a high-electrification scenario would result in a 100% diffusion of electric boilers by 2050. Their findings indicate that the simultaneous decarbonization of the power production sector and the adoption of electrified technologies in the construction, transportation, and industrial sectors could reduce CO2 emissions by up to 68% below the baseline level in 2050. Jia et al. [33] developed a new adsorbent that shows significant progress in the removal of mercury from industrial boiler emissions. Likewise, Shiro et al. [34] found that mixing hydrogen, up to 20%, with natural gas in the premixed boilers could substantially reduce CO2 emissions.
The efficiency of a boiler is the ratio of the net amount of heat being absorbed by the generated steam to the net amount of heat supplied to the boiler. It is necassary to understand the operation and components of a boiler before identifying any opportunities to improve efficiency. Any improvements will result in lesser fossil-fuel usage, thus ultimately contributing towards decarbonization little by little. The sources of heat loss in a boiler system vary depending on the type of boiler, type of fuel used, operating conditions, level of insulation, and blowdown amount. Boiler energy efficiency ranges from 20% to 92% depending on the fuel type used and the application of the boiler [35]. The major heat loss occurs due to high air-to-fuel ratios, under-rated steam generation capacity, surface thermal losses, and high flue gas temperatures [36].
The direct efficiency method calculates boiler efficiency by using the basic efficiency formula,
η = E n e r g y   O u t p u t E n e r g y   I n p u t × 100 % .
This equation can be rewritten as
η = m · S × h S h M W m · F × H H V × 100 % ,
where
η = Typical Efficiency of Fossil-Fuel Boiler (no unit)
S = Amount of Steam Flow (lb/h) (1 lb/h = 0.000126 kg/s)
hS = Enthalpy of Steam at Given Temperature and Pressure (Btu/lb) (1 Btu/lb = 2326 J/kg)
hMW = Enthalpy of Feedwater (Btu/lb)
F = Amount of Fuel (lb/h)
HHV = Higher Heating Value of Fuel (Btu/lb)
The indirect efficiency of a boiler is calculated by identifying the individual losses taking place in a boiler system and then subtracting their sum from 100%. This method includes separate measurements of all the individual losses, and their magnitude needs to be calculated to determine the boiler’s overall efficiency. The calculated losses include stack losses, boiler surface, and blowdown losses. [37].
η = 100 % η s t a c k η b l o w d o w n η s h e l l η m i s c .
Addressing the losses mentioned above will increase boiler efficiency. Therefore, indirect efficiency measurement is preferable as it helps to identify individual losses. In addition, it can indicate which losses are contributing more rather unusually, and improving them will increase the boiler’s operating efficiency.
Replacing fossil-fuel-fired boilers with electric boilers is the simple answer to reducing GHG emissions in industrial plants. Few studies have documented the benefits of industrial electrification and listed boilers as a significant opportunity [38,39,40]. Electric boilers have high efficiency (99%), fast ramp-up time, and low downtime [41] and require no onsite air pollution abatement or combustion accessories such as fuel pipelines and exhaust systems. In addition, electric boilers have other non-energy-related benefits, such as lower maintenance and administrative cost compared to fossil-fuel-fired boilers and smaller physical footprints, but the high operating costs due to the higher cost of electricity relative to equivalent natural gas and other fuels make their application economically infeasible [38]. However, operating them by utilizing the low-cost power supply from renewables can increase the feasibility [39], and electric boilers combined with the electric grid from renewables can eliminate GHG emissions.
Modeling a system is the best way to understand how the system will respond to changes. However, modeling a boiler system and its operation can be difficult as steam heat energy usage significantly depends on the operational need, control system, surrounding environment, and weather. Several methods and software have been employed to model and simulate boiler operation and usage.
Laubscher and Rousseau [41] evaluated the thermal performance of the water wall evaporator and platen and final stage superheaters of a subcritical pulverized coal-fired boiler using a Computational Fluid Dynamics (CFD) modeling methodology. The effect of internal steam maldistribution on metal temperatures at low loads was investigated using the developed methodology. CFD simulation has been applied in other studies [42]. Badur et al. [43] studied the lifetime of pulverized-coal boilers’ water walls. In their study, the authors developed a mathematical model to prevent the water walls from high degradation and reduce unburned carbon in bottom ash. In paper [44], the authors presented a developed mathematical model for monitoring air distribution in a large-scale coal-fired boiler. Madejski et al. [45] developed a model to monitor superheater operating conditions in a Circulating Fluidized Bed (CFD) boiler at steady and transient states. Zima [46] presented a one-dimensional numerical model simulating changes in the supercritical boiler operating conditions. The model is based on energy, mass, and momentum balance equations solved using an implicit difference scheme. Taler et al. [47] developed an online model that enables simulations of a boiler operation. Depending on the load on the power unit, the model can produce sliding curves for the steam parameters at the turbine inlet. It is possible to replicate start from cold, warm, and hot states in the model. Chen et al. [48] introduced a computational fluid dynamics coal combustion model combined with a one-dimensional hydrodynamic model for steam flowing within the superheater.
Camaraza-Medina et al. [49] presented a method for the calculation of the gross thermal performance of steam boilers. The algorithm that is suggested in the publication is based on both the direct and indirect method of the Russian standard GOST. It enables the calculation of the energy balance for a steam generator running at various loads. The suggested algorithm also makes it possible to calculate the average fuel consumption based on the amount of boiler load and the circumstances under which the boiler operates at peak efficiency. Drosatos et al. [50] developed a model based on the Ansys Fluent software that represents convective heat exchangers operating conditions located inside the boiler without applying a complex numerical model.
Madejski [51] discussed a numerical model that depicts the coal combustion process in a fluidized bed boiler while accounting for particle heating, coal carbonization, and combustion, as well as turbulent flow and heat radiation. Li et al. [52] created a 3D CFD model of the furnace chamber of a 660 MW boiler. The effect of the Primary Air Ratio (PAR) on the boiler’s performance was investigated using the model. Ghaffari et al. [53] proposed a neural network-based model of power plant boiler operation that makes use of extensive amounts of measurement data collected from actual facilities. It enables the determination of power unit operation parameters so that they can be used to track the system’s overall performance. Wang et al. [54] offer a technique for enhancing superheated steam characteristics without going above critical pressure. The scholars came to the conclusion that altering the furnace chamber might considerably improve the boiler efficiency using a mathematical analysis. Bennett and Elwell [55] evaluated the effect of boiler sizing on efficiency. Zhang et al. [56] conducted an exergy analysis of 141 coal-fired industrial boilers to identify energy efficiency improvements. Wang et al. [57] presented the direct method of boiler efficiency evaluation by incorporating offline fuzzy modeling and online operations. Said et al. [58] developed a mathematical model with a java program based on the thermal analysis of the boiler. Similarly, Erbas [59] conducted a case study on a mining industry boiler with a capacity of 75 t/h. The author followed the energy balance method used in analyzing the boiler’s efficiency calculation as provided on the directive test standards of ASME PTC–4 [60]. Wang et al. [61] conducted full-scale experiments and simulations to investigate the co-combustion characteristics of semicoke and coal in a 300 MW coal-fired utility boiler, focusing on the blending method and air distribution. Klačková et al. [62] presented a CFD simulation of the wood gasification process in the filling chamber and the subsequent burning of wood gas on a model heat source.
However, the mathematical model in previous studies addresses specific boiler systems or components, but they failed to capture the overall usage pattern of the system. Albeit there are software and online applications available to measure the fuel consumption and energy usage of a boiler, they do not consider the effect of daily temperature changes on the heat energy requirements of the steam and boiler system. Developing a program that can estimate the energy consumption and fuel usage of boiler systems depending on varying weather conditions can aid in potential decarbonization efforts. In addition, it can give the user a complete understanding of the system, such as how it will behave when the temperature changes significantly, and help them to explore energy savings opportunities.

1.2. Objectives

This research focuses on developing a user-driven simulation program with input from the user of a real-world system. The input options are based on the complete boiler and steam system, capacity rating, exhaust system operating conditions, process heat energy requirements, temperature data, fuel type, and fuel cost. These input parameters will be linked with system operation or generate random variable values. Five different scenarios are considered based on the system’s different input conditions and locations. For a specific benchmark scenario, the range of random number generators for temperature data will be specified based on historical information. The simulation program will be developed in Microsoft Excel® 2019 version using the Visual Basic Application (VBA)® based on discrete-event Monte Carlo Simulation (MCS). The Monte Carlo Simulation will generate the hourly temperature pattern for one year. This random temperature will dictate the heat energy required by the steam system over the year. It will reflect the energy consumption and fuel usage for each benchmarked scenario. A complete understanding of the boiler system is important for the management and operators to run the system efficiently. A complete yearly summary calculated down to hourly based on operational input information will give beneficial insight into the system that can aid the management in making critical improvement decisions about the system.
The objectives of this research are as follows:
  • Evaluate and compare the energy usage, operating cost, and CO2 emissions of fossil-fuel-fired boilers and electrical boilers for decarbonization.
  • Utilize the heat energy balance and calculate the heat energy requirement from boiler systems based on the simulated hourly temperature over a year.
  • Identify the system losses in a boiler and estimate the electrical boiler capacity required to replace the current fossil-fuel-fired boiler.
  • Develop a user-driven and interactive simulation program in Microsoft Excel® where the user can change the input parameters to evaluate the boiler system.
  • Integrate Monte Carlo Simulation in the program that can estimate the hourly temperature based on the randomness of the input.
  • Develop cases to calculate energy and fuel consumption based on different scenarios of the system for program verification.
  • Provide a means to analyze the boiler and steam system fuel usage and behavior for important managerial decisions.

2. Materials and Methods

The technology of electric boilers and their availability have allowed pathways for decarbonization in industrial heating processes. Several research studies have used analytical and computational methods to model the energy usage of fossil-fuel-fired boilers and their efficiency. However, an investigation into electrical boilers has yet to be made available.
This research focuses on determining a boiler system’s energy and fuel usage by simulating the temperature variation pattern. The simulation takes information about the system’s location, the number of existing boilers and end users of the steam, operational settings of the boiler system, and general facility and production capacity information as input factors. The simulation walk-through can be segmented into steps, as shown in the flow diagram (Figure 2) and described later. Step 1: Define the location, the number of boilers, the number of end users, and the utility cost. Step 2: Define the operational control of the boiler based on capacity, set temperature or pressure, blowdown amount, makeup water amount, ambient condition, surface area, flue gas information, end users’ information and requirements, and facility working hours and production probabilities (monthly and hourly). Step 3: Define the temperature range condition of the location based on weather data. Step 4: If the user proceeds with the default temperature range variation, it will be generated using the location of the system and uniform probabilities. Step 5: The hourly temperature for a year will be generated using Monte Carlo Simulation based on the location degree days information and temperature variation. The simulation generates a random temperature variation for each day from the previously generated range and equally distributes the range for 24 h. Step 6: This simulation enables the model to randomly vary the steam usage amount and the losses amount over time, ultimately assigning a load factor to the boiler. The detail load factor is calculated every 1 h for one year. Step 7: The equivalent electrical boiler requirement and capacity are determined based on the user information. Step 8: Finally, the existing fossil-fuel-fired boiler and proposed electrical boiler energy usage data, operational cost data, and detailed emissions information are presented.
The system requires some input to generate a pattern using simulation. In the model, the user has the flexibility to choose a location or user-defined degree days, number of boilers, number of end users, boiler capacity, flow rate, set temperature and pressure, combustion air temperature, makeup water amount and temperature, blowdown amount and temperature, boiler surface area and temperature, flue gas information, fuel type, steam type, auxiliary unit presence, control type, and facility operational hour and capacity probability. All these input factors enable the model to be robust. The simulation program is interactive and detail-oriented, which allows the user to change the values of every variable. All the input variables are explained in the next chapter with their functionality. The simulation is developed in Microsoft Excel® using the Visual Basic Application (VBA)® based on discrete-event Monte Carlo Simulation (MCS). The uniformly distributed random number is generated in Excel, depending on the user input. A heuristic approach is used to determine the temperature based on the generated random number concerning heating and cooling degree days. Similarly, the heuristic rule is used to calculate the boiler system losses and finally translate the energy usage by the system.

2.1. Energy Calculating Factors

The user must provide the required factors to move forward with the simulation, whereas optional factors can be left blank and will be populated by default values. The required factors are location, utility cost, boiler number, end user type and number, boiler capacity, steam type, steam temperature and pressure, surface area, boiler surface area and temperature, blowdown amount and temperature, flue gas flow rate and temperature, flue gas surface area and temperature, and end-user heat energy requirements. The optional factors include steam flow amount, combustion air temperature, makeup water amount and temperature, condensate return amount and temperature, presence of auxiliary component, control type, ramp up and ramp down time, monthly and hourly production variation, and system pipeline information.

2.2. Case Development

For this study, five cases will be considered to increase the versatility of the fuel usage by boiler and equivalent electrical boiler.
Case I: Four boilers running in a facility that generates hot water to provide the energy required for space heating are considered. Since the requirement is for space heating, the demand for hot water from the boiler is continuous in wintertime; however, during summer, the boilers will barely run.
Case II: In this case, the four boiler settings remain the same as in Case I. The purpose of the boilers is similar to serving space heating needs. However, in this model, the location will be more temperate. All other operating parameters will remain the same as Case I.
Case III: This case will have one large-capacity boiler for process heating. Since process heating is required during the production hours only for this instance, weekdays, 8 AM to 4 PM, the simulation will imitate the boiler fuel consumption only during those hours.
Case IV: This case will be designed similarly to Case III for comparison. The only difference will be on the demand side, where space heating is needed alongside process heating. This will require the boiler to work more, resulting in more fuel consumption.
Case V: This last case will be again designed similarly to Case III, with the difference that improved boiler operating parameters will be used. Using an improved boiler will reduce the fossil-fuel-fired boiler’s energy losses, reducing CO2 emissions. The demand side energy usage will remain the same. Therefore, the electrical boiler should require a slightly lower capacity than Case III.
After providing all the required information, the user will click the “Click to Run Simulation” button at the top of the input sheet to start the simulation to generate temperature variation every hour for a year. The VBA program will generate a random range for temperature for each day. With the Monte Carlo Simulation and heuristic rules, the daily temperature will vary on the randomly generated range for 24 h. The simulation will calculate the heat energy of steam, condensate return, blowdown, flue gas losses, shell losses, and the end-user need at a 1 h interval for 365 days. Finally, an output spreadsheet will be created to summarize the results. Current energy and fuel usage for each boiler will be represented graphically and numerically. The result will include the required electrical boiler sizing and energy usage for a year. The current cost of operation and proposed electrical boiler operating cost will be included for comparison. Lastly, the CO2 emissions for all possible scenarios will be included to justify the decarbonization effort through electrical boilers.

2.3. Heat Balance

Heat balance is the underlying tool for calculating the energy usage of a boiler and steam system. Heat balance comes from the fundamental concept of the first law of thermodynamics. The first law is a statement of the principle of conservation of energy. In a steam system, the heat is generated by the combustion of fossil fuels, and it is transferred to the steam. The steam travels inside the system, finally transferring the heat energy to the end-user, and returns to the boiler after it has given away its heat content. In heat transfer, it is common practice to refer to the first law as the energy conservation principle or simply as an energy or heat balance. A heat balance determines the heat coming into a system from all sources and the heat leaving the system. The input and output are then balanced to account for all the heat. Therefore, the calculation can be divided into two groups. The first group includes all the heat inputs or gains to the boiler system, and the second group is all the heat outputs or losses from the system.
Heat in Fuel: The amount of heat energy available from the fuel is the fuel heating value multiplied by the fuel used per hour. This can be calculated as:
Q F = m · F × H H V ,
where
QF = Heat Content in Fuel (Btu/h) (1 Btu/h = 0.293071 W)
F = Amount of Fuel (lb/h) (1 lb/h = 0.000126 kg/s)
HHV = Higher Heating Value of Fuel (Btu/lb) (1 Btu/lb = 2326 J/kg)
In addition to the previous formula, the firing factor and capacity of the boiler can be utilized to calculate the energy in the fuel. It will be easier for the user to obtain the capacity of the boiler from the name specification rather than from the mass flow rate of the fuel. Therefore, the model will integrate the latter concept for convenience.
Q F = x f f × C × C C 1 ,
where
xff = Firing Factor of Boiler (no unit)
C = Capacity of Boiler (MMBtu/h) (1 MMBtu = 293 kWh)
CC1 = Conversion Constant (Btu/MMBtu)
Heat Gain from Combustion Air: Since the enthalpy of flue gas will be calculated relative to the temperature of the entering combustion air, the relative enthalpy of the combustion air is zero. This convention avoids counting the enthalpy of the combustion air in both the input and output computations.
Heat Gain from Makeup Feedwater: If the makeup water enters the boiler at ambient temperature, it will not represent a heat gain or a heat loss. However, if a feedwater economizer exists, the user must provide the feedwater temperature to calculate the energy content. The temperature will be used to find the enthalpy of feedwater from the steam tables. The energy content in feedwater can be calculated as:
Q M W = m · M W × h M W × k 1 × k 2 ,
where
QMW = Heat Content in Makeup Feedwater (Btu/h)
MW = Amount of Feedwater (gal/min) (1 gal/min = 0.063090 L/s)
hMW = Enthalpy of Feedwater (Btu/lb) (1 Btu/lb = 2326 J/kg)
k1 = Constant 1 (min/h)
k2 = Constant 2 (lb/gal) (1 lb/gal = 0.119826 kg/L)
Heat Gain from Condensate Return: Condensate returned to the boiler accounts for a substantial amount of heat energy input. This input can be calculated as:
Q C = m · C × h C ,
where
QC = Heat Content in Condensate (Btu/h) (1 Btu/h = 0.293071 W)
C = Amount of Condensate Return (lb/h) (1 lb/h = 0.000126 kg/s)
hC = Enthalpy of Condensate (Btu/lb) (1 Btu/lb = 2326 J/kg)
Heat in Steam: Steam going out of the boiler contains most of the heat energy generated by the boiler. The heat energy contained in steam is called enthalpy. It is made up of latent heat or the heat to vaporize the water, plus sensible heat, the energy required to heat pure steam—this is generally proportional to the temperature difference through which the steam was heated. The following equation can calculate the energy contained in the steam:
Q S = m · S × h S ,
where
QS = Heat Content in Steam (Btu/h) (1 Btu/h = 0.293071 W)
S = Amount of Steam Flow (lb/h) (1 lb/h = 0.000126 kg/s)
hS = Enthalpy of Steam at Given Temperature and Pressure (Btu/lb) (1 Btu/lb = 2326 J/kg)
Heat Loss in Blowdown: The blowdown loss can be calculated by determining the mass of water and the energy content of the discharged water. The amount of energy lost through blowdown depends on factors such as the temperature and pressure of the water being discharged and the volume of water being blown down. The following equation presents the energy content in the blowdown water:
Q B D = m · B D × h B D ,
where
QBD = Heat Content in Blowdown (Btu/h) (1 Btu/h = 0.293071 W)
BD = Amount of Blowdown (lb/h) (1 lb/h = 0.000126 kg/s)
hBD = Enthalpy of Blowdown at Given Temperature (Btu/lb) (1 Btu/lb = 2326 J/kg)
Heat Loss from Surface: Much of the energy lost from boilers is radiated to the environment or transferred to the environment via convection. The following equation is used to calculate the heat losses from the surface by radiation and convection:
Q S L r a d i a t i o n = A B S × C 1 × T s 4 T A 4 ,
where
QSLradiation = Radiative Heat Loss from Surface (Btu/h) (1 Btu/h = 0.293071 W)
ABS = Boiler Surface Area (ft2)
C1 = Stefan-Boltzmann Constant (0.1714 × 10⁻⁸ Btu/h-ft2-°R4) (1 Btu/h-ft-°F = 1.730735 W/m·K)
Ts = Boiler Surface Temperature (°R = °F + 460)
TA = Ambient Temperature (°R = °F + 460)
Q S L c o n v e c t i o n = A B S × C 2 × T s T A 4 / 3 ,
where
QSLconvection = Convective Heat Loss from Surface (Btu/h) (1 Btu/h = 0.293071 W)
ABS = Boiler Surface Area (ft2) (1 ft2 = 0.092903 m2)
C2 = Convection Coefficient (0.18 Btu/h-ft2-°F) (1 Btu/h-ft-°F = 1.730735 W/m·K)
Ts = Boiler Surface Temperature (°F) (°C = (°F − 32)/1.8)
TA = Ambient Temperature (°F)
Heat Loss in Flue Gas: There are several ways to calculate the heat loss from the boiler through flue gas. (i) Use the fossil-fuel composition and the chemical reactions in the combustion to estimate the amounts of each flue gas component. Then determine the enthalpy of each component and add them all up. This requires a good knowledge of chemistry and extensive calculation. (ii) Use the combustion efficiency curve, which requires measuring the percent of flue gas oxygen. (iii) Calculate the heat energy in the flue gas using mass flow rate, specific heat, and temperature difference. This third model option will be used as mass flow rate can be found from the combustion motor specification, and the standard value for the specific heat of flue gas can be utilized. The first option can be cumbersome to integrate into the model, and the second option requires the oxygen percentage in flue gas, which might need to be more readily available. To calculate the flue gas heat loss, the following equation is used:
Q F G = ν F G × ρ F G × k 1 × C p × T F G T A ,
where
QFG = Flue Gas Heat Loss (Btu/h)
νFG = Volumetric Flow Rate of Flue Gas (ft3/min) (1 ft3/min = 0.000472 m3/s
ρFG = Density of Flue Gas (lb/ft3) (1 lb/ft3 = 16.018463 kg/m3)
k1 = Constant 1 (min/h)
Cp = Specific Heat of Flue Gas (Btu/lb-°F) (1 Btu/lb-°F = 4.1868 J/kg·K)
TFG = Flue Gas Temperature (°F) (°C = (°F − 32)/1.8)
Heat Loss from Flue Surface: Heat loss from the flue surface can be similar to heat loss from the boiler surface. Therefore, a similar equation can calculate the heat loss from the flue surface.
End User Energy Usage: The steam generated by the boiler transfers its heat energy content to the end user. The heat transfer equation can be utilized on the end user side to determine heat energy gained from the steam based on the required temperature. After providing the heat energy to the end user, the steam returns to the system as condensation. The following heat transfer equation can be used if the end-user is solid/metal:
Q E U s o l i d = k × A E U × T E U T A t ,
where
QEUsolid = Heat Energy Requirement of End User (Btu/h) (1 Btu/h = 0.293071 W)
k = thermal conductivity (Btu/h-ft-°F) (1 Btu/h-ft-°F = 1.730735 W/m·K)
AEU = Surface Area of Solid End User (ft2) (1 ft2 = 0.0929 m2)
t = Thickness of the Solid End User (ft) (1 ft = 0.3048 m)
TEU = End User Required Temperature (°F) (°C = (°F − 32)/1.8)
If the end user is fluid (liquid/gas), the following heat transfer equation can be used:
Q E U f l u i d = ν E U × ρ E U × k 1 × C p E U × T E U T A ,
where
QEUfluid = Heat Energy Requirement of End User (Btu/h) (1 Btu/h = 0.293071 W)
νEU = Volumetric Flow Rate of End User (ft3/min) (1 ft3/min = 0.000472 m3/s)
ρEU = Density of End User (lb/ft3) (1 lb/ft3 = 16.018463 kg/m3)
k1 = Constant 1 (min/h)
CpEU = Specific Heat of End User (Btu/lb-°F) (1 Btu/lb-°F = 4186.8 J/kg·K)
TEU = End User Required Temperature (°F) (°C = (°F − 32)/1.8)
Figure 3 shows the heat energy input and output of the developed model.
A similar heat energy balance can be applied to the demand side to balance the energy in the end user. Figure 4 depicts the energy input and output at the end user.
Based on the diagram, the energy balance formula for the model used is as follows:
Q F + Q C A + Q M W + Q C = Q S + Q F G + Q B D + Q S L .
The demand side balance can be expressed with the following formula:
Q E U + Q C = Q S .
The enthalpy of the flue gas will be calculated relative to the combustion air; the relative enthalpy of the combustion air is zero. The enthalpy of steam, condensate return, and blowdown is determined relative to makeup water enthalpy; therefore, the enthalpy of makeup water will not be considered in Equation (15). Moreover, the firing factor used in Equation (5) dictates the operating load of the boiler, which will be reflected in the flue gas loss. The energy balance’s outcome determines the boiler’s hourly firing factor. Using the firing factor, the hourly fuel usage amount can be determined, which can be used to calculate the CO2 emissions. Using the information mentioned above, Equation (15) can be rewritten as follows,
x f f =   Q E U + Q B D + Q S L C × C C 1 Q F G .
The hourly firing factor will be used to determine the hourly fuel usage by combining Equations (4) and (5) as follows,
m · F =   x f f + C + k H H V .
Table 1 shows the higher heating values used for different fuels in the model [63].
Finally, the electrical boiler capacity and energy requirements are calculated using the following energy equivalency formula,
1   kW = 3412   Btu / h   or   1   MMBtu / h   = 1   kW .

2.4. Simulation Tool Development

The Excel file initially contains the “Manual”, “Input”, “Steam table”, and “References” spreadsheets. Figure 5 shows some portion of the “Input” sheet.
Table 2 shows the steam properties based on pressure.
The “References” spreadsheet contains other required information such as the HDD and CDD data, along with the constant values used in the equations and unit conversion.
After the simulation starts, “ProcessSim”, “SummaryBoiler”, and “Result” spreadsheets are created by VBA.

3. Results

A user-driven simulation program with real system data input from the user is developed in this research work. All the input information leads to the results, where one-year energy consumption, fuel consumption, and CO2 emissions at 1 h intervals will be calculated for a given boiler system. From the final energy consumption pattern, equivalent electrical boiler capacity and energy usage are provided to aid in the decarbonization of fossil-fuel-fired boilers.

3.1. Compare Simulated Results with Real Data

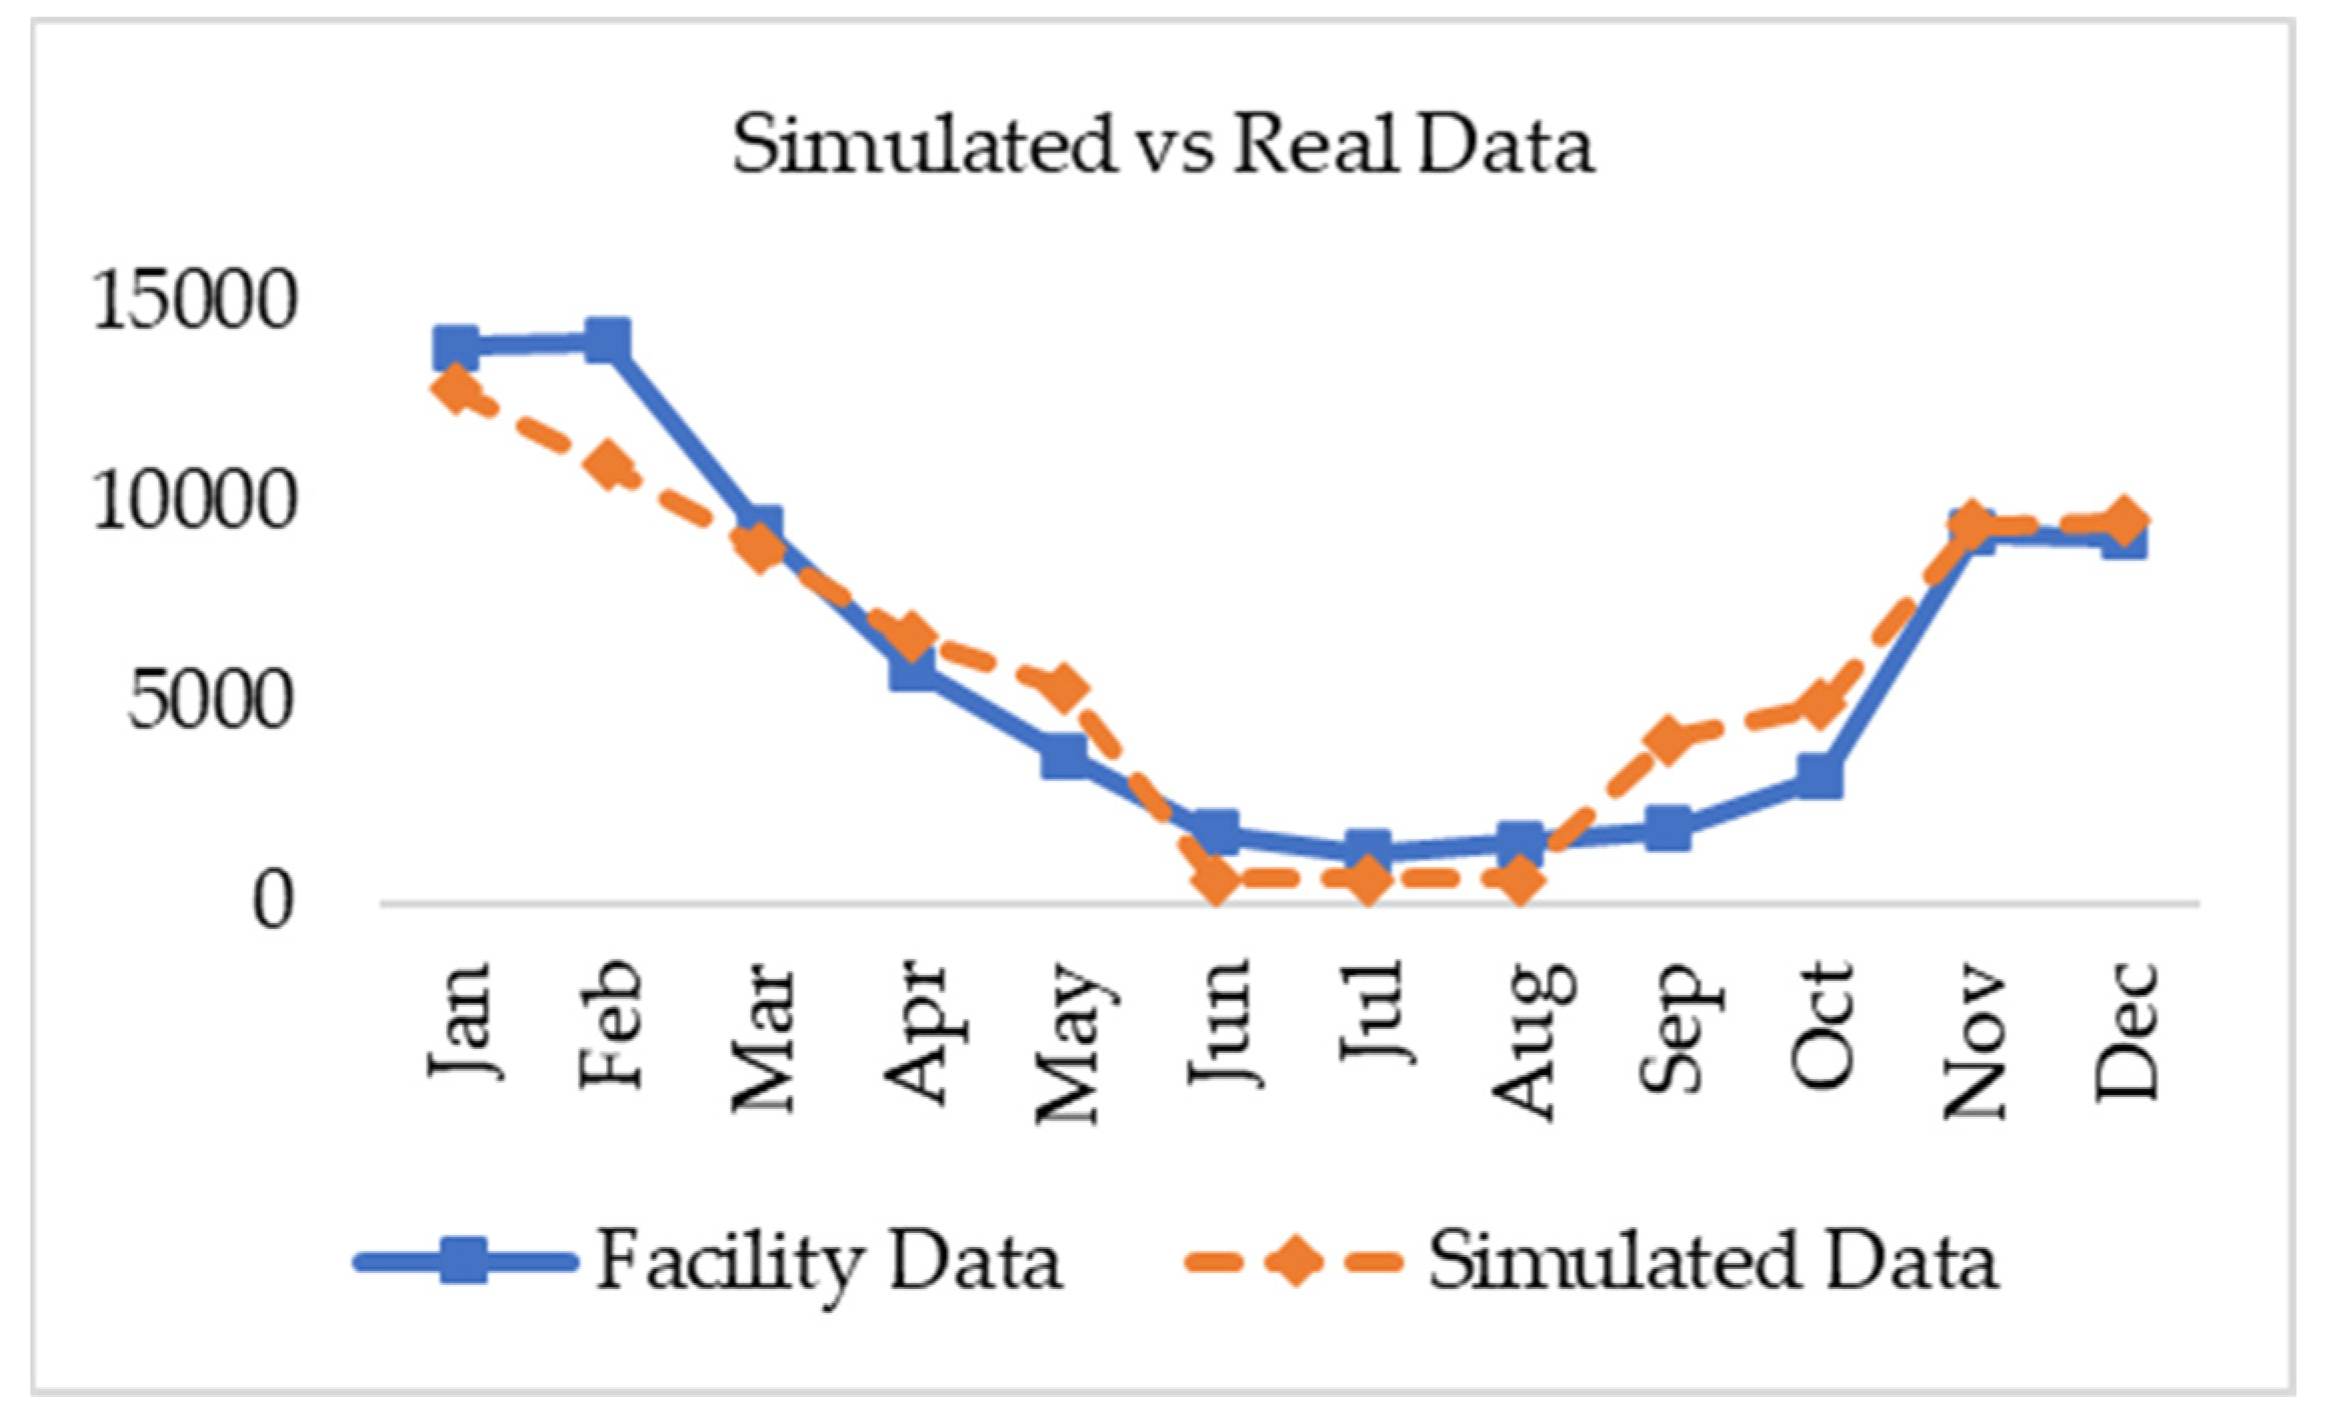
To validate the simulated result, the total energy consumption from Case I is compared with the collected energy consumption data of a real facility. Case I input parameters were provided according to the current operating condition of the facility. The facility uses four hot water boilers, and the primary purpose of the boilers is to generate hot water used for space heating. The boiler’s set temperature is 185 °F, and they have a moderate amount of return water as the system is closed loop and there is some blowdown amount. Boiler surface areas were measured, and flue gas information was collected from combustion testing. The end user’s information was collected from the heat exchangers located in the facility. Table 3 shows the monthly energy usage data of the facility and the simulated data. The data can be visualized in Figure 6. Most of the monthly energy usage simulated data are similar to the actual data, with some discrepancies. The discrepancies exist because the existing boilers in the facility were manually controlled to turn on and off, and all the boilers were not running simultaneously. The simulation program cannot reflect this feature because of the complexity involved. However, the annual energy usage of actual and simulated data is very close, with a small error percentage, and the simulated data were able to capture the overall pattern of the actual usage.

3.2. Compare Simulated Results with Real Data

The HDD and CDD value of both locations is provided in Table 4 to show the differences in the data.
Case I and Case II have all the same input, with exceptions only in the location. Case I is simulated in a colder location based on the location of the existing facility, which was referred to using the input data. Case II is considered to be in a more temperate location.
Table 5 and Table 6 show the annual summary of the fossil-fuel boilers of Case I and Case II.
The simulation results have been produced as a graphical presentation for better visualization. Here we can see the monthly energy consumption by the individual boilers for both Case I and Case II. Figure 7 shows the monthly energy usage summary of Case I, and Case II. The graph shows that Case I has higher energy consumption in different months than Case II and can be related to the degree days values of Table 4.
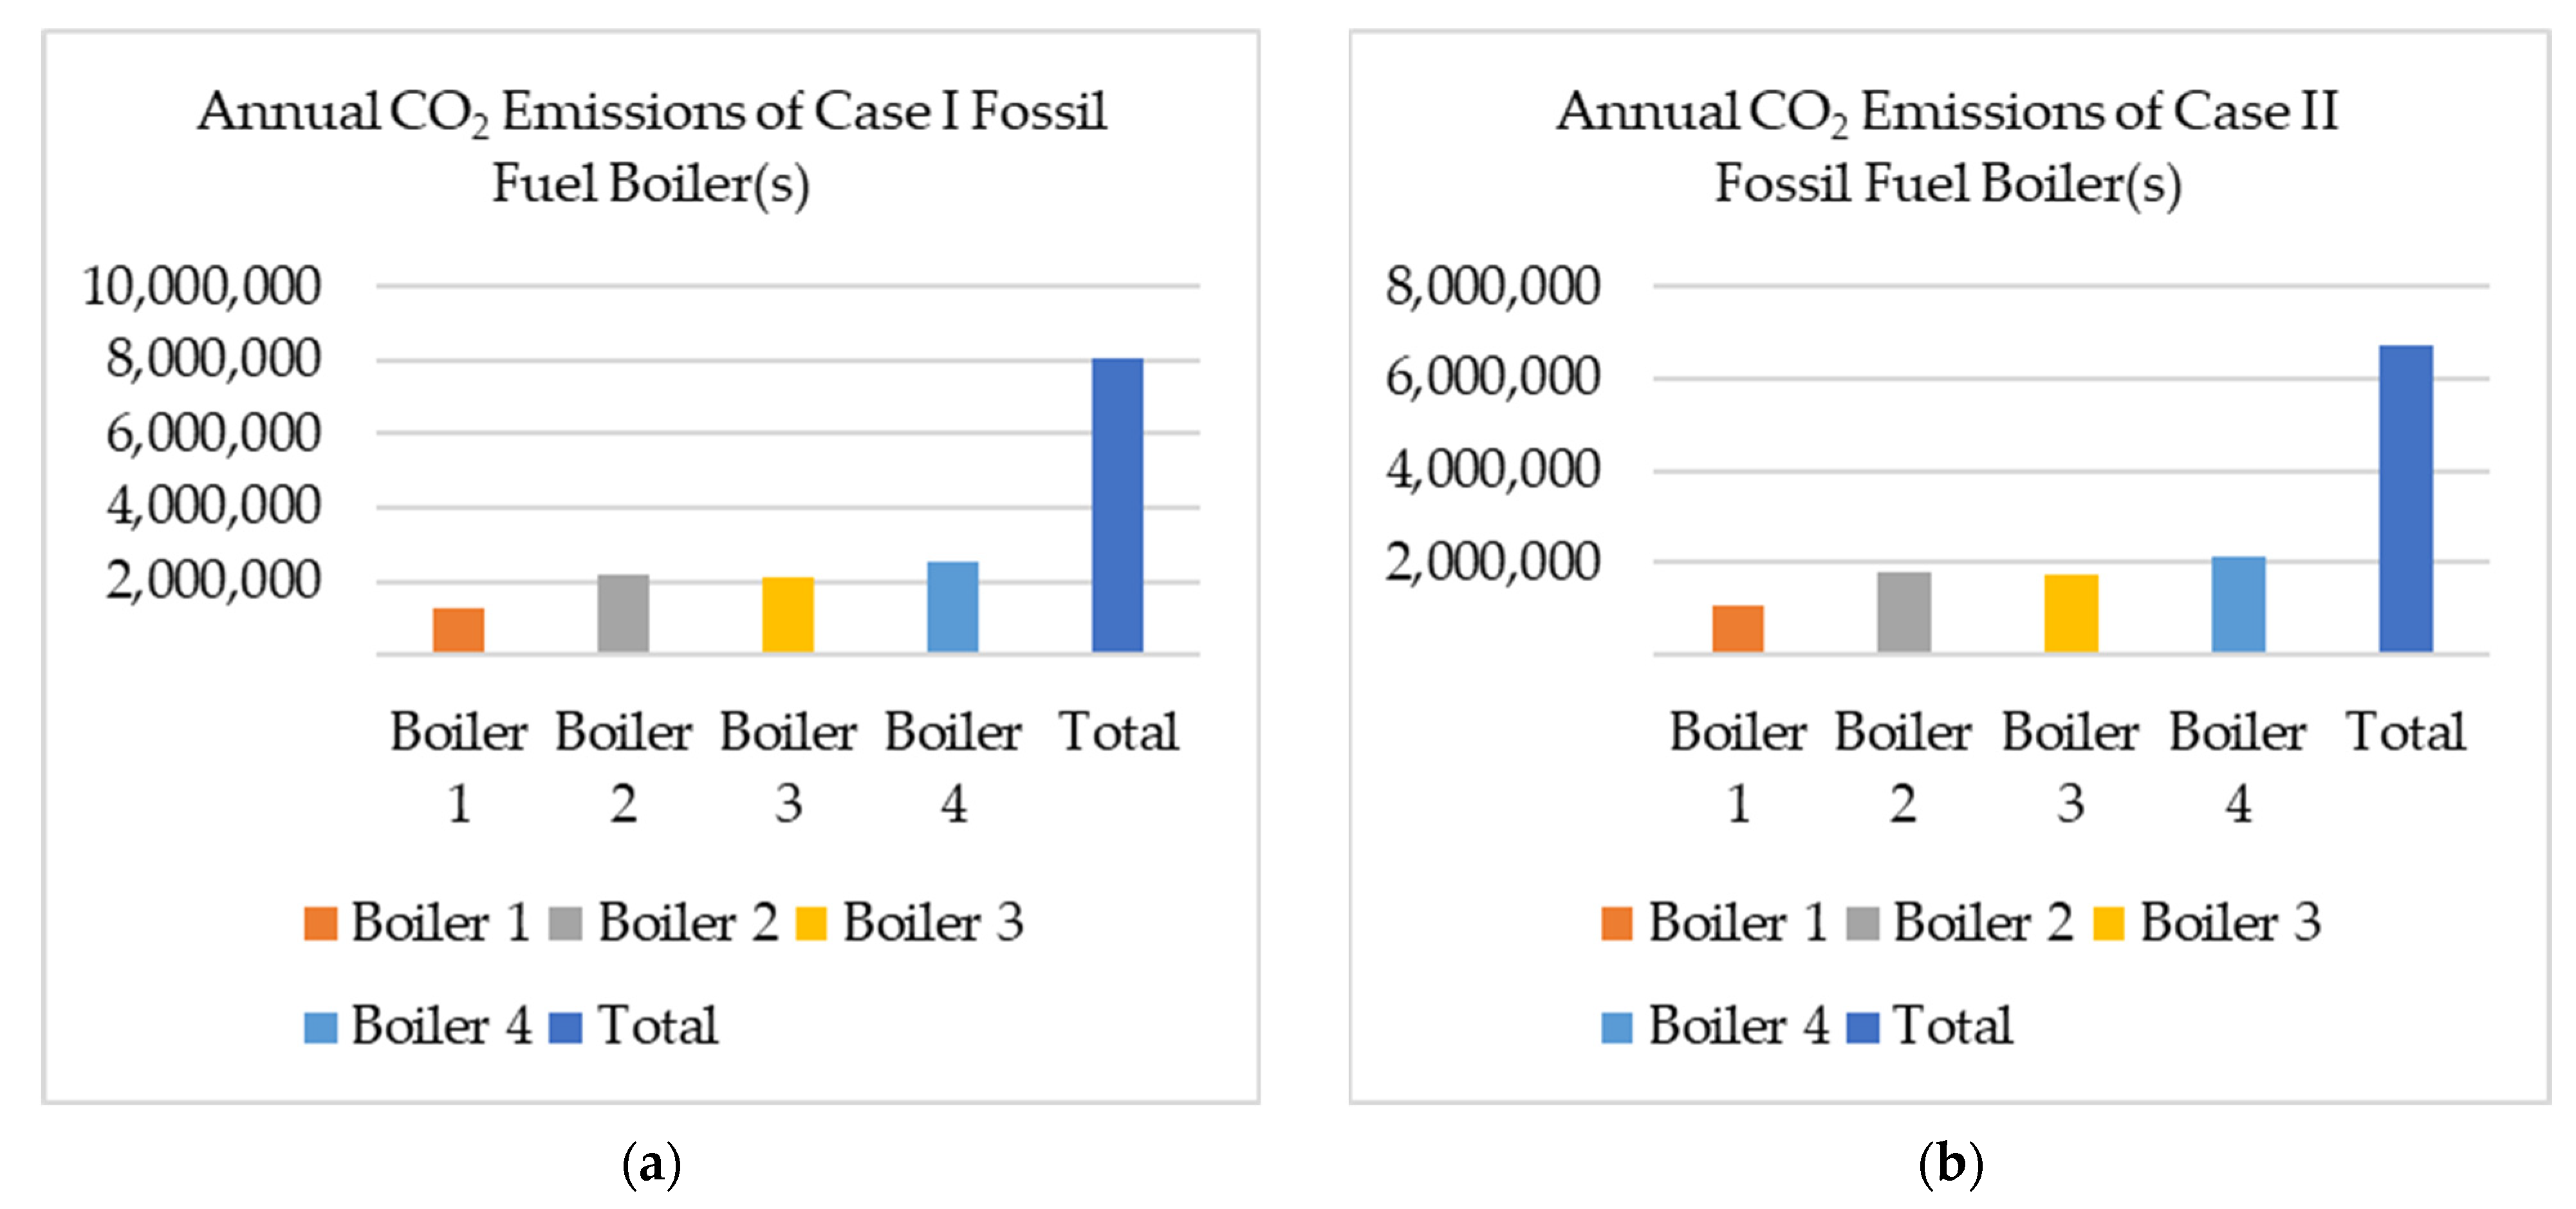
Figure 8 shows the annual CO2 emissions of Case I and Case II fossil-fuel boilers. Case I boilers have overall higher CO2 emissions than Case II boilers, because Case I boilers use more energy, which requires more fossil fuels and, as a result, produces more CO2.
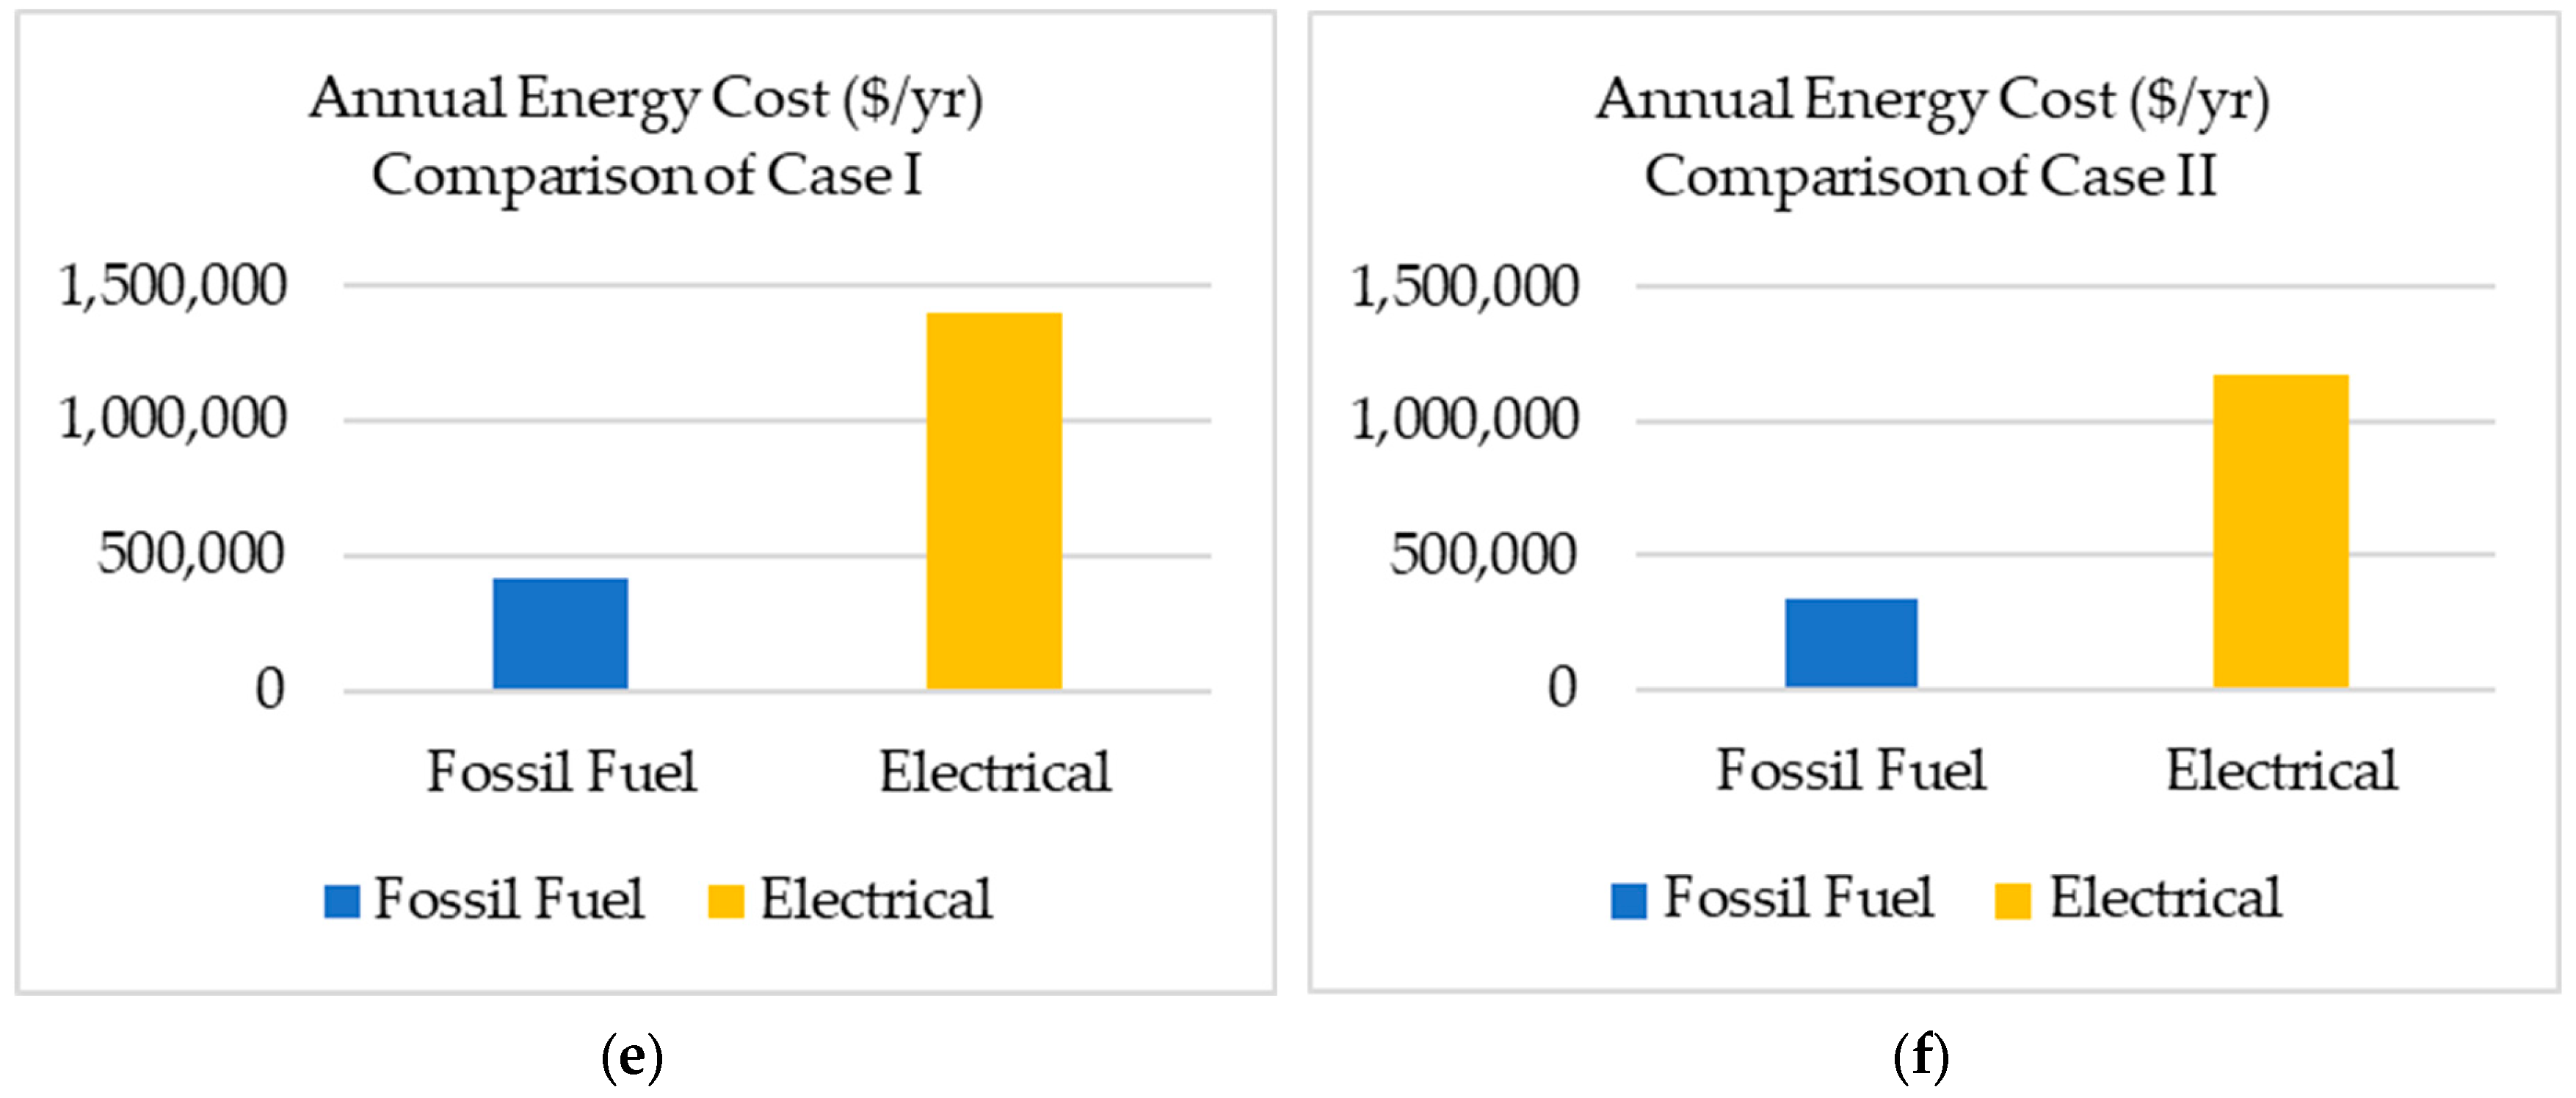
Figure 9 shows fossil-fuel boilers’ overall energy usage, CO2 emissions, and energy cost and compares them with the electrical boiler replacement for Case I and Case II, respectively. The operating cost of the electrical boilers is calculated by considering the current rate structure. However, with increased electrical energy usage and demand, the cost can be different from the current rate structure.
As part of the simulation result, equivalent electrical boilers required to replace the current boiler are evaluated. If the electrical boilers are to match the current capacity of the fossil-fuel boilers, a very high capacity of the electrical boilers is required. However, if electrical boilers are only required to match the end users demand, they can be of lower capacity, which means the current system is oversized from the demand.

3.3. Sensitivity Analysis

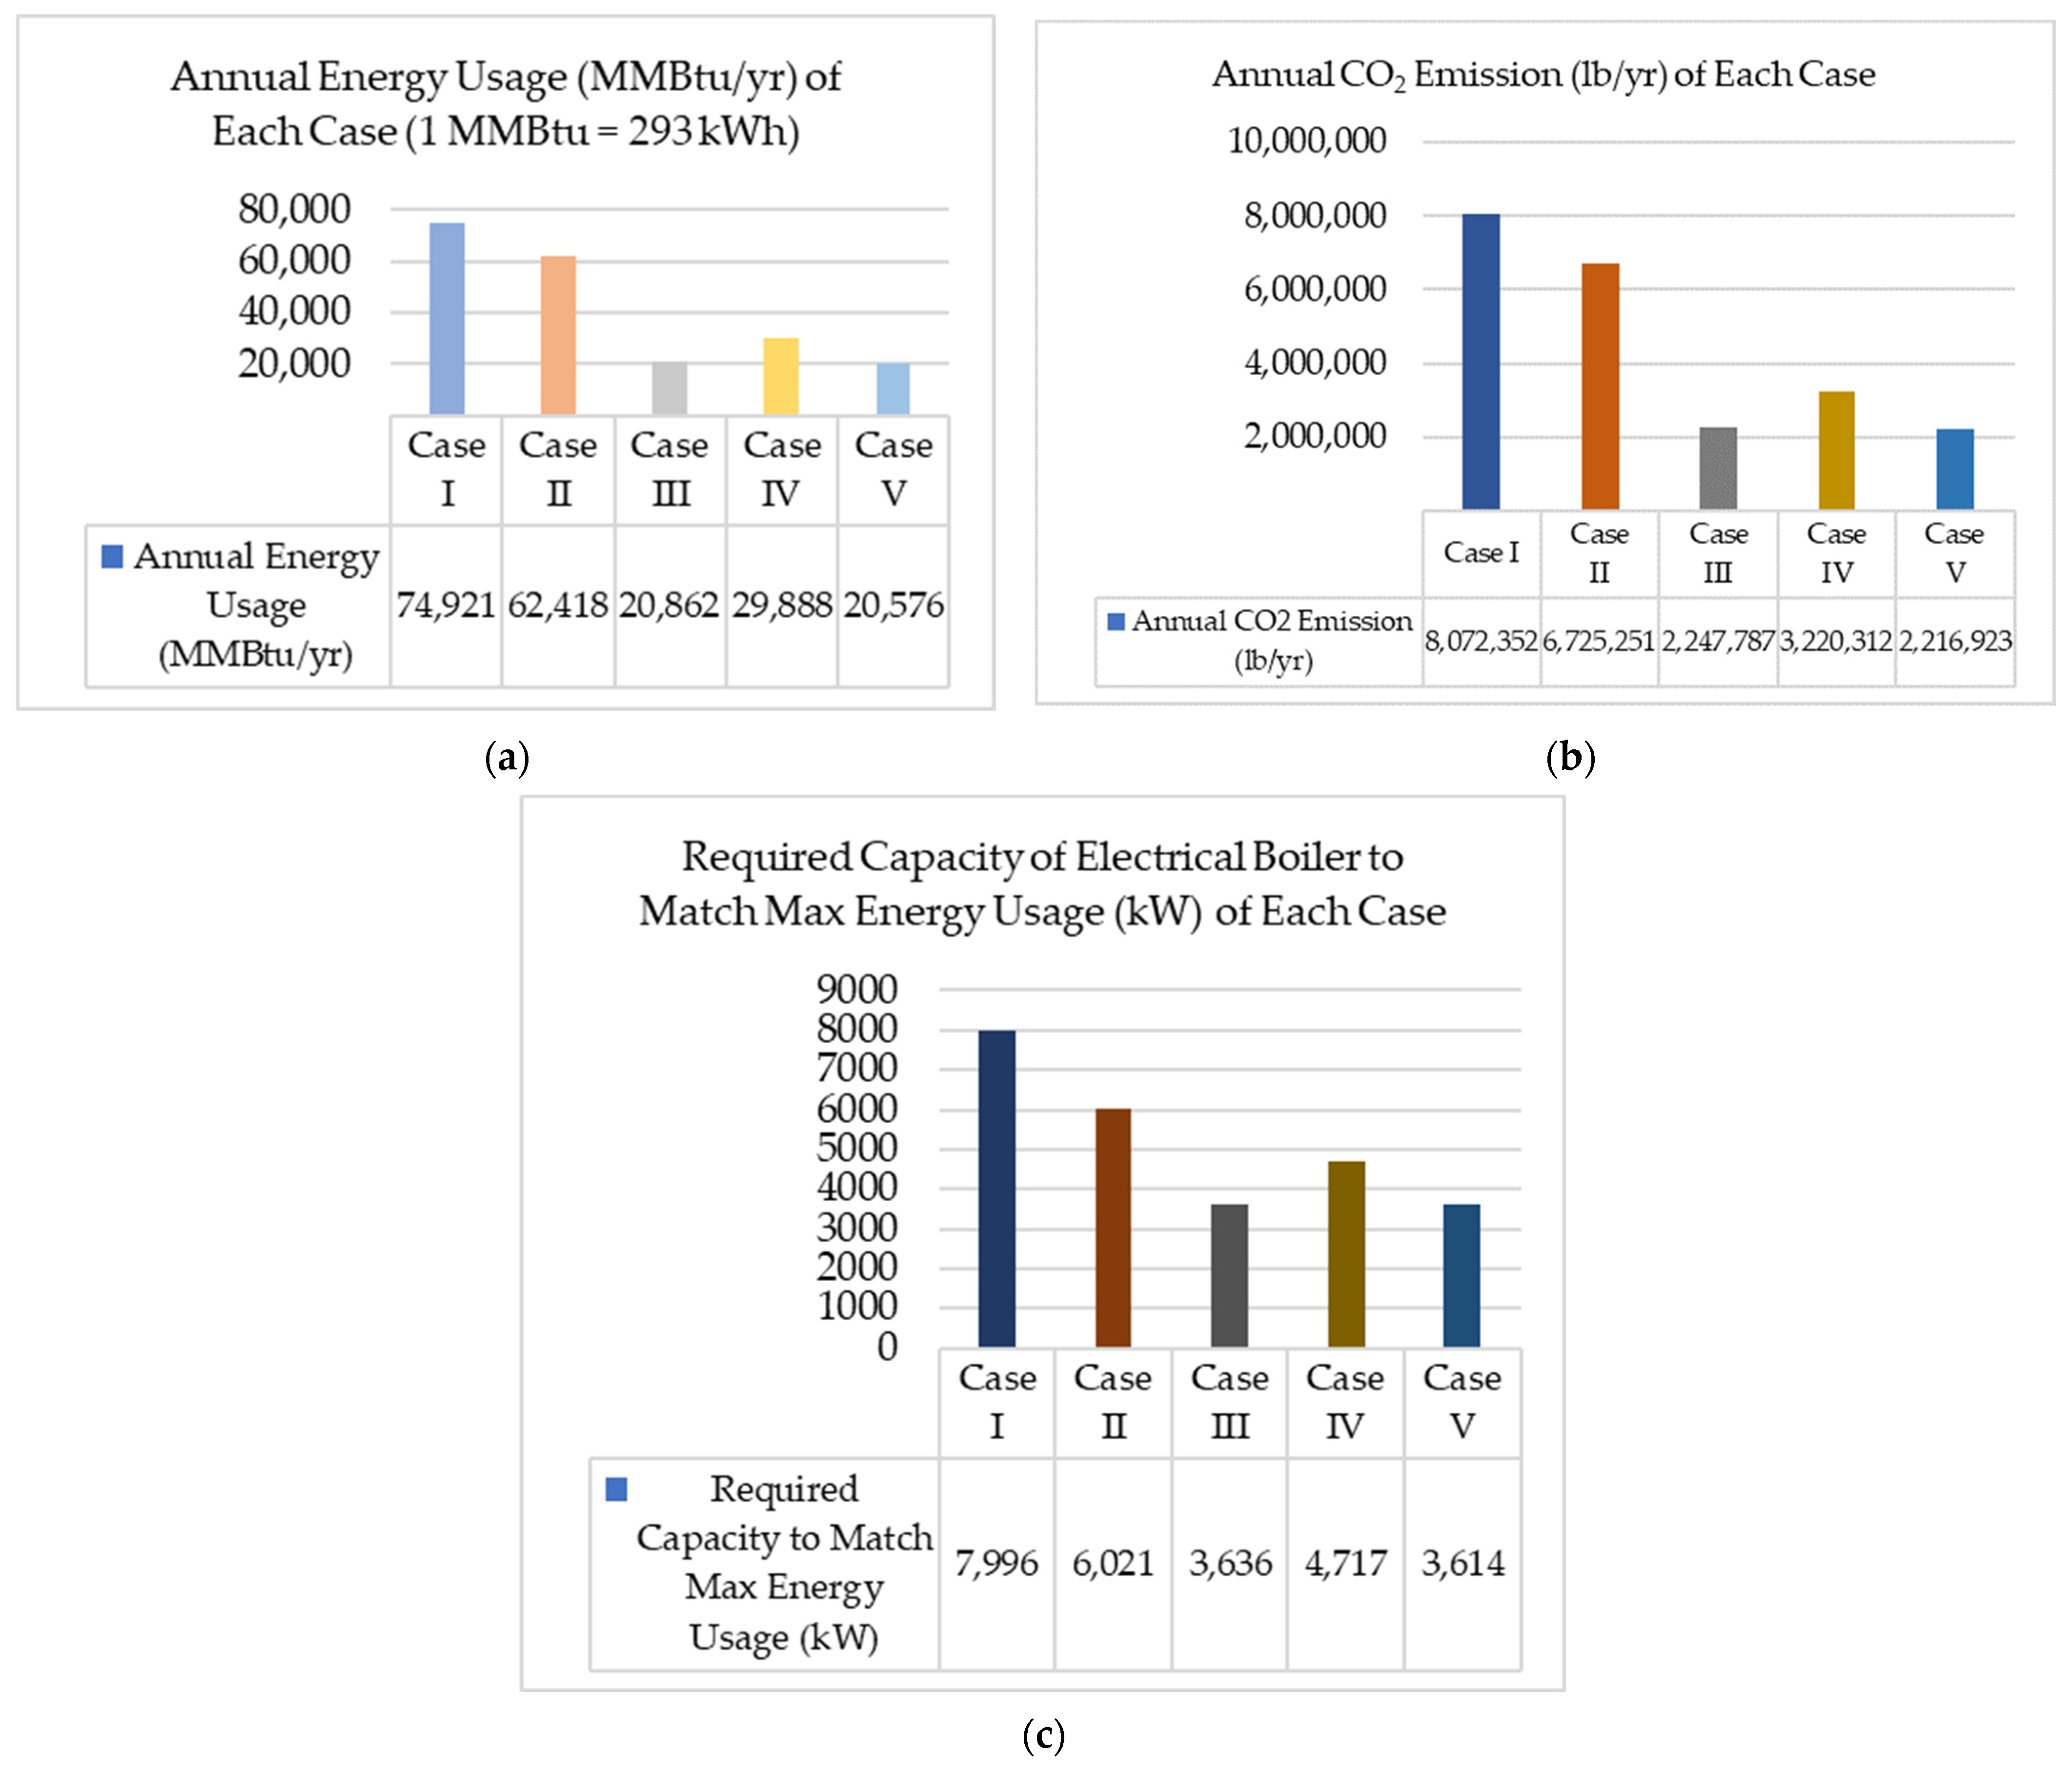
A scrutinized analysis is performed to check the capability of the simulated program. Because of the randomness of the Monte Carlo Simulation, the results differ slightly each time, with the same parameters for the same case. The temperature, which significantly affects the energy consumption of the boilers, is allowed to vary slightly for each location with a random number generator. All the information influences the overall energy consumption and is reflected in the capacity and energy required by the electrical boilers to replace the fossil-fuel-fired boilers. Simulated results from Cases III, IV, and V, along with Cases I and II, are studied here as the input parameters. End users are slightly changed in each case to reflect the effects of input parameters on the outcomes. Figure 10a shows the overall energy consumption of all the boilers in each case. Case I and Case II can be compared as their input parameters are identical, except for the location. Case I is located in a colder climate than Case II; thus, Case I consumes more heat energy than Case II. Case III and Case IV energy consumption can be compared in terms of end users. Case IV has additional end users compared to Case III, and all other input parameters are the same. Therefore, Case IV uses more overall energy as required by the demand side compared to Case III. Again, Case III can be compared with Case V. Case V has the same end user as Case III, while the only exception between both cases is that Case V has better boiler operating conditions than Case III. The improved operating conditions are higher condensate return, lower blowdown amount, and lower losses in the flue gas. Figure 10b represents the total CO2 emissions for all cases and reflects a similar pattern to energy consumption because the CO2 emissions are directly related to fuel usage, which is related to energy consumption. Finally, Figure 10c shows the electrical boiler maximum capacity required to replace the current fossil-fuel boiler to meet the demand in each case and decarbonize the system. However, to meet such high electrical demand, infrastructure changes will be required in the facility. A new substation might be required in order to provide peak demand and an uninterrupted electricity supply. Power outage will be an issue in the operation of electrical boilers and steam supply.

4. Conclusions

The research is focused on developing a user-interactive simulation program that enables the user to assess their current boiler system and aid in making critical decisions about decarbonization. In developing the program, several factors that directly affect the system’s energy consumption are considered. These factors include both the supply and demand sides of the boiler, such as boiler capacity, steam flow rate, operating pressure, and temperature, condensate return amount and temperature, condensate return amount and temperature, blowdown amount and temperature, boiler surface area and temperature, ambient temperature, flue gas flow rate, temperature, surface area and surface temperature, and types of end users that use the steam and information regarding their energy consumption. Some facility information, such as operating hours and monthly and hourly production capacity, is considered to be reflected in energy consumption. The system’s energy consumption is calculated using the thermodynamic heat balance formula. The heat energy produced by the boiler is usually transferred to end users that operate at certain temperatures and lose heat to the ambiance. Therefore, the ambient temperature plays a significant role in the energy consumption of the boiler. In this program, the hourly temperature of a year is simulated using the degree days value of the selected location in the simulation process. Boiler energy losses in the surrounding and end-user energy demand are calculated in reference to the hourly simulated temperature. All the energy coming into the boiler and going out are balanced to calculate the total energy consumed by the boiler. This boiler energy consumption is translated into fossil-fuel usage and, consequently, the emitted CO2. Finally, the current energy consumption of the boiler is utilized to estimate the equivalent electrical boiler capacity and energy consumption. The program ultimately compares fossil-fuel boilers’ energy and fuel consumption with those of electrical boilers. Since the electrical boilers have zero CO2 emissions, the program’s findings can help the management assess different scenarios and make an important decision about decarbonizing their boiler. The simulation program is validated using the collected data from a real facility. In addition, the program’s sensitivity is performed by developing different cases that differ from each other in smaller terms to reflect the changes on the same ground. The summary of the analysis is listed below:
  • The energy consumption of the boiler is high, with the same operating condition in a colder climate than in a temperate climate. A higher-capacity electrical boiler will be required to replace the current boiler.
  • The energy consumption pattern and peak heat demand depend on the type of end user. Space heating requires heat energy throughout the day, while any process heating operation requires energy mostly during operational hours.
  • Changing or improving the operating parameters of the boiler slightly reduces energy consumption, and therefore a lower-capacity electrical boiler can be used.
  • Electrical boilers consume approximately 18% less energy on average from the simulated cases compared to fossil-fuel boilers. This is because electric boilers do not incorporate flue losses.
  • The operating cost of electrical boilers is usually 240% higher on average from simulated cases than that of fossil-fuel boilers.
The electrical boiler operating cost is calculated by considering the current average unit cost of electricity. However, by installing an electrical boiler the electricity usage and demand will rise and rate structure will be different based on the utility company. This updated rate can reduce the electrical cost. In addition, fossil-fuel boilers require high maintenance and other additional costs of boiler tune-up. The high operational cost of the electrical boiler can be offset by a reduction in maintenance costs, electrical rate reduction, and carbon capture cost. In addition, if biogas or landfill gas is considered as a substitute for decarbonization they come at a cost of lower Btu value, which will require extra fuel to meet the same heat demand by the end users. Biogas and landfill gases contain impurities; thus, scrubbing cost will be added to the operational cost of such gases. Therefore, considering all the aspects of operational cost, electrical boilers are more viable and feasible based on the imminent demand of decarbonization, provided the electricity is supplied from renewable sources and smart grids.
Several assumptions have been made to reduce the complexity and execution time of the simulation. In addition, the simulation program can be made more realistic by incorporating several factors that influence the energy consumption of boilers. The possible future works for this study are listed below:
  • The study does not include the individual operating hours of each boiler throughout the year. Including this factor in the input will more realistically reflect the energy usage of the individual boiler.
  • It is assumed that the boiler operates all the time, as indicated by the facility’s working hours, and manual operation or control of the boiler needs to be addressed in the program. It is possible to consider the manual turn-on and turn-off of the boiler to calculate the energy consumption more accurately.
  • To better address the changing temperature, a smaller time interval frequency than 1 h should be considered.
  • Including other end users will make this simulation more usable for diverse applications.
  • A wider range of energy per unit of fuel and CO2 emission values can be used to estimate a range of fuel usage and CO2 emissions by the boiler.
  • Financial calculations can be included in the simulation result to better aid decision-making.

Author Contributions

The original manuscript was drafted by N.I.C., while B.G., N.A., H.L. and Z.L. worked on reviewing and editing it. All authors have read and agreed to the published version of the manuscript.

Funding

This study did not receive any funding from external sources.

Data Availability Statement

The data cannot be accessed by the public due to non-disclosure agreements.

Conflicts of Interest

The authors have no conflicts of interest to declare.

References

  1. Smil, V. Energy and Civilization: A History—Vaclav Smil. Available online: https://vaclavsmil.com/2017/05/08/energy-and-civilization-a-history (accessed on 22 May 2024).
  2. Smil, V. What We Need to Know about the Pace of Decarbonization. Available online: https://www.schoolofpublicpolicy.sk.ca/documents/research/policy-briefs/jsgs-policybriefs-pace-of-decarbonization_web.pdf (accessed on 23 May 2024).
  3. United States Environmental Protection Agency. Global Greenhouse Gas Emissions Data. US Environmental Protection Agency. Available online: https://www.epa.gov/ghgemissions/global-greenhouse-gas-emissions-data (accessed on 20 January 2023).
  4. Hodgson, D.; Vass, T.; Levi, P.; Hugues, P. Industry—Analysis. IEA. Available online: https://www.iea.org/reports/industry (accessed on 28 January 2023).
  5. U.S. Environmental Protection Agency (EPA). Inventory of U.S. Greenhouse Gas Emissions and Sinks 1990–2018. 2020. Available online: https://www.epa.gov/sites/default/files/2020-04/documents/fastfacts-1990-2018.pdf (accessed on 28 January 2023).
  6. UNFCCC. The Paris Agreement. United Nations Framework Convention on Climate Change. Available online: https://unfccc.int/process-and-meetings/the-paris-agreement/the-paris-agreement (accessed on 20 January 2023).
  7. America’s Clean Energy Frontier: The Pathway to a Safer Climate Future. NRDC. Available online: https://www.nrdc.org/resources/americas-clean-energy-frontier-pathway-safer-climate-future (accessed on 23 January 2023).
  8. Nadel, S. Electrification in the Transportation, Buildings, and Industrial Sectors: A Review of Opportunities, Barriers, and Policies. Current Sustainable/Renewable Energy Reports 2019. Curr. Sustain./Renew. Energy Rep 2019, 6, 158–168. [Google Scholar] [CrossRef]
  9. Zuberi, M.J.S.; Hasanbeigi, A.; Morrow, W. Electrification of Industrial Boilers in the USA: Potentials, Challenges, and Policy Implications. Energy Effic. 2022, 15, 70. [Google Scholar] [CrossRef]
  10. Schoeneberger, C.; Zhang, J.; McMillan, C.; Dunn, J.B.; Masanet, E. Electrification Potential of U.S. Industrial Boilers and Assessment of the GHG Emissions Impact. Adv. Appl. Energy. 2022, 5, 100089. [Google Scholar] [CrossRef]
  11. EIA. Where Greenhouse Gases Come from—U.S. Energy Information Administration (EIA). Eia.gov. Available online: https://www.eia.gov/energyexplained/energy-and-the-environment/where-greenhouse-gases-come-from.php (accessed on 27 January 2023).
  12. Brown, T.W.; Bischof-Niemz, T.; Blok, K.; Breyer, C.; Lund, H.; Mathiesen, B.V. Response to “Burden of Proof: A Comprehensive Review of the Feasibility of 100% Renewable-Electricity Systems”. Renew. Sustain. Energy Rev. 2018, 92, 834–847. [Google Scholar] [CrossRef]
  13. Loftus, P.J.; Cohen, A.M.; Long, J.C.S.; Jenkins, J.D. A Critical Review of Global Decarbonization Scenarios: What Do They Tell Us about Feasibility? Wiley Interdiscip. Rev. Clim. Chang. 2014, 6, 93–112. [Google Scholar] [CrossRef]
  14. Manufacturing Thermal Energy Use in 2014|NREL Data Catalog. data.nrel.gov. Available online: https://data.nrel.gov/submissions/118 (accessed on 22 January 2023).
  15. Einstein, D.; Worrell, E.; Khrushch, M. Steam Systems in Industry: Energy Use and Energy Efficiency Improvement Potentials. 2001. eScholarship University of California. Available online: https://escholarship.org/uc/item/3m1781f1 (accessed on 22 January 2023).
  16. U.S. Dept. of Energy (DOE). Manufacturing Energy and Carbon Footprint. 2014 MECS. Sector: Forest Products (NAICS 321, 322). 2018. Available online: https://www.energy.gov/sites/prod/files/2018/10/f56/2014_mecs_forest_products_energy_footprint.pdf (accessed on 20 January 2023).
  17. U.S. Dept. of Energy (DOE). Manufacturing Energy and Carbon Footprint. 2014 MECS. Sector: Petroleum Refining (NAICS 324110). 2018. Available online: https://www.energy.gov/sites/prod/files/2018/10/f56/2014_mecs_petroleum_refining_energy_footprint.pdf (accessed on 28 January 2023).
  18. U.S. Dept. of Energy (DOE). Manufacturing Energy and Carbon Footprint. 2014 MECS. Sector: Chemicals (NAICS 325). 2018. Available online: https://www.energy.gov/sites/prod/files/2018/10/f56/2014_mecs_chemicals_energy_footprint_0.pdf (accessed on 13 January 2023).
  19. U.S. Dept. of Energy (DOE). Manufacturing Energy and Carbon Footprint. 2014 MECS. Sector: Iron and Steel (NAICS 331110, 3312). 2018. Available online: https://www.energy.gov/sites/prod/files/2018/10/f56/2014_mecs_iron_steel_energy_footprint.pdf (accessed on 3 February 2023).
  20. The White House. FACT SHEET: President Biden Sets 2030 Greenhouse Gas Pollution Reduction Target Aimed at Creating Good-Paying Union Jobs and Securing U.S. Leadership on Clean Energy Technologies. The White House. Available online: https://www.whitehouse.gov/briefing-room/statements-releases/2021/04/22/fact-sheet-president-biden-sets-2030-greenhouse-gas-pollution-reduction-target-aimed-at-creating-good-paying-union-jobs-and-securing-u-s-leadership-on-clean-energy-technologies/ (accessed on 4 January 2023).
  21. Abbasi, M.H.; Abdullah, B.; Ahmad, M.W.; Rostami, A.; Cullen, J. Heat Transition in the European Building Sector: Overview of the Heat Decarbonisation Practices through Heat Pump Technology. Sustain. Energy Technol. Assess 2021, 48, 101630. [Google Scholar] [CrossRef]
  22. Smith, M.; Bevacqua, A.; Tembe, S.; Lal, P. Life Cycle Analysis (LCA) of Residential Ground Source Heat Pump Systems: A Comparative Analysis of Energy Efficiency in New Jersey. Sustain. Energy Technol. Assess 2021, 47, 101364. [Google Scholar] [CrossRef]
  23. Rodrigues, A.L.; Seixas, S.R. Battery-Electric Buses and Their Implementation Barriers: Analysis and Prospects for Sustainability. Sustain. Energy Technol. Assess 2022, 51, 101896. [Google Scholar] [CrossRef]
  24. Hasanbeigi, A.; Kirshbaum, L.A.; Collison, B.; Gardiner, D. Electrifying U.S. Industry: Technology and Process-Based Approach to Decarbonization; Global Efficiency Intelligence: Tampa Bay, FL, USA, 2021; Available online: https://www.globalefficiencyintel.com/electrifying-us-industry (accessed on 28 January 2023).
  25. Madeddu, S.; Ueckerdt, F.; Pehl, M.; Peterseim, J.; Lord, M.; Kumar, K.A.; Krüger, C.; Luderer, G. The CO2 Reduction Potential for the European Industry via Direct Electrification of Heat Supply (Power-To-Heat). Environ. Res. Lett. 2020, 15, 124004. [Google Scholar] [CrossRef]
  26. Consumption & Efficiency—U.S. Energy Information Administration (EIA). www.eia.gov. Available online: https://www.eia.gov/consumption/manufacturing/data/201 (accessed on 28 January 2023).
  27. Bühler, F.; Müller Holm, F.; Elmegaard, B. Potentials for the Electrification of Industrial Processes in Denmark: 32nd International Conference on Efficiency, Cost, Optimization, Simulation and Environmental Impact of Energy Systems. In Proceedings of the ECOS 2019: 32nd International Conference on Efficiency, Cost, Optimization, Simulation and Environmental Impact of Energy Systems 2019; Available online: https://orbit.dtu.dk/files/189357718/ECOS2019_B_hler_Fabian_Article_for_proceedings_PDF.pdf (accessed on 27 January 2023).
  28. Wei, M.; McMillan, C.A.; de la Rue du Can, S. Electrification of Industry: Potential, Challenges and Outlook. Curr. Sustain. Renew. Energy Rep. 2019, 6, 140–148. [Google Scholar] [CrossRef]
  29. Heinen, S.; Mancarella, P.; O’Dwyer, C.; O’Malley, M. Heat Electrification: The Latest Research in Europe. IIEEE Power Energy Mag. 2018, 16, 69–78. [Google Scholar] [CrossRef]
  30. Wiertzema, H.; Åhman, M.; Harvey, S. Bottom-up Methodology for Assessing Electrification Options for Deep Decarbonisation of Industrial Processes: ECEEE Industrial Efficiency. ECEEE Ind. Summer Study Proc. 2018, 2018, 389–397. Available online: https://www.eceee.org/library/conference_proceedings/eceee_Industrial_Summer_Study/2018/4-technology-products-and-system-optimisation/bottom-up-methodology-for-assessing-electrification-options-for-deep-decarbonisation-of-industrial-processes/ (accessed on 22 January 2023).
  31. Lamon, E.; Raftery, P.; Schiavon, S. Boiler Retrofits and Decarbonization in Existing Buildings: HVAC Designer Interviews. Escholarship.Org. 2022. Available online: https://escholarship.org/uc/item/6k4369zv (accessed on 23 May 2024).
  32. Steinberg, D.; Bielen, D.; Eichman, J.; Eurek, K.; Logan, J.; Mai, T.; Mcmillan, C.; Parker, A.; Vimmerstedt, L.; Wilson, E. Electrification & Decarbonization: Exploring U.S. Energy Use and Greenhouse Gas Emissions in Scenarios with Widespread Electrification and Power Sector Decarbonization. 2017. Available online: https://www.nrel.gov/docs/fy17osti/68214.pdf (accessed on 25 January 2023).
  33. Jia, L.; Cheng, P.; Yu, Y.; Chen, S.; Wang, C.; He, L.; Nie, H.; Wang, J.; Zhang, J.; Fan, B.; et al. Regeneration Mechanism of a Novel High-Performance Biochar Mercury Adsorbent Directionally Modified by Multimetal Multilayer Loading. Environ. Manage. 2023, 326, 116790. [Google Scholar] [CrossRef]
  34. Schiro, F.; Stoppato, A.; Benato, A. Modelling and Analyzing the Impact of Hydrogen Enriched Natural Gas on Domestic Gas Boilers in a Decarbonization Perspective. Carbon Resour. Convers. 2020, 3, 122–129. [Google Scholar] [CrossRef]
  35. Regulagadda, P.; Dincer, I.; Naterer, G.F. Exergy Analysis of a Thermal Power Plant with Measured Boiler and Turbine Losses. Appl. Therm. Eng. 2010, 30, 970–976. [Google Scholar] [CrossRef]
  36. Kaya, D.; Eyidogan, M. Energy Conservation Opportunities in an Industrial Boiler System. J. Energy Eng. 2010, 136, 18–25. [Google Scholar] [CrossRef]
  37. Hasanuzzaman, M.D.; Rahim, N.A. (Eds.) Energy for Sustainable Development: Demand, Supply, Conversion and Management; Elsevier Academic Press: Cambridge, MA, USA, 2019; Available online: https://shop.elsevier.com/books/energy-for-sustainable-development/hasanuzzaman/978-0-12-814645-3 (accessed on 12 January 2023).
  38. Rightor, E.; Whitlock, A.; Elliott, R. Beneficial Electrification in Industry. 2020. Available online: https://www.aceee.org/sites/default/files/pdfs/ie2002.pdf (accessed on 12 January 2023).
  39. Lord, M. Zero Carbon Industry Plan: Electrifying Industry. Beyond Zero Emissions, Melbourne, Australia. 2018. Available online: https://bze.org.au/wp-content/uploads/2020/12/electrifying-industry-bze-report-2018.pdf (accessed on 26 January 2023).
  40. Larson, E. Net Zero America: Potential Pathways, Infrastructure, and Impacts; Princeton University: Princeton, NJ, USA, 2020; Available online: https://netzeroamerica.princeton.edu/img/Princeton_NZA_Interim_Report_15_Dec_2020_FINAL.pdf (accessed on 29 January 2023).
  41. Laubscher, R.; Rousseau, P. CFD Study of Pulverized Coal-Fired Boiler Evaporator and Radiant Superheaters at Varying Loads. Appl. Therm. Eng. 2019, 160, 114057. [Google Scholar] [CrossRef]
  42. von Bohnstein, M.; Richter, M.; Graeser, P.; Schiemann, M.; Ströhle, J.; Epple, B. 3D CFD Simulation of a 250 MWel Oxy-Fuel Boiler with Evaluation of Heat Radiation Calculation. Renew. Sustain. Energy Rev. 2021, 137, 110601. [Google Scholar] [CrossRef]
  43. Badur, J.; Ziółkowski, P.; Sławiński, D.; Kornet, S. An Approach for Estimation of Water Wall Degradation within Pulverized-Coal Boilers. Energy 2015, 92, 142–152. [Google Scholar] [CrossRef]
  44. Żymełka, P.; Nabagło, D.; Janda, T.; Madejski, P. Online Monitoring System of Air Distribution in Pulverized Coal-Fired Boiler Based on Numerical Modeling. Arch. Thermodyn. 2017, 38, 109–125. [Google Scholar] [CrossRef]
  45. Madejski, P.; Taler, D.; Taler, J. Modeling of Transient Operation of Steam Superheater in CFB Boiler. Energy 2019, 182, 965–974. [Google Scholar] [CrossRef]
  46. Zima, W. Simulation of Rapid Increase in the Steam Mass Flow Rate at a Supercritical Power Boiler Outlet. Energy 2019, 173, 995–1005. [Google Scholar] [CrossRef]
  47. Taler, J.; Zima, W.; Ocłoń, P.; Grądziel, S.; Taler, D.; Cebula, A.; Jaremkiewicz, M.; Korzeń, A.; Cisek, P.; Kaczmarski, K.; et al. Mathematical Model of a Supercritical Power Boiler for Simulating Rapid Changes in Boiler Thermal Loading. Energy 2019, 175, 580–592. [Google Scholar] [CrossRef]
  48. Chen, T.; Zhang, Y.; Liao, M.; Wang, W. Coupled Modeling of Combustion and Hydrodynamics for a Coal-Fired Supercritical Boiler. Fuel 2019, 240, 49–56. [Google Scholar] [CrossRef]
  49. Camaraza-Medina, Y.; Retirado-Mediaceja, Y.; Hernandez-Guerrero, A.; Luis Luviano-Ortiz, J. Energy Efficiency Indicators of the Steam Boiler in a Power Plant of Cuba. Therm. Sci. Eng. Prog 2021, 23, 100880. [Google Scholar] [CrossRef]
  50. Drosatos, P.; Nikolopoulos, N.; Kakaras, E. An In-House Built Code Incorporated into CFD Model for the Simulation of Boiler’s Convection Section. Fuel Process. Technol. 2020, 202, 106333. [Google Scholar] [CrossRef]
  51. Madejski, P. Numerical Study of a Large-Scale Pulverized Coal-Fired Boiler Operation Using CFD Modeling Based on the Probability Density Function Method. Appl. Therm. Eng. 2018, 145, 352–363. [Google Scholar] [CrossRef]
  52. Li, Z.; Miao, Z.; Shen, X.; Li, J. Prevention of Boiler Performance Degradation under Large Primary Air Ratio Scenario in a 660 MW Brown Coal Boiler. Energy 2018, 155, 474–483. [Google Scholar] [CrossRef]
  53. Ghaffari, A.; Chaibakhsh, A.; Lucas, C. Soft Computing Approach for Modeling Power Plant with a Once-through Boiler. Eng. Appl. Artif. Intell. 2007, 20, 809–819. [Google Scholar] [CrossRef]
  54. Wang, H.; Jin, D.; Liu, X.; Zhang, C. Analytical and Numerical Investigations on the High Temperature Upgrading Solution of Subcritical Boilers. Appl. Therm. Eng. 2022, 200, 117628. [Google Scholar] [CrossRef]
  55. Bennett, G.; Elwell, C. Effect of Boiler Oversizing on Efficiency: A Dynamic Simulation Study. Build. Serv. Eng. Res. Technol. 2020, 41, 709–726. [Google Scholar] [CrossRef]
  56. Zhang, Q.; Yi, H.; Yu, Z.; Gao, J.; Wang, X.; Lin, H.; Shen, B. Energy-Exergy Analysis and Energy Efficiency Improvement of Coal-Fired Industrial Boilers Based on Thermal Test Data. Appl. Therm. Eng. 2018, 144, 614–627. [Google Scholar] [CrossRef]
  57. Wang, Y.; Wang, M.; Liu, Y.; Yin, L.; Zhou, X.R.; Xu, J.F.; Zhang, X. Fuzzy Modeling of Boiler Efficiency in Power Plants. Inf. Sci. 2021, 542, 391–405. [Google Scholar] [CrossRef]
  58. Said, S.M.; Hamouda, A.S.; Mahmaoud, H.; Abd-Elwahab, S. Computer-Based Boiler Efficiency Improvement. Environ. Prog. Sustain. Energy 2019, 38, 13161. [Google Scholar] [CrossRef]
  59. Erbas, O. Investigation of Factors Affecting Thermal Performance in a Coal—Fired Boiler and Determination of Thermal Losses by Energy Balance Method. Case Stud. Therm. Eng. 2021, 26, 101047. [Google Scholar] [CrossRef]
  60. American Society Mechanical Engineering. PTC 4-2013 Fired Steam Generators; ASME: New York City, NY, USA, 2013. [Google Scholar]
  61. Wang, P.; Wang, C.; Du, Y.; Feng, Q.; Wang, Z.; Yao, W.; Liu, J.; Zhang, J.; Che, D. Experiments and Simulation on Co-Combustion of Semicoke and Coal in a Full-Scale Tangentially Fired Utility Boiler. Energy Fuels 2019, 33, 3012–3027. [Google Scholar] [CrossRef]
  62. Klačková, I.; Zajačko, I.; Lenhard, R.; Gritsuk, I.; Wiecek, D. Simulation of Wood Biomass Combustion in Hot Water Boiler. IOP Conf. Ser. Mater. Sci. Eng. 2020, 776, 012033. [Google Scholar] [CrossRef]
  63. University of Illinois Urbana-Champaign (UIUC). Lower and Higher Heating Values of Gas, Liquid and Solid Fuels. 2018. Available online: https://courses.engr.illinois.edu/npre470/sp2018/web/Lower_and_Higher_Heating_Values_of_Gas_Liquid_and_Solid_Fuels.pdf (accessed on 28 January 2023).
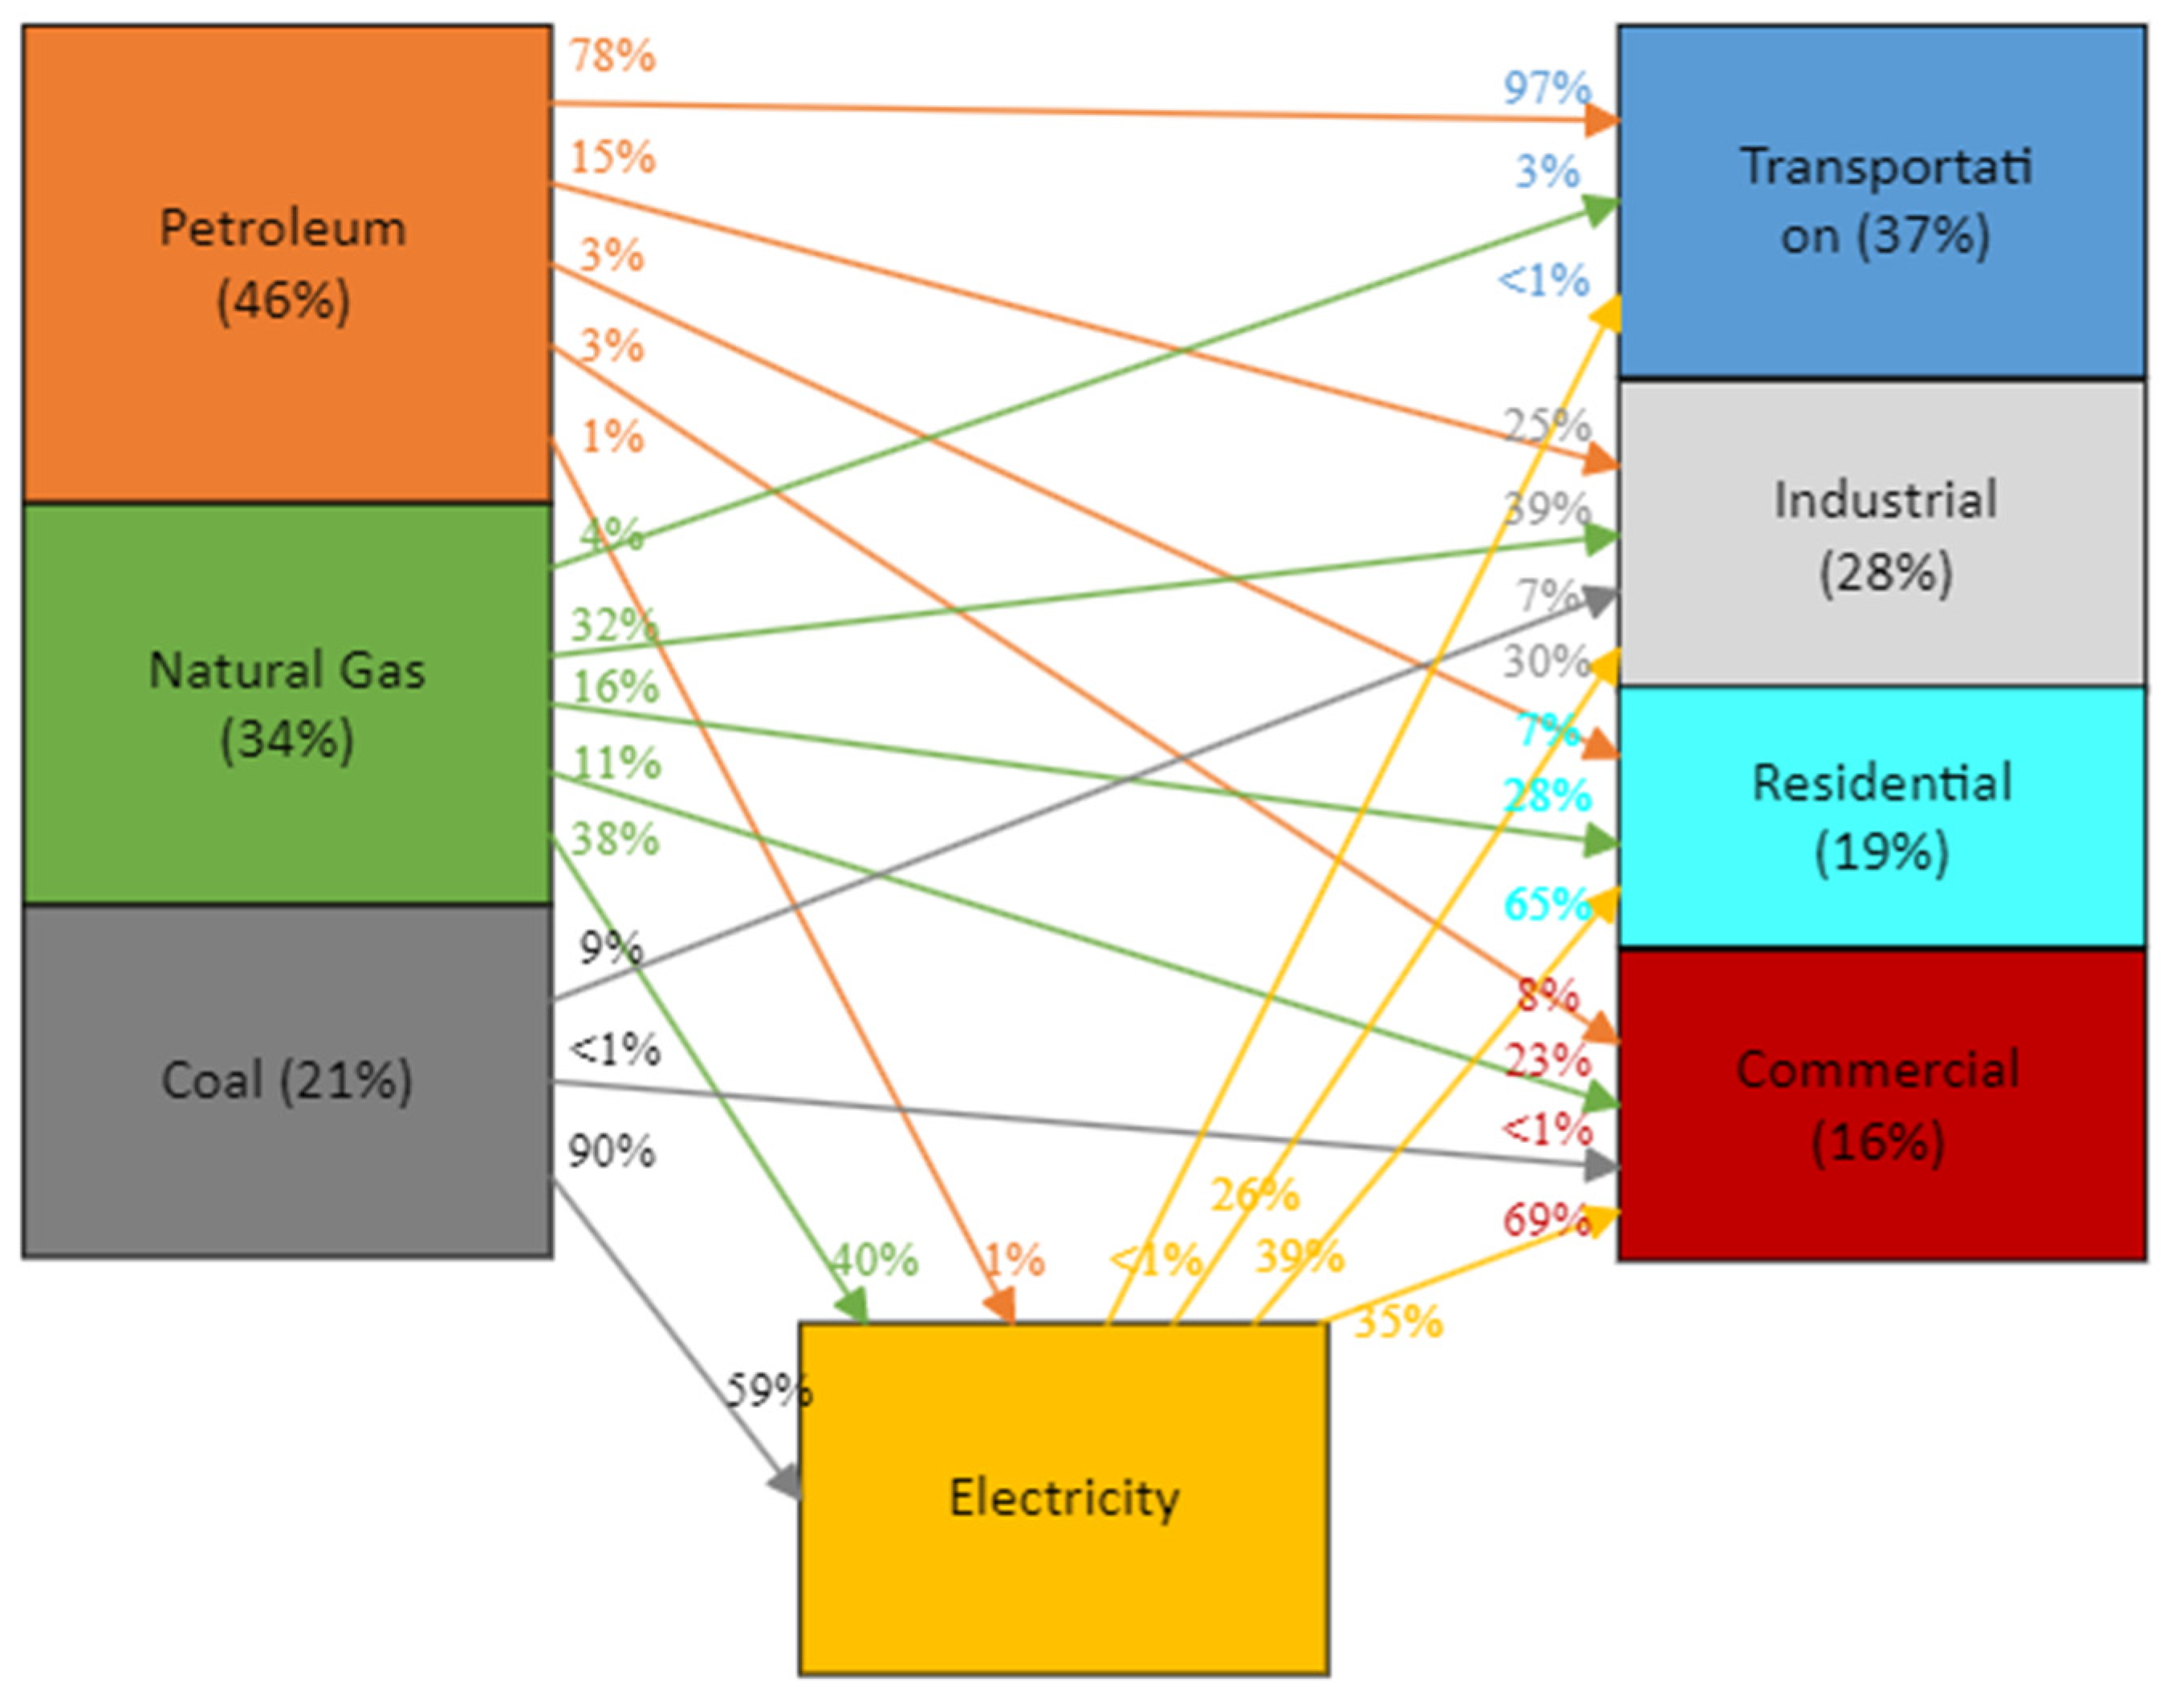
Figure 1. USA CO2 emissions from energy consumption by source and sector, 2021.
Energies 17 02882 g001
Figure 2. Model flow diagram.
Energies 17 02882 g002
Figure 3. Boiler heat energy flow.
Energies 17 02882 g003
Figure 4. Demand-side heat energy flow.
Energies 17 02882 g004
Figure 5. Input spreadsheet of the model (1 MMBtu/h = 293 kW).
Energies 17 02882 g005
Figure 6. Monthly energy usage pattern of actual and simulated data of Case I.
Energies 17 02882 g006
Figure 7. Monthly energy usage of Case I and Case II boilers.
Energies 17 02882 g007
Figure 8. (a) Annual CO2 emissions of Case I fossil-fuel boiler, (b) Annual CO2 emissions of Case II fossil-fuel boiler.
Energies 17 02882 g008
Figure 9. Comparison of Case I and Case II. (a) Annual energy comparison of Case I, (b) Annual energy comparison of Case II, (c) Annual CO2 emission comparison of Case I, (d) Annual CO2 emission comparison of Case II, (e) Annual energy cost comparison of Case I, (f) Annual energy cost comparison of Case II.
Energies 17 02882 g009aEnergies 17 02882 g009b
Figure 10. Five different cases. (a) Total energy usage of each case, (b)Total CO2 emissions from fossil-fuel Boiler in each case, (c) Maximum electrical capacity required to replace fossil-fuel boiler in each case.
Energies 17 02882 g010
Table 1. Higher heating values of fuels.
Higher Heating Value of FuelsBtu/lb 1
Natural Gas22,453
#2 Fuel Oil18,446
#6 Fuel Oil17,691
Typical Coal11,723
1 (1 Btu/lb = 2326 J/kg).
Table 2. Steam properties based on pressure.
Enthalpy, Btu/lb
Pressure, psiaTemp, FSaturated LiquidLatent HeatSteam
0.088632.020.001075.51075.5
0.135.023.031073.81076.8
0.245.4513.501067.91081.4
0.253.1621.221063.51084.7
0.364.4832.541057.11089.7
0.472.8740.921052.41093.3
0.579.5947.621048.61096.3
0.685.2253.251045.51098.7
0.790.0958.101042.71100.8
0.894.3862.391040.31102.6
0.998.2466.241038.11104.3
1.0101.7469.771036.11105.8
2.0126.0794.031022.11116.2
3.0141.47109.421013.21122.6
4.0152.96120.921006.41127.3
5.0162.24130.201000.91131.1
6.0170.05138.03996.21134.2
7.0176.84144.83992.11136.9
8.0182.86150.87988.51139.3
9.0188.27156.30985.11141.4
10.0193.21161.26982.11143.3
14.696212.00180.17970.31150.5
15.0213.03181.21969.71150.9
20.0227.96196.27960.11156.3
Table 3. Monthly energy usage of actual and simulated boilers in Case I.
MonthFacility Data (MMBtu/Month) 2Simulated Data (MMBtu/Month)Error Percentage
January13,95812,9107.51%
February14,12110,99422.14%
March943689585.06%
April59216662−12.50%
May37065445−46.91%
June177659366.61%
July124461150.94%
August149760959.32%
September18354109−123.89%
October31404963−58.04%
November93119472−1.73%
December91639591−4.67%
Total75,11074,9160.26%
2 (1 MMBtu = 293 kWh).
Table 4. Degree days value of Case I and Case II.
HDD of LocationCDD of Location
MonthCase ICase IICase ICase II
January867433010
February810302036
March5022811650
April27614252105
May12311142320
June01339470
July00459547
August00436423
September731237280
October781979686
November582340846
December596499217
Table 5. Annual summary of Case I boilers (1 MMBtu = 293 kWh).
Annual Summary of Fossil-Fuel Boiler of Case I
BoilerAnnual Energy Usage (MMBtu/yr)Annual Fuel Usage (lb/yr)Annual CO2 Emission (lb/yr)Annual Fuel Cost ($/yr)
Boiler 111,748523,2111,265,75364,730
Boiler 220,057893,3072,161,089110,516
Boiler 319,616873,6422,113,515108,084
Boiler 423,4981,046,5412,531,793129,474
Total74,9193,336,7028,072,150412,804
Table 6. Annual summary of Case II boilers (1 MMBtu = 293 kWh).
Annual Summary of Fossil-Fuel Boiler of Case II
BoilerAnnual Energy Usage (MMBtu/yr)Annual Fuel Usage (lb/yr)Annual CO2 Emission (lb/yr)Annual Fuel Cost ($/yr)
Boiler 19771435,1741,052,77353,838
Boiler 216,663742,1401,795,38491,815
Boiler 316,307726,2691,756,99089,851
Boiler 419,682876,5842,120,631108,447
Total62,4232,780,1666,725,778343,951
Disclaimer/Publisher’s Note: The statements, opinions and data contained in all publications are solely those of the individual author(s) and contributor(s) and not of MDPI and/or the editor(s). MDPI and/or the editor(s) disclaim responsibility for any injury to people or property resulting from any ideas, methods, instructions or products referred to in the content.