Abstract
In recent years, there has been a significant uptick in the integration of Inverter-Based Resources (IBRs) into the power grid, driven by the global shift toward renewable energy sources. The Western Electricity Coordinating Council (WECC) has developed standardized models for these inverters to facilitate their representation in system studies, playing a crucial role in evaluating IBRs, especially those modeled as grid-following inverters (GFLs). However, with the increasing prevalence of IBRs, the adjustment of grid interaction between grid-forming inverters (GFMs) and GFLs should be considered in terms of frequency stability assessment. This study investigates the optimization of synchronous generators and IBR operations in more detail. The IBR operation is evaluated with considerations for ratio and penetration. The findings suggest that with over 50% IBR penetration, GFL capacity should be reduced, and GFM capacity should be over 35% of IBR to maintain grid frequency stability. Moreover, this study also explains advanced prediction of frequency nadir, particularly the optimal ratio of WECC generic and GFM through the least squares method. Furthermore, the small-signal dynamic characteristics of WECC are studied at various gain values to investigate frequency droop control.
Keywords:
effective inertia; droop control; generic model; REPC_A; REEC_A; REGC_A; grid-forming control 1. Introduction
The spread of Inverter-Based Resources (IBRs) in the power system has accelerated significantly, owing to the global push for renewable energy sources. These resources, which include solar, wind, and battery storage, connect to the electrical grid through power electronic inverters [1]. According to [2], the swing characteristics, synchronization procedures, and grid interaction dynamics can be reconceptualized as a current-angle swing and a voltage-angle swing, also known as grid-forming (GFM) and grid-following (GFL).
The current environment of GFL inverters relies extensively on the grid’s frequency and voltage parameters as critical reference points for their operational functionality. While this method of operation has previously sufficed in systems dominated by conventional power plants, the introduction of high IBR penetration rates introduces variability and uncertainty, posing new issues [3]. Notably, the Western Electricity Coordinating Council (WECC) has worked hard to create generic models for these inverters, which may then be used as standard templates in complete system studies. These standardized models are important in assessing the impact of IBRs on grid stability and overall performance [4]. Nonetheless, given the increasing importance of IBRs in the energy mix, there is an urgent need to optimize their control systems, therefore improving grid dependability [5]. The controllers integrated into the WECC generic models are rigorously tuned to deal with these complications, with the goal of increasing IBR dynamic responsiveness and their ability to contribute to system inertia, fault tolerance, and frequency regulation [6]. In reference [7], the research focuses on developing and validating large-scale photovoltaic (PV) plants to investigate power system stability using general WECC models. Specific control models used include REPC_A, REEC_B, and REGC_A. However, the REEC_B model is no longer accessible and has been replaced by upgrades to either A-model or C-model control.
In the field of system dynamics and stability, the authors in reference [8] distributed GFM and GFL throughout a large number of locations, resulting in a significant adoption of IBRs. This study investigates the effects of GFM and GFL regulation on the behavior of large-scale transmission and distribution networks. The simulation is conducted through co-simulation and validated by utilizing high-performance computing resources to enable parallel simulation. Furthermore, the study evaluates the WECC generic model as a GFL. The outcome is dependent on the fact that while 100% of the GFL is under control, the IBRs will be limited to a particular percentage in order to ensure system stability. However, if 12% of the GFL is substituted with GFM, the IBRs can reach 100%. On the other hand, as stated in reference [9], the functioning of GFM and GFL is influenced by mechanical inertia, penetration of the IBR level, and its power limit operation, which are assessed in conjunction with small-signal stability. It is aligned with [10], which demonstrates the dynamic interaction between GFM and GFL in a 9-bus system through small-signal analysis. It is also analogous to [11]. However, it solely focuses on studying the varying levels using GFM and synchronous generators [12,13].
This study focuses on the IEEE 9-bus system, which serves as a simplified representation of an electric grid. According to various referenced studies, large-scale simulations can be streamlined through equivalent generator modeling. Based on this study [14], we can reduce the extensive model system into two main steps. First, classify generator types such as thermal, hydro, etc. Similar to the first step, the total load of each region is accumulated based on real grid information data. Furthermore, to demonstrate the effectiveness of the “equivalence” concept, real-time frequency monitoring developed by Oak Ridge National Laboratory (ORNL) is used for comparison. Additionally, another reference [15] shows an evaluation of how much an extensive system can be reduced to test systems; it explains this through a modified IEEE 9-bus system. This modification is made according to the real-world Western System Coordinating Council (WSCC) network system. According to the comparison between the equivalent generator and the real system [16], dynamic characteristics such as frequency nadir, recovery slope, and overshoot are consistent with measurement data from FNET/GridEye. The results show that the reduced model has a frequency response performance similar to the ERCOT system.
For instance, as detailed in [16], the Electric Reliability Council of Texas (ERCOT) simplifies its power system network interconnection in electromagnetic transient (EMT) software, which used PSCAD Version 4, by utilizing equivalent generation modeling, especially for generators with high capacities. Additionally, other studies cited [17,18] demonstrate that equivalent or reduced models yield similar responses, particularly in terms of grid frequency and voltage during contingency studies. Drawing from these references, we classify the grid network size as medium, with a total generation capacity of approximately 100 MW. Other considerations are for nine buses only because (EMT) simulations can become challenging when dealing with large-scale power systems with numerous buses due to computational limitations. As the number of buses increases, the complexity of the simulation grows exponentially, resulting in longer computation times and increased memory requirements.
The goal of this study is to provide detailed insights into the effectiveness of controllers utilized in WECC generic (RE-A) models compared to GFM inverter control methods. The methods are simulated across a range of high to low IBR penetrations, with varying inertia values, and retain the synchronous generator in the grid depending on the simulation scenario. This approach allows us to analyze the system’s response under a wide array of conditions not discussed in detail in previous references [8] due to the lack of inertia in the system’s variation. Moreover, the positive simulation results are validated with a small-signal parameter evaluation of GFL based on the WECC model, which previous references [10] did not discuss in detail. Simulations and stability tests are used to determine optimal control solutions for various inertia system conditions, whether there are many IBRs in the system or only a few. These aspects were not discussed in detail in previous references [13] due to the unavailability of case studies on full IBR penetration.
Lastly, we encompass a broader spectrum of grid parameters, such as variations in the capacity and inertia of synchronous generators. We propose determining the optimal GFM capacity through the application of the least squares method to simulation data fitting tools. According to multiple references [8,9,10,11,12,13], there is currently no existing methodology for determining the optimal GFM ratio using a fitting technique. Furthermore, our proposed fitting technique demonstrated a high level of consistency when compared to frequency analysis conducted through existing heuristic simulations. Additionally, we introduce a polynomial equation that forecasts the frequency nadir based on the inertia system value and the ratio between GFM and GFL. This equation also facilitates the evaluation of prediction accuracy via the Root Mean Square Error (RMSE) value. By adjusting and altering the high-order values between inertia and the GFM ratio, a third-order polynomial demonstrates a resilient response with minimal error values, suggesting that the prediction is remarkably accurate and closely corresponds to the observed data.
2. Frequency Support by Grid-Forming Control and WECC 2nd REGM
2.1. Inertia and Frequency Stability
The fluctuation in frequency is closely tied to the equilibrium between power supply and demand. An imbalance in this supply–demand relationship leads to variations in frequency. Following such variations, the frequency response characteristic typically undergoes three distinct stages, as illustrated in Figure 1. The straight line represents the frequency nadir of the system if considering the swing equation with improved inertia and RoCoF. The dash line indicates the frequency nadir before considering improvement. The initial stage, known as Arresting Periods or Inertia Response (IR), is marked by frequency fluctuations resulting from supply–demand imbalances, releasing stored energy in the rotor [19]. The subsequent stage is the Recovery Period, during which the frequency reaches its nadir and experiences a slight rebound due to governor response and other system characteristics like load behavior and voltage fluctuations. Moreover, it involves the restoration of the frequency to its normal value through generator re-dispatch. The alteration in power system frequency can be quantified using the swing equation, represented as follows [20,21]:
where denotes the inertia constant of the system, is the total generator capacity in the system, and is the initial frequency before the occurrence of the variation. The inertia constant of the system is the equivalent inertia constant, as defined by the following:
where is the inertia constant of the individual generator and is the capacity of the generator.
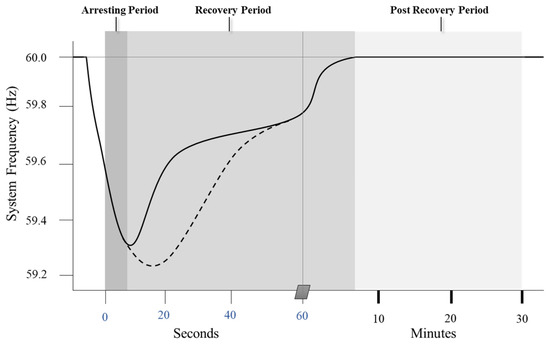
Figure 1.
Frequency response characteristic.
Both the frequency nadir and the Rate of Change of Frequency (RoCoF) play pivotal roles in determining system stability. A low-frequency nadir can prompt load shedding, while RoCoF is often regulated by grid codes in various countries. By bolstering the frequency nadir and managing RoCoF effectively, improvements in power system stability can be achieved, serving as a proactive measure to prevent load shedding.
2.2. Grid-Forming Control
The voltage-source inverter (VSI) operating as a grid-forming system controls output voltages to establish the reference voltage and frequency for the electrical network, as shown in Figure 2. Typically, a droop control method with characteristics akin to those of a traditional synchronous machine is employed [21]. The grid-forming VSI, utilizing the droop control approach, ensures a steady-state voltage and frequency, as outlined below [22]:
where f(t) is the common operation frequency, U(t) is the terminal voltage of the VSI, and are the rating frequency and voltage of the VSI, respectively, and are real and reactive power setpoints of the VSI, P(t) and Q(t) are real and reactive power outputs of the VSI, and and represent the static droop gain.
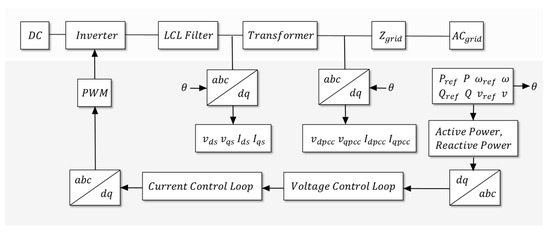
Figure 2.
Grid-forming inverter control.
Grid-forming inverters play a crucial role in the integration of renewable energy sources into the power grid. These inverters effectively manage the fluctuating output from sources such as solar panels and wind turbines, converting and conditioning the power to ensure compatibility with the grid. As cited in [23,24], grid-forming inverter (GFM) control offers various control strategies that can be implemented. Among these, droop-based control is commonly employed in simulations. The droop characteristics, as depicted in Figure 3a,b, adhere to the operational principles of traditional power plants, utilizing f(P) and U(Q) droops with a reversed relationship [25].
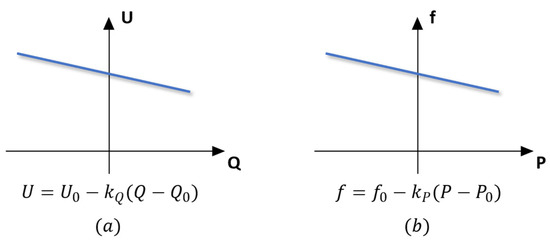
Figure 3.
(a) Voltage droop control responses; (b) Frequency droop control responses.
2.3. WECC Generic Model Control
Renewable energy sources are categorized as Inverter-Based Resources (IBRs) and are distinctively characterized by their low inertia, which can impact the stability of the electric power system. In response to this, the WECC Renewable Energy Modeling Task Force has developed advanced, second-generation dynamic models for renewable systems. These models are instrumental in conducting comprehensive interconnection studies of IBRs, ensuring an accurate representation of Bulk Power System (BPS) dynamics [5,26,27]. As depicted in Figure 4, the Renewable Energy Generic Model, meticulously developed by WECC, serves as an encompassing framework crucial for gaining insights into the intricate dynamics of Inverter-Based Resources (IBRs) within power systems. This model comprises three fundamental components: the renewable energy converter model, the electrical model, and the plant model [28,29]. Together, these elements furnish operators and planners with a sophisticated toolkit to meticulously evaluate the nuanced impact of IBRs on critical aspects such as grid stability, power quality, and the seamless integration of renewable energy sources. At the core of this comprehensive framework lies the pivotal Renewable Energy Plant Controller (REPC), a dynamic entity within renewable energy power plants. The REPC harnesses an array of control functions and algorithms, intricately designed to orchestrate and optimize various facets of power generation and grid integration within the realm of renewable energy. As evidenced in Figure 5, the active power application of the IBR model is extensively discussed in reference. Embedded within the domain of electrical control, REPC assumes a pivotal role by dynamically adjusting the setpoints. This orchestrates a meticulous interplay with the Renewable Energy Electrical Converter (REEC), which, in turn, transforms these setpoints into tangible current values [30]. The complexity of this process is further accentuated as it takes into consideration the implementation of current limiters based on voltage and priority settings, underscoring a commitment to precision and adaptability within the control framework.
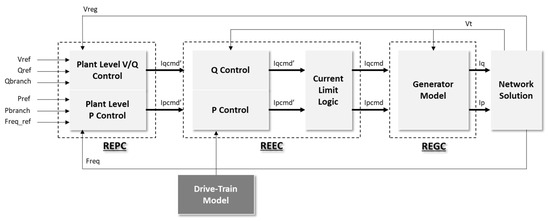
Figure 4.
WECC 2nd Renewable Energy Generic Model.
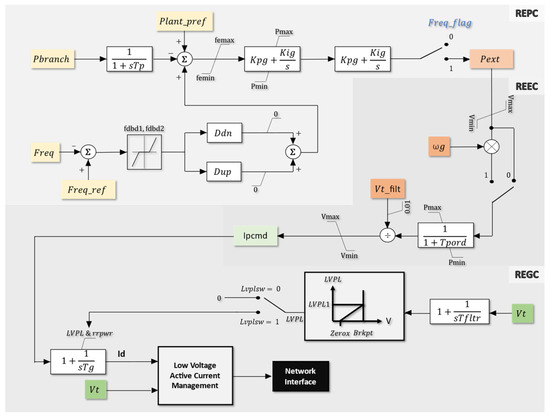
Figure 5.
Active power loop control of REGM.
Adding an additional layer of sophistication to this intricate control ecosystem is the Renewable Energy Generator Controller (REGC), a central entity adept at astutely managing the conversion value. This is achieved through the judicious adjustment of the converter’s time constant, introducing a dynamic element that fine-tunes the responsiveness and efficiency of the entire system [31]. The careful calibration of these control parameters within the REGC showcases a commitment to not only optimizing power generation from renewable sources but also ensuring a seamlessly integrated and resilient presence within the broader power grid. In essence, this multifaceted control architecture, with the interplay of the REPC, REEC, and REGC, not only maximizes the efficiency of renewable energy generation but also facilitates the harmonious integration of these resources into the larger power grid [6,32,33]. The deliberate consideration of current limiters, voltage dependencies, and time constants underscores a commitment to adaptability and precision, ultimately contributing significantly to the resilience and sustainability of the overarching energy infrastructure.
3. Small-Signal Stability Analysis
As a reference [34], this study delves into the analysis of grid stability within the Renewable Energy Generic Model (REGM). A key focus of the investigation is the incorporation of active power loop control, revealing that such control mechanisms have the potential to significantly enhance frequency stability, particularly in challenging islanding conditions. Building upon this foundation, the study goes on to offer an in-depth exploration of stability analysis, providing meticulous attention to the various parameters associated with active power loop control. Notably, the examination scrutinizes elements such as droop and proportional–integral control within the broader framework of plant control, offering a nuanced understanding of their impact on system stability.
To assess the frequency stability of the REGM, the study employs a System Frequency Response (SFR). This analytical approach offers a comprehensive perspective on the dynamic behavior of the system under varying conditions. Reference [35] complements this analysis with a detailed exposition on a simplified SFR model applied specifically to the converter. Within this context, Equation (7) serves as a pivotal element, elucidating the intricate relationships between the plant-level control mechanisms implemented in the REGM and the resultant frequency response. In summary, this study not only scrutinizes the grid stability of the REGM but also provides a nuanced understanding of how active power loop control, with a detailed consideration of its parameters, influences frequency stability. The incorporation of System Frequency Response and the detailed model presented in reference [35] enriches the analysis, offering valuable insights into the complex dynamics of the power system.
where is the inertia value of the system, is the power controller lag time constant, is the droop coefficient for headroom reserve control, and R(s) is calculated from the power deviation between the branch and the reference value and is explained through Equation (8).
Utilizing the provided equations, an in-depth analysis of the small-signal behavior of the REGM can be conducted. This involves simulating various parameters, including droop coefficients related to headroom reserve control and proportional–integral control parameters. The simulation process entails systematically adjusting these parameters to observe their impact on the small-signal dynamics of the REGM. Specifically, the exploration involves scrutinizing the droop coefficients’ influence on the system’s responsiveness to changes in operating conditions. Additionally, the study focuses on understanding the role of proportional–integral control parameters in shaping the small-signal response of the system.
In Figure 6, a noteworthy observation emerges: as the parameter decreases, there is a discernible shift of the pole point to the right side. This indicates that, under low droop coefficient headroom reserve control, the pole of the plant control (REPC-A) resides within the unstable region. This positioning raises concerns about the system’s stability, particularly when operating with lower values of the droop coefficient for headroom reserve control. Conversely, an increase in leads to an observable movement of the pole point to the upper side. It is essential to carefully choose and tune the droop coefficient to maintain stability in the system, as indicated by the pole-zero map analysis. Further analysis or tuning may be necessary to find an optimal range for the droop coefficient.
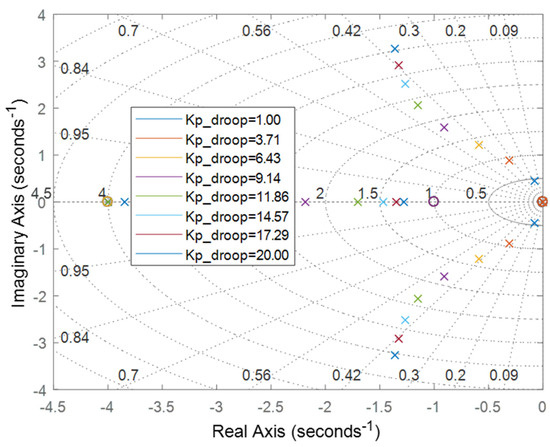
Figure 6.
Pole-zero map of the droop coefficient for headroom reserve control.
This shift could potentially give rise to overshoot issues if not accompanied by appropriate adjustment values. The implications of this movement highlight the delicate balance required in adjusting the droop coefficient for headroom reserve control. Insufficient values risk instability, while excessive values may introduce overshooting problems. This analysis underscores the importance of carefully tuning the parameter within the plant control system. Finding an optimal balance is crucial to ensuring the stability and performance of the REGM (REPC-A). The insights derived from this observation contribute to a deeper understanding of the dynamic behavior of the system under varying droop coefficient conditions.
Examining Figure 7 reveals a distinctive trend: as the parameter increases, there is a clear shift of the pole point toward the right side. This shift signifies that, under high integral gain conditions, the pole of the plant control (REPC-A) is positioned within the unstable region. This observation raises significant concerns regarding system stability, particularly when operating with elevated integral gain values. The relocation of the pole to the right side highlights the intricate balance required within the plant control system. Elevated integral gain values have the potential to induce instability, posing challenges to the overall performance of the REGM (REPC-A). The dynamic response, illustrated by the movement of the pole, underscores the sensitivity of the control system to variations in the integral gain parameter. As described in Figure 8, this insight underscores the critical importance of meticulous tuning of the parameter within the plant control system.
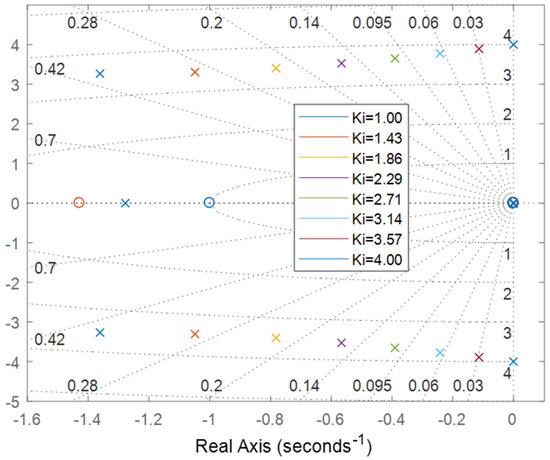
Figure 7.
Pole-zero map of the integral gain coefficient for headroom reserve control.
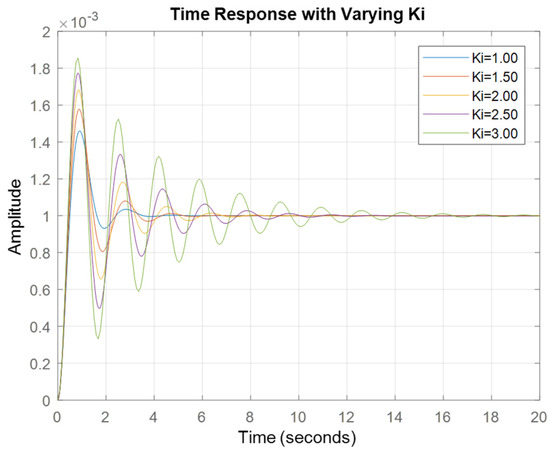
Figure 8.
Step response of frequency in the time domain with varying integral gain.
4. Simulation Results
PSCAD with the IEEE 9-bus test system is used to verify these models, with a detailed explanation of the test system and scenarios provided in Appendix A. The fundamental reason for proposing PSCAD Version 5 (EMT software) is its pivotal role in power system modeling and control, offering indispensable capabilities for engineers navigating the intricacies of electrical grids. Unlike RMS (Root Mean Square) software such as PSSE Version 33, which predominantly focuses on steady-state analysis, EMT software specializes in capturing the nuances of transient events and electromagnetic phenomena with unparalleled accuracy. This precision is crucial for comprehending system behavior during rapid transients, fault occurrences, and dynamic responses to disturbances.
Furthermore, as mentioned in the first section, PSCAD (EMT software) is renowned for its robustness in capturing system responses during transient periods. However, it encounters limitations when dealing with large network sizes due to computational constraints, leading to longer computation times and increased memory requirements. One fundamental reason behind this limitation lies in the nature of EMT simulations. EMT simulations necessitate small time steps to accurately capture fast-changing phenomena, such as transient events and electromagnetic transients. As the size of the simulated network increases, the number of system components and interactions grows exponentially, demanding finer time steps to maintain accuracy. Consequently, this exponentially increases the computational burden and memory requirements, making simulations of large bus systems impractical with conventional computational resources. Despite its prowess in capturing transient behavior, this inherent limitation of EMT simulations underscores the need for careful consideration of system size and computational resources when utilizing PSCAD/EMT for power system analysis and design.
WECC Generic Model with Droop Validation
In Figure 9, the frequency response graph provides a dynamic representation of how the system’s frequency evolves over time following a disturbance. Each line on the graph, distinguished by different colors, corresponds to specific droop settings, ranging from 1% to 5%, in addition to a scenario where droop control is not applied. Droop control, a sophisticated method widely employed in power systems, plays a crucial role in stabilizing frequency by adjusting the power output of generators in response to fluctuations in frequency. Examining the graph in detail, it becomes apparent that as the droop setting increases, the system’s frequency exhibits a more rapid recovery to its nominal value after the initial dip. The line representing the system with a 5% droop setting stands out, showing the least deviation and the quickest recovery, closely followed by the 4% setting, and so on. This progression underscores the incremental effectiveness of higher droop settings in enhancing the system’s frequency stability. Conversely, the scenario labeled “Without Droop” starkly contrasts with the controlled settings, revealing a more substantial frequency deviation. This stark difference emphasizes the vital role played by droop control in dampening frequency swings and expediting the return of the system to its nominal frequency. The visual representation in Figure 9 serves as a compelling testament to the efficacy of droop control mechanisms in ensuring the stability and resilience of power systems. In the realm of droop control, elevating the droop settings results in a more rapid and prominent surge in active power, thereby enhancing the pace of frequency restoration, as depicted in Figure 10. Conversely, the absence of droop control in the system results in a delayed and less efficient response in active power, consequently leading to subpar frequency recovery.
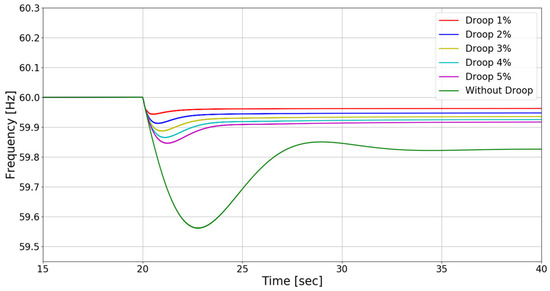
Figure 9.
Frequency response post-disturbance.
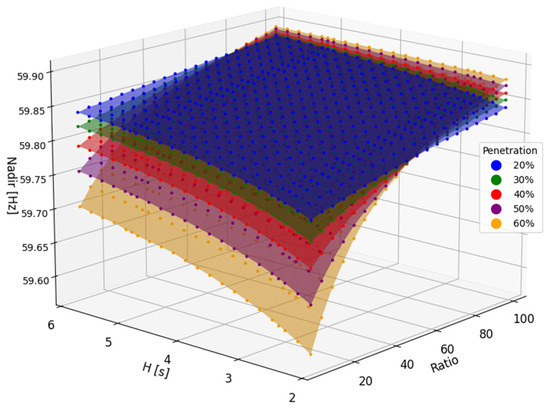
Figure 10.
Frequency nadir of inertia and RES consideration with five penetration cases.
As the renewable energy penetration within the system undergoes a gradual reduction from 60% to 20%, a discernible trend emerges, revealing a noteworthy enhancement in frequency stability. This unfolding pattern provides a nuanced glimpse into the intricate dynamics governing the power grid, underscoring the evolving relationship between conventional and renewable energy sources. The observed improvement implies a lasting influence of traditional synchronous generators, which, despite yielding precedence to the ascendancy of renewable sources, continue to exert a substantial impact on the overall stability of the system. This transitional phase invites a deeper exploration of the harmonious coexistence and collaboration between these disparate energy components, unraveling the subtleties of their interplay. Delving into the intricate fabric of system components, an intriguing narrative unfolds concerning the ratio between grid-forming and WECC generic models. Particularly intriguing is the subtlety of this ratio’s impact at lower levels of renewable penetration, suggesting an inherent adaptability and resilience in the face of changing energy landscapes. This resilience appears to be rooted in the sophisticated capabilities of grid-forming inverters, which showcase a remarkable ability to sustain system stability even amidst a less challenging renewable energy environment. As renewable penetration intensifies, the proportional influence of this ratio gains prominence, signifying an adaptive equilibrium between grid-forming technologies and the evolving energy matrix.
Additionally, the diminishing effect of inertia on frequency stability at lower renewable penetrations introduces a captivating layer of analysis. This trend, which may be attributed to the reduced necessity for synthetic inertia or rapid frequency response mechanisms in environments with lower renewable energy shares, underscores the sustained contribution of synchronous generators to the system’s intrinsic resilience. The comprehensive elucidation of these intricate dynamics, spanning the spectrum of renewable penetrations, is meticulously documented in Figure 10. These visual representations offer a granular exploration of the multifaceted relationship between renewable energy integration, the enduring role of synchronous generators, the nuanced influence of grid-forming models, and the evolving significance of inertia in shaping the intricate landscape of system frequency stability. Such a detailed analysis provides valuable insights into the adaptive responses and collaborative dynamics that characterize the evolving power grid in the face of changing energy paradigms.
Droop control within WECC Generic Models is tailored to regulate output power in reaction to deviations in frequency. Figure 11 provides a comparison illustrating the variance in frequency nadir response with a 1% droop, indicating superior performance compared to scenarios with higher droop settings, particularly when considering the penetration of Inverter-Based Resources (IBRs).
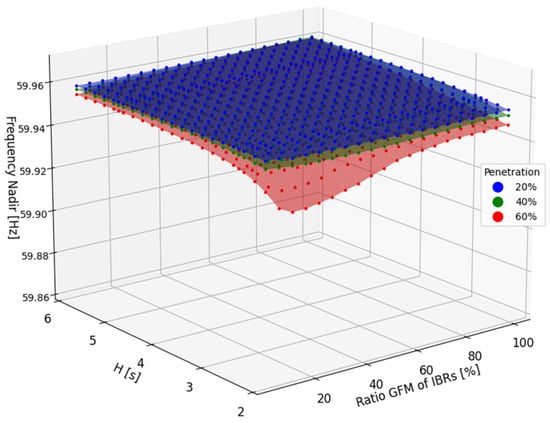
Figure 11.
Frequency nadir with consideration of inertia and GFM ratios with IBR penetration variations for droop 1%.
In contexts of high inertia, it suggests a greater proportion of traditional synchronous generation in relation to the overall generation capacity, thereby fostering a stabilizing influence. In such scenarios, where the ratio of GFM inverters is low, the frequency response primarily relies on the inertia of synchronous generators. The substantial inertia enables these generators to absorb disturbances more effectively, resulting in reduced fluctuations in the frequency nadir across different droop settings. Essentially, the high inertia mitigates the impact of droop settings on frequency response. However, when IBR penetration reaches 60% with low inertia and a low ratio of GFM control, the frequency nadir becomes vulnerable. Furthermore, with a 1% droop, the injected power aligned with the droop control appears to reach a saturation point around 59.96 Hz. This saturation is attributed to the bandwidth of the droop control, set at 0.036 Hz.
At lower inertia levels, the system exhibits heightened sensitivity to these adjustments, amplifying the discernible effects of various droop settings. Low-droop settings have the potential to elevate and render system frequencies fluctuant due to heightened sensitivity toward power imbalances. Figure 12 and Figure 13 illustrate different scenarios of Inverter-Based Resource (IBR) penetration variations alongside droop settings of 3% and 5%. In particular, Figure 12 highlights that a low-droop setting results in significant power output changes in response to minor frequency deviations. This aggressive control response may impede the system’s ability to attain a new equilibrium, particularly when confronted with fluctuations in load conditions or disturbances. Conversely, a larger droop value signifies less fluctuation in power output for a given frequency deviation, yet it may result in larger frequency deviations overall. On the other hand, a smaller droop value triggers more substantial changes in power output for a given frequency deviation, with the aim of aggressively stabilizing the frequency.
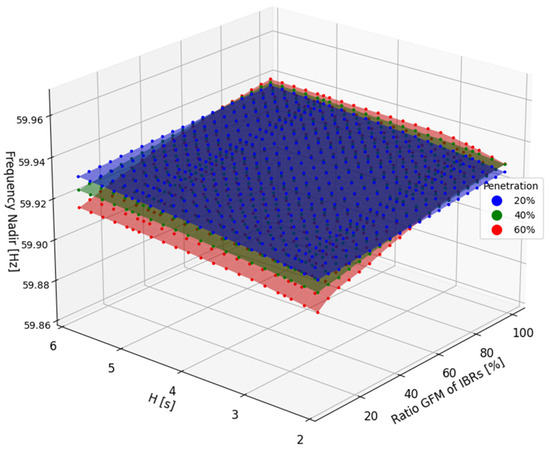
Figure 12.
Frequency nadir with consideration of inertia and GFM ratios with IBR penetration variations for 3% droop.
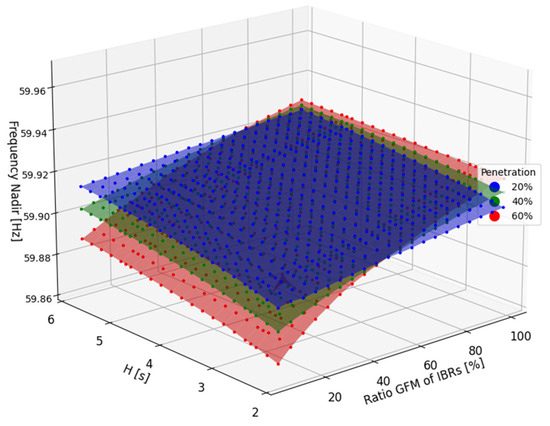
Figure 13.
Frequency nadir with consideration of inertia and GFM ratios with IBR penetration variations for 5% droop.
In Figure 14, which presents a comparison between frequency nadir and GFM ratios at various IBR penetration levels, we observe that even with a droop setting of 3%, GFM control can still improve the system’s frequency nadir. With an IBR penetration of 20%, the frequency nadir tends to become more pronounced and stable, even if the grid-forming mode (GFM) is in a lower ratio compared to the grid-following mode (GFL). As the penetration level increases, more sensitive responses are observed. For instance, with an IBR penetration of 60%, the frequency nadir improves when the GFM ratio exceeds that of GFL. However, this also impacts the system’s aggressiveness. Consequently, when the GFM ratio is lower, the frequency nadir decreases accordingly.
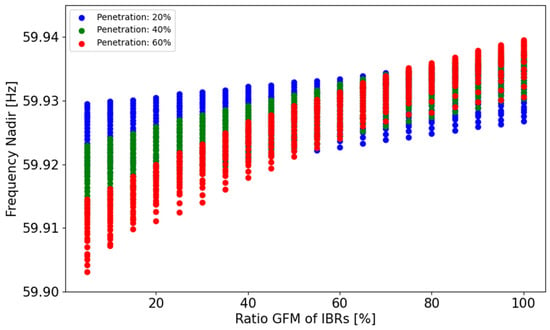
Figure 14.
Frequency nadir and GFM ratio comparison graph for WECC 3% droop.
5. Calculating GFM Capacity for Grid-Frequency Stabilization
5.1. Linear and Nonlinearization for GFM Optimal Capacity Estimation
As renewable energy integration grows, stability concerns become increasingly prominent within grid operations. Section 4 of our analysis sheds light on critical scenarios where Inertia-Based Response (IBR) penetration reaches 60%, accompanied by a small proportion of the grid-forming inverter (GFM) rate, resulting in frequency dips below the crucial 59.7 Hz threshold—a telltale sign of potential instability. Notably, Figure 15 vividly illustrates how, at 50% IBR penetration, the susceptibility of grid frequency destabilization escalates after contingencies arise, particularly in situations characterized by low inertia and GFM rates. To proactively address this risk, our analysis systematically identifies cases failing to meet stability criteria. Subsequently, both linear and nonlinear adjustments are meticulously employed to ensure compatibility, as visually depicted in Figure 16. Our investigation delves deeply into elucidating the intricate relationship between variable H and the corresponding GFM rates through sophisticated polynomial curve fitting. This method aims to discern the most accurate polynomial function that effectively captures the observed data points, revealing subtle trends in how variations in H influence GFM rates. By fitting polynomial models to empirical data, our analysis aims to uncover underlying patterns and facilitate precise predictions under diverse operational conditions. Additionally, drawing insights from a pertinent study [36], we explore a variant of the least squares method that proves invaluable for estimating critical grid parameters, including inertia, damping, and mechanical power.
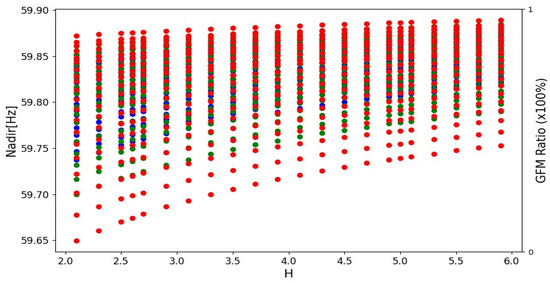
Figure 15.
Frequency nadir and GFM ratio comparison for WECC without droop.
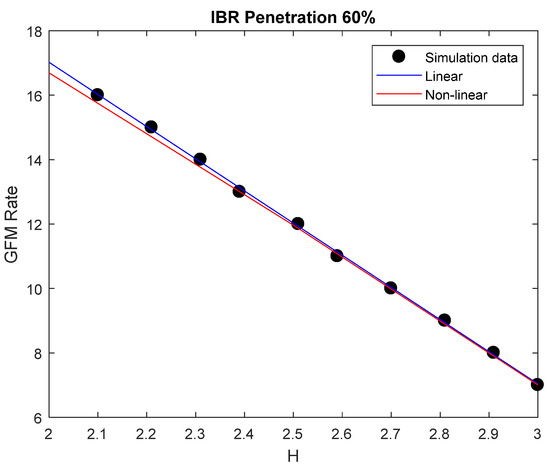
Figure 16.
Linearizing and de-linearizing data for 60% IBR penetration.
5.2. Formalizing the Frequency Nadir Equation Based on Renewable Penetration Rate
After evaluating the feasibility of the data formulation using both linear and nonlinear graphs, we proceeded with formulating the complete dataset. Data fitting was conducted for renewable energy inputs of 60%, employing quadratic fitting on both the X-axis and Y-axis to ensure the usability and consistency of the frequency nadir formula. Consequently, we proceeded to the next step, taking into account the appropriate error rate and formula usability. Examining various polynomial orders enables capturing different levels of complexity in the relationship between H and GFM rate. As illustrated in Figure 17, the interpretation of results involves assessing the coefficients of the fitted polynomial models and evaluating goodness-of-fit measures to understand how well the models explain the observed variation in GFM rate. Ultimately, this analysis is instrumental in optimizing system performance, predicting system behavior under varying conditions, and making informed decisions about the GFM rate.
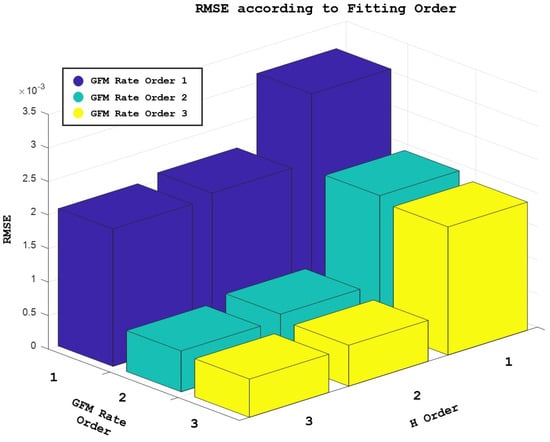
Figure 17.
RMSE of frequency nadir based on grid-forming rate and inertia.
Root Mean Square Error (RMSE) is used to evaluate the performance of a predictive model because of RMSE offers a comprehensive assessment of a model’s accuracy by considering the magnitude of errors across all data points. This holistic approach accounts for both the direction and magnitude of discrepancies between predicted and observed values, providing a thorough evaluation of model performance. Additionally, RMSE generates a standardized metric that facilitates straightforward comparisons across different datasets or between various models. Its sensitivity to outliers ensures that extreme prediction errors are appropriately accounted for, making RMSE particularly useful for identifying and addressing outliers in the data. Moreover, RMSE is commonly used as an objective function in optimization algorithms, allowing practitioners to fine-tune model parameters or select the best-performing model from a pool of candidates. Its intuitive interpretation further enhances its utility, with lower RMSE values indicating better model performance and closer agreement between predicted and observed values. Overall, RMSE’s versatility and effectiveness make it a widely accepted and valuable tool for evaluating and improving predictive modeling techniques across diverse applications and industries. RMSE’s utility extends beyond model evaluation; it also aids in model development and refinement. By serving as an objective function in optimization algorithms, RMSE enables practitioners to fine-tune model parameters or select the most suitable model from a range of candidates. Its intuitive interpretation simplifies decision-making processes, with lower RMSE values signaling superior model performance and closer alignment between predicted and observed values.
Higher-order polynomials offer greater flexibility in capturing complex patterns within data compared to lower-order polynomials or linear models. As illustrated in Figure 18, when the relationship between variables is nonlinear, such as exhibiting curves or peaks, lower-order polynomials may struggle to accurately represent these complexities. In contrast, higher-order polynomials introduce additional terms, allowing the model to bend and flex in ways that better match the intricacies of the data, as described in Figure 19.
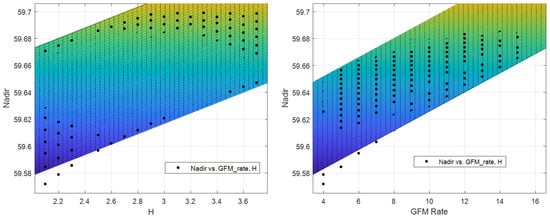
Figure 18.
Characteristics of bend curve of low-order polynomial.
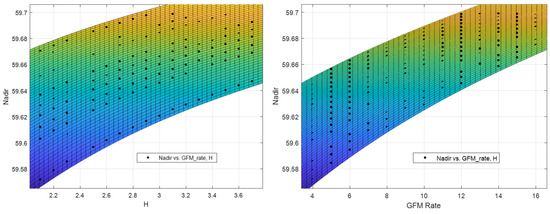
Figure 19.
Characteristics of bend curve of high-order polynomial.
This increased flexibility enables higher-order polynomials to more effectively mold themselves around scattered data points, thereby capturing the underlying relationships more accurately. Moreover, by accommodating these complexities, higher-order polynomials can mitigate biases that may arise from using simpler models. Linear models and lower-order polynomials, constrained by their simplicity, may fail to capture the full intricacies of the relationship, leading to biased predictions. However, higher-order polynomials, with their increased complexity, can better fit the data, resulting in less biased predictions. Nonetheless, while higher-order polynomials can reduce bias by closely fitting the data, it is essential to guard against overfitting, where the model captures noise rather than true patterns. Achieving a balance between bias and variance is critical for developing models that generalize well to new, unseen data.
In terms of polynomial order equal to one, a polynomial equation could be described through Equation (9).
where is the first coefficient with a value equal to 59.65, is the second coefficient with a value equal to 0.02529, and is the third coefficient with a value equivalent to 0.01873. Furthermore, this value is achieved through the optimal minimum RMSE value. As explained in the first paragraph of this section, a high polynomial order could reduce the RMSE value. Furthermore, polynomial order three could be described through Equation (10).
where is 59.66, is 0.02408, is 0.01756, is −0.002128, is −0.002598, is −0.002053, is 0.0002723, is 0.0003885, is 0.0004193, and is 0.0002911. According to this least squares method, we can predict the frequency nadir value for unseen data or various scenarios. Furthermore, the inclusion of higher-order polynomial terms allows for a more comprehensive representation of the underlying relationship between variables. This enhanced model versatility enables us to anticipate and mitigate potential frequency nadir occurrences in diverse operational scenarios. High-order polynomials, as represented by this equation, have the capability to capture all the nuances within the data and diminish bias concerning frequency nadir. Elevated bias levels pose a significant risk to grid stability, particularly when there is an imbalance between the grid-forming ratio and the existing inertia system. In the absence of proper equilibrium, the grid runs the risk of experiencing a blackout scenario.
6. Conclusions
This study aimed to evaluate the impacts of IBR penetration on grid stability, focusing on GFM and GFL using the WECC generic model. Additionally, the study was analyzed through PSCAD (EMT software) for advanced transient analysis, incorporating the generator equivalent concept to describe large-scale IBR penetration into the grid. Various grid parameters, such as inertia, IBR penetration, and GFM−GFL ratio, were proposed to determine the optimal GFM capacity ratio using the least squares method in power system operations. The simulation results confirm that while GFL inverters with grid support functions can provide limited frequency support, especially when IBR penetration exceeds 50%, the combined effect of small-scale GFM inverters can significantly enhance the primary frequency response of the bulk power grid. The conclusion emphasizes the relationship between IBR penetration rates, system inertia settings, and their impacts on grid stability. It addresses the specific aspects of penetration and inertia variations, covering the objectives, results, limitations, and future research directions related to these factors. Moreover, the study suggests that if IBR penetration reaches 60%, limiting the proportion of GFL inverters to around 35% is necessary to maintain system stability. The developed least squares method equation can also predict frequency nadir in large-scale simulations by varying system inertia and GFM ratios. For future research, various outer loop grid-forming control strategies should be explored to mitigate operational challenges in weak grids.
Author Contributions
Conceptualization, A.P., U.F.R., D.K. and M.Y.; investigation, A.P. and U.F.R.; methodology, A.P., U.F.R., D.K. and M.Y.; software, A.P. and U.F.R.; validation, D.H. and M.Y.; visualization, A.P., U.F.R., D.K. and M.Y.; supervision, M.Y.; writing—original draft preparation, A.P. and U.F.R.; writing—review and editing, A.P., U.F.R., D.H. and M.Y. All authors have read and agreed to the published version of the manuscript.
Funding
This work was supported by the Korea Electric Power Corporation grant (R22XO05-02) and the Research Resettlement Fund for the new faculty of Kwangwoon University in 2022.
Data Availability Statement
The original contributions presented in the study are included in the article, further inquiries can be directed to the corresponding author.
Conflicts of Interest
Author Donghwi Kim was employed by the company Samsung Electronics. The remaining authors declare that the research was conducted in the absence of any commercial or financial relationships that could be construed as a potential conflict of interest.
Appendix A
A test network for renewable power sources will be established, featuring synchronous generators, GFL, and GFM as power generation sources. System operations will be conducted, and various simulations will be performed under diverse system conditions. These simulations will consider factors such as the penetration rate of renewable power generation sources, the inertia of synchronous generators, and the GFL−GFM ratio, as illustrated in Figure A1. Numerous case studies will be undertaken to record nadirs resulting from generator failure N-1 phase static accidents, considering various parameter conditions and GFM ratios. A 3D graph will be created to visualize trends. Subsequently, cases meeting the N-1 assumed accident stability standard of 59.7 Hz will be organized, and the optimal GFM rate capable of ensuring stability will be determined. This determination will be based on the formulation derived from data on several cases. Through this process, the GFM capacity meeting the stability criteria can be identified according to Table A1. Moreover, an explanation of the variation scenario test system is described in Table A2.
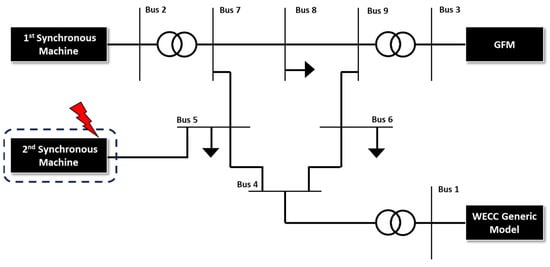
Figure A1.
IEEE 9-bus test system.

Table A1.
Generator model capacities in the simplified model.
Table A1.
Generator model capacities in the simplified model.
| System Configuration | |||
|---|---|---|---|
| 150 [MW] | |||
| 100 [MW] | |||
| 20 [MW] | |||
| 20 [MW] | 154 [kV] | ||

Table A2.
Variation of scenarios.
Table A2.
Variation of scenarios.
| Parameter Scenario | Value |
|---|---|
| Capacity [MVA] | 100 |
| Reserve Power [%] | 3 |
| Generator Trip [MVA] | 3 |
| Inertia Synchronous Machine | 2–6 s |
| GFL/GFM Ratio [%] | 0–100 |
| Renewable Energy Penetration Rate [%] | 20–60 |
References
- Wang, X.; Taul, M.G.; Wu, H.; Liao, Y.; Blaabjerg, F.; Harnefors, L. Grid-synchronization stability of converter-based resources–an overview. IEEE Open J. Ind. Appl. 2020, 1, 115–134. [Google Scholar] [CrossRef]
- Li, Y.; Gu, Y.; Green, T.C. Revisiting grid-forming and grid-following inverters: A duality theory. IEEE Trans. Power Syst. 2022, 37, 4541–4554. [Google Scholar] [CrossRef]
- Zhou, Z.; Wang, W.; Lan, T.; Huang, G.M. Dynamic performance evaluation of grid-following and grid-forming inverters for frequency support in low inertia transmission grids. In Proceedings of the 2021 IEEE PES Innovative Smart Grid Technologies Europe (ISGT Europe), Espoo, Finland, 18–21 October 2021. [Google Scholar]
- Xu, X.; Casale, E.; Bishop, M.; Oikarinen, D.G. Application of New Generic Models for PV and Battery Storage in System Planning Studies. In Proceedings of the 2017 IEEE Power & Energy Society General Meeting, Chicago, IL, USA, 16–20 July 2017. [Google Scholar]
- Pourbeik, P.; Petter, J.K. Modeling and Validation of Battery Energy Storage Systems Using Simple Generic Models for Power System Stability Studies. CIGRE 2017, 9, 63–72. [Google Scholar]
- California ISO; DCR Transmission; Gridliance West LLC.; Pacific Gas and Electric Company; San Diego Gas and Electric Company; Southern California Edison and Valley Electric Association. Dynamic Model Review Guideline for Inverter Based Interconnection Requests; CAISO: Folsom, CA, USA, 2021. [Google Scholar]
- Lammert, G.; Ospina, L.D.P.; Pourbeik, P.; Fetzer, D.; Braun, M. Implementation and validation of WECC generic photovoltaic system models in DIgSILENT PowerFactory. In Proceedings of the 2016 IEEE Power and Energy Society General Meeting (PESGM), Boston, MA, USA, 17–21 July 2016. [Google Scholar]
- Liu, Y.; Huang, R.; Du, W.; Singhal, A.; Huang, Z. Highly-scalable transmission and distribution dynamic co-simulation with 10,000+ grid-following and grid-forming inverters. IEEE Trans. Power Deliv. 2023, 39, 578–590. [Google Scholar] [CrossRef]
- Pattabiraman, D.; Lasseter, R.H.; Jahns, T.M. Comparison of grid following and grid forming control for a high inverter penetration power system. In Proceedings of the 2018 IEEE Power & Energy Society General Meeting (PESGM), Portland, OR, USA, 5–10 August 2018. [Google Scholar]
- Sajadi, A.; Kenyon, R.W.; Bossart, M.; Hodge, B.-M. Dynamic interaction of grid-forming and grid-following inverters with synchronous generators in hybrid power plants. In Proceedings of the 2021 IEEE Kansas Power and Energy Conference (KPEC), Manhattan, KS, USA, 19–20 April 2021. [Google Scholar]
- Pierre, B.J.; Pico, H.N.V.; Elliott, R.T.; Flicker, J.; Lin, Y.; Johnson, B.B.; Eto, J.H.; Lasseter, R.H.; Ellis, A. Bulk power system dynamics with varying levels of synchronous generators and grid-forming power inverters. In Proceedings of the 2019 IEEE 46th Photovoltaic Specialists Conference (PVSC), Chicago, IL, USA, 16–21 June 2019. [Google Scholar]
- Rosso, R.; Wang, X.; Liserre, M.; Lu, X.; Engelken, S. Grid-forming converters: Control approaches, grid-synchronization, and future trends—A review. IEEE Open J. Ind. Appl. 2021, 2, 93–109. [Google Scholar] [CrossRef]
- Zare, A.; D’Silva, S.; Shadmand, M.B. Optimal Ratio of Grid-Forming to Grid-Following Inverters towards Resilient Power Electronics Dominated Grids. In Proceedings of the 2023 IEEE Applied Power Electronics Conference and Exposition (APEC), Orlando, FL, USA, 19–23 March 2023; pp. 2347–2352. [Google Scholar] [CrossRef]
- Liu, Y.; You, S.; Yao, W.; Cui, Y.; Wu, L.; Zhou, D.; Zhao, J.; Liu, H.; Liu, Y. A Distribution Level Wide Area Monitoring System for the Electric Power Grid–FNET/GridEye. IEEE Access 2017, 5, 2329–2338. [Google Scholar] [CrossRef]
- The Illinois Center for a Smarter Electric Grid (ICSEG), WSCC 9-Bus System, Power Cases. Available online: http://publish.illinois.edu/smartergrid/wscc-9-bus-system (accessed on 11 April 2015).
- Sun, K.; Xiao, H.; You, S.; Li, H.; Pan, J.; Li, K.-J.; Liu, Y. Frequency secure control strategy for power grid with large-scale wind farms through HVDC links. Int. J. Electr. Power Energy Syst. 2020, 117, 105706. [Google Scholar] [CrossRef]
- Tong, N.; Jiang, Z.; You, S.; Zhu, L.; Deng, X.; Xue, Y.; Liu, Y. Dynamic Equivalence of Large-Scale Power Systems Based on Boundary Measurements. In Proceedings of the 2020 American Control Conference (ACC), Denver, CO, USA, 1–3 July 2020; pp. 3164–3169. [Google Scholar] [CrossRef]
- Ma, F.; Luo, X.; Vittal, V. Application of dynamic equivalencing in large-scale power systems. In Proceedings of the 2011 IEEE Power and Energy Society General Meeting, Detroit, MI, USA, 24–28 July 2011; pp. 1–10. [Google Scholar] [CrossRef]
- Kundur, P. Power System Stability and Control; McGraw Hill: New York, NY, USA, 1993. [Google Scholar]
- Yoon, M.; Lee, J.; Song, S.; Yoo, Y.; Jang, G.; Jung, S.; Hwang, S. Utilization of energy storage system for frequency regulation in large-scale transmission system. Energies 2019, 12, 3898. [Google Scholar] [CrossRef]
- Zhang, G. EPRI Power System Dynamics Tutorial; Electric Power Research Institute, Inc.: Palo Alto, CA, USA, 2009. [Google Scholar]
- Biswas, S.; Follum, J.; Nguyen, Q.; Huang, Z.; Lyu, X.; Fan, X.; Du, W. How a Large-Scale Deployment of Grid-Forming Inverters May Impact Inter-Area Oscillation Modes; Pacific Northwest National Laboratory: Richland, WA, USA, 2023. [Google Scholar]
- Kenyon, R.W.; Sajadi, A.; Hoke, A.; Hodge, B.-M. Open-source PSCAD grid-following and grid-forming inverters and a benchmark for zero-inertia power system simulations. In Proceedings of the 2021 IEEE Kansas Power and Energy Conference (KPEC), Manhattan, KS, USA, 19–20 April 2021. [Google Scholar]
- Singhal, A.; Vu, T.L.; Du, W. Consensus control for coordinating grid-forming and grid-following inverters in microgrids. IEEE Trans. Smart Grid 2022, 13, 4123–4133. [Google Scholar] [CrossRef]
- Unruh, P.; Nuschke, M.; Strauß, P.; Welck, F. Overview on grid-forming inverter control methods. Energies 2020, 13, 2589. [Google Scholar] [CrossRef]
- Lin, Y.; Eto, J.H.; Johnson, B.B.; Flicker, J.D.; Lasseter, R.H.; Pico, H.N.V.; Seo, G.-S.; Pierre, B.J.; Ellis, A. Research Roadmap on Grid-Forming Inverters; No. NREL/TP-5D00-73476, National Renewable Energy Lab. (NREL): Golden, CO, USA, 2020. [Google Scholar]
- Guddanti, B.; Wang, J.; Feng, X. Global Sensitivity Analysis of Inverter-Based Resources for Bulk Power System Dynamic Studies. Ph.D. Thesis, The Ohio State University, Columbus, OH, USA, 2022. [Google Scholar]
- Lorenzo-Bonache, A.; Honrubia-Escribano, A.; Jiménez-Buendía, F.; Gómez-Lázaro, E. Field Validation of Generic Type 4 Wind Turbine Models Based on IEC and WECC Guidelines. IEEE Trans. Energy Convers. 2019, 34, 933–941. [Google Scholar] [CrossRef]
- WECC Modeling and Validation Subcommittee REMWG. Brief Summary of all 2nd Generation Generic Renewable Energy System Dynamic Models. In RES Model Summary Guide; WECC: Salt Lake City, UT, USA, 2021. [Google Scholar]
- WECC Modeling and Validation Working Group. Solar Photovoltaic Power Plant Modeling and Validation Guideline; WECC: Salt Lake City, UT, USA, 2019. [Google Scholar]
- Ellis, A.; Pourbeik, P.; Sanchez-Gasca, J.J.; Senthil, J.; Weber, J.; WECC Renewable Energy Modelling Task Force. Generic Wind Turbine Generator Models for WECC—A Second Status Report. In Proceedings of the 2015 IEEE Power & Energy Society General Meeting, Denver, CO, USA, 26–30 July 2015. [Google Scholar]
- WECC Modeling and Validation Working Group. WECC Wind Power Plant Dynamic Modeling Guide; WECC: Salt Lake City, UT, USA, 2014. [Google Scholar]
- Farantatos, E.; Electric Power Research Institute (EPRI). Model User Guide for Generic Renewable Energy System Models; Electric Power Research Institute, Inc.: Pao Alto, CA, USA, 2018. [Google Scholar]
- Ramadhan, U.F.; Yoon, M. Enhanced Grid Stability Operation with Plant-Level Control of Generic Inverter-Based Resources in an Embedded HVDC Link. In Proceedings of the 2023 International Conference on Technology and Policy in Energy and Electric Power (ICT-PEP), Jakarta, Indonesia, 2–3 October 2023; pp. 238–243. [Google Scholar] [CrossRef]
- Lee, J.; Jeong, S.; Kim, H.; Yoo, Y.; Jung, S.; Yoon, M.; Jang, G. Analytical Approach for Fast Frequency Response Control of VSC HVDC. IEEE Access 2021, 9, 91303–91313. [Google Scholar] [CrossRef]
- Wang, Y.; Yokoyama, A.; Baba, J. A Multifunctional Online Estimation Method for Synchronous Inertia of Power Systems Using Short-Time Phasor Transient Measurement Data with Linear Least Square Method After Disturbance. IEEE Access 2024, 12, 17010–17022. [Google Scholar] [CrossRef]
Disclaimer/Publisher’s Note: The statements, opinions and data contained in all publications are solely those of the individual author(s) and contributor(s) and not of MDPI and/or the editor(s). MDPI and/or the editor(s) disclaim responsibility for any injury to people or property resulting from any ideas, methods, instructions or products referred to in the content. |
© 2024 by the authors. Licensee MDPI, Basel, Switzerland. This article is an open access article distributed under the terms and conditions of the Creative Commons Attribution (CC BY) license (https://creativecommons.org/licenses/by/4.0/).