Abstract
The current development of prosumer microsources and the expected spread of electric vehicles may cause the appearance of significant current and voltage unbalance in low-voltage (LV) networks. This unbalance, which is an unfavorable phenomenon, may occur when using single-phase photovoltaic (PV) microsources and single-phase home chargers for electric vehicles. This paper presents a proposal for the symmetrization of the LV network using devices for the reconfiguration of phases in the power supply. Both the different locations of these devices and the different objective functions for device implementation are analyzed. The research was carried out on an example LV network, taking into account several variants of the development of PV microsources and home chargers for electric vehicles. The analysis indicates that the appropriate location of phase reconfiguration devices and the use of an appropriate objective function leads to a significant reduction in unfavorable unbalancing in the LV network.
1. Introduction
By 2050, the European Union (EU) wants to achieve climate neutrality [1]. Various programs are used to achieve this aim, including programs for increasing the share of renewable energy sources, resigning from the registration of combustion cars, or resigning from individual combustion-based heating furnaces. This is related to the large-scale emergence of new facilities in the power system, such as photovoltaic (PV) sources, electric vehicle (EV) chargers, or heat pumps. Single-phase facilities, in some cases, can significantly impact the operation of the low-voltage (LV) network, which is used for distributed generation.
Wind and PV sources, as well as energy storage facilities [2] and EVs that can operate in V2G or G2V modes [3,4,5], are connected to a local network. Thanks to local production and close consumption, the use of smart metering and smart charging causes self-consumption to increase [6,7,8]. In such a system, there is no need to transmit power over long distances, which avoids increased power losses. The intelligent management of electric vehicles connected to the grid allows for technical and economic benefits [9]. Such intelligent management is also considered on the basis of DC microgrids [10]. However, it should be indicated that in networks with distributed generation, there may be problems with power quality [11]. One of the problems is power outages, e.g., in systems with wind turbines [12]. The behavior of such systems is recommended to be analyzed using real-time simulators [13]. The greatest problems occur in networks with PV sources because they cause a significant increase in network voltage, often exceeding the permissible value [14,15,16], and are also the reason for a significant voltage unbalance [17,18,19,20]. The problem of increased voltage/current unbalance, as well as increased power loss, may be aggravated by connecting EVs to the LV power network [21,22].
In order to mitigate the unfavorable voltage parameters in the network with distributed generation, various solutions are used. In paper [23], an insulated gate bipolar transistor-based parallel active filter was used for current/voltage unbalance compensation. It has been proven that such a filter can compensate for the unbalance in load current or in the voltage source. Paper [24] proposes a Three Phase Optimal Power Flow method to minimize the voltage unbalance in LV distribution networks with a high penetration of PV sources. Consequently, the reactive power management from these sources significantly reduces voltage unbalance. Paper [25] describes voltage unbalance compensation and minimizing loss in the distribution system with the use of a three-phase individual-step voltage regulator. The application of this system enables the individual tap control of each phase. Paper [26] proposes a method to mitigate voltage unbalance caused by single-phase PV inverters in LV systems. The method is based on the uneven absorption and injection of reactive power by three-phase PV inverters. Each phase is controlled here to achieve this uneven power injection. In turn, paper [27] presents strategies for the control of single-phase and three-phase generating units cooperating with the inverters to improve the voltage magnitude and compensate for the current unbalance. A dynamic voltage restorer—a series-connected advanced power electronic custom-based tool—is discussed in paper [28]. This restorer is installed between the voltage source and the loads to alleviate voltage disturbances. The aforementioned solution is recommended, among others, as a cost-effective method for improving the voltage profile and reducing the voltage unbalance. The authors of paper [29] consider the effect of an unbalanced load with its step change on the voltage unbalance factor. They implemented a positive sequence controller strategy for the control of voltage for varying loads. In paper [30], the authors draw attention to the problem of connecting single-phase distributed energy resources and modern single-phase loads to the network. They analyze the effectiveness of using on-load tap changers, line-voltage regulators, and a Zic-Zac-Load balancer. When reviewing the most recent literature, it should be noted that the following solutions for improving the voltage parameters in the network are currently being discussed. Paper [31] focuses on optimal voltage regulator placement in relation to the optimal placement of EV chargers and PV sources. An optimal allocation of distributed generations is considered in paper [32]. In this case, PV sources, wind turbines, and conventional sources were used so as to minimize voltage drops and the level of power losses. In the analyzed case, more than 2% of power loss reduction, as well as an improvement in voltage levels, was achieved. The problem of optimization in networks with distributed generation is also discussed in publication [33]. Here, optimal EV charging station integration based on the voltage profile and power losses is presented. A genetic algorithm was used for proper network planning. In the case of paper [34], a comprehensive management plan for distributed PV grid-connected voltage based on shunt reactors and energy storage is proposed. In paper [35], a test microgrid consisting of a synchronous generator, PV system, battery storage system, and controllable balanced and unbalanced loads is discussed. It has been proven that it is possible to simultaneously decrease voltage unbalances and frequency deviations with the use of the advanced control structures of the distributed generation sources based on power electronics devices. Paper [36] proposes a neighborhood-collaborative mechanism-based voltage control and voltage unbalance alleviation method for individual PV inverters. This method is integrated with the proposed current unbalance mitigation. There are also methods related to network reconfiguration [37,38,39,40], but relatively few methods are focused on phase rearrangement, such as the Particle Swarm Optimization method, which can find the optimum phase rearrangement as the minimized imbalance on the feeder [41], and is a method of phase rearrangement and dynamic phase and load balancing along a feeder with a radial structure [42] or Dynamic Switching Devices, which are fast power electronic devices for changing the phase connection of a solar PV [43] or measurable data phase-reconfiguration devices [44]. In [45], a droop-based control approach is developed to compensate for the unbalanced output voltages of generators in islanded systems. Paper [46] proposes a control strategy for the converter to suppress the unbalance and distortion of the network-side current and achieve reference voltage output under the unbalanced network voltage.
Based on an analysis of the literature, it can be concluded that a reduction in voltage/current unbalance, as well as the reduction in power losses in networks with distributed generation, are performed primarily with the use of power electronic devices and with the help of the optimal location of sources, e.g., PV sources. So far, the automatic switching/reconfiguration of phases in the network, depending on the voltage/current unbalance caused by the connected single-phase sources and single-phase loads, has not been deeply considered. The implementation of such a proposal is being considered in one of the Polish local power networks. This paper describes the possible benefits of this, calculated on the basis of a real network study. The proposed idea and obtained results may be applicable to many other networks.
In this paper, phase reconfiguration is understood as the change in the sequence of the supply phases. At the same time, it is only possible to shift the phases consecutively. For example, if the sequence of the phases supplying the consumer is L1-L2-L3, it is only possible to change it to L2-L3-L1 or L3-L1-L2.
2. Description of the Analyzed Power Network
The real LV network with a nominal voltage equal to 400/230 V was used in the analyses (Figure 1). It is an urban cable network where most of the customers are those living in single-family houses and multi-family houses. The total length of power lines is 4.24 km, and cable cross sections are between 16 mm2 and 240 mm2. The network is supplied by a 400 kVA transformer—15 kV (MV side) and 0.4 kV (LV side). In Figure 1, this can be recognized by the number of consumers/prosumers written at the ends of the line connections. If this number is at least a dozen or so, it means that it is a multi-family building. In total, 337 private consumers are supplied in the entire network. Each of these consumers has a bidirectional energy meter.
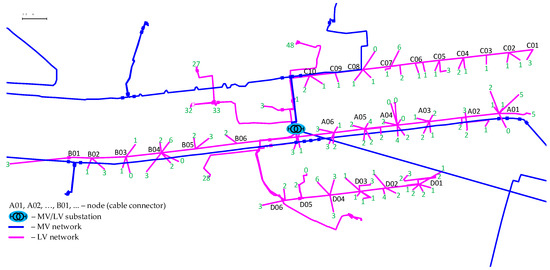
Figure 1.
Structure of the real network. The analyzed part—low-voltage (LV) network.
In general, the LV network is characterized by current and voltage unbalancing. The reason is single-phase loads, which constitute the vast majority of electrical installations for private/domestic consumers. It can, therefore, be concluded that unbalancing is a “natural” state in LV networks, and its level may change often. Figure 2 shows two examples (two randomly selected cases) from the considered LV network, which illustrate the difference in currents in individual phases during the day. These values were measured by Advanced Metering Infrastructure (AMI) system meters and represent the average current value for 15 min.
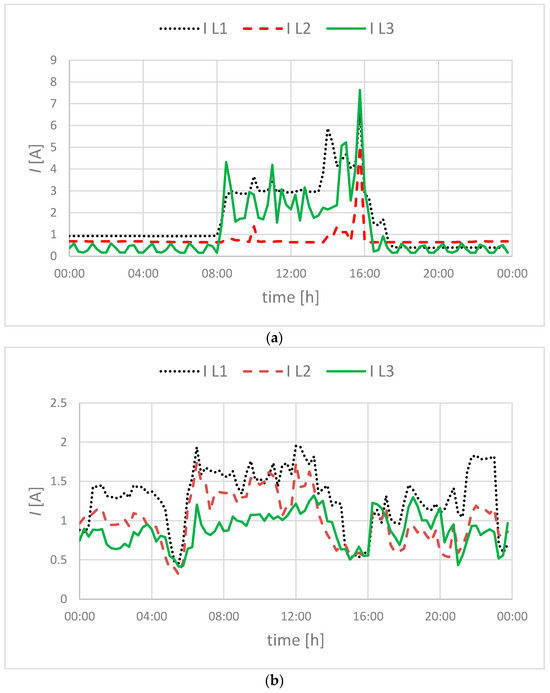
Figure 2.
Sample measurement results of one consumer current (line conductors L1, L2, and L3) in the analyzed LV network: (a) Example 1; (b) Example 2.
For further analyses related to the development of prosumer installations, it was assumed that some prosumers in the network have single-phase PV microsources with a power of 3.7 kW. Moreover, the same prosumers have electric vehicles. It was assumed that there are 28 prosumers of this nature in the considered network, which constitutes 8.3% of the total number of participants connected to it. The generation of PV sources was obtained from the Photovoltaic Geographical Information System (PVGIS) [47] (Figure 3a). In the case of electric vehicles, it was assumed that they were charged in the evening and at night from single-phase chargers with a power of 3.8 kW (Figure 3b). Single-phase PV microsources and electric vehicle chargers were used to highlight the problems that can (and do) occur in the LV network. The powers of these objects were assumed for national conditions, in which the current flow of a standard single-phase load should not exceed 16 A.
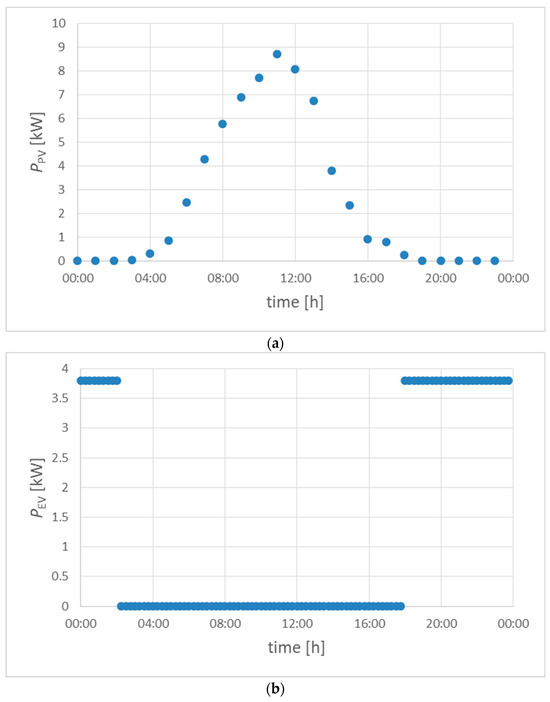
Figure 3.
Assumed model of power generation by a single-phase photovoltaic (PV) source (a) and the charging of electric vehicles (EVs) (b).
In fact, prosumers with PV microsources and electric vehicles may be connected to different areas of the LV network. As this may have a significant impact on the network’s operation, the following two different ways of allocating prosumers were tested:
- (1)
- In the first variant (W1), prosumers are distributed evenly along the entire length of the main supply lines. Their location is marked in Figure 4 by adding the marks “PV” and “EV”.
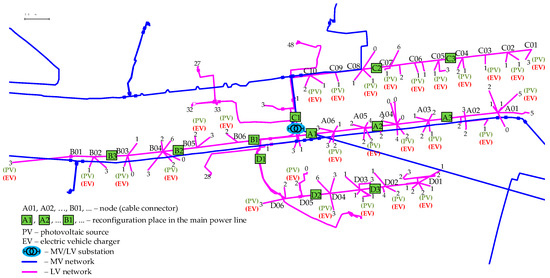 Figure 4. Even distribution of prosumers with a PV source and an electric vehicle charger as well as the deployment of phase reconfiguration devices in main lines.
 - (2)
- In the second variant (W2), prosumers with PV microsources and electric vehicles are clustered closer to each other (Figure 5). In this case, more than one such prosumer is connected to one network point (node/cable connector).
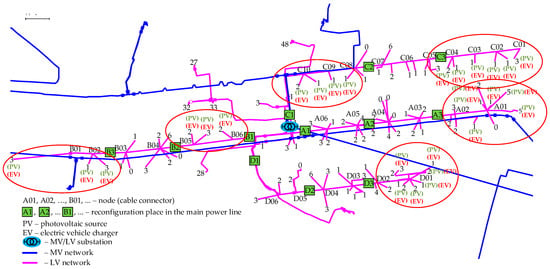 Figure 5. Concentrated distribution of prosumers (red circles indicate places of their concentration) with a PV source and an electric vehicle charger, as well as the deployment of phase reconfiguration devices in main lines.
In both variants (W1 and W2), the number of prosumers with PV and EV remains the same.
This paper considers phase reconfiguration in the LV network in order to reduce current and voltage unbalance. In practice, the phase reconfiguration device can be placed only at one point of the network (e.g., at the beginning of the main power line), or it can be located at many points of the network (e.g., at the point of connection for selected customers/prosumers). In general, three locations for phase reconfiguration devices can be defined:
- (1)
- (2)
- At the point of connection of the prosumer, i.e., in the “node/cable connector”;
- (3)
- At the MV/LV distribution substation, at the beginning of the main power lines.
A separate analysis has shown that the least effective solution is the third option. Therefore, this solution was omitted from further analyses.
3. Objective Functions
Symmetrization of the LV network is understood in this paper as a reduction in voltage unbalance and/or as a reduction in current unbalance. The following two approaches, utilizing the reconfiguration of the supply phases (line conductor reconfiguration), are considered as follows:
- (1)
- Distributed Main Circuit Reconfiguration (hereinafter referred to as DMCR)—reconfiguration performed in the main power lines, which affects a specific group of prosumers’ supply “behind” (downstream) the device;
- (2)
- Final Individual Circuit Reconfiguration (hereinafter referred to as FICR)—phase reconfiguration of prosumers with a PV microsource and an electric vehicle at the point of their connection to the network.
In both of the above cases (DMCR and FICR), it is necessary to measure phase voltages and currents as well as currents flowing in neutral conductors. The place of current/voltage measurement may be at the place where the phase reconfiguration device is installed or at a place remote from it. This is also related to the operation of devices, which, depending on the adopted strategy, can operate autonomously or be controlled by a master controller installed in the MV/LV substation. It should be noted that the analyzed Distribution System Operator (DSO) has remote communication capabilities using Power Line Communication (PLC) technology. However, at the moment, it does not yet have controllers designed for the tasks described in the paper.
Depending on the location of the phase reconfiguration devices and the location of the measurements, four example objective functions were proposed, which are called “scenarios” (Figure 6).
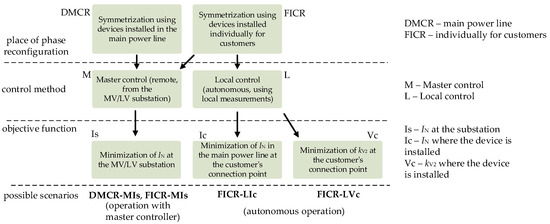
Figure 6.
Possible scenarios of the implementation of the objective functions. IN—neutral conductor current.
- Devices installed at prosumers (for FICR implementation):
- The minimization of the voltage unbalance factor measured at the point of installation of the phase reconfiguration device (mark: FICR-LVc)—objective function (scenario) no. 1—is as follows:
where kV,n—voltage unbalance factor (defined in (5)) at the point of application of the phase reconfiguration device, Ij—current in the j-th power line, Iz,j—current-carrying capacity of the j-th power line, Vw—voltage of the w-th network node, Vmax—maximum permissible line-to-neutral voltage of the analyzed network (253 V), and Vmin—minimum permissible line-to-neutral voltage of the analyzed network (207 V).KV(FICR-LVc) = min{kV,n} for Ij ≤ Iz,j and Vw ≤ Vmax and Vw ≥ Vmin,- b.
- The minimization of currents flowing in neutral conductors at the point of installation of the phase reconfiguration device (mark: FICR-Lic)—objective function (scenario) no. 2—is as follows:
where Ic,j—IN current in the j-th power line, at the point of application of the phase reconfiguration device (other symbols as in (1)).KI(FICR-Lic) = min{Ic,i} for Ij ≤ Iz and Vw ≤ Vmax and Vw ≥ Vmin,- c.
- The minimization of currents flowing in neutral conductors in the MV/LV distribution substation (mark: FICR-Mis)—objective function (scenario) no. 3—is as follows:
where Is,i—IN current in the i-th main power line in the MV/LV substation (other symbols as in (1)).KI(FICR-Mic) = min{Is,i} for Ij ≤ Iz and Vw ≤ Vmax and Vw ≥ Vmin,
- The devices installed in main power lines (for DMCR implementation).
- a.
- The minimization of currents flowing in neutral conductors in the MV/LV distribution substation (mark: DMCR-Mis)—objective function (scenario) no. 4—is as follows.
KI(DMCR-Mis) = min{Is,i} for Ij ≤ Iz and Vw ≤ Vmax and Vw ≥ Vmin,
Calculations for a given objective function were made iteratively with the use of DigSILENT PowerFactory 2022 software using an author’s algorithm automating this process.
The analyses also use the base scenario, which means no phase reconfiguration in the network. It is used to verify the effectiveness of the proposed objective functions.
4. Results
As mentioned above, the analyses assumed two different variants of network operation (W1 and W2), which are also related to the location of prosumers with a PV microsource and an electric vehicle (Figure 4 and Figure 5). In both of these variants, the following connections of PV microsources and Evs are planned as follows:
- PV microsources (3.7 kW) are connected to phase L2,
- Evs are charged (3.8 kW) from phase L3.
Each time, phase reconfiguration is carried out as their shift. Therefore, if the phase sequence is L1-L2-L3 at the point of reconfiguration, only sequence L2-L3-L1 or L3-L1-L2 is possible. Thanks to this, problems related to the correct power supply of three-phase drives are avoided in the network.
The following values were adopted as criteria for assessing the phase reconfiguration efficiency:
- Current flowing in the neutral conductor;
- Voltage unbalance factor defined by [48,49]:
KV = (V2/V1) × 100%,
The lower the above-mentioned values, the better the effectiveness of a given solution. In addition, power losses Plosses in the network are presented to show the effectiveness of the proposed objective functions.
4.1. Objective Function FICR-LVc (No. 1)
The first considered objective function is the minimization of the voltage unbalance factor kV at the point of installation of phase reconfiguration devices—in this case, at prosumers (FICR LVs). At the same time, it is assumed that these devices operate autonomously. This seems to be the simplest solution among those proposed in this paper. In such a case, phase reconfiguration devices should be sized for power no higher than the maximum contracted load of the prosumer. It is also relatively easy to measure voltages at the place where the device is installed.
In general, phase reconfiguration cannot take place simultaneously in all devices in the network because such action would not have the intended effect. It was, therefore, assumed that reconfiguration took place “sequentially”, starting with the devices closest to the ends of the main power lines (Figure 7).
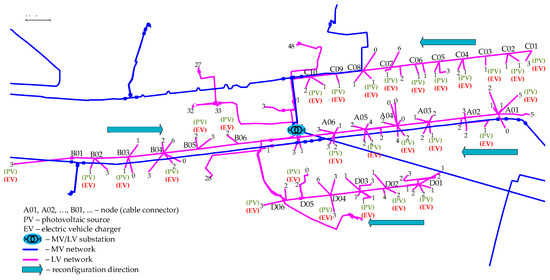
Figure 7.
Phase reconfiguration direction. The arrows show the direction of phase reconfiguration.
After phase reconfiguration for prosumers with PV microsources and electric vehicles, a reduction in the value of the voltage unbalance factor kV was obtained to a level below 1.2% (Figure 8b). This was a significant improvement in relation to the values observed without taking into account phase reconfiguration (Figure 8a—base scenario), in which the permissible value, defined in [48] at the level of 2%, was exceeded. The high values obtained in the base scenario resulted from the assumption of connecting all PV sources to phase L2 and electric vehicle chargers to phase L3.
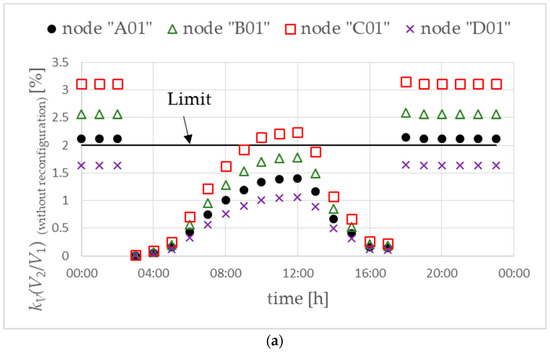
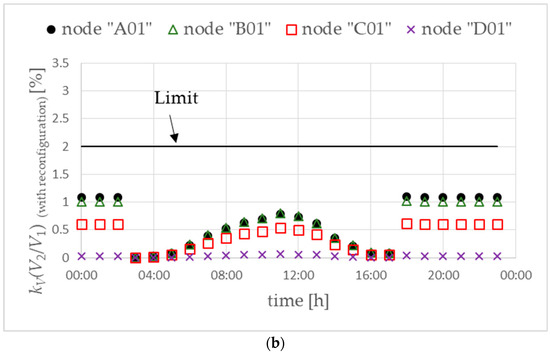
Figure 8.
Voltage unbalance factor without (a) and with (b) phase reconfiguration. Objective function FICR-LVc. Variant W1.
The use of phase reconfiguration for selected prosumers also reduces the value of currents flowing in the neutral conductors in the main power lines (Figure 9). The lowest effect is observed for the main power line “A” when power is generated by PV sources.
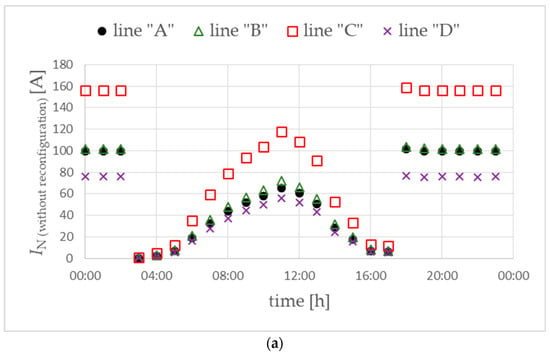
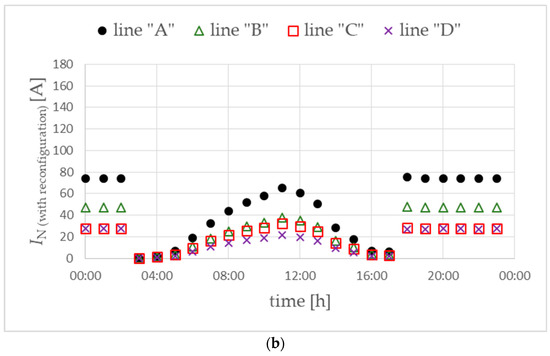
Figure 9.
Currents in the neutral conductor of the main power lines without (a) and with (b) phase reconfiguration. Objective function FICR-LVc. Variant W1.
Reducing currents in neutral conductors transfers into lower active power losses in the analyzed network, which, depending on the hour, are reduced by approximately 50–60% (Figure 10).
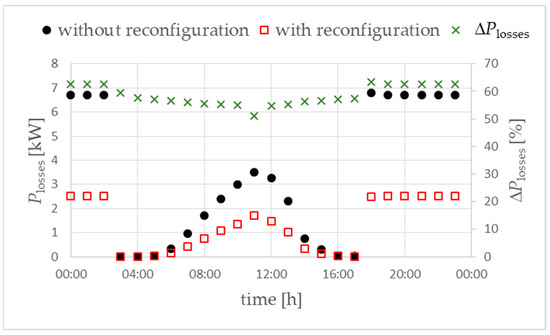
Figure 10.
Active power losses in the analyzed LV network. Objective function FICR-LVc. Variant W1. ΔPlosses (right vertical axis in %)—the difference in power losses “with reconfiguration” compared to “without reconfiguration”.
The obtained results show that the use of an objective function minimizing the voltage unbalance factor at prosumers has a limited impact on reducing current unbalance and, consequently, on reducing power losses in the network.
The above considerations assumed the order of operation of phase reconfiguration devices from the end of the main power lines towards the power supply (MV/LV substation). The reverse situation was also considered, in which reconfiguration started from the MV/LV substation towards the end of the main power lines. In this case, much better results were obtained, i.e., the voltage unbalance factor reached very low values (Figure 11b). This solution also translates into relatively low current values in the neutral conductors (Figure 12b) in the main power lines, measured in the MV/LV substation. At the same time, network power losses are reduced by approximately 65–70% as presented in Figure 13 (in the case of the opposite direction of reconfiguration, it was 50–60%).
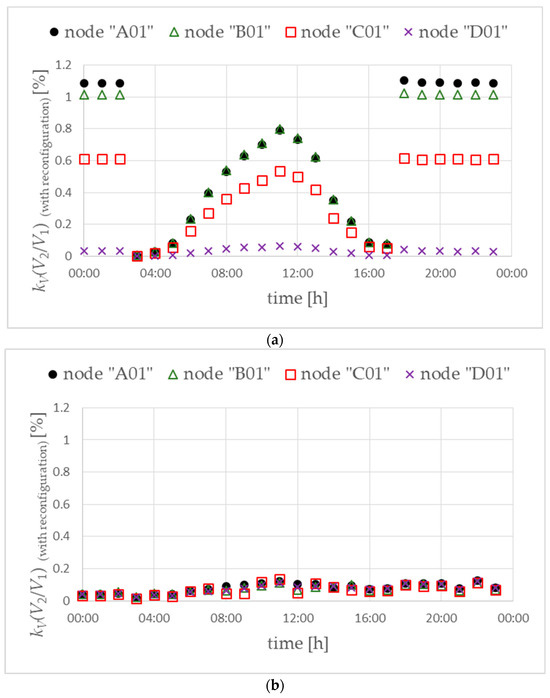
Figure 11.
Voltage unbalance factor for the direction of phase reconfiguration from the end of main lines to the MV/LV substation (a) and from the MV/LV substation to the end of main lines (b). Objective function FICR-LVc. Variant W1.
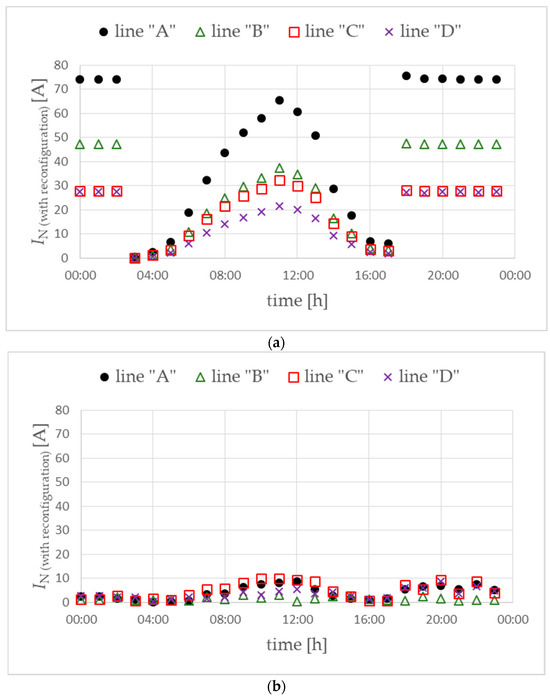
Figure 12.
Currents in the neutral conductor of the main power lines for the direction of phase reconfiguration from the end of the main lines to the MV/LV substation (a) and from the MV/LV substation to the end of the main lines (b). Objective function FICR-LVc. Variant W1.
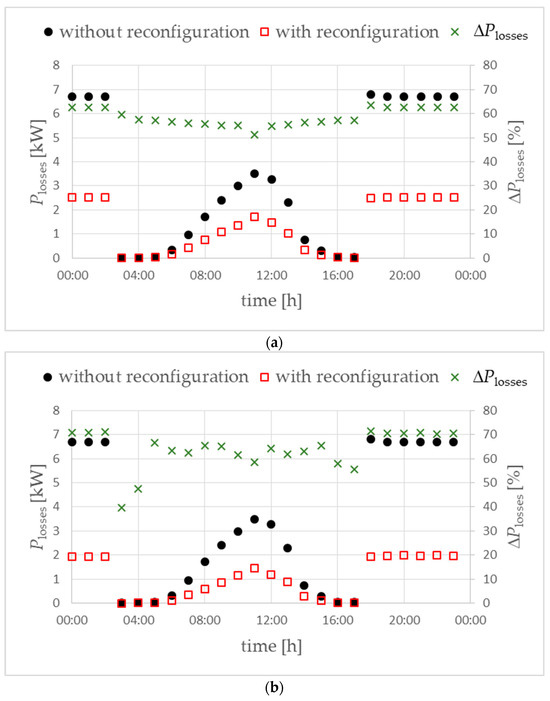
Figure 13.
Active power losses in the analyzed LV network for the direction of phase reconfiguration from the end of the main lines to the MV/LV substation (a) and from the MV/LV substation to the end of the main lines (b). Objective function FICR-LVc. Variant W1. ΔPlosses (right vertical axis in %)—the difference in power losses “with reconfiguration” compared to “without reconfiguration”.
Further analyses were carried out for the uneven location of prosumers with a PV microsource and an electric vehicle (variant W2). In this case, phase reconfiguration is assumed at prosumers, starting from the end of the main power lines towards the distribution MV/LV substation. The value of the voltage unbalance factor without phase reconfiguration, i.e., in the base scenario, is slightly higher than for the W1 variant (Figure 14a vs. Figure 8a). This is due to the different locations of prosumers with a PV microsource and an electric vehicle.
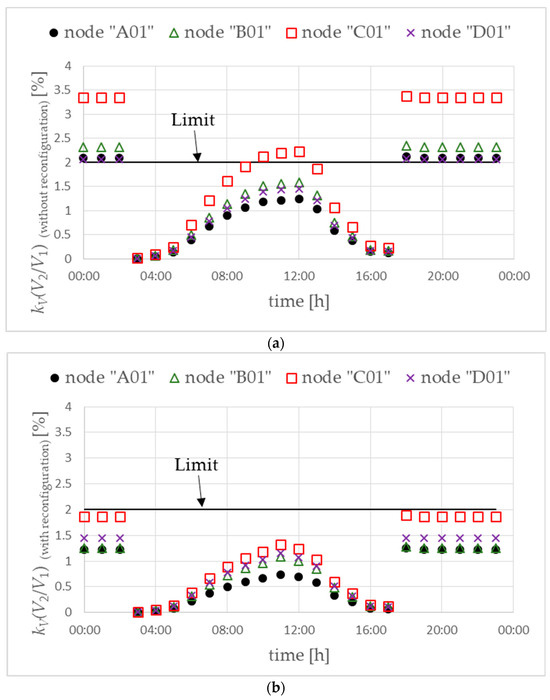
Figure 14.
Voltage unbalance factor without (a) and with (b) phase reconfiguration. Objective function FICR-LVc. Variant W2.
The use of phase reconfiguration in selected prosumers reduces the voltage unbalance factor below the permissible value of 2%. However, the values are clearly higher than even the location of prosumers with PVs and EVs (Figure 14b vs. Figure 8b).
Lower efficiency of phase reconfiguration for the LV network configuration in the W2 variant means a lower reduction in the values of neutral conductor currents (Figure 15b vs. Figure 9b) despite higher currents in the base scenario (Figure 15a vs. Figure 9a). As a consequence, a lower reduction in power losses is observed (Figure 16 vs. Figure 10), only by about 40–50%.
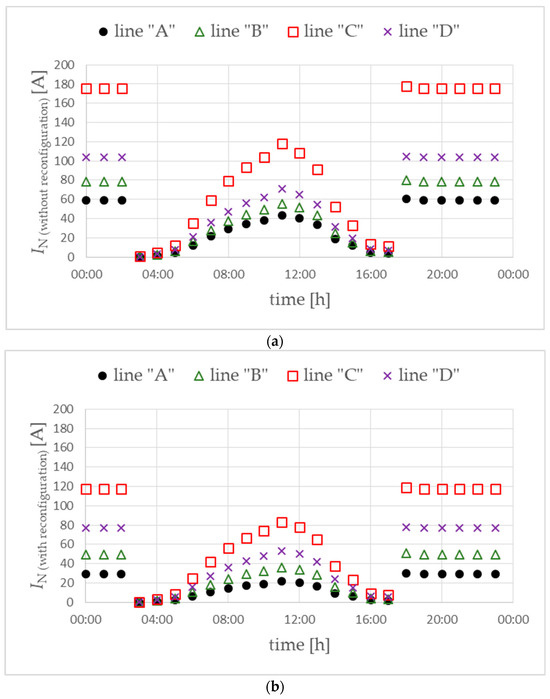
Figure 15.
Currents in the neutral conductor of the main power lines without (a) and with (b) phase reconfiguration. Objective function FICR-LVc. Variant W2.
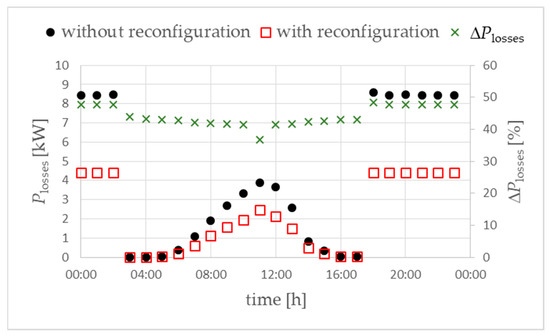
Figure 16.
Active power losses in the analyzed LV network. Objective function FICR-LVc. Variant W2. ΔPlosses (right vertical axis in %)—the difference in power losses “with reconfiguration” compared to “without reconfiguration”.
The above analyses show that in the case of minimizing the voltage unbalance factor at the point of phase reconfiguration, the direction of reconfiguration is important. A much better effect is achieved if the reconfiguration starts from the distribution MV/LV substation towards the end of the main power lines. In real implementation, a specific order/direction of operation for phase reconfiguration devices can be achieved using different device startup delays.
Moreover, the location of prosumers in the network also affects the achieved efficiency. In general, it can be said that the uneven location of this type of prosumers in the network reduces the efficiency of phase reconfiguration.
4.2. Objective Function FICR-LIc (No. 2)
Another analyzed objective function (FICR-LIc) is the minimization of currents flowing in neutral conductors. For this purpose, phase reconfiguration devices are installed for prosumers that have a photovoltaic microsource and an electric vehicle. This approach requires measuring currents in the neutral conductors at the point where the prosumer is connected to the main power line. However, if more phase reconfiguration devices are connected at one point in the network (points marked in Figure 4 and Figure 5 as “node, cable connector”), this measurement can be common for all devices. This analysis uses the W2 network variant (Figure 5), in which prosumers with a PV microsource and an electric vehicle are located unevenly in the network.
The use of the FICR-LIc objective function allows for a significant reduction in the voltage unbalance factor (Figure 17). At the same time, a clearly better result is obtained here than for the FICR-LVc objective function, the results of which are presented in the previous section (Figure 17b vs. Figure 14b).
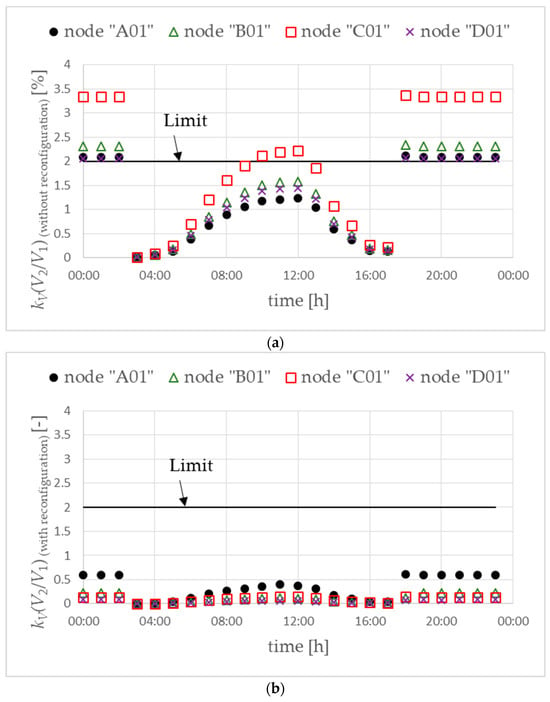
Figure 17.
Voltage unbalance factor without (a) and with (b) phase reconfiguration. Objective function FICR-LIc. Variant W2.
In the case under consideration, a significant reduction in the neutral conductor current measured in the distribution MV/LV substation was also achieved (Figure 18). Much lower values were obtained than for the FICR-LVc objective function, in which the voltage unbalance factor was minimized (Figure 18b vs. Figure 15b).
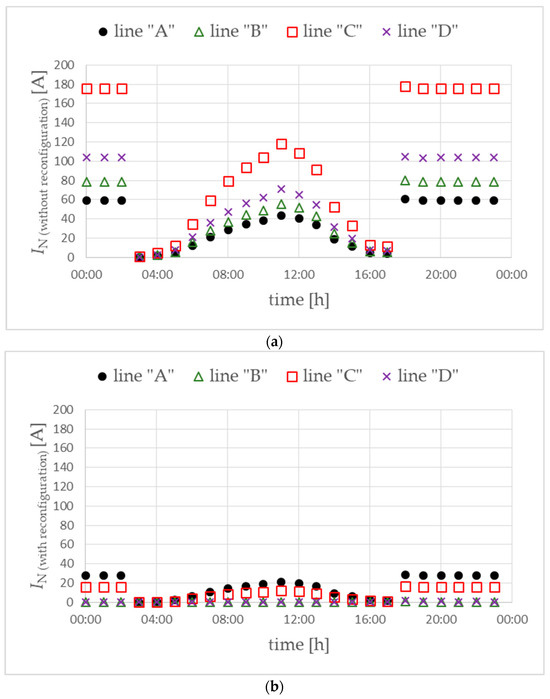
Figure 18.
Currents in the neutral conductor of the main power lines without (a) and with (b) phase reconfiguration. Objective function FICR-LIc. Variant W2.
Reducing the neutral conductor currents reduces the active power losses in the analyzed network by approximately 65–75% (Figure 19).
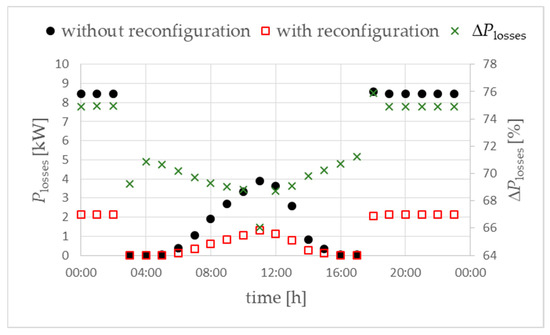
Figure 19.
Active power losses in the analyzed LV network. Objective function FICR-LIc. Variant W2. ΔPlosses (right vertical axis in %)—the difference in power losses “with reconfiguration” compared to “without reconfiguration”.
The results presented above for the FICR-LVc and FICR-LIc objective functions show that it matters what parameter is minimized. When using phase reconfiguration devices for selected prosumers, much better efficiency is achieved by minimizing the currents flowing in the neutral conductors than by minimizing the voltage unbalance factor.
4.3. Objective Function FICR-MIs (No. 3)
The FICR-MI objective function minimizes the neutral conductor currents measured in the MV/LV substation using phase reconfiguration devices at prosumers with a PV microsource and an electric vehicle. In such a case, it is necessary to use a main controller in the MV/LV substation and ensure communication between the controller and the phase reconfiguration devices. Considerations were carried out for both variants (W1 and W2) for the location of prosumers with a PV microsource and an electric vehicle. For both variants, a significant reduction in the voltage unbalance factor is obtained (Figure 20). At the same time, slightly lower values are obtained for the W1 variant, in which prosumers with PV and EV are located evenly (Figure 20a).
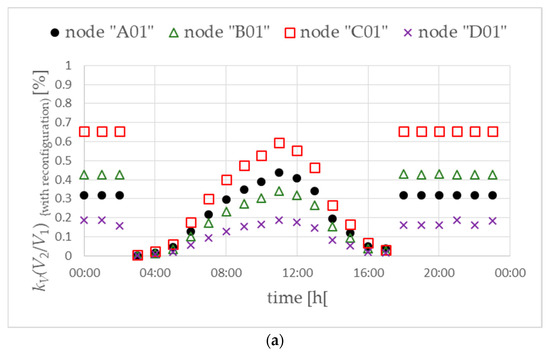
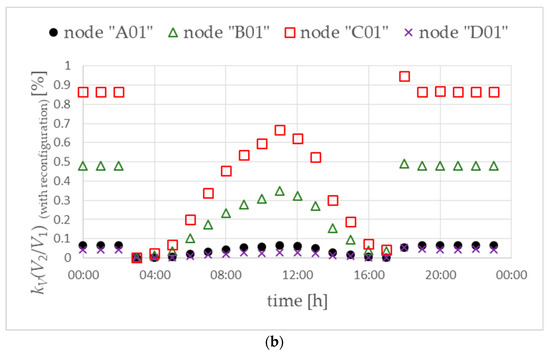
Figure 20.
Voltage unbalance factor for variant W1 (a) and variant W2 (b). Objective function FICR-MIs.
The effectiveness of minimizing currents in the neutral conductor measured in the MV/LV substation is also observed in the values of these currents (Figure 21). They obtain relatively low values compared to the values obtained without reconfiguration (Figure 21a vs. Figure 9a and Figure 21b vs. Figure 15a).
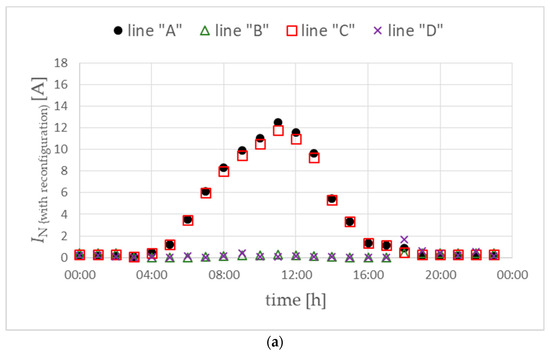
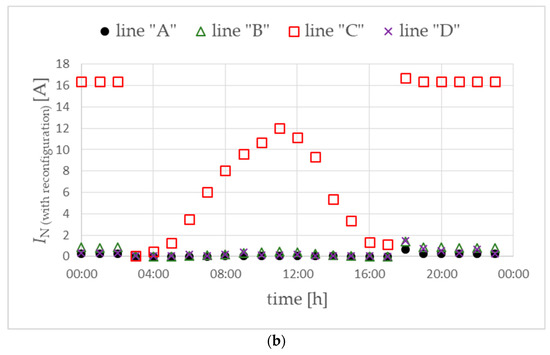
Figure 21.
Currents in the neutral conductor of the main power lines for variant W1 (a) and for variant W2 (b). Objective function FICR-MIs.
An effective reduction in the currents flowing in the neutral conductors also results in a significant reduction in active power losses in the analyzed network (Figure 22) by approximately 60–70%.
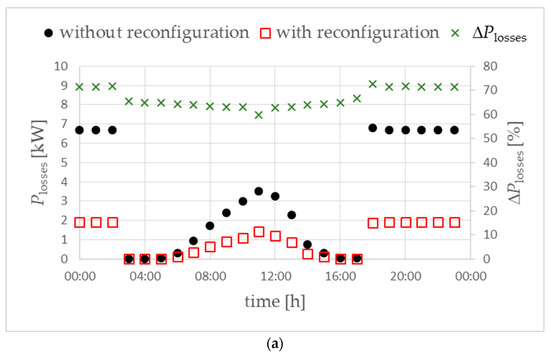
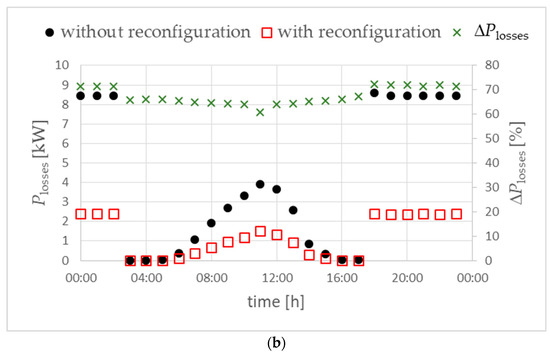
Figure 22.
Active power losses in the analyzed LV network for variant W1 (a) and variant W2 (b). Objective function FICR-MIs. ΔPlosses (right vertical axis in %)—the difference in power losses “with reconfiguration” compared to “without reconfiguration”.
The above results indicate that the use of phase reconfiguration devices at selected prosumers, combined with the minimization of currents in neutral conductors measured in the MV/LV substation, effectively reduces the unbalance that occurs in the analyzed LV network.
4.4. Objective Function DMCR-MIs (No. 4)
The last scenario considered is the use of the DMCR-MIs objective function to minimize the currents flowing in the neutral conductors in the MV/LV substation (the central point of the network). The objective function is implemented using phase reconfiguration devices installed at selected points of the main power lines. In this case, two variants of the location of prosumers with a PV microsource and an electric vehicle were also considered: variants W1 and W2. The location of the phase reconfiguration devices is shown in Figure 4 or Figure 5. In each main power line, three devices were used in the same places for the W1 and W2 variants. Because of this, it was possible to draw conclusions about the effectiveness of the considered scenario for various network structures.
When using devices installed in main power lines, every possible reconfiguration combination is checked for three devices in each main power line. At the same time, it is assumed that the phase sequence can only occur as follows: L1-L2-L3, L2-L3-L1, or L3-L1-L2. From the above, there are 27 phase combinations in these three devices used in each main power line, assuming that the reconfiguration “0” means no reconfiguration.
Phase reconfiguration devices effectively reduce the voltage unbalance factor for the variant in which prosumers with PVs and EVs are evenly located (Figure 23a). For the uneven location of these prosumers, there is no case that would allow for the voltage unbalance factor to be below the permissible value (Figure 23b).
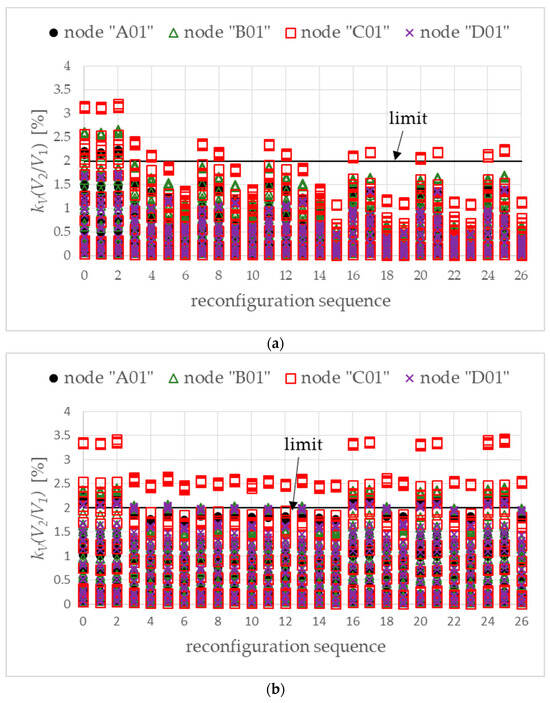
Figure 23.
Voltage unbalance factor for variant W1 (a) and variant W2 (b). Objective function DMCR-MIs.
In the considered approach, for the W1 variant, there are reconfiguration sequences that ensure an effective reduction in both the value of the voltage unbalance factor and the value of the neutral conductor currents (Figure 24a). Such reconfiguration sequences are, for example, no. “15”, “18”, “19”, “22”, “23” and “26”. For the selected reconfiguration sequence (no. “26”), the values of neutral conductor currents during the day are shown in Figure 25.
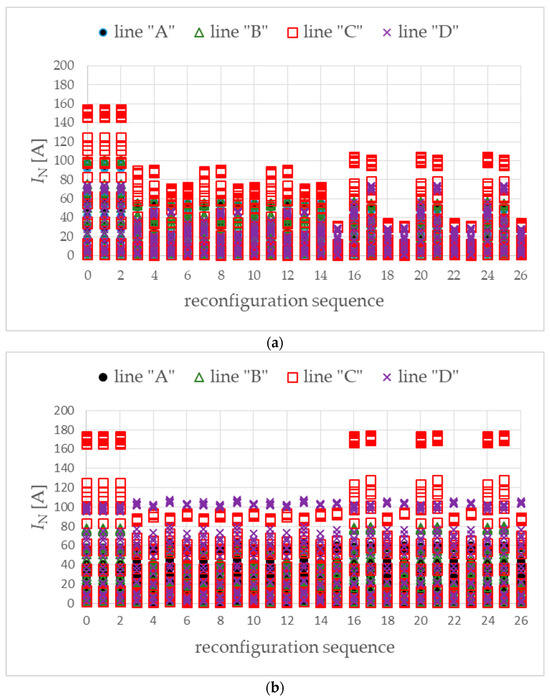
Figure 24.
Currents in the neutral conductor of the main power lines for variant W1 (a) and for variant W2 (b). Objective function of DMCR-MIs.
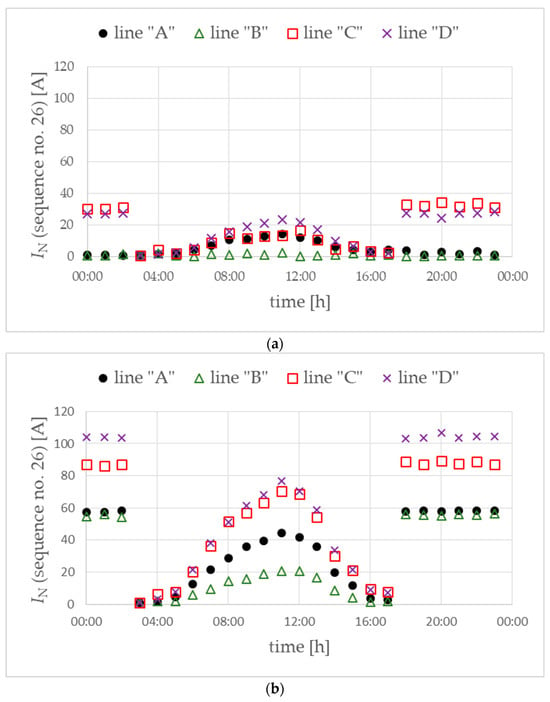
Figure 25.
Currents in the neutral conductor of the main power lines (detailed data for sequence no. 26) for variant W1 (a) and for variant W2 (b). Objective function of DMCR-MIs.
The use of phase reconfiguration devices in the main power lines while evenly locating the prosumers results in a relatively good reduction in active power losses (Figure 26a). In turn, in the case of the uneven location of prosumers (variant W2), the effect obtained is much lower (Figure 26b).
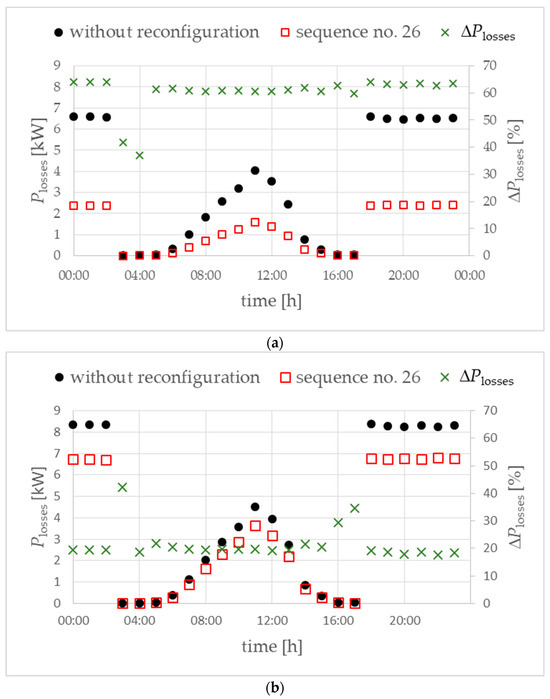
Figure 26.
Active power losses in the analyzed LV network for variant W1 (a) and variant W2 (b). Objective function of DMCR-MIs. ΔPlosses (right vertical axis in %)—the difference in power losses “with reconfiguration” compared to “without reconfiguration”.
The above analysis demonstrates a close relationship between the location of prosumers with a high-load unbalance in the network and the effectiveness of the solution with phase reconfiguration devices in the main power lines.
5. Conclusions
This paper considers the possibility of the symmetrization of the LV network using phase reconfiguration devices located either in the prosumer connection points or in the main power lines. These considerations omitted the aspect of the technical solution of the device itself and focused on the effectiveness of using the proposed objective functions and the reconfiguration process itself. The presented analyses allowed us to draw the following conclusions:
- The application of phase reconfiguration in selected prosumers, compared to the reconfiguration in the main power lines, gives a better effect in a network with single-phase PV microsources and electric vehicles, charged using single-phase chargers;
- It is necessary to apply boundary conditions, i.e., the minimum voltage unbalance factor or the minimum IN current below which the devices do not perform reconfiguration. This can avoid unnecessary (inefficient) reconfiguration;
- Based on the measured values, inferences about the reconfiguration efficiency should be introduced in the decision-making algorithms, which can verify the necessity of reconfiguration. This reduces the number of ineffective reconfigurations;
- Phase reconfiguration devices installed at individual prosumers should be sized in relation to the contracted power. Therefore, these are relatively low-power devices;
- Phase reconfiguration devices installed in main power lines should be sized to supply power to the prosumers “behind” (downstream) the device. If there is more than one device in the main power line, they will have different power ratings. It remains an open issue to determine the expected load, which can be defined, for example, on the basis of the historical loads of prosumers;
- The effectiveness of the operation of phase reconfiguration devices located in the main power lines strongly depends on the location of prosumers with high load unbalance;
- Some of the proposed scenarios require the use of a main controller at the distribution MV/LV substation, as well as communication between the controller and phase reconfiguration devices. This is an additional element increasing the cost of symmetrization in the LV network;
- If the database of historical measurements of prosumers contains measurements of energy, power, or currents independently for each phase, it may facilitate the decision on the appropriateness of using phase reconfiguration devices. Using measurements in a mathematical model would make the decision easier.
Based on the above considerations, it is possible to determine the effectiveness of the objective function and the ease of implementing a given solution. A synthetic comparison is presented in Table 1.

Table 1.
Recommendation of the considered objective functions.
Author Contributions
Conceptualization, K.D.; methodology, K.D.; software, K.D.; validation, K.D. and S.C.; formal analysis, K.D. and S.C.; investigation, K.D.; resources, K.D. and S.C.; data curation, K.D.; writing—original draft preparation, K.D.; writing—review and editing, K.D. and S.C.; visualization, K.D.; supervision, K.D. and S.C.; project administration, K.D. All authors have read and agreed to the published version of the manuscript.
Funding
This research received no external funding.
Data Availability Statement
Data are contained within the article.
Conflicts of Interest
The authors declare no conflicts of interest.
References
- European Commission. Directive of the European Parliament and of the Council on Energy Efficiency, COM(2021) 558 Final/2; European Commission: Brussels, Belgium, 2021. [Google Scholar]
- Panda, S.S.; Rout, U.K. Control and Management of Power Exchange in Microgrid. In Proceedings of the 2022 IEEE 2nd International Symposium on Sustainable Energy, Signal Processing and Cyber Security (iSSSC), Gunupur, India, 15–17 December 2022. [Google Scholar]
- Kirmani, S.; Paul, W.U.H.; Bhat, M.B.; Akhtar, I.; Siddiqui, A.S. Optimal Allocation of V2G Stations in a Microgrid Environment: Demand Response. In Proceedings of the 2023 International Conference on Power, Instrumentation, Energy and Control (PIECON), Aligarh, India, 10–12 February 2023. [Google Scholar]
- Zhang, L.; Cheng, L.; Alsokhiry, F.; Mohamed, M.A. A Novel Stochastic Blockchain-Based Energy Management in Smart Cities Using V2S and V2G. IEEE Trans. Intell. Transp. Syst. 2023, 24, 915–922. [Google Scholar] [CrossRef]
- Jassim, H.M.; Zyuzev, A.; Valtchev, S. Analyzing G2V and V2G Functionalities for Electric Vehicle Charging Station. In Proceedings of the 2022 4th International Conference on Control Systems, Mathematical Modeling, Automation and Energy Efficiency (SUMMA), Lipetsk, Russia, 9–11 November 2022. [Google Scholar]
- Barone, G.; Brusco, G.; Menniti, D.; Pinnarelli, A.; Polizzi, G.; Sorrentino, N.; Vizza, P.; Burgio, A. How Smart Metering and Smart Charging may Help a Local Energy Community in Collective Self-Consumption in Presence of Electric Vehicles. Energies 2020, 13, 4163. [Google Scholar] [CrossRef]
- Menniti, D.; Pinnarelli, A.; Sorrentino, N.; Vizza, P.; Barone, G.; Brusco, G.; Mendicino, S.; Mendicino, L.; Polizzi, G. Enabling Technologies for Energy Communities: Some Experimental Use Cases. Energies 2022, 15, 6374. [Google Scholar] [CrossRef]
- Mendicino, L.; Menniti, D.; Pinnarelli, A.; Sorrentino, N.; Vizza, P.; Alberti, C.; Dura, F. DSO Flexibility Market Framework for Renewable Energy Community of Nanogrids. Energies 2021, 14, 3460. [Google Scholar] [CrossRef]
- Menniti, D.; Pinnarelli, A.; Sorrentino, N.; Vizza, P.; Brusco, G.; Barone, G.; Marano, G. Techno Economic Analysis of Electric Vehicle Grid Integration Aimed to Provide Network Flexibility Services in Italian Regulatory Framework. Energies 2022, 15, 2355. [Google Scholar] [CrossRef]
- Barone, G.; Brusco, G.; Menniti, D.; Pinnarelli, A.; Sorrentino, N.; Vizza, P.; Burgio, A.; Bayod-Rújula, Á. A Renewable Energy Community of DC Nanogrids for Providing Balancing Services. Energies 2021, 14, 7261. [Google Scholar]
- Pijarski, P.; Kacejko, P.; Wancerz, M. Voltage Control in MV Network with Distributed Generation—Possibilities of Real Quality Enhancement. Energies 2022, 15, 2081. [Google Scholar] [CrossRef]
- Duer, S.; Woźniak, M.; Paś, J.; Zajkowski, K.; Bernatowicz, D.; Ostrowski, A.; Budniak, Z. Reliability Testing of Wind Farm Devices Based on the Mean Time between Failures (MTBF). Energies 2023, 16, 1659. [Google Scholar] [CrossRef]
- Kłosowski, Z.; Cieślik, S. The Use of a Real-Time Simulator for Analysis of Power Grid Operation States with a Wind Turbine. Energies 2021, 14, 2327. [Google Scholar] [CrossRef]
- Szultka, A.; Szultka, S.; Czapp, S.; Zajczyk, R. Voltage Variations and Their Reduction in a Rural Low-Voltage Network with PV Sources of Energy. Electronics 2021, 10, 1620. [Google Scholar] [CrossRef]
- Filho, P.M.O.; Abud, T.P.; Borba, B.S.M.C.; Maciel, R.S. Impact of photovoltaic systems on voltage magnitude and unbalance in low voltage networks. In Proceedings of the 2018 Simposio Brasileiro de Sistemas Eletricos (SBSE), Niteroi, Brazil, 12–16 May 2018. [Google Scholar]
- Fardinfar, F.; Pour, M.J.K. Optimal placement of D-STATCOM and PV solar in distribution system using probabilistic load models. In Proceedings of the 2023 10th Iranian Conference on Renewable Energy & Distributed Generation (ICREDG), Shahrood, Iran, 15–16 March 2023. [Google Scholar]
- Harrison, D.H. Connecting renewable generation to rural 11kv networks with high levels of voltage unbalance. In Proceedings of the IET Conference on Renewable Power Generation (RPG 2011), Edinburgh, UK, 6–8 September 2011. [Google Scholar]
- Li, G.; Li, J.; Li, L.; Yu, S.; Wang, N.; Pan, S.; Ding, H.; Su, Z. Research on the Influence of Distributed Photovoltaics on Distribution Network Voltage in Three-phase Unbalanced State. In Proceedings of the 2022 4th International Conference on Power and Energy Technology (ICPET), Beijing, China, 28–31 July 2022. [Google Scholar]
- Hou, Y.; Liu, M.Z.; Ochoa, L.F. Residential PV Hosting Capacity, Voltage Unbalance, and Power Rebalancing: An Australian Case Study. In Proceedings of the 2022 IEEE PES Innovative Smart Grid Technologies Conference Europe (ISGT-Europe), Novi Sad, Serbia, 10–12 October 2022. [Google Scholar]
- Taiwo, O.P.; Tiako, R.; Davidson, I.E. Investigation of voltage unbalance in low voltage electric power distribution network under steady state mode. In Proceedings of the 2017 IEEE 3rd International Conference on Electro-Technology for National Development (NIGERCON), Owerri, Nigeria, 7–10 November 2017. [Google Scholar]
- Pal, A.; Chakraborty, A.K.; Bhattacharya, A. Allocation of PV Mounted EV Fast Charging Station in Superimposed System Considering Vehicle Flow. In Proceedings of the 2023 IEEE IAS Global Conference on Renewable Energy and Hydrogen Technologies (GlobConHT), Male, Maldives, 11–12 March 2023. [Google Scholar]
- Benítez, K.; Jaramillo, M.; Muñoz, J.; Barrera-Singaña, C.; Pavón, W. Multi-Objective Analysis for Optimal location and location of Distributed Generation Focused on Improving Power Quality. In Proceedings of the 2023 IEEE IAS Global Conference on Renewable Energy and Hydrogen Technologies (GlobConHT), Male, Maldives, 11–12 March 2023. [Google Scholar]
- Xu, Y.; Kueck, J.D.; Tolbert, L.M.; Rizy, D.T. Voltage and Current Unbalance Compensation Using a Parallel Active Filter. In Proceedings of the 2007 IEEE Power Electronics Specialists Conference, Orlando, FL, USA, 17–21 June 2007. [Google Scholar]
- Al-Ja’afreh, M.A.A.; Mokryani, G. Voltage Unbalance Mitigation in Low Voltage Distribution Networks using Time Series Three-Phase Optimal Power Flow. In Proceedings of the 2021 56th International Universities Power Engineering Conference (UPEC), Middlesbrough, UK, 31 August–3 September 2021. [Google Scholar]
- Nakadomari, A.; Shigenobu, R.; Sugimura, M.; Takahashi, K.; Senjyu, T. A Study on Voltage Unbalance Compensation and Minimizing Loss in Distribution System using SVR. In Proceedings of the 2020 12th IEEE PES Asia-Pacific Power and Energy Engineering Conference (APPEEC), Nanjing, China, 20–23 September 2020. [Google Scholar]
- Bajo, C.G.; Hashemi, S.; Kjsær, S.B.; Yang, G.; Østergaard, J. Voltage unbalance mitigation in LV networks using three-phase PV systems. In Proceedings of the 2015 IEEE International Conference on Industrial Technology (ICIT), Seville, Spain, 17–19 March 2015. [Google Scholar]
- Caldon, R.; Coppo, M.; Turri, R. Voltage unbalance compensation in LV networks with inverter interfaced distributed energy resources. In Proceedings of the 2012 IEEE International Energy Conference and Exhibition (ENERGYCON), Florence, Italy, 9–12 September 2012. [Google Scholar]
- Taiwo, O.P.; Tiako, R.; Davidson, I.E. An improvement of voltage unbalance in a low voltage 11/0.4 kV electric power distribution network under 3-phase unbalance load condition using dynamic voltage restorer. In Proceedings of the 2017 IEEE PES PowerAfrica, Accra, Ghana, 27–30 June 2017. [Google Scholar]
- Ali, N.; Kumar, D. Inverter Control Strategy for Voltage Unbalance Mitigation. In Proceedings of the 2021 1st International Conference on Power Electronics and Energy (ICPEE), Bhubaneswar, India, 2–3 January 2021. [Google Scholar]
- Jahn, R.; Holt, M.; Rehtanz, C. Mitigation of Voltage Unbalances Using a Line Voltage Regulator. In Proceedings of the 2021 IEEE Madrid PowerTech, Madrid, Spain, 28 June–2 July 2021. [Google Scholar]
- Toghranegar, S.; Rabiee, A.; Mohseni-Bonab, S.M. Increasing Unbalanced Distribution Network’s Hosting Capacity for Distributed Energy Resources by Voltage Regulators. IEEE Access 2023, 11, 22664–22679. [Google Scholar] [CrossRef]
- Ashoornezhad, A.; Asadi, Q.; Saberi, R.; Falaghi, H. Optimal Siting and Sizing of Distributed Generation Under Uncertainties Using Point Estimate Method. In Proceedings of the 2023 8th International Conference on Technology and Energy Management (ICTEM), Babol, Iran, 8–9 February 2023. [Google Scholar]
- Norouzi, M.H.; Gholami, M.; Noroozian, R. A comprehensive study of optimal demand management for a distributed network with the EV charging stations. In Proceedings of the 2023 8th International Conference on Technology and Energy Management (ICTEM), Babol, Iran, 8–9 February 2023. [Google Scholar]
- Tang, P.; Cheng, W.; Peng, D.; Li, Z.; Li, Y.; Chu, Y.; Li, B.; Li, N. A novel voltage control strategy for distributed PV based on reactor and energy storage. In Proceedings of the 2023 IEEE 6th Information Technology, Networking, Electronic and Automation Control Conference (ITNEC), Chongqing, China, 24–26 February 2023. [Google Scholar]
- Todorović, I.; Isakov, I.; Reljić, D.; Jerkan, D.G.; Dujić, D. Mitigation of Voltage and Frequency Excursions in Low-Inertia Microgrids. IEEE Access 2023, 11, 9351–9367. [Google Scholar] [CrossRef]
- Li, J.; Hai, Z.; Shuai, Z.; Zhu, L.; Xu, X.; Zhang, C.; Zhao, J. Coordinated Current and Voltage Unbalance Mitigation in Networked Microgrids With Aggregated PV Systems. IEEE Trans. Power Syst. 2023, 38, 968–971. [Google Scholar] [CrossRef]
- Ding, F.; Loparo, K.A. Feeder Reconfiguration for Unbalanced Distribution Systems With Distributed Generation: A Hierarchical Decentralized Approach. IEEE Trans. Power Syst. 2016, 31, 1633–1642. [Google Scholar] [CrossRef]
- Peng, C.; Xu, L.; Gong, X.; Sun, H.; Pan, L. Molecular Evolution Based Dynamic Reconfiguration of Distribution Networks With DGs Considering Three-Phase Balance and Switching Times. IEEE Trans. Ind. Inform. 2019, 15, 1866–1876. [Google Scholar] [CrossRef]
- Alhmoud, L.; Marji, W. Optimization of Three-Phase Feeder Load Balancing Using Smart Meters. IEEE Can. J. Electr. Comput. Eng. 2022, 45, 9–17. [Google Scholar] [CrossRef]
- You, R.; Lu, X. Voltage Unbalance Compensation in Distribution Feeders Using Soft Open Points. J. Mod. Power Syst. Clean Energy 2022, 10, 1000–1008. [Google Scholar] [CrossRef]
- Tuppadung, Y.; Kurutach, W. The Modified Particle Swarm Optimization for Phase Balancing. In Proceedings of the 2006 IEEE Region 10 Conference (TENCON), Hong Kong, China, 14–17 November 2006. [Google Scholar]
- Siti, M.W.; Nicolae, D.V.; Jimoh, A.A.; Ukil, A. Reconfiguration and Load Balancing in the LV and MV Distribution Networks for Optimal Performance. IEEE Trans. Power Deliv. 2007, 22, 2534–2540. [Google Scholar] [CrossRef]
- Kharrazi, A.; Sreeram, V. Mitigation of Voltage Unbalance in Distribution Feeders Using Phase Switching Devices: A Decentralized Control Approach Based on Local Measurements. IEEE Trans. Power Deliv. 2022, 37, 2875–2885. [Google Scholar] [CrossRef]
- Liu, B.; Meng, K.; Dong, Z.Y.; Wong, P.K.C.; Li, X. Load Balancing in Low-Voltage Distribution Network via Phase Reconfiguration: An Efficient Sensitivity-Based Approach. IEEE Trans. Power Deliv. 2021, 36, 2174–2185. [Google Scholar] [CrossRef]
- Shafiqurrahman, A.; Yahyaee, S.A.; Sreekumar, P.; Khadkikar, V. A Novel Decentralized Unbalance Load Sharing Approach For Islanded Microgrids. IEEE Trans. Ind. Appl. 2024, early access. IEEE Trans. Ind. Appl. early access. 2024. [Google Scholar] [CrossRef]
- Wu, Z.; Guo, X.; Wang, B. Coordinated Control Strategy for Cascaded Current-Source Converter Under Unbalanced Grid Voltage. IEEE Transactions on Power Electronics 2024, 39, 5439–5448. [Google Scholar] [CrossRef]
- Photovoltaic Geographical Information System (PVGIS). Available online: https://re.jrc.ec.europa.eu/pvg_tools/en/ (accessed on 20 May 2024).
- EN 50160:2010; Voltage Characteristics of Electricity Supplied by Public Electricity Networks. European Committee for Electrotechnical Standardization: Brussels, Belgium, 2010.
- IEC International Electrotechnical Vocabulary, IEV ref 614-01-331. Available online: https://www.electropedia.org/iev/iev.nsf/display?openform&ievref=614-01-33 (accessed on 20 May 2024).
Disclaimer/Publisher’s Note: The statements, opinions and data contained in all publications are solely those of the individual author(s) and contributor(s) and not of MDPI and/or the editor(s). MDPI and/or the editor(s) disclaim responsibility for any injury to people or property resulting from any ideas, methods, instructions or products referred to in the content. |
© 2024 by the authors. Licensee MDPI, Basel, Switzerland. This article is an open access article distributed under the terms and conditions of the Creative Commons Attribution (CC BY) license (https://creativecommons.org/licenses/by/4.0/).