Article

Network Reconfiguration for Loss Reduction Using Tabu Search and a Voltage Drop

by
Dionicio Zocimo Ñaupari Huatuco
1,*,
Luiz Otávio Pinheiro Filho
2,
Franklin Jesus Simeon Pucuhuayla
1 and
Yuri Percy Molina Rodriguez
2,*
1
Faculty of Electrical Engineering, National University of Engineering, Lima 15333, Peru
2
Center of Alternative and Renewable Energy, Federal University of Paraíba, João Pessoa 58051-900, PB, Brazil
*
Authors to whom correspondence should be addressed.
Energies 2024, 17(11), 2744; https://doi.org/10.3390/en17112744
Submission received: 26 October 2023 / Revised: 27 November 2023 / Accepted: 28 December 2023 / Published: 4 June 2024
(This article belongs to the Section F: Electrical Engineering)

Highlights

What are the main findings?
  • A method for the systematic calculation of voltage differentials between component buses is introduced, providing a well-informed starting point crucial to the successful implementation of tabu search algorithms.
  • A hybrid approach to generate neighborhoods which incorporates both voltage differences and randomness is adopted. This ensures consistently robust solutions at search speeds surpassing deterministic algorithms. The overall convergence is effective, yielding positive results in most cases.
What is the implication of the main finding?
  • The main findings suggest a notable advancement in electrical network reconfiguration. Because it involves systematic voltage differential calculations and a hybrid neighborhood-generation approach, the proposed methodolgy promises enhanced efficiency. With an optimized initial solution and sustained robustness, the method is well-positioned to assist in the successful implementation of tabu search algorithms. Positive convergence results affirm the method's practical feasibility, offering improved solutions for minimizing losses in real-world electrical network reconfiguration.

Abstract

:
This paper introduces a new algorithm designed to address the challenge of distribution network reconfiguration, employing the tabu search metaheuristic in conjunction with the voltage drop concept. Distinguishing itself from existing methods, our proposed approach not only utilizes voltage drop for obtaining the initial solution but also introduces a novel technique for generating a candidate solution neighborhood. This method leverages both randomness and voltage drop, ensuring a smooth and steady descent during algorithm execution. The primary goal of our algorithm is to minimize active power losses within distribution networks. To validate its effectiveness, the proposed method underwent testing on three commonly referenced distribution systems: the 33-Bus, 69-Bus, and 94-Bus systems, widely acknowledged in the literature. A pivotal aspect of our work involves the synergy of the tabu search algorithm with a combination of both random and deterministic methods for generating neighbors. This strategic amalgamation plays a crucial role, enabling rapid execution while consistently yielding high-quality solutions. Additionally, the adoption of the electric distance method for generating the initial solution adds significant value, offering a commendable solution with minimal computational effort. Comparative assessments against other algorithms documented in the literature underscore the superior efficiency of our proposed algorithm.

1. Introduction

The relentless rise in global demand for electrical energy, as well as society’s growing reliance on it, necessitates the development of an efficient, dependable, continuous, stable, and low-cost electrical system. The electrical power system is responsible for the generation, transmission, and distribution of energy in society. The distribution system is in charge of getting electricity to end-users. At this point, the most significant power losses [1] occur.
Conducting studies on the reconfiguration of the distribution system to reduce losses and improve the voltage profile, among other purposes, is one of the actions that energy firms can take to improve energy supply.
The traditional reconfiguration study seeks to find an optimal topology that generates the lowest possible losses in the system under study. The system topologies are generated by opening or closing the switches present in the system distribution. The reconfiguration problem does not involve the installation of new equipment or new power generation. The only costs of the reconfiguration are those associated with opening or closing switches, which are negligible [2].
The reconfiguration problem is combinatorial, as it depends on the number of switches existing in the system. In this way, as a switch can assume two states, open or closed, a system with n switches can have 2 n candidate solutions for the network topology.
Due to the combinatorial nature of the problem, as it depends on the number of switches existing in the system, a system with n switches can have 2 n candidate solutions for the network topology. This way, deterministic approaches become practically unfeasible [3]. Therefore, there is a need to use computational algorithms and tools that substantially reduce the number of solutions to be tested and find a possible optimal or close-to-optimal solution with a substantially reduced and affordable computational cost.
The pioneers of the reconfiguration heuristic were Merlin and Back [4], who provided a heuristic that started with a meshed network and opened the switches progressively, considering the branch whose removal would limit the power flow as little as is feasible. One of their algorithm’s shortcomings was that the power flow computation only took into account the real part of the current.
The branch exchange approach, suggested by Civanlar et al. [5], entails attempting to recombine related branches in order to minimize losses. They devised a criterion based on the terminal voltage of the typically opened switches to limit the search to only those configurations that result in loss reduction due to the high number of candidate configurations. However, the search space only contains a subset of the possible network configurations, which is still dependent on the initial system configuration.
Niknam and Farsani [6] proposed a hybrid evolutionary algorithm for solving the distribution feeder reconfiguration. Their algorithm is a combination of SAPSO (self-adaptive particle swarm optimization) and MSFLA (modified shuffled frog leaping algorithm). The main idea of integrating SAPSO and MSFLA was to use their advantages and avoid their disadvantages. The algorithm was tested in two distribution systems.
There has been an increase in the technical literature on the usage of heuristics based on biology or physics since the 2000s, highlighting the use of meta-heuristics. Meta-heuristics, according to Glover [7], guide and modify other heuristics, resulting in better results than conventional heuristics. The meta-heuristic tabu search is often applied in the reconfiguration problem.
Jeon and Kim [8] presented a hybrid method that used tabu search and simulated annealing techniques to solve real-world problems. According to the authors, the tabu search strategy uses a descent algorithm to find a solution, but it cannot ensure convergence; simulated annealing, on the other hand, avoids local minima by accepting an increase in the optimization function, but at a high computational cost.
To diversify the search in unexplored regions, Abdelaziz et al. [9] presented an algorithm built with tabu search with a tabu list of an adaptable size conforming to the size of the system, as well as a new procedure of generating solutions called constrained move.
The article referenced as [10] presents a comparison between two well-known metaheuristic algorithms employed for solving combinatorial optimization problems, specifically focusing on network reconfiguration problems. The methods under investigation in this study are simulated annealing and tabu search. To assess the performance of simulated annealing and tabu search, the researchers applied these algorithms to address network reconfiguration problems in power systems, specifically focusing on the 16 and 33 buses systems. These systems serve as standard test cases that are widely employed in the field.
Garcia et al. [11] introduced a methodology targeting two optimization challenges: the strategic placement of voltage collapse monitors, and system reconfiguration to enhance voltage collapse indices. Their proposed algorithm, leveraging the tabu search technique, addresses these issues, particularly in the context of distributed generation within the system. The effectiveness of the algorithm is assessed through rigorous testing, specifically employing the IEEE-57 system as a benchmark for evaluation.
Bagheri et al. [12] proposed an algorithm with tabu search applied to reconfiguration that is capable of working in systems with distributed generation. The algorithm works out the problem of the sizing, reconfiguration, operation, and allocation of distributed generation considering the financial costs, losses, and injected reactive power for distributed generation.
Mohamed et al. [13] innovatively introduced a novel algorithm, termed modified tabu search and Harper sphere search (MTS-HSSA), designed to maximize energy savings in both balanced and unbalanced distribution power systems. This algorithm combines system reconfiguration and optimal capacitor bank selection. Rigorous testing on diverse scenarios, including IEEE 33-bus, 119-bus, and 123-bus unbalanced distribution systems with distributed generators, demonstrated its efficacy. The results indicated a superior performance in terms of energy savings when compared to existing methods documented in the literature. This underscores the effectiveness of the proposed algorithm in achieving optimal capacitor bank choices and system reconfigurations, showcasing its potential for advancing energy efficiency in distribution power systems.
Sayed et al. [14] present a SHADE optimization algorithm to perform the reconfiguration problem, along with the integration of distributed generation units and shunt capacitors in the system. Maximizing the hosting capacity (HC) of the distributed generation units and reducing network power losses in addition to improving the voltage profile have been considered optimization objectives. The authors used the 33-Bus and the 59-Bus systems.
The tabu search metaheuristic has consistently proven its effectiveness in solving various energy system problems. Building upon this, we propose a novel tabu search-based method designed to uncover high-quality solutions for three commonly encountered distribution systems in the literature: the 33-Bus, 69-Bus, and 94-Bus systems.
The main contributions of the proposed method are:
  • A method for calculating the voltage drop between the component buses of the meshes in order to generate an initial solution. This approach allows the tabu search algorithm to begin with a good solution, which is necessary for tabu search techniques to be implemented successfully;
  • The hybrid neighborhood-generating method leverages the voltage drop information, which is a critical factor in energy systems, to guide the search process. By considering the voltage drop, the algorithm can focus on areas where improvements are most needed, ensuring that the generated solutions adhere to voltage stability requirements. This approach enhances the algorithm’s ability to explore promising regions of the solution space efficiently;
  • The proposed method has demonstrated remarkable success in terms of achieving favorable conditions for initializing the initial solution and sustaining a productive neighborhood throughout the optimization process. This approach ensures that the algorithm starts from a promising point in the solution space, enhancing its chances of finding optimal solutions.
This work is organized as follows: Section 2 presents the theoretical foundation to be used in the work, such as the reconfiguration problem, the classic tabu search algorithm, and the concept of the Δ V used in this work; Section 3 presents the proposed method for the tabu search algorithm and its modifications; Section 4 describes the application of the proposed method to the reconfiguration problem; Section 5 presents the results obtained from the simulations and discusses these results; and, finally, Section 6 presents the conclusions of the study and the achievements of the work.

2. Theoretical Foundation

In this section, the distribution network reconfiguration problem, the classic tabu search algorithm, and the Δ V concept will be explained.

2.1. Distribution Network Reconfiguration Problem

In electrical power distribution systems, reconfiguration involves evaluating the status (open or closed) of each of the sectioning or connecting switches in the system.
The reconfiguration problem is a minimization problem with an objective function and constraints. There are different objective functions presented in the technical literature, including enhancing the voltage profile, rebalancing loads between feeders, and, most importantly, decreasing active losses in conductors. The latter is the objective function that will be employed in this project.
As a result, the goal of this research is to find a distribution network system architecture that minimizes conductor losses while also meeting operational constraints.

2.1.1. Objective Function

The fitness function of the reconfiguration problem is to minimize system losses given by:
f ( s ) = l = 1 N l r l · i l 2 ,
where f ( s ) is the sum of all active losses in the distribution system conductors; N l is the number of lines in the distribution system; r l is the resistance of the l line; i l is the electric current passing through the l line; and s is the solution for the system with some switches closed and some switches open.

2.1.2. Constraints

  • Voltage Constraints:
    The voltage in the bus must satisfy the minimum and maximum limits, as follows:
    E m i n E k E m a x ,
    where E m i n is the minimum and E m a x is the maximum voltage value allowed for a given bus k. Commonly adopted values are 0.95 pu and 1.05 pu. This condition is valid for all buses in the system.
  • Current Constraints:
    The current limit constraint on the branch is due to the technical characteristics of the branch used in the distribution system. The current passing through a line ( i l ) cannot exceed the maximum current supported by that line ( i l m a x ), as in:
    i l i l m a x .
  • Radiality Constraints:
    The act of opening and closing switches in a distribution system must be performed in such a way that the system’s radiality is preserved. Radiality is defined as the lack of meshes in the system as well as the fulfillment of all related loads. The conditions for the imposition of radiality employed in this work are taken from Lavorato et al. [15] and are given below:
    • Condition 1: the solution must have A = n b n b s ; where A is the number of active branches, n b is the number of buses in the system, and n b s is the number of substation buses in the system;
    • Condition 2: The system must be connected. This implies that, in addition to the fact that the system must be connected to some substation, all loads must be attended to.

2.2. Classic Tabu Search Algorithm

Tabu search (TS) [7] is a metaheuristic procedure, the philosophy of which is to derive and exploit a collection of intelligent problem solving strategies, based on implicit and explicit learning procedures to exploit an adaptive memory framework, which is an important feature of artificial intelligence [16].
The motions described above are carried out with the goal of arriving at a satisfactory solution while taking into account some function f ( s ) that must be minimized or maximized [7].
Each solution s belonging to a search space S has a neighborhood N ( s ) S , and each solution s N ( s ) is obtained by a movement mechanism [17]. Tabu search algorithms solve algorithms as follows:
minimize s f ( s ) subject to s S ,
where s is a possible solution, f ( s ) is the objective function (fitness function) according to the solution s, and S is the search space. Optimization problems also commonly have constraints to be met. Before explaining the algorithm itself, it is interesting to define the basic concepts, as seen in [18,19]:
  • Initial solution: a feasible solution from the problem, namely, an initial solution, which is generally obtained by using the heuristic rule;
  • Current solution: a possible solution to the problem;
  • Movement: mechanism for generating a new solution by applying a perturbation in the current solution;
  • Neighborhood: A feasible solution is derived from the original feasible solutions by searching with the movement strategy by determining which conforms to the problem constraints;
  • Tabu List: list of last performed moves prohibited from being performed again by T iterations. In practice, the presence of the tabu list prevents cycling in the algorithm;
  • Aspiration Criteria: list of criteria for a solution containing movements from the tabu list to be adopted as the current solution. If a generated neighbor is the best solution ever found but has moves in the tabu list, it can be accepted as the current solution.
With these notions in mind, the algorithm can be described as follows: begin with a solution that satisfies the constraints. A neighborhood with multiple surrounding solutions is produced from this solution using the movement mechanism; verify that these neighbors meet the constraints. This is the new current solution if the best neighbor (according to the minimization function) is not in the tabu list and fits the aspiration requirements. If such a neighbor is on the tabu list but does not match the aspiration requirements, repeat the test for the second-best neighbor and so on until you find a neighbor who is not on the tabu list. Add the moves of this solution to the tabu list after selecting the new current solution. The fitness of the current solution is then tested to find out if it is the best discovered; if it is, the solution is kept as B e s t S , the fitness as B e s t F i t , and the iteration number as B e s t I t e r . When a preset number of iterations without an update on B e s t S are completed, the tabu search algorithm stops.
One observation about the tabu list is that it has a predetermined size T and, when it is filled, every set of new moves is added, and the oldest ones are removed and can be chosen again as the current solution.

2.3. The Kirchhoff’s Circuit Laws and the Voltage Drop

Kirchhoff’s Laws were first introduced in 1847 by the German physicist Gustav Robert Kirchhoff and are formally known as Kirchhoff’s law for current (KCL, or Kirchhoff’s point rule) and Kirchhoff’s law for voltage (KVL, or Kirchhoff’s mesh rule) [20].
  • Kirchhoff’s law for current says that the algebraic sum of currents entering into the bus is zero [20], i.e.:
    n = 1 N i n = 0 ,
    where N is the number of branches connected to the bus and i n is the n-th current entering or leaving the bus.
  • Kirchhoff’s law for voltage says that the algebraic sum of all voltages around a closed path (or loop, or mesh) is zero [20], i.e.:
    m = 1 M v m = 0 ,
    where M is the number of voltages in the loop (loads, sources, conductors, etc.) and v m is the m-th voltage.
Ohm’s Law, which states that a voltage v in a resistor is directly proportional to the current i through it, along with the concept presented by KVL, raises an important concept, which is the voltage drop between two buses.
In this way, according to KVL, between two buses where there is an element connected, there is a voltage drop. And according to Ohm’s Law, the greater the current over a resistive element, the greater the voltage in the element, which means that, if there is a resistive element between two buses, a large current passing through that element will produce a large voltage drop between these buses.
In accordance with the electrical theory, which states that electrical power is directly proportional to the voltage drop and current, it can be inferred that, in a resistive element where a large current is passing, there will be a large dissipation of active power.
In order to better understand it, the power dissipation between the two buses shown in Figure 1 can be analyzed. Thus, for a large current flowing through the conductor, there will be a large power dissipation in the conductor. This implies that the greater the voltage difference between two buses ( Δ V ), the greater the power dissipation between those two buses.
Δ V = V b u s 1 V b u s 2 .

3. The Modified Tabu Search Algorithm

Before explaining the algorithm used in this work, it is interesting to comment on a few words about the software OpenDSS version 9.4.0.3, used in this work. For the losses, voltages, and several other variables to be obtained from a distribution system, it is necessary to calculate the power flow. There are several algorithms capable of calculating a power flow, such as Newton–Raphson, Gauss–Seidel, Decoupled Newton, and several others. In this work, all data related to the power flow come from OpenDSS.
OpenDSS software is an embracing simulation tool for electrical systems that allows it to be controlled by various software platforms, such as C#, Python 3.10.5, MATLAB, Microsoft Office and others. OpenDSS uses two algorithms capable of solving the power flow: the current injection method (CIM) and the Newton method. The first one is faster and used by default. The second is mostly used for complex systems [21].
Having made these observations about the power flow and OpenDSS, it is possible to start exploring the algorithm proposed in this work, starting with the initial solution and then with the neighborhood generation method.

3.1. Initial Solution Using the Voltage Drop Δ V

As explained in Section 2.3, a large voltage difference between two buses can indicate that a high current passes through the conductor that connects the two buses. Consequently, there would also be a large power dissipation in the conductor, which would produce many losses to the system.
Applying them to the distribution systems, it would be logical to open these switches that are between buses with large Δ V that probably have large power dissipation and a large current passage; however, this would lead to opening the probable main feeders of the distribution system, where it must elapse a lot of energy. It is important, then, for the reconfiguration problem to minimize losses, to open the switches that possibly produce little loss, and for their opening to probably not cause problems for the system. Shirmohammadi and Hong [22] proposed something similar with currents, opening the switches that had the smallest chain within each mesh of the system.
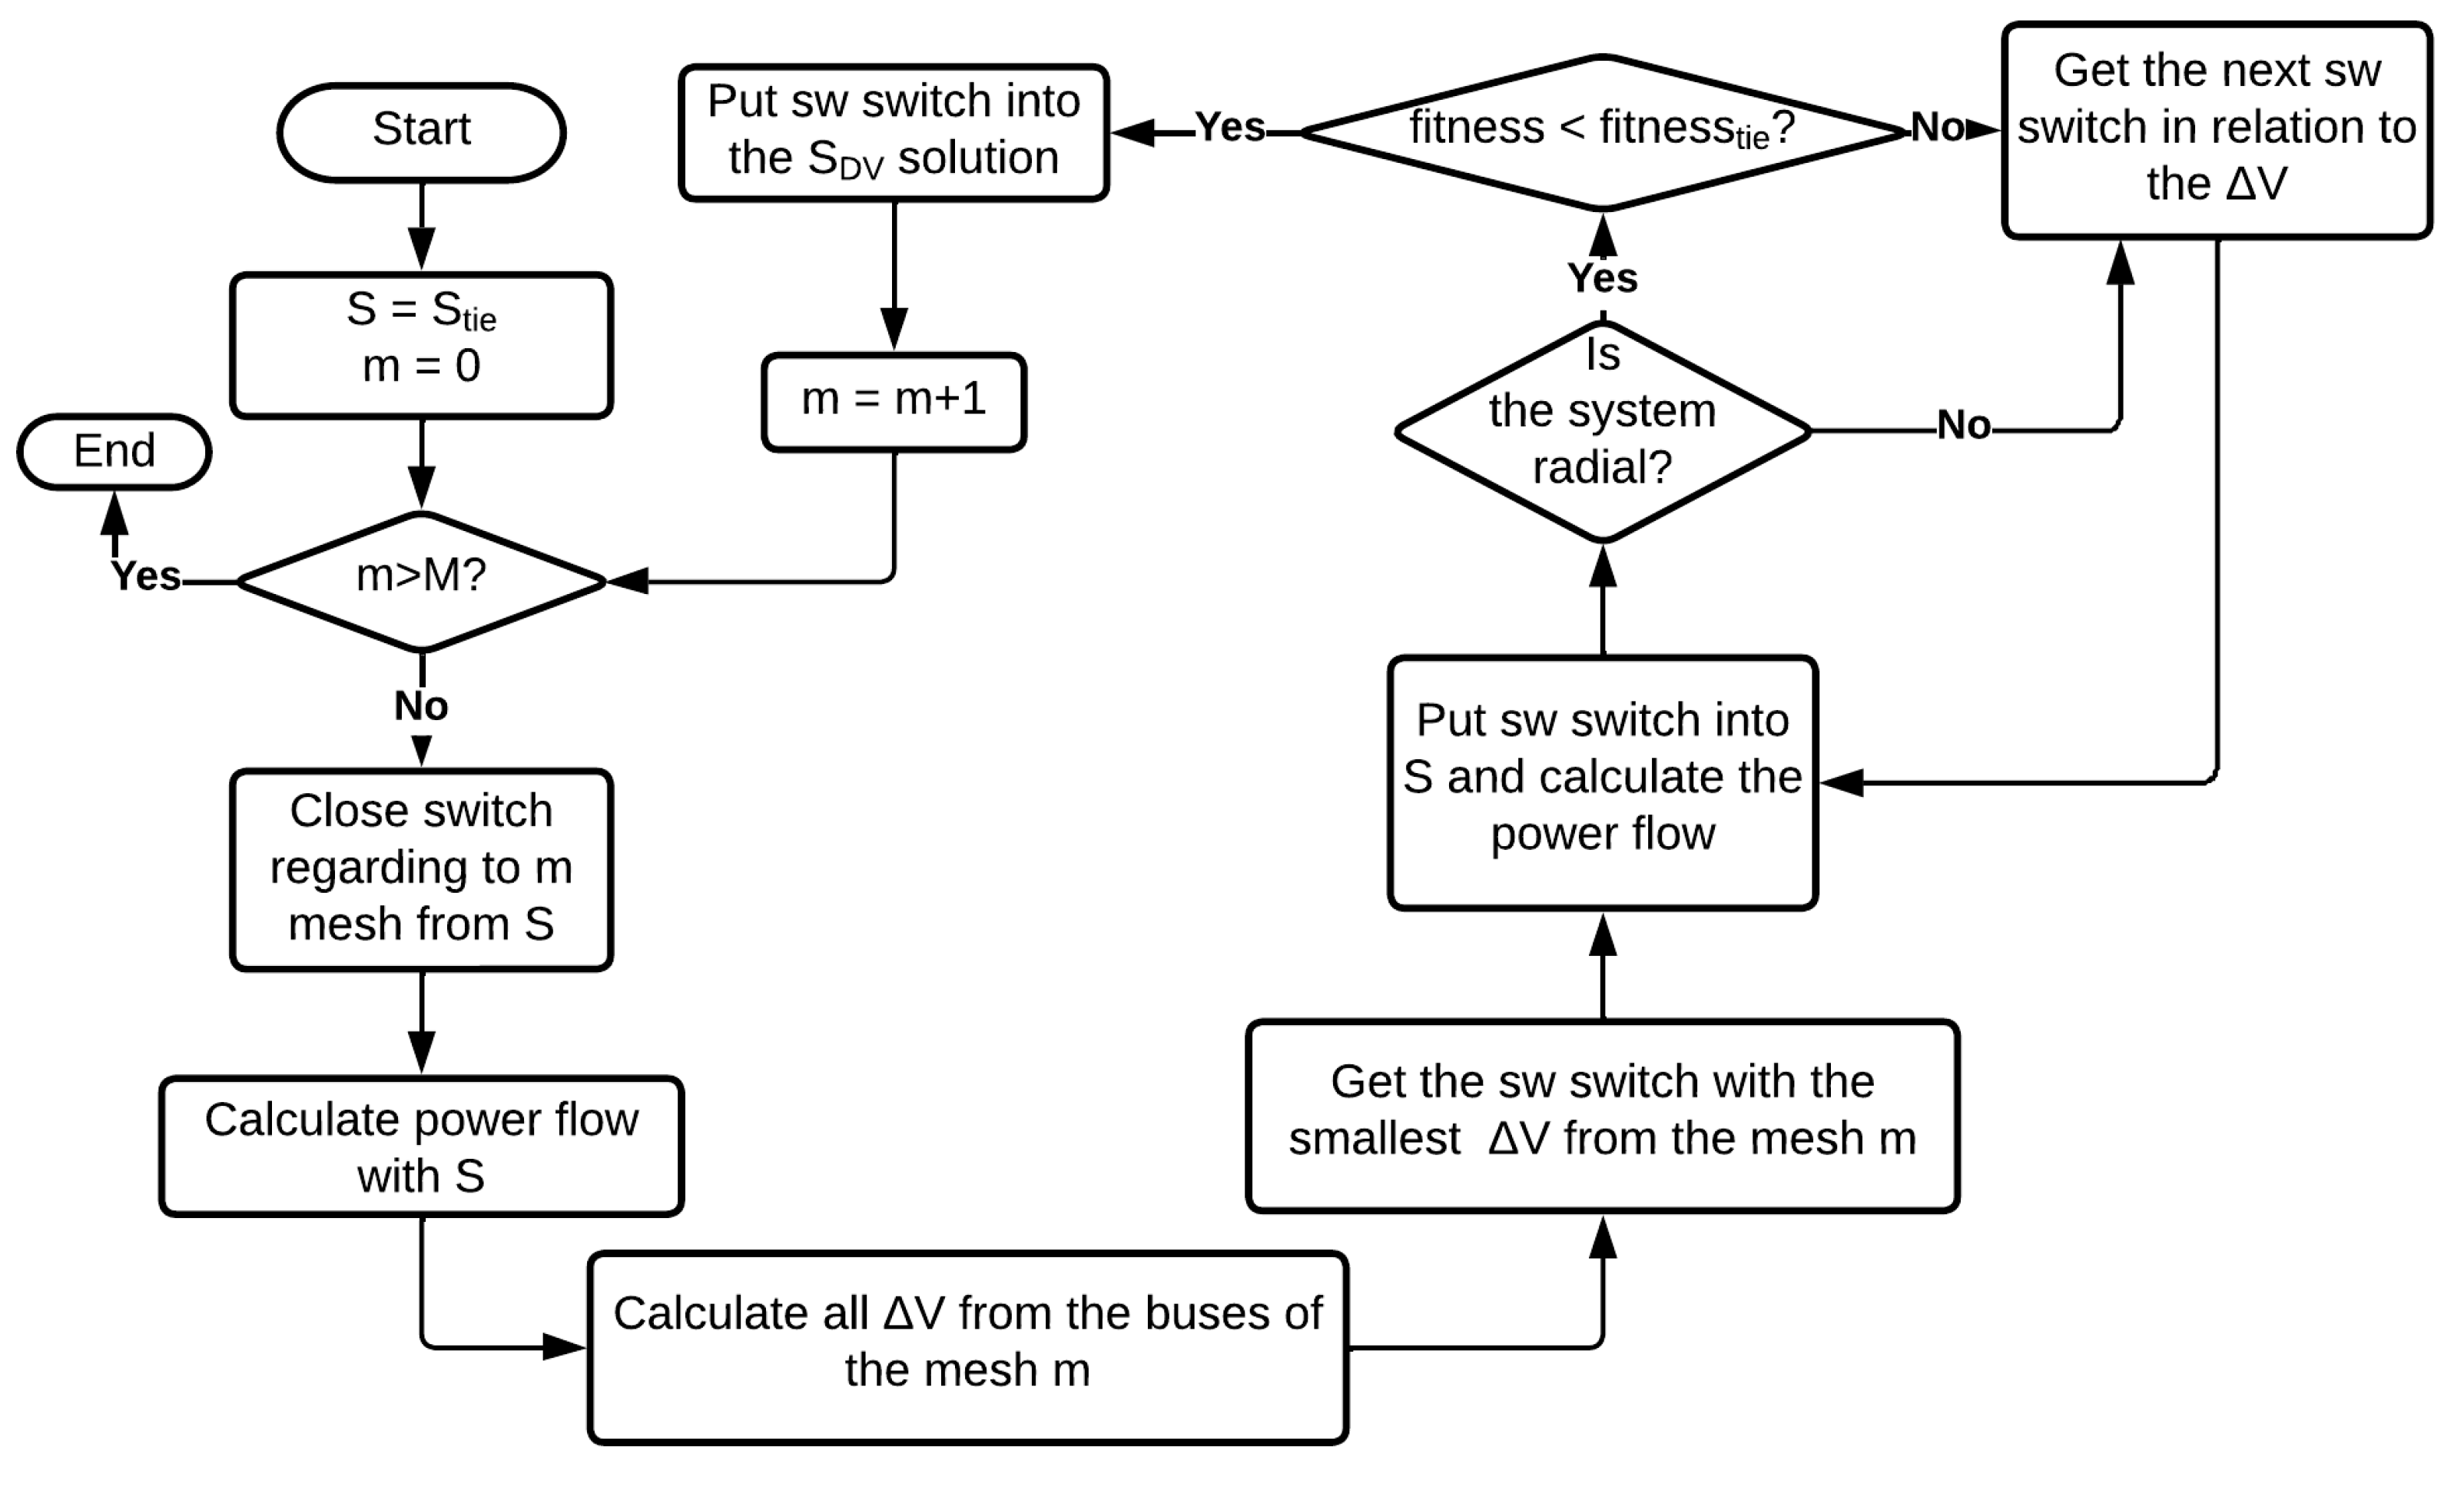
The proposed algorithm for generating an initial solution starts with a radial system, opened with the tie switches used in the literature for the system. The algorithm closes the first switch (it can be any switch), getting a mesh in the system. Then, the power flow is calculated and all the Δ V of the mesh that has just been formed are calculated, that is, all the Δ V between buses connected by a conductor in that mesh. The currently opened switch will be closed and the switch corresponding to the conductor with the lowest Δ V will be opened.
Then, the power flow is recalculated and the radiality condition is tested. If the solution is not radial, the test with the switch that has the second smallest Δ V is performed and so on, until the solution becomes radial again. If the solution is radial and there is a decrease in active losses (in the fitness function), then this switch is saved as part of the solution. Then, the algorithm closes the second tie switch, thus obtaining a second mesh that is different from the first one, already using the first switch obtained from the first mesh process to calculate the power flow. The Δ V of the second mesh is calculated and then the process for obtaining the new switch is the same process already explained for the first mesh. This process is repeated for all switches and loops in the distribution system. With all switches renewed, the new solution can be used as an initial solution for the tabu search algorithm. The algorithm flowchart is shown in Figure 2.

3.2. The Hybrid Neighborhood Algorithm

A satisfying neighborhood is crucial for the progress of tabu search algorithm results. The neighborhood is generated by perturbing the current solution with a movement mechanism. Chiang and Jumeau [23] and several other authors, [9,17,24], for example, employed a mechanism called add/subtract to generate neighbors.
In the first place, it is interesting to denote the variables to be used from now on. M is the number of switches that shall be opened in order for the system to be radial (but remember, this is not the only condition); M can also be called the system dimension number. Ω X is the set of switches belonging to mesh X, after closing all tie switches. For example, in a system with M meshes after closing all tie switches, the first mesh to be analyzed has an Ω 1 set of switches, the second mesh has an Ω 2 set and so on. The order of analysis of the meshes is not important. It is also interesting to note that each set of switches contains all the sectionalizing and tie switches belonging to that mesh X. In these sets, the switches are ordered according to their geographic position, which means that physically neighboring branches are also neighbors in the set of switches.
The proposed algorithm presents a hybrid approach that incorporates two distinct methods to generate neighboring solutions. During even iterations, the algorithm employs a methodology that prioritizes randomness, while during odd iterations, the focus shifts to the differences in voltages ( Δ V ) within the system. Notably, the algorithms for both methods share a remarkable similarity, with the sole variation being the approach used to select the subsequent switch, also referred to as the moving mechanism.
Therefore, both algorithms start by analyzing the current solution S. The index of the first switch of S in the set Ω 1 is found. Right now, there is a difference between the algorithms:
  • For a random algorithm: the algorithm randomly chooses whether the new switch will be immediately to the left or right of the currently opened switch and then chooses the new switch;
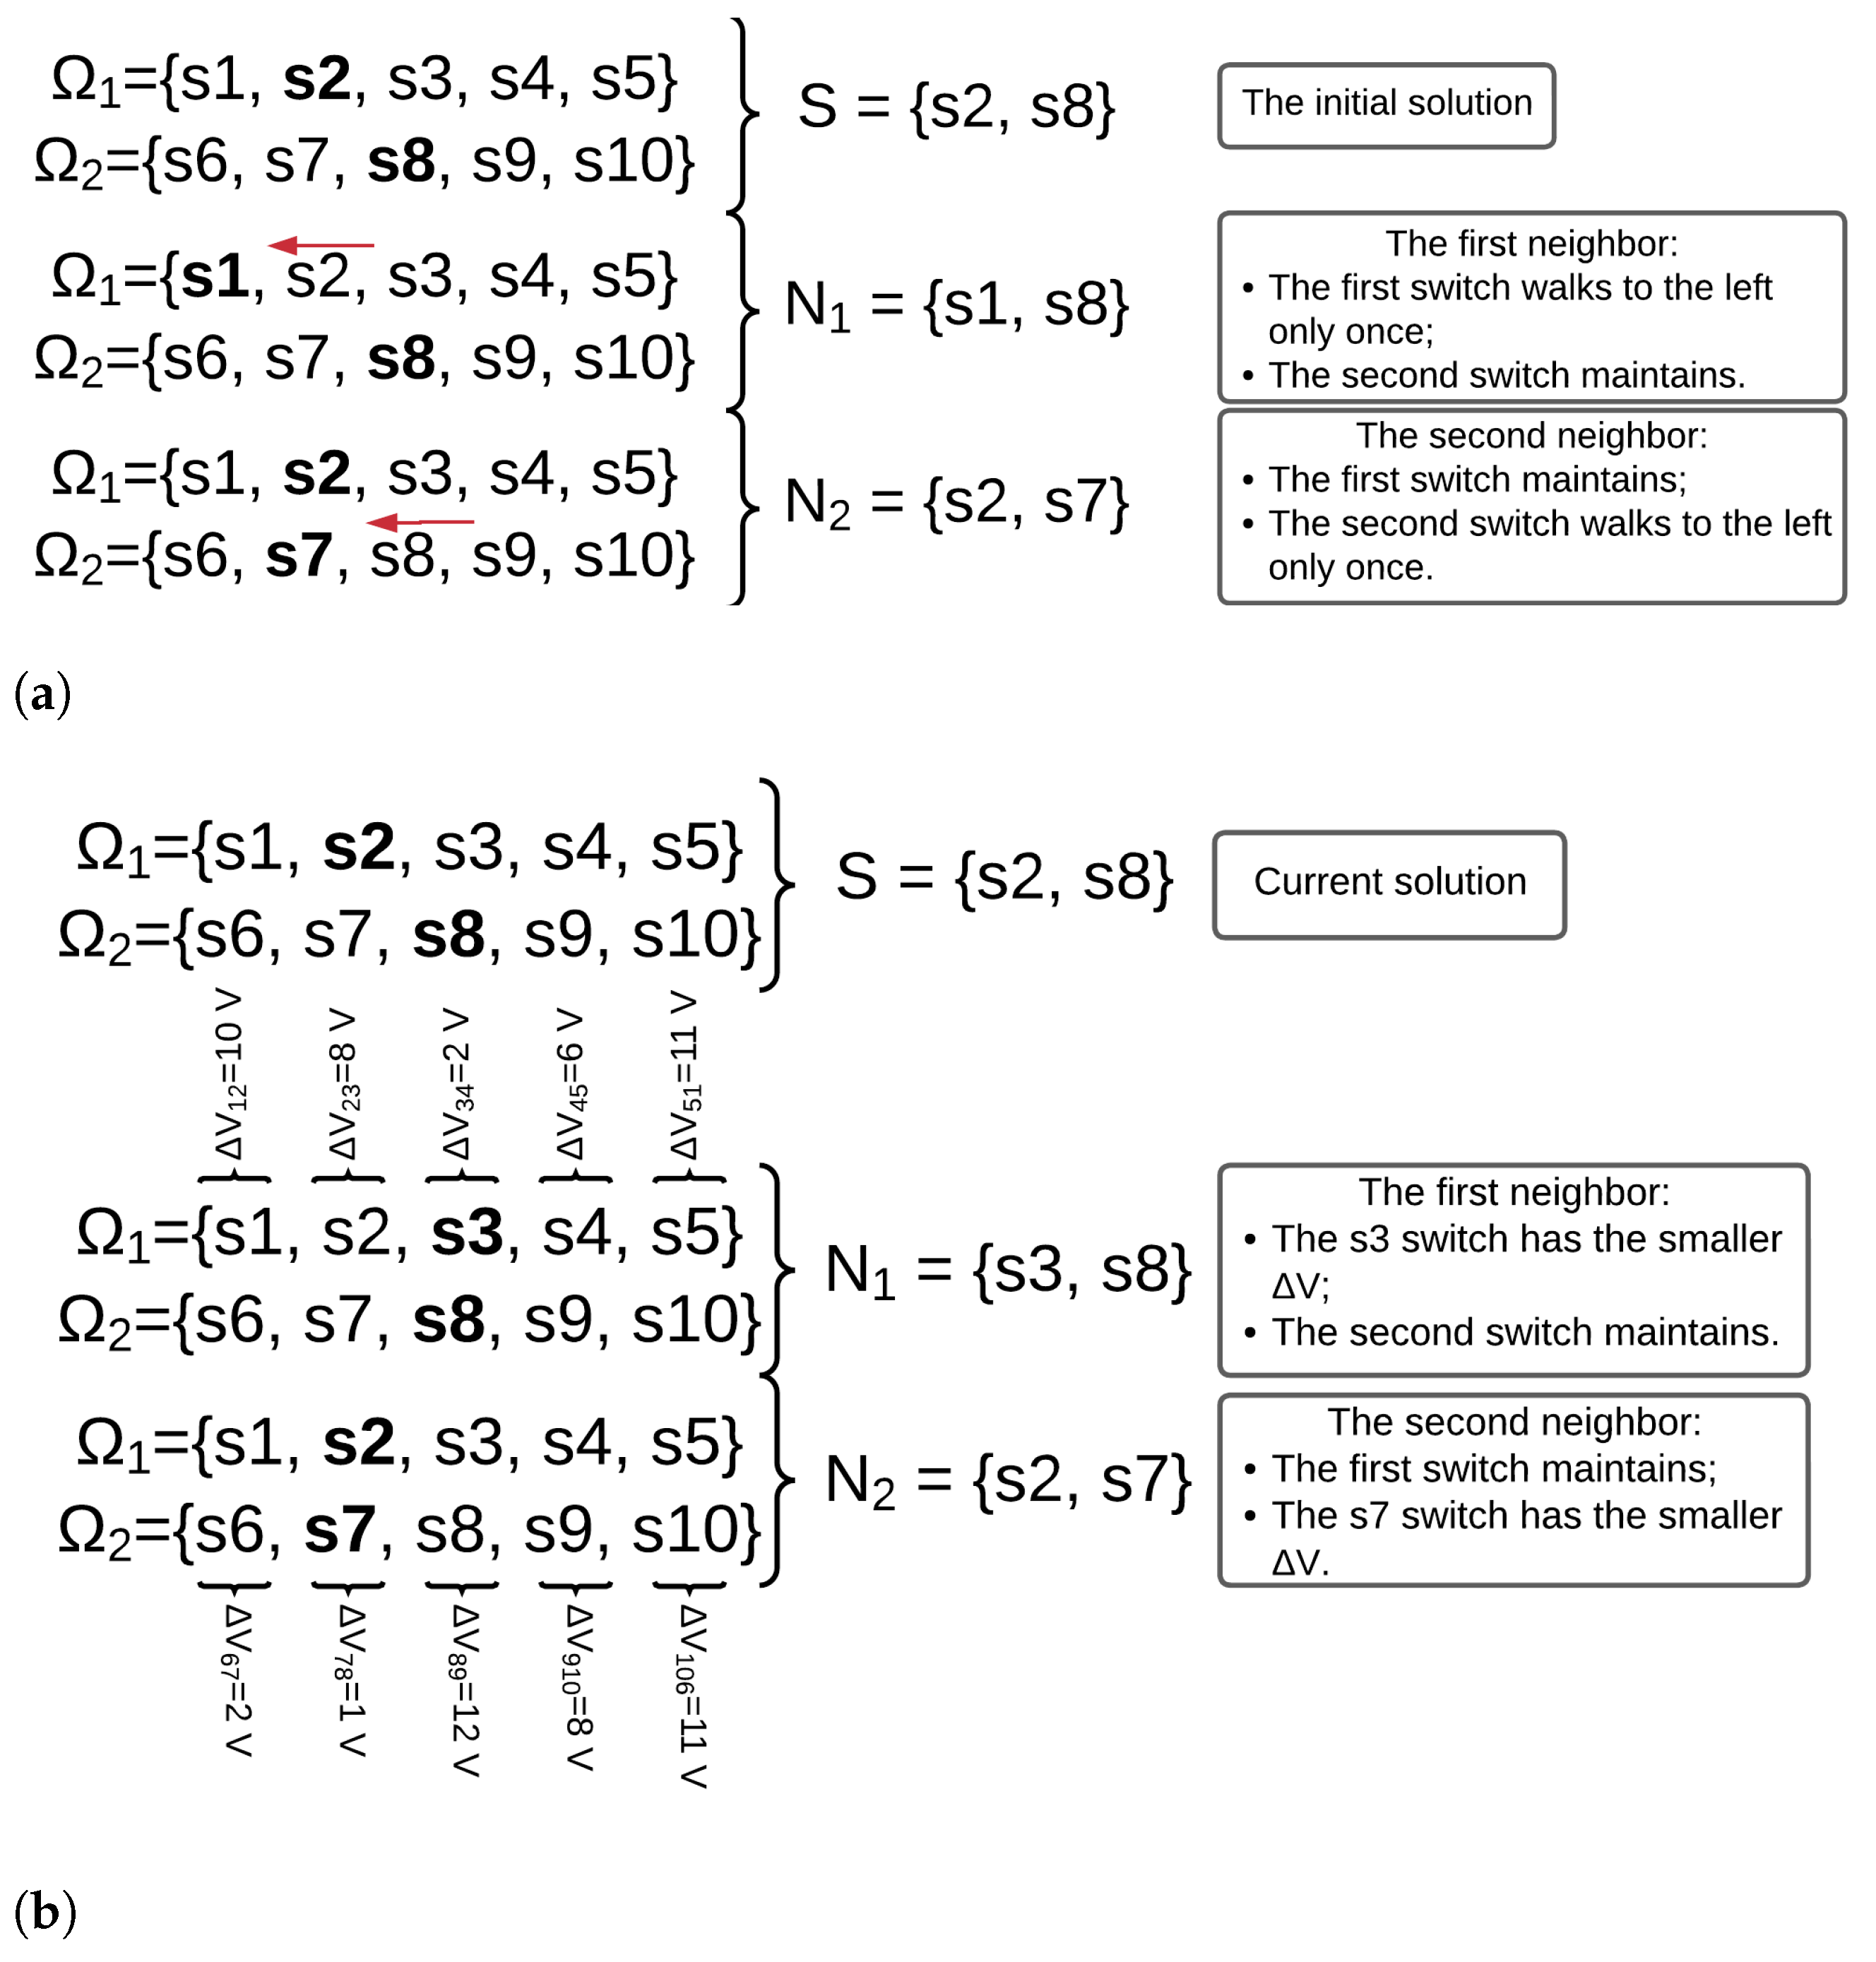
  • For the Δ V algorithm: all the Δ V between the buses that have conductors connecting them within that mesh are calculated and then the chosen switch is the one with the smallest Δ V .
With the new chosen switch opened and the old switch closed, the other switches of the other meshes are not modified and then the first neighbor is created.
For the second neighbor, the process is repeated, but now for the second mesh and the switch set Ω 2 . But notice that the first switch (from the first mesh) for the second neighbor is still the switch to the current solution S. The algorithm will produce M neighbors since only one neighbor was created for each mesh of the system.
However, there is a way to generate more than M neighbors, both for the Δ V algorithm and for the algorithm with an emphasis on randomness:
  • For the algorithm with an emphasis on randomness: after generating the M neighbors that were generated by choosing the switch immediately lateral to the switch of S, it is possible to obtain neighbors going further, selecting not only those immediately to the left or immediately to right but also the second switch to the left or right and so on. To avoid this, the method is also limited to “walking” only to the number of switches that the smallest mesh has, to avoid having very distant neighbors;
  • For the Δ V algorithm: after generating the M neighbors that were generated with the smallest Δ V of each mesh, it is possible to generate other M neighbors with the second smallest Δ V of each mesh and so on, up to the size of the smallest mesh of the system as was done for the case of randomness.
Thus, the variable created to inform the number of neighbors to be generated by the algorithm is N N b (number of neighbors).
For example, consider a system with M = 2 meshes, Ω 1 = s 1 , s 2 , s 3 , s 4 , s 5 and Ω 2 = s 6 , s 7 , s 8 , s 9 , s 10 . Consider the current solution S = s 2 , s 8 . In order to better illustrate the proposed structure of the generated neighbors, considering that N N b = 2 , Figure 3 shows the random algorithm and the Δ V algorithm. Consider that, for the random one, the algorithm chose the left movement.

4. Application of the Modified Tabu Search

The modified tabu search algorithm for the reconfiguration problem can be observed by following these steps:
  • In this step, the lines, switches, loads, and feeds are added, as well as the variables B T M a x (number of iterations without improvement), T (size of the tabu list), M a x I t e r (maximum number of iterations), and N N b (number of neighbors to be generated at each iteration) are set;
  • Get the initial solution using the Δ V method, as seen in Section 3.1;
  • The iterative loop begins. I t e r = I t e r + 1 . If I t e r is even, neighbors with an emphasis on randomness are generated. If I t e r is odd, the neighbors of the voltage differences Δ V are generated. Each neighbor already tracks its active loss value for that topology;
  • The neighborhood is ordered according to the losses that each neighbor generates, in ascending order of losses, that is, the first neighbor will be the best, as it will have the lowest loss value. This neighbor is selected;
  • If this neighbor is the best solution found during this iteration, the new S will be this neighbor (by the aspiration criterion); if not, the neighbor will be checked if any switch is on the tabu list. If not, it will be the new S solution. If it is in the tabu list, the algorithm will select the second best neighbor and perform the described test again until it finds a neighbor that has no switches on the tabu list. With the new S chosen, the tabu list is updated;
  • If this new S solution is the best found, save it as B e s t S (best solution ever found), save its losses as B e s t F i t (best fitness ever found), and save the iteration number as B e s t I t e r ;
  • Check the stopping criteria: if ( I t e r B e s t I t e r ) is greater than B T M a x or if I t e r reaches the value of M a x I t e r , the algorithm stops and goes to step 8. If none of the criteria are met, go to step 3;
  • Show the results: the best solution found, the losses of the best solution, and the minimum and maximum voltages of this solution.

5. Simulations and Results

In this section, the algorithm is executed for three distribution feeder systems used in the technical literature. The parameters for this system are B T M a x , T, N N b , and M a x I t e r = 2000 . It is worth saying that the tests were conducted with Python, on an Intel® Core i7-7500 CPU @ 2.70 GHz 8 GB RAM.

5.1. Initial Solution Method Results

Before commenting on the results for the entire proposed modified algorithm, it is valid to comment on the results obtained only with the Δ V initial solution. The proposed method obtained a better solution than the default solutions with open tie switches proposed by the authors who presented the systems. The method presents good initial solutions for the 33-Bus by Baran and Wu [25] and the 94-Bus by Su and Lee [26] systems, as can be seen in Table 1. This table relates the default initial solution for the systems and the initial solution obtained from the Δ V method proposed in this work. One can see that there is a reduction in the active losses for both systems we presented.
With these reductions in system losses, the initial solution generation algorithm proves to be efficient for obtaining solutions with less active losses for the system using an algorithm with low computational cost.

5.2. Case 1: 33-Bus System

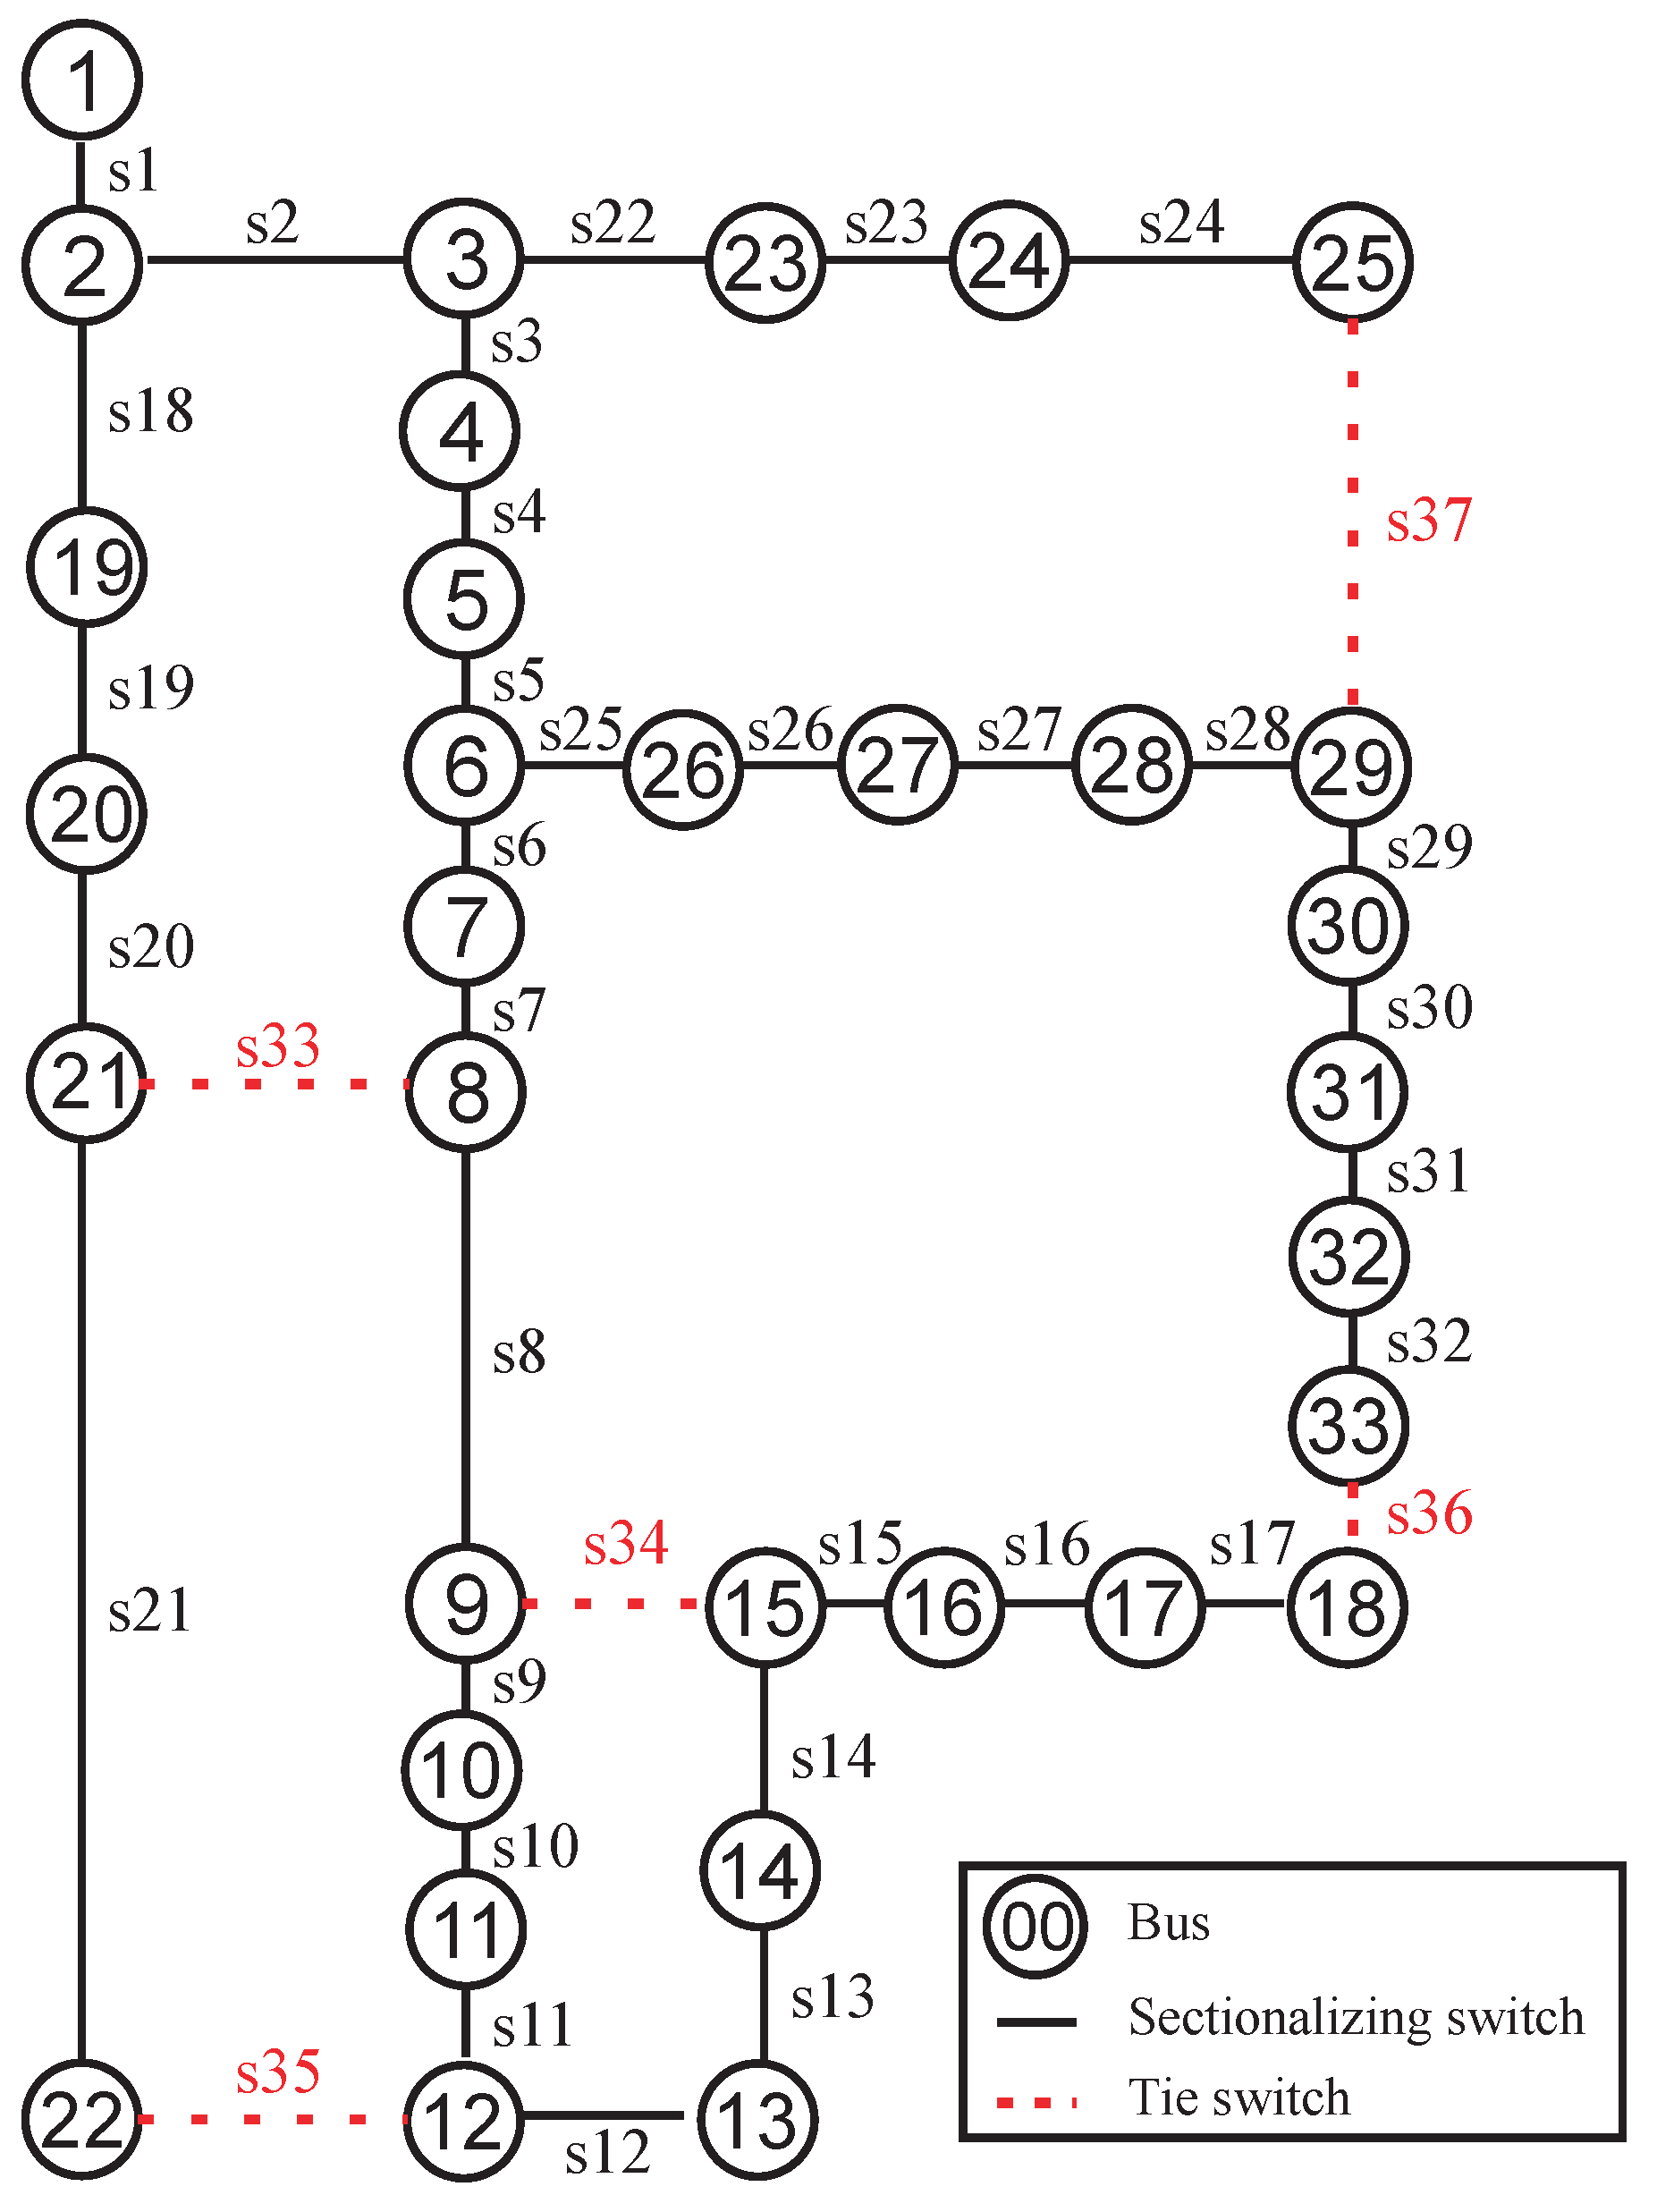
Baran and Wu’s 33-Bus system [25] has 37 branches, 32 of which are normally closed switches (sectionalizing switches), and five switches are normally opened (tie switches). With all switches closed, the system forms 5fivemeshes. The system voltage is 12.66 kV, total active loads are 3715 kW and reactive loads are 2300 kvar. The system is represented in Figure 4, where its sectionalizing switches, from s1 to s32, are represented by continuous lines, while the tie switches, from s33 to s37, are represented by dashed lines. The system presents 202.63 kW of losses before the reconfiguration is performed.
The best solution found by the proposed algorithm is to open switches s7, s9, s14, s32, and s37 and keep the other switches closed. The active losses of this solution are 139.56 kW and represent a reduction of 31.12% in comparison with the system before reconfiguration and the average time for conducting a test was 0.5 s. The same solution was found by [1,17,24].
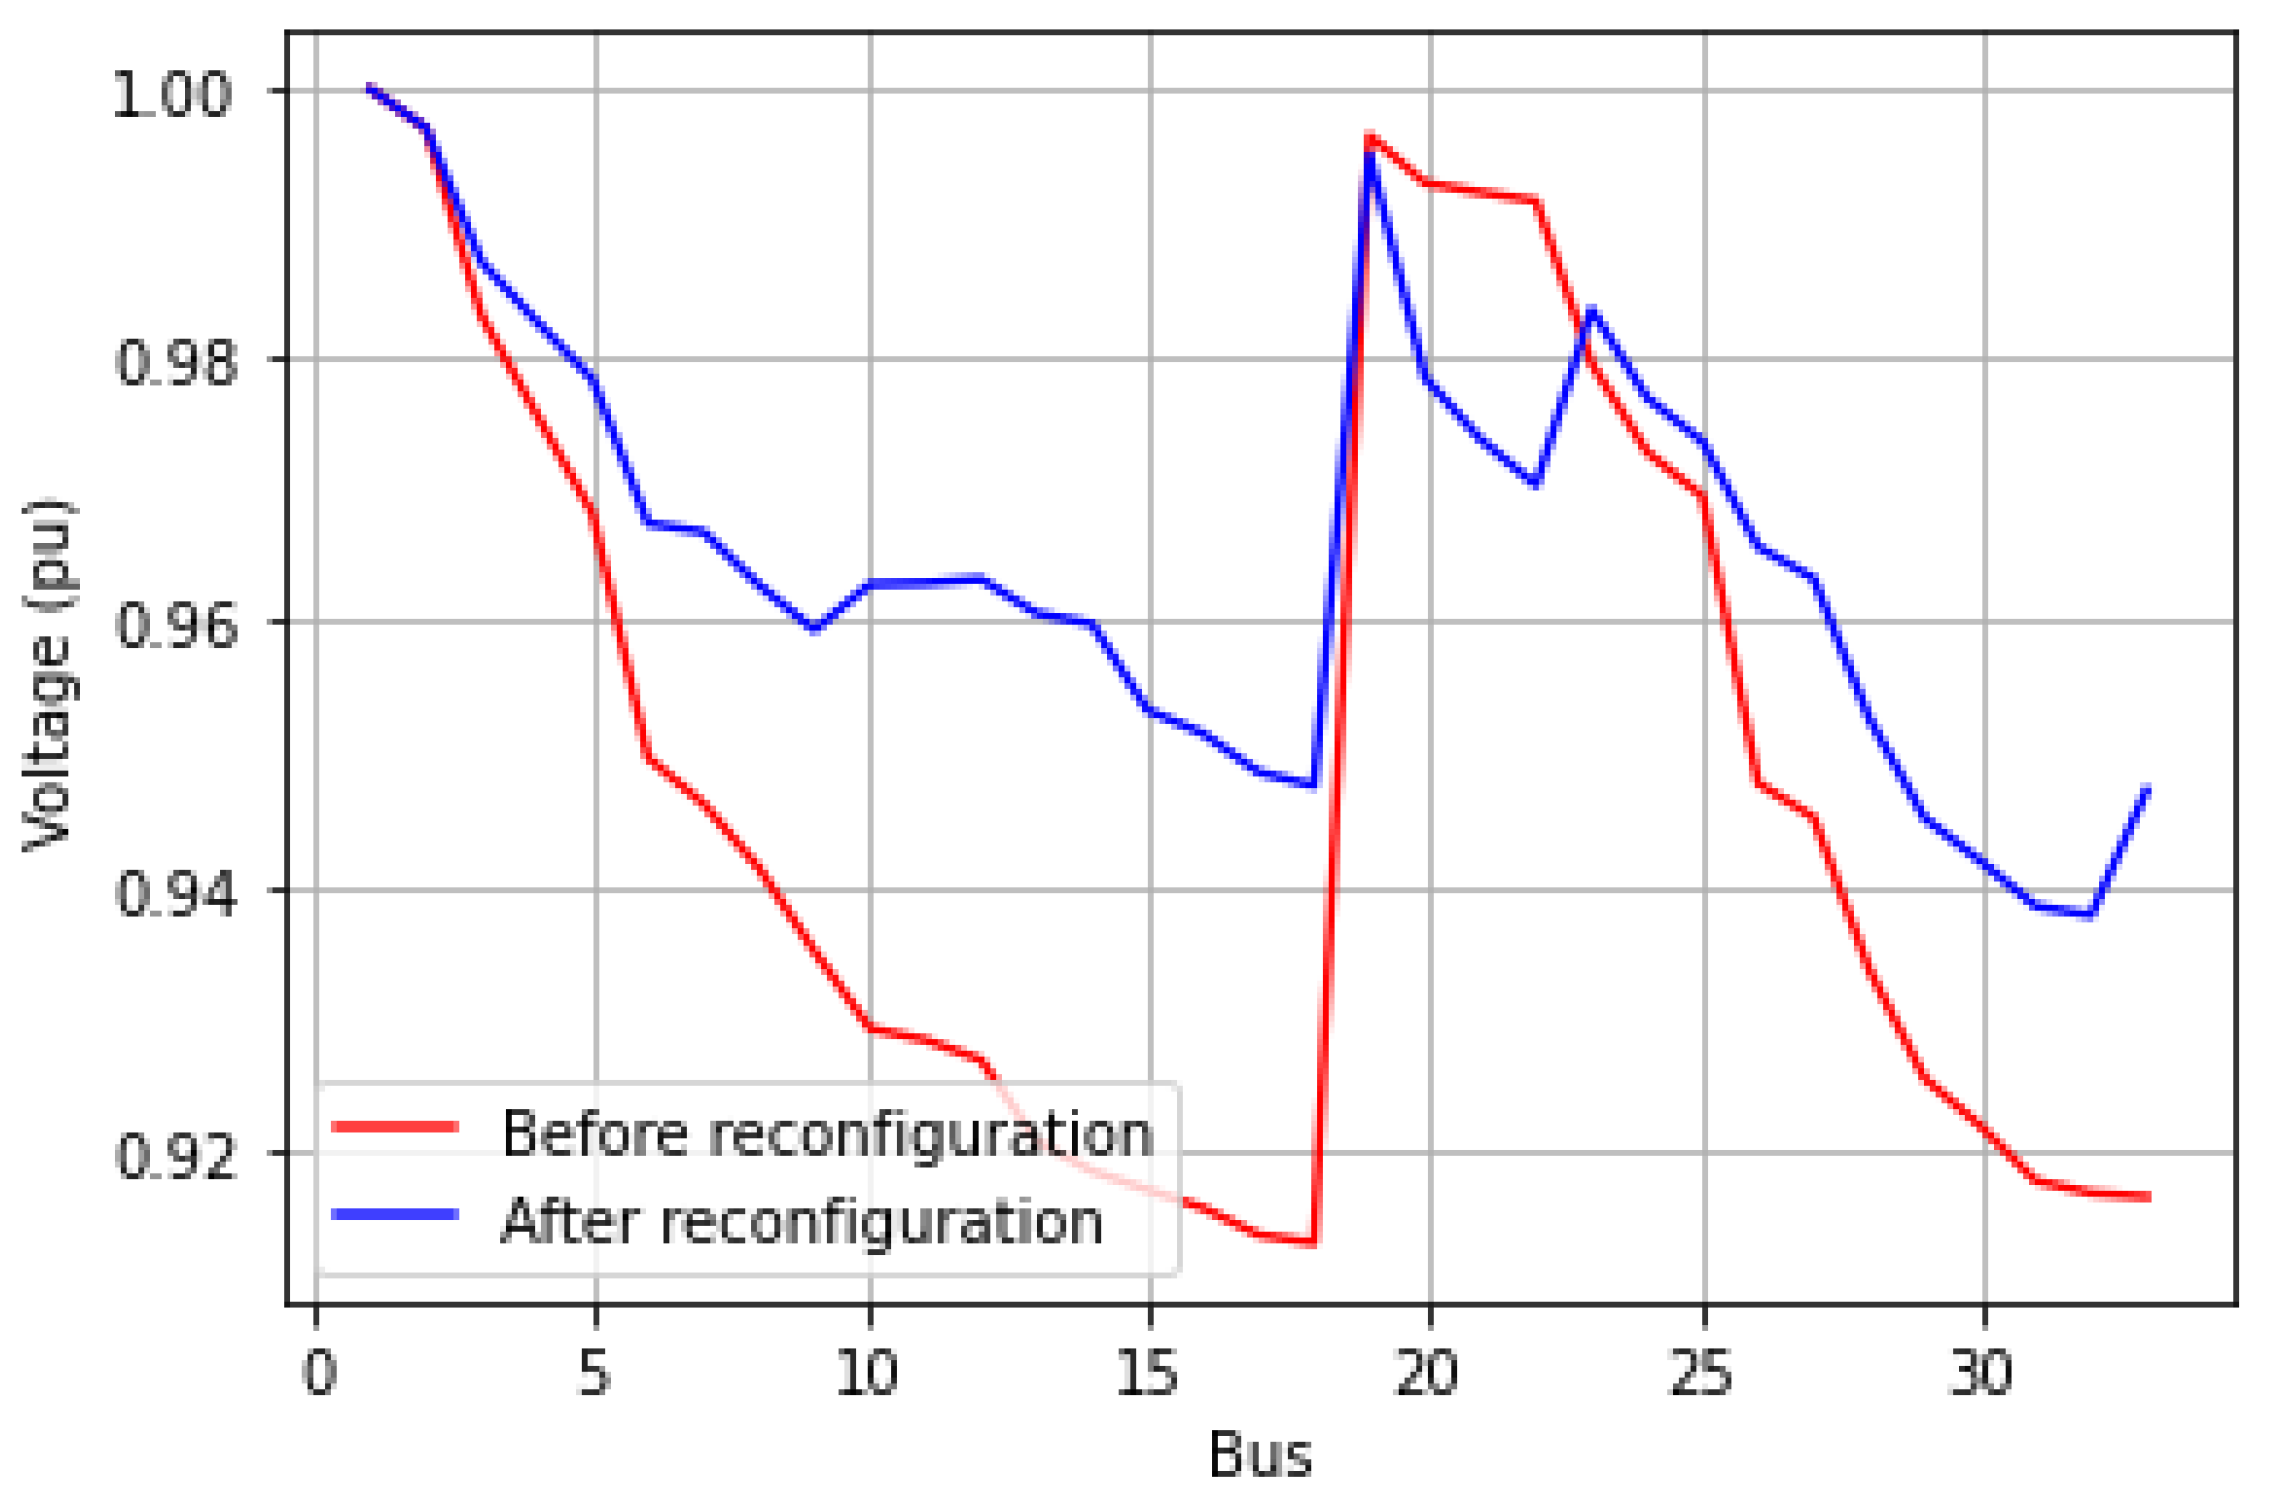
There was also a considerable upgrade in the voltage profile of the system. Before reconfiguration, the smallest voltage at a bus was 0.9174 p.u. and, after reconfiguration, the minimum voltage was 0.9378 p.u. The voltages according to the bus are shown in Figure 5.
To validate the proposed method, a series of tests were conducted using various combinations of B T M a x , T, and N N b . As illustrated in Table 2, it is observed that higher values of B T M a x or N N b correlate with an increased likelihood of achieving 100% success in 100 algorithm executions. However, based on numerous conducted tests, it became evident that, for T values exceeding 5, the system efficiency experiences a decline. This decline is attributed to the limited size of the 33-Bus system, which does not support larger tabu list sizes effectively. The intricate nature of the 33-Bus system’s meshes, characterized by their relatively small size, implies that larger tabu lists could encompass an excessive number of switches, consequently impeding the algorithm’s execution efficiency.
It is interesting to make comparisons with other reconfiguration methods with tabu search available in the technical literature. The proposed algorithm generates 100 optimal solutions for 100 executions, using the same values for the variables B T M a x , T, and N N b for the proposed algorithm and the algorithms of other authors. The variables were B T M a x = 15 , T = 2 , and N N b = 5 . Table 3 brings the results obtained for the proposed algorithm and other algorithms.

5.3. Case 2: 69-Bus System

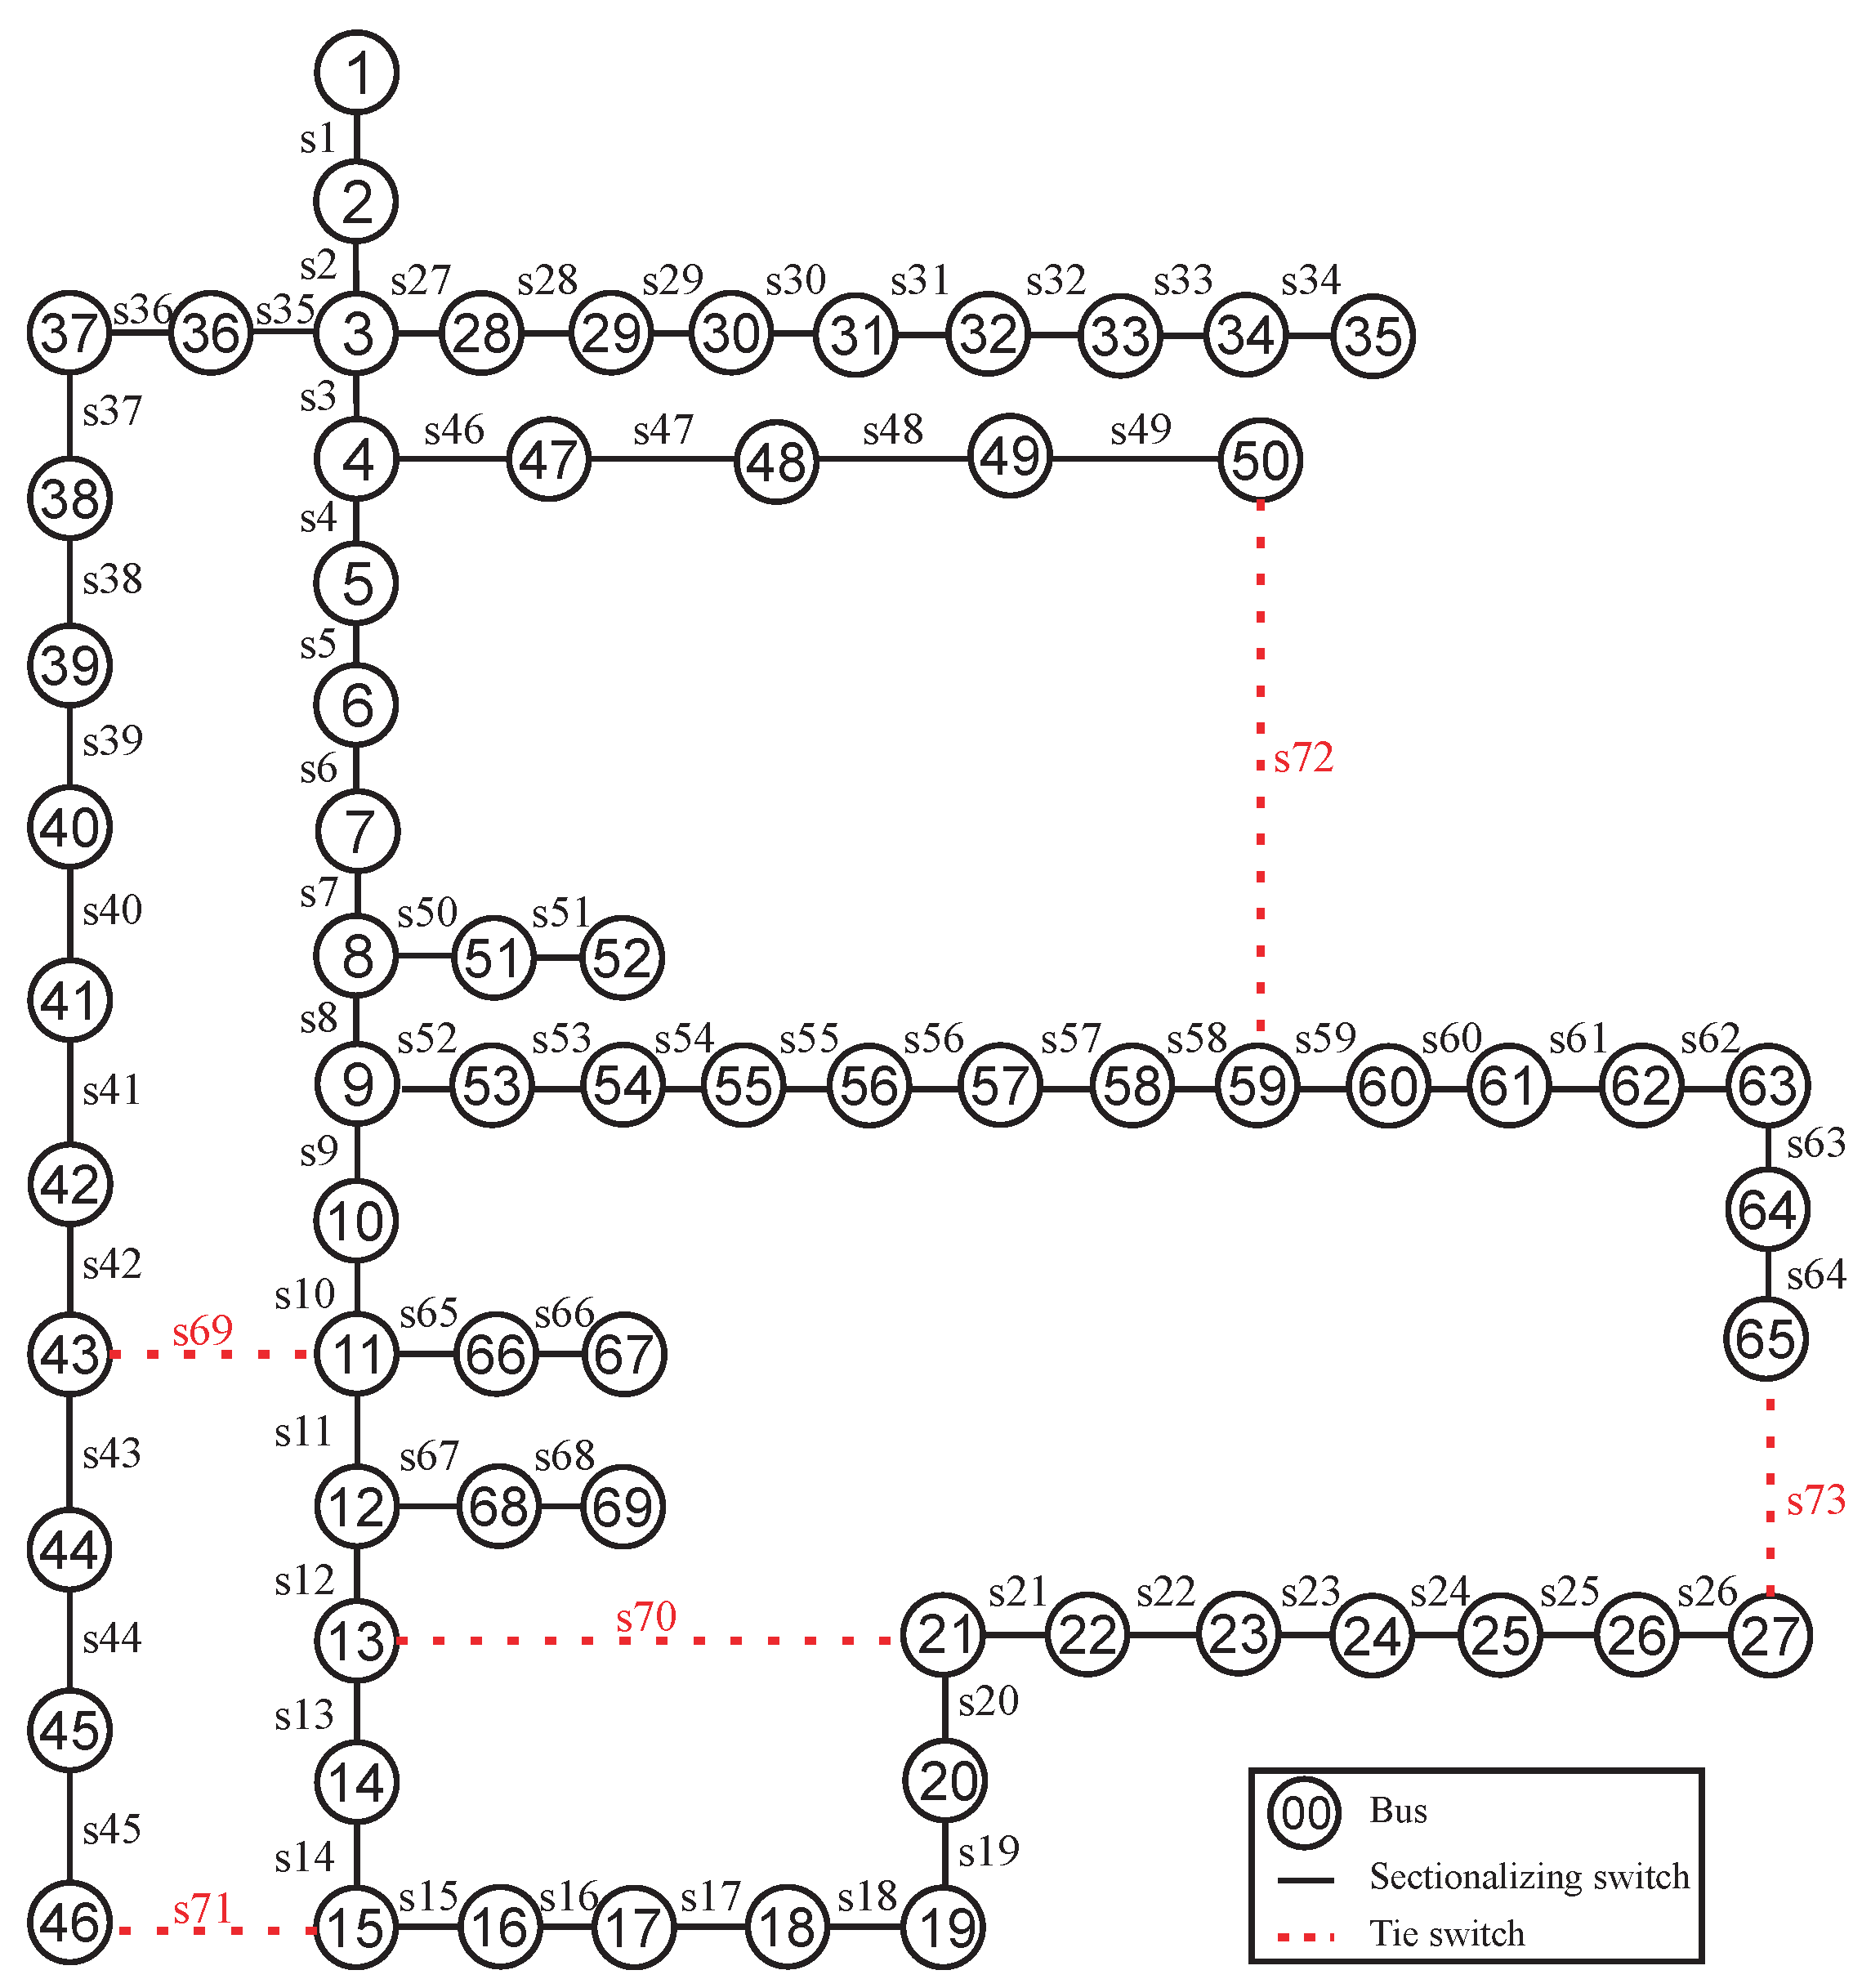
The 69-Bus system, as designed by Savier and Das [27], comprises 73 branches and operates at a voltage of 12.66 kV. Each branch is equipped with a switch, resulting in sixty-eight normally closed switches and five normally opened switches (tie switches). The one-line diagram of this system is depicted in Figure 6. The sectionalizing switches, labeled from s1 to s68, are represented by solid lines, while the tie switches, labeled from s69 to s73, are illustrated with dashed lines. Similar to the 33-Bus system, the closure of tie switches forms five loops, rendering the system five-dimensional. In the configuration where the tie switches are open, the system exhibits line losses of 224.96 kW.
The optimal solution identified by the proposed algorithm involves opening switches s14, s55, s61, s69, and s70 while keeping the remaining switches closed. This configuration results in active losses of 98.47 kW, showcasing a substantial reduction of 56.17% compared to the system’s state before reconfiguration. Impressively, the average time required for conducting a test was a mere 1.4 s, underlining the efficiency of the algorithm in swiftly achieving high-quality solutions.
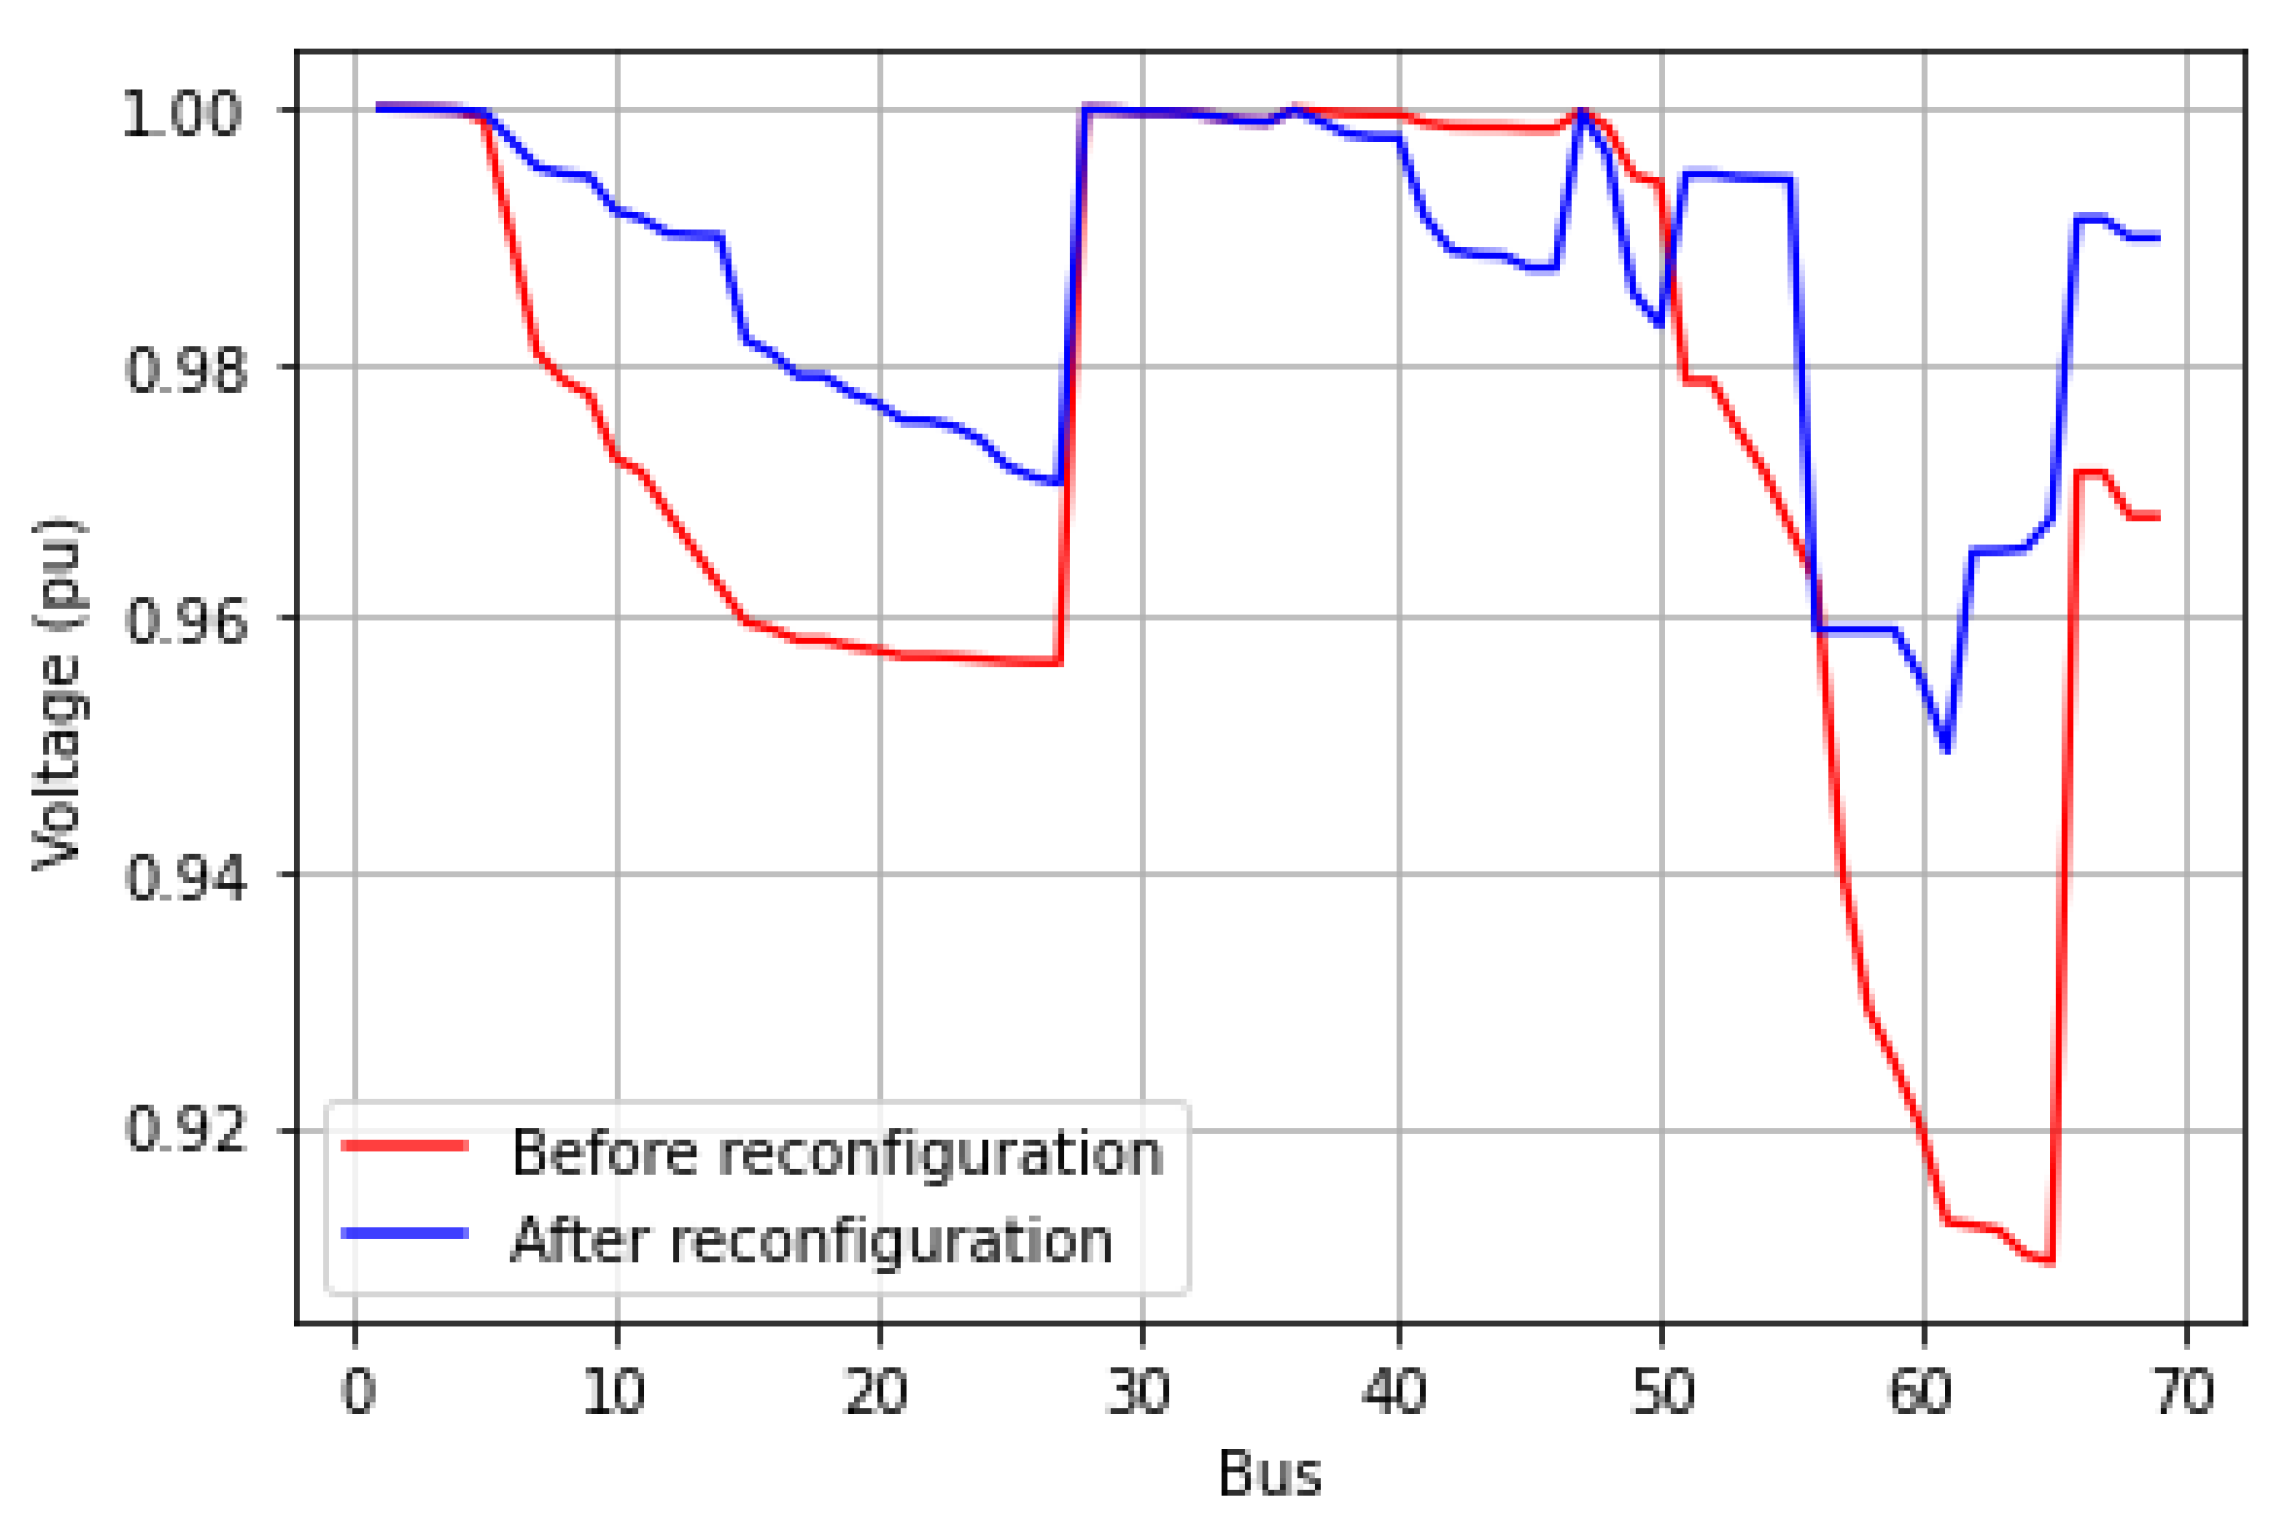
There was also a considerable upgrade in the voltage profile of the system. Before reconfiguration, the smallest voltage at a bus was 0.9174 p.u. and, after reconfiguration, the minimum voltage was 0.9378 p.u. The voltages according to the bus are shown in Figure 7.
To validate the proposed method, a series of tests were conducted with varying combinations of B T M a x , T, and N N b . As illustrated in Table 4, an increase in either B T M a x or N N b is associated with a higher likelihood of achieving success in 100 algorithm executions. However, extensive testing revealed that, for T values exceeding 15, the system efficiency begins to decline. This decrease can be attributed to the limited capacity of the 69-Bus system to accommodate large tabu list sizes effectively. Larger tabu lists may encompass an excessive number of switches, thereby rigidifying the execution of the algorithm.
Comparisons with various reconfiguration methods employing tabu search from the technical literature can offer insightful perspectives. In our proposed algorithm, we generated 100 optimal solutions across 100 executions, utilizing values for the variables B T M a x , T, and N N b that are identical to those employed in algorithms by other researchers. Specifically, the set values for these variables were B T M a x = 20 , T = 15 , and N N b = 15 . The results, presented in Table 5, showcase the performance of our proposed algorithm alongside other algorithms. Notably, our method demonstrated superior speed compared to the analyzed alternatives. It is essential to highlight that all four algorithms underwent execution under identical conditions, encompassing the same parameters and computational environment.

5.4. Case 3: 94-Bus System

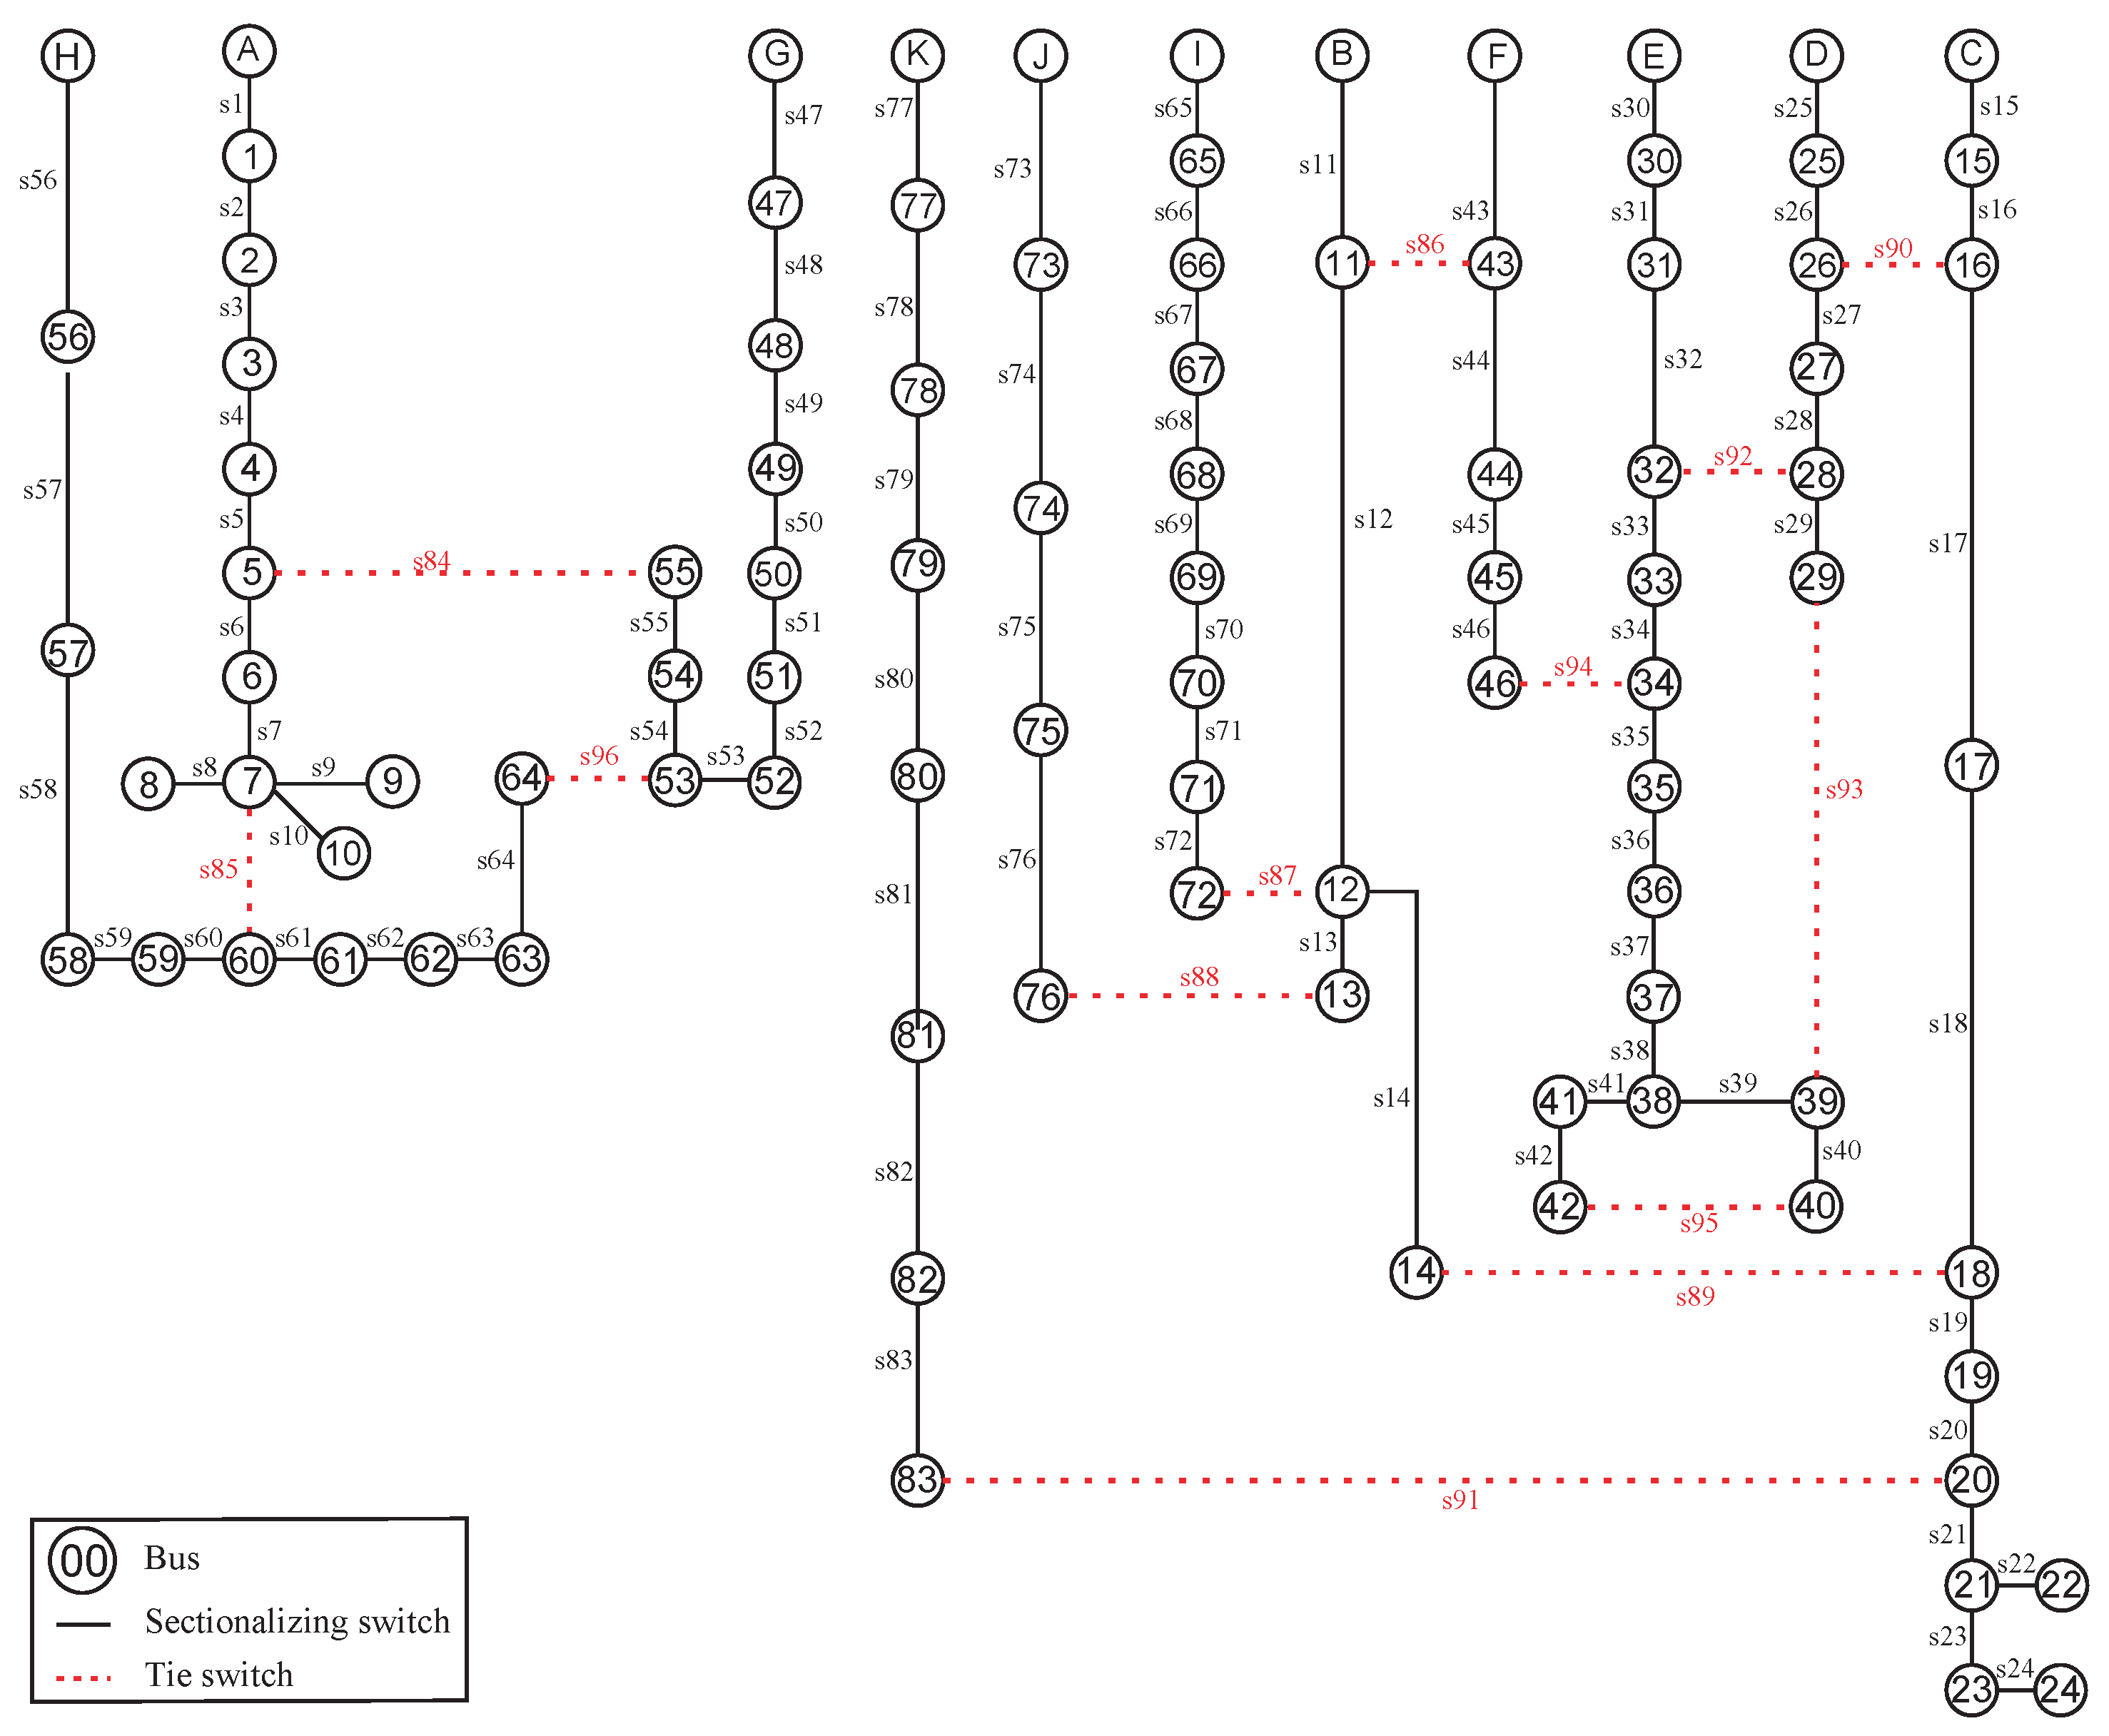
Su and Lee’s 94-Bus system [26] is a real Taiwanese system, with a voltage of 11.4 kV, 11 feeders, and 83 normally closed switches (sectionalizing switches), s1 to s83, and 13 normally opened switches (tie switches), s84 to s96. Thirteen meshes are formed by closing the tie switches. Before reconfiguration, the system has 532 kW in active losses and the average time for conducting a test was 1.2 s. The system can be seen in Figure 8. Normally closed switches are represented by solid black lines and normally opened switches are represented by red dashed lines.
The best solution delivered by the algorithm is to open switches s07, s13, s34, s39, s42, s55, s62, s72, s83, s86, s89, s90, and s92, keeping the other switches closed. The same configuration was obtained by [1,26]. This configuration produces losses of 470.67 kW, which means a reduction of 11.53% in comparison with the system before reconfiguration.
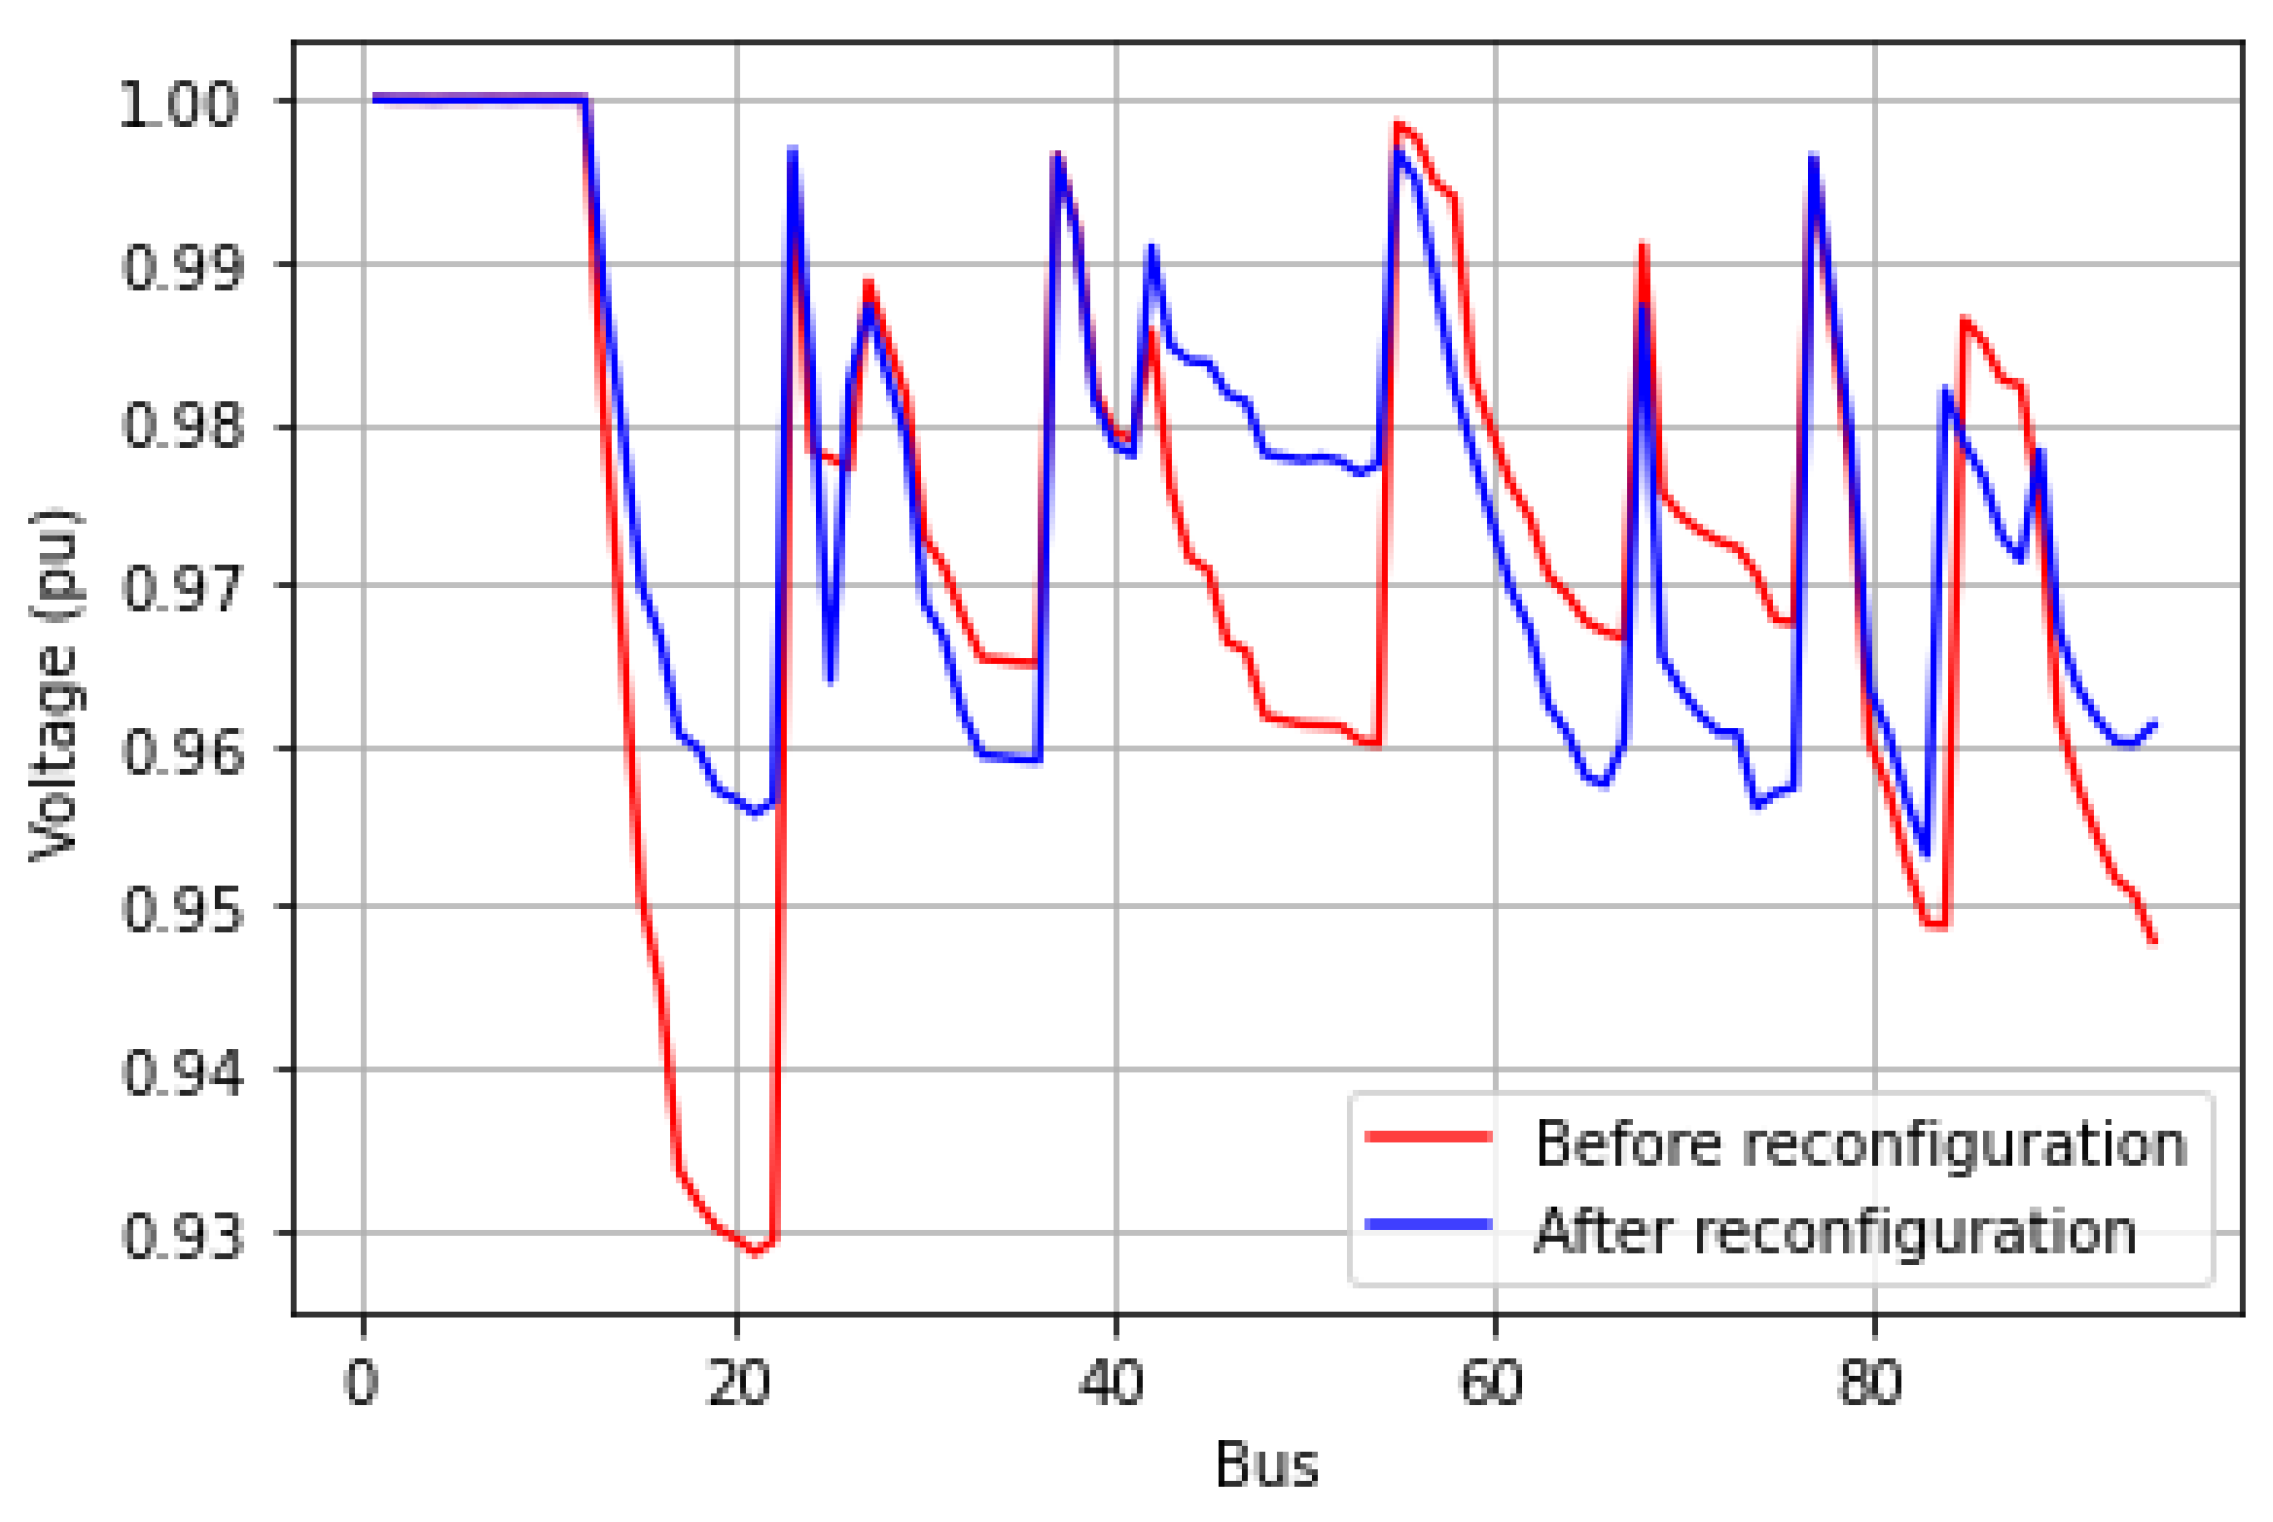
The 94-Bus system, as well as the 33-Bus, showed an improvement in the voltage profile. Before reconfiguration, the lowest voltage was 0.9283 p.u. and, after reset, the lowest voltage became 0.9532 p.u. The voltages according to the bus are shown in Figure 9.
To validate the proposed method using the 94-Bus system, several tests were performed with different combinations of B T M a x , T, and N N b . As can be seen in Table 6, for different values of B T M a x , T, and N N b , the system had 100% efficiency, delivering the best solution in 100 attempts every time. The authors admit that they tried different combinations of the variables to obtain one that would make the algorithm difficult, but a combination was not found. The most critical variable for the algorithm is B T M a x (number of iterations without improvement); after all, it dictates the moment of the stop of the algorithm and, even with a value of 1, the algorithm did very well. It is believed that its great success is due to the initial solution generation algorithm that generates a solution that is close to the ideal solution. Remember that the initial solution produces 485.41 kW, while the solution after reconfiguration produces 470.67 kW, which makes them relatively approximate and facilitates the work of the tabu search and neighborhood algorithms.
As carried out with the 33-Bus system, comparisons were also made with other methods available in the literature. The proposed algorithm again presented 100 optimal solutions for 100 executions of the algorithm, using the same values for B T M a x , T, and N N b for the proposed algorithm and the other authors’ algorithms. The values used were: B T M a x = 15 , T = 8 , and N N b = 13 . Comparative results are available in Table 7.

6. Conclusions

The application of the tabu search metaheuristic in addressing the distribution network reconfiguration problem stands out as a significant contribution to this study. Utilizing the voltage drop concept to generate an initial solution reduced computational costs and introduced an innovative approach to neighborhood creation. By shifting a single dimension of the current solution for each neighbor and integrating randomness and voltage drop, the algorithm executed a smooth and consistent descent, resulting in a neighborhood with a strong likelihood of improvement with each iteration.
The simulation results underscored the effectiveness of the proposed strategy, showcasing its capacity to produce high-quality solutions for the addressed problem. Rigorous testing across three different systems demonstrated an impressive efficiency of 100 percent in consistently achieving optimal solutions reported in the technical literature. In direct comparison with alternative algorithms tested under identical conditions, our proposed algorithm achieved a standard deviation of zero and significantly outperformed them by attaining a 100 percent success rate in finding global solutions.
This success of the tabu search metaheuristic in tackling the distribution network reconfiguration problem highlights its potential as an innovative and efficient approach to power systems optimization. Moving forward, opportunities for further research could explore refinements and adaptations of the algorithm to handle larger and more complex power distribution networks. The algorithm’s applicability to real-world scenarios, incorporating factors such as renewable energy sources, dynamic loads, capacitor banks, and uncertainties, could contribute to enhancing its robustness and practicality. As the field of power systems continues to evolve, the strides made in this research pave the way for ongoing advancements in optimizing distribution network configurations, ensuring the reliability and efficiency of power supply systems.

Author Contributions

Conceptualization, D.Z.Ñ.H. and L.O.P.F.; Investigation, L.O.P.F., Methodology, L.O.P.F. and Y.P.M.R.; Software, L.O.P.F. and F.J.S.P., Validation, L.O.P.F., F.J.S.P., Y.P.M.R. and D.Z.Ñ.H.; Funding Acquisition, Y.P.M.R. and D.Z.Ñ.H.; Resources, D.Z.Ñ.H., Writing—Original Draft Preparation, L.O.P.F.; Writing—Review and Editing, Y.P.M.R. and D.Z.Ñ.H. All authors have read and agreed to the published version of the manuscript.

Funding

This research was funded by UNI (Universidad Nacional de Ingeniería) and CAPES (Coordenação de Aperfeiçoamento de Pessoal de Nível Superior).

Data Availability Statement

Dataset available on request from the authors.

Conflicts of Interest

The authors declare no conflict of interest.

References

  1. Pegado, R.; Ñaupari, Z.; Molina, Y.; Castillo, C. Radial distribution network reconfiguration for power losses reduction based on improved selective BPSO. Electr. Power Syst. Res. 2019, 169, 206–213. [Google Scholar] [CrossRef]
  2. Dias Santos, J.; Marques, F.; Garcés Negrete, L.P.; Andrêa Brigatto, G.A.; López-Lezama, J.M.; Muñoz-Galeano, N. A Novel Solution Method for the Distribution Network Reconfiguration Problem Based on a Search Mechanism Enhancement of the Improved Harmony Search Algorithm. Energies 2022, 15, 2083. [Google Scholar] [CrossRef]
  3. Gerez, C.; Coelho Marques Costa, E.; Sguarezi Filho, A.J. Distribution Network Reconfiguration Considering Voltage and Current Unbalance Indexes and Variable Demand Solved through a Selective Bio-Inspired Metaheuristic. Energies 2022, 15, 1686. [Google Scholar] [CrossRef]
  4. Merlin, A. Search for a minimal-loss operating spanning tree configuration for an urban power distribution system. In Proceedings of the 5th Power Systems Computation Conference, Cambridge, UK, 1–5 September 1975; Volume 1, pp. 1–18. [Google Scholar]
  5. Civanlar, S.; Grainger, J.; Yin, H.; Lee, S. Distribution feeder reconfiguration for loss reduction. IEEE Trans. Power Deliv. 1988, 3, 1217–1223. [Google Scholar] [CrossRef]
  6. Niknam, T.; Farsani, E.A. A hybrid self-adaptive particle swarm optimization and modified shuffled frog leaping algorithm for distribution feeder reconfiguration. Eng. Appl. Artif. Intell. 2010, 23, 1340–1349. [Google Scholar] [CrossRef]
  7. Glover, F. Tabu search: A tutorial. Interfaces 1990, 20, 74–94. [Google Scholar] [CrossRef]
  8. Jeon, Y.J.; Kim, J.C. Network reconfiguration in radial distribution system using simulated annealing and tabu search. In Proceedings of the 2000 IEEE Power Engineering Society Winter Meeting. Conference Proceedings (Cat. No. 00CH37077), Singapore, 23–27 January 2000; IEEE: Piscataway, NJ, USA, 2000; Volume 4, pp. 2329–2333. [Google Scholar]
  9. Abdelaziz, A.Y.; Mohamed, F.; Mekhamer, S.; Badr, M. Distribution system reconfiguration using a modified Tabu Search algorithm. Electr. Power Syst. Res. 2010, 80, 943–953. [Google Scholar] [CrossRef]
  10. de Andrade, B.A.R.; Ferreira, N.R. Simulated annealing and tabu search applied on network reconfiguration in distribution systems. In Proceedings of the 2018 Simposio Brasileiro de Sistemas Eletricos (SBSE), Niteroi, Brazil, 12–16 May 2018; IEEE: Piscataway, NJ, USA, 2018; pp. 1–6. [Google Scholar]
  11. García-Martínez, S.; Espinosa-Juárez, E.; Pérez-Rojas, C. Optimal Location of Voltage Sag Monitors Considering Electrical Network Reconfiguration in Presence of DG by Using Tabu Search. In Proceedings of the 2018 International Conference on Computational Science and Computational Intelligence (CSCI), Las Vegas, NV, USA, 13–15 December 2018; IEEE: Piscataway, NJ, USA, 2018; pp. 197–202. [Google Scholar]
  12. Bagheri, A.; Bagheri, M.; Lorestani, A. Optimal reconfiguration and DG integration in distribution networks considering switching actions costs using tabu search algorithm. J. Ambient. Intell. Humaniz. Comput. 2020, 12, 7837–7856. [Google Scholar] [CrossRef]
  13. Mohamed, M.A.E.H.; Ali, Z.M.; Ahmed, M.; Al-Gahtani, S.F. Energy saving maximization of balanced and unbalanced distribution power systems via network reconfiguration and optimum capacitor allocation using a hybrid metaheuristic algorithm. Energies 2021, 14, 3205. [Google Scholar] [CrossRef]
  14. Sayed, M.M.; Mahdy, M.Y.; Abdel Aleem, S.H.; Youssef, H.K.; Boghdady, T.A. Simultaneous Distribution Network Reconfiguration and Optimal Allocation of Renewable-Based Distributed Generators and Shunt Capacitors under Uncertain Conditions. Energies 2022, 15, 2299. [Google Scholar] [CrossRef]
  15. Lavorato, M.; Franco, J.F.; Rider, M.J.; Romero, R. Imposing radiality constraints in distribution system optimization problems. IEEE Trans. Power Syst. 2011, 27, 172–180. [Google Scholar] [CrossRef]
  16. Lalla-Ruiz, E.; Melián-Batista, B.; Moreno-Vega, J.M. Artificial intelligence hybrid heuristic based on tabu search for the dynamic berth allocation problem. Eng. Appl. Artif. Intell. 2012, 25, 1132–1141. [Google Scholar] [CrossRef]
  17. Guimaraes, M.A.; Lorenzeti, J.F.; Castro, C.A. Reconfiguration of distribution systems for stability margin enhancement using tabu search. In Proceedings of the 2004 International Conference on Power System Technology, 2004, PowerCon 2004, Singapore, 21–24 November 2004; IEEE: Piscataway, NJ, USA, 2004; Volume 2, pp. 1556–1561. [Google Scholar]
  18. Pan, N.H.; Hsaio, P.W.; Chen, K.Y. A study of project scheduling optimization using Tabu Search algorithm. Eng. Appl. Artif. Intell. 2008, 21, 1101–1112. [Google Scholar] [CrossRef]
  19. Al-Sultan, K.S. A tabu search approach to the clustering problem. Pattern Recognit. 1995, 28, 1443–1451. [Google Scholar] [CrossRef]
  20. Alexander, C.K.; Sadiku, M.N.; Sadiku, M. Fundamentals of Electric Circuits; McGraw-Hill Higher Education: Boston, MA, USA, 2007; pp. 34–39. [Google Scholar]
  21. Freitas, P.R.R.D. Impacto de Funções Inteligentes de Inversores de Sistemas Fotovoltaicos na Operação de Redes de Distribuição de Energia Elétrica. Ph.D. Thesis, Universidade de São Paulo, São Paulo, Brazil, 2020. [Google Scholar]
  22. Shirmohammadi, D.; Hong, H.W. Reconfiguration of electric distribution networks for resistive line losses reduction. IEEE Trans. Power Deliv. 1989, 4, 1492–1498. [Google Scholar] [CrossRef]
  23. Chiang, H.D.; Jean-Jumeau, R. Optimal network reconfigurations in distribution systems. II. Solution algorithms and numerical results. IEEE Trans. Power Deliv. 1990, 5, 1568–1574. [Google Scholar] [CrossRef]
  24. Goswami, S.K.; Basu, S.K. A new algorithm for the reconfiguration of distribution feeders for loss minimization. IEEE Trans. Power Deliv. 1992, 7, 1484–1491. [Google Scholar] [CrossRef]
  25. Baran, M.; Wu, F. Network reconfiguration in distribution systems for loss reduction and load balancing. IEEE Trans. Power Deliv. 1989, 4, 1401–1407. [Google Scholar] [CrossRef]
  26. Su, C.T.; Lee, C.S. Network reconfiguration of distribution systems using improved mixed-integer hybrid differential evolution. IEEE Trans. Power Deliv. 2003, 18, 1022–1027. [Google Scholar] [CrossRef]
  27. Savier, J.; Das, D. Impact of network reconfiguration on loss allocation of radial distribution systems. IEEE Trans. Power Deliv. 2007, 22, 2473–2480. [Google Scholar] [CrossRef]
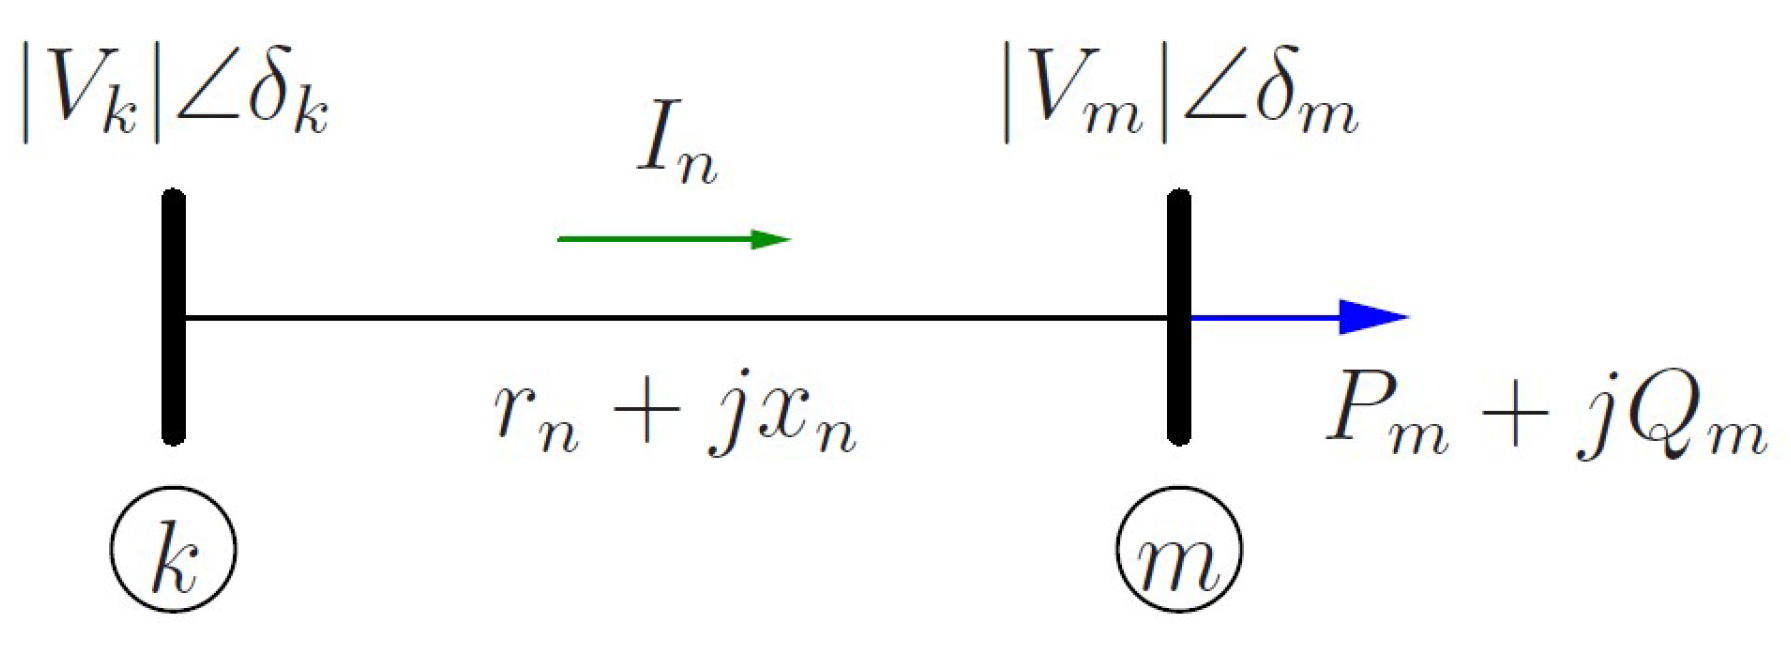
Figure 1. Two-bus example system.
Energies 17 02744 g001
Figure 2. The initial solution flowchart.
Energies 17 02744 g002
Figure 3. Example of one iteration for the hybrid neighborhood algorithm. (a) The random algorithm for even iterations. (b) The Δ V algorithm for odd iterations.
Energies 17 02744 g003
Figure 4. Single line diagram of IEEE-33 bus distribution system. Adapted from [25].
Energies 17 02744 g004
Figure 5. Voltages before and after reconfiguration for 33-Bus system.
Energies 17 02744 g005
Figure 6. Single line diagram of 69-Bus distribution system. Adapted from [27].
Energies 17 02744 g006
Figure 7. Voltages before and after reconfiguration for 69-Bus system.
Energies 17 02744 g007
Figure 8. Single-line diagram of 94-Bus distribution system. Adapted from [26].
Energies 17 02744 g008
Figure 9. Voltages before and after reconfiguration for 94-Bus system.
Energies 17 02744 g009
Table 1. Initial Solutions Using Δ V method.
SystemDefault Initial SolutionInitial Solution Using
Δ V Method
Reduction
33-Bus [25]s33, s37, s35, s36, s34
202.27 kW
s6, s25, s11, s32, s14
163.22 kW
19.31%
94-Bus [26]s96, s88, s91, s87, s89,
s94, s95,s93, s92, s90,
s84, s85, s86
532.8 kW
s96, s88, s82, s72, s89,
s33, s42, s39, s92, s90,
s84, s7, s86
485.41 kW
8.89%
Table 2. Results varying BTMax, T, and NNb in 100 trials for 33-Bus system.
BTMaxTNNbLoss Average (kW)Standard Deviation (kW)Worst SolutionLosses (kW)No. of Global Solutions
1025139.620.2419s7, s28, s10, s32, s14140.7291
10210139.570.1367s7, s28, s10, s32, s14140.7298
1055139.811.2575s7, s26, s10, s32, s14147.9890
10510139.580.1000s7, s37, s10, s32, s14140.2996
2025139.560--100
20210139.560--100
2055139.560--100
20510139.560--100
Table 3. Comparison between the results of the 33-Bus system for different techniques in 100 tests.
MethodLoss Average (kW)Standard DeviationWorst SolutionNo. of Global SolutionsTime (s)
Proposed method139.560-10023.2
Abdelaziz et al. [9]140.301.9496s33, s27, s11, s31, s34 148.71 kW6833.8
Andrade and Ferreira [10]139.750.9708s33, s28, s11, s32, s34
143.52 kW
7835.9
Jeon and Kim [8]139.691.0410s33, s28, s9, s32, s34 144.38 kW8544.2
Table 4. Results varying BTMax, T, and NNb in 100 trials for 69-Bus system.
BTMaxTNNbLoss Average (kW)Standard Deviation (kW)Worst SolutionLosses (kW)No. of Global Solutions
2055101.154.41s55, s69, s12, s18, s26122.7636
2051598.470.047s58, s69, s12, s14, s6198.9479
20155100.253.06s55, s69, s13, s18, s63115.7538
20151598.470--100
305599.961.663s57, s69, s13, s18, s63105.5841
3051598.470.01s55, s59, s13, s70, s6198.5789
30155100.332.65s55, s41, s13, s18, s63115.7539
30151598.47---100
Table 5. Comparison between the results of the 69-Bus system for different techniques in 100 tests.
MethodLoss Average (kW)Standard DeviationWorst SolutionNo. of Global SolutionsTime (s)
Proposed method98.470-100148.45
Abdelaziz et al. [9]98.50.14s55, s69, s14, s70, s63
99.49 kW
96353.83
Andrade and Ferreira [10]98.560.58s55, s10, s14, s70, s61
104.12 kW
92177.78
Jeon and Kim [8]98.50.14s55, s69, s14, s70, s63
99.49 kW
97200.55
Table 6. Results varying BTMax, T, and NNb in 100 trials for 94-Bus system.
BTMaxTNNbLoss Average (kW)Standard Deviation (kW)Worst SolutionLosses (kW)No. of Global Solutions
1513470.670--100
1526470.670--100
11013470.670--100
11026470.670--100
10513470.670--100
10526470.670--100
101013470.670--100
101026470.670--100
Table 7. Comparison between the results of the 94-Bus system for different techniques in 100 tests.
MethodLoss Average (kW)Standard DeviationWorst SolutionNo. of Global Solutions
Proposed method470.670-100
Abdelaziz et al. [9]471.554.6203s96, s13, s83, s72, s89,
s34, s42, s39, s92, s90,
s84, s85, s86
503.42 kW
69
Andrade and Ferreira [10]472.657.4419s96, s88, s82, s87, s89,
s34, s42, s39, s92, s90,
s84, s85, s86
508.21 kW
52
Jeon and Kim [8]471.785.5723s96, s13, s83, s72, s89,
s34, s42, s39, s92, s90,
s84, s85, s86
503.42 kW
62
Disclaimer/Publisher’s Note: The statements, opinions and data contained in all publications are solely those of the individual author(s) and contributor(s) and not of MDPI and/or the editor(s). MDPI and/or the editor(s) disclaim responsibility for any injury to people or property resulting from any ideas, methods, instructions or products referred to in the content.