Article

A Strategy for Enhanced Carbon Storage: A Hybrid CO2 and Aqueous Formate Solution Injection to Control Buoyancy and Reduce Risk

by
Marcos Vitor Barbosa Machado
1,*,
Mojdeh Delshad
2,
Omar Ali Carrasco Jaim
2,
Ryosuke Okuno
2 and
Kamy Sepehrnoori
2,*
1
Petrobras, Rio de Janeiro 20231-030, Brazil
2
Hildebrand Department of Petroleum and Geosystems Engineering, The University of Texas at Austin, Austin, TX 78712, USA
*
Authors to whom correspondence should be addressed.
Energies 2024, 17(11), 2680; https://doi.org/10.3390/en17112680
Submission received: 19 April 2024 / Revised: 25 May 2024 / Accepted: 29 May 2024 / Published: 31 May 2024
(This article belongs to the Special Issue Subsurface Energy and Environmental Protection)

Abstract

:
Conventional Carbon Capture and Storage (CCS) operations use the direct injection of CO2 in a gaseous phase from the surface as a carbon carrier. Due to CO2 properties under reservoir conditions with lower density and viscosity than in situ brine, CO2 flux is mainly gravity-dominated. CO2 moves toward the top and accumulates below the top seal, thus reinforcing the risk of possible leakage to the surface through unexpected hydraulic paths (e.g., reactivated faults, fractures, and abandoned wells) or in sites without an effective sealing caprock. Considering the risks, the potential benefits of the interplay between CO2 and an aqueous solution of formate ions (HCOO¯) were evaluated when combined to control CO2 gravity segregation in porous media. Three combined strategies were evaluated and compared with those where either pure CO2 or a formate solution was injected. The first strategy consisted of a pre-flush of formate solution followed by continuous CO2 injection, and it was not effective in controlling the vertical propagation of the CO2 plume. However, the injection of a formate solution slug in a continuous or alternated way, simultaneously with the CO2 continuous injection, was effective in slowing down the vertical migration of the CO2 plume and keeping it permanently stationary deeper than the surface depth.

1. Introduction

The scenarios analyzed by international entities, such as the International Energy Agency (IEA), underscore the intricate nature of the actions required to achieve the established goals for reducing Greenhouse Gas emissions in the forthcoming decades while simultaneously transforming energy generation sources. The “World Energy Outlook 2022” report [1] emphasizes that a synergistic deployment of multiple technologies and energy sources will play a pivotal role in providing sustainable energy resources for the planet. Among the various options for curtailing CO2 emissions, Carbon Capture and Storage (CCS) arises as a technology with substantial potential to mitigate CO2 emissions in a probable scenario characterized by ongoing fossil fuel utilization in the future.
A CCS project encompasses the capture of CO2 from industries with high emission rates and its subsequent injection into geological formations, such as aquifers and depleted hydrocarbon reservoirs. One of the primary challenges associated with long-term and large-scale CO2 storage in geological formations pertains to ensuring the safety and reliability of storage. To address this challenge, diverse trapping mechanisms within porous media can be studied [2,3,4,5]. For instance, during the initial phase of a CO2 injection, the migration of free CO2 is controlled by structural and stratigraphic trapping facilitated by the caprock, which is known as the primary trapping mechanism. Over the medium and long term, a portion of the mobile CO2 will undergo dissolution in water through a process known as solubility trapping. This phenomenon is particularly pronounced in low-salinity brine under conditions of high pressure and low temperature [6,7]. The dissolution of CO2 into brine is facilitated by molecular diffusion and brine solubility. As CO2 dissolves into saline water, the resulting CO2(aq)-dissolved brine becomes denser. This density contrast between the CO2(aq)-dissolved brine and the pure brine causes the denser CO2(aq) to sink while the pure brine rises [8,9]. The resulting density-driven convection accelerates the rate of CO2 mass transfer, promotes further dissolution, and enhances the stability and safety of geological storage [10,11,12].
In addition to solubility trapping, changes in saturation induced by the upward movement of the CO2 plume can result in additional trapping as a residual phase, attributable to relative permeability and capillary hysteresis [13]. Additionally, in specific cases, certain CO2 molecules can be trapped in the form of minerals, influenced by the pH of the brine and the mineralogy of the rock [14]. These secondary trapping mechanisms bolster storage security by immobilizing buoyant CO2 within the pore space or converting it into a non-free phase.
According to Bachu [13], the contribution of secondary trapping mechanisms is almost negligible during the injection phase. Consequently, during this stage, the caprock assumes a critical role in ensuring the security of the CCS operation, as the buoyancy of CO2 has the potential to induce its migration toward the surface or seafloor in the case of offshore storage sites. In the Frio CO2 field demonstration project conducted in the U.S. [15], CO2 was injected in a deeper zone below several well-known shale seals. However, certain authors [16] are currently reevaluating the necessity of a caprock to control the upward movement of the CO2 plume, given the absence of prescriptive regulations pertaining to geologic seals. Furthermore, there is ongoing consideration of a composite confining system comprising discontinuous barriers that create prolonged and convoluted pathways to attenuate the saturation of mobile CO2.
Where the caprock cannot be effective, additional control over the CO2 buoyancy is desired to support the discontinuous geologic barriers. Some authors have worked with aqueous solutions based on formic acid [17] to enhance the CO2 solubility in brine or on formate ions [18,19] to enhance the pore-space utilization in carbon storage while avoiding various issues with CO2 storage. Additional benefits of the formate solution have been found for carbonate rocks concerning the wettability alteration to enhance oil recovery [18,20,21,22].
A formate ion (HCOO¯) is the simplest carboxylate and the conjugate base of formic acid (HCOOH). Both compounds can be used as precursors for additional chemicals in energy-related applications, such as hydrogen storage and carbon carrier materials. The estimated global market for formic acid is 1,300,000 tons by 2035 [23] as a result of its growing utilization in these areas.
Currently, formate ion production is based on thermochemical processes in which syngas and steam generation are needed, resulting in energy-intensive reactions with carbon dioxide emissions [24]. Alternatively, the electrochemical reduction in CO2 (ECR-CO2) is a technology with the potential to produce formate species (including formic acid) under ambient conditions utilizing renewable energy and contributing to atmospheric carbon removal [24,25].
Different reported techno-economic analyses (TEA) have stated the feasibility of formic acid production by electrochemical reduction in CO2, providing a reaction energy consumption between 4.5 and 4.7 kWh/kg HCOOH [26,27] for the best scenario using 0.95 kg CO2/kg HCOOH and 0.60 kg H2O/kg HCOOH consumption rates [26]. Under these conditions, the overall production cost is estimated to be US $0.46–0.75/kg HCOOH [26,27], which is quite competitive since the current market price is US $0.68–1/kg HCOOH [25,26].
Although no commercial CO2 electrolyzer is available, great progress has been made to successfully develop industrial-scale technologies, achieving a current TRL of 6. Experimental work has demonstrated a reaction energy consumption of around 5.5 kWh/kg HCOOH [28] and stable long-term performance for 1000 h, which is a promising scenario for large-scale formic acid production by electrochemical reduction in CO2.
In this study, the aqueous solution of formate ions, referred to as a formate solution, combined with CO2 (injected as a gas from the surface) was evaluated to support the gravity control of the plume in porous media, unlike Oyenowo et al.’s work [29], who evaluated only a formate injection as a carbon carrier. The following three combined strategies were tested: (1) a pre-flush of the formate solution slug preceding the continuous CO2 injection; (2) injecting the formate solution slug in a continuous or alternated way with CO2; and (3) injecting formate solution simultaneously with CO2 using a dual completion well similar to that in simultaneous water alternating gas injection projects [30]. All our simulations considered the mentioned secondary trapping mechanisms in two geological models, a synthetic one and an actual aquifer in Brazil, with little evidence of effective caprock. The main assumptions in this paper include the following:
  • No geomechanical or caprock modeling;
  • A pure CO2 stream is injected at a typical commercial rate;
  • No consideration of surface facility modeling. Focus on the subsurface flow and the impact of formate on CO2 fate and transport in a saline aquifer.

2. Modeling Geochemical Reactions

In the simulation of CO2 injection for CCS, both in the synthetic model and in the real cases to be discussed in the subsequent section, the numerical simulation was performed using CMG-GEM [31]. This simulator was used considering the following features:
  • The diffusion coefficient (D) for super-critical CO2 in brine equals 3.65 × 10⁻⁵ cm2/s, according to Ahmadi et al. [32]. This coefficient is applied to compute the effective CO2 diffusion (Deff) considering a porous medium with a tortuosity τ.
D e f f = D τ
  • The solubility of CO2 in brine can be estimated using the method proposed by Li and Nghiem [33], which is based on Henry’s law. This model calculates Henry’s constant based on Equation (2), which is a function of pressure and temperature. However, the influence of salt on the solubility of CO2 in the aqueous phase is taken into account through the use of a salting-out coefficient [34].
    l n H i = l n H i * + v i ¯ R T p p *
    where
    H i : Henry’s constant at current pressure (p) and temperature (T);
    H i * : Henry’s constant at reference pressure (p*) and temperature (T);
    v i ¯ : partial molar volume at infinite dilution;
    R: universal gas constant;
    i: species dissolved in water (CO2 in this work).
  • Water acid reactions for bicarbonate and carbonate ion generation using kinetic parameters from the PHREEQC database [35,36]:
OH + H+ = H2O
CO2 + H2O = H+ + HCO3
CO32− + H+ = HCO3
  • Reactions between a formate ion and other species in brine using kinetic parameters from the MINTEQ database [37]:
H+ + HCOO = HCO2H
Ca2+ + HCOO = Ca(HCO2)2
Mg2+ + HCOO = Mg(HCO2)2
  • Reactions with primary minerals using kinetic parameters from PHREEQC for the Transition-State-Theory (TST)-derived rate laws:
    -
    In the synthetic aquifer model:
    Calcite [CaCO3] + H+ = Ca2+ + HCO3
    -
    In the real aquifer model:
Quartz [SiO2] = SiO2 (aq)
K-feldspar [KAlSi3O8] + 4 H+ = 3 SiO2 (aq) + Al3+ + K+ + 2 H2O
Albite [NaAlSi3O8] + 4 H+ = 3 SiO2 (aq) + Al3+ + Na+ + 2 H2O
  • Permeability alteration due to mineral precipitation or dissolution was computed by applying the Kozeny–Carman equation with an exponent value of 3, as Zeidouni et al. [38] recommended as follows:
    k k = k n / r f ,
    and
    r f = r f n φ n φ k 3 1 φ k 1 φ n , 2
    where the resistance factor rf is modeled by the Kozeny–Carman equation or the power law relationship; kn and kk refer to permeability at previous (n) and current (k) timesteps, respectively. The porosity, φ, in (14) is calculated as follows:
    φ = 1 + c f p p * φ * j = 1 n N j ρ m , j N j 0 ρ m , j ,
    where:
    φ* is the reference porosity without mineral precipitation/dissolution;
    Nj is the total moles of mineral j per bulk volume at the current time;
    N j 0 is the total moles of mineral j per bulk volume at the initial time;
    ρm,j is the mineral molar density;
    cf is the rock compressibility;
    p* is the reference pressure.
  • The aqueous formate solution used in this study considered the formulation of Wang et al. [21], with a formate concentration of 30 wt% in brine, with a total salinity of 468,333 ppm (Na+: 159,236 ppm; Cl: 9097 ppm; HCOO: 300,000 ppm) and pH adjusted to 7. The resulting density of this formate solution is around 2300 kg/m3 with a viscosity of about 3 cP at the real average reservoir pressure and temperature conditions, as will be detailed in the following sections.

3. Case Study 1: Synthetic Model

3.1. Geological Model

To gain a deeper understanding of the impact of a formate solution in conjunction with a CO2 injection, a 2D synthetic model of a saline aquifer was built. The model was designed to have homogeneous petrophysical properties. A vertical injection well was placed at the edge of the model, with perforations in the three bottom layers. Figure 1 illustrates the dimensions of the model, which was discretized into a grid consisting of 100 × 100 × 20 gridblocks, each with a volume of 10 × 10 × 5 m3. This model discretization was validated and has been utilized for various applications related to reactive flow transport, as documented in the available literature [39,40,41].
Other properties of the synthetic model are summarized in Table 1, obtained from Oyenowo et al. [29].
The assumed synthetic relative permeability and capillary pressure curves [39] are represented in Figure 2. The maximum trapped gas saturation (Sgt) is assumed to be 0.4 in the Carlson hysteresis model [42], corresponding to the Land’s constant (C) [43] of 2, according to Equation (16):
S g t = S g   m a x 1 + C S g   m a x
where Sg max is the maximum gas saturation.
The synthetic water composition assigned for this case is represented in Table 2 [39].

3.2. Results

Oyenowo et al. [29] performed numerical simulations injecting an aqueous formate solution into an aquifer and an oil reservoir. They showed no upward buoyancy-driven flux when they used the formate solution as a single carbon carrier. This result inspired us to evaluate the combination of formate and CO2 injections to enhance the amount of carbon stored and to control the stability of the displacement process and buoyant forces due to the higher density and viscosity of the formate solution. Firstly, this approach was tested in the synthetic model and also coupled with the abovementioned geochemical reactions to capture trapping mechanisms such as solubility, including ionic trapping (bicarbonate and carbonate ion generation), residual, and mineral trapping.
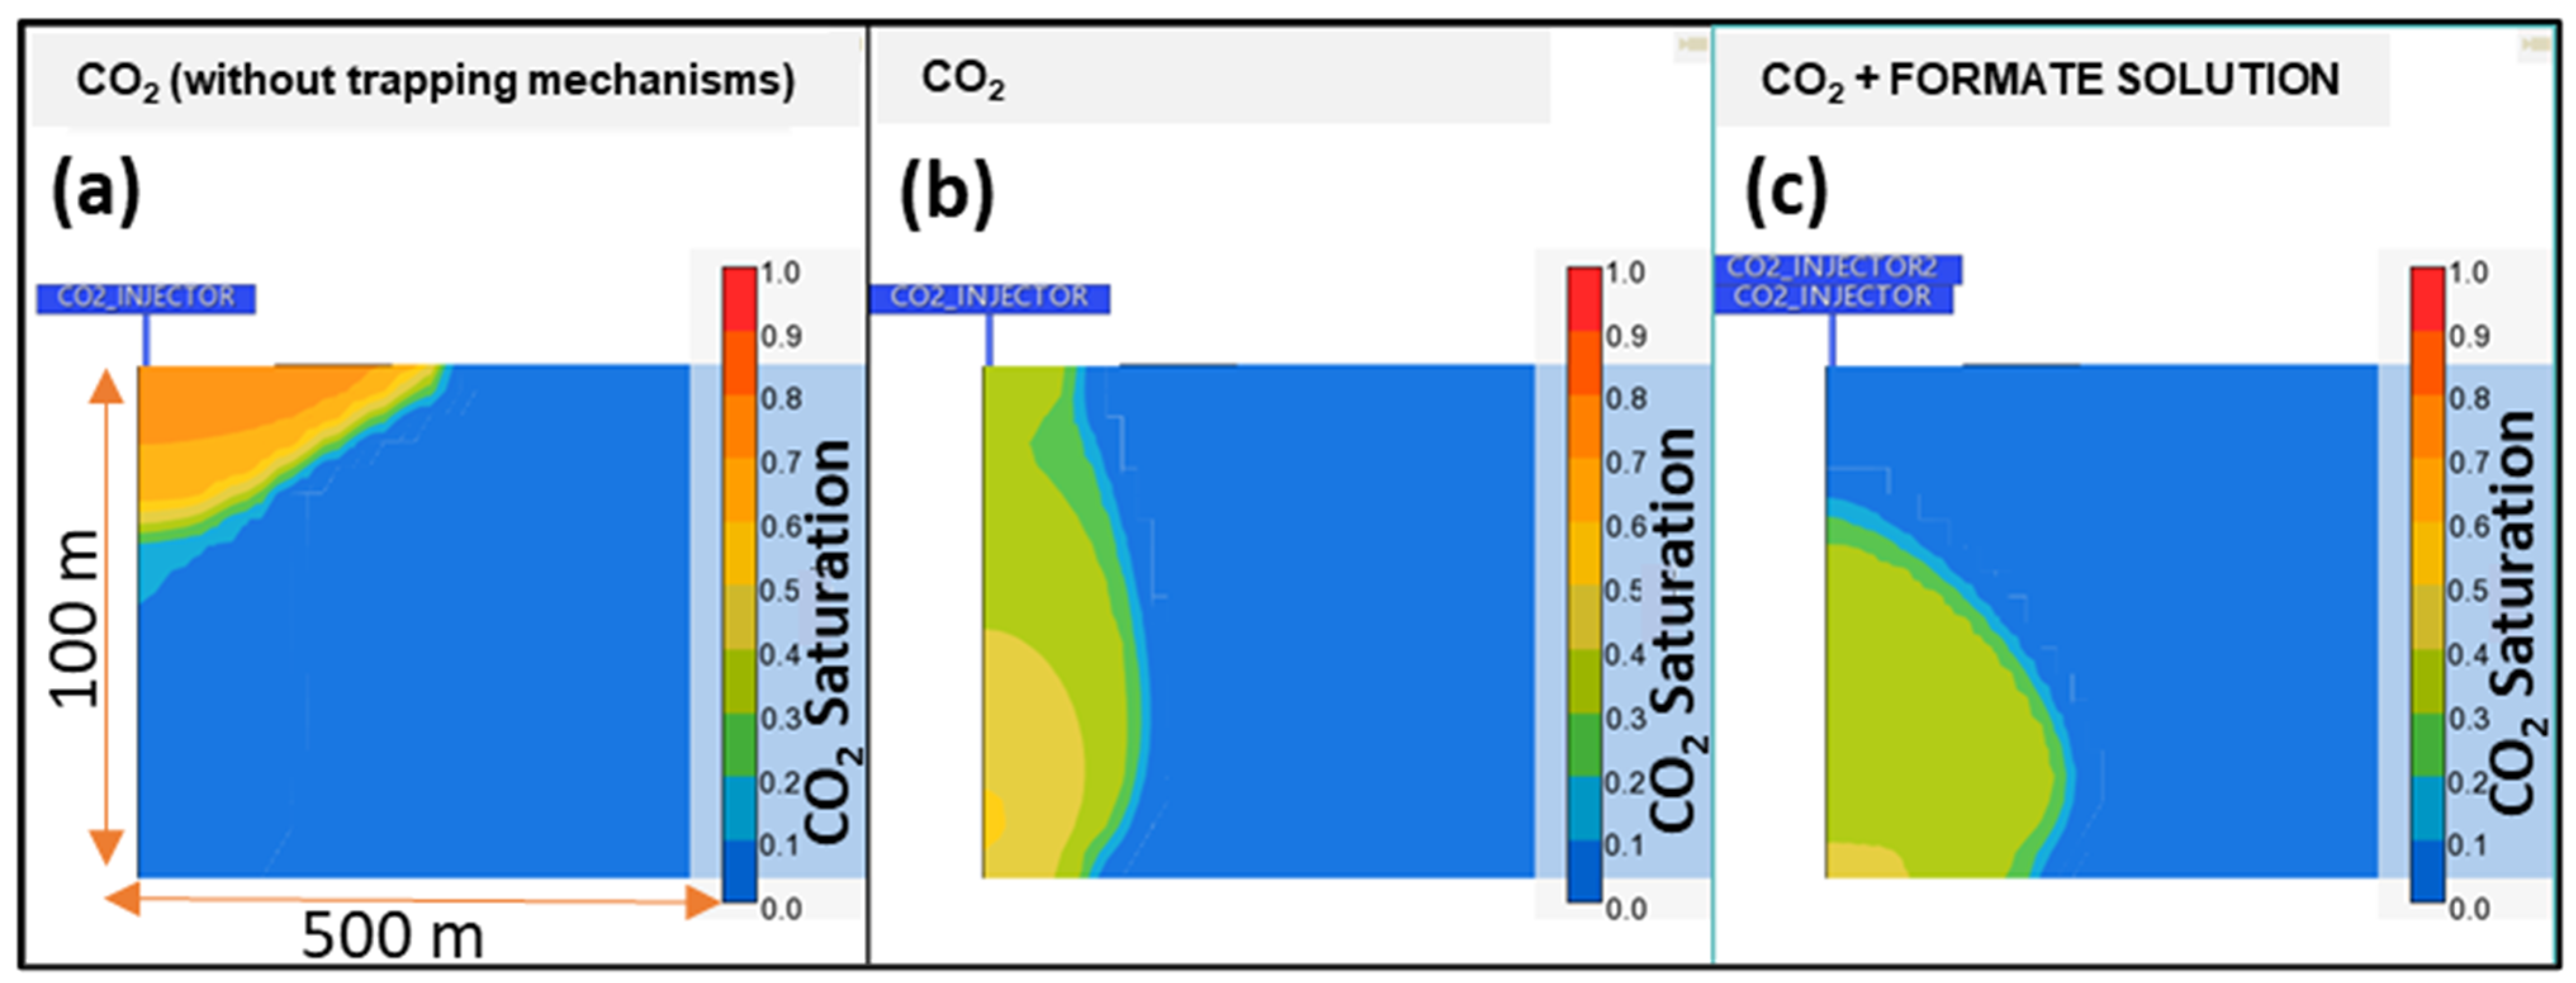
Figure 3a shows the CO2 injection without consideration of all the aforementioned trapping mechanisms, highlighting the CO2 rising as a mobile super-critical CO2 phase trapped by the caprock. In Figure 3b, the trapping mechanisms were included, and the CO2 plume was simulated to spread along the aquifer thickness, less dependent on the structural trapping. However, when formate solution was injected (30 wt%) simultaneously with the CO2 in an equal volume in the aquifer conditions, the CO2 plume did not reach the caprock, reducing the importance of structural trapping in the storage projects (Figure 3c). This observation reinforced our motivation to test the co-injection of CO2 and formate to minimize the risk associated with the caprock’s effectiveness as a barrier to the CO2 plume.
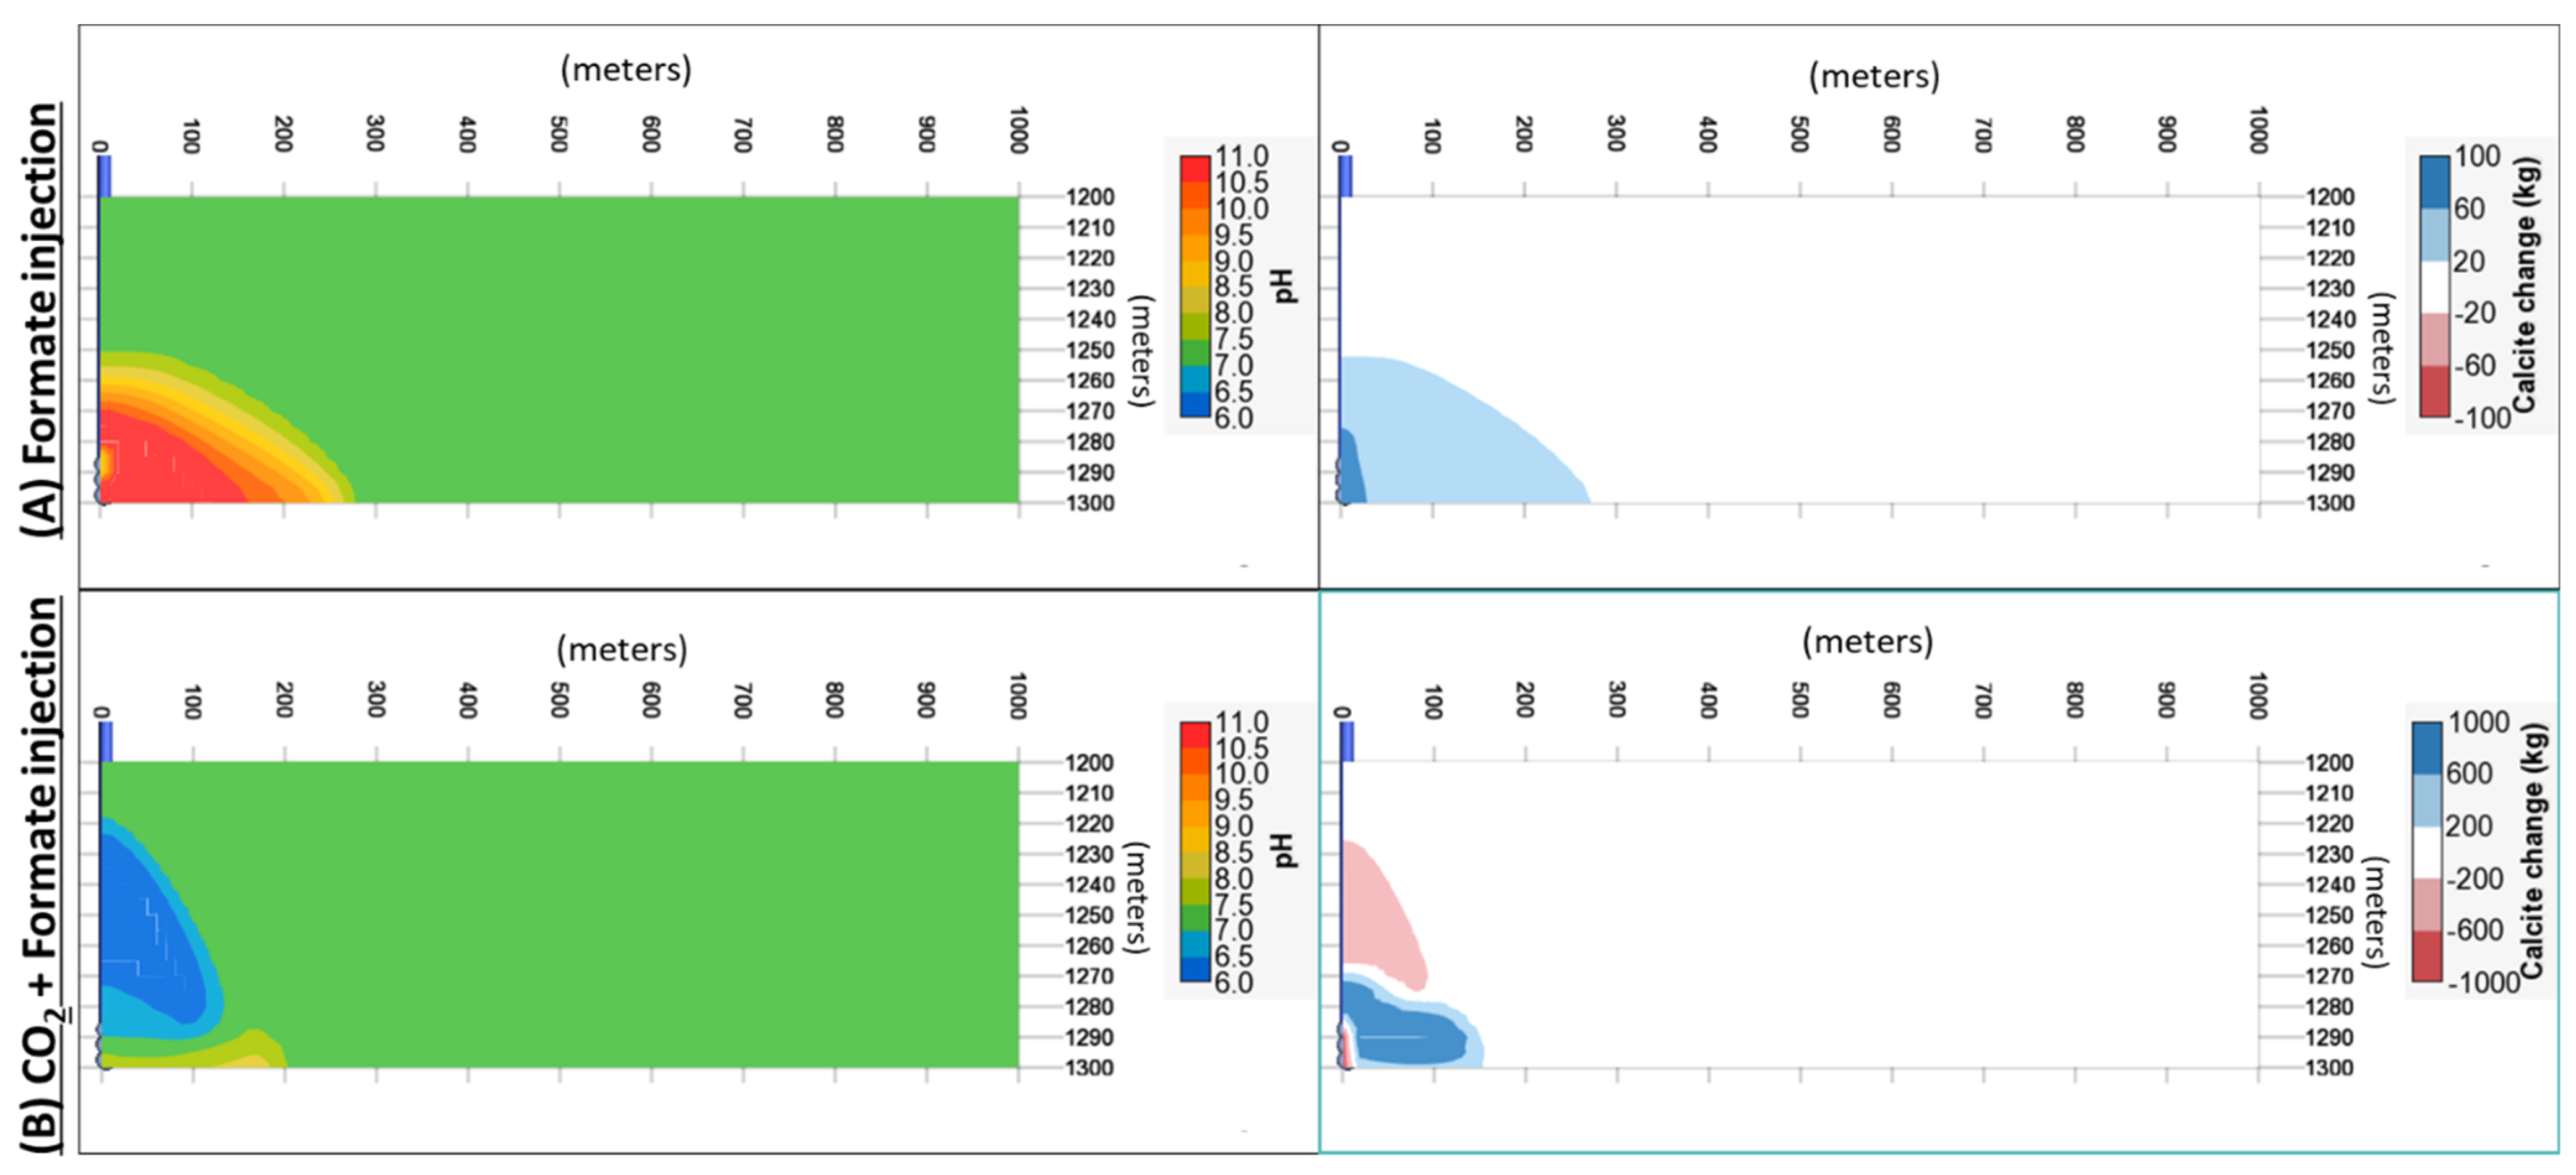
A secondary effect observed by this simulation is the buffer solution with a basic pH mainly around the well when the formate solution is injected in a calcite-rich matrix, as shown in Figure 4A. Regarding this effect, Wang et al. [21] showed that either brine with calcite or a 20 wt% formate solution with calcite reached the same equilibrium pH between 8.5 and 9 from their static bottle tests and corefloods with Texas Cream limestone cores. Without calcite, the formate solution in brine showed no reactivity and no change from the initial pH, which was 7.0. Figure 4A (left) shows a zone with a pH greater than 9, but such large pH values were not observed experimentally in [18,21].
Generally, calcite precipitation tends to be induced in a basic pH environment if carbonate ions are in contact with calcium ions in the resident brine or generated from the dissolution of carbonate minerals. To emulate this, a carbonate matrix with 63% of the volume of calcite [44] was assumed to see the impact of the pH changes on the reaction (Equation (9)). Other minerals present in the rock matrix are mainly quartz, kaolinite, and oligoclase. Our simulation study could reproduce the following mechanism:
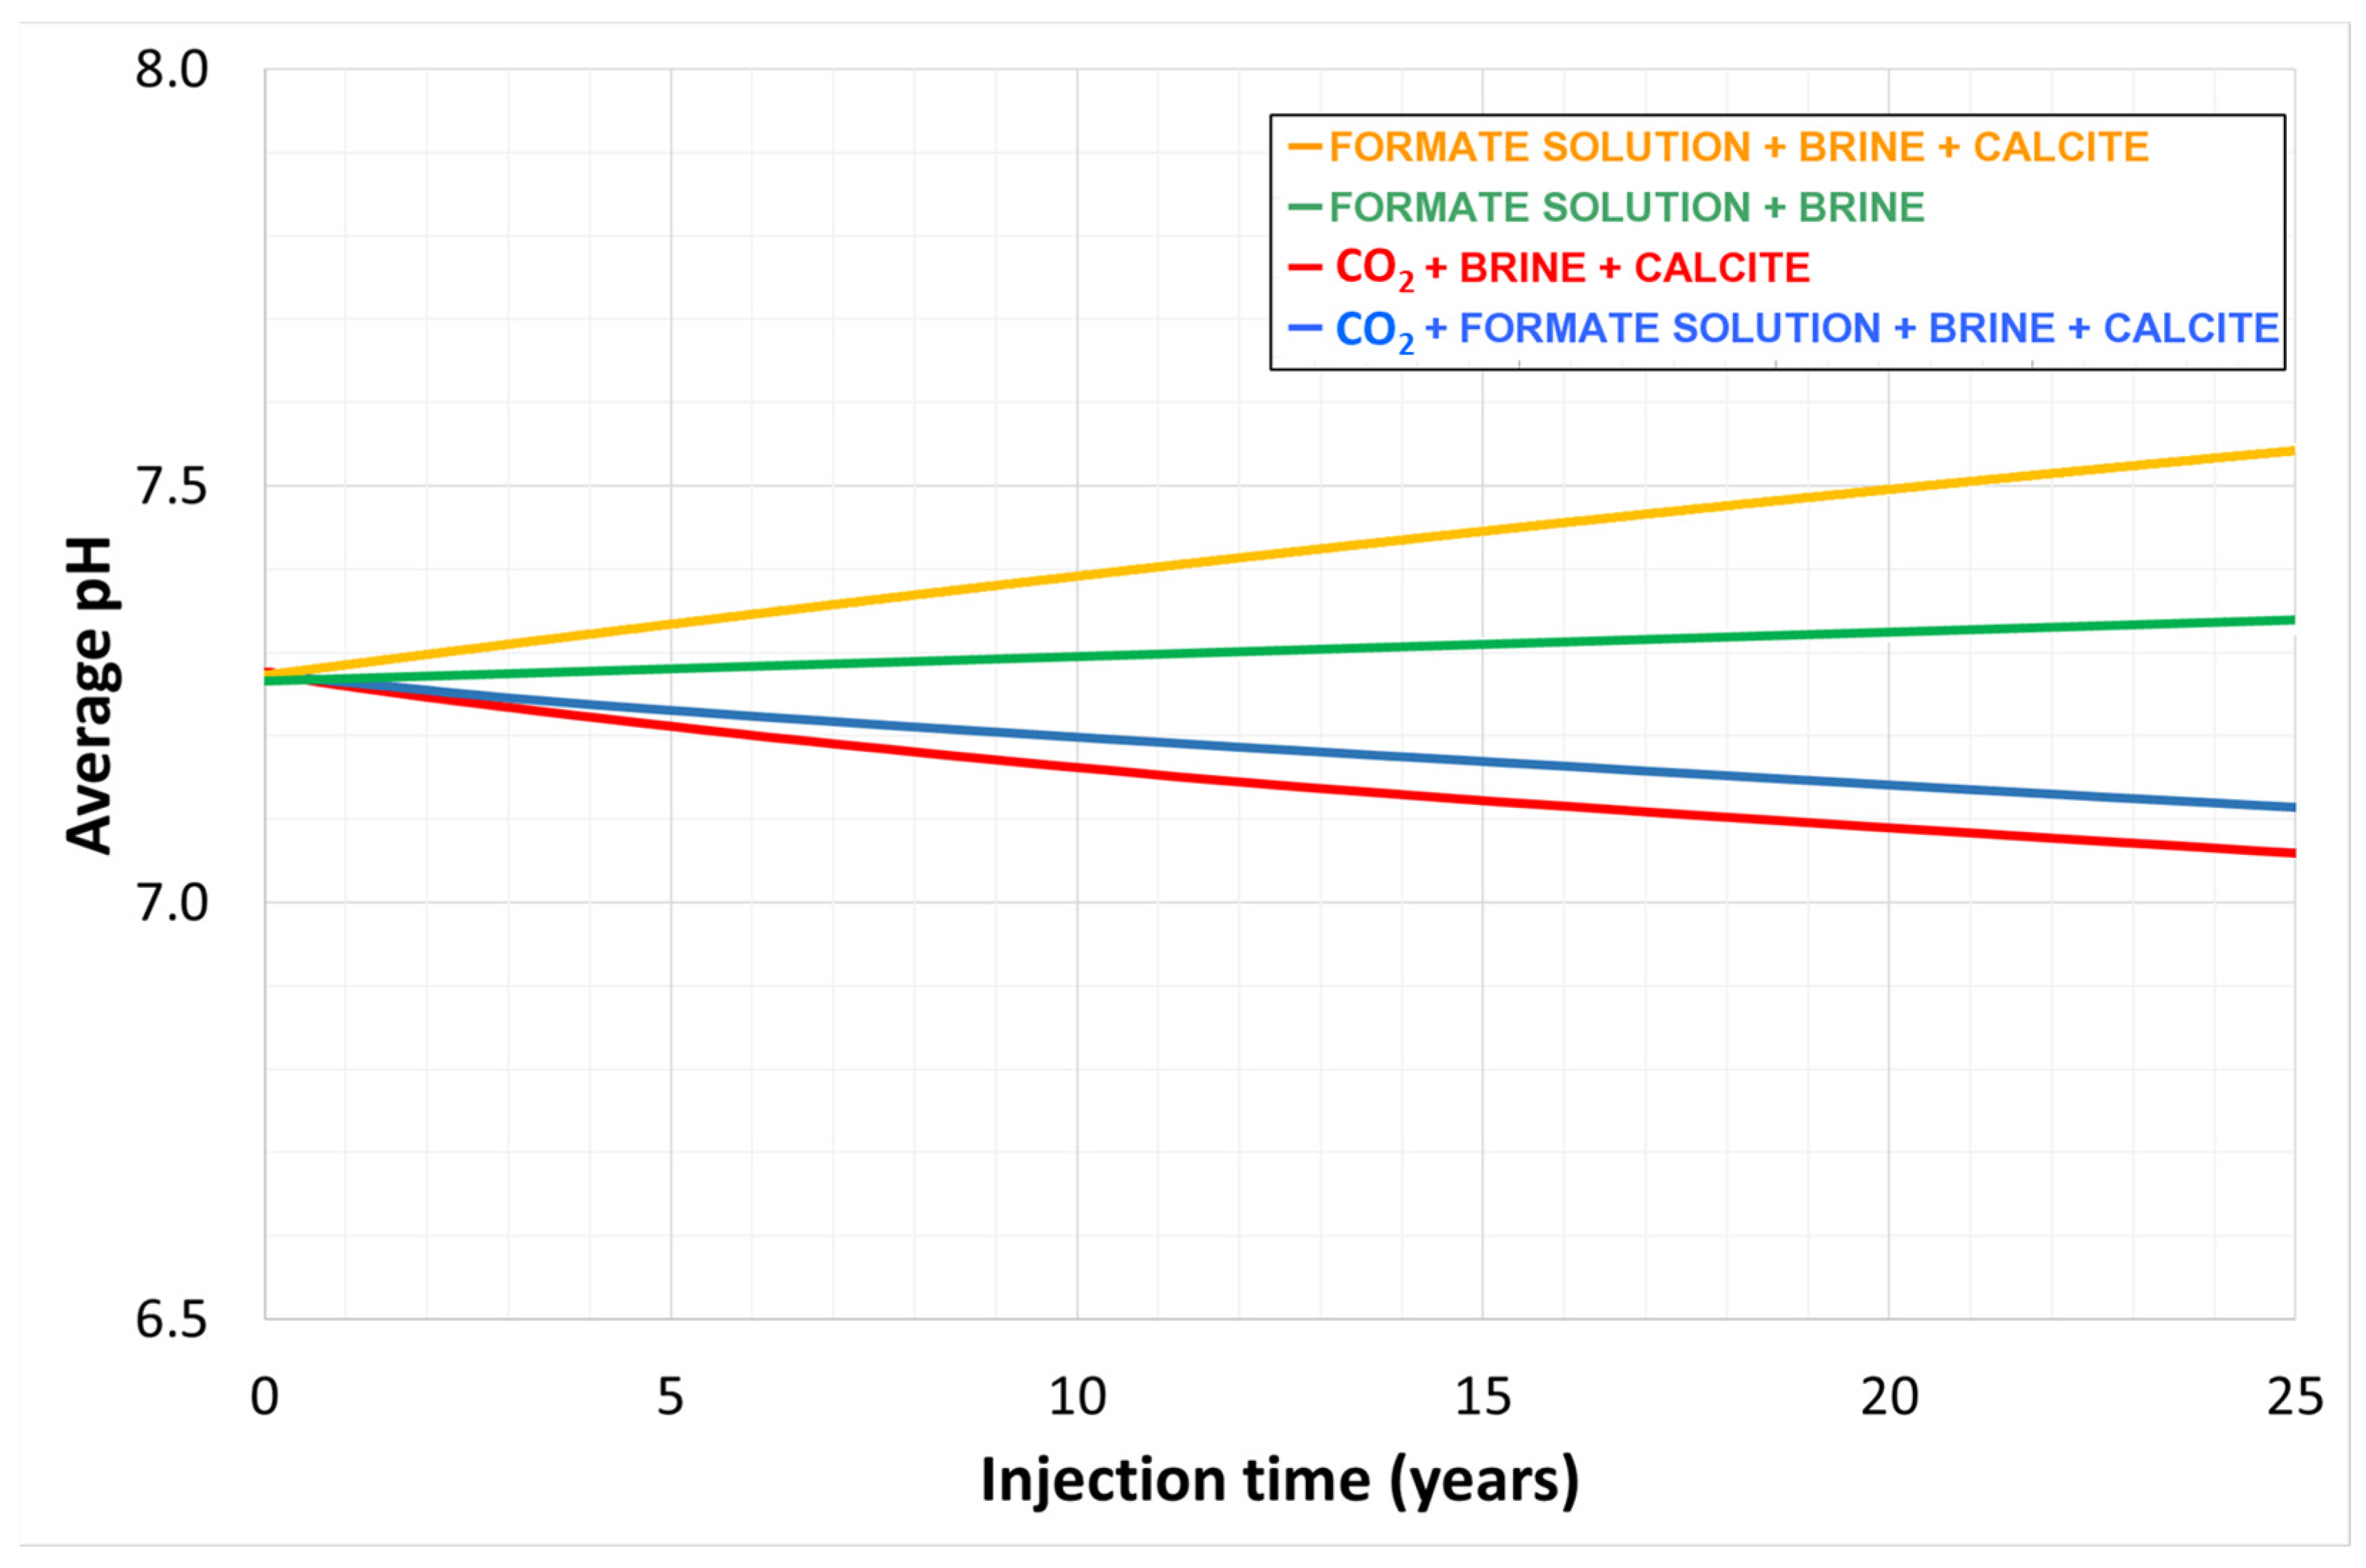
Increased pH when a formate solution is injected into a carbonate rock (orange curve in Figure 5), as experimentally observed by [18,21]. This is the sodium formate solution injection with no CO2 injection. The small precipitation of calcite comes from formate-induced calcite dissolution and then re-precipitation because bicarbonate ions from the resident brine (Table 2) cause calcite to precipitate in Figure 4A (right) upon the pH increase in Figure 4A (left). Note that the large pH values in Figure 4A are numerically simulated under the simulation conditions; therefore, the simulation results in Figure 4 must be interpreted qualitatively;
Nearly constant pH when a formate solution is injected into a rock without calcite (green curve in Figure 5), as reported by Wang [21];
Acidification occurs when CO2 is injected into a carbonate matrix (red curve in Figure 5), as expected by the generation of carbonic acid;
Less intense acidification occurs when a formate solution is injected simultaneously with the CO2 (blue curve in Figure 5). In this case, part of the CO2 injected is converted to bicarbonate induced by the buffer solution with an alkaline pH created by the formate injection, concentrated on the bottom of Figure 4B (left). Meanwhile, some of the CO2 rises (Figure 3c) and creates a lower pH zone (blue zone in Figure 4B on the left), inducing more significant calcite dissolution (red area in Figure 4B on the right) than when only formate is injected. In the same Figure, calcite re-precipitation is observed on the bottom induced by the buffer solution.
In summary, if only CO2 is injected, an acidic pH is expected to promote the calcite to dissolve (red curves in Figure 6) and increase the initial calcium concentration in brine. As shown in Figure 6 (orange curve on the top), the pH tends to increase if an aqueous solution of sodium formate is injected without adjusting the pH, for example, by formic acid [19,29]. If properly designed for a given formation and its operating conditions, an injection of aqueous formate solution can be used to control the CO2 mineralization trapping mechanism (the orange curve on the bottom) besides controlling the CO2 plume rise.

4. Case Study 2: Real Aquifer

4.1. Geological Model

The final evaluation was conducted in a model of an actual sandstone aquifer built with seismic and well data from three wells drilled in that area. The aquifer covers an onshore and offshore area in the Campos basin, Rio de Janeiro state, Brazil (red square in Figure 7). The sand grains are composed of quartz and feldspars, with a significant presence of granitic lithoclasts (a mechanically formed and deposited fragment of rock derived from an older one). The total porosity is 25%, and its origin is mainly secondary, generated by matrix contraction, grain dissolution, or grain fracturing, resulting in an average permeability of 1.5 D. Its rock mineralogy [45], in volumetric fraction, is composed of the following main minerals: quartz (29.5%), K-feldspar (8%), and plagioclase (5%), assumed here as albite.
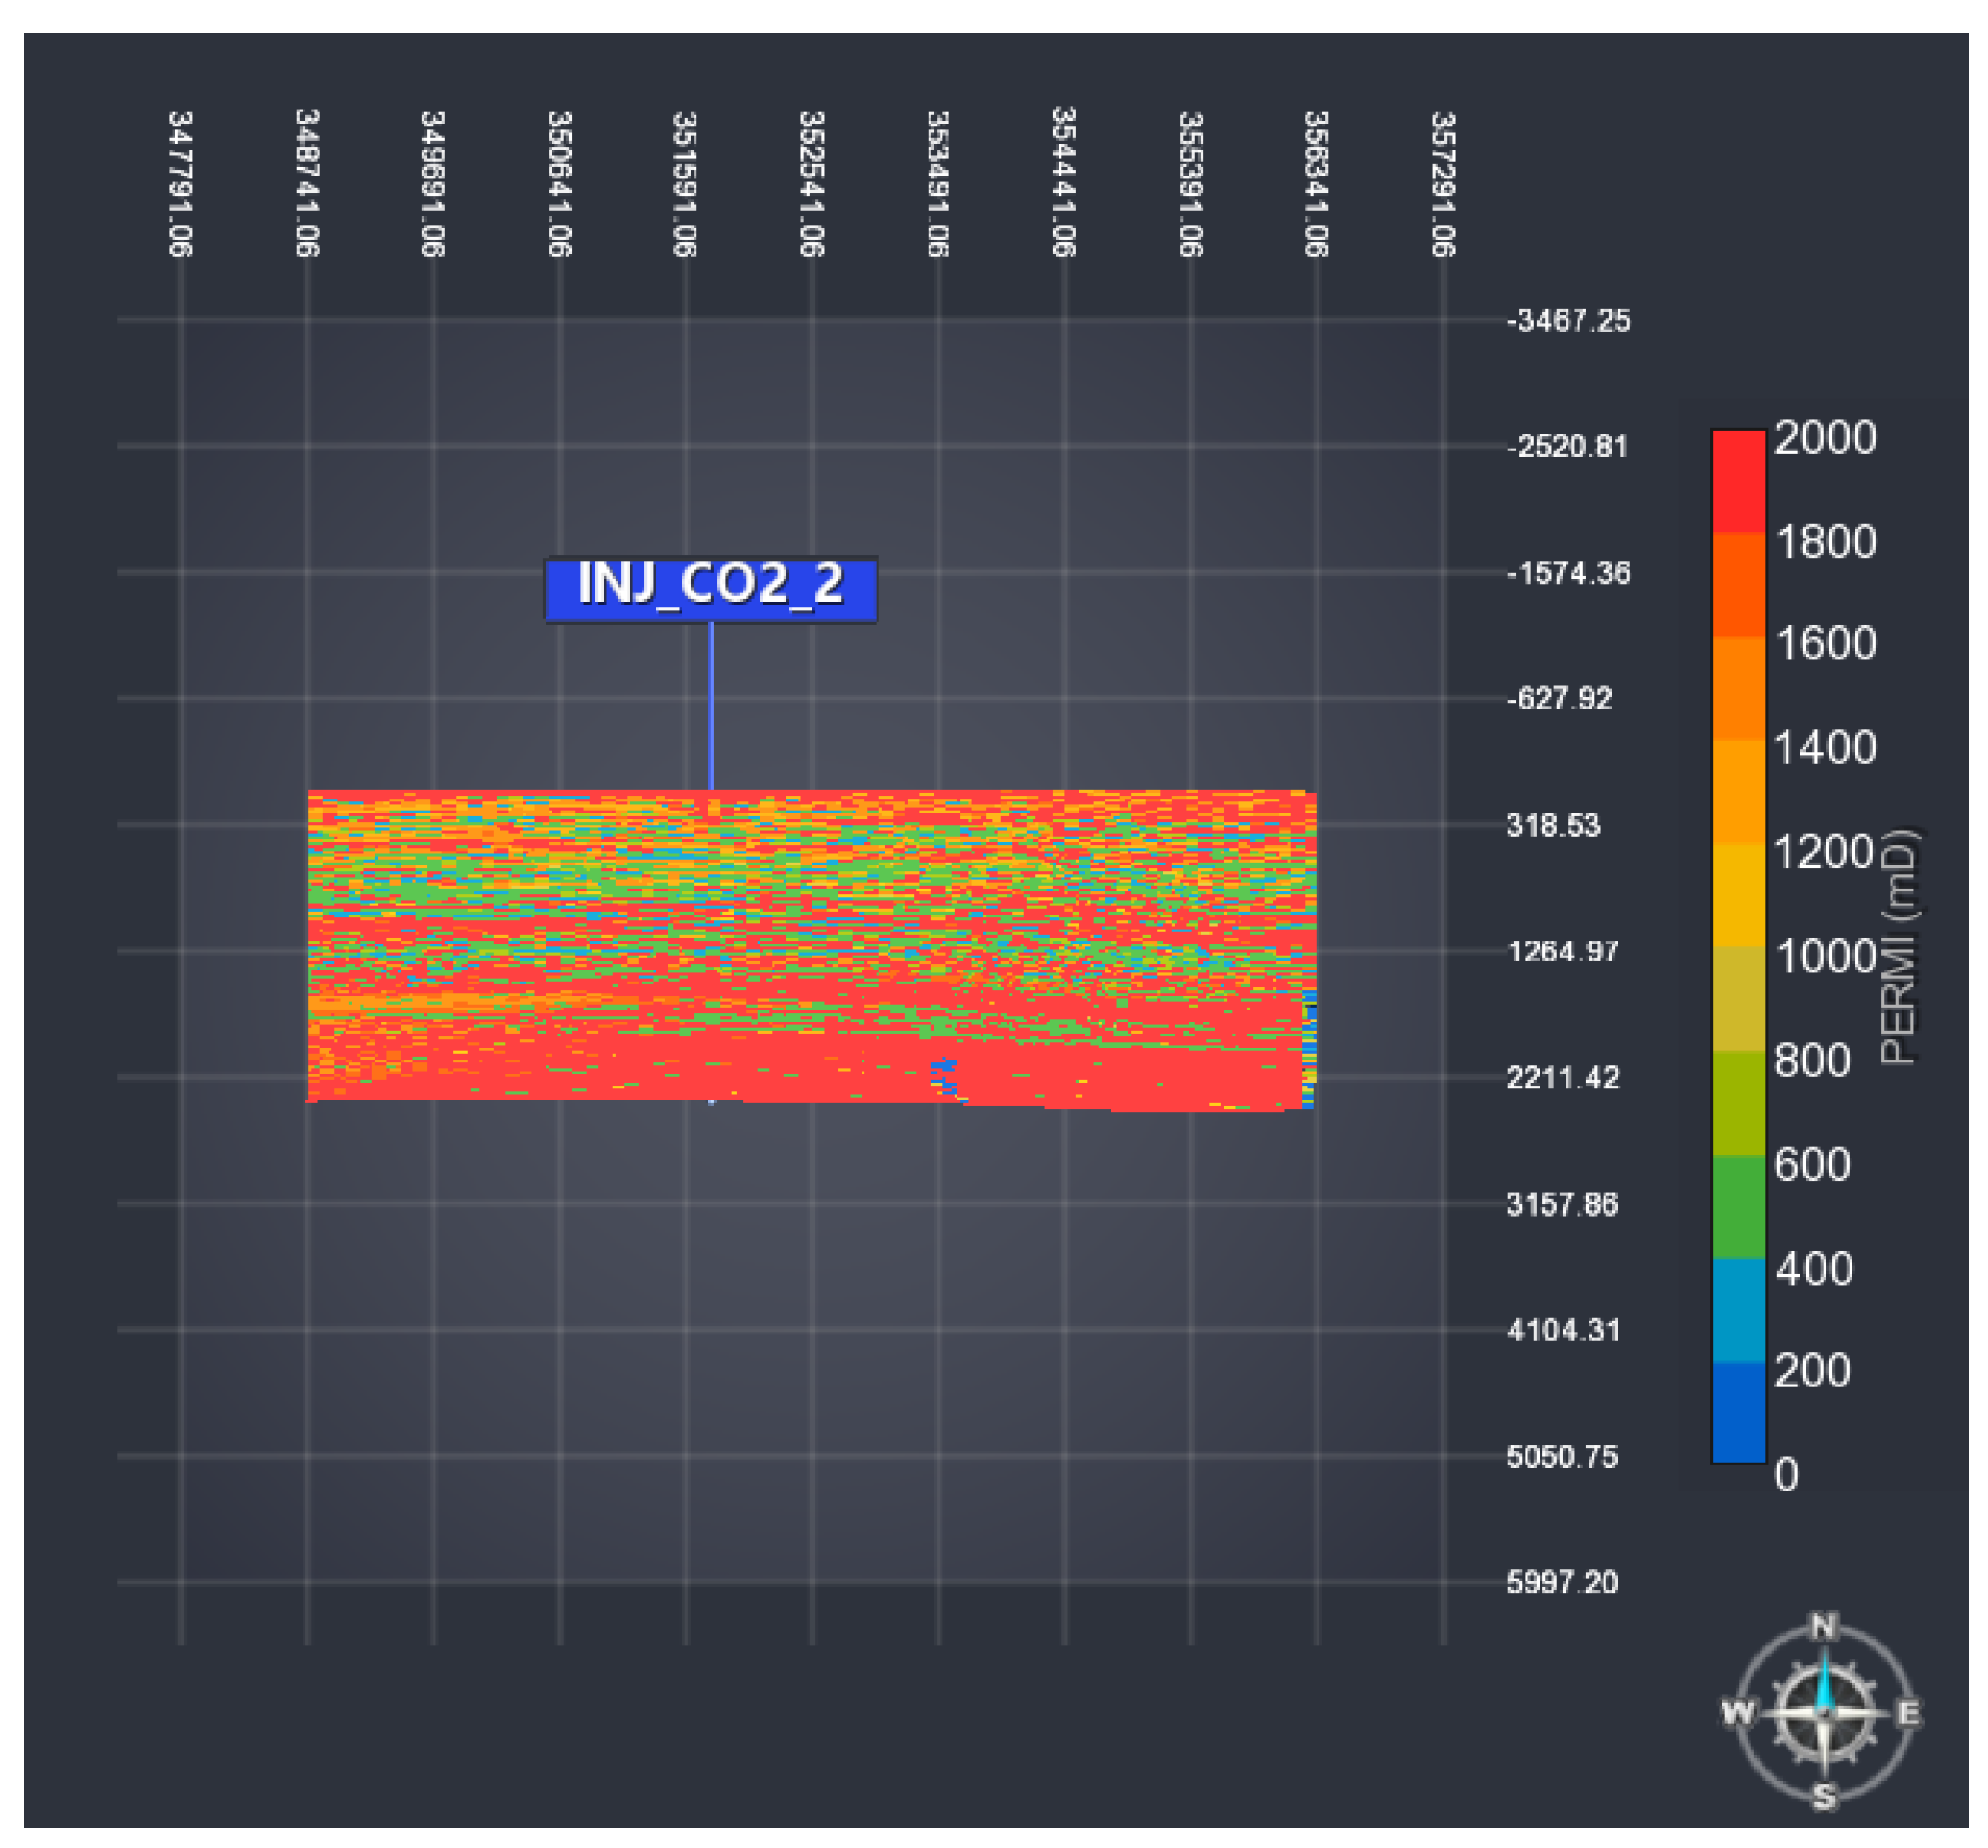
The full reservoir model encompasses a pore volume of over 150 billion m³, but a sector model with a pore volume of about 30 billion m3 was considered in this work (Figure 8). The gridblock size is 100 × 100 m2 horizontally and 5 m thick. A grid refinement was performed around the injector to reduce the gridblock size from 100 m to 25 m using the workflow proposed by Machado et al. [39].
The CO2 injection was evaluated over twenty years (2025–2045) with a constant rate of 1.5 million metric tons/yr through a centrally located vertical injector in the bottom layers. In this selected area, there is no evidence of an existing caprock, only a set of discontinuous shale lenses fitting the composite confining system classification, according to the concept introduced by Bump et al. [16]. Therefore, they can work as barriers to the CO2 plume. However, due to the geologic uncertainty of the occurrence and distribution of the dispersed barriers, it would be desirable to count on an additional control to prevent CO2 buoyancy on the surface or seafloor. In this context, the formate solution is anticipated to have a significant impact, which justifies the selection of this particular geological model for conducting the investigation. This model was chosen due to its suitability for examining and understanding the specific effects and implications associated with using a formate solution within the given scenario.
Other properties of the real case model are summarized in Table 3.

4.2. Results

Based on the potential benefits of the co-injection of a formate solution with CO2 using the synthetic model, application in an actual aquifer model is discussed in this section. Due to the larger amounts of CO2 to be injected, we need to optimize how and the quantity of the formate solution will be injected. Therefore, the following steps were proposed:
  • Start injecting the same volume of CO2 and formate solution. In this case, 1.5 million metric tons/yr of CO2 was assumed based on the field project design;
  • Evaluate different CO2/formate volumetric ratios (R);
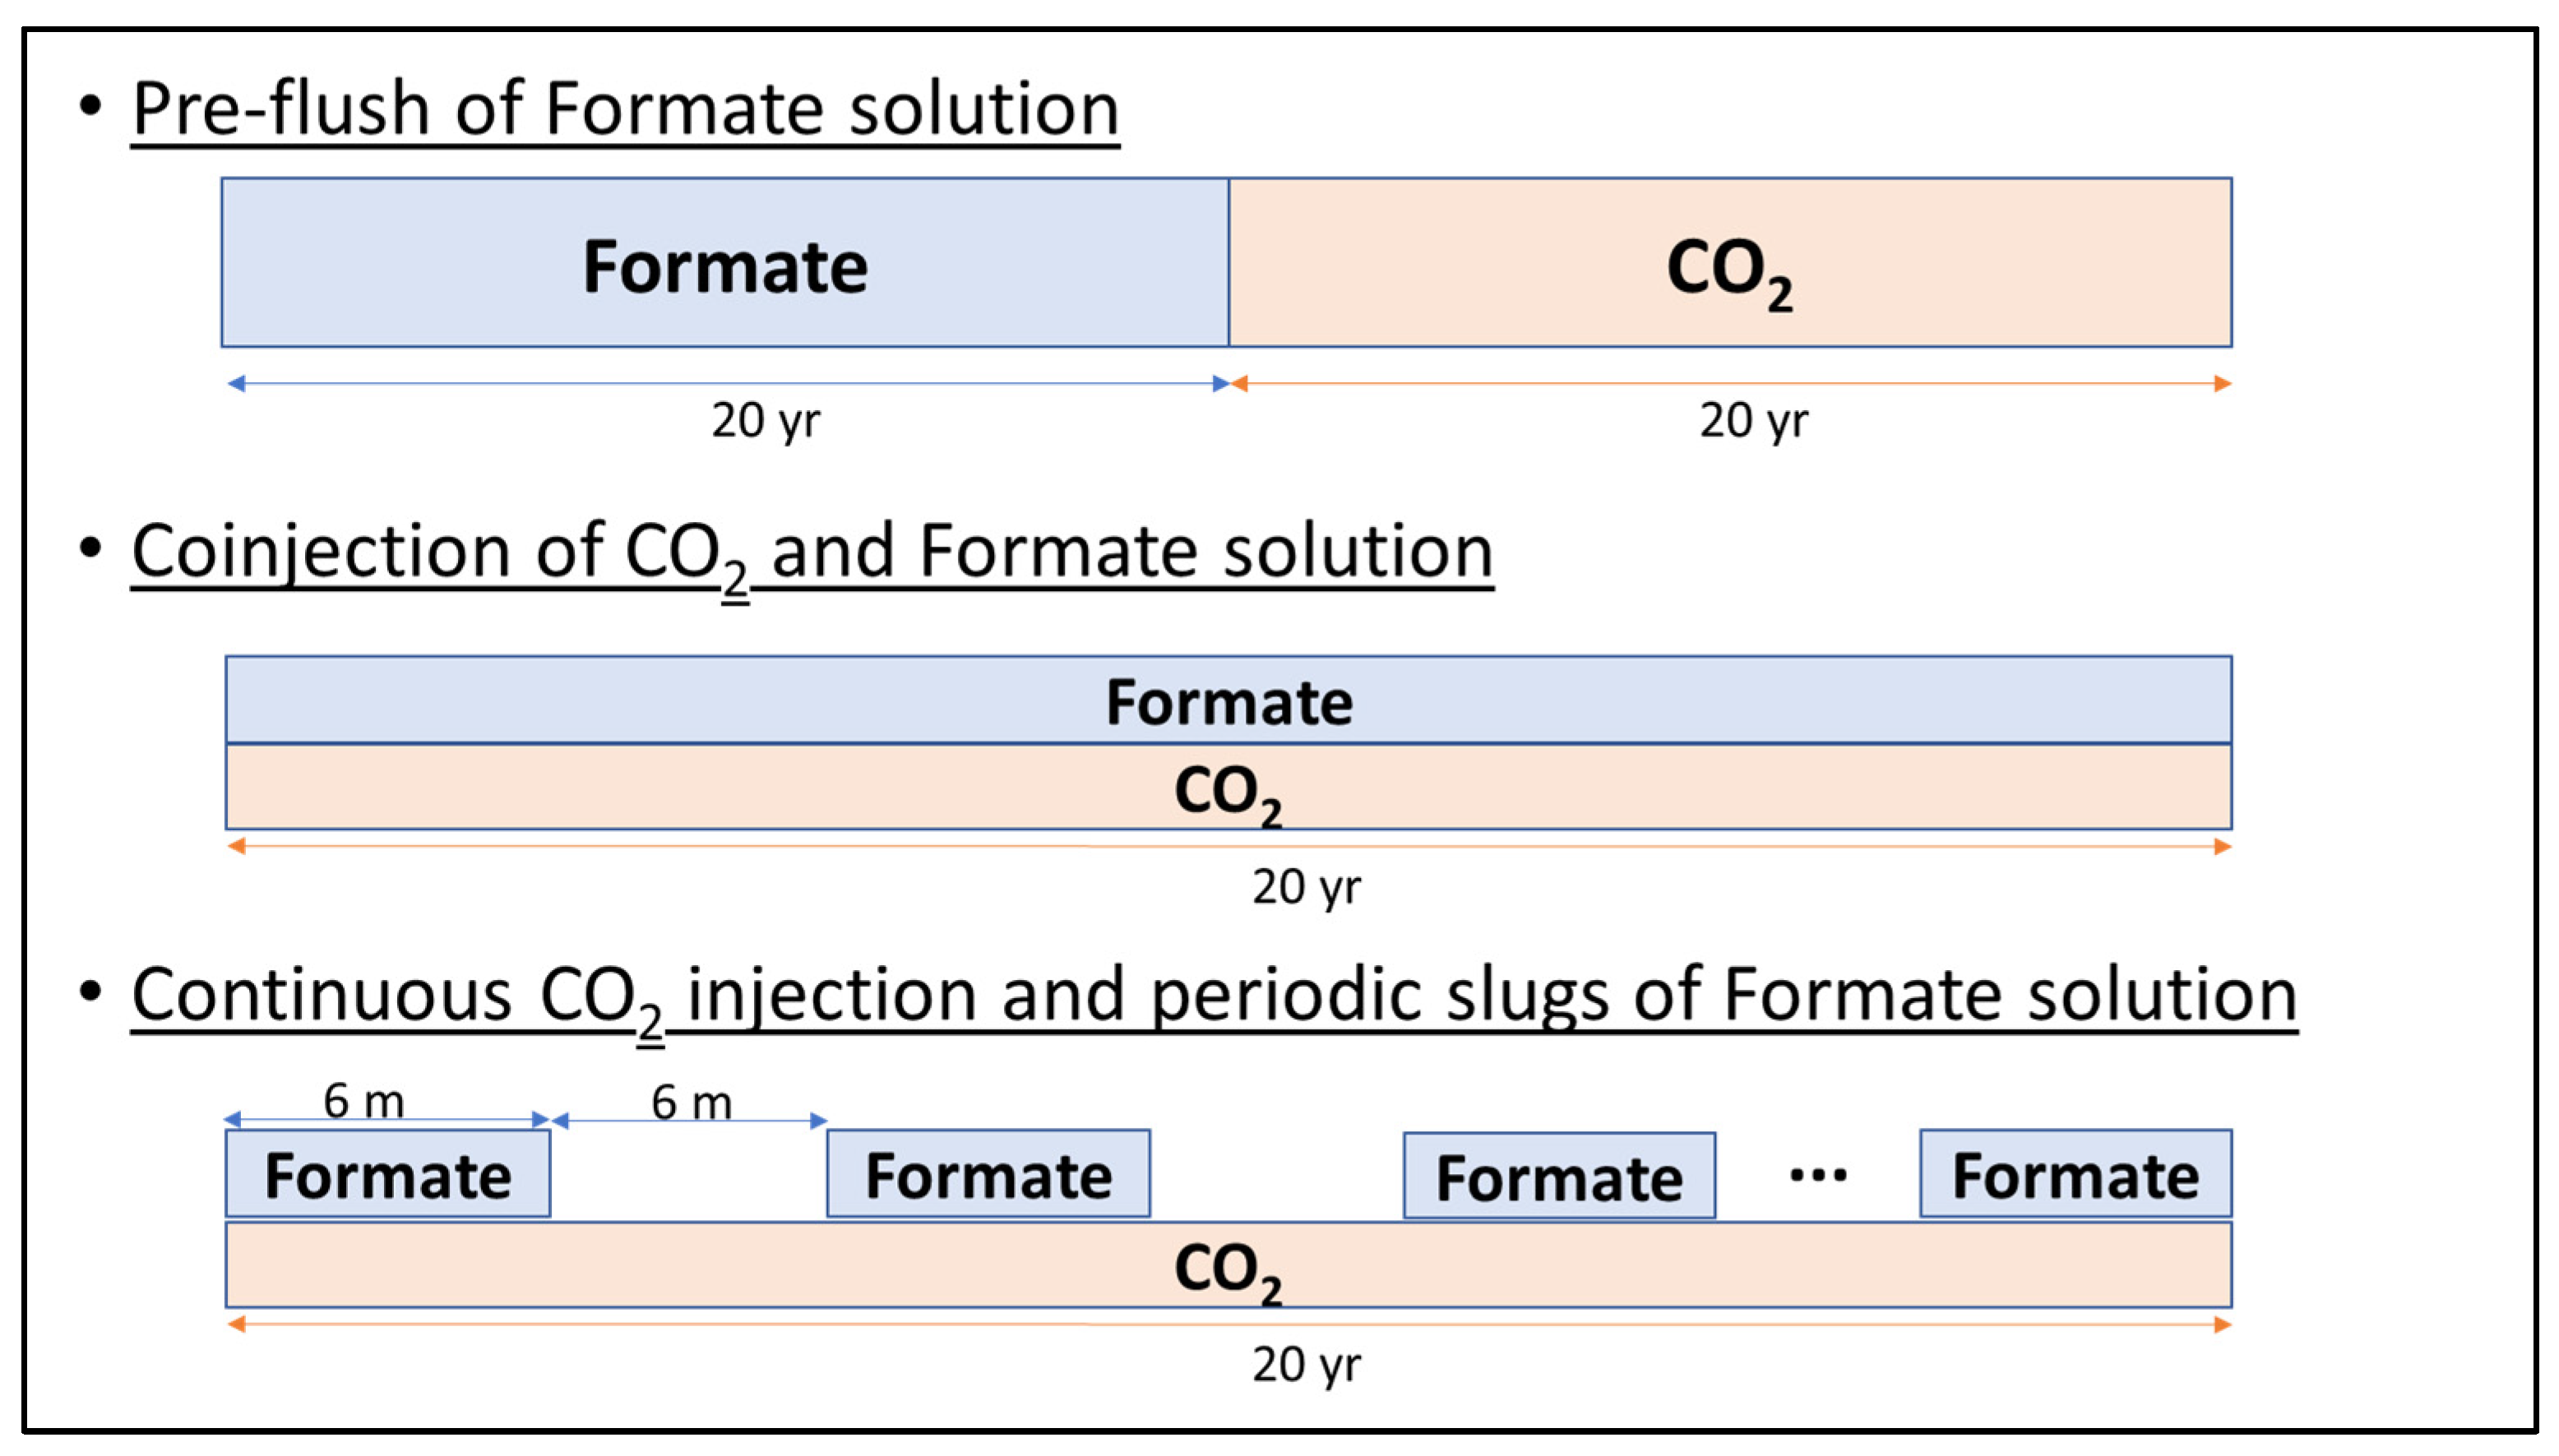
  • With the best R-value, test different hybrid strategies: (i) pre-flush of formate preceding the CO2 injection, called “pre-flush”; (ii) simultaneous and continuous injections of both fluids, called “co-injection”; (iii) continuous CO2 injection and alternating and simultaneous formate injection with 6-month slugs, called “alternated.” Figure 9 illustrates the different injection strategies.
To make a fair comparison, the volume of the formate solution used in the simulations is the same in all cases over 20 years of injections (2025–2045), and it corresponds to approximately 3.6 million tons (i.e., 1.08 million tons of formate ions, not formate salts), which is a considerable amount and could raise some concerns about the economic viability of this process. However, as mentioned in the Introduction section, formate species can also be generated by the electrochemical reduction in CO2 [47], contributing to carbon emission reduction goals. Therefore, the combination of CO2 and formate solution injections brings synergistic benefits: it makes the storage safer by providing buoyancy control and, at the same time, enhances the amount of carbon stored since the gravity-controlling agent (formate solution) can be generated from CO2 electrochemical reduction on the surface.
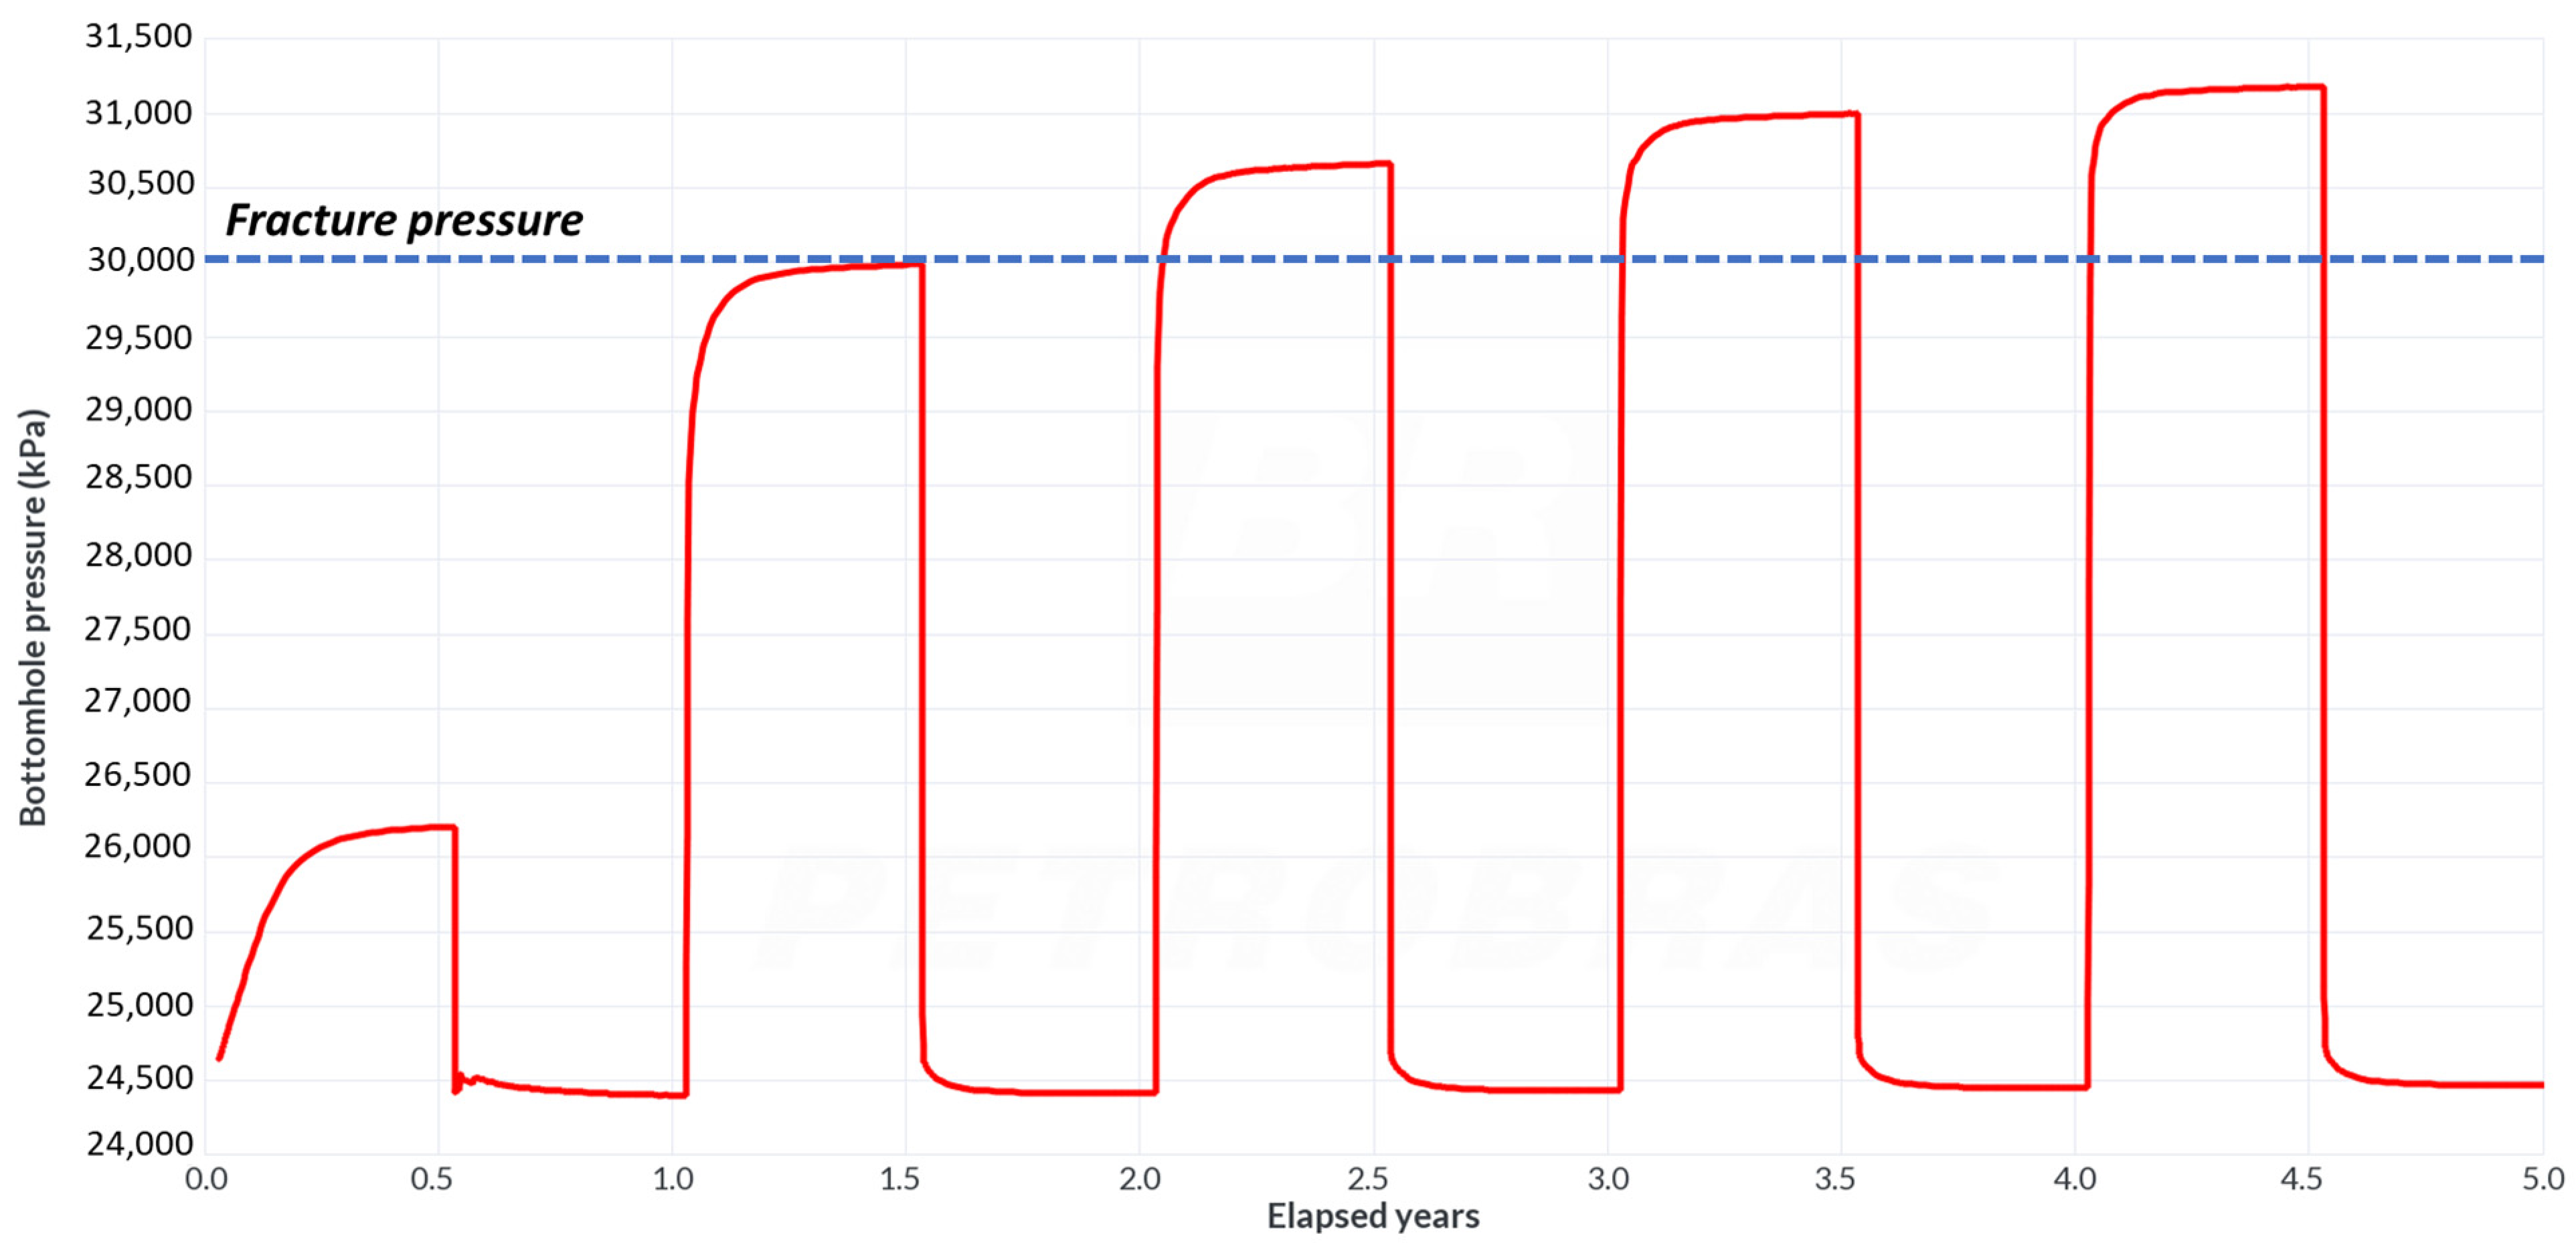
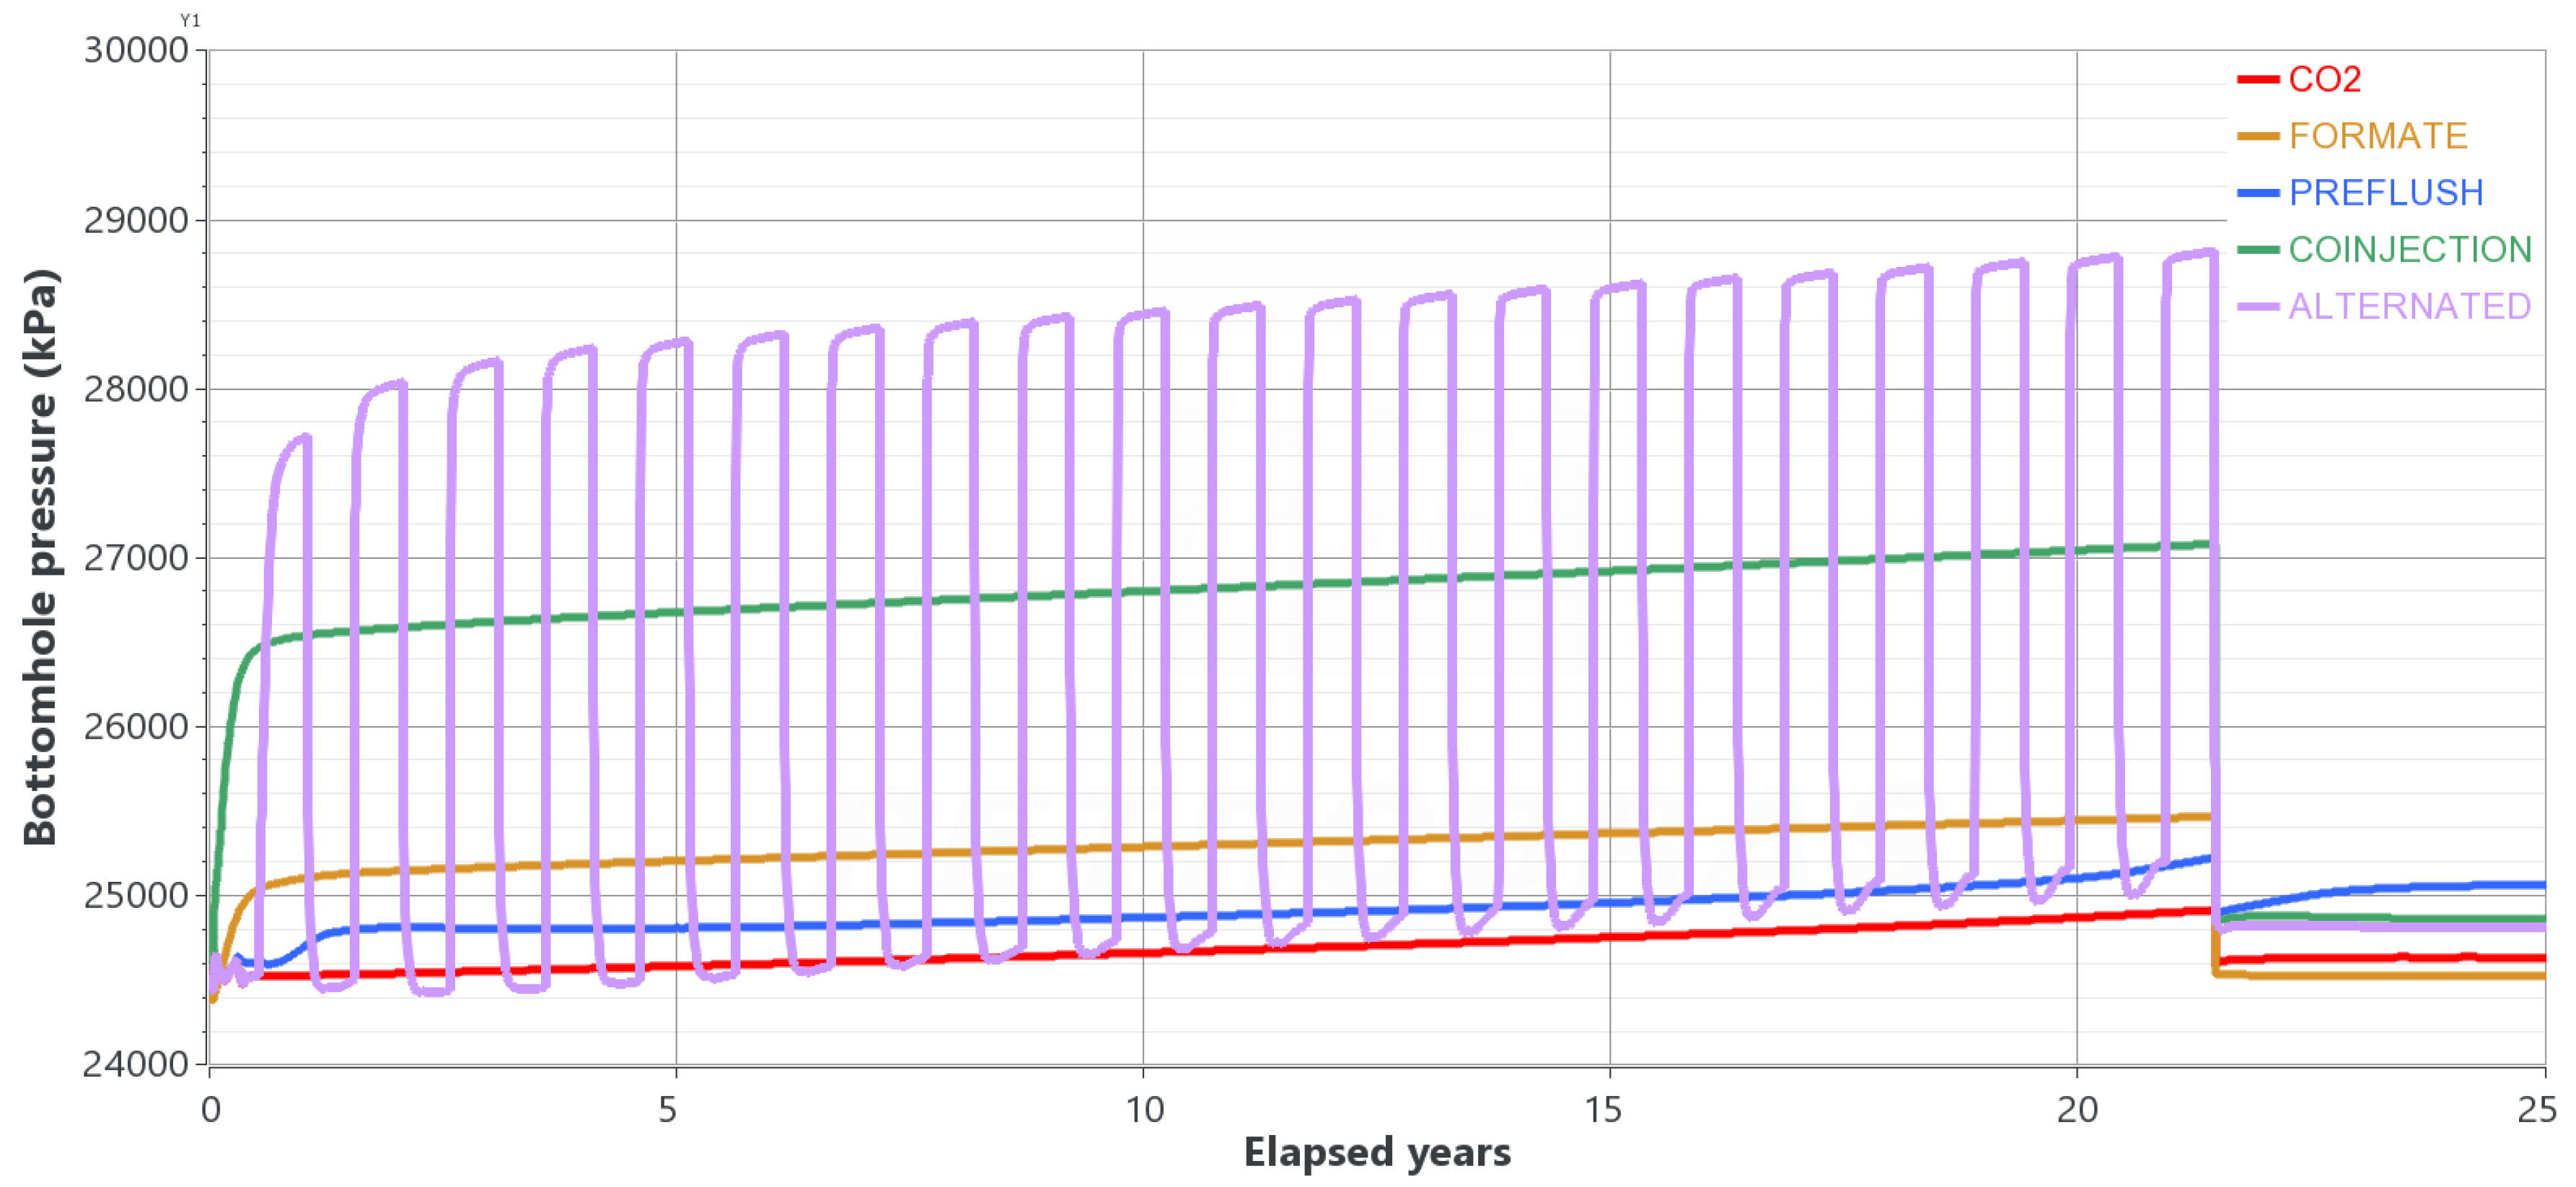
In this work, R values of more than 1 were considered due to economic viability concerns. This is because producing a larger volume of formate solution would be required compared to the CO2 volume. Additionally, the formate solution exhibits higher viscosity than CO2, with an average viscosity of 3 cP compared to 0.05 cP for CO2 at downhole conditions. Consequently, the injection rate of formate would need to be limited after the second year of injections when testing an R = 0.5, as illustrated in Figure 10. This limitation is necessary to ensure that the pressure during operation remains below the fracture gradient, which establishes a maximum bottomhole pressure of 30,000 kPa for this specific aquifer. Hence, operating with an R-value less than 1 could pose operational challenges, particularly for cases with low- and mid-permeability, where issues related to injectivity are more likely to arise.
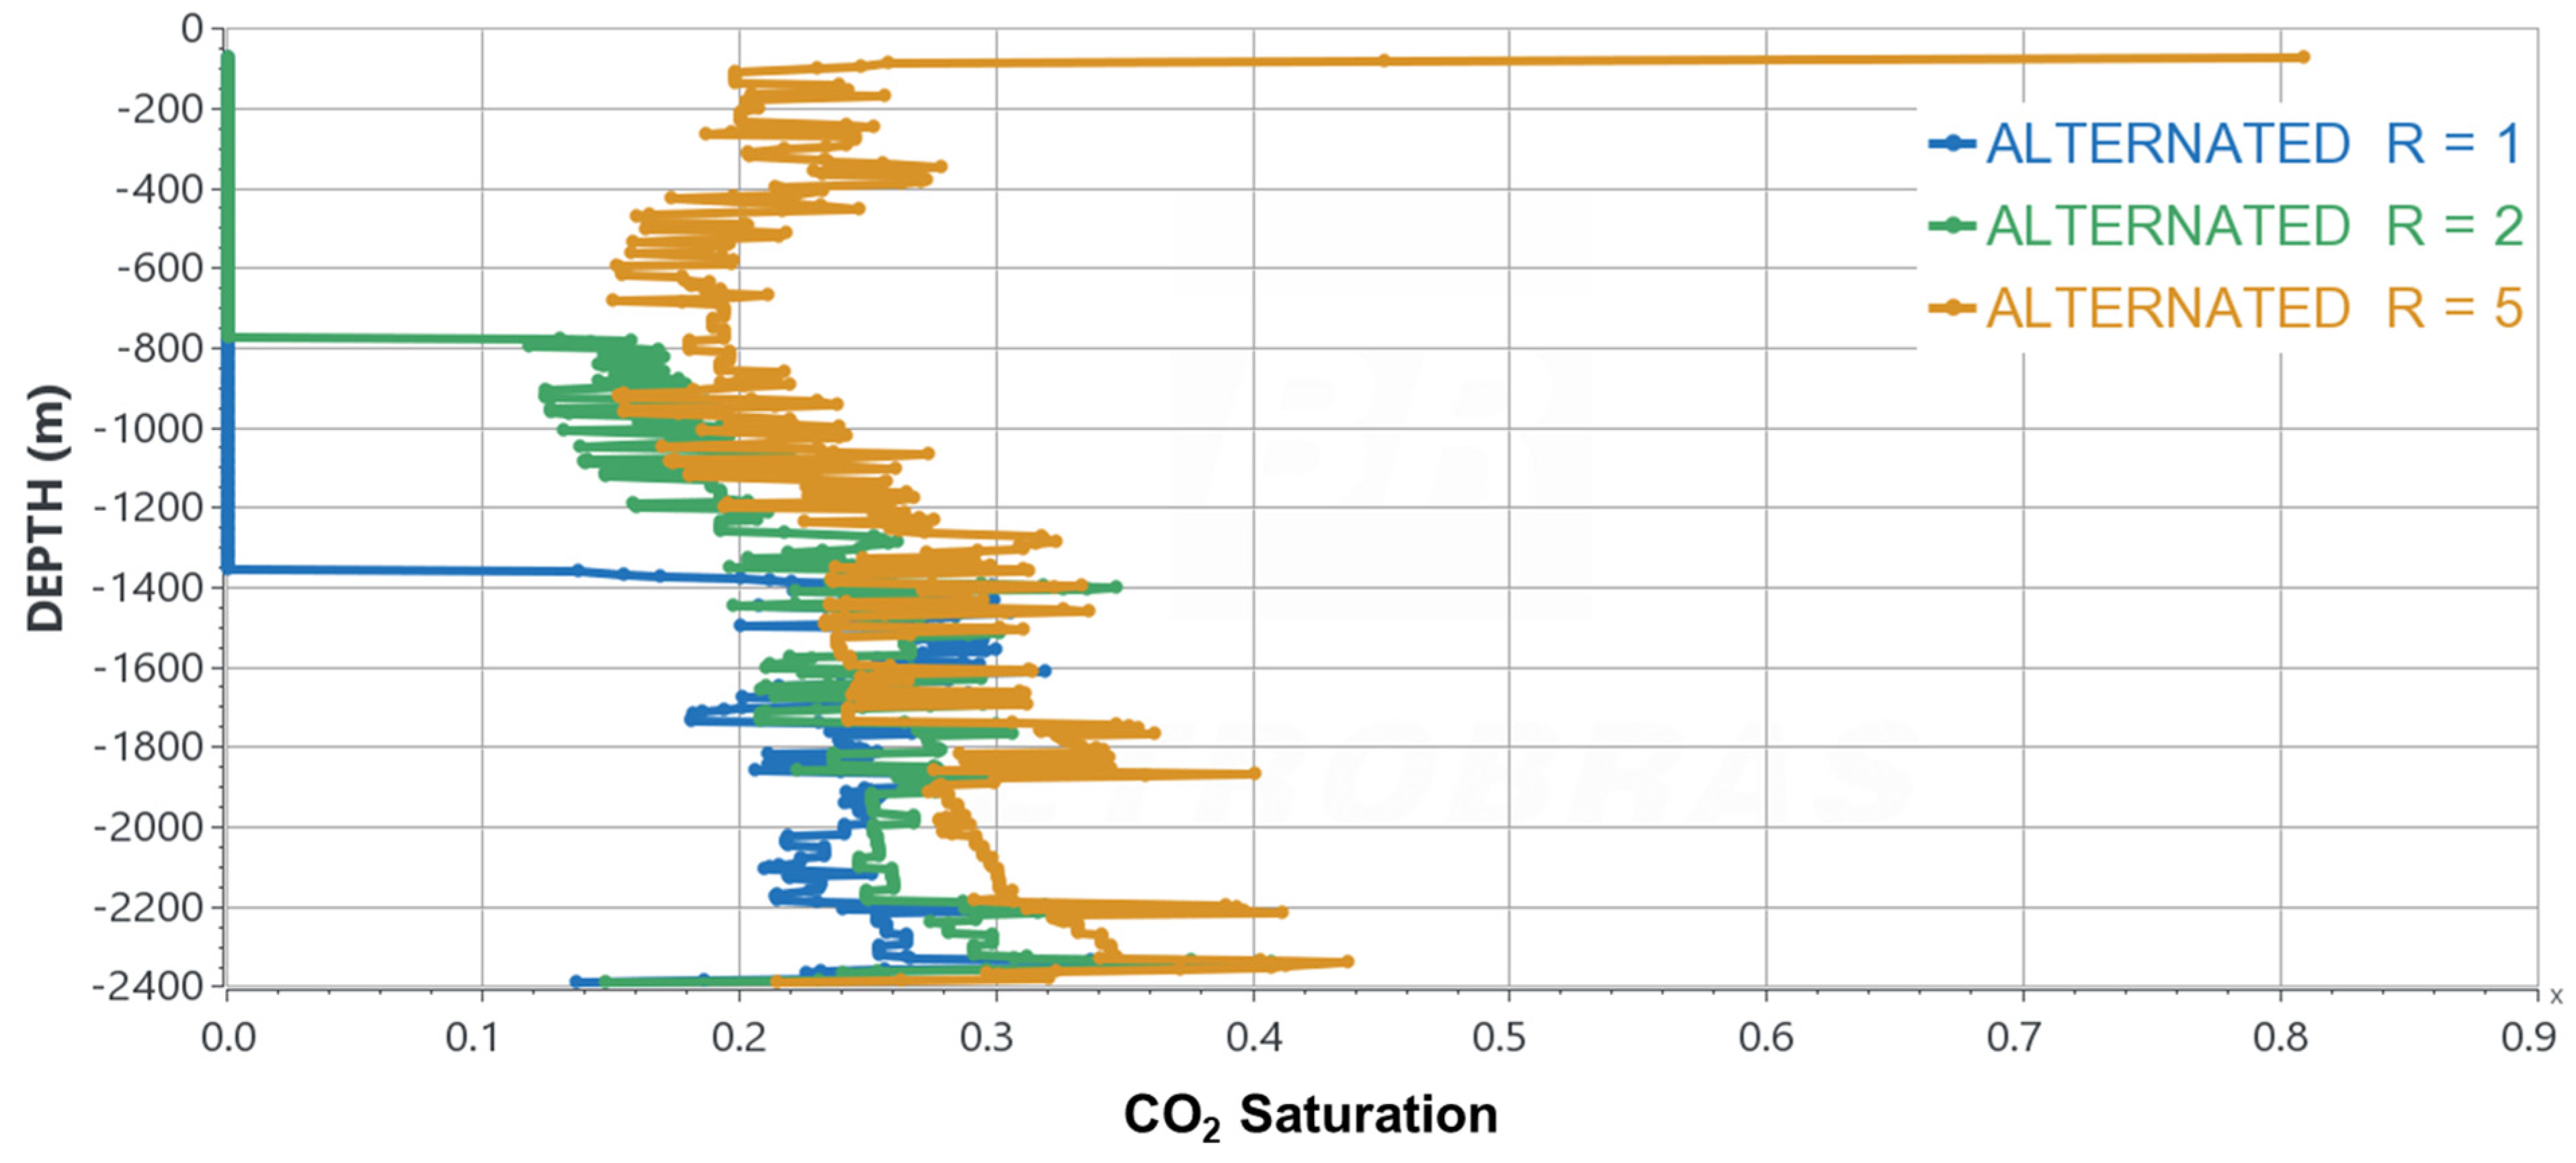
After following the optimization steps (a) and (b), the best R-value (CO2/formate ratio) to control the plume rise was when the volumetric amounts of CO2 and the formate solution were the same, e.g., R = 1.0. Figure 11 compares three R values considering the alternated CO2/formate injection strategy. The results indicate that the case with R = 1 poses a lower risk compared to the other case. When R = 5, representing a CO2 injected volume five times that of the formate volume, the CO2 plume reaches the surface after 20 years of injections (2045).
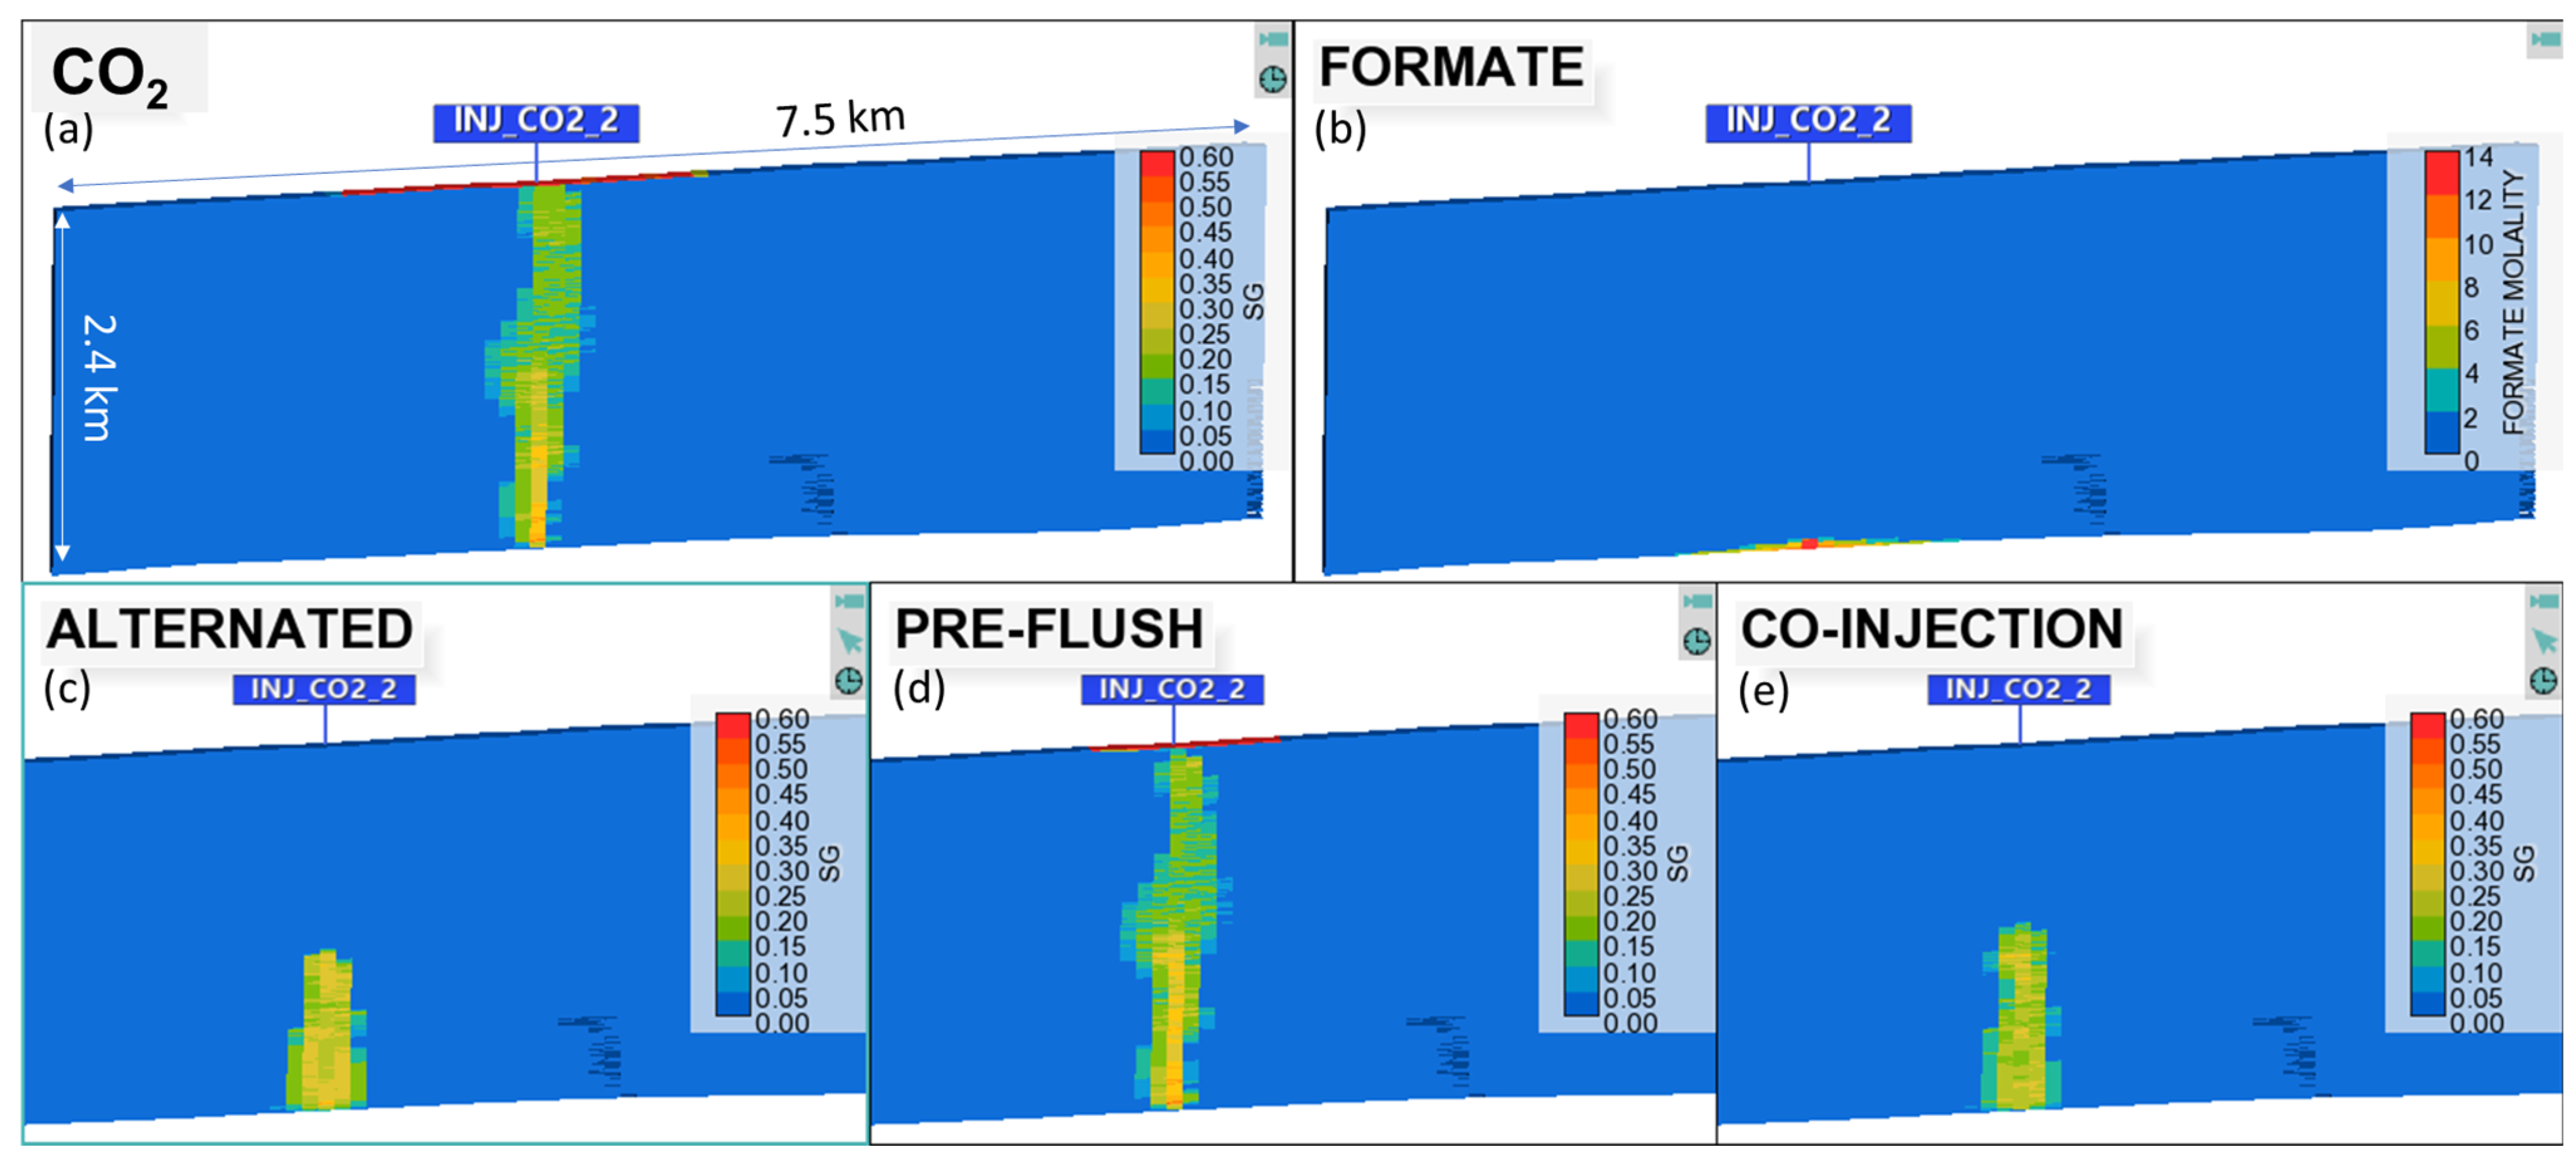
Figure 12 presents a comparison of different injection strategies with R = 1. The first row of the figure displays the cases of only a CO2 injection or only a formate solution injection, while the second row showcases the hybrid techniques. It is important to note that the injection point for all strategies remains consistent and is placed at the bottom of the aquifer. The regime is less gravity-dominant when only a formate solution is injected, in agreement with the results obtained by Oyenowo et al. [29]. However, the primary goal of this study is to evaluate hybrid strategies. Therefore, the best hybrid plans were the co-injection and alternate ones. The pre-flush case could not prevent CO2 upward buoyancy flux to the surface/seafloor depth.
Even in the combined strategies, where the total injection rate was higher, it was possible to inject below the maximum bottomhole pressure (BHP) of 30,000 kPa (Figure 13) for this saline aquifer to avoid fracturing the rock, highlighting that it is operationally possible to inject both CO2 and the formate solution [46]. The curves show a consistent behavior when only CO2 is injected (lower viscosity phase), developing lower pressures (red curve). The co-injection presented an average curve for BHP (green curve) when compared with that of the alternated case (light-purple curve), since the injected masses (CO2 and formate) were the same.
After 100 years of redistribution (Year 2145), the CO2 plume in the best strategies (co-injection and alternate injection) remained stationary/immobile below the surface depth, as shown in Figure 14, highlighting the effectiveness of the buoyancy control exerted by the formate solution over the CO2 plume in those combined strategies.
Regarding the aquifer average pressure, its build-up was less intense than it was observed in the wellbore, mitigating geomechanical risks associated with the high pressure, such as fracture initialization or fault activation. Figure 15 compares the average pressures of the cases where only CO2 is injected with the two best options when the CO2 injection is combined with the formate solution in co-injection and alternated ways. The wavy behavior in the curve of the alternated case (light purple) is due to the injection of the formate solution in periodic slugs.
Regarding the possible CO2 mineralization induced by the higher pH generated by the formate injection around the injector well, mineral precipitation was not observed since this case is a sandstone matrix without reactive carbonate minerals, and the formation brine presents a low concentration of Ca2+ ions.

4.3. Sensitivity to the Formate Volume

Figure 11 shows the relationship between the volumes of CO2 and the formate solution injected. For more significant amounts of CO2 compared to the formate solution, this combination was not effective in controlling the CO2 plume rise. For this study, the optimal ratio R should be lower or equal to 1. However, as commented before, R < 1 would require a larger mass of formate per well, which can be costly. Although economic evaluation is outside the scope of this work, some simulations for CCUS projects can be found in [29]. Economic evaluation depends on each country’s carbon credit and tax relief policies, which vary over time, besides the subsurface pressure, depth, and CO2 injection rate.

4.4. Sensitivity to Rock Permeability

Injectivity can be a concern because of the higher viscosity of the formate solution (3 cP in this study) than CO2 (0.05 cP). However, this technique is still possible for lower injection rates in mid-permeability cases (average of 150 mD), despite the lower injectivity than CO2. Supposing the permeability of the model is reduced by a factor of 10, the co-injection and alternated cases can still operate with typical CO2 injection capacities, respecting the maximum BHP of 30,000 kPa, as shown in Table 4. According to data from different storage sites [48,49], those rates are practical for a CCS project, ranging from 0.1 million metric tons/yr. In the co-injection strategy, the total mobility of the fluids injected (CO2 + formate) is higher, so the injectivity is more affected than in the alternated case.

5. Conclusions

This paper discussed the risk of CO2 leakage in CCS projects where the caprock is not an effective barrier and investigated the possibility of controlling the buoyancy-driven upward flux of CO2 by injecting an aqueous solution of formate species. The main conclusions are summarized below:
  • The co-injection of an aqueous formate solution could make the gravity-dominant regime less intense during CO2 injection for carbon storage purposes, especially when the CO2 and formate solution volumes are approximately the same;
  • Three injection strategies were evaluated against the single fluid injection (only CO2 or formate). The best strategies combine the simultaneous injection of the two fluids, either continuous or alternated slugs of formate solution. Both cases prevent a CO2 plume from rising to the surface and keep the plume stationary over hundreds of years of redistribution;
  • A secondary benefit of the formate solution is the pH buffering, which results in a suppressed change in pH when CO2 is injected. This mechanism induced calcite precipitation from brines in the studied case. Thus, it could be an additional and permanent CO2 trapping mechanism in this buffer zone in carbonate rocks.

Author Contributions

Conceptualization, M.V.B.M., M.D., O.A.C.J., R.O. and K.S.; methodology, M.V.B.M., M.D. and R.O.; software, M.V.B.M.; validation, M.V.B.M., M.D., O.A.C.J., R.O. and K.S.; formal analysis, M.V.B.M., M.D., O.A.C.J., R.O. and K.S.; investigation, M.V.B.M., M.D. and R.O.; resources, M.V.B.M., M.D. and R.O.; data curation, M.V.B.M., M.D. and R.O.; writing—original draft preparation, M.V.B.M., O.A.C.J. and R.O.; writing—review and editing, M.D. and K.S.; visualization, M.V.B.M., M.D., O.A.C.J., R.O. and K.S.; supervision, M.D., R.O. and K.S.; project administration, K.S. All authors have read and agreed to the published version of the manuscript.

Funding

This research received no external funding.

Data Availability Statement

The data and model’s details used in this study are provided within the article.

Acknowledgments

The authors thank PETROBRAS for authorizing the data and models and Marcos Silveira Gonçalves (from PETROBRAS) for his support in preparing the real geological case model.

Conflicts of Interest

The author Marcos Vitor Barbosa Machado is employed by the company Petrobras. The remaining authors declare that the research was conducted in the absence of any commercial or financial relationships that could be construed as a potential conflict of interest.

Nomenclature

CLand’s constant, dimensionless
cfrock compressibility, kPa−1
Ddiffusion coefficient, cm²/s
Deffeffective diffusion coefficient, cm²/s
kcurrent absolute permeability, mD [9.869 × 10⁻⁴ μm2]
H i Henry’s constant at current pressure (p) and temperature (T), dimensionless
H i * Henry’s constant at reference pressure (p*) and temperature (T), dimensionless
Njthe total moles of mineral j, gmol/m³
ppressure, kPa
Runiversal gas constant, 8.314 kPa·L/mol·K
rfresistance factor, dimensionless
Sgttrapped gas saturation, dimensionless
Sg maxmaximum gas saturation, dimensionless
v i ¯ partial molar volume at infinite dilution, L/mol
Greek Symbols
φ current porosity
ρmmineral molar density, gmol/m3
ρ density, kg/m³
τtortuosity, dimensionless

References

  1. Birol, D.F. World Energy Outlook 2022; IEA Publications: Paris, France, 2022. [Google Scholar]
  2. Delshad, M.; Kong, X.; Tavakoli, R.; Hosseini, S.A.; Wheeler, M.F. Modeling and Simulation of Carbon Sequestration at Cranfield Incorporating New Physical Models. Int. J. Greenh. Gas Control. 2013, 18, 463–473. [Google Scholar] [CrossRef]
  3. Han, W.S.; McPherson, B.J.; Lichtner, P.C.; Wang, F.P. Evaluation of Trapping Mechanisms in Geologic CO2 Sequestration: Case Study of SACROC Northern Platform, a 35-Year CO2 Injection Site. Am. J. Sci. 2010, 310, 282–324. [Google Scholar] [CrossRef]
  4. Nghiem, L.; Shrivastava, V.; Kohse, B.; Hassam, M.; Yang, C. Simulation of Trapping Processes for CO2 Storage in Saline Aquifers. In Proceedings of the Canadian International Petroleum Conference, Calgary, AB, Canada, 16–18 June 2009; Petroleum Society of Canada: Calgary, AB, Canada, 2009. [Google Scholar]
  5. Rackley, S.A. Carbon Capture and Storage, 2nd ed.; Butterworth-Heinemann: Cambridge, MA, USA, 2017; ISBN 978-0-12-812041-5. [Google Scholar]
  6. Duan, Z.; Sun, R. An Improved Model Calculating CO2 Solubility in Pure Water and Aqueous NaCl Solutions from 273 to 533 K and from 0 to 2000 Bar. Chem. Geol. 2003, 193, 257–271. [Google Scholar] [CrossRef]
  7. Portier, S.; Rochelle, C. Modelling CO2 Solubility in Pure Water and NaCl-Type Waters from 0 to 300 °C and from 1 to 300 Bar. Chem. Geol. 2005, 217, 187–199. [Google Scholar] [CrossRef]
  8. Farajzadeh, R.; Zitha, P.L.J.; Bruining, J. Enhanced Mass Transfer of CO2 into Water: Experiment and Modeling. Ind. Eng. Chem. Res. 2009, 48, 6423–6431. [Google Scholar] [CrossRef]
  9. Neufeld, J.A.; Hesse, M.A.; Riaz, A.; Hallworth, M.A.; Tchelepi, H.A.; Huppert, H.E. Convective Dissolution of Carbon Dioxide in Saline Aquifers. Geophys. Res. Lett. 2010, 37, 22. [Google Scholar] [CrossRef]
  10. Taheri, A.; Torsæter, O.; Lindeberg, E.; Hadia, N.J.; Wessel-Berg, D. Effect of Convective Mixing Process on Storage of CO2 in Saline Aquifers with Layered Permeability. Adv. Chem. Res. 2021, 3, 1–21. [Google Scholar] [CrossRef]
  11. Amarasinghe, W.; Farzaneh, S.; Fjelde, I.; Sohrabi, M.; Guo, Y. A Visual Investigation of CO2 Convective Mixing in Water and Oil at the Pore Scale Using a Micromodel Apparatus at Reservoir Conditions. Gases 2021, 1, 53–67. [Google Scholar] [CrossRef]
  12. Elenius, M.T.; Voskov, D.V.; Tchelepi, H.A. Interactions between Gravity Currents and Convective Dissolution. Adv. Water Resour. 2015, 83, 77–88. [Google Scholar] [CrossRef]
  13. Bachu, S. CO2 Storage in Geological Media: Role, Means, Status and Barriers to Deployment. Prog. Energy Combust. Sci. 2008, 34, 254–273. [Google Scholar] [CrossRef]
  14. Xu, T.; Yue, G.; Wang, F.; Liu, N. Using Natural CO2 Reservoir to Constrain Geochemical Models for CO2 Geological Sequestration. Appl. Geochem. 2014, 43, 22–34. [Google Scholar] [CrossRef]
  15. Hovorka, S. Optimization of Geological Environments for Carbon Dioxide Disposal in Saline Aquifers in the United States (Part One); University of Texas: Austin, TX, USA, 2008; p. 990445. [Google Scholar]
  16. Bump, A.P.; Bakhshian, S.; Ni, H.; Hovorka, S.D.; Olariu, M.I.; Dunlap, D.; Hosseini, S.A.; Meckel, T.A. Composite Confining Systems: Rethinking Geologic Seals for Permanent CO2 Sequestration. Int. J. Greenh. Gas Control. 2023, 126, 103908. [Google Scholar] [CrossRef]
  17. Wasik, D.O.; Polat, H.M.; Ramdin, M.; Moultos, O.A.; Calero, S.; Vlugt, T.J.H. Solubility of CO2 in Aqueous Formic Acid Solutions and the Effect of NaCl Addition: A Molecular Simulation Study. J. Phys. Chem. C 2022, 126, 19424–19434. [Google Scholar] [CrossRef] [PubMed]
  18. Oyenowo, O.P.; Wang, H.; Okuno, R.; Mirzaei-Paiaman, A.; Sheng, K. Geochemical Impact on Rock Wettability in Injection of High-Concentration Formate Solution for Enhanced Geologic Carbon Storage and Oil Recovery. In Proceedings of the SPE International Conference on Oilfield Chemistry, The Woodlands, TX, USA, 28–29 June 2023; p. D021S010R005. [Google Scholar]
  19. Oyenowo, O.P.; Sheng, K.; Abeykoon, G.A.; Argüelles-Vivas, F.J.; Okuno, R. A Case Study of Using Aqueous Formate Solution for Carbon Sequestration and Geological Storage. GeoGulf Trans. 2021, 71, 203–215. [Google Scholar]
  20. Baghishov, I.; Abeykoon, G.A.; Wang, M.; Oyenowo, O.P.; Argüelles-Vivas, F.J.; Okuno, R. A Mechanistic Comparison of Formate, Acetate, and Glycine as Wettability Modifiers for Carbonate and Shale Formations. Colloids Surf. A Physicochem. Eng. Asp. 2022, 652, 129849. [Google Scholar] [CrossRef]
  21. Wang, H.; Precious Oyenowo, O.; Okuno, R. Aqueous Formate Solution for Enhanced Water Imbibition in Oil Recovery and Carbon Storage in Carbonate Reservoirs. Fuel 2023, 345, 128198. [Google Scholar] [CrossRef]
  22. Oyenowo, O.P.; Wang, H.; Mirzaei-Paiaman, A.; Carrasco-Jaim, O.A.; Sheng, K.; Okuno, R. Geochemical Impact of High-Concentration Formate Solution Injection on Rock Wettability for Enhanced Oil Recovery and Geologic Carbon Storage. Energy Fuels 2024, 38, 6138–6155. [Google Scholar] [CrossRef]
  23. ChemAnalyst. Formic Acid Market Analysis; ChemAnalyst: Noida, India, 2023. [Google Scholar]
  24. Xu, D.; Li, K.; Jia, B.; Sun, W.; Zhang, W.; Liu, X.; Ma, T. Electrocatalytic CO2 Reduction towards Industrial Applications. Carbon Energy 2023, 5, e230. [Google Scholar] [CrossRef]
  25. Fernández-Caso, K.; Díaz-Sainz, G.; Alvarez-Guerra, M.; Irabien, A. Electroreduction of CO2: Advances in the Continuous Production of Formic Acid and Formate. ACS Energy Lett. 2023, 8, 1992–2024. [Google Scholar] [CrossRef]
  26. Gao, T.; Xia, B.; Yang, K.; Li, D.; Shao, T.; Chen, S.; Li, Q.; Duan, J. Techno-Economic Analysis and Carbon Footprint Accounting for Industrial CO2 Electrolysis Systems. Energy Fuels 2023, 37, 17997–18008. [Google Scholar] [CrossRef]
  27. Ramdin, M.; Morrison, A.R.T.; De Groen, M.; Van Haperen, R.; De Kler, R.; Irtem, E.; Laitinen, A.T.; Van Den Broeke, L.J.P.; Breugelmans, T.; Trusler, J.P.M.; et al. High-Pressure Electrochemical Reduction of CO2 to Formic Acid/Formate: Effect of pH on the Downstream Separation Process and Economics. Ind. Eng. Chem. Res. 2019, 58, 22718–22740. [Google Scholar] [CrossRef]
  28. Yang, H.; Kaczur, J.J.; Sajjad, S.D.; Masel, R.I. Performance and Long-Term Stability of CO2 Conversion to Formic Acid Using a Three-Compartment Electrolyzer Design. J. CO2 Util. 2020, 42, 101349. [Google Scholar] [CrossRef]
  29. Oyenowo, O.P.; Sheng, K.; Okuno, R. Simulation Case Studies of Aqueous Formate Solution for Geological Carbon Storage. Fuel 2023, 334, 126643. [Google Scholar] [CrossRef]
  30. Dermanaki Farahani, Z.; Khorsand Movaghar, M.R. Improving Oil Recovery Using Miscible Selective Simultaneous Water Alternating Gas (MSSWAG) Injection in One of the Iranian Reservoirs. Arab. J. Sci. Eng. 2018, 43, 2521–2535. [Google Scholar] [CrossRef]
  31. CMG. GEM Compositional & Unconventional Simulator, version 2022.10; Windows, CMG: Calgary, AB, Canada, 2022. [Google Scholar]
  32. Ahmadi, H.; Erfani, H.; Jamialahmadi, M.; Soulgani, B.S.; Dinarvand, N.; Sharafi, M.S. Corrigendum to “Experimental Study and Modelling on Diffusion Coefficient of CO2 in Water” Fluid Phase Equilibria 523 (2020) 112,584. Fluid Phase Equilibria 2021, 529, 112869. [Google Scholar] [CrossRef]
  33. Li, Y.-K.; Nghiem, L.X. Phase Equilibria of Oil, Gas and Water/Brine Mixtures from a Cubic Equation of State and Henry’s Law. Can. J. Chem. Eng. 1986, 64, 486–496. [Google Scholar] [CrossRef]
  34. Bakker, R.J. Package FLUIDS 1. Computer Programs for Analysis of Fluid Inclusion Data and for Modelling Bulk Fluid Properties. Chem. Geol. 2003, 194, 3–23. [Google Scholar] [CrossRef]
  35. Parkhurst, D.L.; Thorstenson, D.C.; Plummer, L.N. PHREEQE: A Computer Program for Geochemical Calculations; U.S. Geological Survey: Denver, CO, USA, 1980.
  36. Parkhurst, D.L.; Appelo, C.A.J. Description of Input and Examples for PHREEQC Version 3: A Computer Program for Speciation, Batch-Reaction, One-Dimensional Transport, and Inverse Geochemical Calculations; U.S. Geological Survey Techniques and Methods, Book 6; U.S. Geological Survey: Denver, CO, USA, 2013; p. 497.
  37. Allison, J.D.; Brown, D.S.; Novo-Gradac, K.J. MINTEQA2/PRODEFA2: A Geochemical Assessment Model for Environmental Systems: Version 3.0 User’s Manual; Environmental Research Laboratory, Office of Research and Development, US Environmental Protection Agency: Washington, DC, USA, 1991. [Google Scholar]
  38. Zeidouni, M.; Pooladi-Darvish, M.; Keith, D. Analytical Solution to Evaluate Salt Precipitation during CO2 Injection in Saline Aquifers. Int. J. Greenh. Gas Control. 2009, 3, 600–611. [Google Scholar] [CrossRef]
  39. Machado, M.V.B.; Delshad, M.; Sepehrnoori, K. A Practical and Innovative Workflow to Support the Numerical Simulation of CO2 Storage in Large Field-Scale Models. SPE Reserv. Eval. Eng. 2023, 26, 1541–1552. [Google Scholar] [CrossRef]
  40. Machado, M.V.B.; Delshad, M.; Sepehrnoori, K. Modeling Self-Sealing Mechanisms in Fractured Carbonates Induced by CO2 Injection in Saline Aquifers. ACS Omega 2023, 8, 48925–48937. [Google Scholar] [CrossRef] [PubMed]
  41. Machado, M.V.B.; Khanal, A.; Delshad, M. Unveiling the Essential Parameters Driving Mineral Reactions during CO2 Storage in Carbonate Aquifers through Proxy Models. Appl. Sci. 2024, 14, 1465. [Google Scholar] [CrossRef]
  42. Carlson, F.M. Simulation of Relative Permeability Hysteresis to the Nonwetting Phase; SPE: San Antonio, TX, USA, 1981. [Google Scholar]
  43. Land, C.S. Calculation of Imbibition Relative Permeability for Two- and Three-Phase Flow from Rock Properties. Soc. Pet. Eng. J. 1968, 8, 149–156. [Google Scholar] [CrossRef]
  44. Xiao, Y.; Xu, T.; Pruess, K. The Effects of Gas-Fluid-Rock Interactions on CO2 Injection and Storage: Insights from Reactive Transport Modeling. Energy Procedia 2009, 1, 1783–1790. [Google Scholar] [CrossRef]
  45. Brêda, T.C.; Mello, C.L.; Silva Junior, G.C.d.; Alves, M.d.G.; Neiva, E.B. Caracterização Petrográfica Da Formação Emborê Com Base Em Dados Dos Poços 2-CST-1-RJ e 9-BRF-1D-RJ (Região Emersa Da Bacia de Campos). Geol. USP. Sér. Cient. 2018, 18, 45–58. [Google Scholar] [CrossRef]
  46. PETROBRAS (PETROBRAS, Rio de Janeiro, Brazil). Personal Communication. 2023.
  47. Agarwal, A.S.; Zhai, Y.; Hill, D.; Sridhar, N. The Electrochemical Reduction of Carbon Dioxide to Formate/Formic Acid: Engineering and Economic Feasibility. ChemSusChem 2011, 4, 1301–1310. [Google Scholar] [CrossRef]
  48. Hosa, A.; Esentia, M.; Stewart, J.; Haszeldine, S. Injection of CO2 into Saline Formations: Benchmarking Worldwide Projects. Chem. Eng. Res. Des. 2011, 89, 1855–1864. [Google Scholar] [CrossRef]
  49. Metz, B.; Davidson, O.; de Coninck, H.; Loos, M.; Meyer, L. (Eds.) IPCC Special Report on Carbon Dioxide Capture and Storage; Cambridge University Press: Cambridge, UK, 2005; ISBN 978-0-521-86643-9.
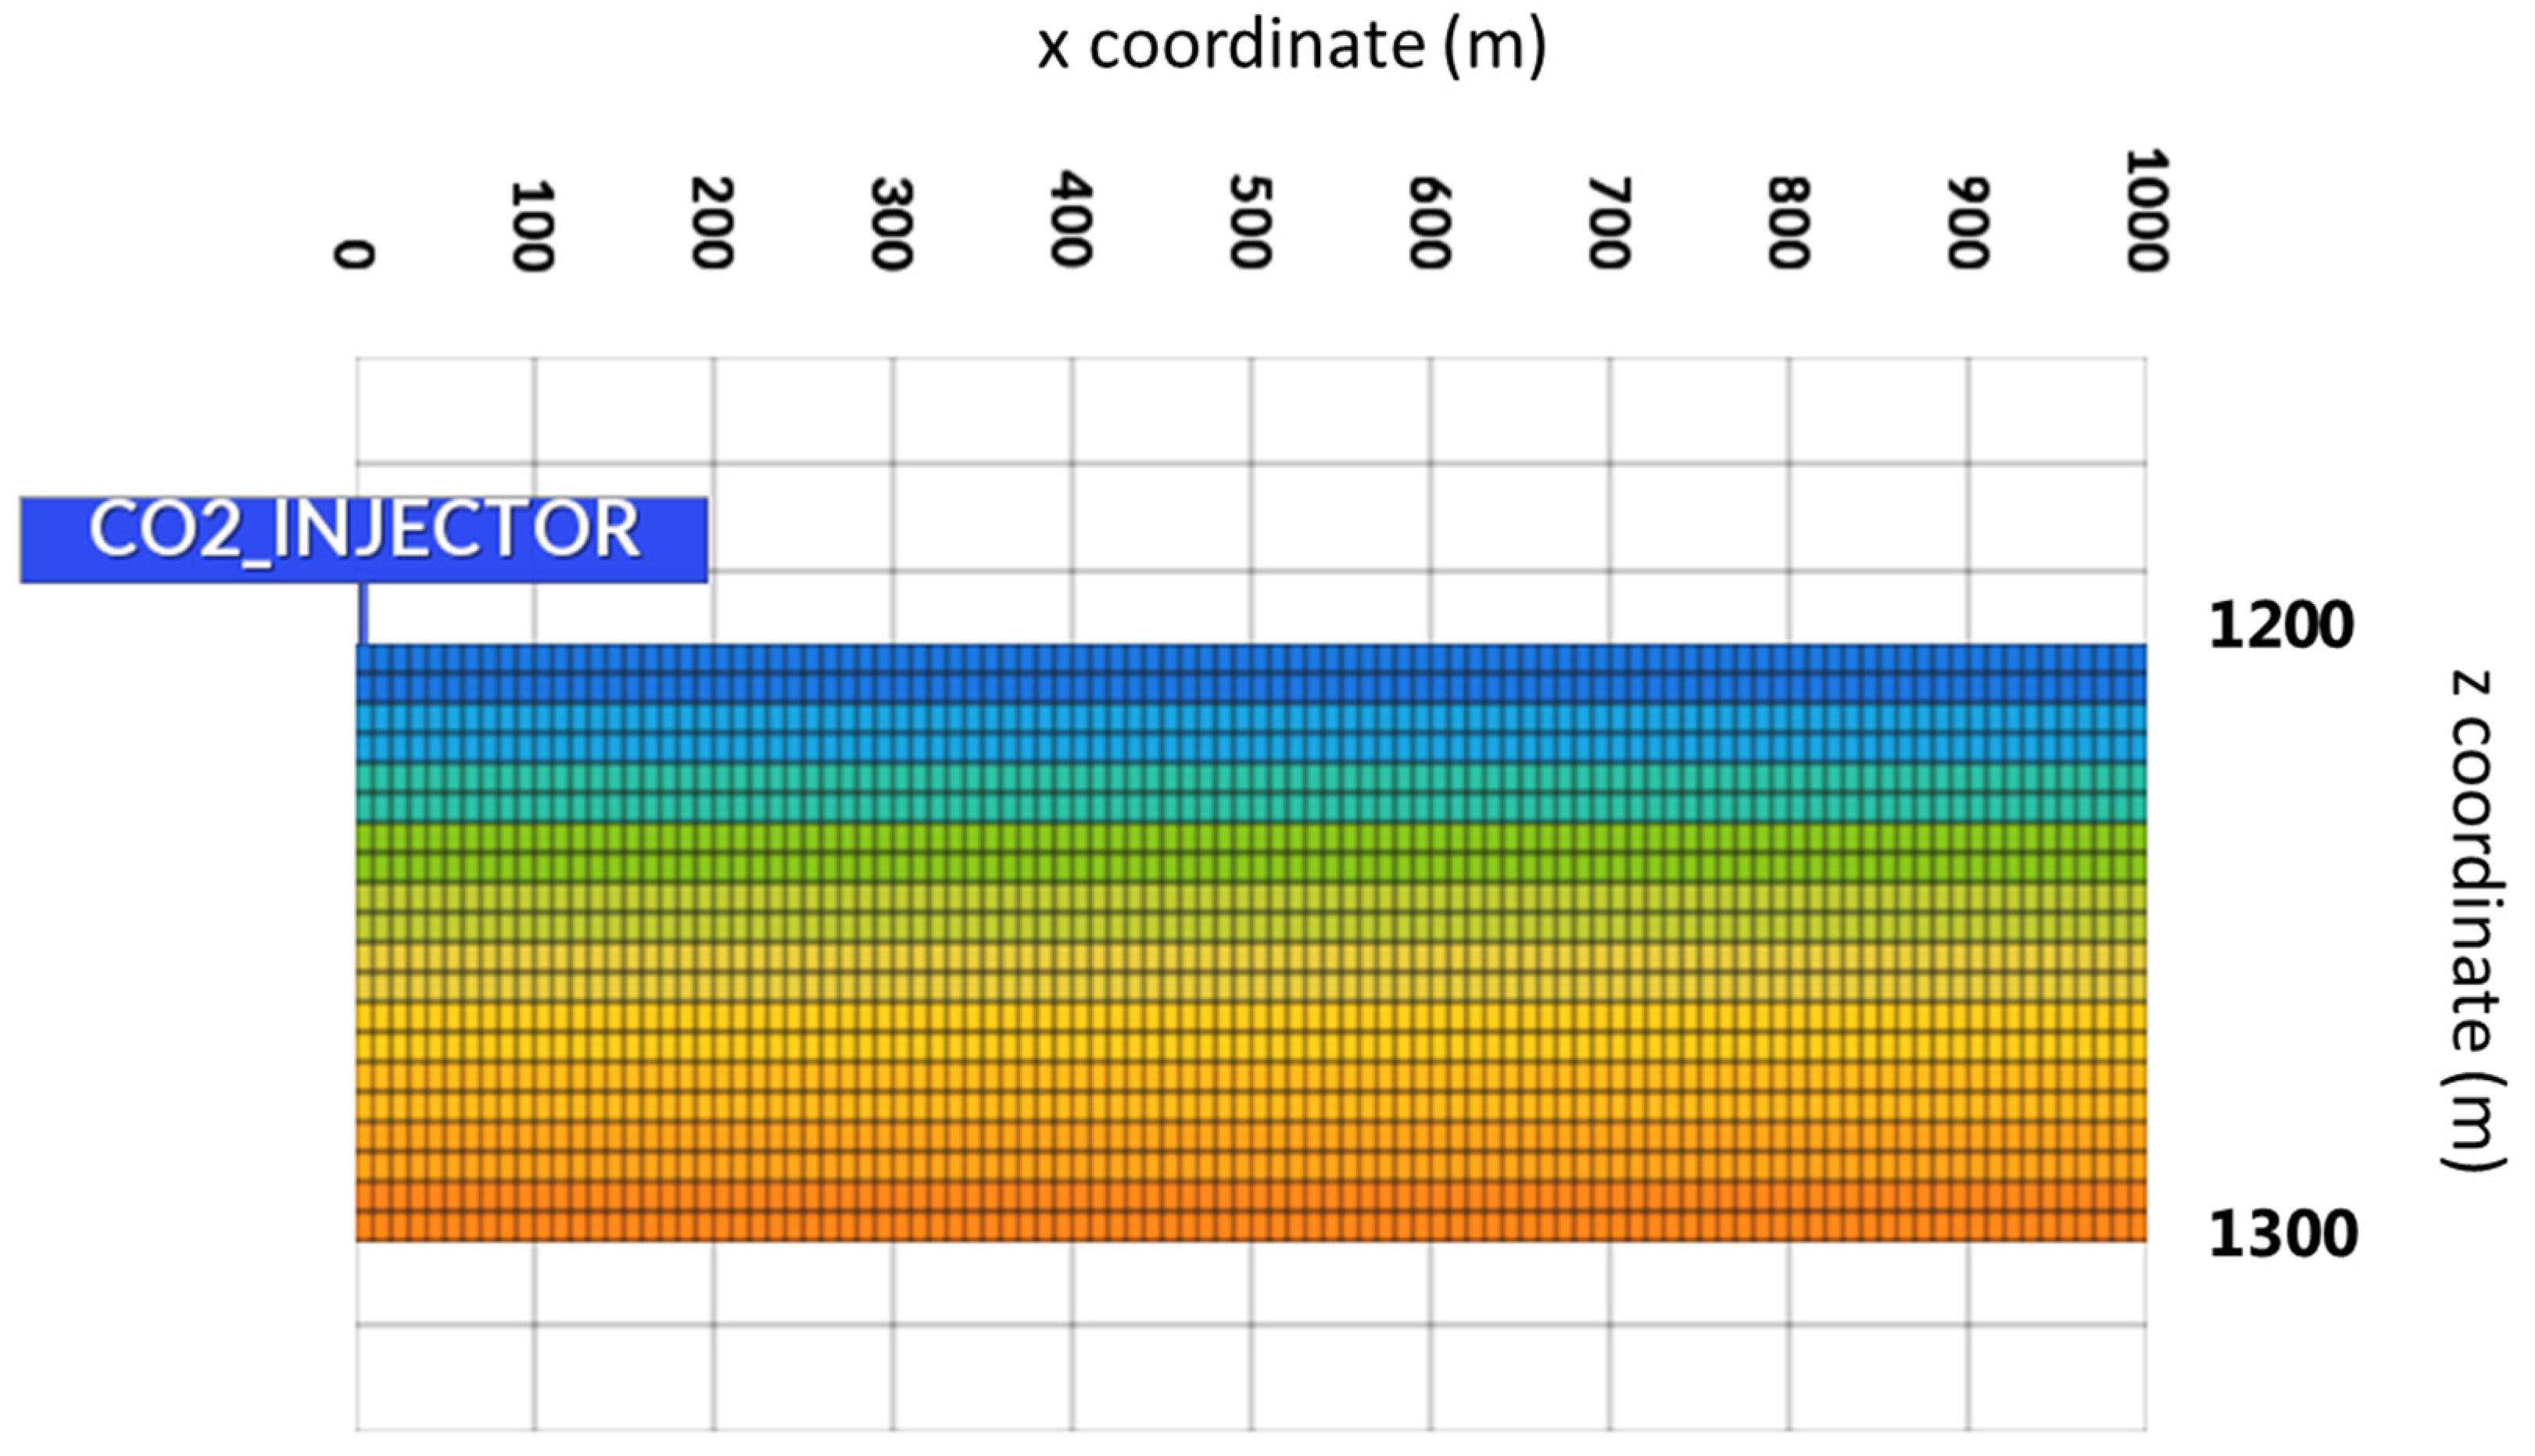
Figure 1. Synthetic 2D homogeneous model of a saline aquifer.
Energies 17 02680 g001
Figure 2. On the left: drainage water–CO2 relative permeability curves (the Carlson hysteresis model generates the imbibition curves). On the right: water–CO2 capillary pressure curves (in blue: drainage curve; in red: imbibition curve)—synthetic model.
Energies 17 02680 g002
Figure 3. (a) CO2 saturation plume after 20 years of injection considering only structural trapping, (b) including all CO2 trapping mechanisms, and (c) co-injection with aqueous formate solution through a dual completion well.
Energies 17 02680 g003
Figure 4. pH distribution (on the left) and induced calcite changes (on the right) around the well after 20 years of (A) aqueous formate solution injection and (B) formate solution and CO2 co-injection.
Energies 17 02680 g004
Figure 5. pH evolution (average over the entire reservoir pore volume) when CO2 (in red), formate solution (in orange), or CO2 + formate solution (in blue) are injected into carbonate rock. The green curve corresponds to when a nonreactive matrix is considered for the formate solution case.
Energies 17 02680 g005
Figure 6. Top: average pH considering CO2 injection (red curve) and formate solution injection (orange). Bottom: calcite concentration changes in moles due to calcite dissolution by the CO2 injection (negative values in the red curve) and calcite precipitation (orange curve) induced by pH changes with the formate injection.
Energies 17 02680 g006
Figure 7. Saline aquifer location in the Campos basin (red square), southeast of Brazil.
Energies 17 02680 g007
Figure 8. Cross-sectional view (coordinates in meters) of the horizontal permeability distribution (PERMI, mD) in the well plane of the actual saline aquifer model.
Energies 17 02680 g008
Figure 9. Hybrid CO2 and formate injection strategies.
Energies 17 02680 g009
Figure 10. Bottomhole pressure of the injector well over 5 years for R = 0.5 considering the alternated injection strategy.
Energies 17 02680 g010
Figure 11. Profiles of CO2 saturation along the well for different CO2/formate ratios, R values at 2045 considering the alternated injection strategy.
Energies 17 02680 g011
Figure 12. Cross-sectional view of the CO2 saturation (SG) for different injection strategies in 2045. (a) Only CO2 is injected; (b) only formate solution is injected. Hybrid strategies: (c) alternated, (d) pre-flush, and (e) co-injection.
Energies 17 02680 g012
Figure 13. Bottomhole pressure for each strategy over the injection period of the first 20 years.
Energies 17 02680 g013
Figure 14. Cross-sectional view of the CO2 saturation along the well trajectory 100 years after the injection shutoff (coordinates in meters). (A) Simultaneous and continuous injection of CO2 and format solutions. (B) Continuous CO2 injections and alternating formate injections.
Energies 17 02680 g014
Figure 15. Aquifer average pressure for the best strategies over 50 years.
Energies 17 02680 g015
Table 1. Summary of the main petrophysical and fluid properties—synthetic model.
Total model pore volume180,000 m3
Average horizontal permeability100 mD
Ratio of vertical/horizontal permeabilities0.10
Average porosity0.18
Initial pressure @ datum8.963 MPa
Temperature
Initial pH
41 °C
7.3
CO2 injection rate
Aqueous formate solution injection rate
1.0 metric tons/d
0.65 m3/d
Relative permeability curves
Capillary pressure curves
Figure 2
Figure 2
Table 2. Ionic composition of formation water.
IonsConcentration (ppm)
H+1.4872 × 10⁻⁵
Ca2+11,307
Na+17,763
Cl
HCO3
39,604
425
Table 3. Ionic composition of formation water [46].
IonsConcentration (ppm)
H+1.4767 × 10⁻⁴
Ca2+998
Mg2+627
Na+27,094
Cl
HCO3
42,685
1337
Table 4. CO2 injected over 20 years, considering a reduction of 10 times in the horizontal permeability of the model.
CaseCumulative CO2 Injected
Original Permeability
(Mean: 1500 mD)
Reduced Permeability
(Mean: 150 mD)
Alternated30 million metric tons3.10 million metric tons
Co-injection30 million metric tons1.85 million metric tons
Disclaimer/Publisher’s Note: The statements, opinions and data contained in all publications are solely those of the individual author(s) and contributor(s) and not of MDPI and/or the editor(s). MDPI and/or the editor(s) disclaim responsibility for any injury to people or property resulting from any ideas, methods, instructions or products referred to in the content.