

Impact of Geometrical Misplacement of Heat Exchanger Pipe Parallel Configuration in Energy Piles


Abstract
1. Introduction
2. Numerical Model
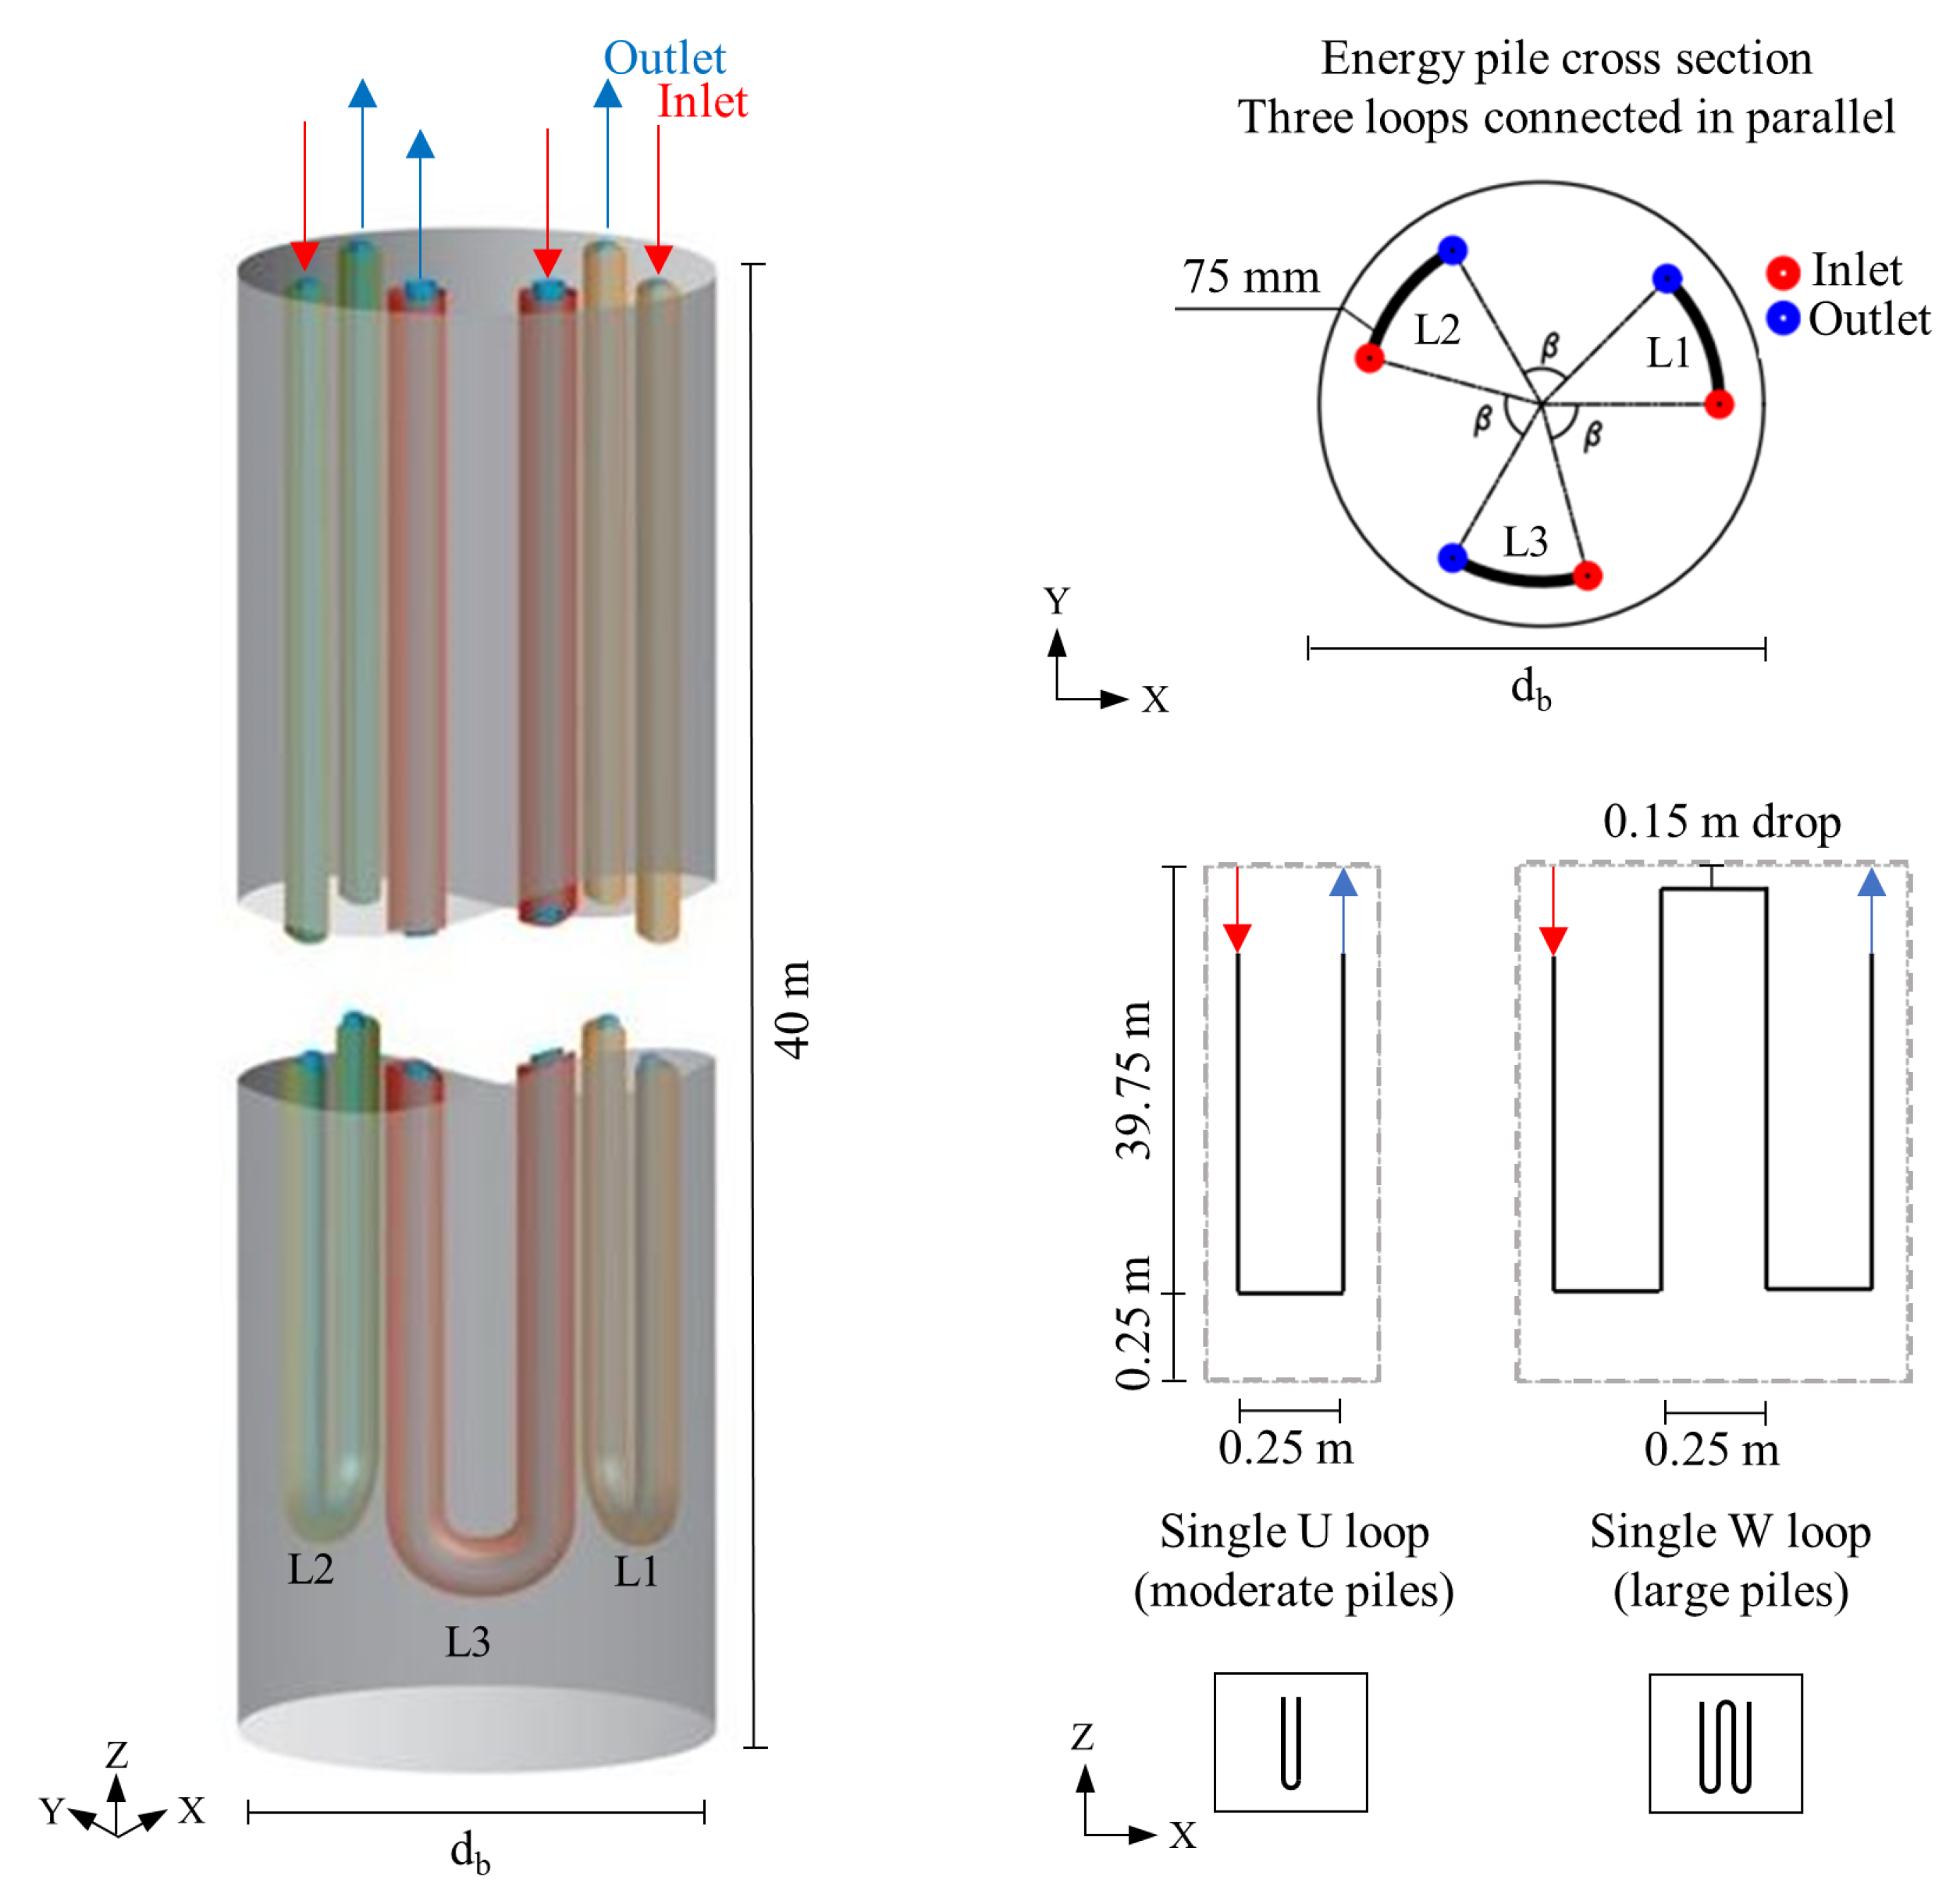
2.1. Overview
2.2. Governing Equations
2.3. Geological, Thermal, and Operation Parameters
2.4. Modelling Specifications and Boundary Conditions
2.5. Mesh Sensitivity Study
2.6. Numerical Simulations
3. Results and Discussion
3.1. The Arden Site-Specific Case
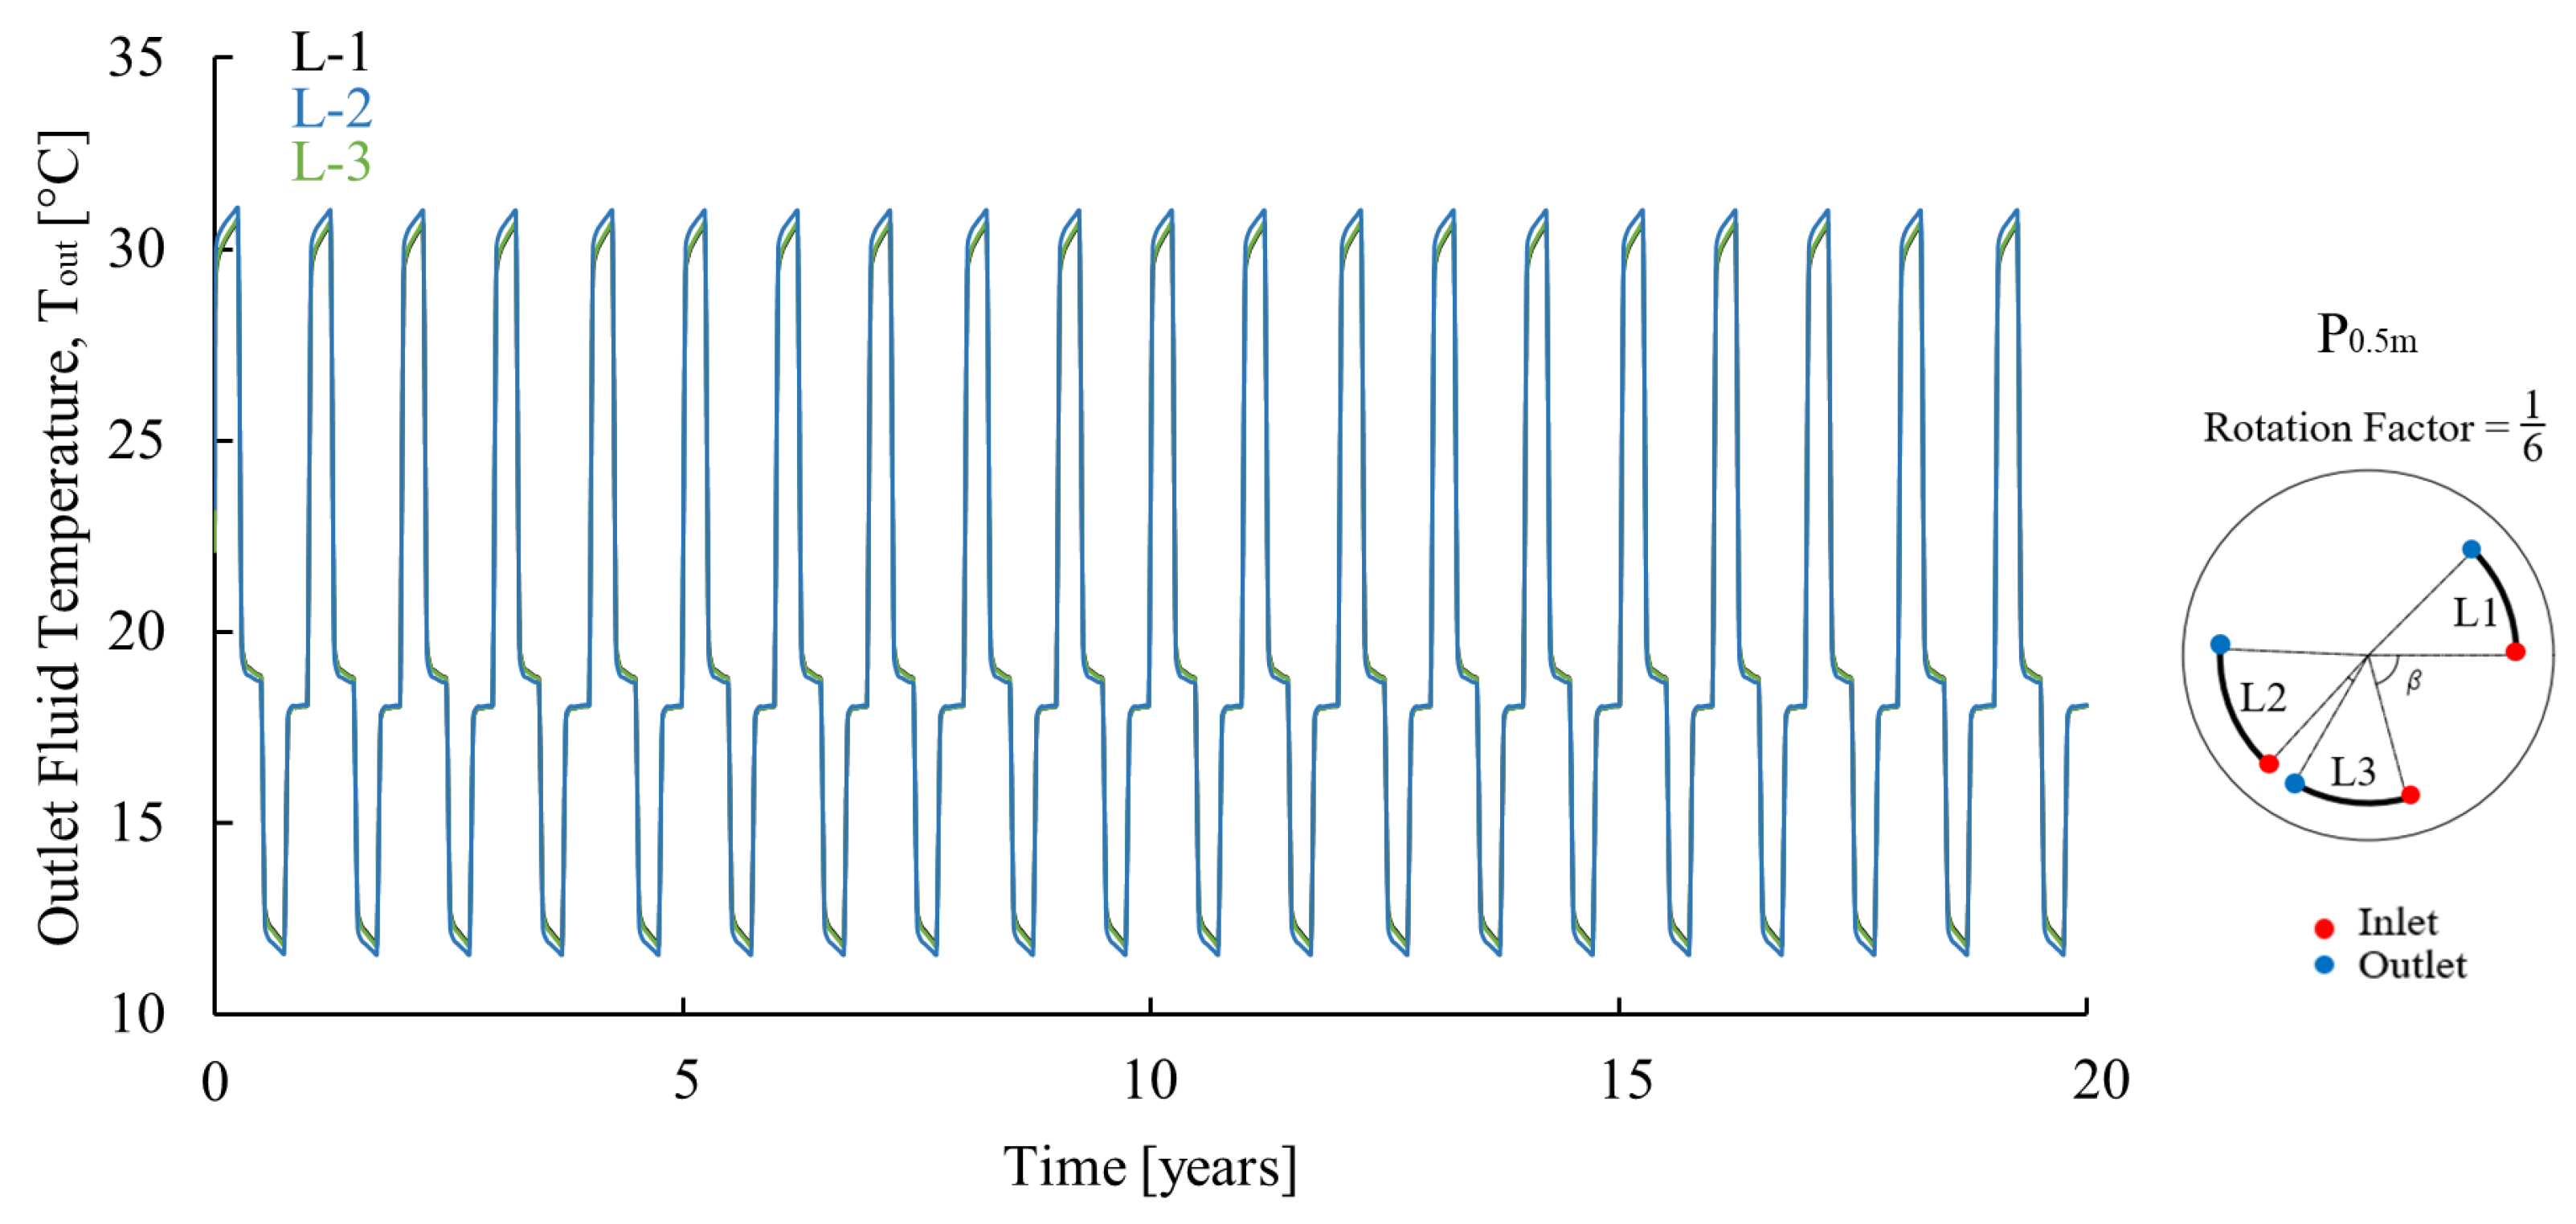
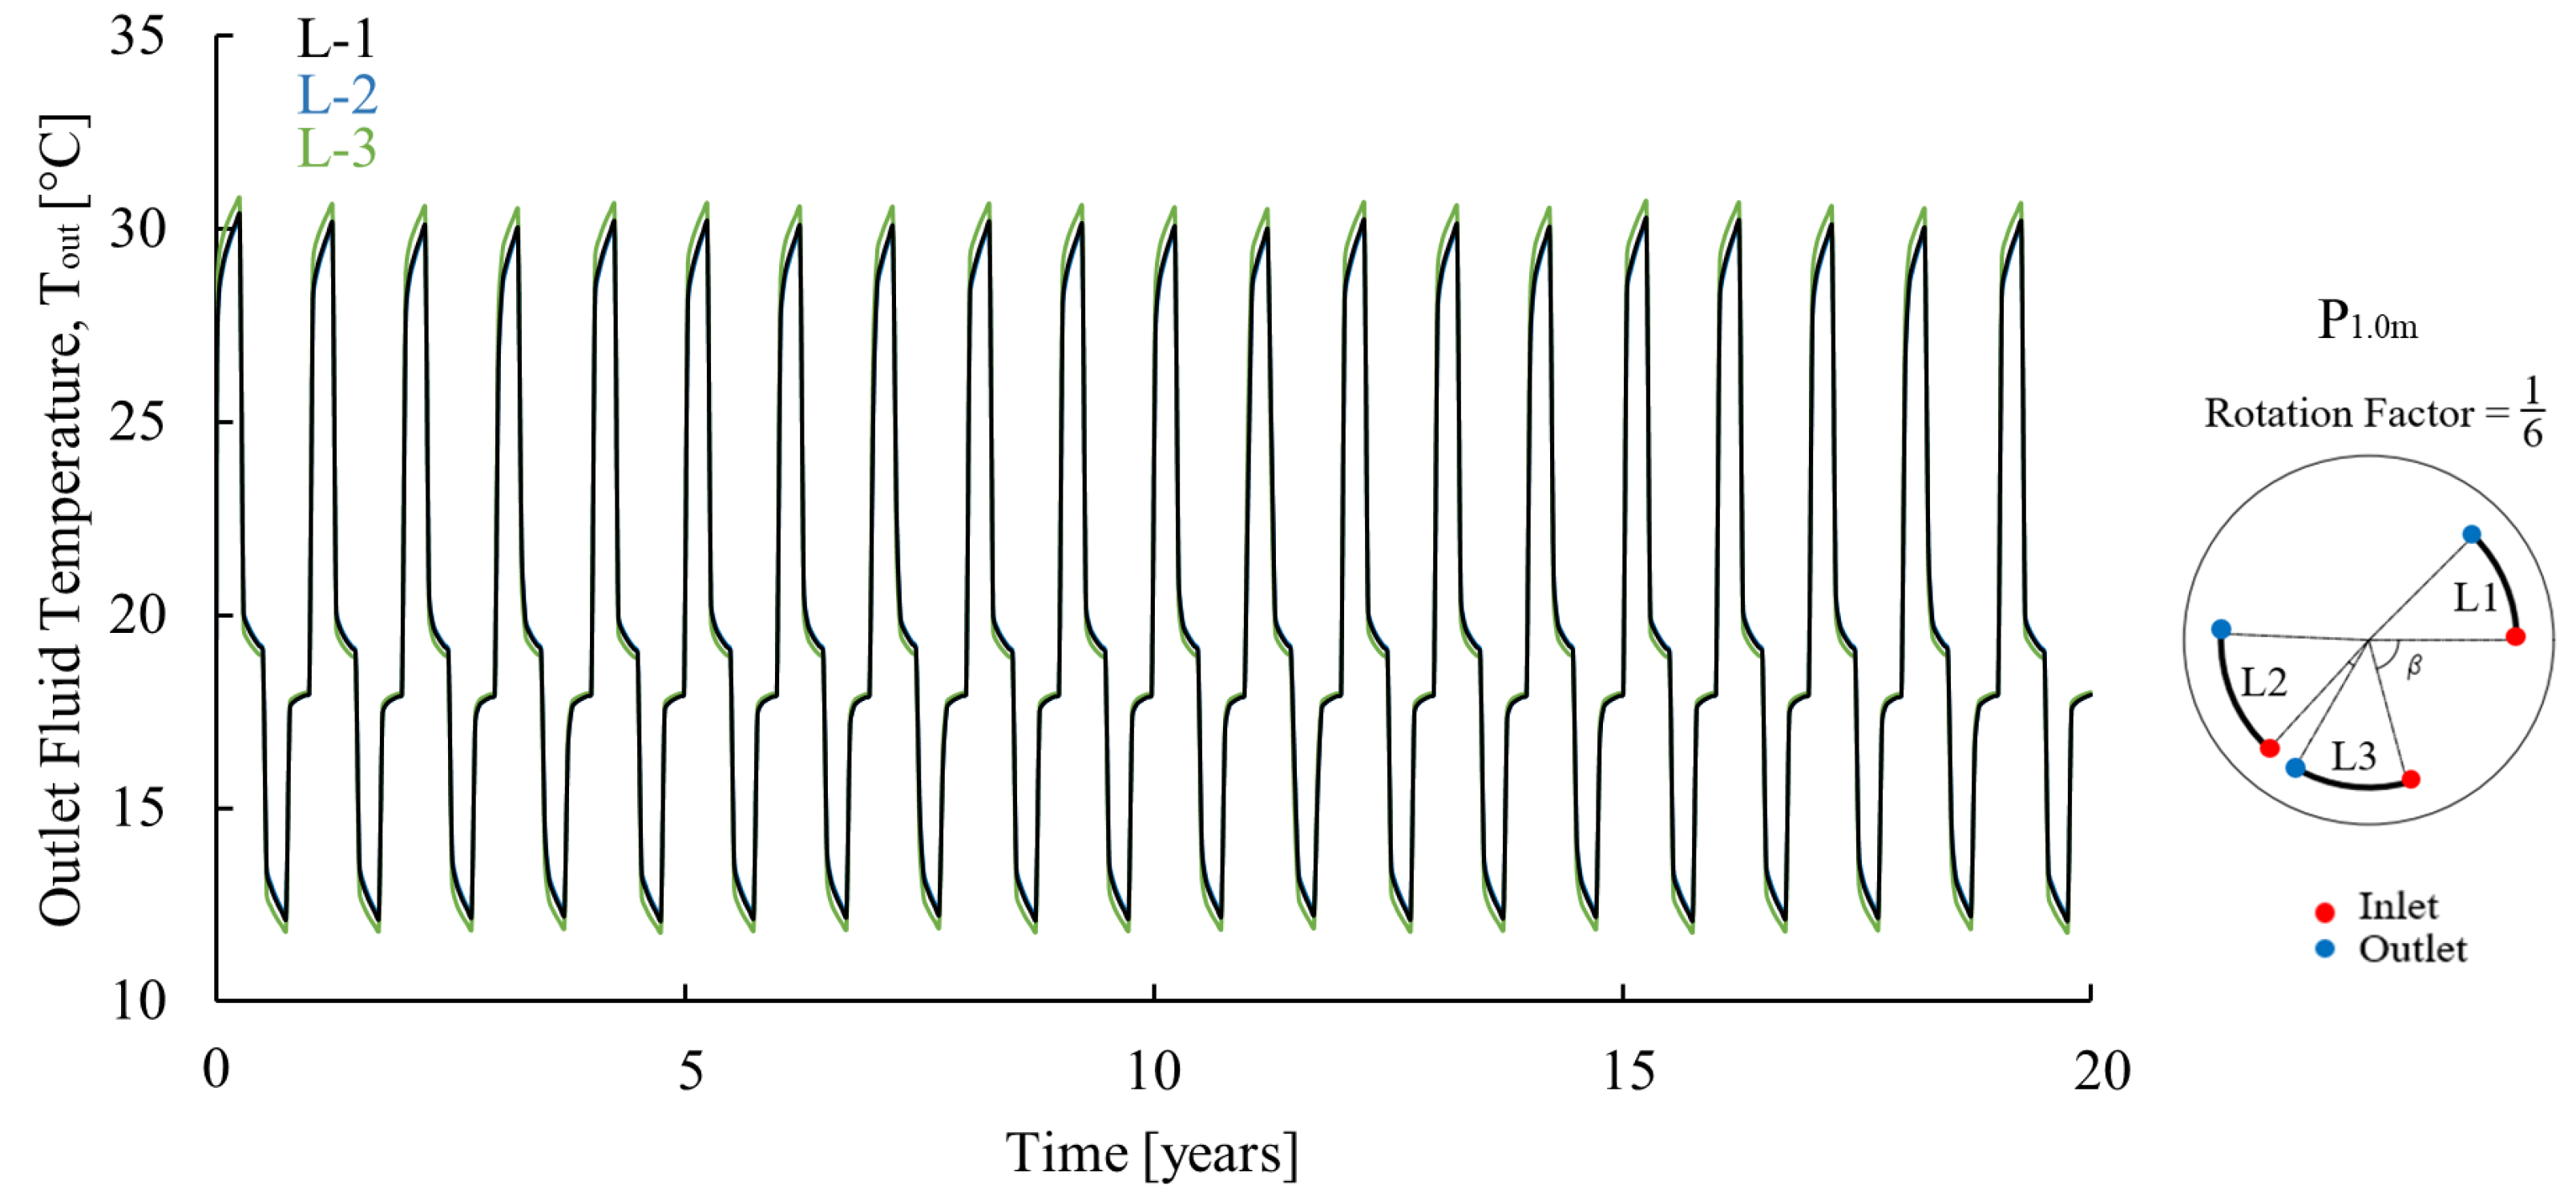
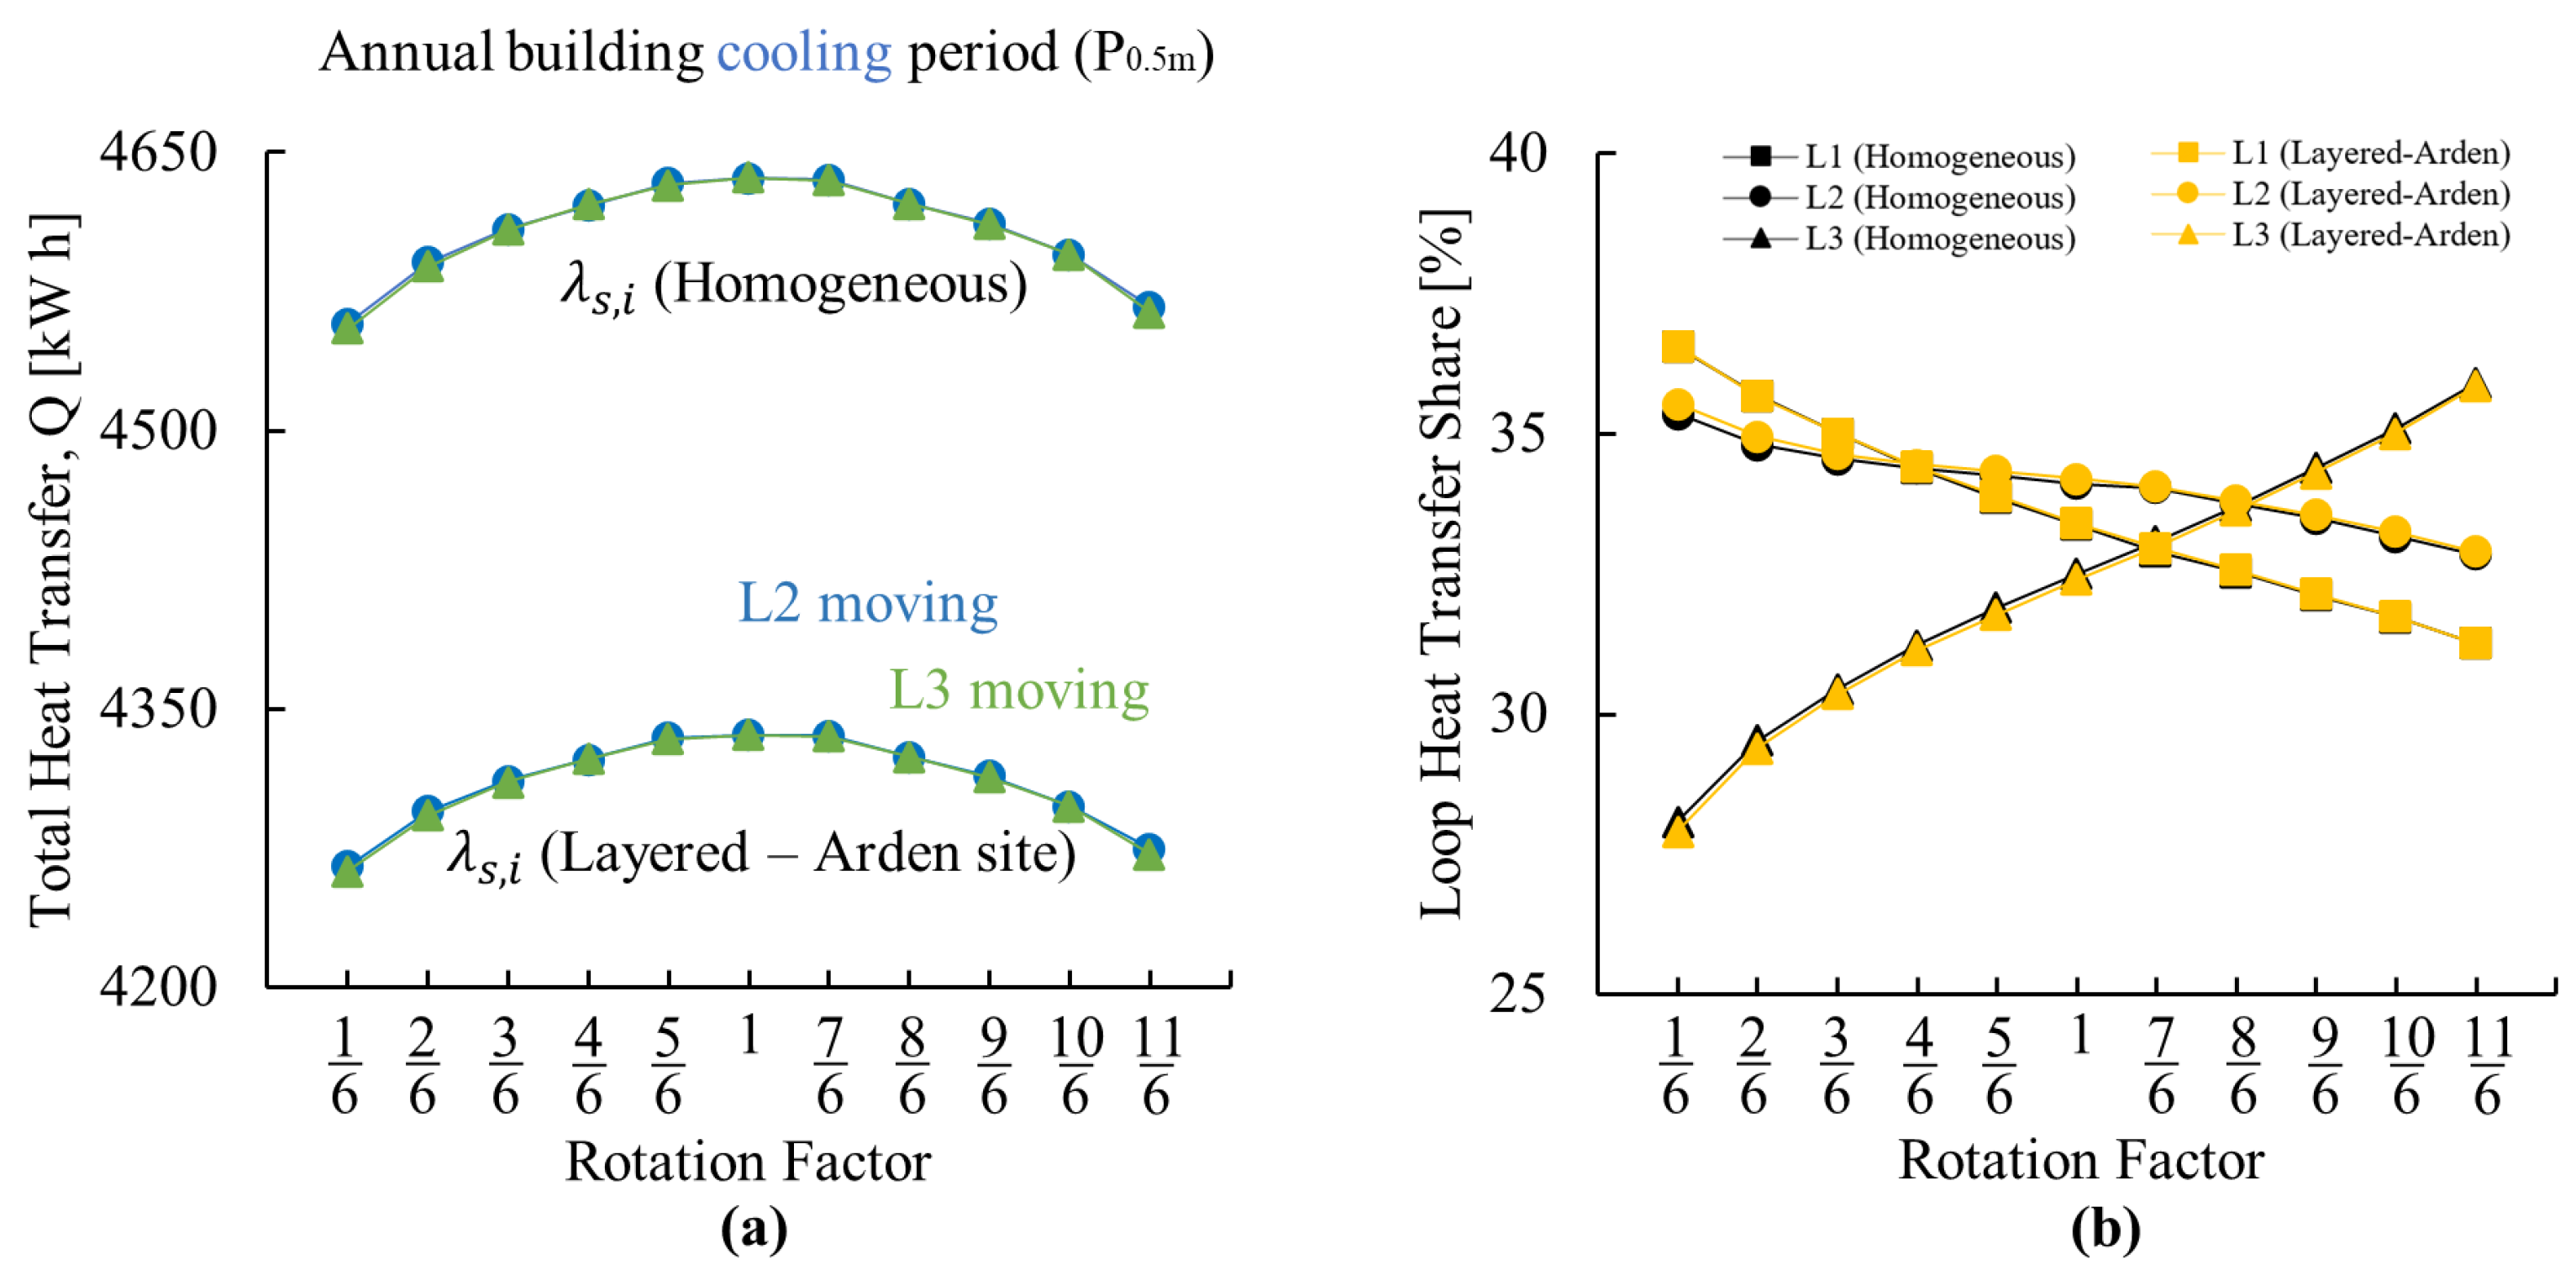
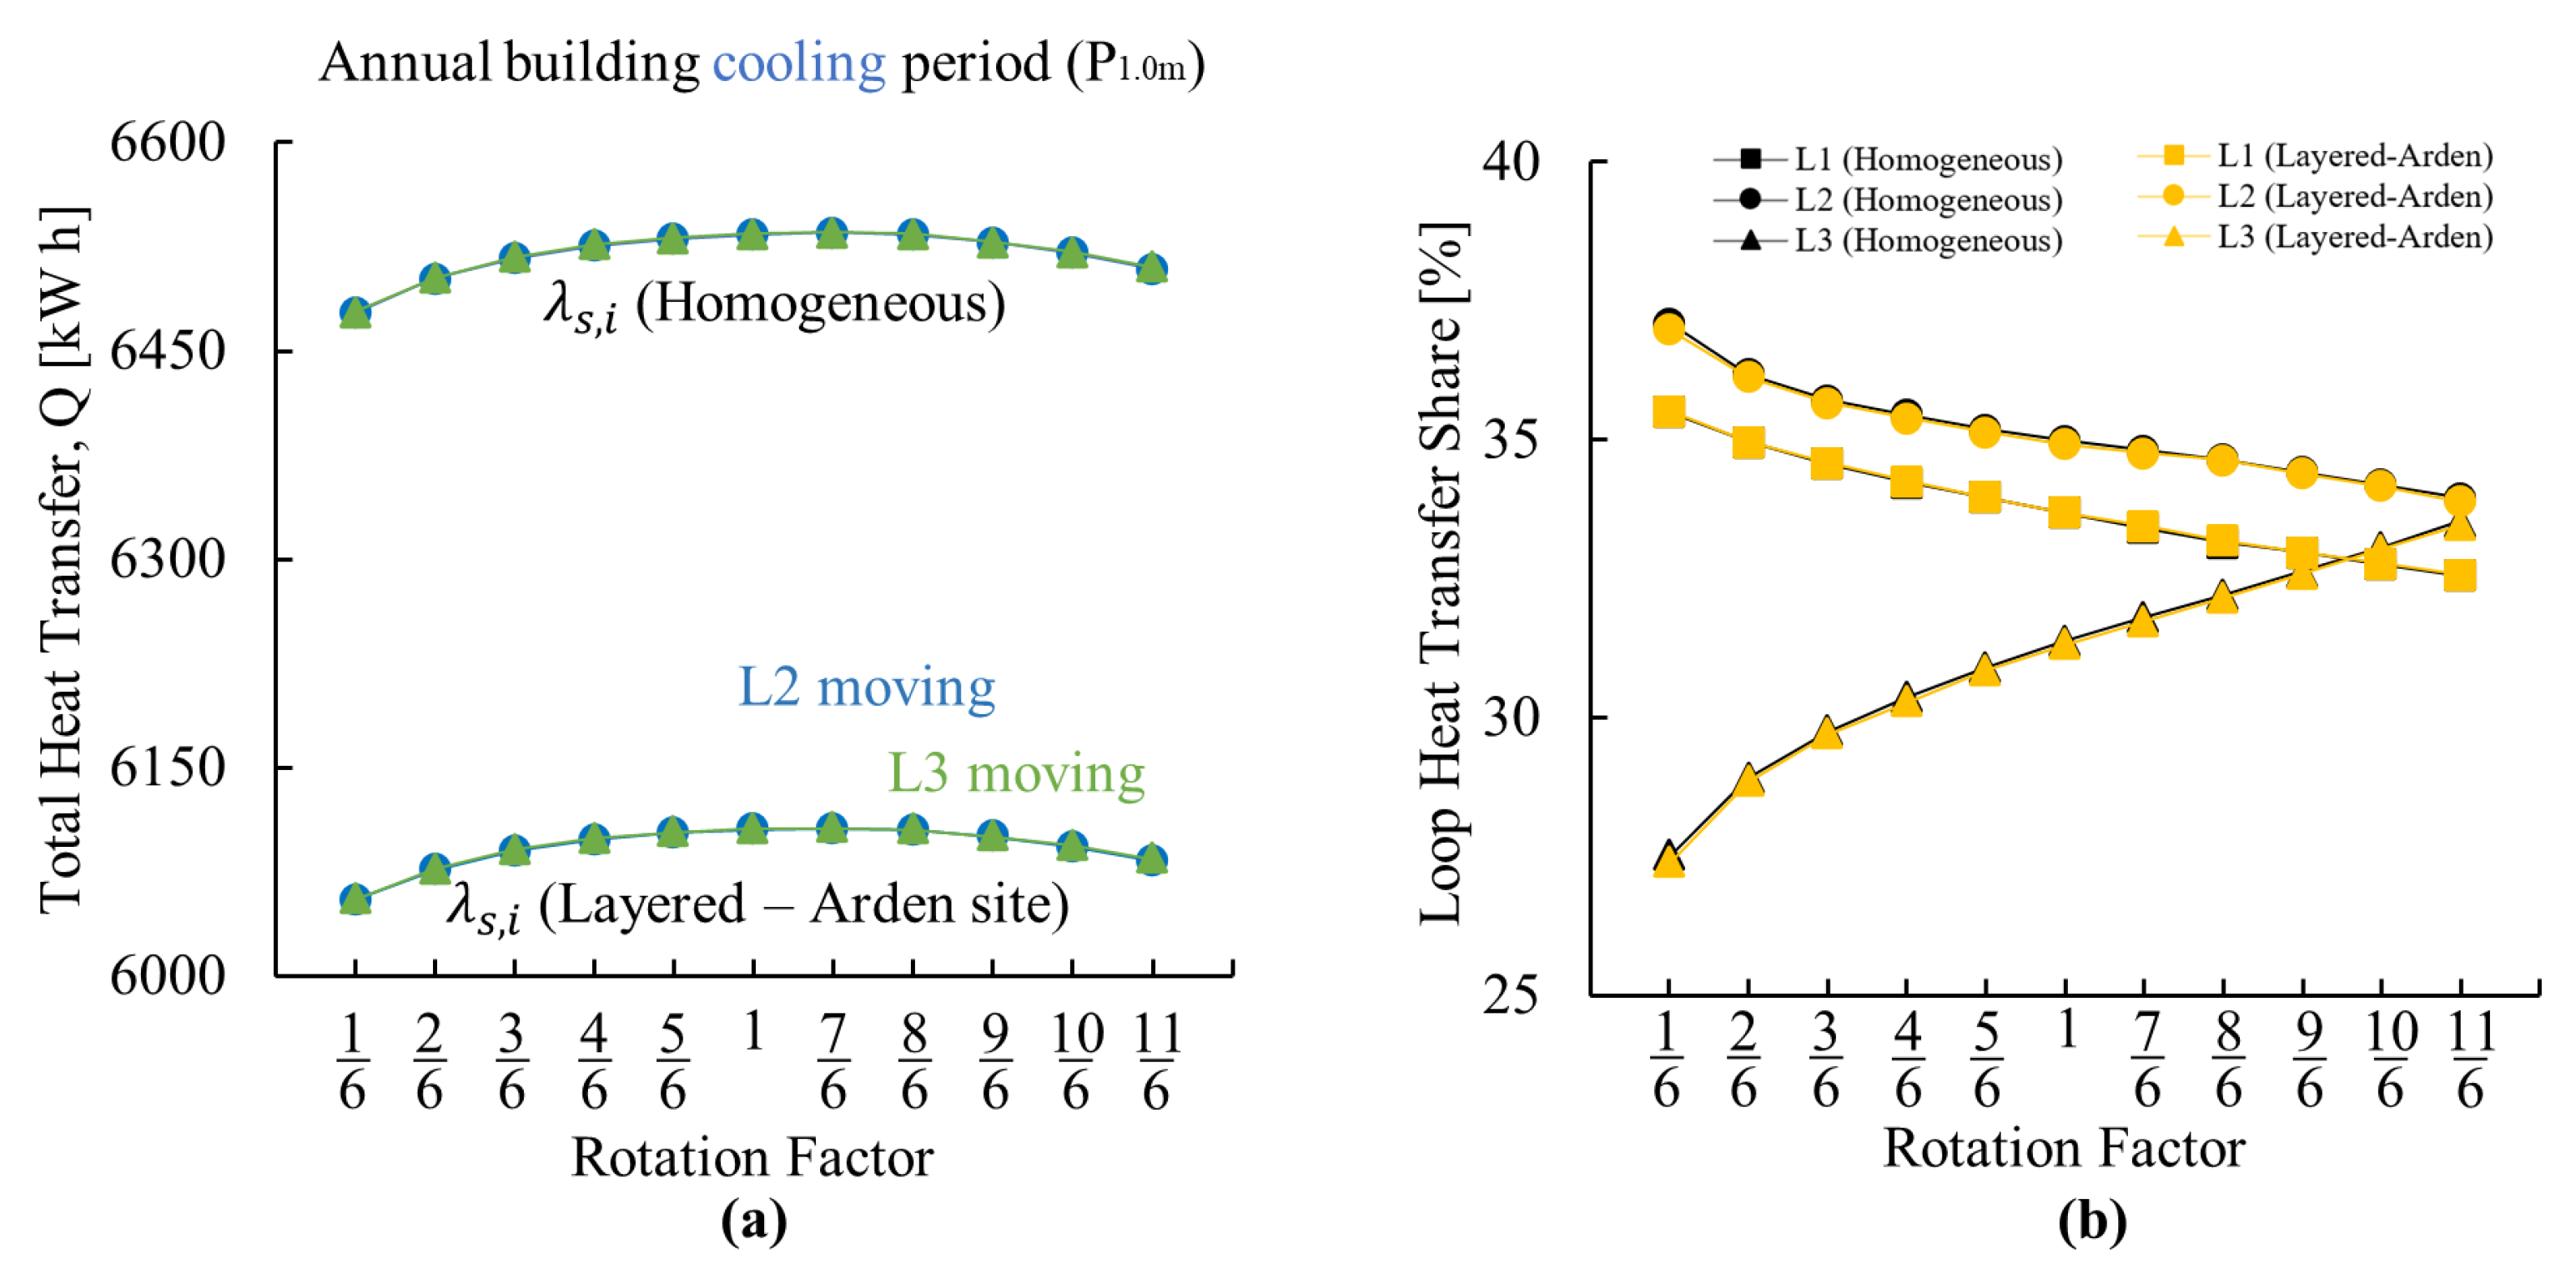
3.1.1. Effect of GHE Distribution
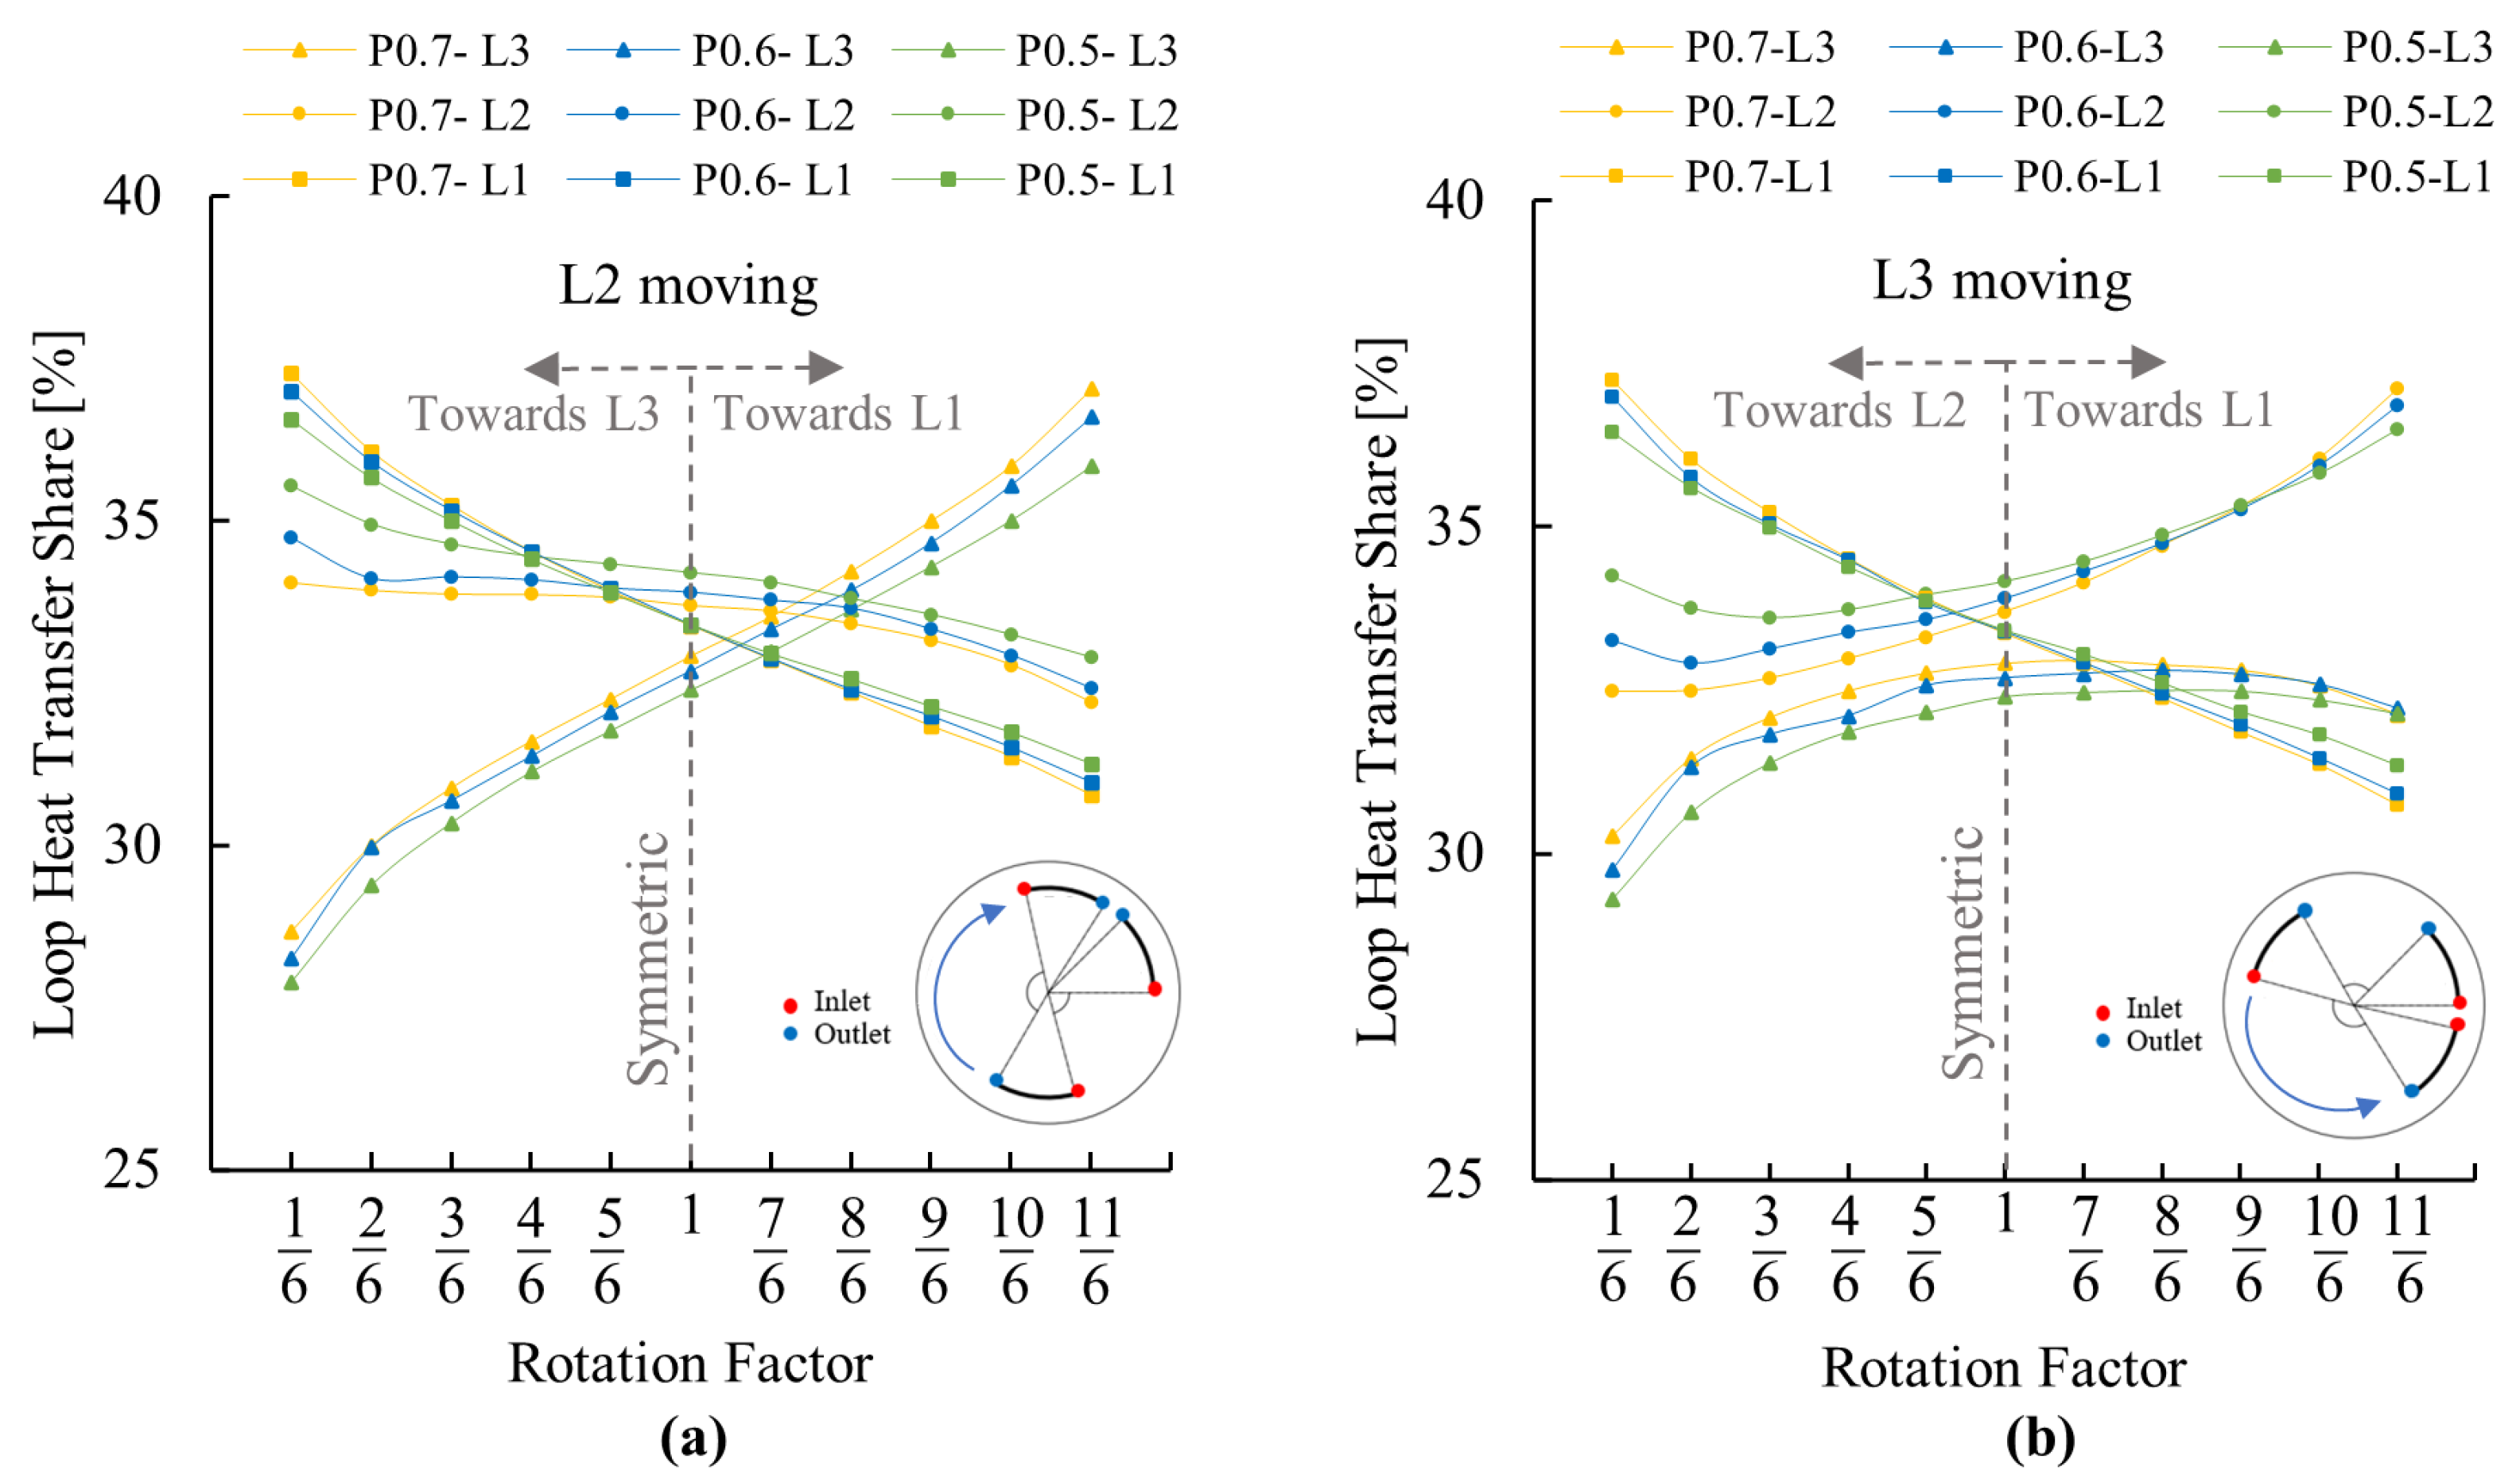
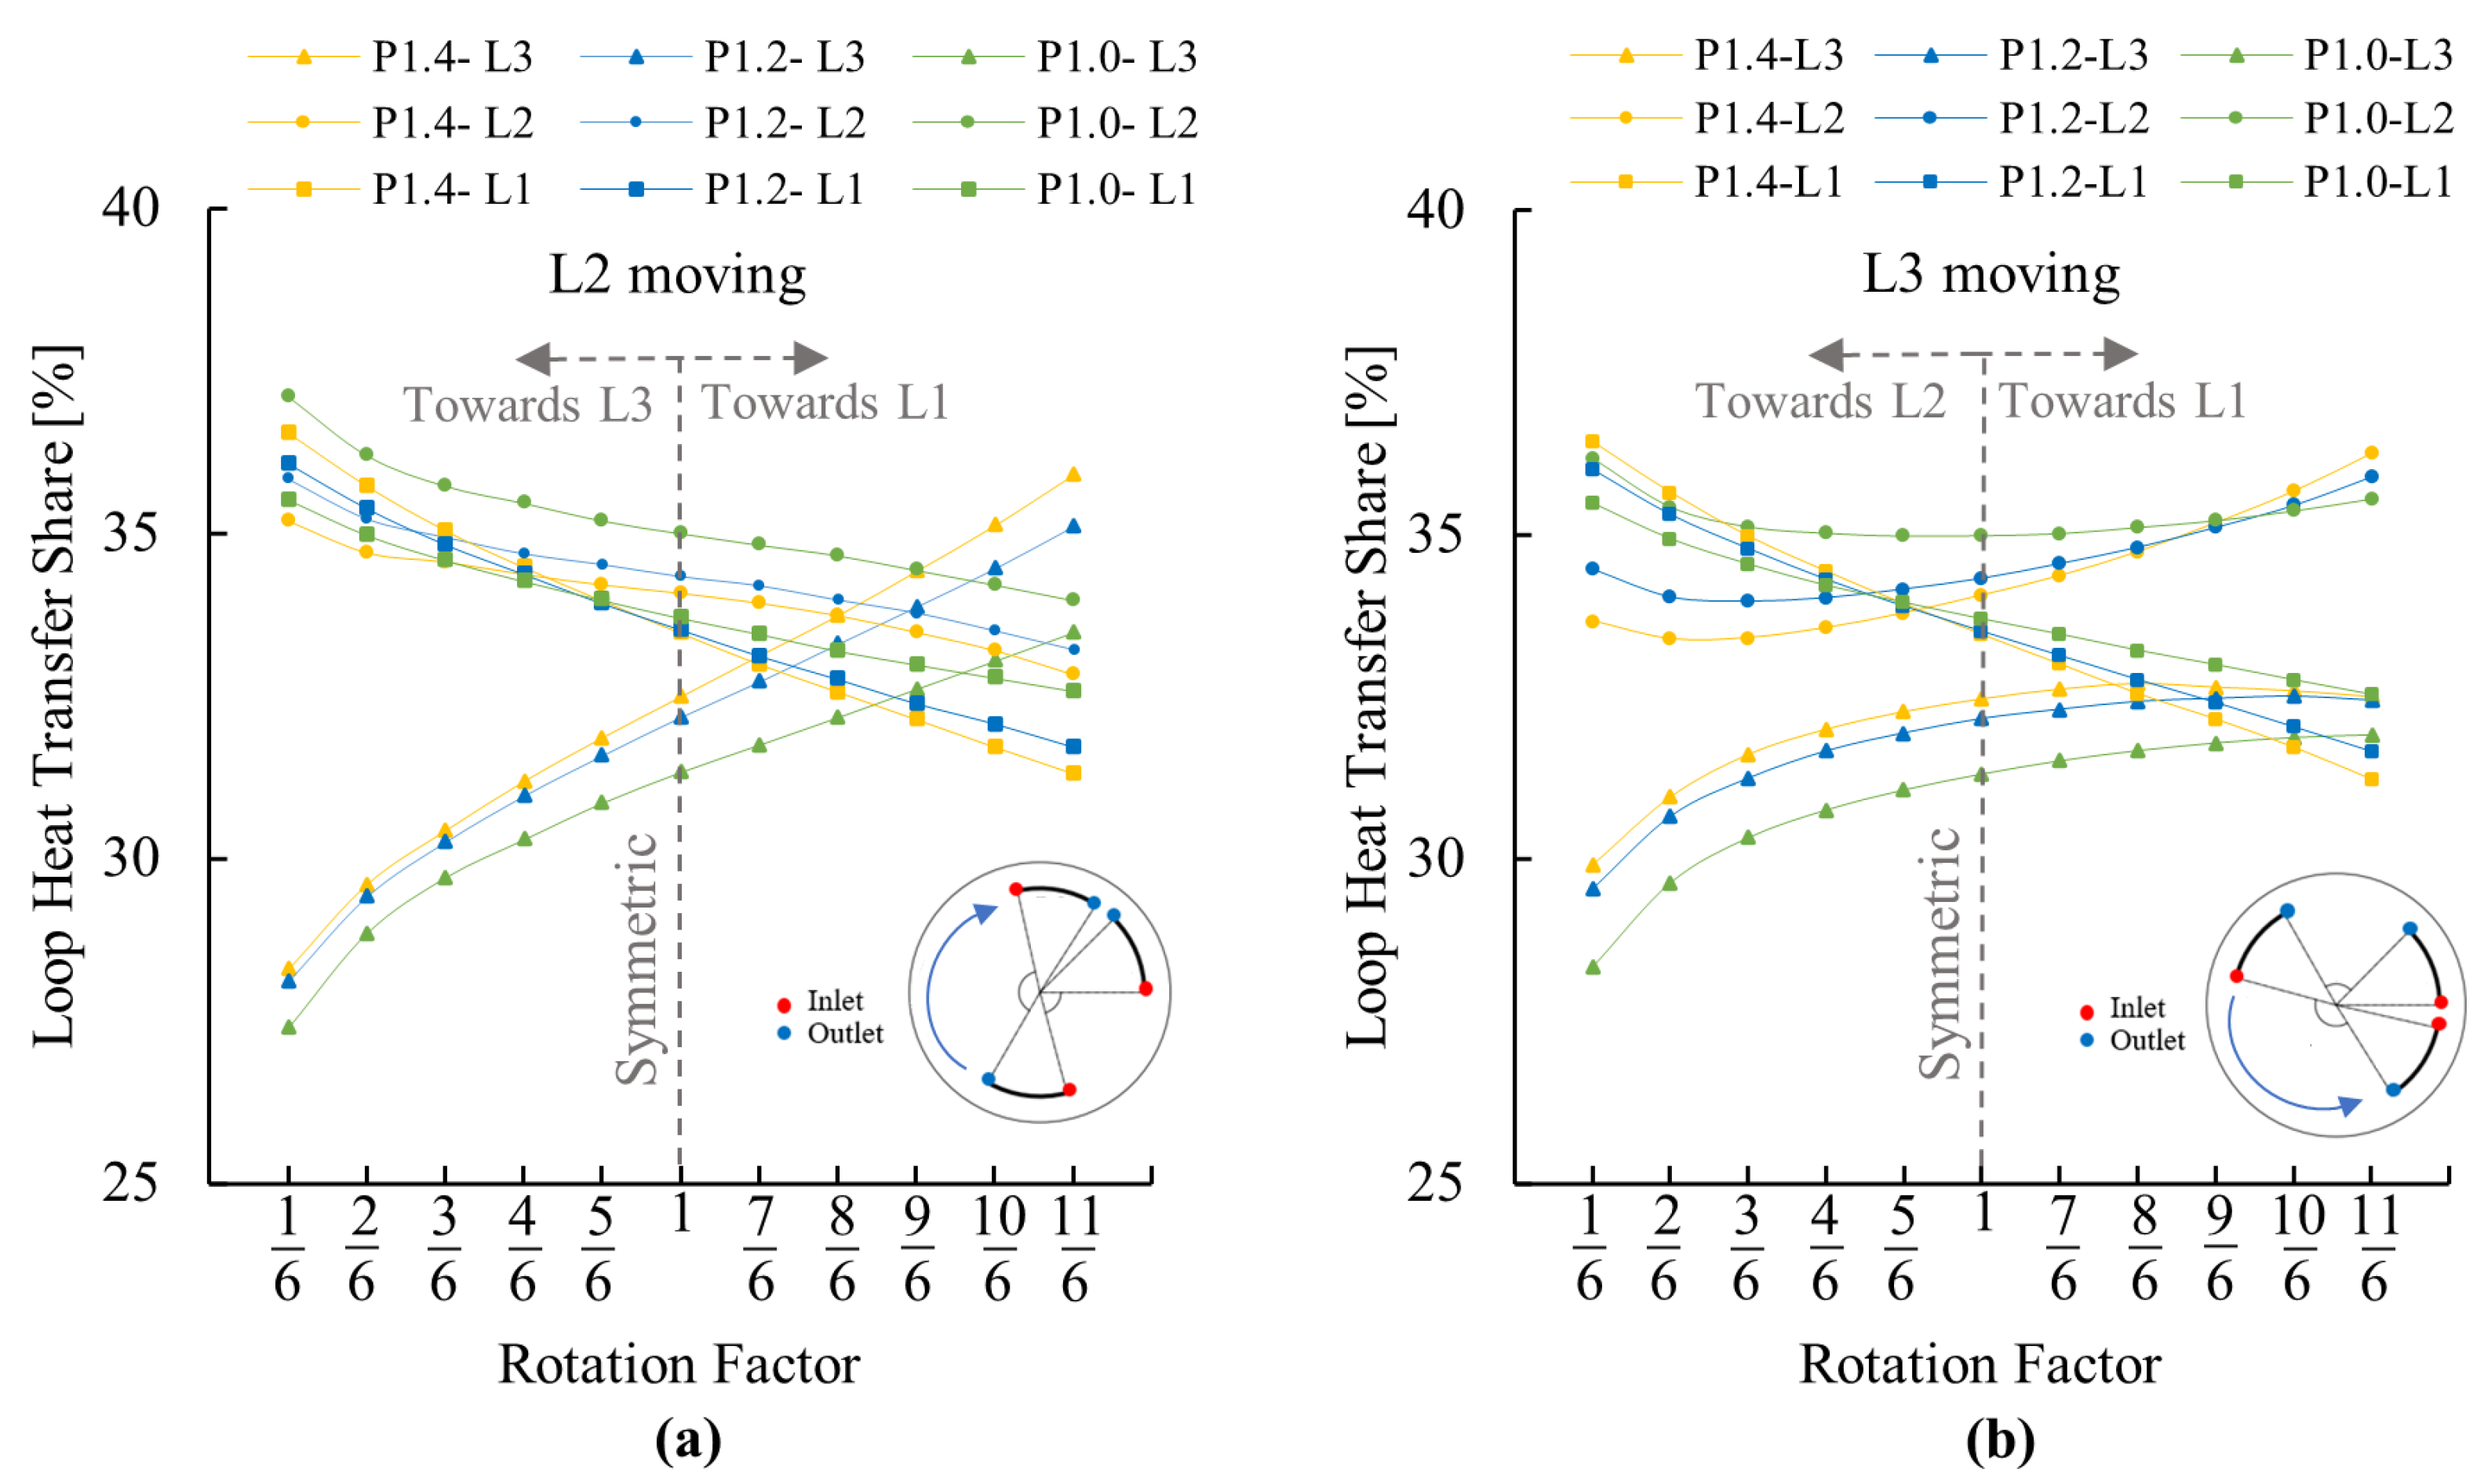
3.1.2. Heat Transfer Share between Loops
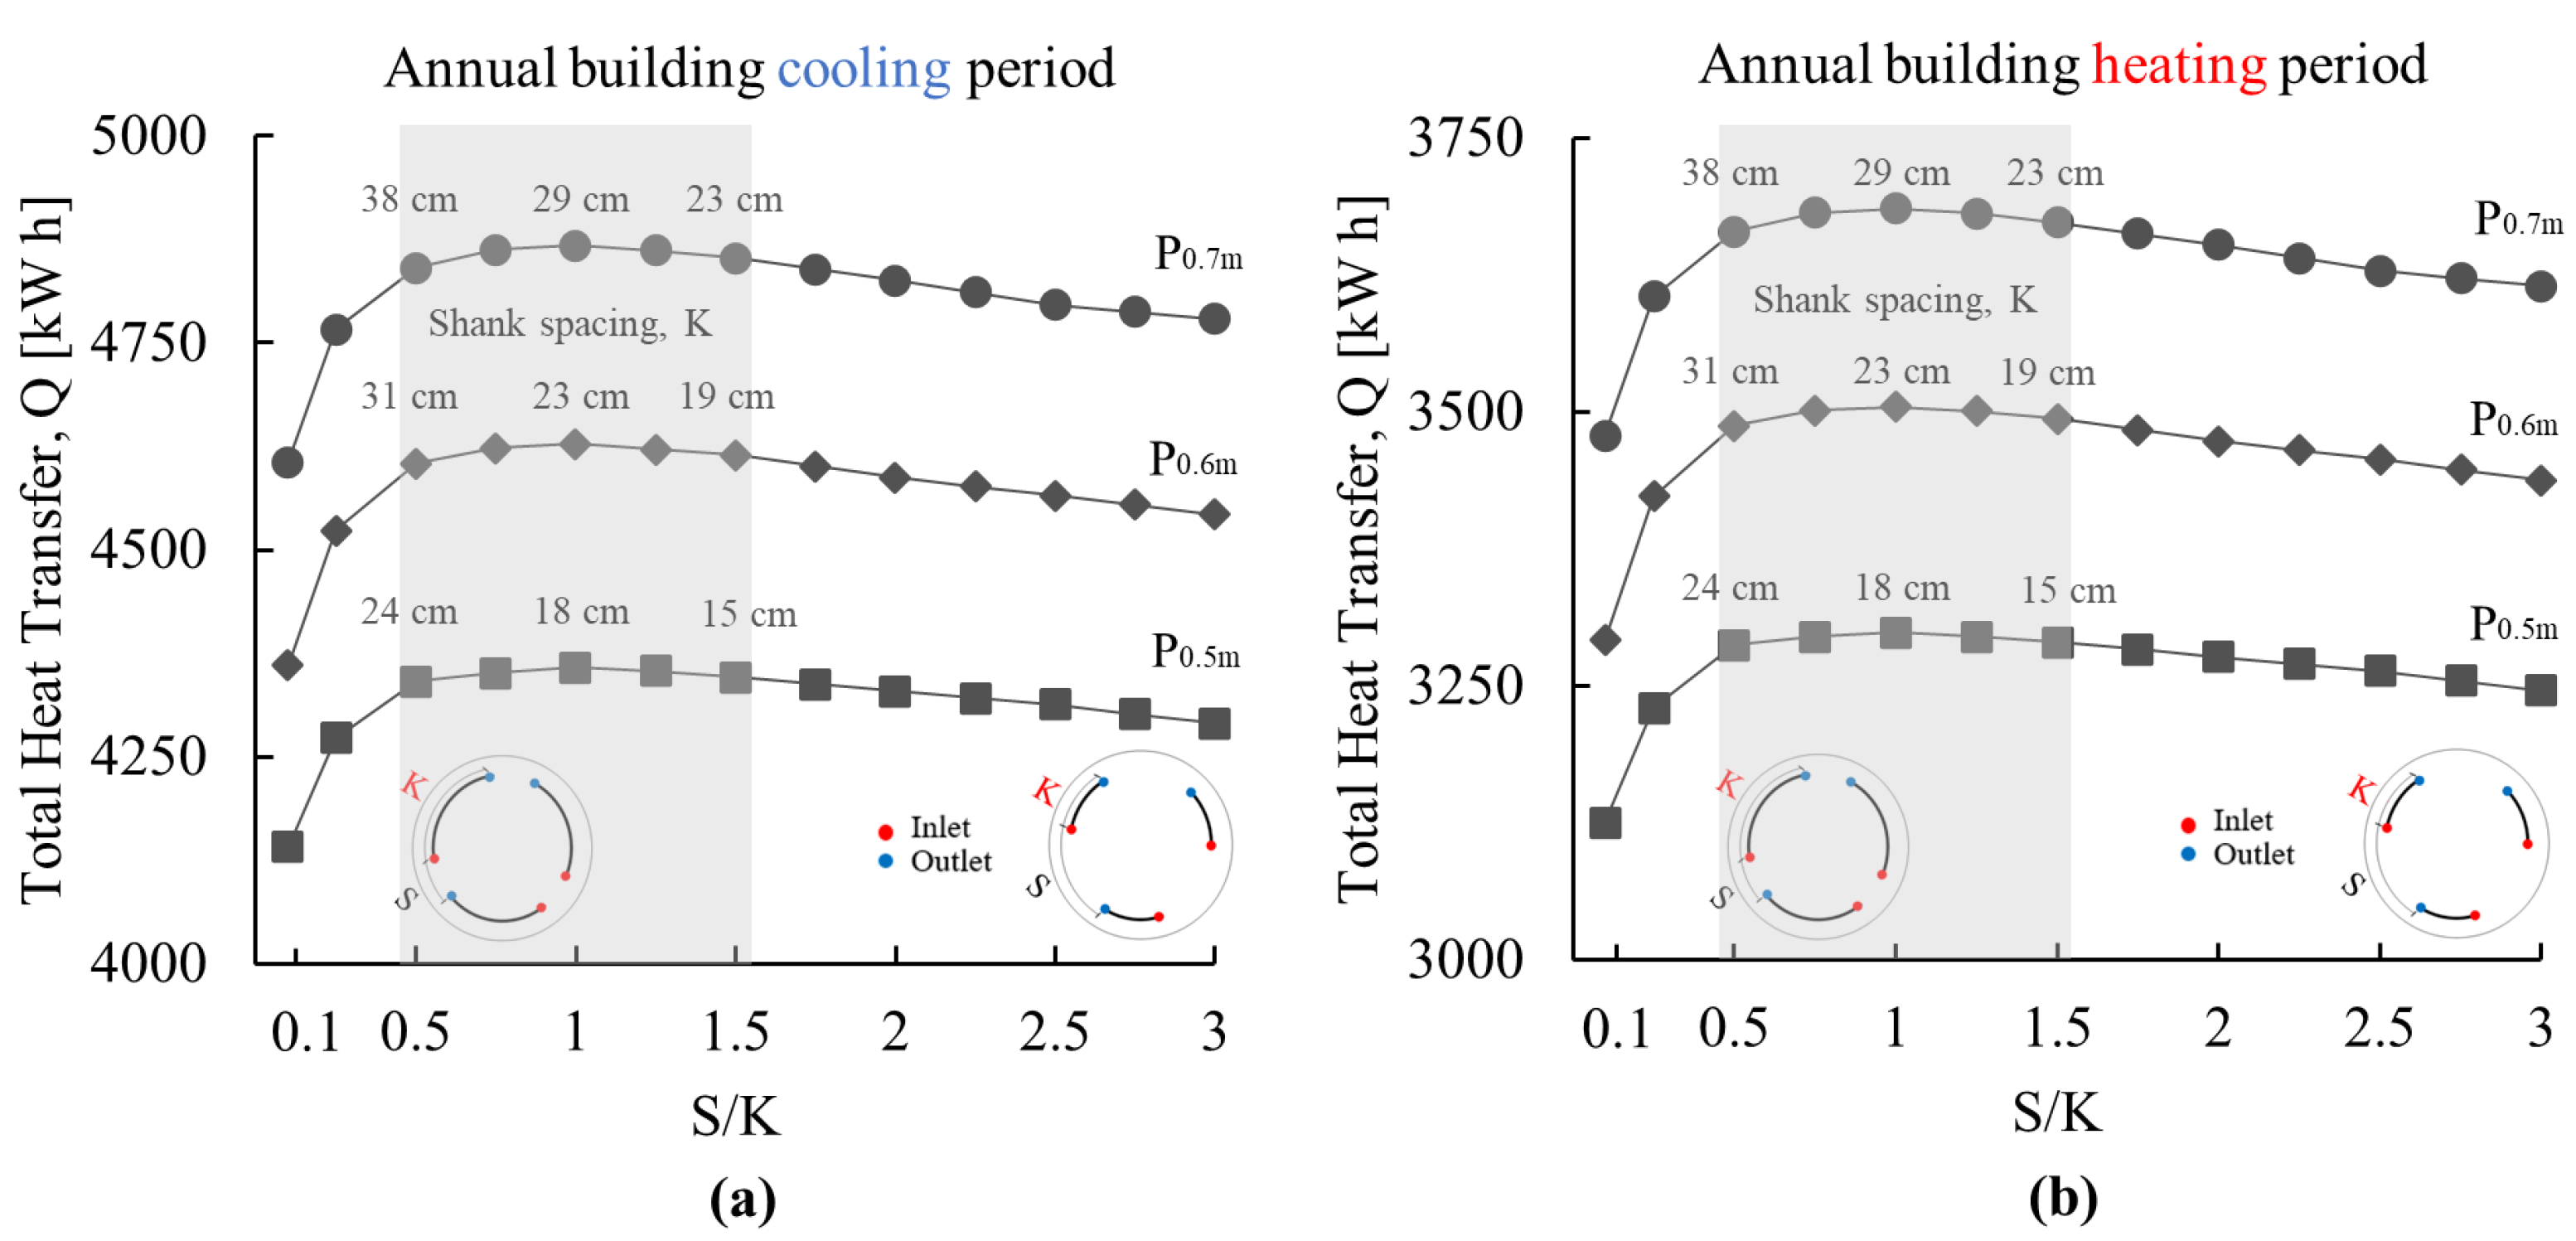
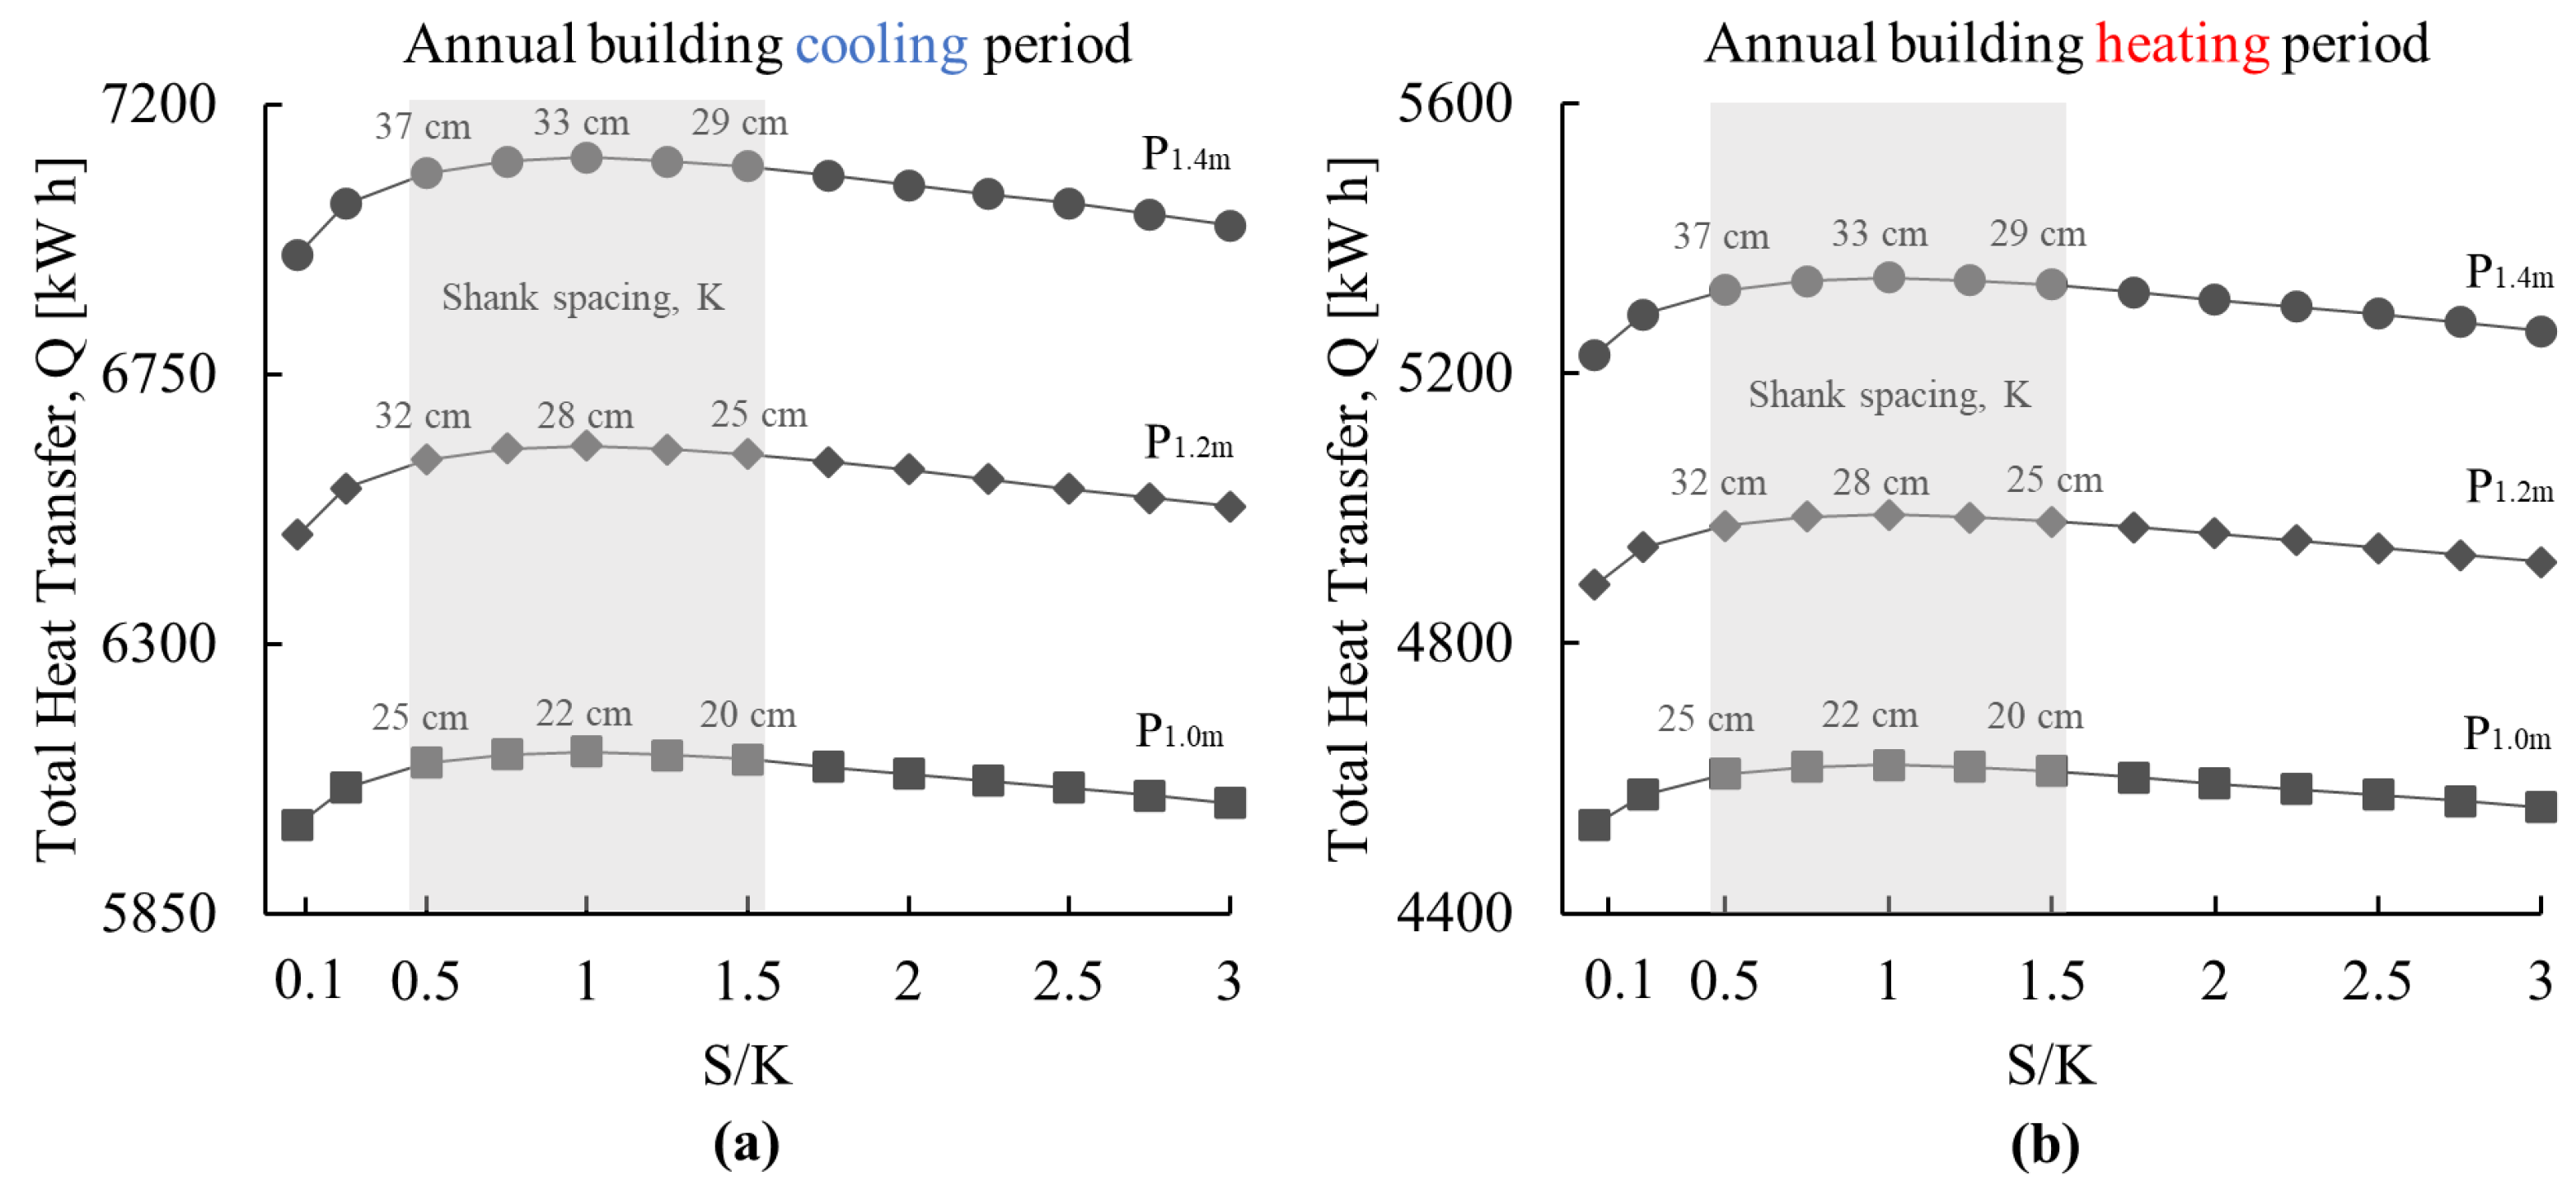
3.1.3. Effect of GHE Pipe Leg Spacing
3.2. Generalised Case and Influencing Parameters
4. Conclusions
- A drop of less than 3% in the total heat transfer is observed considering a worst-case scenario (highly non-symmetrical placement) of the GHE distribution connected in parallel within the energy pile compared to the symmetrical case. This means that the effect of altering the loops’ distribution is minimal from the thermal yield point of view;
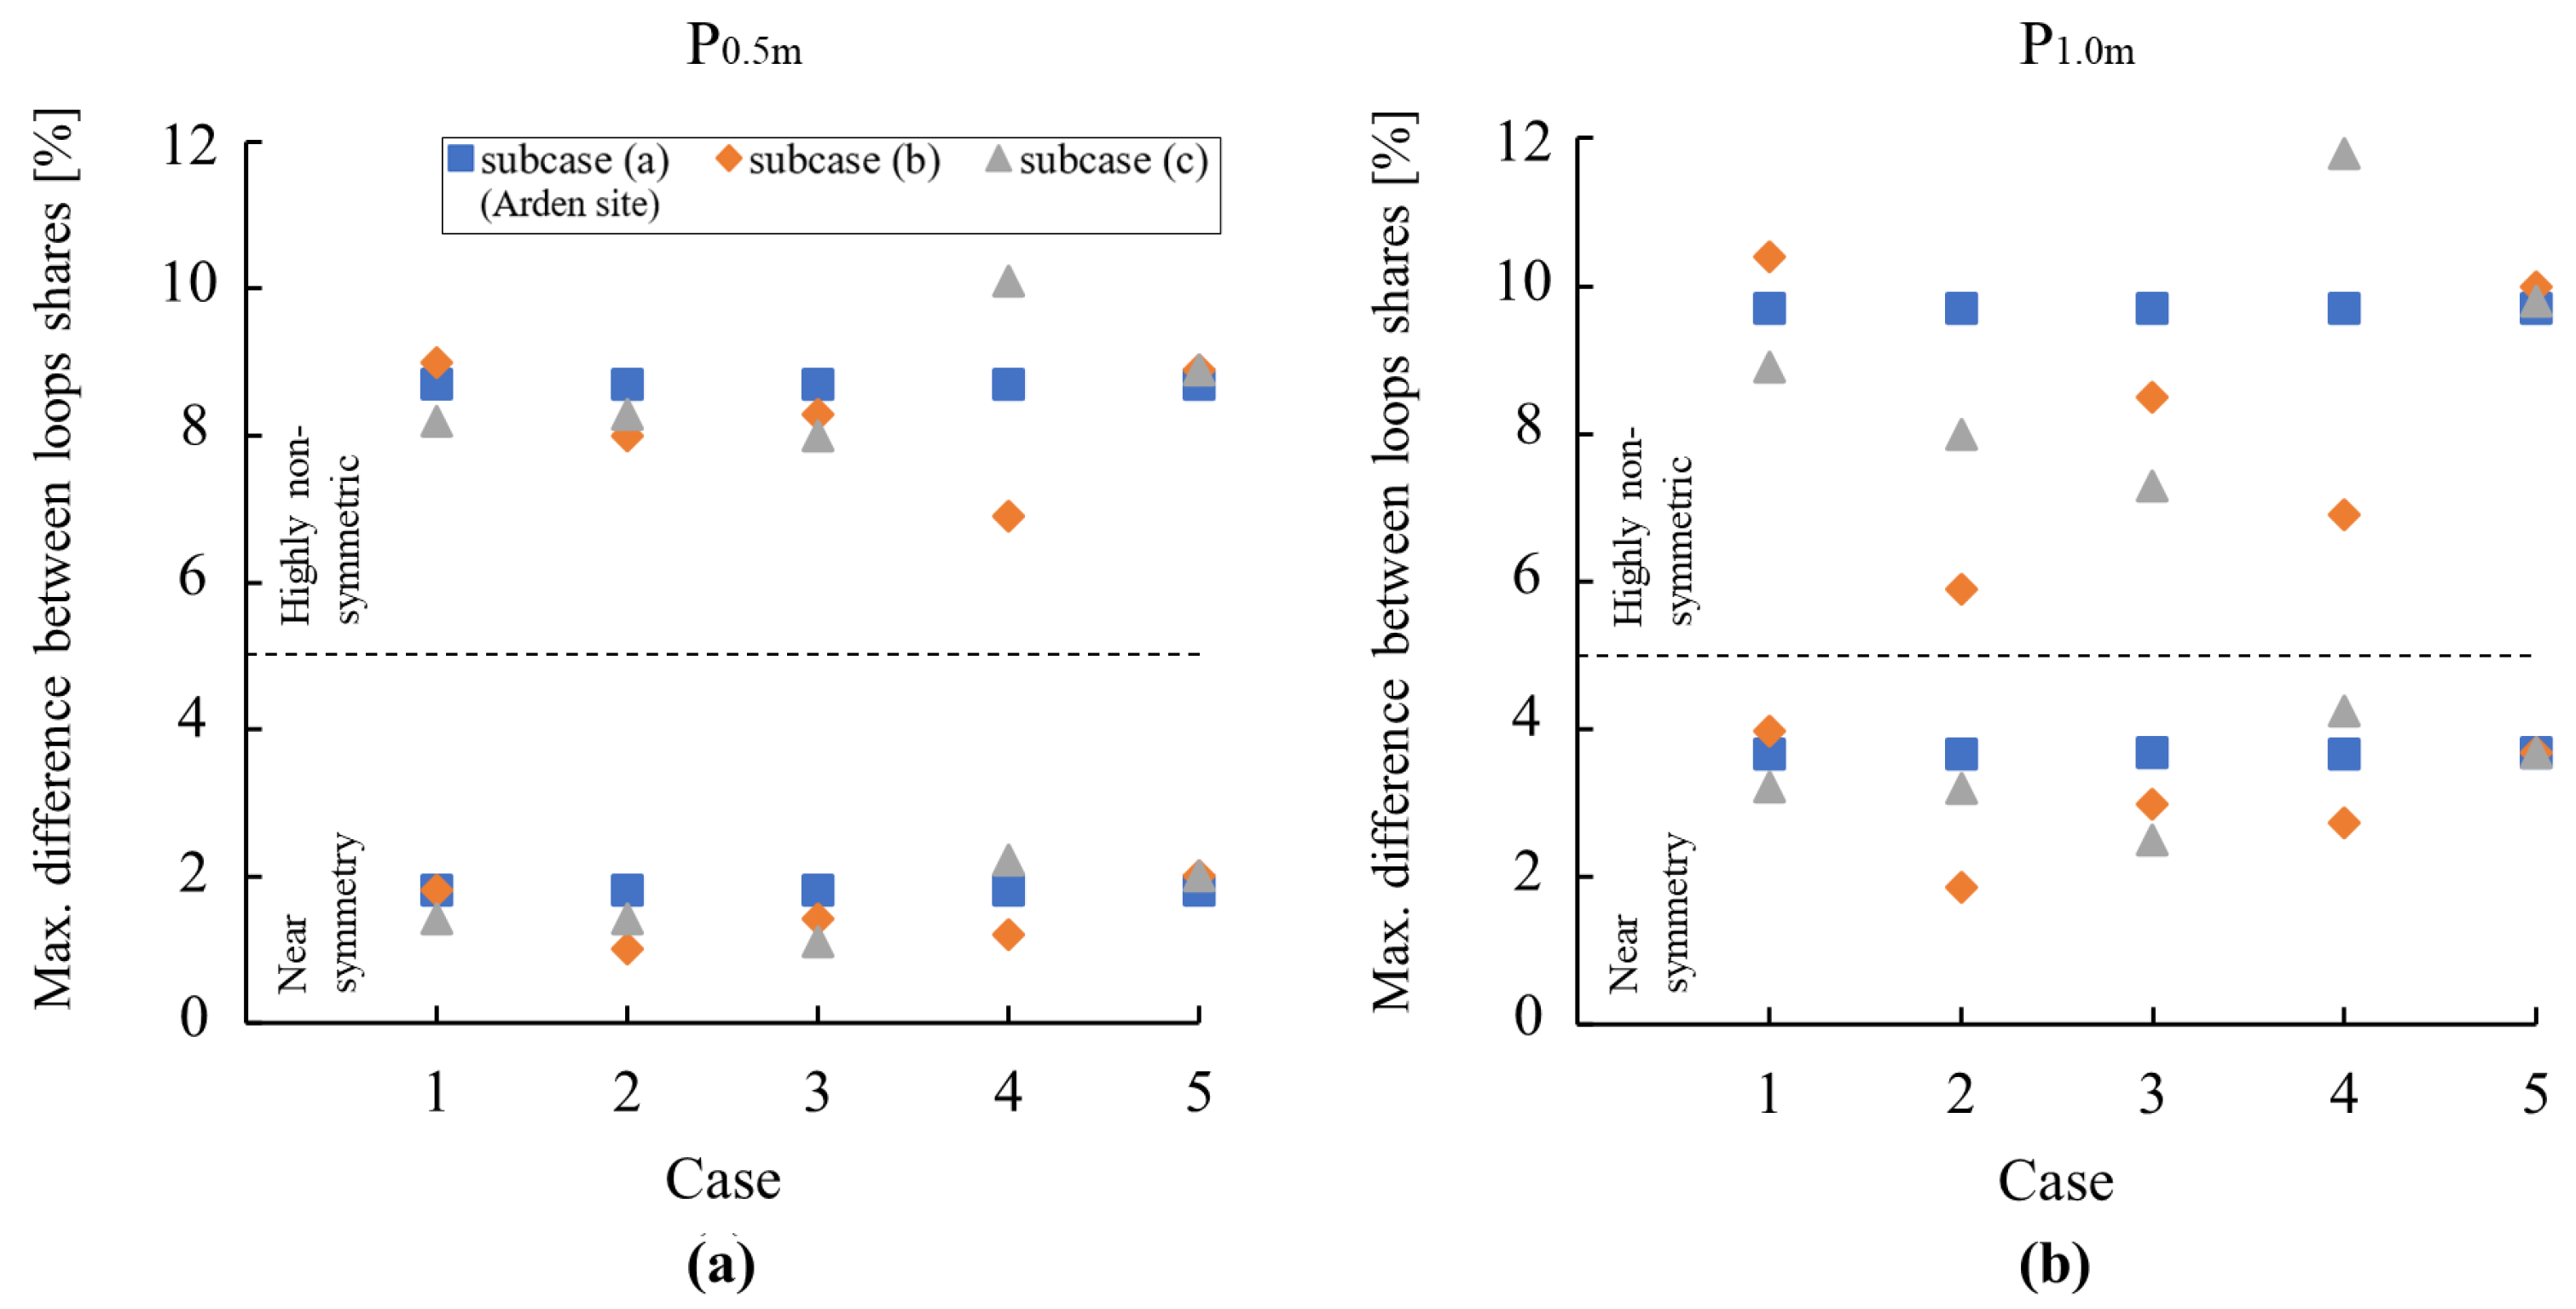
- The share of the total heat transfer between the parallel loops generally varies within a range of less than 5%, except for highly non-symmetric configurations. These results allow ample flexibility in distributing the loops during the design stages. In addition, the results suggest low risks associated with deviations from design during installation with regard to thermal performance;
- The heat transfer share between loops might be different as two adjacent inlets become closer to each other compared to two adjacent outlets in the pile. This becomes more important as the internal space of the pile becomes smaller and equipped with higher thermally efficient GHE loops such as W-tube compared to U-tube loops, and may be a consideration for structural integrity given the thermal gradients within the horizontal cross-section of the pile induced during operation of the GSHP system;
- The insignificant decrease in thermal performance when the separation-to-shank distance ratios range from 0.5 to 1.5 in the symmetrical distribution allows for more flexibility in designing and installing the GHE loops as well as the possibility of increasing the number of loops, which increases the total energy pile thermal yield. However, installing the loops in symmetrical and evenly spaced distribution (i.e., separation-to-shank distance ratio equal to 1) results in the best overall performance and is thus recommended;
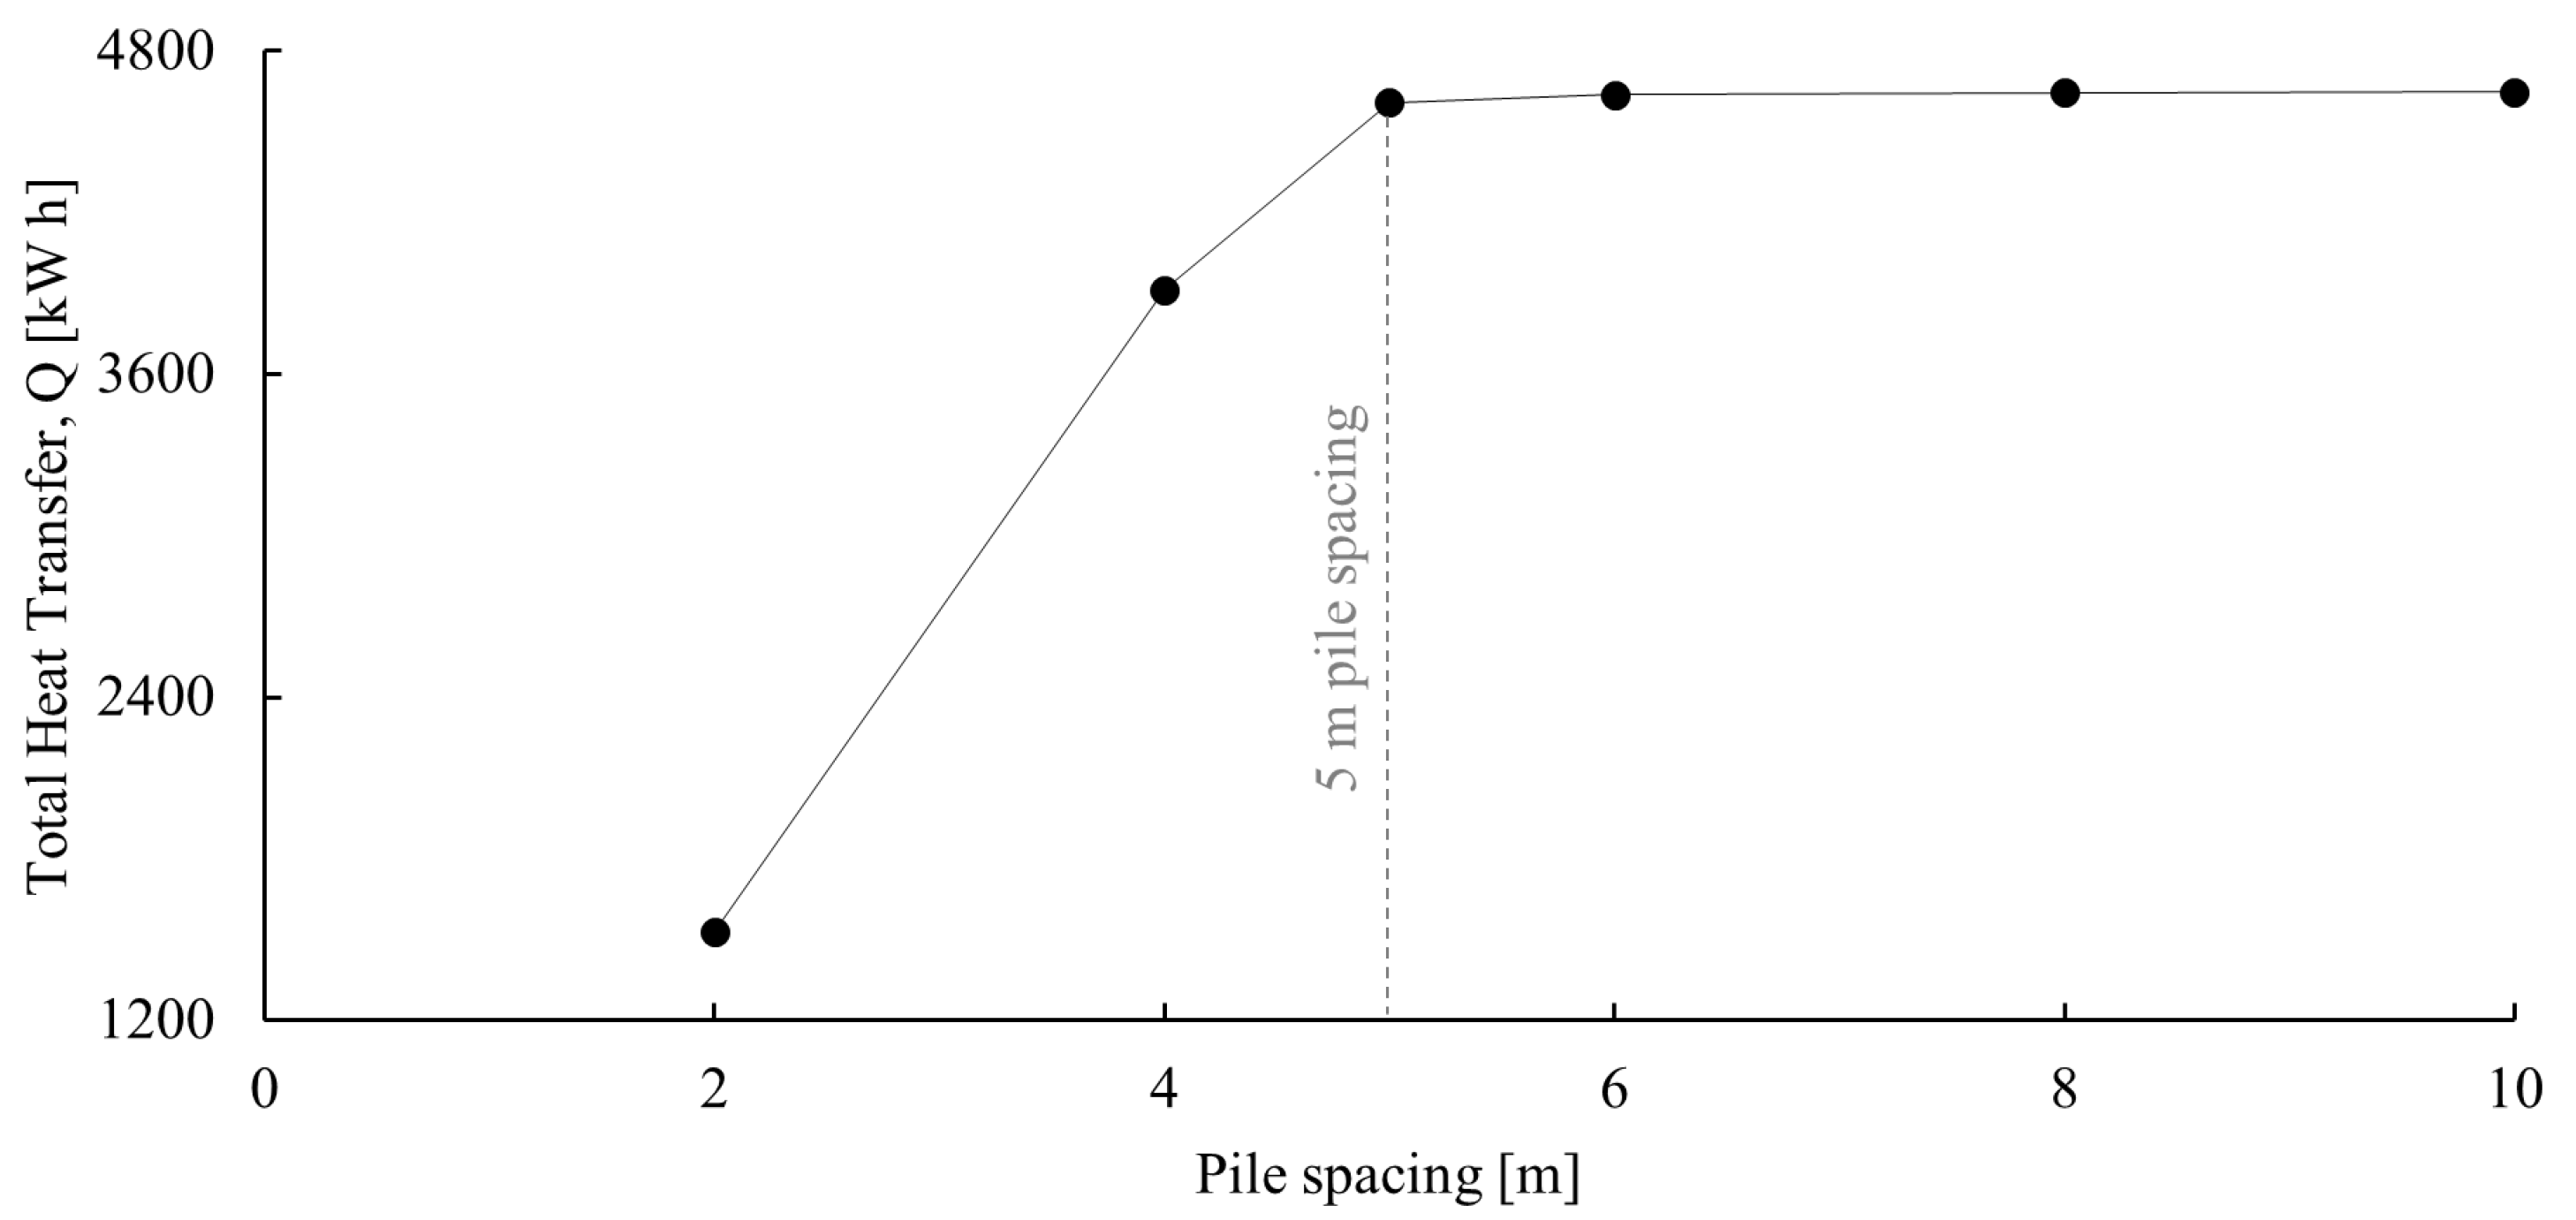
- Regardless of variations in the considered cases of the influencing parameters (i.e., ground thermal conductivity, concrete thermal conductivity, pile length, fluid flow rate, pipe diameter, and pile spacing), when the loops stay near a symmetric distribution, they are within 5% of difference in sharing the load. However, if one loop is not carefully placed and becomes loose, it could result in up to a 12% difference in the load share among the loops. This may impose inter-pile thermal strains;
- Anisotropic material conditions were not evaluated but are suspected to render similar trends, albeit different absolute values in results. This may be the subject of future work.
Author Contributions
Funding
Data Availability Statement
Acknowledgments
Conflicts of Interest
Appendix A
Appendix A.1
Appendix A.2
Appendix A.3

| Case | Total Heat Transfer in Cooling (P0.5m) [kW h] | |||||||||||
|---|---|---|---|---|---|---|---|---|---|---|---|---|
| 1/6 β | 2/6 β | 3/6 β | 4/6 β | 5/6 β | Symmetry | 7/6 β | 8/6 β | 9/6 β | 10/6 β | 11/6 β | ||
| 1 | a | 4266 | 4295 | 4311 | 4323 | 4335 | 4336 | 4336 | 4325 | 4314 | 4298 | 4275 |
| b | 2901 | 2915 | 2922 | 2927 | 2931 | 2932 | 2933 | 2927 | 2923 | 2918 | 2905 | |
| c | 5356 | 5401 | 5425 | 5443 | 5459 | 5463 | 5462 | 5444 | 5430 | 5407 | 5368 | |
| 2 | a | 4266 | 4295 | 4311 | 4323 | 4335 | 4336 | 4336 | 4325 | 4314 | 4298 | 4275 |
| b | 3586 | 3607 | 3638 | 3645 | 3653 | 3670 | 3640 | 3630 | 3611 | 3575 | 3564 | |
| c | 4386 | 4389 | 4410 | 4417 | 4425 | 4432 | 4420 | 4397 | 4382 | 4357 | 4347 | |
| 3 | a | 4266 | 4295 | 4311 | 4323 | 4335 | 4336 | 4336 | 4325 | 4314 | 4298 | 4275 |
| b | 1422 | 1429 | 1434 | 1438 | 1439 | 1440 | 1439 | 1437 | 1433 | 1429 | 1420 | |
| c | 2569 | 2584 | 2595 | 2599 | 2605 | 2606 | 2605 | 2601 | 2593 | 2585 | 2570 | |
| 4 | a | 4266 | 4295 | 4311 | 4323 | 4335 | 4336 | 4336 | 4325 | 4314 | 4298 | 4275 |
| b | 4362 | 4385 | 4401 | 4421 | 4424 | 4426 | 4424 | 4414 | 4402 | 4393 | 4362 | |
| c | 4420 | 4450 | 4464 | 4480 | 4487 | 4490 | 4485 | 4477 | 4466 | 4447 | 4426 | |
| 5 | a | 4266 | 4295 | 4311 | 4323 | 4335 | 4336 | 4336 | 4325 | 4314 | 4298 | 4275 |
| b | 4067 | 4095 | 4112 | 4123 | 4132 | 4135 | 4132 | 4122 | 4112 | 4097 | 4072 | |
| c | 4362 | 4390 | 4405 | 4418 | 4429 | 4432 | 4429 | 4419 | 4410 | 4395 | 4372 | |
| 6 | a | 4266 | 4295 | 4311 | 4323 | 4335 | 4336 | 4336 | 4325 | 4314 | 4298 | 4275 |
| b | 1748 | 1751 | 1752 | 1753 | 1753 | 1753 | 1752 | 1752 | 1751 | 1750 | 1748 | |
| c | 3357 | 3373 | 3382 | 3388 | 3390 | 3393 | 3391 | 3387 | 3382 | 3374 | 3362 | |
| Case | Total Heat Transfer in Heating (P0.5m) [kW h] | |||||||||||
|---|---|---|---|---|---|---|---|---|---|---|---|---|
| 1/6 β | 2/6 β | 3/6 β | 4/6 β | 5/6 β | Symmetry | 7/6 β | 8/6 β | 9/6 β | 10/6 β | 11/6 β | ||
| 1 | a | 3226 | 3249 | 3262 | 3271 | 3281 | 3282 | 3281 | 3272 | 3264 | 3252 | 3232 |
| b | 2043 | 2053 | 2059 | 2063 | 2067 | 2068 | 2067 | 2064 | 2060 | 2054 | 2045 | |
| c | 4128 | 4162 | 4181 | 4193 | 4207 | 4210 | 4208 | 4196 | 4184 | 4165 | 4136 | |
| 2 | a | 3226 | 3249 | 3262 | 3271 | 3281 | 3282 | 3281 | 3272 | 3264 | 3252 | 3232 |
| b | 2713 | 2744 | 2763 | 2776 | 2790 | 2792 | 2790 | 2775 | 2762 | 2745 | 2716 | |
| c | 3391 | 3410 | 3421 | 3428 | 3435 | 3437 | 3436 | 3429 | 3423 | 3414 | 3398 | |
| 3 | a | 3226 | 3249 | 3262 | 3271 | 3281 | 3282 | 3281 | 3272 | 3264 | 3252 | 3232 |
| b | 1026 | 1032 | 1036 | 1039 | 1040 | 1041 | 1040 | 1038 | 1035 | 1032 | 1025 | |
| c | 1906 | 1919 | 1927 | 1935 | 1936 | 1937 | 1936 | 1933 | 1926 | 1919 | 1907 | |
| 4 | a | 3226 | 3249 | 3262 | 3271 | 3281 | 3282 | 3281 | 3272 | 3264 | 3252 | 3232 |
| b | 3303 | 3326 | 3339 | 3347 | 3357 | 3358 | 3357 | 3348 | 3339 | 3326 | 3307 | |
| c | 3355 | 3377 | 3390 | 3398 | 3408 | 3410 | 3408 | 3398 | 3389 | 3377 | 3356 | |
| 5 | a | 3226 | 3249 | 3262 | 3271 | 3281 | 3282 | 3281 | 3272 | 3264 | 3252 | 3232 |
| b | 3069 | 3093 | 3106 | 3114 | 3122 | 3124 | 3122 | 3114 | 3106 | 3094 | 3073 | |
| c | 3274 | 3297 | 3310 | 3319 | 3329 | 3330 | 3333 | 3320 | 3312 | 3301 | 3282 | |
| 6 | a | 3226 | 3249 | 3262 | 3271 | 3281 | 3282 | 3281 | 3272 | 3264 | 3252 | 3232 |
| b | 1022 | 1022 | 1022 | 1023 | 1023 | 1023 | 1023 | 1023 | 1022 | 1022 | 1022 | |
| c | 2482 | 2490 | 2495 | 2498 | 2499 | 2500 | 2499 | 2497 | 2495 | 2491 | 2484 | |
| Case | Total Heat Transfer in Cooling (P1.0m) [kW h] | |||||||||||
|---|---|---|---|---|---|---|---|---|---|---|---|---|
| 1/6 β | 2/6 β | 3/6 β | 4/6 β | 5/6 β | Symmetry | 7/6 β | 8/6 β | 9/6 β | 10/6 β | 11/6 β | ||
| 1 | a | 6055 | 6077 | 6090 | 6098 | 6103 | 6106 | 6106 | 6105 | 6101 | 6093 | 6083 |
| b | 4278 | 4283 | 4293 | 4294 | 4297 | 4297 | 4299 | 4300 | 4297 | 4285 | 4279 | |
| c | 7605 | 7635 | 7656 | 7680 | 7692 | 7693 | 7692 | 7685 | 7660 | 7628 | 7615 | |
| 2 | a | 6055 | 6077 | 6090 | 6098 | 6103 | 6106 | 6106 | 6105 | 6101 | 6093 | 6083 |
| b | 5480 | 5506 | 5523 | 5533 | 5539 | 5542 | 5541 | 5538 | 5530 | 5517 | 5500 | |
| c | 6225 | 6244 | 6255 | 6262 | 6267 | 6270 | 6271 | 6270 | 6267 | 6262 | 6254 | |
| 3 | a | 6055 | 6077 | 6090 | 6098 | 6103 | 6106 | 6106 | 6105 | 6101 | 6093 | 6083 |
| b | 2096 | 2105 | 2110 | 2112 | 2113 | 2113 | 2113 | 2112 | 2111 | 2108 | 2104 | |
| c | 3760 | 3770 | 3775 | 3778 | 3782 | 3784 | 3760 | 3759 | 3756 | 3751 | 3745 | |
| 4 | a | 6055 | 6077 | 6090 | 6098 | 6103 | 6106 | 6106 | 6105 | 6101 | 6093 | 6083 |
| b | 6202 | 6219 | 6230 | 6237 | 6241 | 6243 | 6243 | 6241 | 6236 | 6223 | 6218 | |
| c | 6319 | 6334 | 6344 | 6350 | 6353 | 6355 | 6355 | 6353 | 6347 | 6339 | 6328 | |
| 5 | a | 6055 | 6077 | 6090 | 6098 | 6103 | 6106 | 6106 | 6105 | 6101 | 6093 | 6083 |
| b | 5882 | 5900 | 5912 | 5918 | 5922 | 5925 | 5924 | 5923 | 5918 | 5910 | 5898 | |
| c | 6133 | 6159 | 6174 | 6183 | 6188 | 6191 | 6192 | 6191 | 6187 | 6181 | 6172 | |
| 6 | a | 6055 | 6077 | 6090 | 6098 | 6103 | 6106 | 6106 | 6105 | 6101 | 6093 | 6083 |
| b | 2645 | 2648 | 2649 | 2650 | 2650 | 2650 | 2650 | 2650 | 2650 | 2649 | 2648 | |
| c | 4772 | 4783 | 4790 | 4794 | 4796 | 4797 | 4797 | 4797 | 4794 | 4791 | 4786 | |
| Case | Total Heat Transfer in Heating (P1.0m) [kW h] | |||||||||||
|---|---|---|---|---|---|---|---|---|---|---|---|---|
| 1/6 β | 2/6 β | 3/6 β | 4/6 β | 5/6 β | Symmetry | 7/6 β | 8/6 β | 9/6 β | 10/6 β | 11/6 β | ||
| 1 | a | 4573 | 4589 | 4599 | 4605 | 4608 | 4610 | 4610 | 4610 | 4606 | 4601 | 4594 |
| b | 3067 | 3075 | 3081 | 3084 | 3086 | 3087 | 3088 | 3087 | 3085 | 3082 | 3078 | |
| c | 5716 | 5736 | 5749 | 5756 | 5760 | 5763 | 5763 | 5763 | 5758 | 5751 | 5743 | |
| 2 | a | 4573 | 4589 | 4599 | 4605 | 4608 | 4610 | 4610 | 4610 | 4606 | 4601 | 4594 |
| b | 4144 | 4164 | 4177 | 4184 | 4188 | 4191 | 4190 | 4188 | 4181 | 4171 | 4158 | |
| c | 4694 | 4707 | 4715 | 4720 | 4723 | 4725 | 4726 | 4726 | 4723 | 4720 | 4714 | |
| 3 | a | 4573 | 4589 | 4599 | 4605 | 4608 | 4610 | 4610 | 4610 | 4606 | 4601 | 4594 |
| b | 1545 | 1549 | 1551 | 1553 | 1553 | 1554 | 1553 | 1553 | 1552 | 1550 | 1546 | |
| c | 2812 | 2819 | 2824 | 2828 | 2829 | 2830 | 2830 | 2829 | 2827 | 2823 | 2818 | |
| 4 | a | 4573 | 4589 | 4599 | 4605 | 4608 | 4610 | 4610 | 4610 | 4606 | 4601 | 4594 |
| b | 4707 | 4719 | 4727 | 4732 | 4735 | 4737 | 4737 | 4735 | 4732 | 4726 | 4718 | |
| c | 4792 | 4803 | 4810 | 4814 | 4817 | 4818 | 4817 | 4816 | 4812 | 4807 | 4799 | |
| 5 | a | 4573 | 4589 | 4599 | 4605 | 4608 | 4610 | 4610 | 4610 | 4606 | 4601 | 4594 |
| b | 4445 | 4458 | 4466 | 4471 | 4474 | 4476 | 4476 | 4475 | 4471 | 4465 | 4456 | |
| c | 4612 | 4629 | 4639 | 4645 | 4648 | 4650 | 4651 | 4650 | 4647 | 4642 | 4635 | |
| 6 | a | 4573 | 4589 | 4599 | 4605 | 4608 | 4610 | 4610 | 4610 | 4606 | 4601 | 4594 |
| b | 1528 | 1529 | 1529 | 1530 | 1530 | 1530 | 1530 | 1530 | 1530 | 1529 | 1529 | |
| c | 3361 | 3364 | 3366 | 3367 | 3368 | 3368 | 3368 | 3368 | 3367 | 3366 | 3365 | |
References
- Brandl, H. Energy foundations and other thermo-active ground structures. Géotechnique 2006, 56, 81–122. [Google Scholar] [CrossRef]
- Cui, P.; Diao, N.; Gao, C.; Fang, Z. Thermal investigation of in-series vertical ground heat exchangers for industrial waste heat storage. Geothermics 2015, 57, 205–212. [Google Scholar] [CrossRef]
- Narsilio, G.; Johnston, I.; Bidarmaghz, A.; Colls, S.; Mikhaylovaa, O.; Kivi, A.; Aditya, R. Geothermal energy: Introducing an emerging technology. In Proceedings of the International Conference on Advances in Civil Engineering for Sustainable Development, Pattaya, Thailand, 27–29 August 2014. [Google Scholar]
- Laloui, L.; Di Donna, A. Understanding the behaviour of energy geo-structures. In Institution of Civil Engineers-Civil Engineering; Thomas Telford Ltd.: London, UK, 2011. [Google Scholar]
- Mohamad, Z.; Fardoun, F.; Meftah, F. A review on energy piles design, evaluation, and optimization. J. Clean. Prod. 2021, 292, 125802. [Google Scholar] [CrossRef]
- Loveridge, F.; McCartney, J.S.; Narsilio, G.A.; Sanchez, M. Energy geostructures: A review of analysis approaches, in situ testing and model scale experiments. Geomech. Energy Environ. 2020, 22, 100173. [Google Scholar] [CrossRef]
- Liang, B.; Chen, M.; Orooji, Y. Effective parameters on the performance of ground heat exchangers: A review of latest advances. Geothermics 2022, 98, 102283. [Google Scholar] [CrossRef]
- Park, S.; Sung, C.; Jung, K.; Sohn, B.; Chauchois, A.; Choi, H. Constructability and heat exchange efficiency of large diameter cast-in-place energy piles with various configurations of heat exchange pipe. Appl. Therm. Eng. 2015, 90, 1061–1071. [Google Scholar] [CrossRef]
- Makasis, N.; Narsilio, G.A.; Bidarmaghz, A.; Johnston, I.W. Ground-source heat pump systems: The effect of variable pipe separation in ground heat exchangers. Comput. Geotech. 2018, 100, 97–109. [Google Scholar] [CrossRef]
- Miyara, A. Thermal performance investigation of several types of vertical ground heat exchangers with different operation mode. Appl. Therm. Eng. 2012, 33, 167–174. [Google Scholar] [CrossRef]
- Lee, C.; Lam, H. A simplified model of energy pile for ground-source heat pump systems. Energy 2013, 55, 838–845. [Google Scholar] [CrossRef]
- Caulk, R.; Ghazanfari, E.; McCartney, J.S. Parameterization of a calibrated geothermal energy pile model. Geomech. Energy Environ. 2016, 5, 1–15. [Google Scholar] [CrossRef]
- Loveridge, F.; Powrie, W. 2D thermal resistance of pile heat exchangers. Geothermics 2014, 50, 122–135. [Google Scholar] [CrossRef]
- Pekař, L. Introduction to heat exchangers. In Advanced Analytic and Control Techniques for Thermal Systems with Heat Exchangers; Elsevier: Amsterdam, The Netherlands, 2020; pp. 3–20. [Google Scholar] [CrossRef]
- Kakaç, S.; Liu, H.; Pramuanjaroenkij, A. Heat Exchangers: Selection, Rating, and Thermal Design, 3rd ed.; Taylor & Francis: Abingdon, UK, 2012. [Google Scholar]
- Cui, P.; Yang, W.; Zhang, W.; Zhu, K.; Spitler, J.D.; Yu, M. Advances in ground heat exchangers for space heating and cooling: Review and perspectives. Energy Built Environ. 2022, 5, 255–269. [Google Scholar] [CrossRef]
- Bezyan, B.; Porkhial, S.; Mehrizi, A.A. 3-D simulation of heat transfer rate in geothermal pile-foundation heat exchangers with spiral pipe configuration. Appl. Therm. Eng. 2015, 87, 655–668. [Google Scholar] [CrossRef]
- Zhao, Q.; Chen, B.; Liu, F. Study on the thermal performance of several types of energy pile ground heat exchangers: U-shaped, W-shaped and spiral-shaped. Energy Build. 2016, 133, 335–344. [Google Scholar] [CrossRef]
- Luo, J.; Zhao, H.; Gui, S.; Xiang, W.; Rohn, J.; Blum, P. Thermo-economic analysis of four different types of ground heat exchangers in energy piles. Appl. Therm. Eng. 2016, 108, 11–19. [Google Scholar] [CrossRef]
- Khandouzi, O.; Pourfallah, M.; Yoosefirad, E.; Shaker, B.; Gholinia, M.; Mouloodi, S. Evaluating and optimizing the geometry of thermal foundation pipes for the utilization of the geothermal energy: Numerical simulation. J. Energy Storage 2021, 37, 102464. [Google Scholar] [CrossRef]
- Javadi, H.; Ajarostaghi, S.S.M.; Pourfallah, M.; Zaboli, M. Performance analysis of helical ground heat exchangers with different configurations. Appl. Therm. Eng. 2019, 154, 24–36. [Google Scholar] [CrossRef]
- Laloui, L.; Loria, A.R. Analysis and Design of Energy Geostructures: Theoretical Essentials and Practical Application; Academic Press: Cambridge, MA, USA, 2019. [Google Scholar]
- Rashidi, S.; Bakhshi, N.; Rafee, R. Progress and challenges of helical-shaped geothermal heat exchangers. Environ. Sci. Pollut. Res. 2021, 28, 28965–28992. [Google Scholar] [CrossRef]
- McCorry, M.; Jones, G. Geotrainet Training Manual for Designers of Shallow Geothermal Systems; Geotrainet, European Federation of Geologists: Brussels, Belgium, 2011; pp. 1–192. [Google Scholar]
- Banks, D. An Introduction to Thermogeology: Ground Source Heating and Cooling; John Wiley & Sons: Hoboken, NJ, USA, 2012. [Google Scholar]
- Park, S.; Lee, S.; Lee, D.; Ahn, D.; Choi, H. Effect of thermal interference on energy piles considering various configurations of heat exchangers. Energy Build. 2019, 199, 381–401. [Google Scholar] [CrossRef]
- Cui, P.; Jia, L.; Zhou, X.; Yang, W.; Zhang, W. Heat transfer analysis of energy piles with parallel U-Tubes. Renew. Energy 2020, 161, 1046–1058. [Google Scholar] [CrossRef]
- Park, S.; Lee, S.; Park, S.; Choi, H. Empirical formulas for borehole thermal resistance of parallel U-type cast-in-place energy pile. Renew. Energy 2022, 197, 211–227. [Google Scholar] [CrossRef]
- Anstett, M.; Hubbuch, M.; Laloui, L.; Matthey, B.; Morath, M.; Pahud, D.; Parriaux, A.; Rybach, L.; Schönbächler, M.; Tacher, L.; et al. SIA DO 190: Utilisation de la Chaleur du Sous-Sol par des Ouvrages de Fondation et de Soutènement en Béton–Guide Pour la Conception, la Réalisation et la Maintenance; SIA (Société Suisse des Ingénieurs et des Architects): Zürich, Switzerland, 2005. (In French) [Google Scholar]
- Makasis, N. Further Understanding Ground-Source Heat Pump System Design Using Finite Element Methods and Machine Learning Techniques. Ph.D. Thesis, University of Melbourne, Parkville, Australia, 2019. [Google Scholar]
- Bidarmaghz, A. 3D Numerical Modelling of Vertical Ground Heat Exchangers. Ph.D. Thesis, University of Melbourne, Parkville, Australia, 2014. [Google Scholar]
- Alqawasmeh, Q.I.; Narsilio, G.A.; Makasis, N.; Kreitmair, M.J. The impact of soil layering and groundwater flow on energy pile thermal performance. Geomech. Energy Environ. 2024, 38, 100538. [Google Scholar] [CrossRef]
- Lurie, M.V. Modeling and Calculation of Stationary Operating Regimes of Oil and Gas Pipelines; Wiley: Weinheim, Germany, 2008; pp. 73–108. [Google Scholar]
- Jensen-Page, L. Measurement of Ground Thermal Properties for Shallow Geothermal Applications. Ph.D. Thesis, The University of Melbourne, Parkville, Australia, 2019. [Google Scholar]
- Barry-Macaulay, D.; Bouazza, A.; Singh, R.M.; Wang, B. Thermal properties of some Melbourne soils and rocks. Aust. Geomech. 2014, 49, 31–44. [Google Scholar]
- Barry-Macaulay, D.; Bouazza, A.; Singh, R.M.; Wang, B.; Ranjith, P. Thermal conductivity of soils and rocks from the Melbourne (Australia) region. Eng. Geol. 2013, 164, 131–138. [Google Scholar] [CrossRef]
- Zhong, Y.; Bidarmaghz, A.; Narsilio, G.A.; Makasis, N. Thermo-hydraulic analysis in geothermal energy walls. Tunn. Undergr. Space Technol. 2023, 132, 104862. [Google Scholar] [CrossRef]
- Jia, G.S.; Ma, Z.D.; Xia, Z.H.; Wang, J.W.; Zhang, Y.P.; Jin, L.W. Influence of groundwater flow on the ground heat exchanger performance and ground temperature distributions: A comprehensive review of analytical, numerical and experimental studies. Geothermics 2022, 100, 102342. [Google Scholar] [CrossRef]
- Remund, C.; Carda, R.; Rawlings, P.; Bose, J. Ground Source Heat Pump Residential and Light Commercial Design and Installation Guide; International Ground Source Heat Pump Association: Springfield, IL, USA, 2009. [Google Scholar]
- Australian Government Bureau of Meteorology. Available online: http://www.bom.gov.au/ (accessed on 15 April 2023).
- Meline, L.; Kavanaugh, S. Geothermal Heat Pumps—Simply Efficient. ASHRAE Trans. 2019, 125, 570. [Google Scholar]
- Batini, N.; Loria, A.F.R.; Conti, P.; Testi, D.; Grassi, W.; Laloui, L. Energy and geotechnical behaviour of energy piles for different design solutions. Appl. Therm. Eng. 2015, 86, 199–213. [Google Scholar] [CrossRef]

| Parameter | Value |
|---|---|
| Concrete pile | |
| Pile length, L | 40 [m] |
| Pile diameter, | Varies (0.5, 0.6, 0.7, 1.0, 1.2, 1.4 m) |
| Concrete thermal conductivity, | 2.1 [W/(m·K)] |
| Concrete density, | 2250 [kg/m3] |
| Concrete heat capacity, | 890 [J/(kg·K)] |
| Heat exchange pipes | |
| Material | HDPE |
| Pipe inner diameter, | 0.0254 [m] |
| Pipe outer diameter, | 0.0334 [m] |
| Pipe thermal conductivity, | 0.48 [W/(m·K)] |
| Geologic conditions | |
| Undisturbed ground temperature, | 18.2 [°C] |
| Layers thermal conductivity, | Figure 2a |
| Soil density, | Figure 2a |
| Soil heat capacity, | Figure 2a |
| Carrier fluid (Water) | |
| Fluid flow rate, q | 5.5 [L/min] in each loop |
| Thermal conductivity, | 0.586 [W/(m·K)] at 20 °C |
| Mesh | No. of Elements | Computational Time [min s] | Heat Transfer [kW h] |
|---|---|---|---|
| A | 37,912 | 06′56″ | 4390 (cooling) 3327 (heating) |
| B | 66,681 | 12′26″ | 4337 (cooling) 3298 (heating) |
| C | 121,307 | 21′35″ | 4336 (cooling) 3282 (heating) |
| D | 233,063 | 40′58″ | 4336 (cooling) 3282 (heating) |
| Case | Description | Value | |
|---|---|---|---|
| 1 | a | Ground thermal conductivity [W/(m·K)] | ~2.5 Layered (Arden site) |
| b | 1 | ||
| c | 4 | ||
| 2 | a | Concrete thermal conductivity [W/(m·K)] | 2.1 (Arden site) |
| b | 1 | ||
| c | 3 | ||
| 3 | a | Pile length [m] | 40 (Arden site) |
| b | 15 | ||
| c | 25 | ||
| 4 | a | Fluid flow rate [l/min] | 5.5 (Arden site) |
| b | 7.5 | ||
| c | 10 | ||
| 5 | a | Inner pipe diameter [mm] | 25.4 (Arden site) |
| b | 12.7 | ||
| c | 38.1 | ||
| 6 | a | Pile spacing [m] | 5 (Arden site) |
| b | 2 | ||
| c | 3.5 | ||
| Case | Total Heat Transfer (P0.5m) [kW h] | Total Heat Transfer (P1.0m) [kW h] | |||||
|---|---|---|---|---|---|---|---|
| 1/6 β | Symmetry | Difference [%] | 1/6 β | Symmetry | Difference [%] | ||
| 1 | a | 4266 | 4336 | 1.6 | 6055 | 6105 | 0.8 |
| b | 2901 | 2932 | 1.1 | 4278 | 4297 | 0.4 | |
| c | 5356 | 5463 | 1.9 | 7605 | 7693 | 1.1 | |
| 2 | a | 4266 | 4336 | 1.6 | 6055 | 6105 | 0.8 |
| b | 3586 | 3670 | 2.3 | 5480 | 5542 | 1.1 | |
| c | 4386 | 4432 | 1.0 | 6225 | 6270 | 0.7 | |
| 3 | a | 4266 | 4336 | 1.6 | 6055 | 6105 | 0.8 |
| b | 1422 | 1440 | 1.3 | 2096 | 2113 | 0.8 | |
| c | 2569 | 2606 | 1.4 | 3760 | 3784 | 0.6 | |
| 4 | a | 4266 | 4336 | 1.6 | 6055 | 6105 | 0.8 |
| b | 4362 | 4426 | 1.4 | 6202 | 6243 | 0.6 | |
| c | 4420 | 4490 | 1.6 | 6319 | 6355 | 0.6 | |
| 5 | a | 4266 | 4336 | 1.6 | 6055 | 6105 | 0.8 |
| b | 4067 | 4135 | 1.6 | 5882 | 5925 | 0.7 | |
| c | 4362 | 4432 | 1.6 | 6133 | 6191 | 0.9 | |
| 6 | a | 4266 | 4336 | 1.6 | 6055 | 6105 | 0.8 |
| b | 1748 | 1753 | 0.3 | 2645 | 2650 | 0.2 | |
| c | 3357 | 3393 | 1.1 | 4772 | 4797 | 0.5 | |
Disclaimer/Publisher’s Note: The statements, opinions and data contained in all publications are solely those of the individual author(s) and contributor(s) and not of MDPI and/or the editor(s). MDPI and/or the editor(s) disclaim responsibility for any injury to people or property resulting from any ideas, methods, instructions or products referred to in the content. |
© 2024 by the authors. Licensee MDPI, Basel, Switzerland. This article is an open access article distributed under the terms and conditions of the Creative Commons Attribution (CC BY) license (https://creativecommons.org/licenses/by/4.0/).
Share and Cite
Alqawasmeh, Q.I.; Narsilio, G.A.; Makasis, N. Impact of Geometrical Misplacement of Heat Exchanger Pipe Parallel Configuration in Energy Piles. Energies 2024, 17, 2580. https://doi.org/10.3390/en17112580
Alqawasmeh QI, Narsilio GA, Makasis N. Impact of Geometrical Misplacement of Heat Exchanger Pipe Parallel Configuration in Energy Piles. Energies. 2024; 17(11):2580. https://doi.org/10.3390/en17112580
Chicago/Turabian StyleAlqawasmeh, Qusi I., Guillermo A. Narsilio, and Nikolas Makasis. 2024. "Impact of Geometrical Misplacement of Heat Exchanger Pipe Parallel Configuration in Energy Piles" Energies 17, no. 11: 2580. https://doi.org/10.3390/en17112580
APA StyleAlqawasmeh, Q. I., Narsilio, G. A., & Makasis, N. (2024). Impact of Geometrical Misplacement of Heat Exchanger Pipe Parallel Configuration in Energy Piles. Energies, 17(11), 2580. https://doi.org/10.3390/en17112580