Review

Unconventional Fossil Energy Carrier Assessment of the Influence of the Gas Permeability Coefficient on the Structure of Porous Materials: A Review

1
Institute of Technology and Life Sciences—National Research Institute, Falenty, Al. Hrabska 3, 05-090 Raszyn, Poland
2
Department of Theoretical and Applied Electrical Engineering, Poznan University of Technology, Piotrowo 3A Street, 60-965 Poznan, Poland
3
Department of Renewable Energy Engineering, West Pomeranian University of Technology in Szczecin, 1 Papieza Pawla VI Street, 71-459 Szczecin, Poland
*
Author to whom correspondence should be addressed.
Energies 2025, 18(4), 870; https://doi.org/10.3390/en18040870
Submission received: 21 January 2025 / Revised: 7 February 2025 / Accepted: 10 February 2025 / Published: 12 February 2025
(This article belongs to the Special Issue Energy Geotechnics and Geostructures—2nd Edition)

Abstract

:
The issue of gas permeability of porous beds is important for the development of a new generation of clean energy sources, especially in the context of unconventional energy storage. Detailed experimental studies were carried out to demonstrate the gas permeability of porous materials: in situ karbonizat and natural and synthetic pumice. The measure of gas permeability was the volumetric gas flow velocity resulting from the permissible pressure difference forcing the gas flow in a given axis (X, Y, Z) on a sample of a cube-shaped porous material. A novelty is the indication of correlation with selected materials exhibiting features of unconventional energy storage. Assessment of the gas permeability coefficient for selected material features shows an increasing trend for epoxy resin, dacite, in situ carbonizate and pumice. On the other hand, for carbonate rocks, mudstones and shales, there is a decrease in gas permeability. The indicated porous materials can be storage tanks of unconventional energy carriers. In an innovative way, a material (halloysite) was indicated that has the ability to store and be a source of transport in the form of a cylindrical model (nanotube) for future implementation of isotropic features of porous materials.

1. Introduction

Many industrial processes often use gas flow through various interphase separators, especially liquid and gas phases. The selection of the type of such a separator and its internal structure has a significant impact on the hydrodynamics of the device operation. The separator is directly related to the management of the interphase surface. The most popular design solutions of these feeders are symmetrical multi-channel structures designed for a specific purpose. The channel diameters are selected depending on the gas flows volume to avoid too large local flows resistances [1,2]. Another solution is slotted separators, a variant of which is a system with a slot additionally filled with porous material [3,4]. In this example, the filling consists of materials with micrometer-sized pores or demister meshes of similar dimensions. Another area of application of porous building materials are catalytic combustion reactions carried out in structural reactors [5,6]. The group of monolithic reactors (so-called catalysts) equipped with ceramic inserts with a multi-channel structure is very diverse, and their common feature is a high density of channels and free gas flows in a large free space. On the other hand, metal monoliths are used less frequently due to difficulties in locating the catalytic substance on their surface [5]. Gas flows through a porous medium at high temperatures most often occurs in technological processes related to thermal treatment of coal, as well as during migration of natural gases (e.g., coke, activated carbon, etc. [7,8]). In the context of the diverse internal structure of the porous medium, understanding the gas flow conditions creates significant problems in describing hydrodynamics and assessing the gas flows mechanism. Knowledge of the mechanism allows for the assessment of process conditions related to the hydrodynamics of gas flows. A specific feature of porous materials is their ability to store and transport the medium as a result of internal and external forces. In the works of Aksielrud and Altszuler [9], it is stated that in millimeter and smaller pores, the process phenomenon resulting from the hydrodynamics of viscous fluid flows dominates. However, in flows through structures with pores, e.g., up to tenths of a micrometer, these phenomena are limited by physicochemical and mechanical influences of diffusion occurring at their contact surfaces [10,11]. In each case, the gas flows mechanism is closely related to the geometric structure of the porous layer. It therefore depends on the configuration and size of the pores, as well as their shape and curvature.
Generally speaking, there are two main cases of flows in porous media, as shown in Figure 1.
Figure 1a (symbols: ε—bed porosity; dε—hydraulic pore diameter; d—column diameter; Lε—actual flow path; L—column height; υε—actual velocity in the channel; Q—flow stream) shows the flow through a granular layer in the intergranular space; the space resulting from the porosity of the filling layer ε is completely accessible to flow. In Figure 1b, the flow through a porous material with a solid (skeletal) structure with empty pores occurs only in the area of open and interconnected pores and channels, and the flow area is much smaller than the absolute porosity of the material requires. Lambe and Whitman [13] note the pressure gradient coefficient, the value of which corresponds to the bed porosity ε, the hydraulic pore diameter dε and the actual flow path Lε, which results from the tubular curvature of the pores. The basis for detailed analysis of flow in porous media is still Darcy’s law [14], which in its original form describes the permeability conditions of different types of granular sediments, referring to the filtration mechanism—Figure 2 (symbols: I—height of the porous medium; Ao—bed cross-section; V—flow rate, ΔP—pressure gradient).
Considering the variability of fluid properties, the velocity in the porous bed will be proportional to the change in density ρ and inversely proportional to the change in viscosity η [15]. Then, the Darcy equation describing the flow stream Q of the porous bed takes the following, Formula (1) [15]:
Q = K A o ρ ĝ η Δ h L ; [ m 3 · s 1 ]
This formula remains one of the features of the modern description of the permeability phenomenon, although it applies only to laminar flow and Newtonian fluids. The K coefficient in Equation (1) describes the so-called permeability of a porous medium, and its value is characteristic for a given porous medium. Since the coefficient has a surface dimension, its value from the hydrodynamic point of view is very often treated as a certain geometric feature of the total permeability of the porous material. The permeability value depends not only on the filtration properties of the porous medium (its structure, particle size, density, porosity, etc.), but also on the physical properties of the liquid, especially viscosity [16]. As a rule, this coefficient does not depend on the shape and size of the bed itself. Of course, the Darcy model can also be used to describe pressure flows; for Equation (1) we obtain (2) [15]:
Q = K A o Δ P η L ; m 3 · s 1     K = η Q A o L P ; [ m 2 ]
For a given volumetric flow rate Q, the permeability of a porous layer can be determined experimentally if the fluid properties η and the geometric parameters of the flow system Ao are known. The pressure gradient ΔP across the layer is then an experimental value. Knowing the hydrodynamic parameters (flow rate, pressure gradient, material porosity and type of gas), the value of the permeability coefficient can be determined experimentally (3) in our own model (developed by Grzegorz Wałowski):
K = Q P z m ρ ; [ m 2 ]
For the development of a new generation of clean energy sources, especially in the context of unconventional hydrogen storage, it is important to expand the previously unrecognized knowledge in the field of gas hydrodynamics assessment in porous media.

2. Materials and Methods

Permeability tests were conducted on materials with average porosity ranging from 45% to 88% [17]. The research material consisted of various types of solid skeleton structures: in situ carbonization from heat treatment of hard coal and natural and synthetic pumice, analyzed in detail in the work of Wałowski and Filipczak [17], in which the influence of anisotropy on the directional dependence of gas permeability was demonstrated.
For the selected bulk materials, the results of hydrodynamic tests were compared in relation to in situ carbonization of pumice (natural and synthetic). The ranges of porosity and fluid flow rates through such materials were indicated. The resistance to gas flow through granular and porous deposits was compared.
In addition, fluid permeability models were developed that can be used in simulations and real conditions. The computational models were analyzed taking into account hydrodynamic phenomena. For the selected characteristic deposit materials, comparisons were made with the tested materials: in situ carbonization of pumice. A graphical comparison was made, taking into account the gas permeability coefficient related to the flow resistance. The probable convergence of halloysite nanotubes with biogas production was indicated.

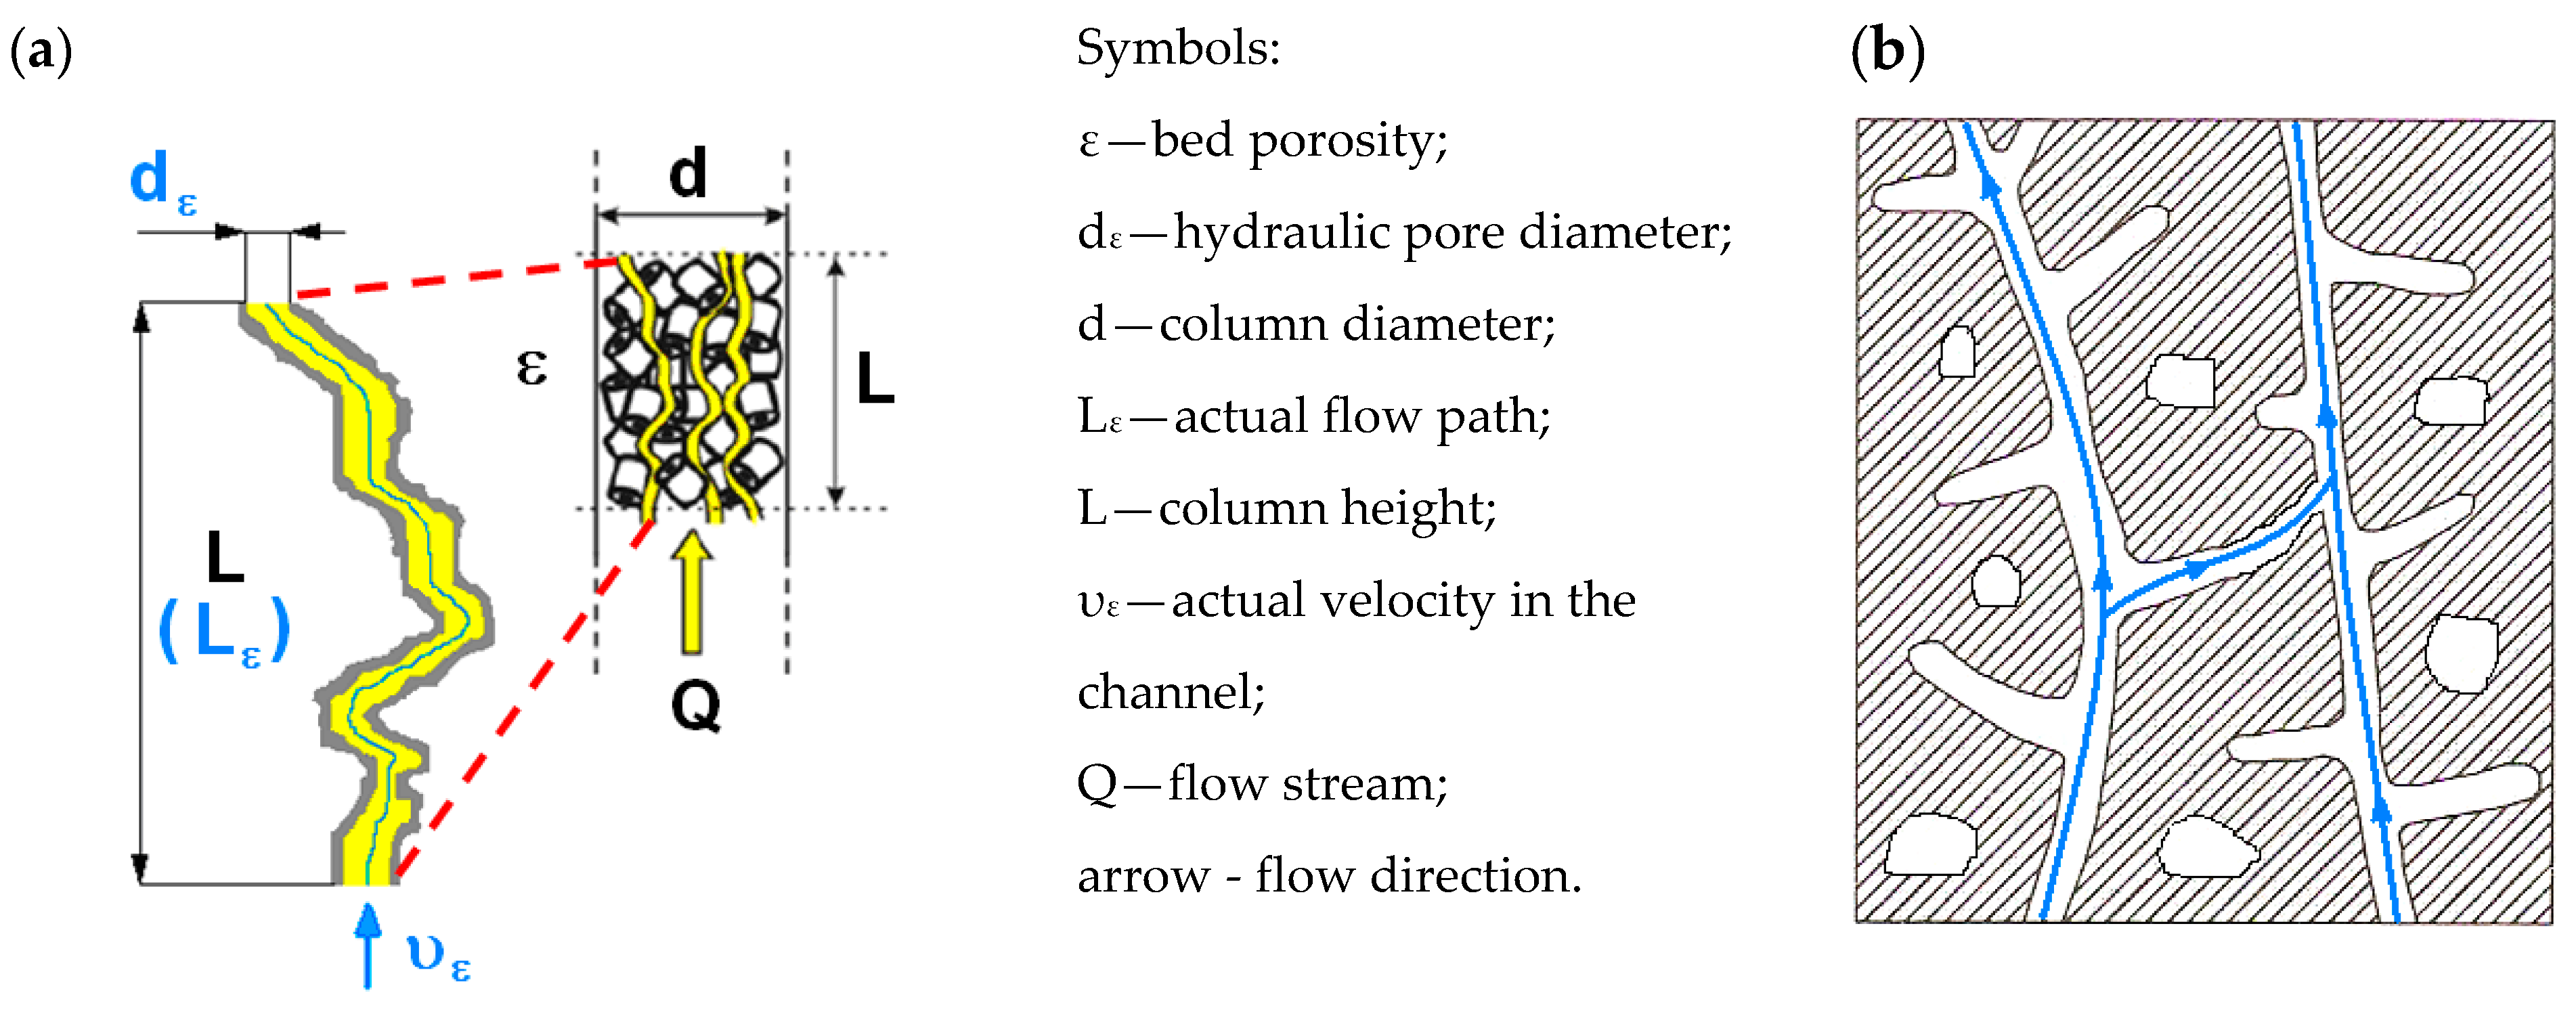
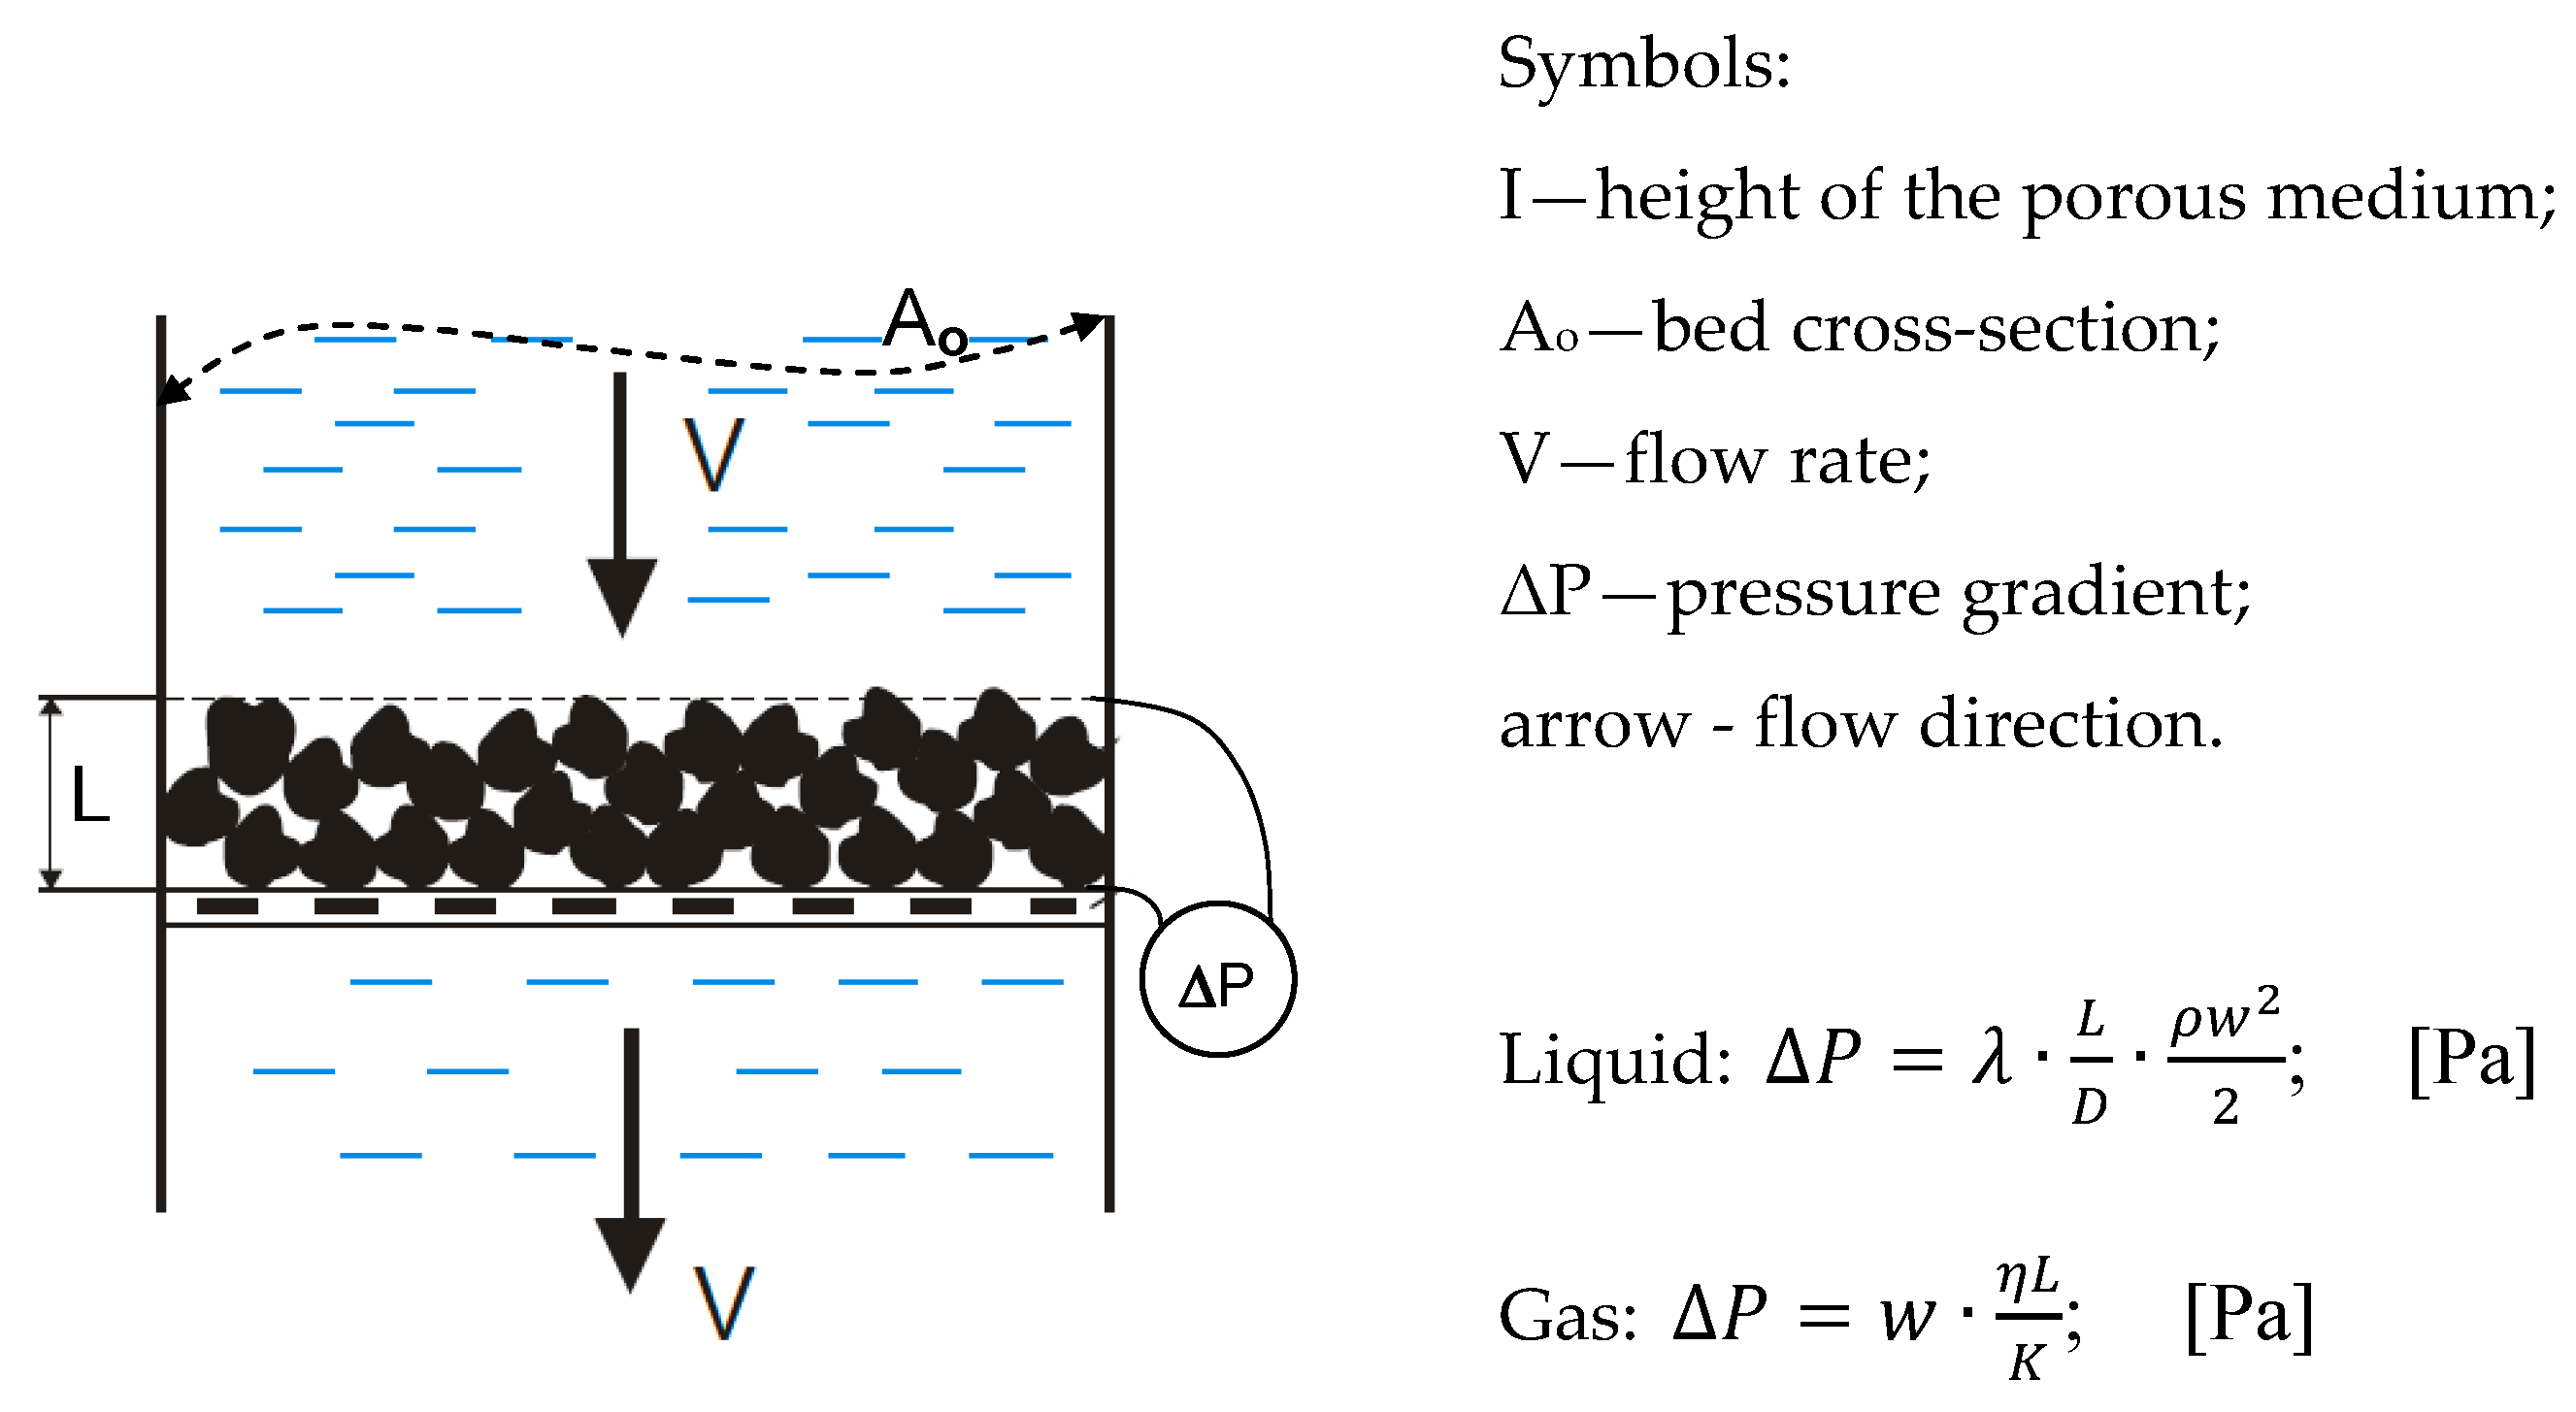
2.1. Experimental Stand

The tests were carried out on a specially designed stand [18], the basic element of which is a flow channel into which a sample of porous material is introduced—Figure 3. The current work refers to previously studied porous materials of isotropic character, indicating the aspect of implementing gas permeability in correlation to selected porous materials demonstrated by the literature review.
In each case, the gas flow through the sample was in the pressure-free regime, with the reference pressure on the reduction valve in the range 0.04–0.4 MPa, and free gas flow to the environment. The pressure gradient in a given measurement system was measured using liquid differential manometers, installed in the flow measurement system before the gas inlet to the material sample. The gas flow was measured using float rotameters, which were calibrated using a bellows gas meter before the start of the tests. The measurement system, or more precisely the structure of the permeability meter used for directed gas flow along the selected sample axis (X, Y, Z), is designed to test the permeability of samples in the form of a cubic body in any direction of its axis, which is possible thanks to the use of a special measuring cell sealing system, enabling the measurement of permeability in any direction (X, Y, Z).

2.2. Scope and Research Methodology

Detailed experimental studies were conducted to demonstrate the gas permeability through porous materials (including in situ carbonization—Figure 3a, natural pumice—Figure 3b and synthetic pumice—Figure 3c) with different structures and process characteristics. The measure of gas permeability was the volumetric gas flow rate resulting from the permissible pressure difference forcing the gas flow in a given axis on the porous material sample. The test samples were cubic in shape, and the design of the flow channel enabled the measurement of gas permeability for each of the main flow directions: X, Y, Z (Figure 3d). By rotating the cubic sample by 90° in the selected measurement plane [17], gas permeability tests were carried out using air as the working medium. The Round-Robin test is indicated for measurements, analyses or experiments performed independently several times, and this was also the case in our experiment. On the other hand, the test may involve many independent scientists performing the test using the same method with different equipment or different methods and equipment. In reality, it is often a combination of both variants, for example, if a sample is analyzed or one (or more) of its properties are measured by different laboratories using different methods, or even simply by different equipment units of identical design. In this case, the sample of the test material was tested depending on the flow direction on the same device, so three measurements were made at four reference pressures for three test materials. The presented research involves unique research on a patented device, which is available with the consent of the originator (Prof. G. Wałowski) and which can be used with the help of a granted license due to legal protection (patent [17]). The analysis of basic physicochemical data on the mechanical properties of aliphatic hydrocarbons and hydrogen, generally known and tabulated, indicate dramatic differences in the context of transport through porous media.
This article presents the process problems of gas flow through porous media and reviews research on selected methods of describing the hydrodynamics of gas flow through porous media. The aim of the current work is to recognize the literature in relation to gas permeability, compare the research material in the context of the occurring correlations with selected granular materials and natural or synthetic materials exhibiting the characteristics of energy storage. By demonstrating available gas permeability models and associating our own model, we consequently demonstrate the dependencies for equations related to flow resistance in the power system. Consequently, we indicate a material (halloysite) that is able to store and is a source of transport in the form of a cylindrical model (nanotube) for future implementation of isotropic features of porous materials.

3. Results and Discussion

Research on the gas permeability of porous deposits most often concerns model column systems loaded with a deposit of this type. Experiments for skeletal systems are more difficult to implement, which is reflected in the small number of publications in this field (Table 1); the results of only selected works allow for a quantitative assessment of the quality of deposits in terms of flow resistance [19,20,21,22]. Table 1 also includes Wałowski’s works in this field.
Figure 4 illustrates the results of the experiments [19,20,21,22] cited in Table 1, including Wałowski’s.
Figure 4 deliberately presents the results of experimental studies for in situ char, related to the directional gas flow (XYZ). Attention is drawn to the importance of the gas permeability phenomenon in the aspect of carbon dioxide sequestration in geological deposits. It can be seen that in situ char is characterized by the highest permeability for air; the pumice stones show a much lower permeability limit. With a relatively high porosity of materials (synthetic pumice as much as 88%), this indicates a very large limitation of free space for gas flow, which is undoubtedly caused by a large share of blind and closed pores in the structure of these materials. In all other cases, the permeability characteristics related to the individual flow directions indicate a clear anisotropy of the structure of the tested materials. It is worth noting that the characteristics of gas permeability through a porous material are directly related to the values of the pressure gradient that occurs at a given gas stream on a given porous bed. Most of the theoretical considerations resulting from this are based on models of rectilinear channels and on Poissuille’s law (laminar flow), and even more often, on models identifying a porous medium, with a skeletal form, with a granular bed, with the same features and flow parameters of the bed. These models most often take the form of correlation equations, verified under specific process conditions. The results of this comparison show that the possible adaptation of computational methods (models) characteristic of porous granular beds does not provide sufficient grounds for using these methods in describing the hydrodynamics of gas flow through skeleton (solid) porous beds. The main reason for this state of affairs should be sought in the fact that porous materials with a skeleton structure are characterized—and this is confirmed by the results of our own research—by gas permeability that is disproportionately lower than the calculated value as it results from the potential scale of porosity of this material. As has been emphasized many times, this is caused by the presence of numerous blind pores and channels closed to gas flow in porous skeleton materials. As a result, pressure losses on the bed of porous skeleton material, both those that may be related to friction losses and losses resulting from velocity profile disturbances (local), differ from those characteristic for full-section flow resulting from the porosity of the bed.
They are limited to a “directed vertical area” (velocities from 0.01 to 0.5 m∙s−1, resistances from 0.005 to 100 kPa). Since the physical nature of the studied phenomenon depends on many deposit parameters, the results of the cited works demonstrate the varied computational complexity of flow resistance. The formation of a “directed horizontal region” is characteristic of skeletal deposits (velocities from 0.01 to 5 m∙s−1, resistances from 0.7 to 150 kPa). In this region, the in situ char is characterized by the largest number of fractures, while the two pumices distinguish open and closed pores. The article presents all the flow cases shown in Figure 1. Of course, for loose (granular) deposits the flow (Figure 1a and Figure 2—Darcy’s model) shown in Figure 4 was assumed. On the other hand, for skeletal deposits (research material—Figure 3) the flow (Figure 1b) shown in Figure 4 was assumed. It was in Figure 4 that the correlation for flows was made.
Professor Wałowski had already previously analyzed porous materials in the works [17,18], demonstrating their anisotropy. In the current work, however, the focus was on the application of model (3), which was used already in 2013 to determine gas permeability, and this model was again demonstrated due to the aspect of an attempt to implement for the universal application of the model and its reference to other models shown in this paper.
The distribution of points shows that the framework materials analyzed in our own research are characterized by relatively the highest flow resistances, comparable to other materials. The permeability resulting from this comparison is represented by the gas velocity, which was in all cases converted to the average flow conditions resulting from the computational porosity of each analyzed deposit. The purpose of our own research referred to in Table 1 and presented in Figure 4 is to indicate the relationship between the porosity and cross-sectional area in relation to the velocity that determines the flow.

3.1. Gas Permeability Mechanisms Based on Models

An overview of the mechanisms of fluid permeability is given in Table 2 (Appendix A).
In the work by Khasanov and co-workers [23], the process of replacing hydrated CH4 with CO2 during injection into a porous medium was analyzed. Based on the model describing the kinetics of mass and heat transfer, it was noticed that for areas described by high values of the diffusion coefficient for the hydrate and low permeability values for the deposit itself, in proportion to its length, the discussed process will proceed head-on.
Haghi and co-workers [24] studied changes in the hydrodynamic properties of Berea sandstone under isothermal conditions (T = 313.15 K; pmax = 30 MPa). For the N2/H2O model system, it was confirmed that porosity, absolute permeability, drainage relative permeability and drainage capillary pressure depend on the effective stress.
Experimental results from Jiang and co-workers [25] and Guo and co-workers [26] on the rheological properties of dacite show that this material exhibits the characteristics of a porous medium when subjected to long-term confining pressure under loading conditions. The consequence of this is an inverse proportionality between permeability and gas pressure. Dacite is a relatively dark, neutral, hypabyssal, subvolcanic or extrusive rock with a mineral composition similar to granodiorites. The mineral composition is dominated by sodium feldspars. Subordinately, pyroxenes, quartz and biotite may occur in dacites. The remaining features of the rock are common to other porphyries [26].
The work by Ma and co-workers [27] presents the results of research on the drag forces acting on porous spherical particles with uniform porosity, in a wide range of relative permeability (β). It was concluded that the medium prepared by the given method can be used to measure the drag coefficients of porous permeable spheres in a wide range of Reynolds numbers and β, including the interactions between porous particles and the fluid.
The isothermal-scale pore network model for reverse gas flow in porous media with a large number of capillaries by Santos and Carvalho [28] shows a change in the gas flow pattern (from single- to two-phase) in the core ring, in the critical state. The predictive ability of the model for two-dimensional networks was confirmed.
The numerical model by Seitz and co-workers [29] for a solid substrate, parameterized by porosity and permeability, effectively predicts the reaction efficiency for a wide range of variable values.
In the work by Yoon and co-workers [30], the capillary pressure hysteresis and relative permeability in porous media were modeled in terms of the plasticity theory. The results in terms of shrinkage and stability of the computational flow are promising.
The article by Chalykh and co-workers [31] is devoted to the analysis of the kinetics of sorption, permeability and diffusion of water vapor in porous polymer membranes with different hydrophilicity and through porosity, based on the Zolotarev–Dubin theory.
Porous alumina (Al2O3) materials, formed in situ, were prepared using pure cement (calcium source) by Xiong and co-workers [32]. The demonstrated strong positive correlation between pore structural parameters and permeability coefficients confirms the very good fractal properties of the tested material. Apparent porosity and pore size distribution also had relatively high correlation coefficients with permeability.
In turn, Civan [33], in a work devoted to the issue of the influence of the quality of the formulation of similar research systems, showed the difficulties resulting from the strongly nonlinear nature of the pressure relationship for the flow of compressible diluted gas in tight channels. These difficulties were partially overcome by introducing a novel integral transformation.
From Wu and co-workers [34], the research result of the blocking effect of injection into crude oil (for oil and gas it is an indication of the mechanisms that operate in a given porous model) reservoirs in the CO2/N2 system shows that the injection of N2 can effectively maintain the reservoir pressure while weakening the CO2 recovery efficiency. On this basis, a closed bed model with two pores was developed, validated for very low permeability.
The performance of the triple-pore network model by Rabbani and co-workers [35], composed of a single pore network model coupled with cracks and micro-porosities, was compared with dual-pore network models and analytical solutions. For tight pore flow under conditions of significant Knudsen diffusion and slip, the model provides a more accurate solution compared to the two-pore model.
The research reported by Ghanbarian and co-workers [36] examined the effective center approximation approach and the universal power-law scaling law. Comparisons with the results of simulation calculations and the results of empirical research allowed us to conclude that in the absence of microcracks, the discussed model correctly estimates the ring in shales and porous rocks.
From Chittenden and co-workers [37], a fully coupled hydromechanical model for the case of gas flow through expanding capillaries in saturated bentonite allows approximate spatial discretization. The advantage is a good reproduction of empirical data. Good agreement between model results and experimental data can be obtained by calibrating several key parameters, which also provide a good fit to the additional data set.
Research on the diffusion and reversible adsorption of gas in carbon particle clusters by Peng and co-workers [38] focused on the influence of the adsorption layer on the mass transport process, based on the Langmuir approach.
In the work by Zolotukhin and Gayubov [39], the applicability of Darcy’s and Forchheimer’s laws was checked. Departures from Darcy’s law depend on the value of the Forchheimer number. In turn, the use of the Forchheimer number in a semi-analytical approach allows us to describe the flow within an approximation broader than Darcy’s.
The article by Moreno and co-workers [40] proposed a method of calculating dependent effective curves as functions of flow rate in a semi-analytical approach, in the steady state, by calibrating the one-dimensional structure examined for the purposes of modeling spatial flow.
When Jannot and co-workers [41] describe the method for measuring permeability and porosity in the transition state, the simplifying model assumption is to assume gas compressibility as a constant. The aim of the developed model is to predict the behavior of heterogeneous materials, including anisotropic ones.
The issue of the process of total pressure gradient in a porous bed was considered in terms of the change in the Reynolds number by Wałowski [42]. Comparison of the value of the determined flow resistance coefficient (in situ char) with the gas stream, and the total pressure gradient in the bed, were empirically determined. The adopted approach applies to a solid body of any shape.
The apparent gas permeability model by Wu and co-workers [43] was derived for actual flow in fractured porous media, taking into account the mechanical characteristics of the material. The assumptions of the fractal system for the described phenomenon fit well with the laboratory data.
In the work by Wałowski on gas permeability through a porous material based on polyamide, the k-turbulence model was tested [44]. On its basis, the anisotropic nature of the tested medium was confirmed.
A numerical model by Khoei and co-workers [45] describing the thermohydromechanical process taking into account the phase change in a fractured heterogeneous medium, based on the assumptions of finite element theory, was used to study multiphase fluid flows, heat transfer and the distribution of small strains.
The work of Mrazík and Kříž [46] presents a nonlinear description of gas permeability as a function of pressure for the graphene oxide (GO) medium. The dependence of the polytropic exponent on the molecular nature of the gas was confirmed.
The research presented in Jia and Cui [47] examined the consequences of pulse decay on one shale core under variable pressure conditions on the relationship between gas permeability and experiment duration. The gas pressure diffusivity was shown to be dependent on the pore gas spreading efficiency. Moreover, it was noticed that the determination of permeability at lower pore pressure depends more on the pulse size.
In the course of testing the macroporous and microporous properties of nanotubes by CH4 diffusion, it was found that the importance of surface diffusion increases with decreasing pore size, also demonstrating their isotropic nature. Interestingly, the decrease in pressure in the beds during the experiment was accompanied by a change in the relative contribution of adsorption and diffusion to the mechanism of the phenomenon, as shown by Afagwu and co-workers [48].
An extensive thermo-hydraulic-chemical numerical model by Gao and co-workers [49] to describe temperature changes and the sublimation phenomenon during underground coal gasification was assessed as effective, taking into account the temperature increase and variability of the synthesis gas composition.
The heap permeability model was verified (CH4) under experimental conditions. The concentration of the gas used increases with increasing distance from the front. It was also noticed that the gas concentration decreased as the distance from the bottom of the seam increased. In the numerical simulation, the permeability model of the porous medium is part of it, and the boundary conditions of the numerical model are set according to the experimental conditions. The model was rated as useful by Liu and co-workers [50].
The suitability of the hybrid model was investigated by Becker and co-workers [51] by modeling H2 storage in a heterogeneous medium. A feature of the model is its strong temporal and spatial adaptability compared to the full-scale model. It is also numerically more efficient.
Based on wavelet theory, a set of numerical methods useful in oil mining applications was developed. Validation by Wang and co-workers [52] was based on (i) a one-dimensional analytical solution and (ii) comparison with higher-dimensional simulation results.
The permeability of a single-layer sieve with different numbers of holes and diameters was tested using experimental methods and numerical simulation by Tan and co-workers [53]. The result proves that the relationship between the product of the loss coefficient and the Re number and the hydraulic diameter at the intersection of longitudinal and horizontal conduits is close to linear.
A three-dimensional network model of a nano- and microporous deposit (shale gas) was checked in terms of the physics of the process. The estimated apparent permeability for low pressure areas is much higher when the model is more broadly parameterized, as shown by Mehmani and co-workers [54].
In a paper Zhao and co-workers devoted to the problem of the presence of water in the pores of a mineral deposit based on the correction to the Knudsen number, a model description of apparent permeability (shale gas) was given. The positive effect of the pressure gradient on fluid flow is shown. High pressure conditions promote phase enrichment of the test substance [55].
The paper by Li and Chen [56] discusses a method to calculate β by modeling gas and water flow by generating a random three-dimensional micropore network. Comparison with empirical data proves that the value of the non-Darcy coefficient decreases with increasing average pore radius, fractal size, irreducible water saturation and tortuosity.
The research by Zolotukhin and Gayubov [39] was devoted to the description of fluid flow in a porous medium in terms of the recently proposed semi-analytical equation. This model effectively captures effects that deviate from Darcy’s law in low permeability media. The Klinkenberg coefficient is described as dependent on the chemical structure of the gas and the properties of the medium.
The paper by Li and co-workers [57] proposes a technique for solving nonlinear (systems of) equations, regardless of their nature (Newton–Raphson algorithm) associated with damage, which enables the description of quasi-brittle cracks in porous-elastic media. The work by Lysyy and co-workers [58] presents the results of research on the hysteresis of hydrogen and water permeability through sandstone (steady state).
Transport coefficients were determined for single-phase flow in networks of rigid spheres distributed on the walls of model chambers by Galteland and co-workers [59]. The porosity-dependent Klinkenberg effect has been proven.
The Monte Carlo method describes the physics of dilute gas flow in supernanoporous materials in a work by Shariati and co-workers [60]. The model takes into account the morphological features of the deposit during gas flow under low pressure conditions. It is shown that the ratio of apparent permeability to internal permeability, hydraulic tortuosity and surface friction coefficient is inversely proportional to the porosity of the material. On the other hand, the surface friction coefficient and apparent permeability increase with increasing wall heat flux.
The work by Shi and co-workers [61] describes a model of the permeability of cement materials reflecting the Klinkenberg effect. Moreover, this model allows predicting the internal and apparent permeability of various gases and porous media.
The discussion on the characteristics of models of gas permeability through porous media must be based on two pillars: (i) including all significant phenomena within the modeled system, i.e., within the gas phase, as well as at the interface of phases (we ignore interactions within the solid phase of the deposit because they are responsible for the cohesion of the material, i.e., a property that cannot be modeled); (ii) selection of an appropriate set of model systems (in practice, several gases for a given deposit), representing a wide range of behavioral variability.
Generally, the characteristics of gas flows (generally liquids) through the channels are driven by intermolecular interactions, basically exclusively of a non-covalent nature. It is assumed that there are no chemical reactions that lead to the breaking of existing chemical bonds and the creation of new ones within the molecules of the gases in question (in particular those forming the walls of the deposits). Under gas flow conditions, non-binding intermolecular interactions occur. From the point of view of the nature of the problem, these will not be electrostatic interactions (ion–ion) but (potentially, depending on the chemical nature of the gas used) hydrogen bonds and/or interactions between two permanent dipoles (these may be molecules having a permanent dipole moment, but not proton acceptors or donors). In the context of interactions limited to the gas phase, consideration of van der Waals forces, i.e., including permanent and induced dipoles, is important when at least two gases whose molecules differ in polarity are passed through porous beds simultaneously; since the models are tested simultaneously using pure substances and not mixtures, this option can be rejected. Finally, the weakest of the non-covalent interactions, London dispersion forces, which are also the most common, define the transport properties of gases even with simple molecules (N2), i.e., those close to the model concept of an ideal gas, or gases occurring in atomic form (He, Ar, Ne).
The macroscopic reflection of the discussed interactions is viscosity, which is a consequence of internal friction between fluid layers. Of the models mentioned in the article, the mathematical formalism of only some of them covers this phenomenon explicitly. It should be expected that only for phases under relatively low pressures the effects of internal friction can be neglected, which in turn seems to be a condition different from the actual approach to the problem.
From the point of view of the discussed problem, adhesion remains an important phenomenon, which is the cause of differences in the viscosity of substances. Considering adhesion only through the prism of London forces allows it to be related to a fundamental quantity, which is polarizability (α), i.e., a measure of the ability of a given chemical entity (molecule, atom, ion) to dislocate the electric charge under the influence of a change in the electric field, caused, for example, by the presence of other entities (polarizability is the defining component of the dipole moment). The classic Chapman–Enskog theory can be helpful in assessing the share of viscosity in flow modeling, as it is based on fundamental quantities, not empirical assumptions, which allows for the derivation of a universal theory.
Unfortunately, only selected works attempted to include such important quantities as viscosity in the models. Importantly, in the analyzed works it was not even decided to estimate the adhesion strength.
To solve the problem of gas permeability through porous material, the chemical nature of the gases must also be approached. Since these models are most often developed for components of fossil fuels (hydrocarbons), it is not surprising that research is carried out using CH4 (at this point it is worth considering the lack of literature reports for representatives of the homologous series of alkanes). The methane molecule is a good object for modeling because it does not have a permanent dipole moment. In this context, a question may be asked about the prospects of using fluorine and chlorine derivatives for comparative research on modeling the permeability of this gas (the limiting factor is the limited volatility of some such compounds). Such experiments could demonstrate the influence of molecular polarity on mechanical properties.
In addition to CH4, H2 and N2 are often chosen as working gases. Molecules of these chemical compounds are not involved in the implementation of strong intermolecular non-covalent interactions and do not have a strong affinity for the deposit. CO2 molecules, which are present in real mixtures of fossil fuel deposits, may behave in the opposite way. Moreover, nitrogen compounds (amines and NH3) are also components of such mixtures. They are generally polar, qualitatively similar to the compounds of oxygen (H2O, cyclic and chain ethers) and sulfur (H2S, thioethers) that pollute fossil gases. This problem highlights the need to develop a model that is resistant to the accepted limitations of describing gases without taking into account their chemical nature, but only depending on pressure and temperature conditions.
Figure 5 is an illustration of characteristic gas permeability curves, indicating a common area of flow resistance, for different ranges.
Polymer claddings show similar efficiency in storing hydrogen as salt rocks, although still lower than steel Gajda and Lutyński [62]. Equation (73) is as follows:
K V = 1 · 10 15 · P 0.9654 ; [ m 2 ]
Concrete-based materials, on the other hand, have much higher permeability and are not effective. Model calculations of the mechanisms of the discussed phenomenon allow you to easily assess the usefulness of synthetic polymer materials. Validation by Jiang and co-workers [25] of these models involves comparison with corresponding Ar experiments. On their basis, it was possible to predict the positive effect of high pressures on the insulating effectiveness of coatings, demonstrated in Equation (74):
K V = 5 · 10 17 · P 0.1786 ; [ m 2 ]
CH4 flow simulation results in the D-PNM and T-PNM models by Rabbani and co-workers [63] for three heterogeneous carbonate rocks showed the inefficiency of isolation under low-pressure conditions in the T-PNM approximation. Gas permeability is relatively less sensitive to temperature changes compared to pressure, shown by Equation (75):
K V = 1 · 10 11 · P 0.067 ; [ m 2 ]
A proposal by Ahmadi and co-workers for the analytical description of the apparent gas permeability of a porous medium consisting of fractures with a tortuous structure is given in [64], disregarding the roughness of the fracture walls and taking into account the uniform distribution of pores. The existing model was compared with values predicted by the apparent fractal permeability model. The given model well reflects the described phenomenon in the case of highly porous assembly media. Greater relative roughness results in a smaller fracture opening and greater flow resistance, resulting in lower apparent gas permeability, shown in Equation (76):
K V = 3 · 10 15 · P 1.012 ; [ m 2 ]
In the presented study by Afagwu and co-workers [65], a semi-analytical permeability model was developed for shales and tight deposits, for which the effects of reversible adsorption were investigated. Surface diffusivity, pore diffusion, apparent permeability in Equation (77) and correction factor were predicted for all models:
K V = 2 · 10 14 · P 1.046 ; [ m 2 ]
The distribution of experimental points (Figure 5) shows that the permeability of the research materials depends significantly on the directionality of the gas flow. This indicates a clear influence of the asymmetry of the permeability of the porous bed in relation to the selected flow direction (axis). The gas permeability characteristics also show that despite the porosity of 40.3% for the in situ char, it has similar characteristics. This is confirmed by the observation that the greater impact of char permeability in situ results more from their fractured structure than from the scale of their porosity. Interestingly, for in situ char, the permeability characteristics are also nonlinear within the measurement range, which indicates the advantage of turbulent gas flow over its laminar movement. Equation (78) is as follows:
K V = 6 · 10 8 · P 0.3321 ; [ m 2 ]
With the relatively high porosity of the materials (synthetic pumice 88.1%, Equation (79), and natural pumice 63.3%, Equation (80)) in relation to carbon in situ, it should be noted that the free space for gas flow is very limited, which is undoubtedly due to the large share of pores in the structure of these materials blind and closed to flow:
K V = 2 · 10 11 · P 0.7825 ; [ m 2 ]
K V = 8 · 10 12 · P 0.7831 ; [ m 2 ]
Regardless of the gas permeability coefficient (Figure 5), these materials constitute a group of materials with high permeability.
It is worth noting that the characteristics of gas permeability through a porous material are directly related to the pressure gradient values that occur in a given porous bed at a given gas stream. Most of the theoretical considerations resulting from this were generally based on straight-axial channel models and Poissuille’s law (laminar flow), and even more often on models identifying a porous medium in a skeletal form with a granular bed with the same characteristics and flow parameters fold. These models are most often in the form of correlation equations, verified under specific process conditions.
Porous materials with a skeleton structure are characterized—as confirmed by the results of our own research—with gas permeability that is disproportionately lower than the calculated value, which results from the potential scale of porosity of this material. As has been repeatedly emphasized, this is due to the presence of numerous blind pores in the porous framework materials and pores closed to gas flow in the channels. As a result, pressure losses in a bed of porous material with a skeletal structure, both those related to friction losses and losses resulting from the disturbance of the velocity profile (local), differ from those typical for a full-section flow resulting from the porosity of the bed. Taking into account Figure 5, Equations (73)–(80) are presented, from which results the division into two groups with a tendency of decreasing and increasing gas permeability. In the region of decreasing gas permeability, Equations (75)–(77) dominate, while in the region of increasing gas permeability, Equations (73), (74) and (78)–(80) are key. The phenomenon of “twin gas permeability” was observed for Equation (73) with respect to Equations (79) and (80) for Kv equal to 10−8. It results in the flow resistance for pumice being of the order of magnitude from 104 to 105 Pa with respect to epoxy resin from 106 to 107 Pa. In this way, the gas permeability mechanism for isotropic pumice can be correlated with the hydrogen storage for epoxy (polymer).
The presented state of research refers to the verification of gas permeability models, at the same time indicating the potential application of energy carriers. Innovation refers to the developed model in Equation (3), thanks to which it is possible to universally measure gas permeability in the context of future identification of materials necessary for energy storage.
The essence of the article is the issue of hydrogen storage, not fossil energy carriers. Moreover, the presented literature is intended to provide only a sketchy insight and point out the differences in technological development in the use of conventional and renewable energy carriers.
When analyzing Figure 5, it is worth observing the trend of increasing permeability for epoxy resin, dacite, in situ char, synthetic pumice, natural pumice and the trend of decreasing permeability for carbonate rocks, mudstone and shales. The reason for such a situation is caused, among others, by the porosity of materials constituting a reservoir for conventional deposits, in which permeability occurs at the following levels: low 0.1–1.0 mD; moderate 1.0–10.0 mD; and high, above 10.0 mD. On the other hand, for unconventional deposits, permeability occurs at the following levels: extremely compact, below 0.001 mD; very compact 0.001–0.01.0 mD; and compact 0.01–0.1 mD.
A gas reservoir can be defined as a “tight” type if the permeability of gas-bearing rocks is below 0.1 mD (0.1 mD ≈ 1 × 10– 16 m2). This definition is commonly used; in the case of pore spaces for which the radii of the connecting channels are greater than 100 nm, the flow model does not change. This is still Darcy’s law with Klinkenberg’s correction for the so-called slippage [66]. Rocks with permeabilities below 0.1 mD, i.e., tight-type rocks, are constructed in this way. These rocks are characterized, similarly to conventional formations, by the regular development of pore spaces. In the German oil industry, it was assumed that the average effective permeability of a “tight gas” reservoir (for gas) is not less than 0.6 mD. In this situation, determining the degree of rock permeability for gas in a given type of reservoir (sandstones or carbonates)—with existing or not natural fractures—may depend on their various properties, e.g., grain size. There are also reservoirs referred to as “ultra tight” with permeability below 0.001 mD. The necessary conditions for the formation of such gas accumulations are low permeability of the reservoir rock, anomalous pressure, gas saturation (i.e., the existence of a generation-reservoir system) and the absence of underlying water (occurring below the reservoir layer or along its slope). During gas generation, water is displaced in whole or in part, and if there is a zone of deteriorating permeability in the gas-saturated reservoir, the water acts as a seal, referred to as “capillary pressure seals”. A water barrier in tight reservoirs is created as a result of capillary pressure, the size of which depends on the permeability and lithology of the rocks (type of intergranular spaces or microfracture system) of the given reservoir. The permeability of shale rocks is a function of, among other things, mineral composition, porosity, temperature, overburden pressure and formation pressure. Production shale wells usually show a very rapid initial decline in production (gas flow from fractures), followed by a phase of slow, gradual decline in production (desorption and transport of gas from pores to fractures). Therefore, the permeability of shale rocks should be considered in the context of fracture permeability and rock matrix permeability [18]. The permeability of the rock matrix of clay-mudstone rocks is influenced by diffusion flow, which takes place in very small pores, and advective flow in larger pores and microfractures. The permeability of the rock matrix depends, among other things, on the overburden pressure and pore pressure. Due to the plasticity of clay-mudstone rocks, significant deformation of the pore space may occur in them, depending on the pressures acting on the rock. The rock extracted to the surface is expanded, which may lead to a change in the distribution of pore diameters, and thus significantly affect the flow of fluids [66]. The factor influencing the value of the permeability coefficient is the type of fluid. For carbonate rocks and shale rocks, the differences in permeability coefficients are related to the difference in the size of gas molecules, the Klinkenberg effect, as well as sorption in the rock matrix. The Knudsen number is an indicator of the mechanisms controlling flows in the pore space. The largest deviations from Darcy’s law occur at low pore pressures and small pore diameters, so they cannot be ignored in the analysis of flows through shale formation rocks. Due to the distribution of pore diameters in shale rocks, slip flow in pore channels and phenomena occurring in the transition zone between slip flow and molecular diffusion dominate.
As a curiosity, it is worth pointing out that permeability anomalies often occur; for example, in the case of two rocks with the same absolute permeability, the first of which has low porosity but has pore channels of a relatively large diameter, and the second has more smaller pores, the probability of a gas molecule colliding with the pore wall instead of another gas molecule is greater in the second rock, and thus the sliding effect is more visible. This fundamental relationship allows the use of the sliding effect measurement to analyze the effective pore diameter. The issue is still being analyzed and interpreted, undertaken by the team led by Prof. Wałowski.

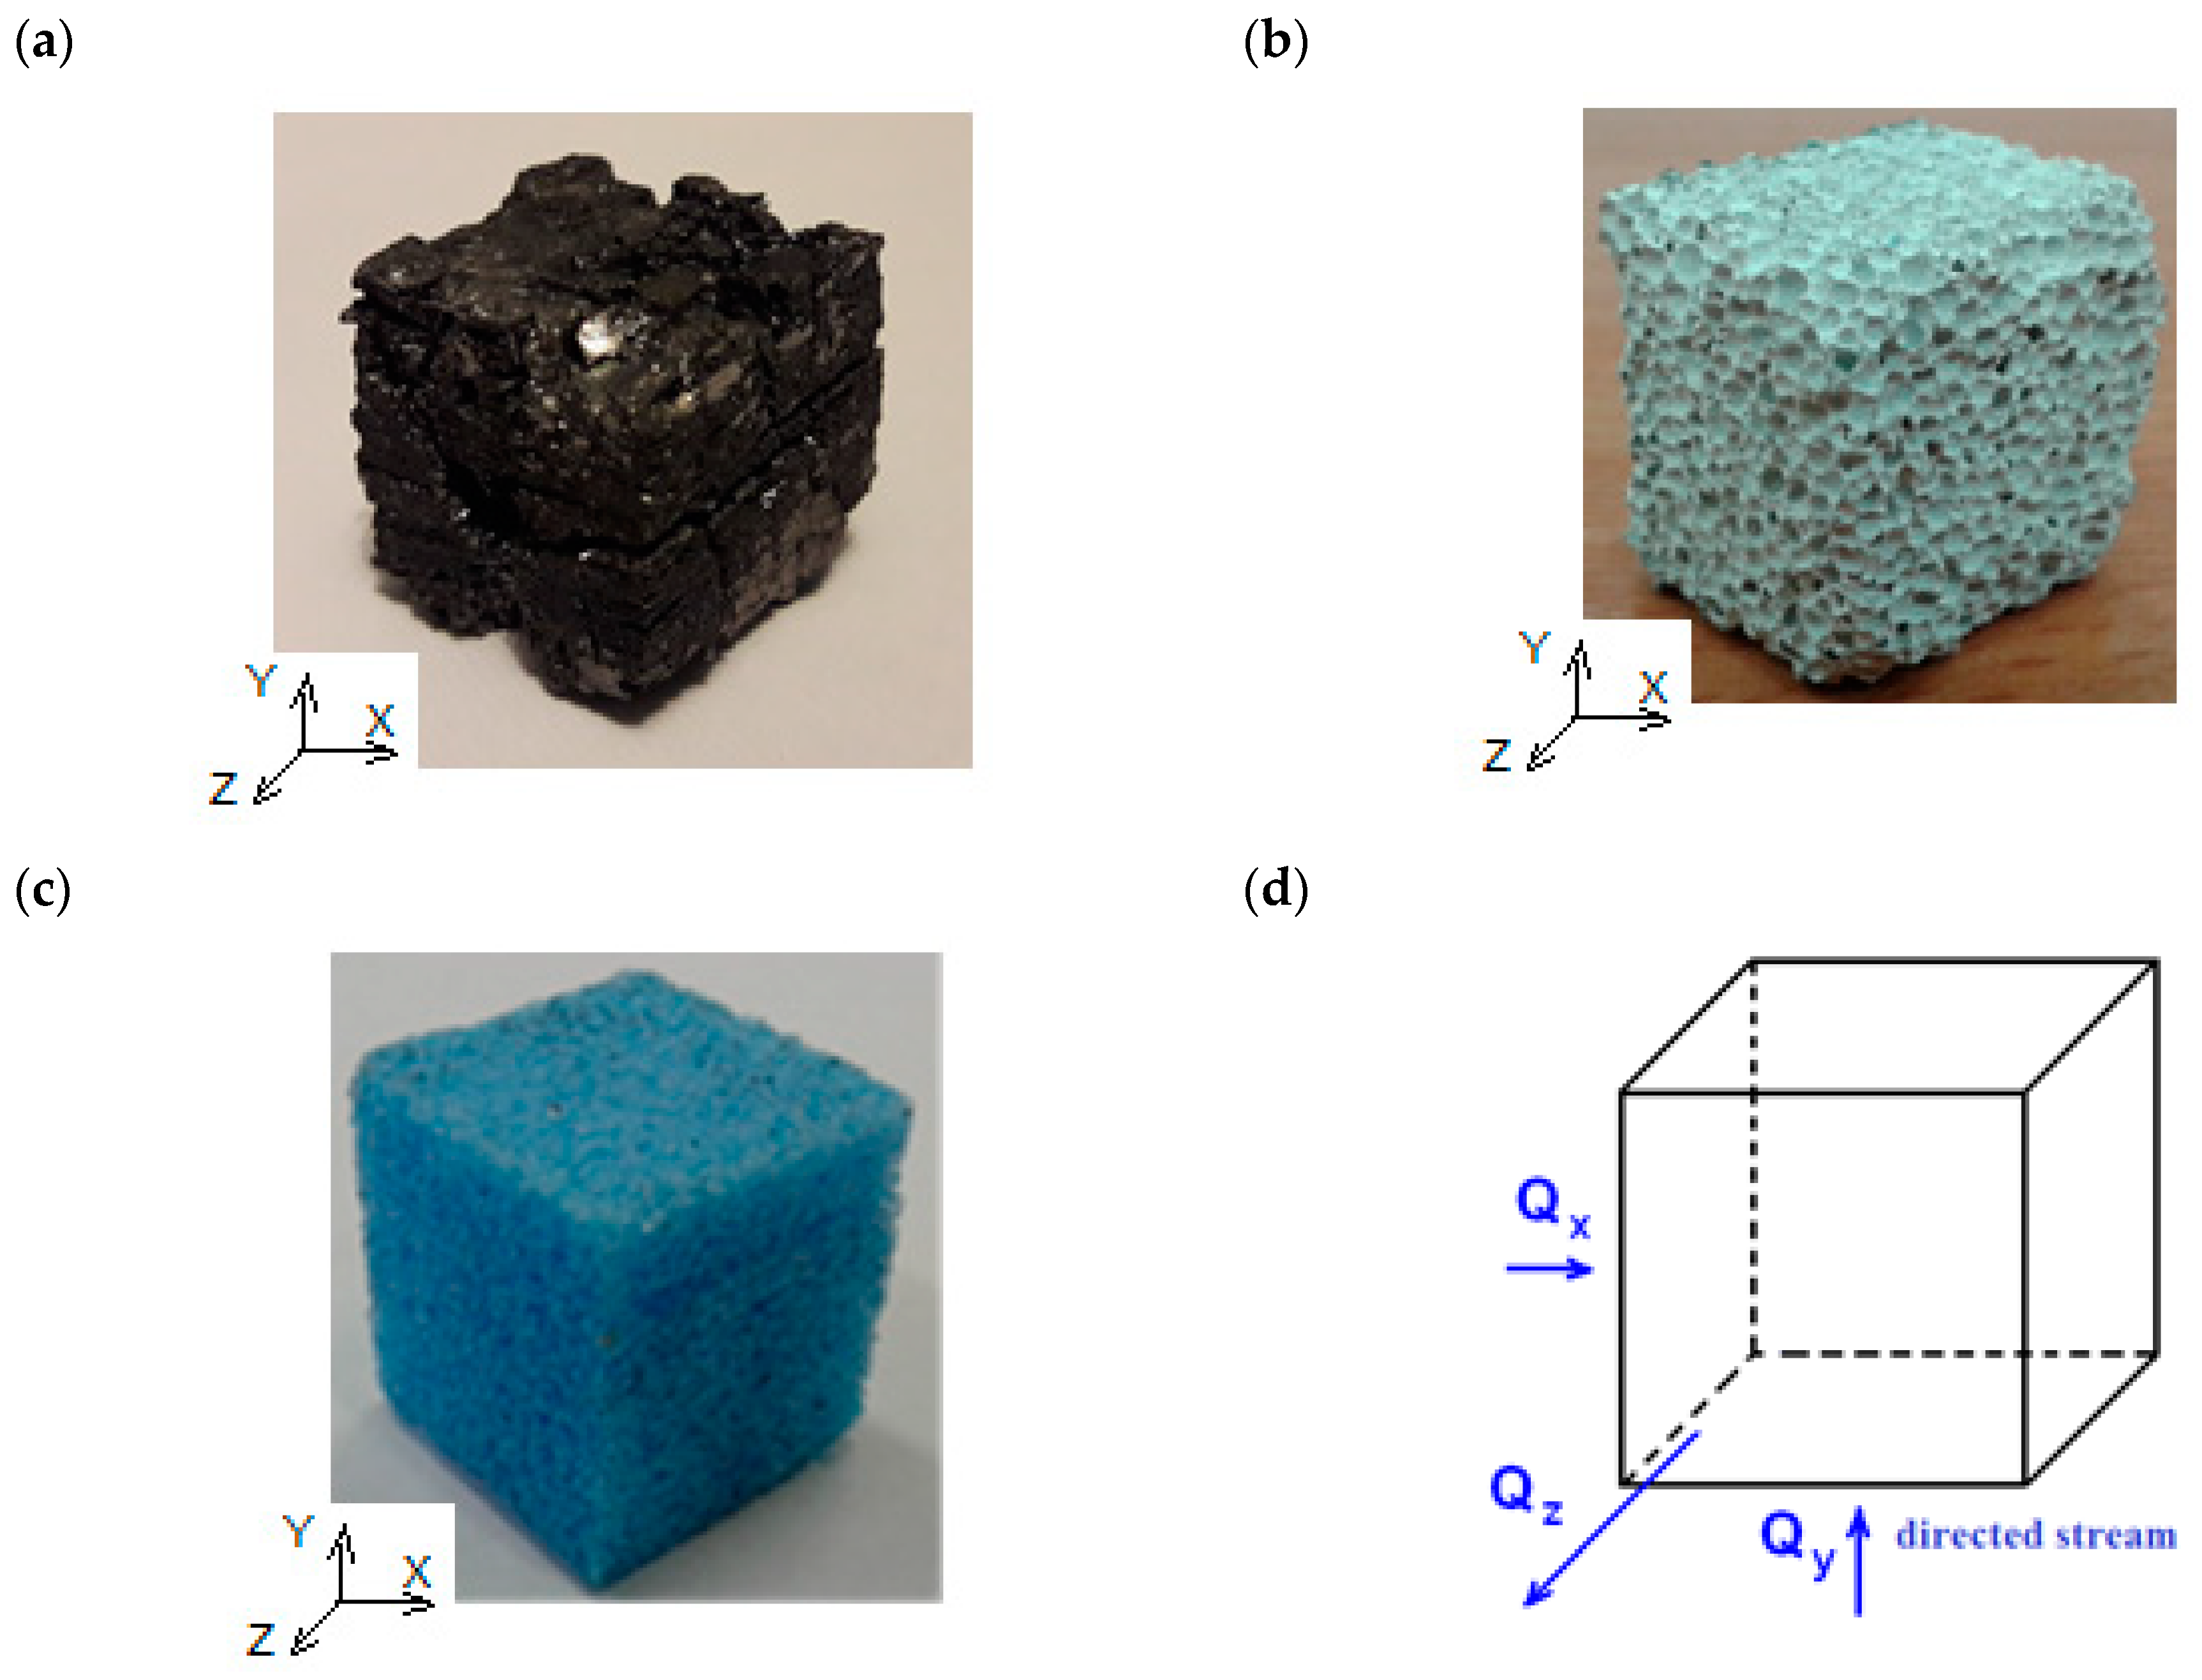
3.2. The Use of Halloysite in the Form of Nanotubes (HNT) as a Model Material for Testing Gas Permeability

In the work by Ahmadi and co-workers [67], the effectiveness of membranes was checked, including the assessment of aging by occurrence of undesirable reactions with the test gases (CH4 and CO2) in isothermal conditions (T = 298.15 K), in the pressure range from 4 to 10 bar. Compared to Pebax membranes, they turned out to be more effective.
Studies on nanocomposite films, taking into account changes in their hydromechanical properties, showed that the maximum density of nanocomposite layers increased gradually with the increase in the nanofiller content, such as in work by Alakrach and co-workers [68].
Flat ultrafiltration membranes were produced by Keskin and co-workers [69] by introducing two different sizes of halloysite nanotubes. It was found that the efficiency of the membranes was highest for the content of 1.88% of nanotubes.
Nanocomposite films based on halloysite, modified with hydroxypropyl cellulose, deserve attention. The influence of the composition on the optical and thermal properties of the foil was checked. Research by Lisuzzo and co-workers [70] has proven that the presence of wax–halloysite microclusters in the modified cellulose bed had a huge impact on the prepared systems, which were positively assessed as good materials for storing energy and heat.
A hydrophobic membrane based on a composite of poly(vinylidene fluoride) and halloysite nanotubes is a promising material to be used for gas storage, following the limitation of wettability, as demonstrated by AbdulKadir and co-workers [71].
Membranes composed of graphene oxide and halloysite nanotubes were obtained by filtration of suspensions of components under reduced pressure. The resulting product is characterized by a 3-fold increase in efficiency compared to pure graphene oxide material, reported by Zhang and co-workers [72].
Halloysite nanotubes have been used as nanofillers to produce mixed matrix (CH4 and CO2) membranes including a polyamide polymer as the base material—Ahmadi and co-workers [73]. It has been shown that a small admixture of polymer-modified nanotubes significantly increases CO2 permeability and selectivity of gas separation.
Halloysite composite materials made of PET and nanomaterial based on Al and Si with silanized nanoclay were prepared and characterized. Studies by Garcia-Escobar and co-workers [74] on the adsorption properties (N2) have shown that doping has a positive effect on generating Young’s modulus strains and reducing the limit strain but does not significantly affect the permeability compared to pure PET. The authors of the work—Viscusi and co-workers [75]—reached similar conclusions. The physical properties of pure halloysite nanotubes and those doped with a carbohydrate polymer were analyzed. The filler had no significant effect on thermal properties, but improved mechanical and barrier properties were found. A slight increase in turbidity was detected without a significant deterioration in the transparency of the film.
One of the possibilities for large-scale energy storage (H2 or CH4/H2), next to caverns after the exploitation of rock salt deposits, is the Lined Rock Cavern (LRC) underground energy storage facility. It is based on sealing linings produced by modifying the supporting polymer (graphite, HNT, fly ash). The results of the tests indicate that the H2 permeability coefficients of the polymers are similar to the results for salt rock after the salt creep process—Gajda and Lutyński [62].
Geopolymer binders were synthesized using metakaolin and metahalloysite as aluminosilicate precursors and activated with an alkaline solution. Gas tightness tests showed that the use of metahalloysite resulted in better performance compared to the use of kaolia clay. Geopolymer binders synthesized by Kaze and co-workers [76] from activated metahalloysite showed an increase in compressive and flexural strength, respectively.
As a sustainable alternative to the conventional polymer membrane, a poly(ʟ-lactic acid)-based hybrid membrane was doped with halloysite nanotubes. Studies by Wang and co-workers [77] on the water flow through the thus obtained membrane (doping from 0% to 1%) proved that its permeability increased by over 200%, while the retention coefficient of bovine serum albumin (BSA) decreased by about 10 percentage points.
Similar research by Boro and co-workers [78] on poly(lactic acid) nanocomposites with clove oil and chemically treated halloysite nanotubes as a material for obtaining coatings was characterized in terms of physical, thermal, mechanical and water vapor barrier properties for their use as food packaging material. They were characterized by a significant increase in the analyzed features. The authors of another paper, Shahabi and co-workers [79], checked the effect of halloysite in the form of nanotubes on the physicochemical properties of a film isolated from soy protein from basil seeds activated with propolis. The barrier properties of the film decreased significantly with the introduction of halloysite. Furthermore, encapsulation significantly increased the antioxidant potential of the samples in DPPH radical scavenging activity assays.
An interesting fact is the convergence of HNT nanotubes in a capillary bed as a result of biogas production by Wałowski [80,81]. The article presents the results of selected agricultural biogas production methods using an energy carrier and describes the technological aspects of these methods for monosubstrate bioreactors. Based on the literature, modeling of mixing in bioreactors using computational fluid dynamics (CFD) is presented.
Currently, natural geological formations are used for underground storage of gaseous energy carriers (natural gas, hydrogen). Deep underground storage requires less above-ground space and ensures greater safety and profitability of the installation.
In the case of natural gas, the most frequently used are cavities from depleted hydrocarbon deposits (75%), aquifers (13%) and salt caverns (12%). In the case of hydrogen, the latter are the most preferred because they are characterized by high energy density and favorable mechanical properties (porosity). However, salt caverns are difficult to prepare (the hardness of the material affects the effectiveness of drilling and finishing, and the chemical activity makes corrosion control difficult), as reported by Bade and co-workers [82] and Dodangoda and co-workers [83].
The use of halloysite for hydrogen storage is prospective. Laboratory tests for nanotubes made of pure material confirmed an adsorption rate of 0.436% (p = 2.63 MPa, T = 298 K). Thermal modification reduces the adsorption capacity (0.263%), while chemical modification causes a significant increase: palladium modification allows for storage with an efficiency of 1.143%, and acid treatment increases the adsorption capacity by 1.371%, as reported by Jin and co-workers [84]. The authors of other studies proved that carbon-modified halloysite nanotubes allow for an increase in hydrogen adsorption capacity from 0.35% to 0.48% (p = 2.65 MPa, T = 298 K). Doping carbon nanotubes with palladium increases the storage efficiency to 0.63%, reported by Jin and co-workers [85].
Natural halloysite deposits can potentially be successfully used to store hydrogen, especially when there are other minerals that contribute to the increase in the stability of the tested structures. Research on the structure and adsorption capacity indicates that a unique feature of natural halloysite nanostructures is the difference in the characteristics of the internal and external surfaces, resulting in a variable hydrophilic and hydrophobic character. This feature determines the anomalous flow behavior through consolidated materials in natural deposits. The mechanical properties (elastic modulus, hardness) are higher compared to kaolinite. On the other hand, natural halloysite nanotubes are much softer than common minerals such as calcite and quartz, which in turn avoids technical problems related to operation, as shown by Jin and co-workers [86].
Considering the gas permeability mechanism presented in the publication, it is worth adding that it also has significant application to the flow conductivity of fracture channels in rocks on fluids for gas flow in rock strata, as shown by Zou and co-workers [87]. Hydraulic fracturing is widely used in China for underground coal bed methane extraction (ECBM). The strength of coal after hydraulic fracturing has a significant effect—the paper examines the characteristics of stress and strain curves of the pre-cracked material—Zou and co-workers [88]. During the exploitation of coal seam, the stress state changes from time to time, and the development of coal seam cracks depends on the exploitation. When examining the effect of stress on the permeation of coal samples, the cracked structure of coal samples should be taken into account, as per Zhang and co-workers [89]. The effect of gas extraction depends on the permeability of the coal seam, which in turn is influenced by many factors, including loading and unloading stresses and strains in the coal seam. The stresses cause internal cracks, which result in the formation of cracks and gas emission channels, and the permeability of the coal seam is permanently changed. To explain the effect of stress on the permeability of the coal seam, this study summarized the available approaches used to combine the stress path and the seepage law in the coal seam seepage law, which can be divided into two design methods: single load change and combined field operation method (Cheng and co-workers [90]).
Unconventional Fossil Energy: Shale energy is an abundant fossil resource in unconventional reservoirs and is widely considered by petroleum engineers as a critical alternative or complementary energy source for the efficient extraction and development of the industry. Numerous reservoir modification techniques including fracturing and sand viscosity reduction can be used to modify deep shale reservoirs. It has been observed that in shale reservoirs, intermolecular hydrogen bonds are easily formed with water molecules in the oil field working fluid, which causes a strong water-sensitive phenomenon on the shale surface, which causes a decrease in the permeability of reservoir rocks (Li and co-workers [91]). The properties of hydrate deposits have been experimentally studied and it was found that the elastic modulus, cohesion and angle of internal friction of hydrate deposits show an increase with increasing effective stress, while Poisson’s ratio, permeability and porosity show a decrease. It was indicated that the study can provide methodological premises for examining the influence of various factors on the stability of the wellhead during the long-term process of hydrate development (Li and co-workers [92]). A typical equivalent of geological features with long-term CO2 storage may be porous rock deposits, where gas injected under high pressure after a very long time dissolves and transforms into crystalline forms. The effect of proper gas permeability was indicated by Wałowski [93]. Practical and safe crushing of coal in situ is provided by a transverse wave, through which the accumulated energy generated by the controlled explosion of propane is discharged. The safety of using transverse waves is the lack of propagation ability in liquids and gases, while the occurring phenomenon of gas permeability is desirable for hydrogenation of hard coal in the deposit. This was presented by Wałowski [94].
In summary, the Darcy equation is a well-known model for fluid transport in porous media. However, the equation is less effective in describing the flow in shale gas reservoirs due to the very low permeability and nanometric pore structure of the rock, as shown by Afagwu and co-workers [48] and Javadpour [95]. Phenomena such as adsorption/desorption, Knudsen diffusion and slip flow effects must be taken into account to properly model fluid transport in low-permeability reservoirs. Shale systems are unconventional reservoirs that contain less than 50% organic matter by mass (Clarkson and co-workers [96]). More specifically, shale formations contain type II and type III kerogens, depending on their origin (i.e., plant or animal). These types of reservoirs are classified as self-supplying (as opposed to conventional reservoirs) and have extremely fine-grained sediments with pore sizes smaller than 62.5 μm. They exhibit cleavage, with nano-scale pore structure and matrix permeability less than 1 μD—Javadpour [95] and Wang and Yu [97]. In the work of Yao [98], viscous flow and Knudsen diffusion were considered together with the Javadpour model, Civan model and DGM model. The Javadpour model [95] was proposed by Javadpour in 2009 with apparent permeability, which takes into account viscous flow and Knudsen diffusion in a single nanotube. To simulate gas flow in nanopores in shale matrix, Javadpour [95] and Javadpour and co-workers [99] proposed to calculate the total mass flux by simultaneously combining slip flow and Knudsen diffusion. Considering the above, Prof. Wałowski presents density as a flow criterion given for gas permeability regardless of the flow regime in natural conditions, especially for heterogeneous material—this has already been presented in publications depending on the industry [100,101] and field of science [102,103]. To sum up, examples of applications of the shape of fracture-porous structures for potential flow in the context of energy storage in natural deposits are presented.
In summary, hydrogen is characterized by high energy density, as a substance subject to oxidation without the formation of harmful products is considered one of the most promising energy carriers. In the context of global climate change and the growing demand for clean energy, shale gas, among others, is seen as an important bridge between traditional and renewable energy sources. Shale gas has the potential to become a key raw material in the transition period before renewable technologies become the dominant energy source. Considering many technological aspects, the influence of the difference in the adsorption of various gases in porous materials was taken into account, and an example of such considerations was indicated in the production of biohydrogen [80,81]. Hydrogen (H2) is representative as an unconventional energy gas, because the use of renewable raw materials for H2 production is an alternative option that shows high economic and environmental benefits for the development of sustainable raw materials and a closed-loop economy. Biological conversion of waste into H2 may be the best alternative method [104], as well as the most cost-effective method of storing H2.
Hydrogen production is the most important and promising alternative to replace fossil fuels in an environmentally friendly way. Along with many available renewable energy sources, hydrogen storage takes an irreplaceable position due to the undeniable availability of biomass and the need to manage food waste. Hydrogen production and storage is the least harmful to the environment and has the most promising potential in the course of the current energy transformation, using porous beds.

4. Conclusions

The implementation of a hydrogen economy to reduce emissions will require storage facilities, and underground hydrogen storage in porous media provides an easily accessible, large-scale option. The lack of studies on multiphase H2 flow in porous media is one of the few barriers to accurate UHS predictions.
The recognition of the problem of gas permeability through porous media has shown the following:
(1)
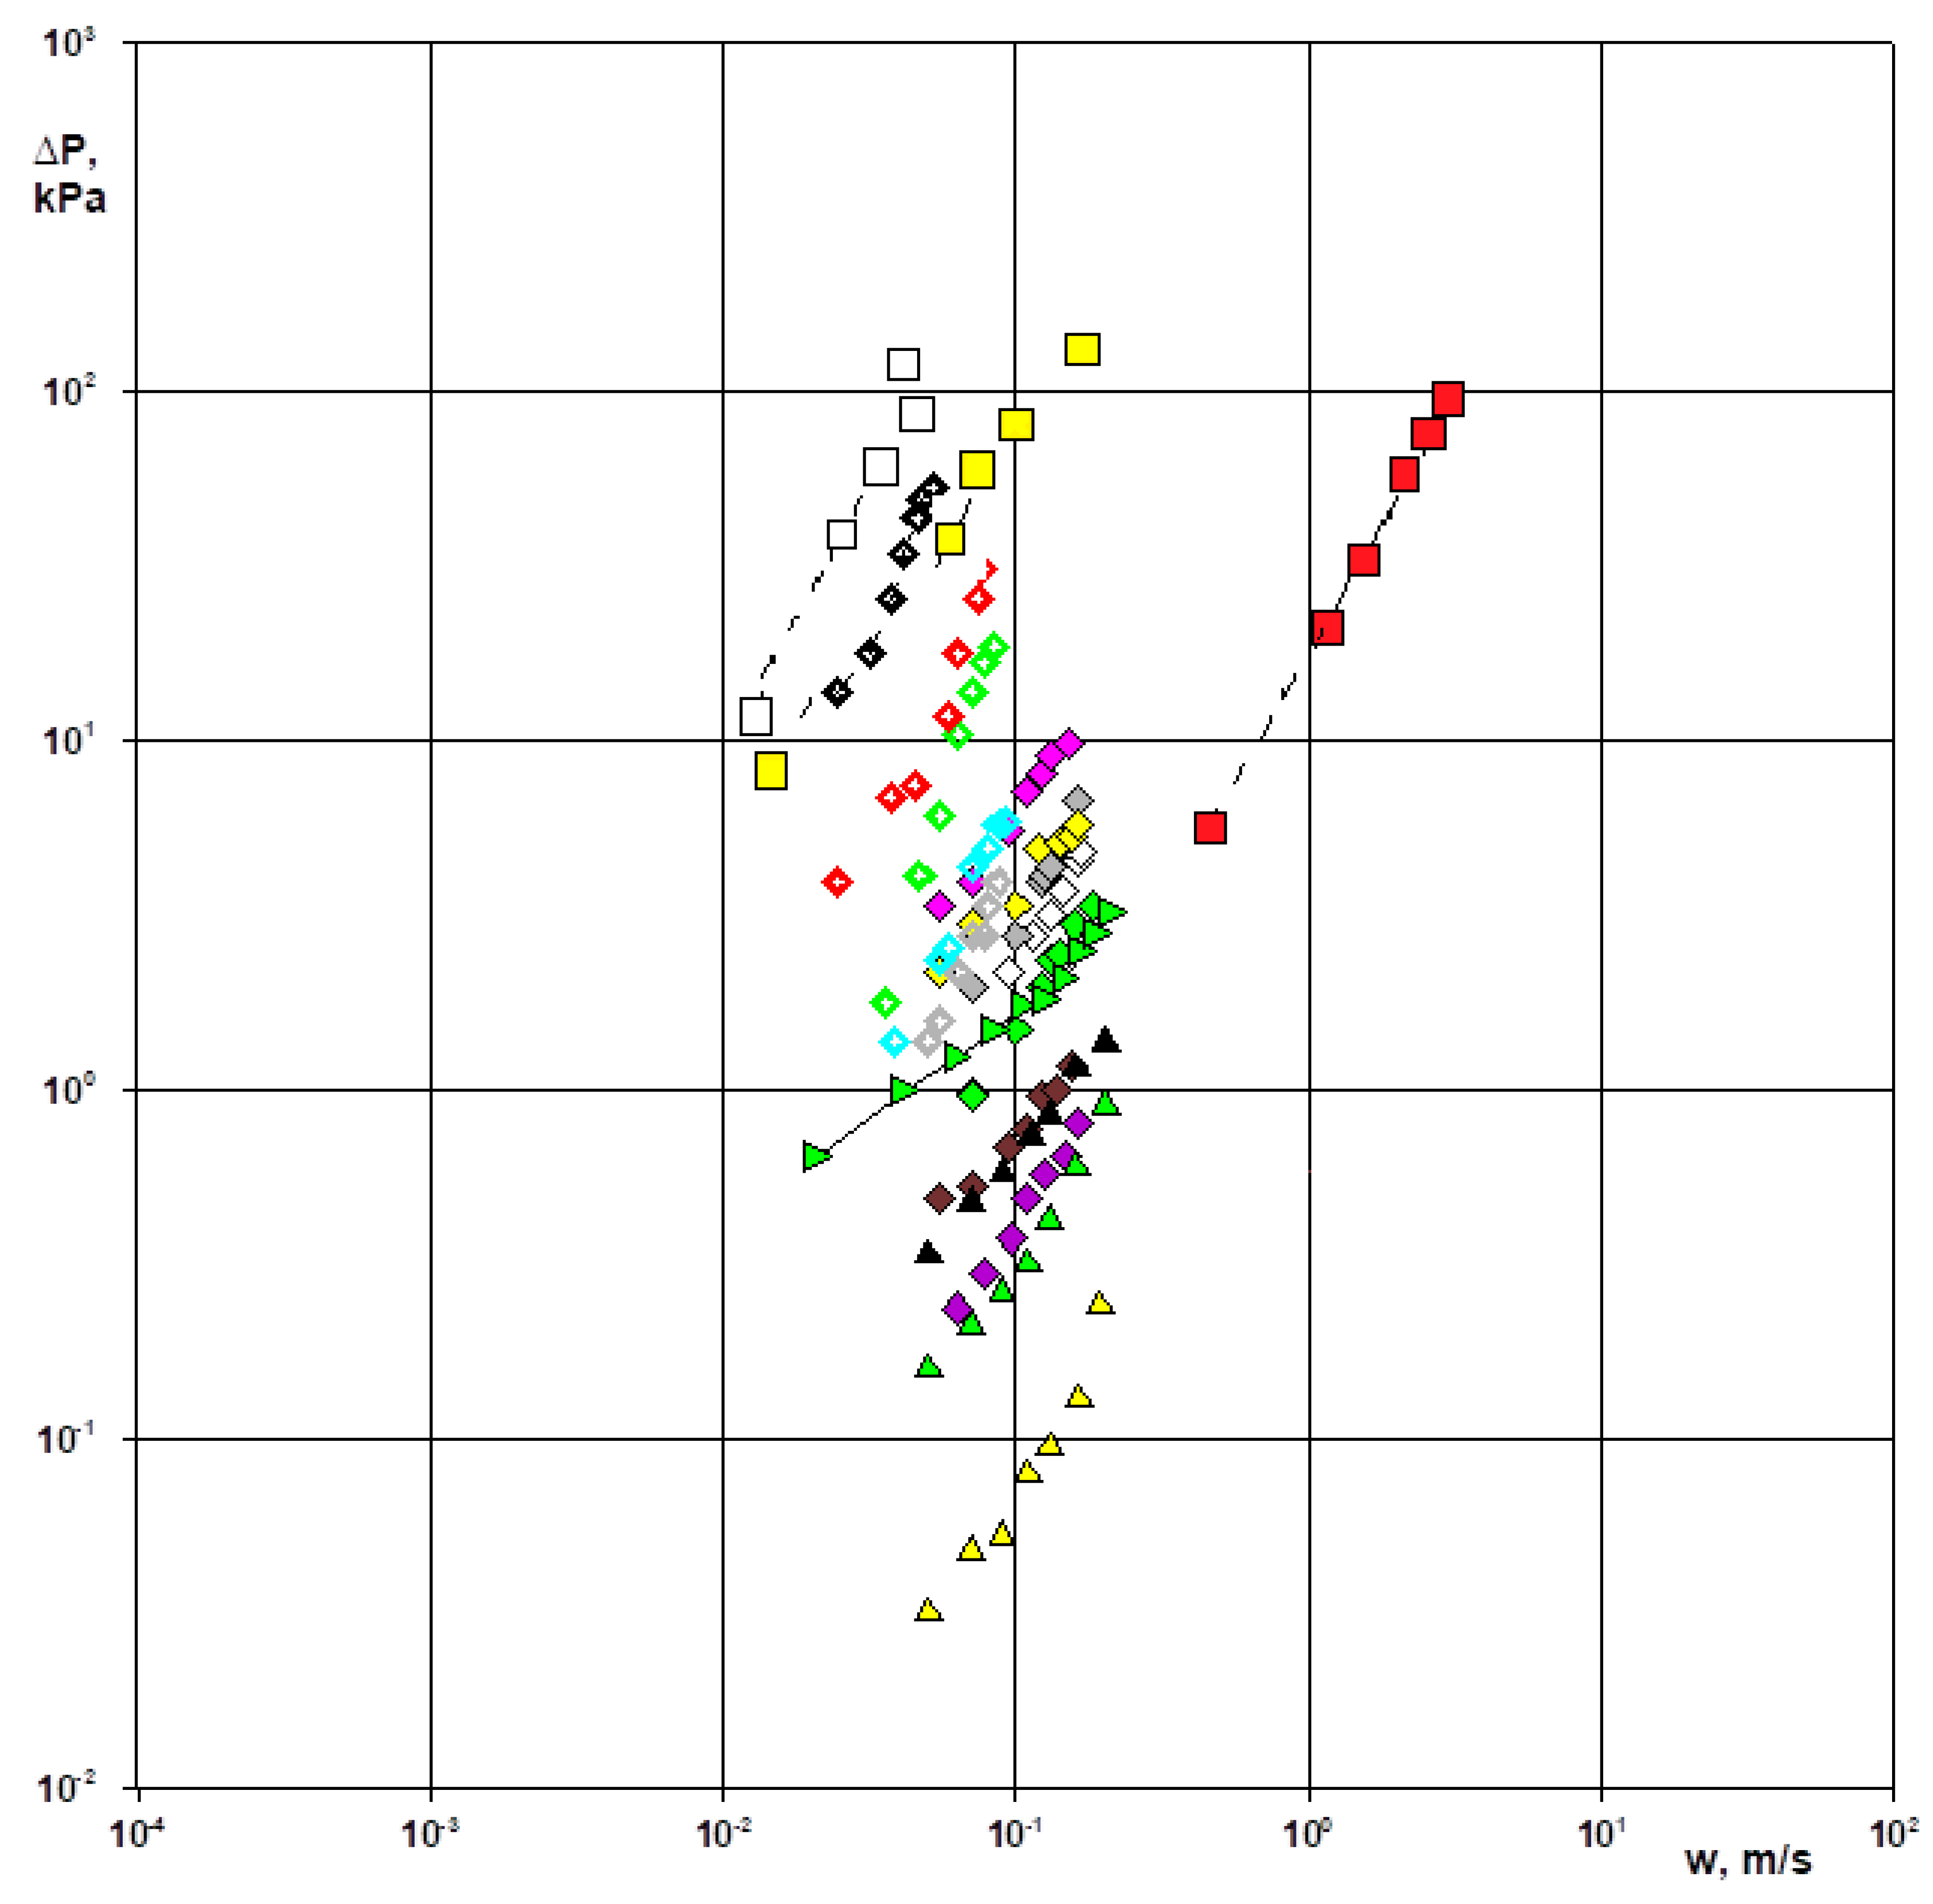
Appropriate experimental tests of gas permeability through materials have been performed and hydrodynamic phenomena resulting from the pressure gradient of the gas flow have been assessed. The “directed horizontal region” characteristic of skeletal deposits (velocities from 0.01 to 5 m∙s−1, resistances from 0.7 to 150 kPa) was determined. In this region, the in situ char is characterized by the largest number of fractures, while the two pumices distinguish open and closed pores. Additionally, selected granular materials forming the “directed vertical region” (velocities from 0.01 to 0.5 m∙s−1, resistances from 0.005 to 100 kPa) were listed.
(2)
The phenomenon of “twin gas permeability” was observed for Kv equal to 10−8, which results in flow resistances for pumice of the order of magnitude from 104 to 105 Pa, with respect to epoxy resin from 106 to 107 Pa. In this way, the gas permeability mechanism for isotropic pumice can be correlated with hydrogen storage for epoxy (polymer).
(3)
The results of studies on the hydrodynamics of gas flow through porous skeleton beds and the proven usefulness of the process evaluation of these studies are an innovation for practical use for energy storage.
(4)
Numerous studies show that at low pressure gradients, the gas slip effect occurs, which causes an overestimation of the flow velocity compared to Darcy’s law. The characteristics of gas permeability through a porous material are directly related to the values of the pressure gradient that occurs at a given gas stream on a given porous bed. Most of the theoretical considerations resulting from this are based on models of rectilinear channels and on Poissuille’s law (laminar flow), and even more often, on models identifying a porous medium, with a skeleton form with a granular bed, with the same features and flow parameters of the bed.

Author Contributions

Conceptualization: J.T.H.-K., A.K., G.W.; Data curation: J.T.H.-K., B.D., J.S.; Formal analysis: J.T.H.-K., A.K., G.W.; Funding acquisition: A.K.; Investigation: J.T.H.-K., A.K., B.D., J.S., G.W.; Methodology: J.T.H.-K., A.K., G.W.; Project administration: G.W., A.K.; Resources: J.T.H.-K., A.K., B.D., J.S., G.W.; Software: B.D., G.W.; Supervision: G.W.; Validation: J.T.H.-K., A.K., G.W.; Visualization: B.D., G.W.; Roles/Writing—original draft: J.T.H.-K., B.D., G.W.; Writing—review and editing: G.W. All authors have read and agreed to the published version of the manuscript.

Funding

The study conducted as part of the project financed by West Pomeranian University of Technology in Szczecin, Poland. The APC was funded by West Pomeranian University of Technology in Szczecin, Poland.

Institutional Review Board Statement

Not applicable.

Informed Consent Statement

Not applicable.

Data Availability Statement

The data presented in this study are available on request from the corresponding author.

Conflicts of Interest

The authors declare no conflicts of interest. The funders had no role in the design of the study; in the collection, analyses or interpretation of data; in the writing of the manuscript or in the decision to publish the results.

Abbreviations

Aobed cross-sectionm2
Lheight of the porous mediumm
Kcoefficient of permeabilitym2
Qvolumetric flow ratem3/s
ΔP pressure gradientPa
gearth accelerationm/s2
Δh pressure heightPa
ηviscosityPa∙s
ρdensitykg/m3

Appendix A

Notations for Table 2 (acc. to equation number):
mreservoir porosity (4)
Sggas saturation; partial velocity (4)
kgpermeability of the gas mixture (4)
μgdynamic viscosity (4)
ppressure (4)
ΔPpressure gradient (5)
qflow rate per unit width of the fracture normal to the flow (6) and (7)
eequivalent crack aperture (6) and (7)
νfluid viscosity (6) and (7)
∂P\∂Xpressure gradient (6) and (7)
kpermeability (6) and (7)
Ω correction factor, dimensionless (8)
β dimensionless radius of a sphere, dimensionless (8)
krrelative permeability of gas/liquid (9)
QRC phase is the volumetric flow rate at the network inlet reported at network average pressure (9)
Anetwork cross-sectional (9)
Llength of the network (9)
v gas velocity (10)
K permeability tensor (10)
μviscosity (10)
ppressure (10)
ρJdensity (11)
vJ volumetric fluid velocity (11)
kJ rank-2 positive-definite effective permeability tensor (11)
μJviscosity (11)
pJpressure of phase J (11)
ggravity vector (11)
mporosity of the membrane (12)–(14)
lthickness (12)–(14)
clocal concentrations of the diffusant in the pores and the polymeric phase (12)–(14)
a local concentrations of the diffusant in the pores and the polymeric phase (12)–(14)
Didiffusion coefficients in the pores and the polymeric phase (12)–(14)
Dadiffusion coefficients in the pores and the polymeric phase (12)–(14)
dP/dxpressure gradient (15)
μabsolute viscosity (15)
ρdensity (15)
υssuperficial fluid velocity (15)
Kintrinsic permeability (16)
φporosity, fraction (16)
Reequivalent hydraulic radius of a channel (16)
τhtortuosity of capillary transport paths, dimensionless (16)
φfugacity coefficient (17) and (18)
biparameter in equation of state of component i (17) and (18)
bmparameter in equation of state of mixture (17) and (18)
ZLcompressibility factor for liquid phase (17) and (18)
ZVcompressibility factor for vapor phase (17) and (18)
PLpressure of liquid phase (17) and (18)
PVpressure of vapor phase (17) and (18)
amparameter in equation of state of mixture (17) and (18)
aparameter in equation of state (17) and (18)
Pcapcapillary pressure (19)
σinterfacial tension (19)
rpore radius (19)
Kggas permeability of a network link (20)
Aieffective surface area of a network link in the direction of flow (20)
μggas viscosity (20)
Lilength of a network link and its equal to the distance between two connected nodes (20)
Gpore conductance (21)
gean effective pore conductance (21)
Zthe average pore coordination number (21)
acreepconstant micro-scale deformation permeability (22)–(24)
θcreep, refreference (gas) porosity associated with micro-scale deformation (22)–(24)
crmicro-scale deformation rate (22)–(24)
fidiscrete density distribution function (25) and (26)
fieqlocal equilibrium function (25) and (26)
ei discrete velocity of the particle (25) and (26)
cslattice sound velocity (25) and (26)
τrelaxation time (25) and (26)
ωiweight coefficient (25) and (26)
δttime step (25) and (26)
Ppressure (27)
μviscosity, (27)
kpermeability (27)
uvelocity (27)
βnon-Darcy coefficient (27)
ρdensity (27)
Swwetting phase saturation (28) and (29)
Qtottotal injection rate (28) and (29)
fffractional flow (28) and (29)
Acore cross-sectional area (28) and (29)
μithe phase viscosity (28) and (29)
εporosity (30)–(33)
kpermeability (30)–(33)
μgas dynamic viscosity (30)–(33)
P pressure gradient resistance flow (34)
Aexperimental constant (34)
ReReynolds number (34)
nconstant (34)
ρfluid density (34)
wvelocity (34)
Lflow path length for the height of the porous bed (34)
deequivalent diameter (34)
μviscosity (35) and (36)
mtotaltotal mass flow (35) and (36)
ρgas density (35) and (36)
Aarea (35) and (36)
p pressure (35) and (36)
Qstream (37)
Kcoefficient of permeability (37)
A0reference layer bed cross-section (37)
ρdensity (37)
gEarth acceleration (37)
ηviscosity (37)
h pressure height (37)
Lheight of porous medium (37)
w Darcy velocities (38) and (39)
k permeability matrices (38) and (39)
Ssaturation (38) and (39)
qvolume flux (40) and (41)
kDarcy’s permeability (40) and (41)
μdynamic viscosity (40) and (41)
ppressure (40) and (41)
Runiversal gas constant (40) and (41)
Ttemperature (40) and (41)
Mmolar mass (40) and (41)
AMmembrane area (40) and (41)
ρdensity (40) and (41)
kaapparent permeability (42)
kliquid permeability (42)
KnKnudsen number (42)
ρdensity (42)
μviscosity (42)
Mmolecular weight (42)
Rgas constant (42)
Ttemperature (42)
rpore size (42)
ppressure (42)
γ“momentum accommodation coefficient” that depends on flow conditions, gas type, and surface roughness (42)
κappapparent gas permeability (43)–(48)
dpore size or diameter (43)–(48)
Dssurface diffusion of adsorbed gas (43)–(48)
pLLangmuir pressure (43)–(48)
Mgas molar mass (43)–(48)
KnKnudsen number (43)–(48)
μgviscosity of gaseous phase (49)
kintrinsic permeability or absolute permeability of coal, which is assumed to be isotropic (49)
ψKpermeability shape factor (50)–(52)
dmean particle size of the porous media (50)–(52)
AErgun equation coefficient (50)–(52)
λphase mobility (53)–(56)
krrelative permeability (53)–(56)
μdynamic fluid viscosity (53)–(56)
kintrinsic permeability (53)–(56)
pphase pressure (53)–(56)
ggravitational acceleration (53)–(56)
zpointing upward (53)–(56)
kformation permeability (57) and (58)
μfluid viscosity (57) and (58)
ggravitational acceleration (57) and (58)
preservoir pressure (57) and (58)
ϕformation porosity (57) and (58)
ρfluid density (57) and (58)
ttime (57) and (58)
zgelevation (57) and (58)
Qmass entering (leaving) a control volume from a sink (source) (57) and (58)
kpermeability (59)
μdynamic viscosity (59)
mmass flow (59)
ρdensity of fluid (59)
Across-sectional area of a wick (59)
ggravitational acceleration (59)
θininclined angle of platform (59)
Vvolume flow rate (59)
Kappapparent permeability (60)
qflow rate (60)
μviscosity (60)
Lpore length (60)
Across-sectional area (60)
Ppressure (60)
kggas permeability (62)
kpermeability (62)
βnon-Darcy coefficient (62)
ρdensity (62)
vgas flow rate (62)
μgas viscosity (62)
ηffluid viscosity (65) and (66)
ρffluid density (65) and (66)
ktotal permeability tensor (65) and (66)
ggravity acceleration (65) and (66)
Krggas relative permeability (67) and (68)
Krwwater relative permeability (67) and (68)
Krpoints Kr at irreducible water saturation (Swirr) and residual gas saturation (Sgr) (67) and (68)
Swnormalized water saturation (67) and (68)
Kintintrinsic permeability (70) and (71)
Kappapparent permeability (67)–(68)
U gas velocity (70) and (71)
mdynamic viscosity (70) and (71)
Uavgaverage velocity magnitude (70) and (71)
Llength of the porous structure (70) and (71)
kaapparent permeability (72)
μdynamic viscosity (72)
Lsunit sample length (72)
Ssunit sample permeation surface (72)
d, dipore diameter (72)
Rideal gas constant (72)
Ttemperature (72)
Mmolar mass (72)
αtangential momentum accommodation coefficient (72)
Pmmean pressure between upstream and downstream (72)

References

  1. Lorenzi, A.; Sotgnia, G. Comparative investigation of some characteristic quantities of two-phase cocurrent upward and downward flow. In Proceedings of the Two-Phase Flow and Heat Transfer Symposium-Workshop: Proceedings of Condensed Papers, Fort Lauderdale, FL, USA, 18–20 October 1976. [Google Scholar]
  2. Sadatomi, M.; Sato, Y.; Saruwatari, S. Two-Phase Flow in Vertical Noncircular Channels. Int. J. Multiph. Flow 1982, 8, 641–655. [Google Scholar] [CrossRef]
  3. Prakash, A.; Briens, C.L. Porous Gas Distributors in Bubble Columns. Effect of Liquid Presence on Distributor Pressure Drop. Effect of Start-up on Distributor Performance. Can. J. Chem. Eng. 1990, 68, 204. [Google Scholar] [CrossRef]
  4. Praser, H.M.; Krepper, E.; Lucas, D. Evolution of the two-phase flow in a vertical tube—Decomposition of gas fraction profiles according to bubble size classes using wiremesh sensors. Int. J. Therm. Sci. 2002, 41, 17. [Google Scholar] [CrossRef]
  5. Cybulski, A.; Moulijn, J.A. Monoliths in Heterogeneous Catalysis. Catal. Rev. 1994, 36, 179–270. [Google Scholar] [CrossRef]
  6. Williams, J.L. Monolith structures, materials, properties and uses. Catal. Today 2001, 69, 3. [Google Scholar] [CrossRef]
  7. Błaszczyk, M. Research Upon Processes of Migration of Petroleum Substances and Their Emulsions in Porous Structures. Ph.D. Thesis, Lodz University of Technology, Faculty of Chemistry, Łódź, Poland, 2014. [Google Scholar]
  8. Stańczyk, K.; Świądrowski, J.; Kapusta, K.; Howaniec, N.; Cybulski, K.; Rogut, J.; Smolinski, A.; Wiatowski, M.; Kotyrba, A.; Krause, E.; et al. Hydrogen-Oriented Underground Coal Gasification for Europe (HUGE); Final Report; Research Found for Coal and Steel; (EUR 25044 EN 2012); European Commission: Brussels, Belgium, 2015. [Google Scholar]
  9. Aksielrud, G.A.; Altszuler, M.A. Movement of Mass in Porous Bodies; WNT: Warsaw, Poland, 1987. [Google Scholar]
  10. Dulniew, G.N.; Nowikow, W.W. Prociessy Pierienosa w Nieodnorodnych Sriedach; Eniergoatomizdat: Moscow, Russia, 1991; p. 248. [Google Scholar]
  11. Mozhaev, A.P. Chaotic Homogeneous Porous Media. 2. Theory of Dispersion Turbulence: Basic Propositions. J. Eng. Phys. Thermophys. 2002, 75, 371–383. [Google Scholar] [CrossRef]
  12. Wałowski, G.; Filipczak, G. Hydrodynamics of Gas Flow Through Porous Deposits. Ph.D. Thesis, Opole University of Technology, Opole, Poland, 2015. [Google Scholar]
  13. Lambe, T.; Whitman, R.V. Soil Mechanics; Arkady Publishing House: Warsaw, Poland, 1978. [Google Scholar]
  14. Darcy, H. Les Fontaines Publiques de la Ville de Dijon; Valmont, V., Ed.; Dalmont: Kraljevica, Croatia, 1856. [Google Scholar]
  15. Strzelecki, T.; Kostecki, S.; Żak, S. Modeling of Flows Through Porous Media; Lower Silesian Educational Publishing House: Wrocław, Poland, 2008. [Google Scholar]
  16. Waluk, J. Soil Mechanics Laboratory; Wroclaw University of Technology: Wroclaw, Poland, 1973. [Google Scholar]
  17. Wałowski, G.; Filipczak, G. Assessment of process conditions associated with hydrodynamics of gas flow through materials with anisotropic internal structure. J. Sustain. Min. 2016, 15, 156–169. [Google Scholar] [CrossRef]
  18. Wałowski, G.; Filipczak, G.; Krause, E. Hydrodynamics of gas flow in porous carbonisate structures in the aspect of underground coal gasification technology. Young for Technic 2013. In Selected Research and Development Issues in Chemistry and Chemical Technology; Warsaw University of Technology: Płock, Poland, 2013; p. 253. [Google Scholar]
  19. Palica, M.; Chmiel, K.; Waluś, J. Hydraulics of selected biologically active deposits. In Yearbook of Environmental Protection; Middle-Pomeranian Scientific Society for Environmental Protection: Koszalin, Poland, 1999; Volume 1, p. 85. [Google Scholar]
  20. Chmiel, K.; Palica, M.; Waluś, J. Hydraulics and biofiltration of triethylamine on the modified EKOSORB – 100 deposit. In Yearbook of Environmental Protection; Middle-Pomeranian Scientific Society for Environmental Protection: Koszalin, Poland, 1999; Volume 1, p. 125. [Google Scholar]
  21. Łukaszuk, J.; Molenda, M.; Szwed, G. Influence of bulk density of seeds on airflow resistance. Acta Agrophysica 2004, 4, 77–83. [Google Scholar]
  22. Kusińska, E.; Nadulski, R.; Kobus, Z.; Guz, T. Air flow resistance during aeration of wheat meal. Agric. Eng. 2011, 4, 159. [Google Scholar]
  23. Khasanov, M.K.; Rafikova, G.R.; Musakaev, N.G. Mathematical model of carbon dioxide injection into a porous reservoir saturated with methane and its gas hydrate. Energies 2020, 13, 440. [Google Scholar] [CrossRef]
  24. Haghi, A.H.; Talman, S.; Chalaturnyk, R. Consecutive Experimental Determination of Stress-Dependent Fluid Flow Properties of Berea Sandstone and Implications for Two-Phase Flow Modeling. Water Resour. Res. 2019, 56, e2018WR024245. [Google Scholar] [CrossRef]
  25. Jiang, Z.; Wang, H.; Xu, J.; Chen, H.; Xie, W.-C. Variation of permeability of natural filled jointed rock under repeated loading and unloading conditions. Eur. J. Environ. Civ. Eng. 2020, 27, 2447–2459. [Google Scholar] [CrossRef]
  26. Guo, J.; Liu, J.; Li, Q.; Chen, X.; Chen, Z.; Huang, B.; Chen, S. Variation law of coal permeability under cyclic loading and unloading. Therm. Sci. 2019, 23, 1487–1494. [Google Scholar] [CrossRef]
  27. Ma, L.; Xu, S.; Li, X.; Guo, Q.; Gao, D.; Ding, Y.; Ye, M.; Liu, Z. Particle tracking velocimetry of porous sphere settling under gravity: Preparation of the model porous particle and measurement of drag coefficients. Powder Technol. 2020, 360, 241–252. [Google Scholar] [CrossRef]
  28. Santos, M.P.P.C.; Carvalho, M.S. Pore network model for retrograde gas flow in porous media. J. Pet. Sci. Eng. 2020, 185, 106635. [Google Scholar] [CrossRef]
  29. Seitz, G.; Helmig, R.; Class, H. A numerical modeling study on the influence of porosity changes during thermochemical heat storage. Appl. Energy 2020, 259, 114152. [Google Scholar] [CrossRef]
  30. Yoon, H.C.; Zhou, P.; Kim, J. Robust modeling of hysteretic capillary pressure and relative permeability for two phase flow in porous media. J. Comput. Phys. 2020, 402, 108915. [Google Scholar] [CrossRef]
  31. Chalykh, A.; Zolotarev, P.; Chalykh, T.; Rubtsov, A.; Zolotova, S. Water vapor permeability through porous polymeric membranes with various hydrophilicity as synthetic and natural barriers. Polymers 2020, 12, 282. [Google Scholar] [CrossRef] [PubMed]
  32. Xiong, X.; Wang, Z.; Wang, X.; Liu, H.; Ma, Y. Correlations between pore structure parameters and gas permeability of corundum porous materials. J. Am. Ceram. Soc. 2020, 103, 2137–2145. [Google Scholar] [CrossRef]
  33. Civan, F. Can Moderately Rarefied Gas Transport Through Round and Flat Tight Channels of Fractured Porous Media be Described Accurately? Transp. Porous Media 2020, 132, 157–181. [Google Scholar] [CrossRef]
  34. Wu, S.; Li, Z.; Wang, Z.; Sarma, H.K.; Zhang, C.; Wu, M. Investigation of CO2/N2 injection in tight oil reservoirs with confinement effect. Energy Sci. Eng. 2020, 8, 1194–1208. [Google Scholar] [CrossRef]
  35. Rabbani, A.; Mostaghimi, P.; Armstrong, R.T. Pore network extraction using geometrical domain decomposition. Adv. Water Resour. 2019, 123, 70–83. [Google Scholar] [CrossRef]
  36. Ghanbarian, B.; Liang, F.; Liu, H.-H. Modeling gas relative permeability in shales and tight porous rocks. Fuel 2020, 272, 117686. [Google Scholar] [CrossRef]
  37. Chittenden, N.; Benbow, S.; Bond, A.; Norris, S. Development of an upscalable HM model for representing advective gas migration through saturated bentonite. Int. J. Rock Mech. Min. Sci. 2020, 133, 104415. [Google Scholar] [CrossRef]
  38. Peng, Z.; Liu, S.; Li, Y.; Deng, Z.; Feng, H. Pore-scale lattice Boltzmann simulation of gas diffusion–adsorption kinetics considering adsorption-induced diffusivity change. Energies 2020, 13, 4927. [Google Scholar] [CrossRef]
  39. Zolotukhin, A.B.; Gayubov, A.T. Semi-analytical Approach to Modeling Forchheimer Flow in Porous Media at Meso- and Macroscales. Transp. Porous Media 2021, 136, 715–741. [Google Scholar] [CrossRef]
  40. Moreno, Z.; Anto-Darkwah, E.; Rabinovich, A. Semi-Analytical Modeling of Rate-Dependent Relative Permeability in Heterogeneous Formations. Water Resour. Res. 2021, 57, e2021WR029710. [Google Scholar] [CrossRef]
  41. Jannot, Y.; Degiovanni, A.; Moyne, C.; Lasseux, D. New developments of the Gas Research Institute method for the permeability measurement of porous media. Rev. Sci. Instrum. 2021, 92, 065102. [Google Scholar] [CrossRef] [PubMed]
  42. Wałowski, G. Model of Flow Resistance Coefficient for a Fragment of a Porous Material Deposit with Skeletal Structure. Energies 2021, 14, 3355. [Google Scholar] [CrossRef]
  43. Wu, K.L.; Chen, Z.X.; Li, X.F. Real gas transport through nanopores of varying cross-section type and shape in shale gas reservoirs. Chem. Eng. J. 2015, 281, 813–825. [Google Scholar] [CrossRef]
  44. Wałowski, G. Experimental and Numerical Studies of Gas Permeability through Orthogonal Networks for Isotropic Porous Material. Materials 2021, 14, 3832. [Google Scholar] [CrossRef] [PubMed]
  45. Khoei, A.R.; Amini, D.; Mortazavi, S.M.S. Modeling non-isothermal two-phase fluid flow with phase change in deformable fractured porous media using extended finite element method. Int. J. Numer. Methods Eng. 2021, 122, 4378–4426. [Google Scholar] [CrossRef]
  46. Mrazík, L.; Kříž, P. Porous Medium Equation in Graphene Oxide Membrane: Nonlinear Dependence of Permeability on Pressure Gradient Explained. Membranes 2021, 11, 665. [Google Scholar] [CrossRef] [PubMed]
  47. Jia, B.; Cui, X. Pore pressure dependent gas flow in tight porous media. J. Pet. Sci. Eng. 2021, 205, 108835. [Google Scholar] [CrossRef]
  48. Afagwu, C.; Abubakar, I.; Kalam, S.; Al-Afnan, S.F.; Awotunde, A.A. Pressure-transient analysis in shale gas reservoirs: A review. J. Nat. Gas Sci. Eng. 2020, 78, 103319. [Google Scholar] [CrossRef]
  49. Gao, W.; Zagorščak, R.; Thomas, H.R.; An, N. Simulation of underground coal gasification based on a coupled thermal-hydraulic-chemical model. Combust. Theory Model. 2022, 26, 110–134. [Google Scholar] [CrossRef]
  50. Liu, Q.; Lin, B.; Zhou, Y.; Li, Y.; Ting, L. Experimental verification of permeability and inertial resistance coefficient model in the goaf. Energy Sources Part A Recovery Util. Environ. Eff. 2022, 1–20. [Google Scholar] [CrossRef]
  51. Becker, B.; Guo, B.; Buntic, I.; Flemisch, B.; Helmig, R. An Adaptive Hybrid Vertical Equilibrium/Full-Dimensional Model for Compositional Multiphase Flow. Water Resour. Res. 2022, 58, e2021WR030990. [Google Scholar] [CrossRef]
  52. Wang, O.; Moridis, G.J.; Blasingame, T.A. Wavelet Transforms for the Simulation of Flow Processes in Porous Geologic Media. Transp. Porous Media 2023, 146, 771–803. [Google Scholar] [CrossRef]
  53. Tan, S.-C.; Guo, C.; Jiang, Y.-Y.; Wang, T.; Li, C.-Z. Investigation on permeability of ultra-thin screen wick with free surface using gravity flow and numerical simulation methods. Int. Commun. Heat Mass Transf. 2022, 131, 105879. [Google Scholar] [CrossRef]
  54. Mehmani, A.; Prodanović, M.; Javadpour, F. Multiscale, Multiphysics Network Modeling of Shale Matrix Gas Flows. Transp. Porous Media 2013, 99, 377–390. [Google Scholar] [CrossRef]
  55. Zhao, S.; Liu, H.; Jiang, E.; Zhao, N.; Guo, C.; Bai, B. Study on Apparent Permeability Model for Gas Transport in Shale Inorganic Nanopores. Energies 2022, 15, 6301. [Google Scholar] [CrossRef]
  56. Li, J.; Chen, C. Numerical Simulation of the Non-Darcy Flow Based on Random Fractal Micronetwork Model for Low Permeability Sandstone Gas Reservoirs. Geofluids 2020, 2020, 8884885. [Google Scholar] [CrossRef]
  57. Li, H.; Lei, H.; Yang, Z.; Wu, J.; Zhang, X.; Shouding, L. A hydro-mechanical-damage fully coupled cohesive phase field model for complicated fracking simulations in poroelastic media. Comput. Methods Appl. Mech. Eng. 2022, 399, 115451. [Google Scholar] [CrossRef]
  58. Lysyy, M.; Føyen, T.; Birkeland Johannesen, E.; Fernø, M.; Ersland, G. Hydrogen Relative Permeability Hysteresis in Underground Storage. Geophys. Res. Lett. 2022, 49, e2022GL100364. [Google Scholar] [CrossRef]
  59. Galteland, O.; Rauter, M.T.; Bratvold, M.S.; Trinh, T.T.; Bedeaux, D.; Kjelstrup, S. Local Thermodynamic Description of Isothermal Single-Phase Flow in Simple Porous Media. Transp. Porous Media 2022, 145, 153–173. [Google Scholar] [CrossRef]
  60. Shariati, V.; Roohi, E.; Ebrahimi, A. Numerical Study of Gas Flow in Super Nanoporous Materials Using the Direct Simulation Monte-Carlo Method. Micromachines 2023, 14, 139. [Google Scholar] [CrossRef]
  61. Shi, J.; Chun, Q.; Zhang, Y.; Wang, D.; Liu, Z.; Jin, H.; Liu, C.; Liu, G.; Qian, R. Modified random hierarchical bundle model for predicting gas permeability of cement-based materials. Constr. Build. Mater. 2023, 363, 129859. [Google Scholar] [CrossRef]
  62. Gajda, D.; Lutyński, M. Permeability Modeling and Estimation of Hydrogen Loss through Polymer Sealing Liners in Underground Hydrogen Storage. Energies 2022, 15, 2663. [Google Scholar] [CrossRef]
  63. Rabbani, A.; Babaei, M.; Javadpour, F. A Triple Pore Network Model (T PNM) for Gas Flow Simulation in Fractured, Micro porous and Meso porous Media. Transp. Porous Media 2020, 132, 707–740. [Google Scholar] [CrossRef]
  64. Wu, T.; Wang, Q.; Wang, S. An Apparent Gas Permeability Model for Real Gas Flow in Fractured Porous Media with Roughened Surfaces. Polymers 2021, 13, 1937. [Google Scholar] [CrossRef]
  65. Afagwu, C.; Alafnan, S.; Mahmoud, M.A.; Patil, S. Permeability model for shale and ultra-tight gas formations: Critical insights into the impact of dynamic adsorption. Energy Rep. 2021, 7, 3302–3316. [Google Scholar] [CrossRef]
  66. Dyrka, I.; Kiersnowski, H.; Wójcicki, A. Geology of Tight Gas Deposits. National Geological Institute—National Research Institute. 2025. Available online: https://www.pgi.gov.pl/psg-1/psg-2/informacja-i-szkolenia/wiadomosci-surowcowe/10869-geologia-zloz-gazu-zamknietego.html (accessed on 1 February 2025).
  67. Ahmadi, S.M.A.; Mohammadi, T.; Azizi, N. Effect of halloysite nanotubes incorporation on morphology and CO2/CH4 separation performance of Pebax-based membranes. Korean J. Chem. Eng. 2021, 38, 104–113. [Google Scholar] [CrossRef]
  68. Alakrach, A.M.; Al-Rashdi, A.A.; Al-Omar, M.K.; Jassam, T.M.; Ting, S.S.; Dahham, O.S.; Zulkepli, N.N. Physical and Barrier Properties of Polylactic Acid/Halloysite Nanotubes-Titanium Dioxide Nanocomposites. Mater. Sci. Forum 2021, 1021, 280–289. [Google Scholar] [CrossRef]
  69. Keskin, B.; Ağtaş, M.; Ormancı-Acar, T.; Türken, T.; İmer, D.Y.; Ünal, S.; Menceloğlu, Y.Z.; Uçar-Demir, T.; Koyuncu, İ. Halloysite nanotube blended nanocomposite ultrafiltration membranes for reactive dye removal. Water Sci. Technol. 2021, 83, 271–283. [Google Scholar] [CrossRef]
  70. Lisuzzo, L.; Caruso, M.R.; Cavallaro, G.; Milioto, S.; Lazzara, G. Hydroxypropyl Cellulose Films Filled with Halloysite Nanotubes/Wax Hybrid Microspheres. Ind. Eng. Chem. Res. 2021, 60, 1656–1665. [Google Scholar] [CrossRef]
  71. AbdulKadir, W.A.F.W.; Ahmad, A.L.; Seng, O.B. Carnauba Wax/Halloysite Nanotube with Improved Anti-Wetting and Permeability of Hydrophobic PVDF Membrane via DCMD. Membranes 2021, 11, 228. [Google Scholar] [CrossRef] [PubMed]
  72. Zhang, X.; Zhang, Z.; Zeng, Z.; Du, S.; Liu, E. Superoleophobic graphene oxide/halloysite nanotube composite membranes for oil-water separation. Mater. Chem. Phys. 2021, 263, 124347. [Google Scholar] [CrossRef]
  73. Ahmadi, S.M.A.; Mohammadi, T.; Azizi, N. Superior Pebax-1657/amine-modified halloysite nanotubes mixed-matrix membranes to improve the CO2/CH4 separation efficiency. J. Appl. Polym. Sci. 2021, 138, e50749. [Google Scholar] [CrossRef]
  74. Garcia-Escobar, F.; Bonilla-Rios, J.; Espinoza-Martinez, A.B.; Cerda-Hurtado, P. Halloysite silanization in polyethylene terephthalate composites for bottling and packaging applications. J. Mater. Sci. 2021, 56, 16376–16386. [Google Scholar] [CrossRef]
  75. Viscusi, G.; Lamberti, E.; D’Amico, F.; Tammaro, L.; Gorrasi, G. Fabrication and Characterization of Bio-Nanocomposites Based on Halloysite-Encapsulating Grapefruit Seed Oil in a Pectin Matrix as a Novel Bio-Coating for Strawberry Protection. Nanomaterials 2022, 12, 1265. [Google Scholar] [CrossRef]
  76. Kaze, C.R.; Adesina, A.; Lecomte-Nana, G.L.; Assaedi, H.; Alomayri, T.; Kamseu, E.; Melo, U.C. Physico-mechanical and microstructural properties of geopolymer binders synthesized with metakaolin and meta-halloysite as precursors. Clean. Mater. 2022, 4, 100070. [Google Scholar] [CrossRef]
  77. Wang, B.; He, H.; Li, Y.; Liu, C.; Bai, J.; Zhou, X.; Li, J.; Wang, Y. Fabrication of green poly (L-lactic acid) hybrid membrane through incorporation of functionalized natural halloysite nanotubes. J. Chem. Technol. Biotechnol. 2022, 97, 1676–1683. [Google Scholar] [CrossRef]
  78. Boro, U.; Priyadarsini, A.; Moholkar, V.S. Synthesis and characterization of poly(lactic acid)/clove essential oil/alkali-treated halloysite nanotubes composite films for food packaging applications. Int. J. Biol. Macromol. 2022, 216, 927–939. [Google Scholar] [CrossRef]
  79. Shahabi, N.; Soleimani, S.; Ghorbani, M. Investigating functional properties of halloysite nanotubes and propolis used in reinforced composite film based on soy protein/basil seed gum for food packaging application. Int. J. Biol. Macromol. 2023, 231, 123350. [Google Scholar] [CrossRef]
  80. Wałowski, G. Development of Biogas and Biorafinery Systems in Polish Rural Communities. J. Water Land Dev. 2021, 49, 156–168. [Google Scholar] [CrossRef]
  81. Wałowski, G. Assessment of polydisperse substrate flow in a fermentor for computational fluid dynamics modelling. J. Water Land Dev. 2022, 1–7. [Google Scholar] [CrossRef]
  82. Bade, S.O.; Taiwo, K.; Ndulue, U.F.; Tomomewo, O.S.; Oni, B.A. A review of underground hydrogen storage systems: Current status, modeling approaches, challenges, and future prospective. Int. J. Hydrog. Energy 2024, 80, 449. [Google Scholar] [CrossRef]
  83. Dodangoda, C.; Ranjith, P.G.; Haque, A. Unlocking the potential of underground hydrogen storage for clean energy solutions. Geomech. Geophys. Geo Energy Geo Resour. 2024, 10, 130. [Google Scholar] [CrossRef]
  84. Jin, J.; Zhang, Y.; Ouyang, J.; Yang, H. Halloysite nanotubes as hydrogen storage materials. Phys. Chem. Miner. 2014, 41, 323. [Google Scholar] [CrossRef]
  85. Jin, J.; Fu, L.; Yang, H.; Ouyang, J. Carbon hybridized halloysite nanotubes for high-performance hydrogen storage capacities. Sci. Rep. 2015, 5, 12429. [Google Scholar] [CrossRef] [PubMed]
  86. Jin, J.; Assemi, S.; Asgar, H.; Gadikota, G.; Tran, T.; Nguyen, W.; McLennan, J.D.; Miller, J.D. Characterization of Natural Consolidated Halloysite Nanotube Structures. Minerals 2021, 11, 1308. [Google Scholar] [CrossRef]
  87. Zou, Q.; Chen, Z.; Zhan, J.; Chen, C.; Gao, S.; Kong, F.; Xia, X. Morphological evolution and flow conduction characteristics of fracture channels in fractured sandstone under cyclic loading and unloading. Int. J. Min. Sci. Technol. 2023, 33, 1527–1540. [Google Scholar] [CrossRef]
  88. Zou, Q.; Li, Q.; Liu, T.; Li, X.; Liang, Y. Peak strength property of the pre-cracked similar material: Implications for the application of hydraulic slotting in ECBM. J. Nat. Gas Sci. Eng. 2017, 37, 106–115. [Google Scholar] [CrossRef]
  89. Zhang, L.; Kan, Z.; Zhang, C.; Tang, J. Experimental study of coal fow characteristics under mining disturbance in China. Int. J. Coal Sci. Technol. 2022, 9, 66. [Google Scholar] [CrossRef]
  90. Cheng, Z.; Pan, H.; Zou, Q.; Li, Z.; Chen, L.; Cao, J.; Zhang, K.; Cui, Y. Gas Flow Characteristics and Optimization of Gas Drainage Borehole Layout in Protective Coal Seam Mining: A Case Study from the Shaqu Coal Mine, Shanxi Province, China. Nat. Resour. Res. 2021, 30, 1481–1493. [Google Scholar] [CrossRef]
  91. Li, Q.; Li, Q.; Cao, H.; Wu, J.; Wang, F.; Wang, Y. The Crack Propagation Behaviour of CO2 Fracturing Fluid in Unconventional Low Permeability Reservoirs: Factor Analysis and Mechanism Revelation. Processes 2025, 13, 159. [Google Scholar] [CrossRef]
  92. Li, Q.; Li, Q.; Wu, J.; Li, X.; Li, H.; Cheng, Y. Wellhead Stability During Development Process of Hydrate Reservoir in the Northern South China Sea: Evolution and Mechanism. Processes 2025, 13, 40. [Google Scholar] [CrossRef]
  93. Wałowski, G. Wałbrzych from the Poor Mineshafts to… Underground Gasification of Hard Coal; Catholic Action of the Archdiocese of Lublin: Lublin, Poland, 2009; ISBN 978-83-927527-8-3. Available online: https://bractwotrojka.pl/pl/p/Walbrzych-od-biedaszybow-do...-Podziemne-zgazowanie-wegla-kamiennego-Grzegorz-Walkowski/2797 (accessed on 1 February 2025).
  94. Wałowski, G. Nowa Ruda: From Poor Mineshafts to… Underground Hydrogenation of Hard Coal; Poligraf Publishing House: Brzezia Łąka, Poland, 2021; ISBN 978-83-62752-68-3. Available online: https://www.ksiazki24h.pl/wiecej.php?id=tt-549 (accessed on 1 February 2025).
  95. Javadpour, F. Nanopores and apparent permeability of gas flow in mudrocks (shales and siltstone). J. Can. Pet. Technol. 2009, 48, 16. [Google Scholar] [CrossRef]
  96. Clarkson, C.R.; Jensen, J.L.; Blasingame, T.A. Reservoir engineering for unconventional gas reservoirs: What Do We.Have to Consider? 2011, p. SPE-145080-MS. Available online: https://www.researchgate.net/profile/Sohail-Khan-23/post/How_to_calculate_the_fluid_flow_in_unconventional_shale_reservoirs/attachment/59d6232f79197b807798183c/AS%3A305909538983942%401449945925552/download/SPE_145080_%28Clarkson%29_Res_Eng_Uncon_Reservoirs.pdf (accessed on 1 February 2025).
  97. Wang, M.; Yu, Q. A method to determine the permeability of shales by using the dynamic process data of methane adsorption. Eng. Geol. 2019, 253, 111–122. [Google Scholar] [CrossRef]
  98. Yao, J.; Sun, H.; Fan, D.-Y.; Wang, C.-C.; Sun, Z.-X. Numerical simulation of gas transport mechanisms in tight shale gas reservoirs. Pet. Sci. 2013, 10, 528–537. [Google Scholar] [CrossRef]
  99. Javadpour, F.; Fisher, D.; Unsworth, M. Nanoscale gas flow in shale gas sediments. J. Can. Pet. Technol. 2007, 46, PETSOC-07-10-06. [Google Scholar] [CrossRef]
  100. Wałowski, G. Assessment of gas permeability coefficient of porous materials. J. Sustain. Min. 2017, 16, 55–65. [Google Scholar] [CrossRef]
  101. Wałowski, G. Gas Permeability Model for Porous Materials from Underground Coal Gasification Technology. Energies 2021, 14, 4462. [Google Scholar] [CrossRef]
  102. Wałowski, G. The method to assess the gas flow of a porous bed product derived from underground coal gasification technology. Energy 2020, 199, 117456. [Google Scholar] [CrossRef]
  103. Wałowski, G. Assessment of coke quality related to of effective permeability coefficient and anisotropy coefficient. Fuel 2019, 236, 82–91. [Google Scholar] [CrossRef]
  104. Jarosz, Z.; Kapłan, M.; Klimek, K.; Anders, D.; Dybek, B.; Herkowiak, M.; Hołaj-Krzak, J.T.; Syrotyuk, S.; Korobka, S.; Syrotyuk, H.; et al. Evaluation of Biohydrogen Production Depending on the Substrate Used—Examples for the Development of Green Energy. Energies 2024, 17, 2524. [Google Scholar] [CrossRef]
Figure 1. Scheme of flows through a porous bed [12]: (a) layer of grains with winding channels; (b) rigid skeletal structure with open flows channels and blind pores and closed to flows.
Energies 18 00870 g001
Figure 2. Scheme of flows through a porous bed [12]—Darcy’s model.
Energies 18 00870 g002
Figure 3. Sample of test material, porous material 20 × 20 × 20 mm: (a) karbonizat (coal char) in situ [photo from G. Wałowski]; (b) natural pumice [photo from G. Wałowski]; (c) synthetic pumice [photo from G. Wałowski]; (d) diagram of gas flow through the sample depending on the X, Y, Z axis [prepared by G. Wałowski].
Energies 18 00870 g003
Figure 4. Summary of test results for gas flow resistance ΔPzm through a granular and porous bed acc. to Table 1 (prepared by G. Wałowski).
Energies 18 00870 g004aEnergies 18 00870 g004b
Figure 5. Gas permeability coefficient KV = f(ΔP)—selected material characteristics: epoxy resin- Gajda and Lutyński [62]; dacite—Jiang and co-workers [25]; carbonate rocks—Rabbani and co-workers [63]; mudstone—Wu and co-workers [64]; shales—Afagwu and co-workers [65]—related to karbonizat (coal char) in situ (Wałowski’s own research); synthetic pumice (Wałowski’s own research); natural pumice (Wałowski’s own research)—acc. to Table 2 (prepared by G. Wałowski).
Energies 18 00870 g005
Table 1. Research on the hydrodynamics of gas flow through a granular and porous deposit (prepared by G. Wałowski).
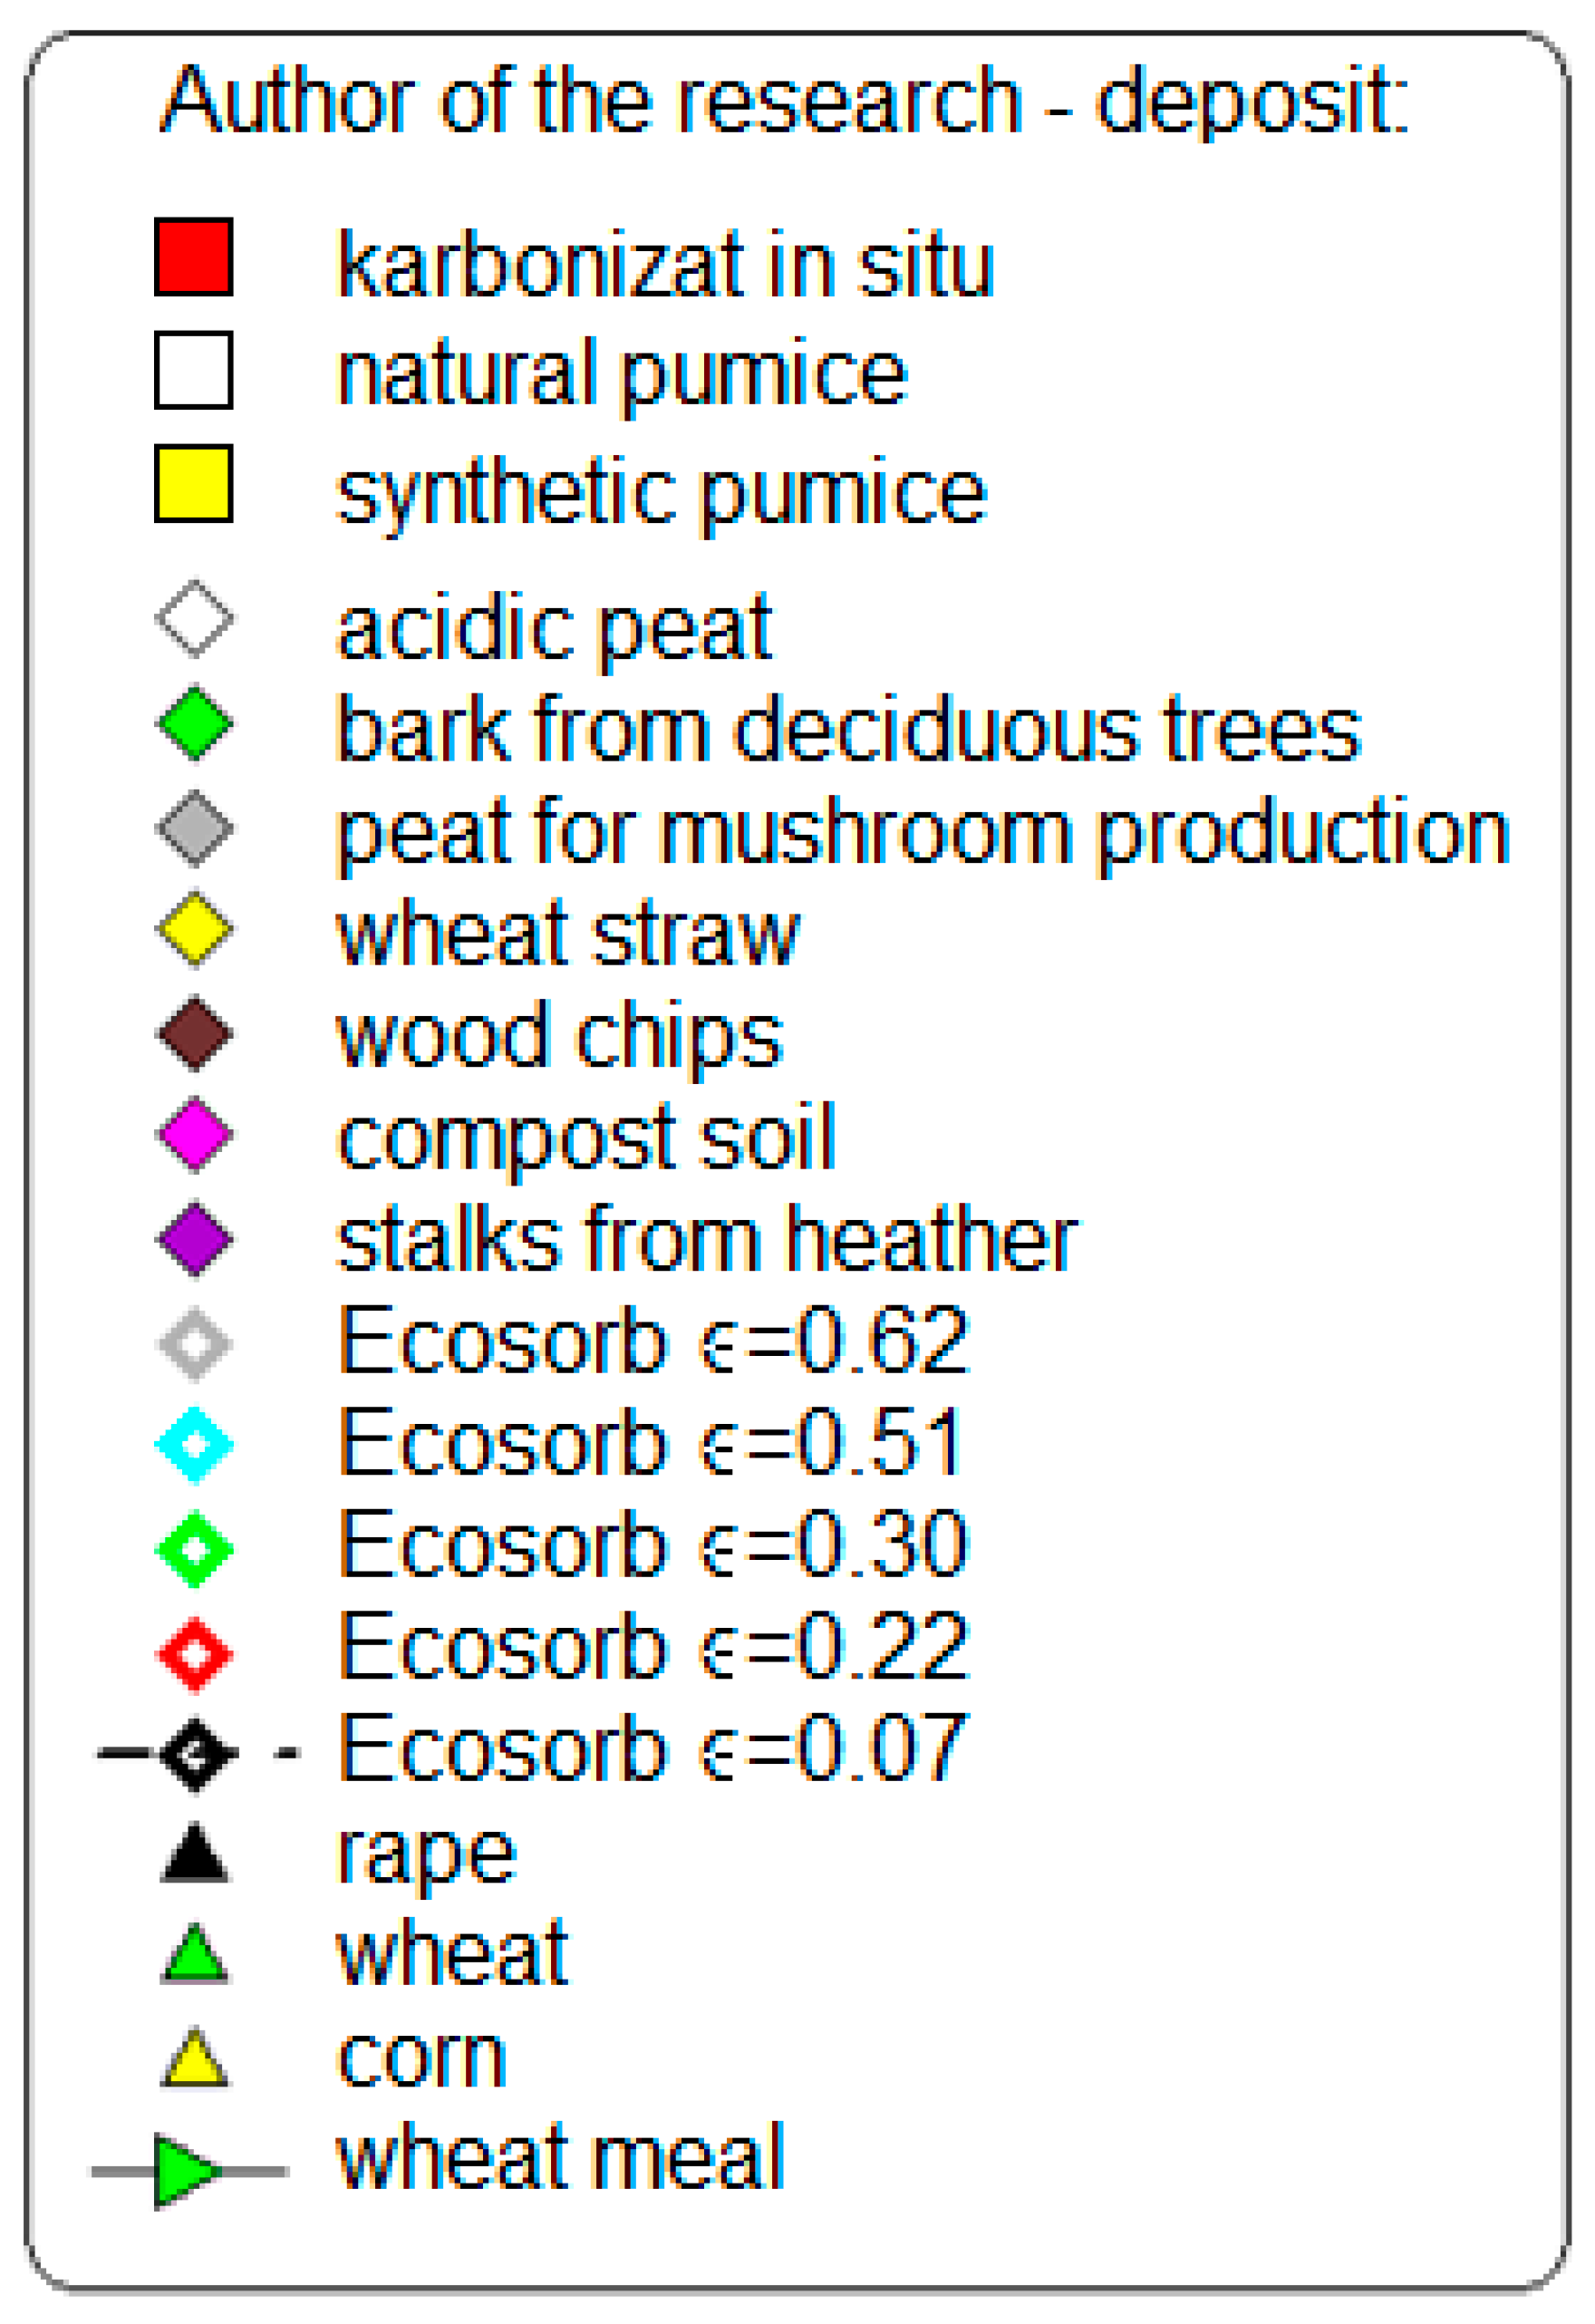
Characteristics of the Deposit
Type
Material
Height of the Deposit
L, m
Diameter of the Column (Deposit)
D, m
Grain Replacement Diameter (Pores)
de, m
Sample Cross-Section
A, m2
Sample Porosity (Deposit)
ε
Gas Velosity
wo, m/s
acidic peat [19]0.450.175 0.02400.470.07–0.16
bark from deciduous trees [19]0.650.07–0.18
peat for mushroom production [19]0.750.07–0.16
wheat straw [19]0.930.05–0.16
wood chips [19]0.680.05–0.15
compost soil [19]0.620.05–0.15
stalks from heather [19]0.930.06–0.16
Ecosorb-100 [20]0.450.1750.00050.02400.620.05–0.08
0.00080.510.03–0.09
0.00210.300.03–0.08
0.00290.220.02–0.07
0.01670.070.02–0.05
rape [21]0.950.1960.001860.01210.400.05–0.20
wheat [21]0.004100.01420.470.05–0.25
corn [21]0.007850.01300.430.05–0.25
wheat meal [22]100.1960.0040.0302-0.021–0.21
karbonizat (coal char) in situ
(Wałowski—own research)
0.02-0.0000680.00040.450.03–0.11
natural pumice
(Wałowski—own research)
-0.630.01–0.06
synthetic pumice
(Wałowski—own research)
-0.880.02–0.18
Table 2. Fluid permeability models indicating an application problem (prepared by G. Wałowski and Jakub T. Hołaj-Krzak)—Appendix A.
Model AuthorsMaterialFlowModelEquation
Darcy
[23]
porous tankCO2
CH4
CH4 gas hydrate
m S g v g = k g μ g p x (4)
Darcy
[24]
Berea sandstonetwo-phase fluid q = k A μ L P ρ g (5)
Darcy–Waite
[25]
cohesive rockfluid q = e 3 12 v P X (6)
Darcy
[26]
cohesive rockfluid q = k v P X (7)
Darcy–Brinkman
[27]
particles of a porous ballfluid Ω = 2 β 2 1 tanh β β 2 β 2 + 3 1 tanh β β (8)
Darcy
[28]
pore networks in porous mediathrottle reverse k p h a s e r = η p h a s e Q p h a s e R C K A L P i P o (9)
Darcy
[29]
porous mediumnumeric v = K μ g grad p (10)
Darcy
[30]
porous mediumtwo-phase v J = k J μ J grad p J ρ J g (11)
Zolotareva–Dubininina
[31]
porous polymer membranessteam D i m = l c 0 θ ( M ) t 0 D a γ c 1 m
D i m = a 1 λ 1 c a 1 a 2 γ 1 c λ 2 ( c )
D a = a 1 a 2 γ 1 c γ 2 c 1 m
(12)

(13)

(14)
Darcy–Forchheimer
[32]
corundum porous materialsgas d P d x = μ k 1 v s + ρ k 2 v s 2 (15)
Carman
[33]
round and flat, tight channels of fractured porous mediagas K * = ϕ R e 2 8 τ h (16)
Soave’a–Redlicha–Kwonga
[34]
porous structures with oil depositsCO2
N2
ln φ i L = b i b m Z L 1 ln Z L b m P L R T a m b m R T 2 j = 1 n x j a i j a m b i b m ln 1 + b m P L Z L R T
ln φ i V = b i b m Z V 1 ln Z V b m P V R T a m b m R T 2 j = 1 n y j a i j a m b i b m ln 1 + b m P V Z V R T
(17)


(18)
Younga–Laplace’a
[34]
porous structures with oil depositsCO2
N2
P c a p = 2 σ cos θ r (19)
Darcy
[35]
triple pore networks (T-PNM) in fractured, microporous and mesoporous mediagas i = 1 n K g i A i P i μ g L i = 0 (20)
Effective-medium approximation
[36]
shales and porous rocksgas g e g g + Z 2 1 g e f g d g = 0 (21)
Hydro-mechanical
[37]
saturated bentonitegas k c r e e p = a c r e e p θ c r e e p θ c r e e p , r e f
θ c r e e p t 0 = θ c r e e p , r e f
d θ c r e e p d t = c r θ c r e e p P g P c r e e p P c r e e p , P g > P c r e e p     θ c r e e p θ c r e e p m a x   0 , P g < P c r e e p     θ c r e e p θ c r e e p m a x  
(22)
(23)
(24)
Network Boltzmanna
[38]
Boltzmann networks on the pore scalefluid f i x + e i δ t ,   t + δ t f i x , t = 1 τ f i x , t f i e q x , t
f i e q = ρ ω i 1 + e i · u c s 2 + u u e i e i c s 2 I 2 c s 4
(25)

(26)
Forchheimer
[39]
porous media on the meso and macro scalefluid grad P = μ k u + β ρ u 2 (27)
Type (extended) Darcy
[40]
heterogeneous formationsfluid k r , w e f S w , Q t o t , f f = Q t o t 1 f f A L p w Q t o t , f f μ w k e f
k r , n w e f S w , Q t o t , f f = Q t o t f f A L p n w Q t o t , f f μ n w k e f
(28)

(29)
Darcy
[41]
porous mediumfluid p t 1 ε μ x k P P x = 0
x = 0 : P = P 1 t
x = L : P x = 0
t = 0 :   P = P i
(30)

(31)
(32)
(33)
Darcy–Weisbach
[42]
a fragment of a deposit of porous material with a skeletal structurefluid P = a R e n 2 ρ w e 2 2 L d e (34)
Darcy
[43]
cracked porous media with rough surfacesgas k a s = μ m t o t a l ρ A p L 0
L 0 = A
(35)

(36)
Darcy
[44]
orthogonal networks of isotropic porous materialgas Q = K A 0 ρ g η h L (37)
Darcy
[45]
cracked porous mediatwo-phase fluid w w = k w p w + ρ w b u D D t w w n S w
w g = k g p g + ρ g b u D D t w g n S g
(38)

(39)
Darcy–PDE
[46]
porous medium in a graphene oxide membranegas q x = k μ lim x w p x
F p i n = k μ RT M A M V IC lim x w ρ p x
(40)

(41)
Beskok–
Karniadakis
[47]
porous mediumgas k a k = 1 + α K n K n 1 + 4 K n 1 + K n (42)
Wasaki–Akkutlu
[48]
shale and ultratight formationCH4 κ a p p = d 2 32 + μ D e f f c g + μ D s V s L ρ g r a i n B g T O C p L p + p L 2 (43)
Geng
[48]
shale and ultratight formationCH4 κ a p p = d 2 32 + K n 2 + K n K n 2 + 1 d μ 3 p 8 R T π M + 4 D s p L M C L μ p + p L 2 ρ d d m θ d m 2 θ 2 d 2 (44)
Cai
[48]
shale and ultratight formationCH4 κ a p p = d 2 32 + K n K n + 1 d μ 3 p 8 R T π M + 4 D s p L M C L μ p + p L 2 ρ d d m θ d m 2 θ 2 d 2 (45)
Yanfeng
[48]
shale and ultratight formationCH4 κ a p p = F d 2 32 + D e f f μ M ρ R T + D s ξ m s ρ a d s p μ ρ (46)
Wu
[48]
shale and ultratight formationCH4 κ a p p = ϕ τ k p V s t d R T 1 + α K n 1 + K n 1 + 6 K n 1 + K n + 2 ϕ 3 τ r d m 2 r D f 2 8 π R T M v s t d μ 1 1 + 1 K n + ϕ τ 1 d m r 2 1 D s C s V s t d μ p M
C s = 4 θ M π N A d m 2
(47)


(48)
Darcy
[49]
coalsynthesis gas v g = k μ g P g (49)
Liu
[50]
porous medium, goafsfluid K = ψ K d 2 A ε 3 1 ε 2
ψ K = 0.530 d 0.401
A = 84.271 + 3.216 d 0.520 + 60.590 + 35.221 · 0.953 d ε + 33.452 16.690 · 0.952 d ε 2
(50)

(51)
(52)
Darcy
[51]
porous mediummultiphase u b = λ b k p b + ϱ b g z
λ b k r , b μ b
u g = λ g k p g + ϱ g g z
λ g k r , g μ g
(53)
(54)

(55)
(56)
Darcy
[52]
porous geological mediafluid k ρ μ p ρ g z g + Q = t ρ ϕ (57)
Buckley’a–Leveretta
[52]
porous geological mediafluid S w x = q ϕ A f w S w x (58)
Darcy
[53]
ultra-thin sieve wick with a free surfacenumeric, fluid k = μ m ˙ ρ 2 A g sin θ i n = μ V ˙ ρ A g sin θ i n (59)
Darcy
[54]
slate matrixgas K a p p = q μ L A P (60)
Javadpoura
[55]
inorganic shale nanoporesgas k a p p = r e 2 r m 2 ε r r e 2 8 1 + α K n * 1 + 4 K n * 1 b K n * + r e 2 r m 2 ε k μ M D k Z R T + 1 r e 2 r m 2 μ Z R T D s C s M P 2 (61)
Forchheimer
[56]
sandstone with low permeabilitynumeric, gas 1 k g = 1 k + β ρ ν μ (62)
Forchheimer–Zolotukhina–Gaybova
[39]
porous mediumliquid k μ ρ p d p d x = ρ p x u F + τ k μ ϕ ϕ ρ 2 p x u F 2 (63)
Zolotukhina–Gaybova
[39]
porous mediumliquid k μ ρ 0 p 0 p d p d x = u F , m + τ k μ ϕ ϕ u F , m 2 (64)
Darcy
[57]
poroelastic centerfluid υ = k η f p + ρ f g (65)
Darcy–Poiseuille’a
[57]
poroelastic centerfluid k = k m + d e k f k m (66)
LET
[58]
underground warehouseH2 K r g = K r g * 1 S w n L g 1 S w n L g + E g S w n T g
K r w = K r w * S w n L w S w n L w + E w 1 S w n T w
(67)


(68)
Darcy
[59]
porous mediumsingle-phase J V = k η b p ^ L = k η b p b L (69)
DSMC
[60]
supernanoporous mediumnumeric, gas K i n t = μ U a v g P i P o
K a p p = 2 μ L P o U o P i 2 P o 2
(70)

(71)
Modified RHBM
[61]
cement-basedgas (72)
k a = μ L s S s i = 1 N c 1 j = 1 M i 1 π d f 4 L j 1 128 μ + 1 64 d f 8 π R T M 2 a 1 1 P m , j + 1 12 d j 8 R T π M 1 P m , j
Disclaimer/Publisher’s Note: The statements, opinions and data contained in all publications are solely those of the individual author(s) and contributor(s) and not of MDPI and/or the editor(s). MDPI and/or the editor(s) disclaim responsibility for any injury to people or property resulting from any ideas, methods, instructions or products referred to in the content.

