1. Introduction
Road transport is responsible of one quarter of global energy consumption [
1] and one fifth of global CO
2 emissions [
2]. To reach climate neutrality, CO
2 emissions from the heavy-duty vehicle fleet must also be reduced [
3]. In the European Union (EU), the European Parliament and the Council of the EU established a CO
2 emission performance standard for heavy-duty vehicles in 2019 [
4]. In United States (US), the Environmental Protection Agency (EPA) and the National Highway Traffic Safety Administration (NHTSA) developed a greenhouse gas (GHG) emission standard for heavy- and medium-duty vehicles in 2011 (Phase 1), revised it in 2016 (Phase 2), and are planning to revise it again (Phase 3) [
5,
6]. Also, Canada recently updated in 2018 the GHG emission regulation on heavy-duty vehicles [
7].
Although diesel oil is still the conventional and predominant fuel for heavy-duty vehicles [
8], many alternative fuel technologies (e.g., biodiesel from different feedstocks, hydrogen and other synthetic fuels, biogas) have been studied for the transport sector to increase its sustainability while reducing costs, GHG emissions, and air pollutant emissions [
1]. Decarbonizing heavy-duty vehicles via electrification presents certain challenges, such as the environmental impacts of manufacturing electric vehicles, the lack of recharging infrastructure, the limited performances of current batteries, translating in short driving ranges, and the critical and scarce materials to produce the batteries [
9]. This is especially true for heavy-duty vehicles and long-haul applications because of factors such as long distances, uncertain routes, high uptime needs, rigorous driving-time schedules, and the need for huge payloads. [
10]. The current energy densities of batteries remain inadequate to accommodate the heightened weight and extended range requirements of heavy-duty vehicles, thereby resulting in excessive weight burdens and prolonged charging durations. [
10]. Moreover, decarbonizing heavy-duty vehicles via electrification requires additional renewable electricity supply, which may necessitate extensive upgrades to grid infrastructure, and improved batteries to cope with the intermittency and variability of renewables [
9,
11,
12,
13]. Lastly, the costs and lead times associated with these advancements have the capacity to impede the pace of progress [
11,
14].
Hydrogen as a fuel has been studied since 90s [
15,
16,
17] and it has been discovered to be a promising solution to address the issue of decarbonization in internal combustion engines (ICEs) [
13,
18,
19,
20,
21] and it has been found to produce outstanding engine performance in terms of thermal efficiency, fuel consumption, and energy consumption [
22]. In comparison to gasoline and diesel oil, hydrogen has several advantages over these fuels, including better engine cold start and efficiency, generally reduced pollutant emissions, and less lubricating oil contamination [
19,
22], even if the increased concentration of water in the crankcase requires an adaptation of the engine lubricating oil [
21]. Also, it does not contribute to emissions of pollutants such as carbon oxides (i.e., CO, CO
2) because it is a non-toxic and carbon-free gas [
18,
19]. Instead, due to the high temperatures involved during combustion in engine cylinders, hydrogen combustion is expected to produce only nitrogen oxides (NOx) emissions, and it may cause lubricant oil to oxidize or burn, generating particulate matter (PM) and unburned hydrocarbons (HC) [
13,
19,
23]. However, according to [
13], these issues can be solved by using a lean mixture, an appropriate after-treatment system, and selecting a specific lubricating oil.
Despite concerns around its production, hydrogen is abundant in most of the universe, but it rarely exists in nature in a pure form, nor molecular or elemental, and it must be extracted from other compounds [
19,
24,
25]. In contrast with the current need for reducing fossil fuel demand, hydrogen is currently extracted from fossil fuels, so the least expensive and most common method to produce hydrogen is steam methane reforming (SMR) from natural gas [
26], one-fifth of the global hydrogen production is based on coal gasification (CG) and just 4% is based on water electrolysis [
22,
24,
25,
27].
From the technological point of view, the implementation of hydrogen as a fuel in ICEs entails considering the differences in physiochemical properties between hydrogen and common fuels [
22]. Furthermore, hydrogen internal combustion engines (H2-ICEs) require certain engine modifications in order to perform properly [
19]. Also, the use of hydrogen in ICEs takes place as a monofuel or as an additional fuel [
19]. Using hydrogen as a monofuel in ICEs involves susceptibility to abnormal combustion phenomena such as early ignition, back-ignition (or flashback), and engine knock formation [
19,
22]. However, the use of hydrogen as an additional fuel will only constitute a transition step toward using hydrogen as a monofuel [
19].
To quantify potential benefits and burdens of using hydrogen as fuel in ICEs, the life-cycle assessment (LCA) methodology can be applied, which considers the comprehensive GHG emissions of the novel solution from the raw material acquisition to disposal at end-of-life (EoL) [
25]. Because engines are made up of hundreds of components and data flows, applying LCA to them (and other complex products like vehicles) is a cutting-edge topic right now [
28]. In fact, simplification strategies have previously been used in the field of LCA, reducing the reliability of the results. This is especially important when it comes to ensuring comparability, such as when comparing data from hydrogen and diesel engines.
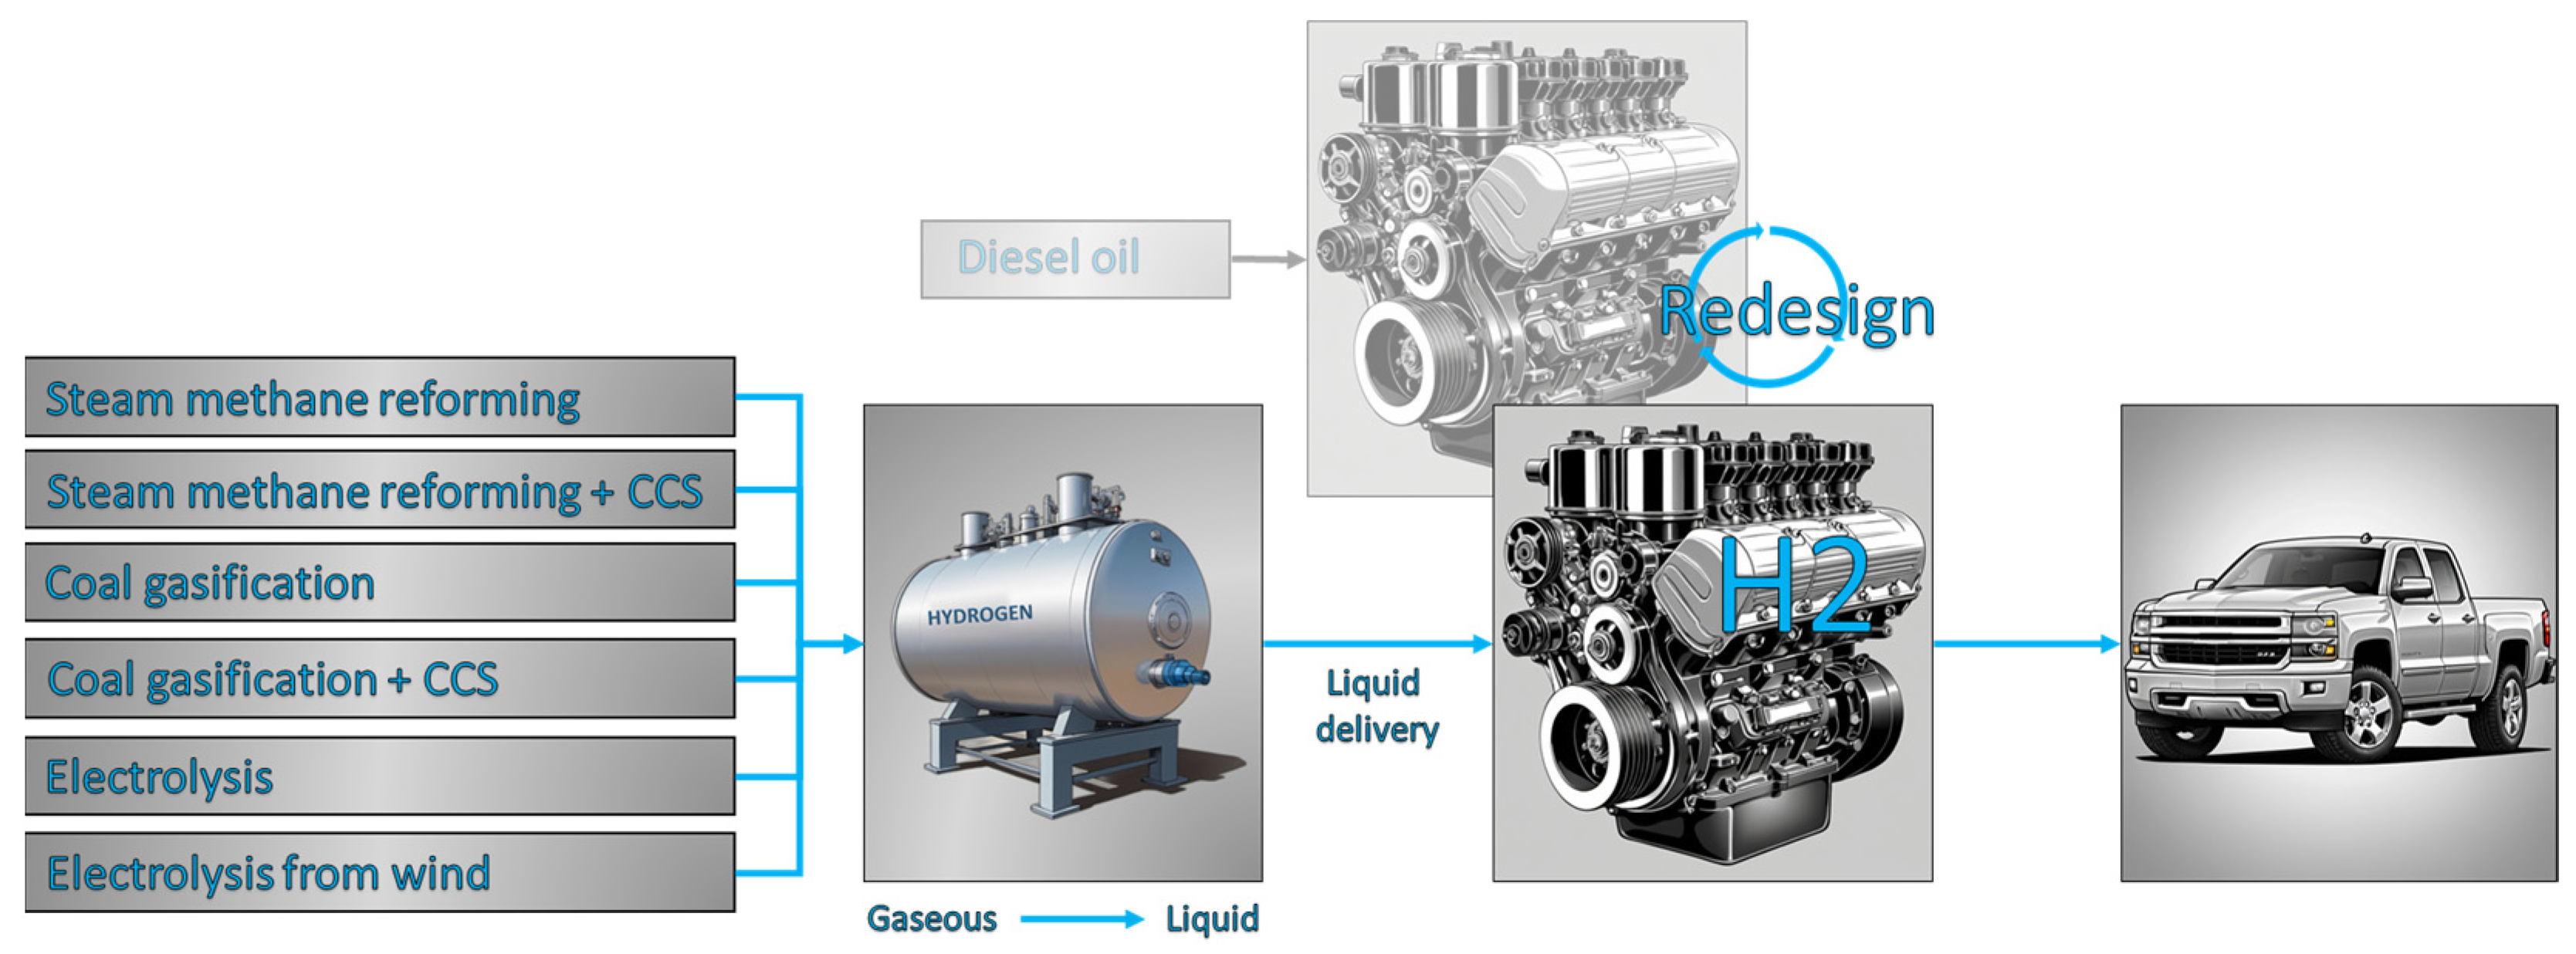
The present study aims at (1) developing a methodology for applying LCA to ICEs to estimate their climate-change emissions in a life-cycle perspective; (2) investigating the decarbonization potential of H2-ICEs produced by exploiting existing diesel oil-fueled engines (DIE-ICEs) and assuming diverse hydrogen production routes (
Figure 1). The products under comparison are two monofuel engines suitable for a wide range of applications such as automotive, cogeneration, maritime, off-road, and railway. However, they are specifically being evaluated for their use in pickup truck operations in this study. In the reference scenario, the H2-ICE has been redesigned based on the DIE-ICE. The redesign process occurred by modifying certain subsystems (e.g., combustion systems, injection, ignition, exhaust gas recirculation, and aftertreatment). Lastly, it must be noted that similarly to electricity production, the environmental impact of hydrogen production depends on the assumed production route [
29]. In the reference scenario, the H2-ICE is fueled by liquid hydrogen produced by SMR. Then, a sensitivity assessment has been conducted and the following hydrogen production routes have been compared:
SMR
SMR + carbon capture and storage (CCS)
CG
CG + CCS
Electrolysis of water (from grid electricity mix)
Electrolysis of water (from wind)
2. Materials and Methods
According to [
30,
31], the methodology to be applied for an LCA analysis should include (1) goal and scope definition, (2) life-cycle Inventory (LCI), (3) life-cycle impact assessment (LCIA), and (4) interpretation of results.
This section describes in detail the assumption made in the first three steps while the obtained results are commented in
Section 3. Also, the LCIs are reported in the
Supplementary Materials to allow for replicability.
2.1. Goal and Scope Definition
The goal of this study is to evaluate the environmental impacts associated with the entire life cycle of a hydrogen-powered internal combustion engine (i.e., H2-ICE) suitable for automotive applications. To fulfill this goal, the LCA methodology is applied, and a cradle-to-grave study is conducted with a focus on GHG emissions. Lastly, the H2-ICE is compared with a diesel oil-powered internal combustion engine (i.e., DIE-ICE) to investigate potential benefits and/or burdens.
The products under study are two internal combustion engines with eight cylinders arranged on two V-shaped banks, for a total displacement of 6.6 L (
Table 1).
Table 1 indicates that the H2-ICE has a greater weight compared to the DIE-ICE. The greater weight of the H2-ICE compared to its diesel counterpart is mostly due to the need for the H2-ICE to be versatile for applications beyond automotive use, such as stationary energy generation and maritime applications.
The functional unit (FU) quantifies the performance of a product system [
30], and it enables the comparison of different products or systems that serve the same final function [
32]. In this study, the functional unit is 1 driven kilometer (km) of the entire lifespan of the vehicle. In compliance with [
33], a vehicle’s lifetime of 150,000 miles has been assumed because the engine is intended for use in a pickup truck.
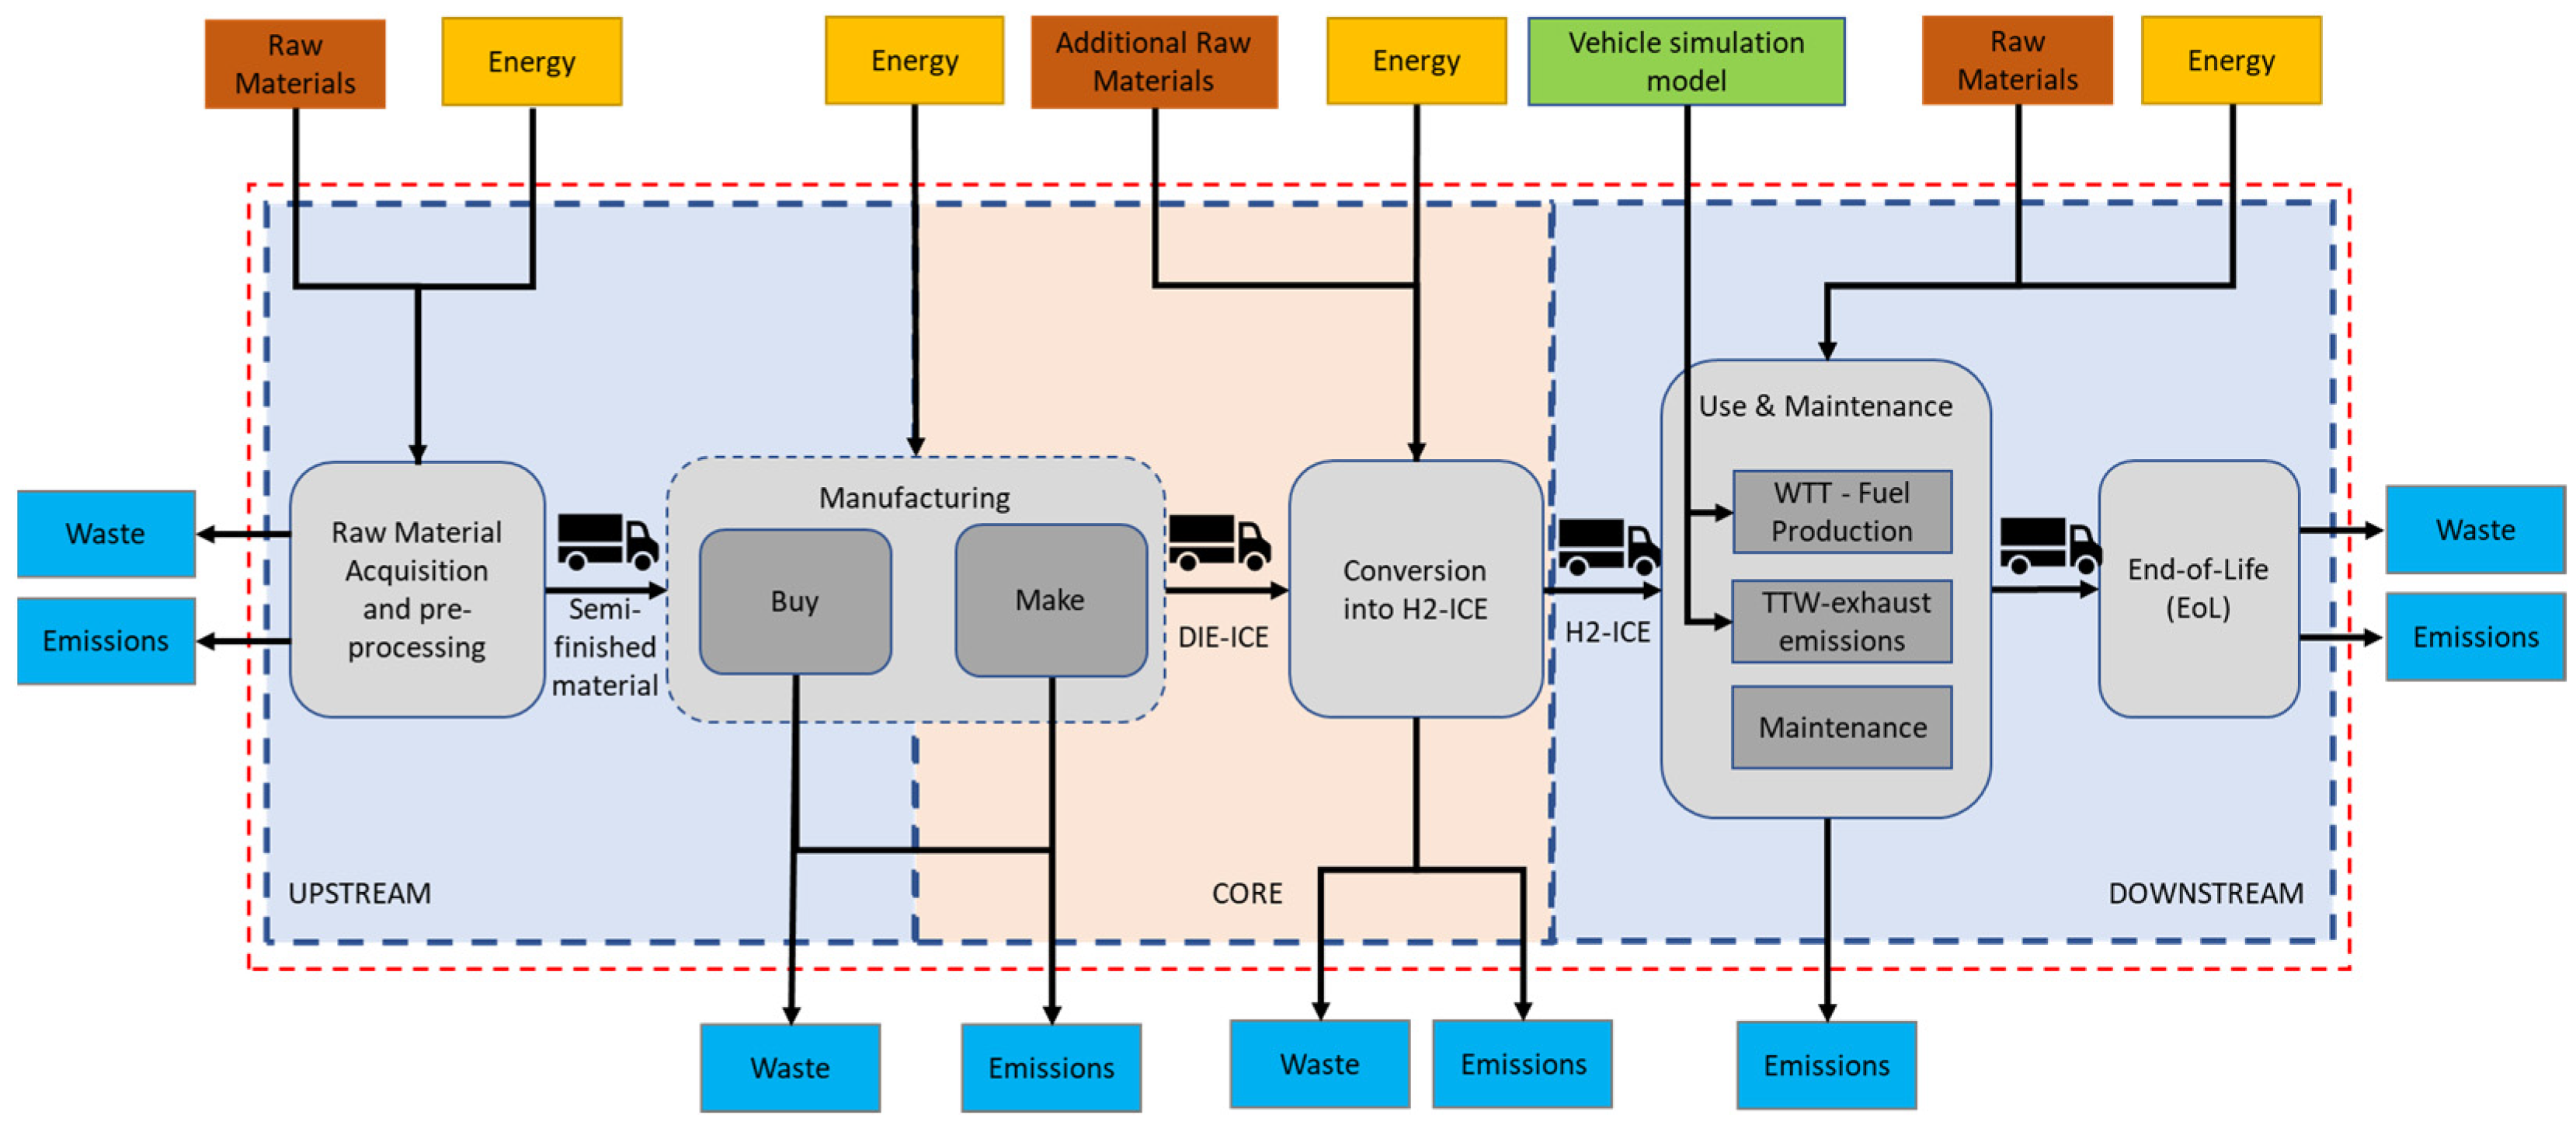
The system boundary is cradle-to-grave, i.e., all the stages of the whole product life cycle are considered, i.e., raw material acquisition and preprocessing, manufacturing, use and maintenance, and end-of-life (EoL) phases (
Figure 2). As shown in
Figure 2, the core boundary comprises all those processes that are under the responsibility of the engine manufacturer (i.e., “Make” and “Conversion into H2-ICE” boxes). The label “Make” refers to those components and assemblies that are manufactured in the main engine plant while the label “Conversion into H2-ICE” refers to those components, assemblies and processes needed to convert the diesel engine to hydrogen. The upstream boundary comprises the raw material acquisition and pre-processing phase, the transport of semi-finished materials to suppliers and the manufacturing of those components that are purchased from suppliers off-the-shelf (i.e., “Buy” box). Lastly, the downstream boundary comprises emissions related to the use, maintenance, and EoL phases. For the use phase, the emissions related to fuel production (i.e., hydrogen and diesel oil) are included. Fuel consumption and exhaust emissions have been estimated based on a vehicle simulation model (i.e., green box) as described in
Section 2.2.4. Based on the results of the vehicle simulation model, the emissions related to both the well-to-thank (WTT) and tank-to-wheel (TTW) parts have been estimated. In addition to the direct emissions at the vehicle’s exhaust pipe, or TTW analysis, the analysis of the environmental effects related to the engine use phase also takes into account the indirect emissions related to fuel production, or WTT analysis [
29]. A well-to-wheel (WTW) study has been performed to model the use phase emissions in a life-cycle perspective.
2.2. Life-Cycle Inventories
This study is mainly based on primary data provided by Dumarey Automotive Italia S.p.A. (Turin, Italy) Ecoinvent version 3.8 has served as the background database for all those processes comprised in the background system (e.g., production of electricity and heat, raw material extraction from ores up to their processing into suitable form to be fed into the engine construction stage). SimaPro version 9.3.0.3 has been used as the LCA software. In cases where Ecoinvent was insufficient, data from the literature have been used to create LCIs.
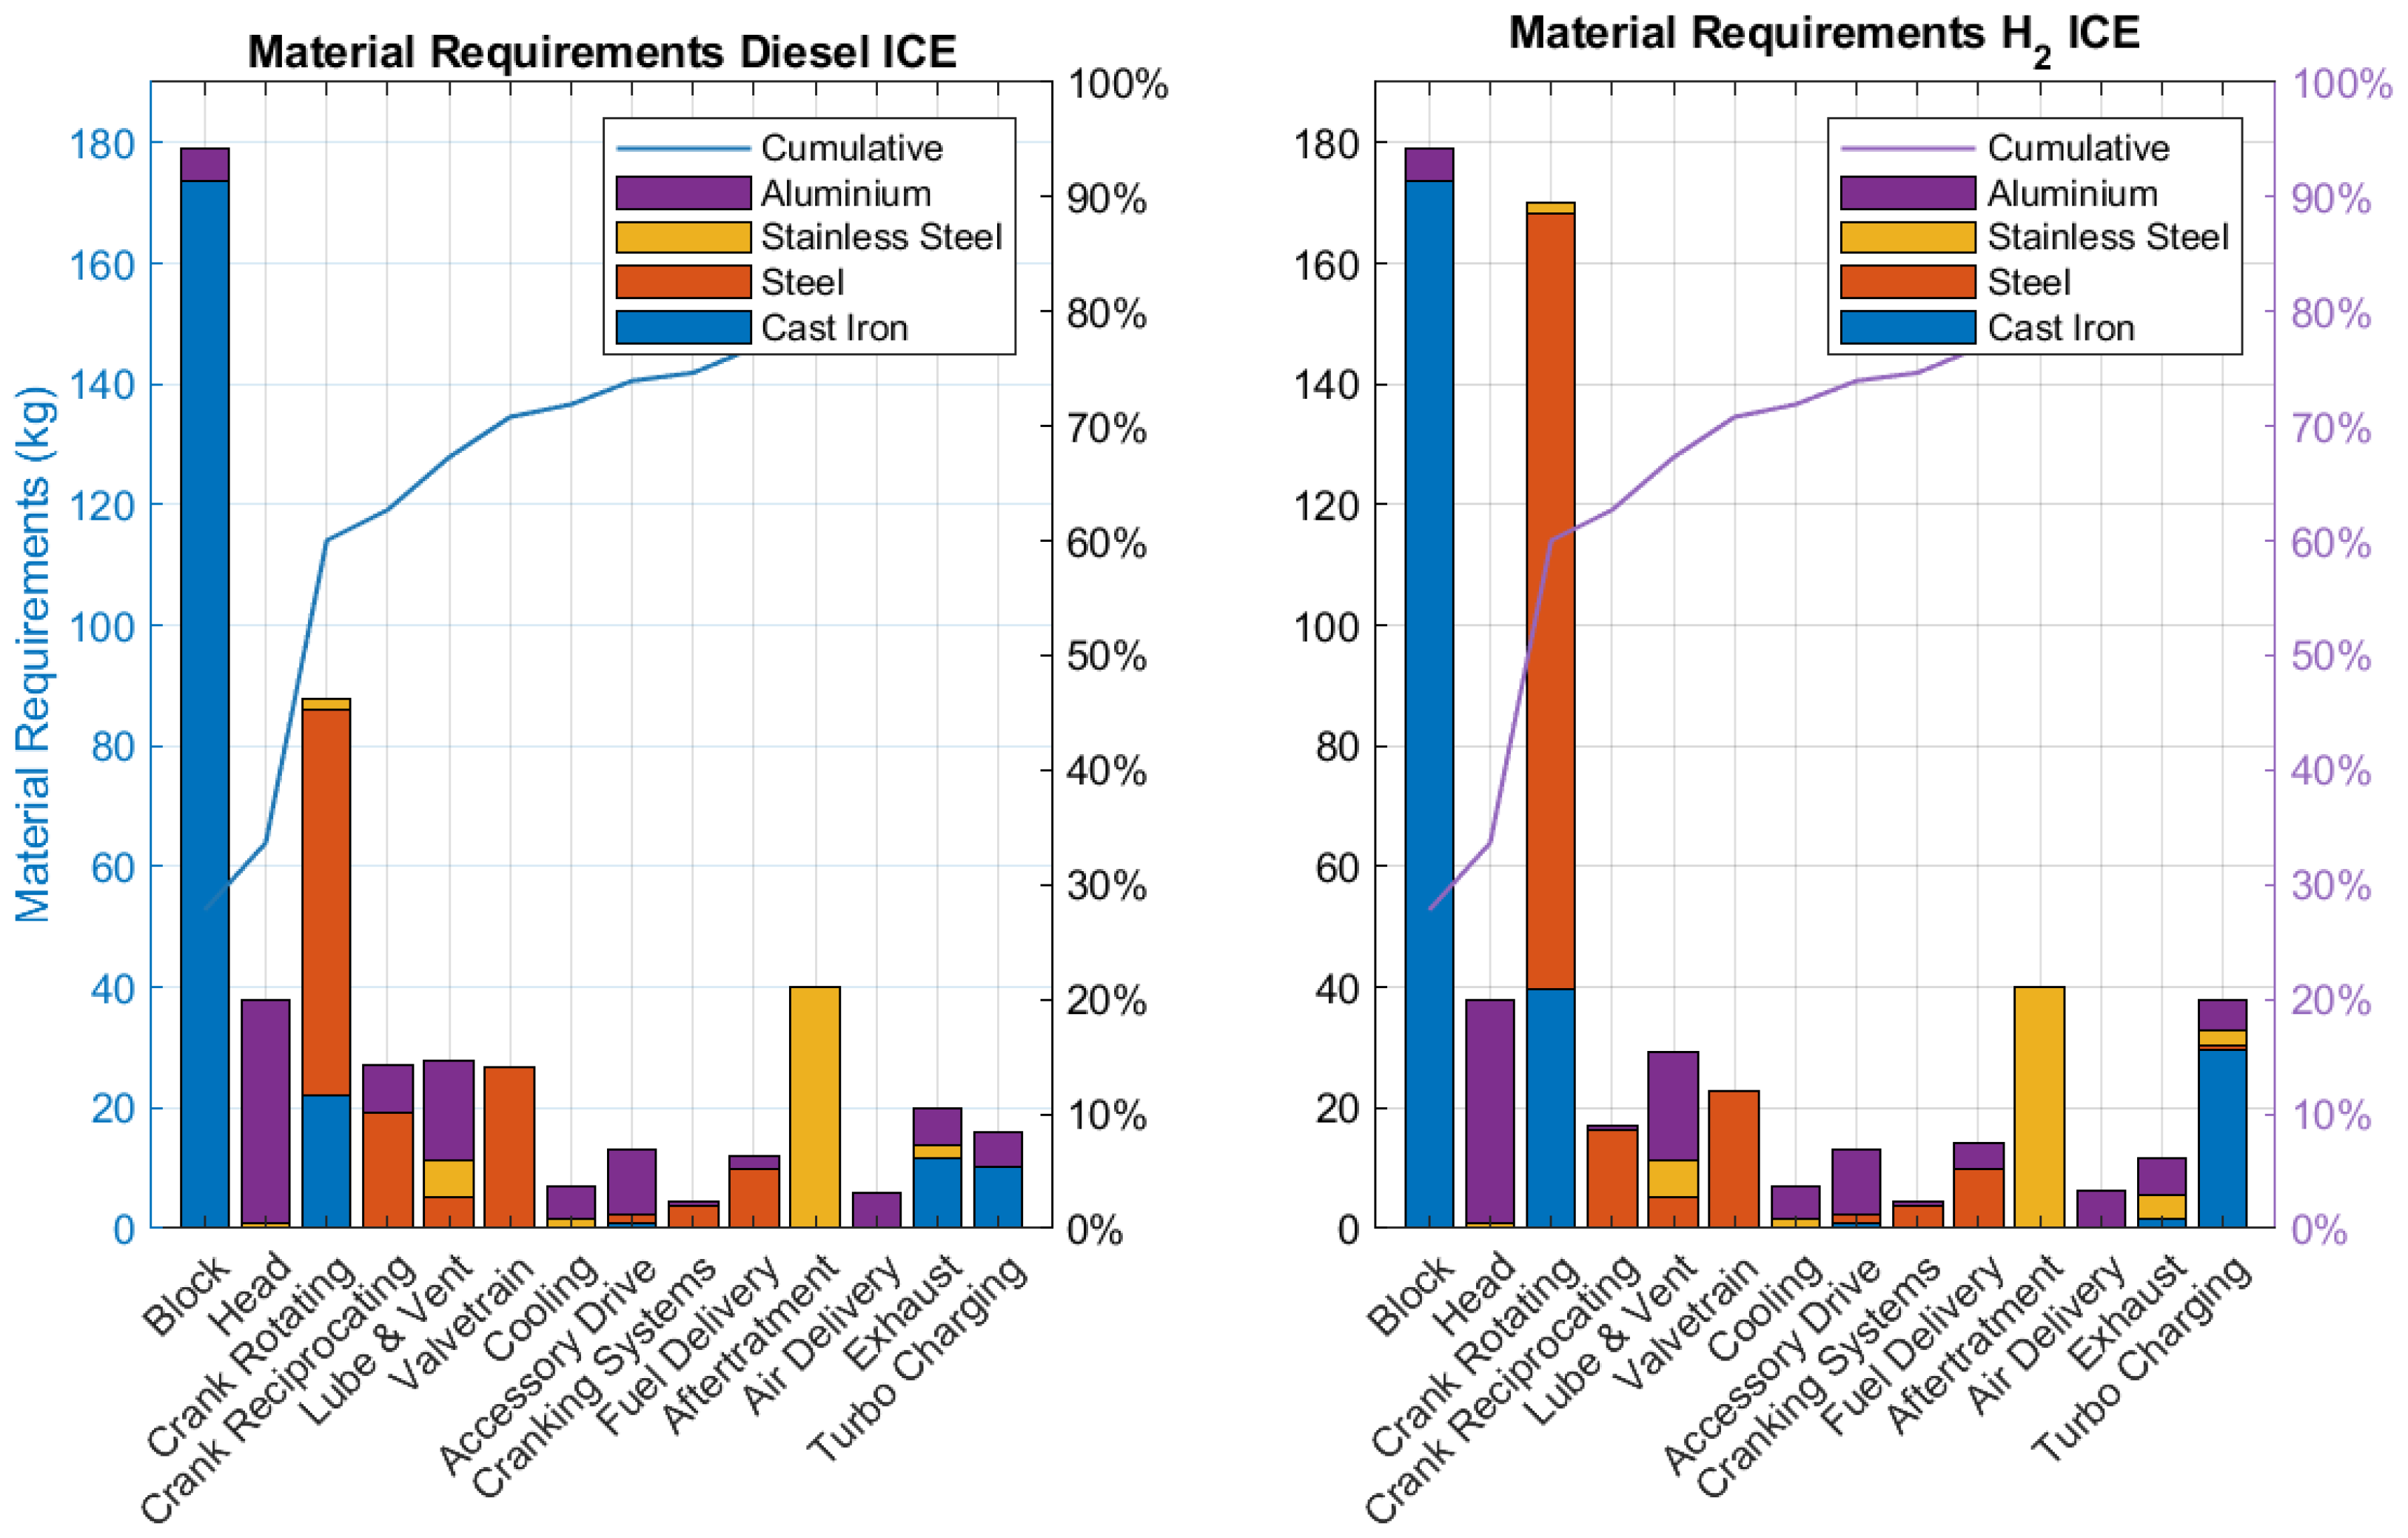
The LCI modelling concept is explained in detail in the paragraphs that follow. However, as a general comment, the inventory modelling was restricted to only those components that have the greatest influence on engine weight to reduce the data gathering effort while maintaining dependability and consistency of the results. However, even after neglecting the lighter components, this study still accounts for over 90% of the engine’s total diesel engine weight (
Figure 3).
2.2.1. Raw Material Acquisition
Based on the diesel engine bill of materials (BoM), the raw material requirement (i.e., gross weight) of each material involved in the manufacturing process has been calculated to take into account the materials needed as well as the amount of pre-consumer scrap generated during the manufacturing process (
Figure 3).
Figure 3 shows the material requirement for the diesel configuration (on the left) and hydrogen configuration (on the right). Results are provided by dividing the engine into subsystems according to
Table 2. The subsystems block, cranktrain-rotating, aftertreatment, and head turned out to be the most demanding in terms of raw material requirement in both engines. In addition, the cylinder block, cylinder head, and crankshaft (respectively included in block, head, and cranktrain-rotating subsystems) resulted to be the engine components that need most input materials.
Moreover, there is a significant weight difference between the cranktrain-rotating subsystems in the two engine configurations (
Figure 3). This contrast arises from the design of the engine being examined, which features eight cylinders arranged in two V-shaped banks. Notably, only one camshaft is integrated into the cylinder block, leading to a simpler cylinder head geometry and a more complex cylinder block. Additionally, due to the low production volume, H2-ICE manufacturing processes are minimally optimized. For example, the flywheel’s weight is significantly higher because, due to low production volumes of the H2-ICE, the manufacturing process has involved machining from a solid block of steel rather than casting, leading to suboptimal efficiency.
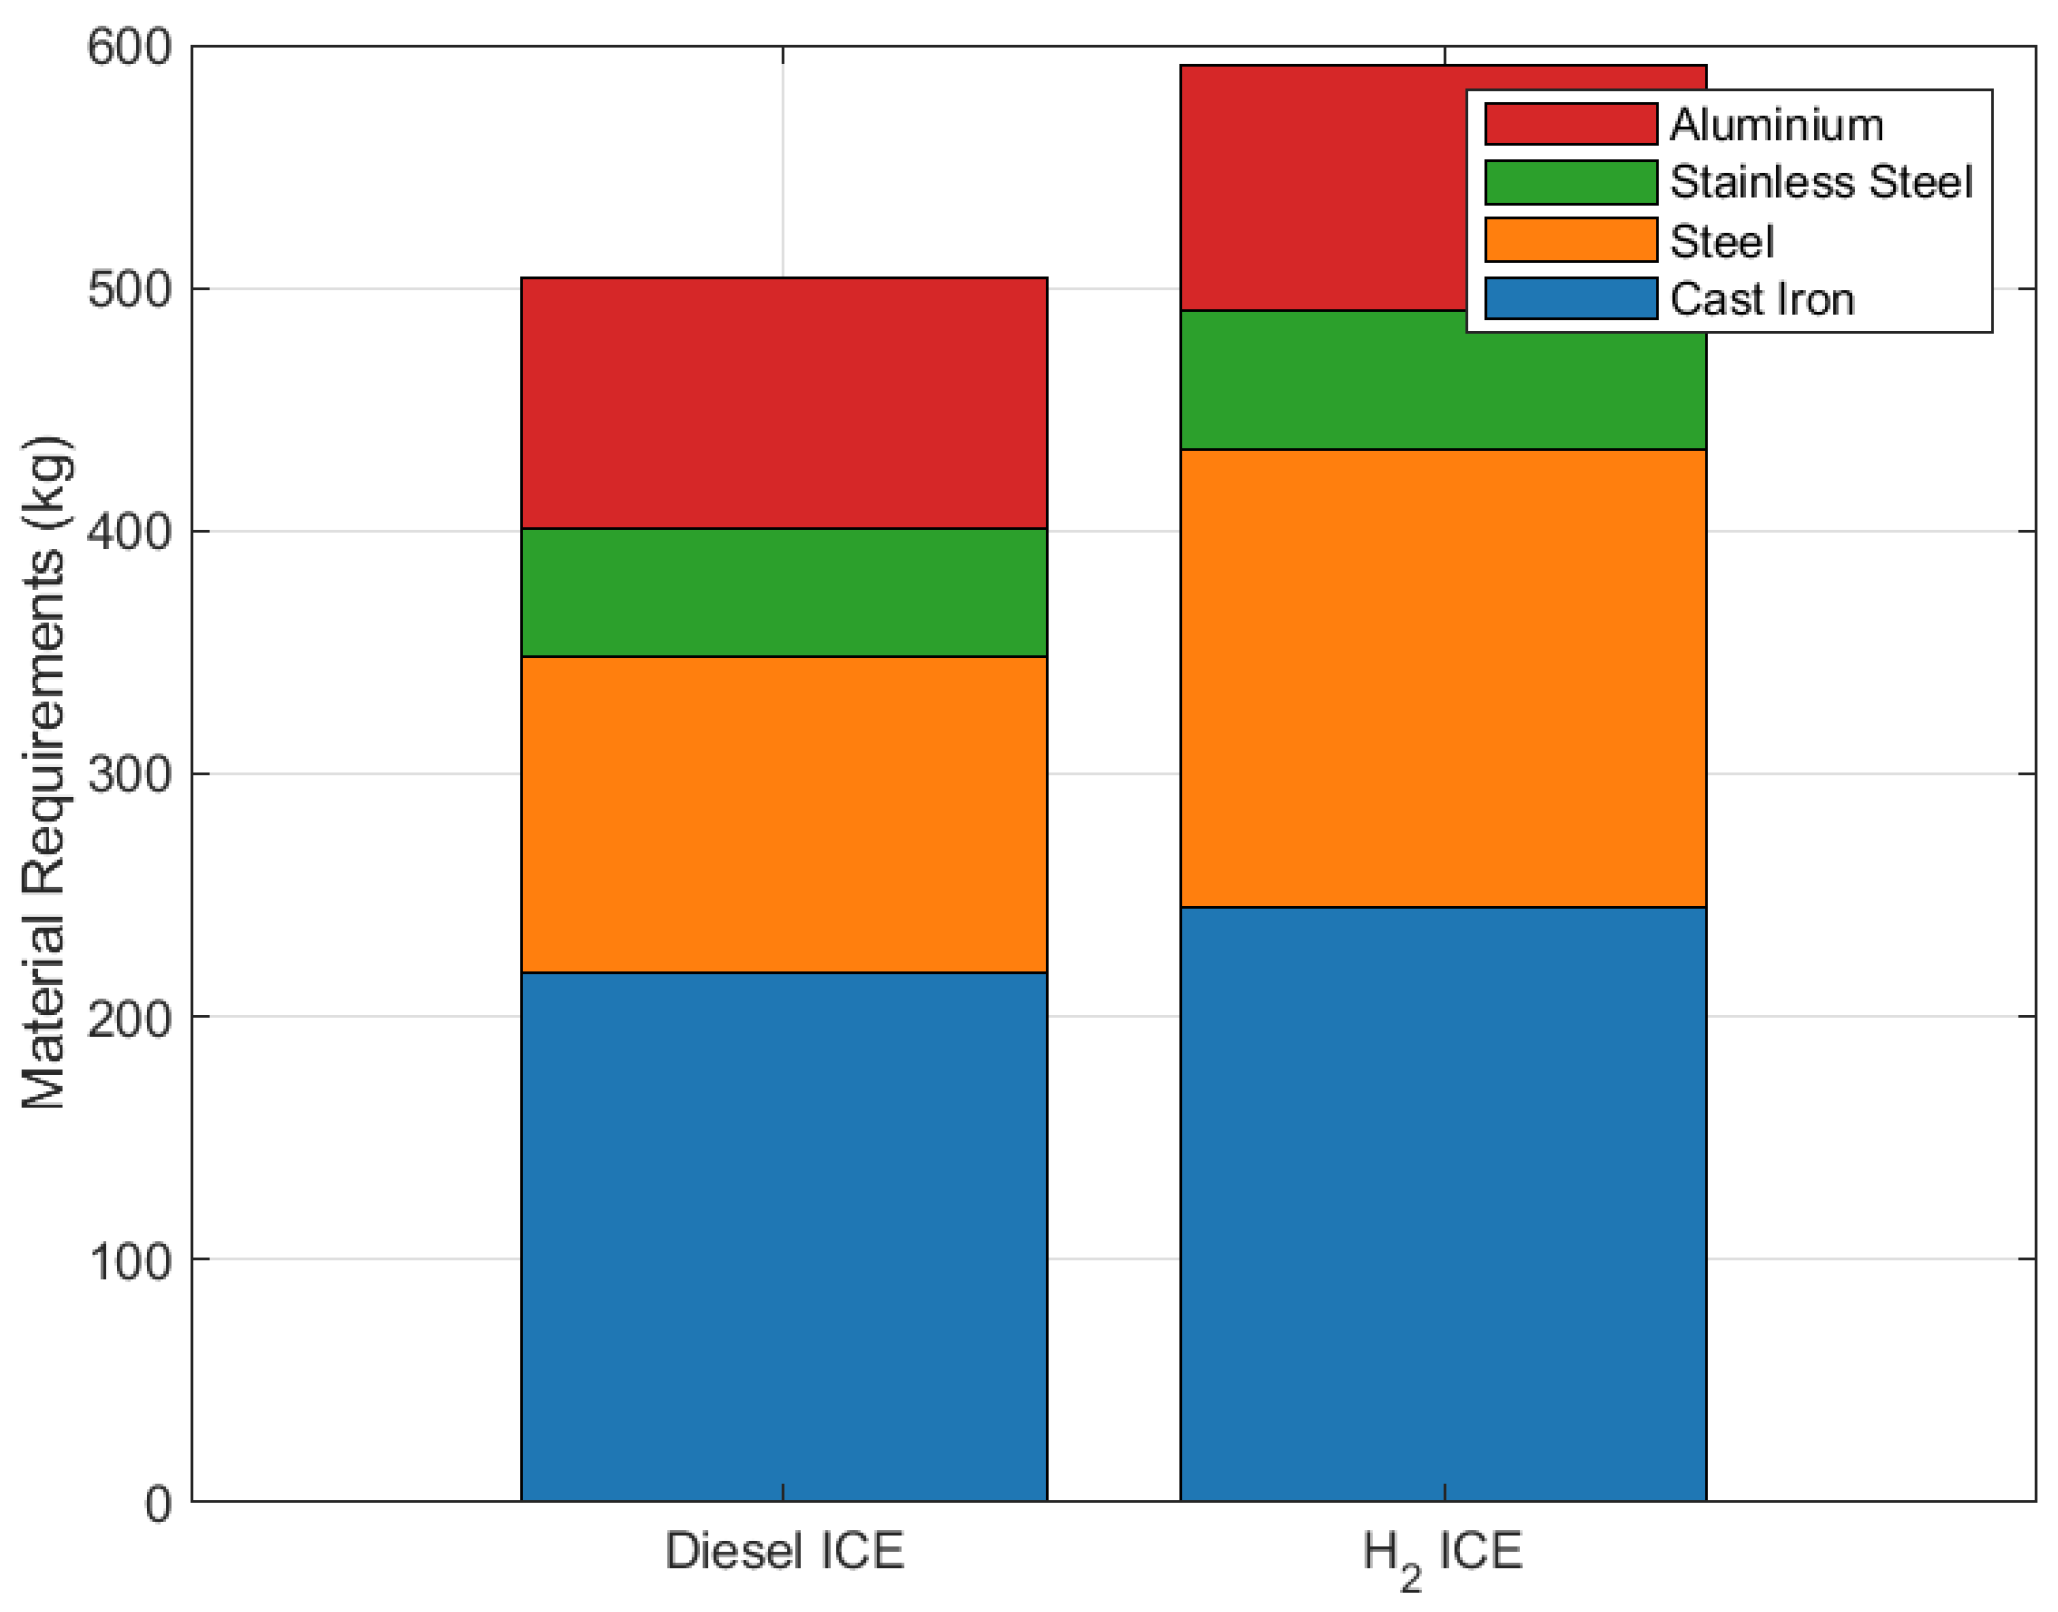
For both diesel and hydrogen, the main raw materials used in engine production are steel, cast iron, aluminum, and stainless steel; other materials, like rubber and polymeric composites, weigh far less; therefore, they are excluded from
Figure 4.
Certain engine components are purchased off-the-shelf (as shown in the box “Buy” in
Figure 2) from several suppliers and countries before being assembled at the company’s central facility in the US. Based on primary data, six manufacturing countries have been identified, and average transport distances have been assumed. Lorries and container ships have been considered for road and sea transport.
2.2.2. Manufacturing
Granularity in LCA studies allows the identification of environmental hotspots and facilitates eco-design [
28]. To ensure fine granularity, the LCA model was built so that all the engine components were grouped into 14 subsystems as follows (
Table 2): block, head, cranktrain-rotating, cranktrain-reciprocating, lube and vent, valvetrain, cooling, accessory drive, cranking system, fuel delivery, aftertreatment, air delivery, exhaust, and turbocharging. Each subsystem is composed of one or more components.
2.2.3. Engine Re-Design
During the re-design process, the original diesel engine remained unchanged in terms of crankcase, crankshaft, and connecting rod sizes, even with the strict design specifications required by hydrogen combustion. Instead, the novel hydrogen combustion technology has involved modifications of certain sub-assemblies as follows (
Table 2):
To make it suitable for controlled ignition, the cylinder head has been modified impacting the head subsystem.
To ensure the high supercharging pressures required for hydrogen combustion, the intake system has been modified (i.e., new intake manifolds, including the hydrogen injection system). Also, the additive manufacturing technique has been used for manifold manufacturing, leading to lighter manifolds. In contrast with the turbocharger of the DIE-ICE that was born for automotive applications, the turbocharger of the H2-ICE has been scaled down by 20%. This has been carried out because the specific H2-ICE model considered in this study has been designed to be used in stationary applications, which typically operate at fixed and lower speeds. Those modifications impact the air delivery and the turbocharging subsystems.
To optimize both the new combustion technique and volumetric efficiency, the camshaft is designed with new camshaft profiles, which impact the valvetrain subsystem.
A new flywheel adapter has been incorporated into the design to accommodate the engine’s usage across different applications, such as marine and genset. This addition affects the cranktrain-rotating subsystem.
The crank-reciprocating subsystem is affected by new pistons featuring extra sealing rings. These additional rings are necessary due to the low density of hydrogen, which can result in a heightened potential for leaks. Hence, the design of the new pistons incorporates this feature to mitigate the issue.
2.2.4. Use Phase
A pick-up truck, classified as 2b class according to the EPA’s vehicle classification [
34], has been assumed as the vehicle application.
Table 3 reports the main vehicle specifications.
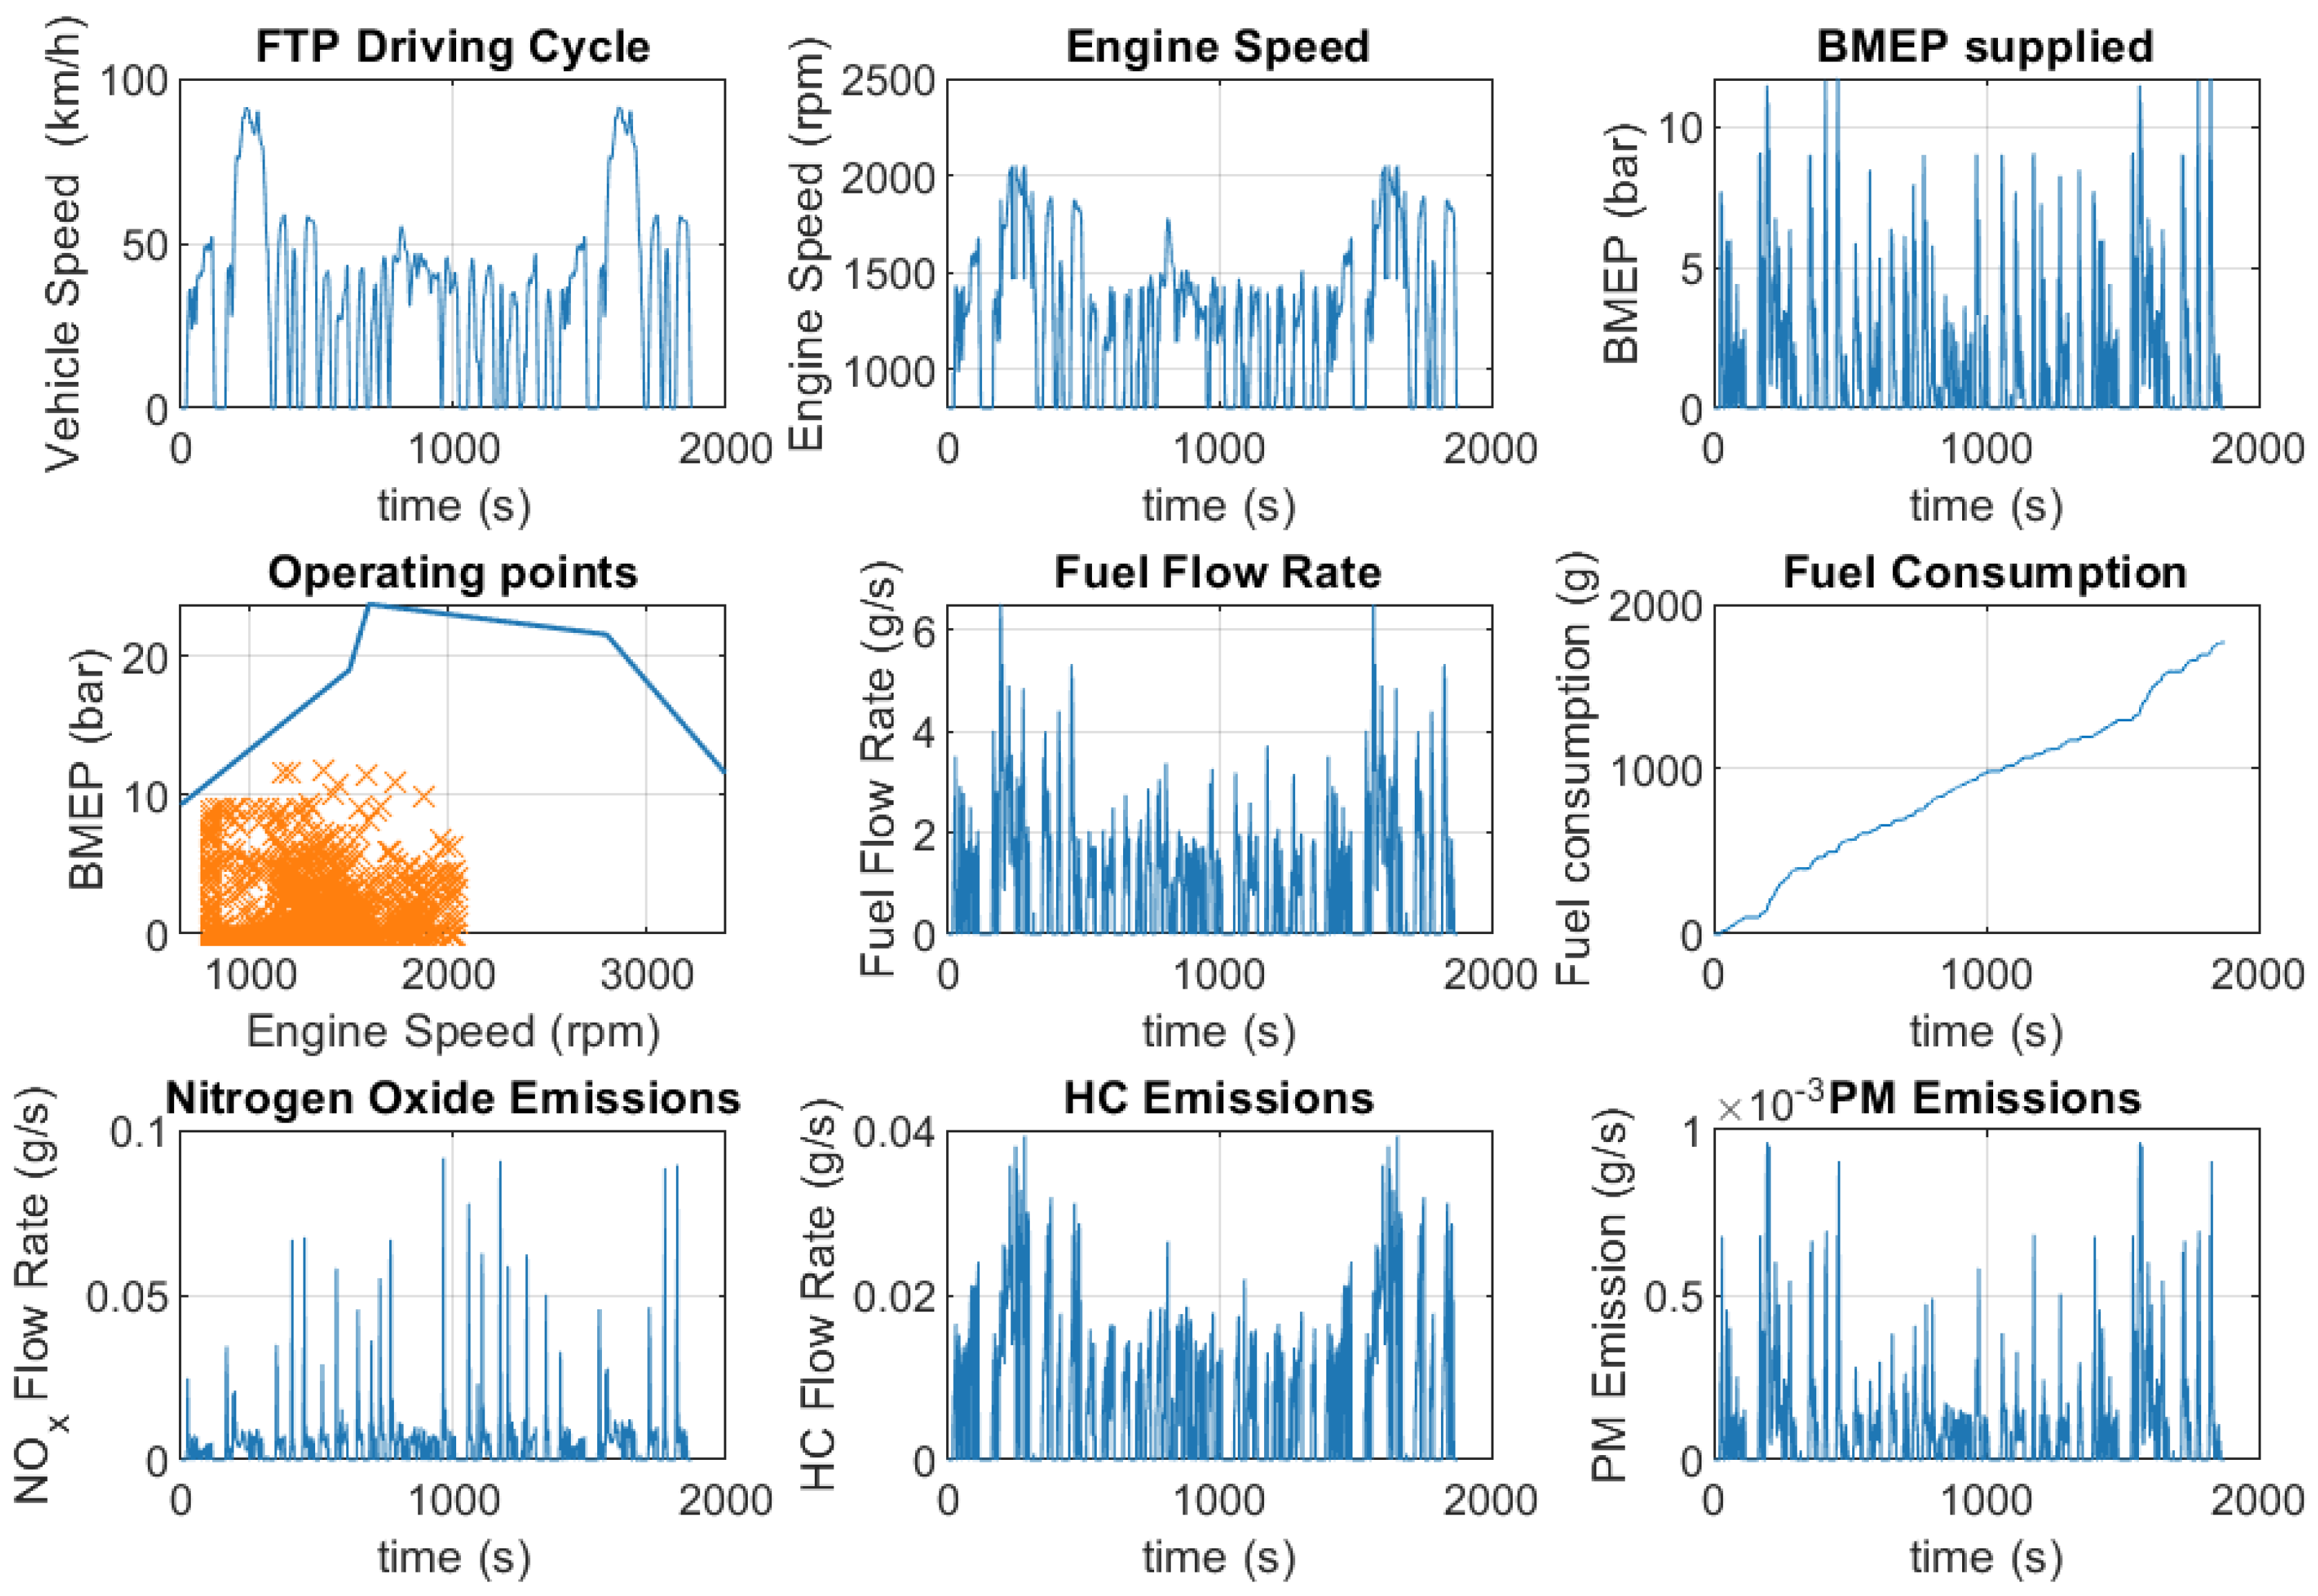
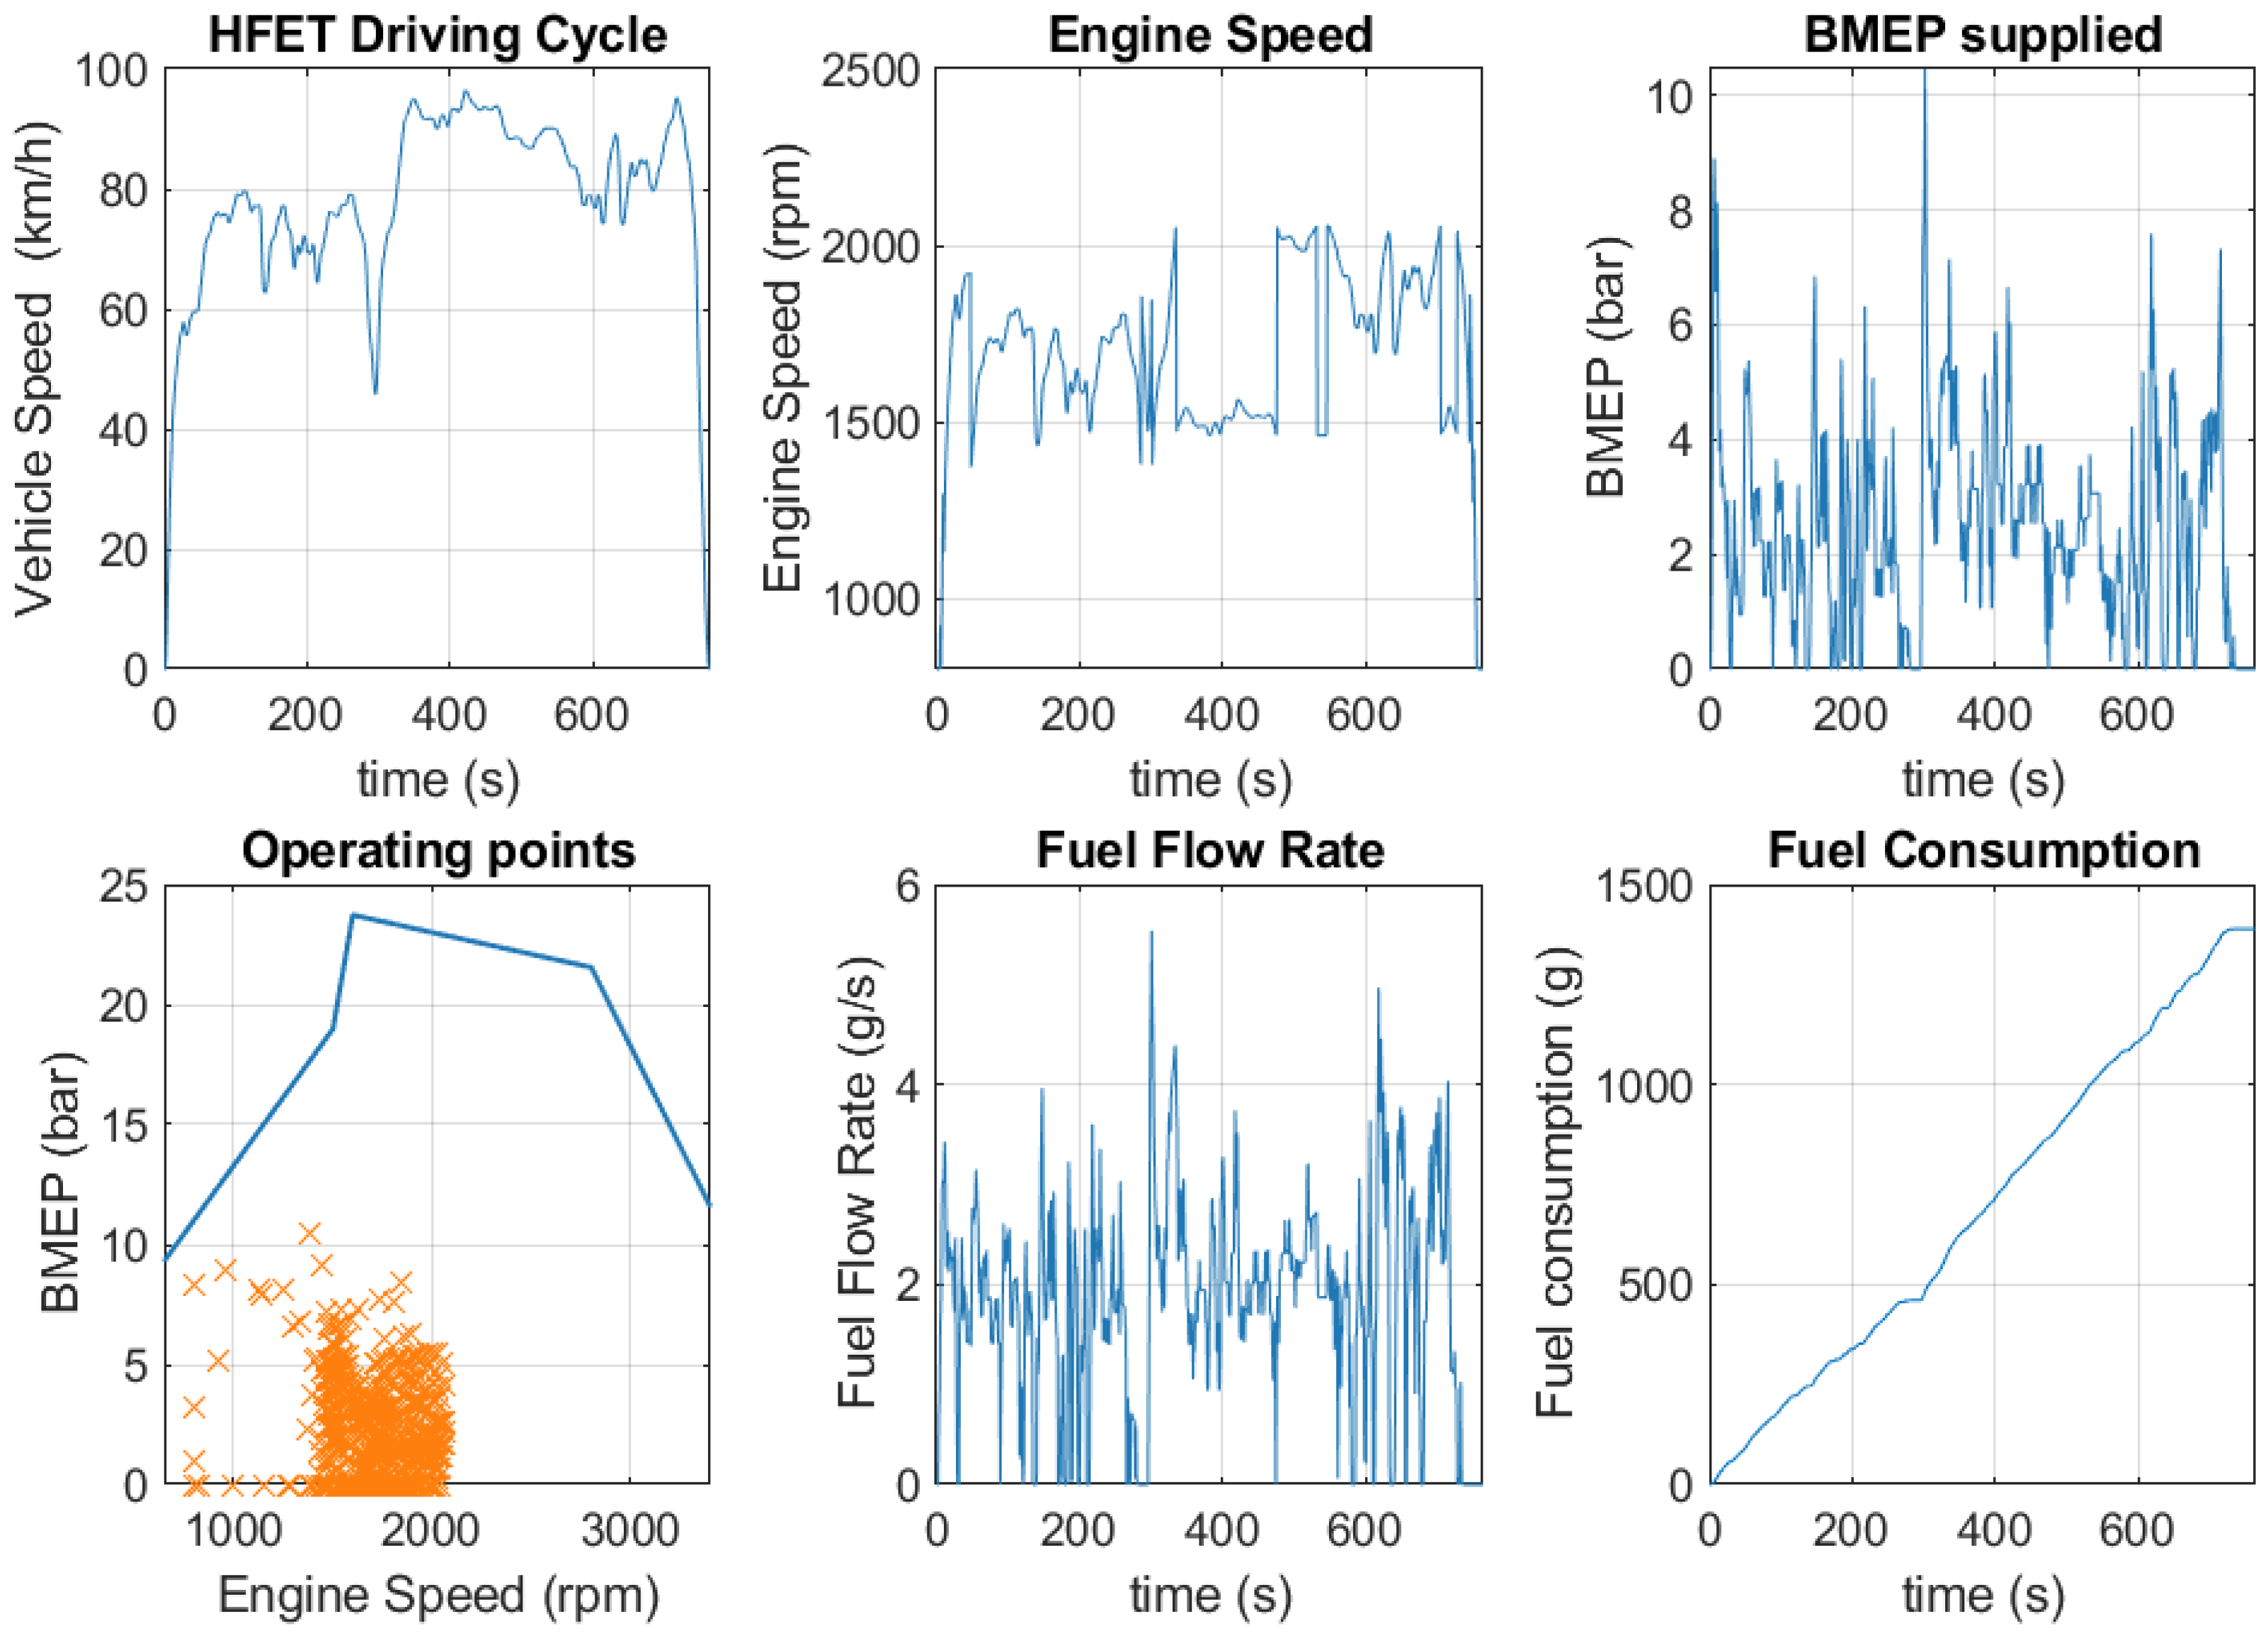
Using an ad-hoc kinematic backward simulation model, the fuel consumption and the exhaust emissions of pollutants and CO
2 have been assessed. For the driving mission, the Federal Test Procedure (FTP) and the Highway Fuel Economy Test (HFET), weighted at 55% and 45%, respectively, have been assumed to estimate the trend of engine brake mean effective pressure (BMEP) and engine speed throughout the driving mission (
Figure 5 and
Figure 6). Coast-down coefficients have been assumed based on [
36]. A typical shift curve has been hypothesized as a speed function. The overall fuel consumption over the assumed engine application has been estimated by integrating the evolution over time of the engine operating point with the brake specific fuel consumption (BSFC).
The fuel consumption over the entire engine useful life has been evaluated by multiplying the average value obtained with the simulation model and measured in liters/100 km by the expected vehicle lifetime in kilometers. For fuel production, the Ecoinvent dataset “Diesel, low sulfur (rest of the world)” has been used for diesel oil. For hydrogen production, six different production routes have been investigated, adapting to the US the values reported in [
29]. All the routes consider liquid hydrogen (i.e., the processes of hydrogen liquefaction, transport, and final cryo-compression to 350 bars up to the vehicle tank are included).
TTW’s contribution to the overall engine life-cycle environmental impacts was measured by estimating the CO
2 and pollutant emission rates using a simulation model like the one used to assess fuel consumption. The FPT cycle was the exclusive basis for the evaluation, accordingly, Tier 3 emission standards, which was carried out by applying the effective emission engine map for each component emitted (CO
2, CO, NO
x, HC, and PM) (
Figure 5).
Regarding the H2-ICE pickup, we have taken into account a tank capable of storing 5.6 kg of cryo-compressed hydrogen, aligning with the expected range for a light-duty vehicle [
37]. This results in a weight increase of 110 kg for a Type 3 tank operating at 350 bars of pressure, as outlined in
Table 3.
Table 4 presents data on fuel consumption and carbon dioxide emissions during the TTW phase. It is worth noting that there are no emissions attributed to H2-ICE due to the study’s oversight in accounting for the potential carbon dioxide generated from lubrication combustion in H2-ICE.
In the reference scenario, WTT’s contribution to the overall engine life-cycle environmental impact has been estimated based on the global warming potential (CO
2eq/MJ) of producing hydrogen through SMR. The natural gas route has been chosen as a reference pathway for the current production in Europe in compliance with [
29]. Also, a sensitivity assessment has been performed on the WTT contribution, as described in
Section 2.3.
The service and maintenance handbook developed for the DIE-ICE and the vehicle application under study has been used for the maintenance procedures that should be performed on the DIE-ICE and as a starting point to estimate the maintenance of the H2-ICE. On both vehicles, the maintenance phase involves the consumption of lubricating oil, water, ethylene-glycol, and polyester along the entire life cycle of the two engine configurations. It is noteworthy that the maintenance process involves the cartridge oil filter change. The cartridge has been assumed to be made of polyester. Concerning the DIE-ICE, the use of a different lubricating oil and the substitution of spark plugs have been taken into account in the H2-ICE configuration.
2.2.5. End of Life
Allocation was necessary for the EoL phase. Allocation means the partitioning of input and output flows between the product system under study and one or more other product systems (for instance, subsequent product systems, if recycled) is involved [
30,
31]. The “avoided burden” or “0:100” approach has been used so that the first life cycle is charged with both the burden and benefits of the recycling process [
38].
The Ecoinvent background dataset “used internal combustion engine, passenger car (GLO)” and was used to model the EoL phase for both DIE-ICE and H2-ICE. In fact, potential differences in terms of material breakdown of the two engine configurations have been discarded (
Figure 4). Instead, the impact of the EoL has been assumed proportional to each engine weight, mass being the reference flow of the original background dataset.
2.3. Life-Cycle Impact Assessment and Sensitivity Assessment
The present study focuses on the GHG emissions, calculated based on the category called “climate change—total” of the environmental footprint (EF) v3.0 impact assessment method described in [
39].
For the sensitivity assessment, it is critical to focus on the use phase when internal combustion engines are involved. For this reason, the sensitivity assessment has been conducted focusing on the WTT contribution of the use phase and several hydrogen production routes have been put in comparison. In addition to SMR (i.e., reference scenario), the CG scenario has been considered because it is currently the most used route together with SMR. Two other scenarios have been considered to address the potential effect of CCS systems, namely SMR + CCS and CG + CCS. Lastly, two additional scenarios refer to the water electrolysis routes. The former represents the current situation, where electricity consumed for the electrolysis is produced from the current electricity mix. The latter represents a future scenario where the electricity consumed for the electrolysis is produced with renewable sources, i.e., wind as the energy source.
In
Table 5, the CO
2eq emissions resulting from the production of 1 MJ of liquid hydrogen through the six different routes are listed, with adjustments made to align with conditions in the US as reported in [
29]. In the case of liquid storage, hydrogen is first liquefied and then driven to the refueling station, where it undergoes a final cryo-compression at 350 bars before being stored in the vehicle’s tank.
3. Results
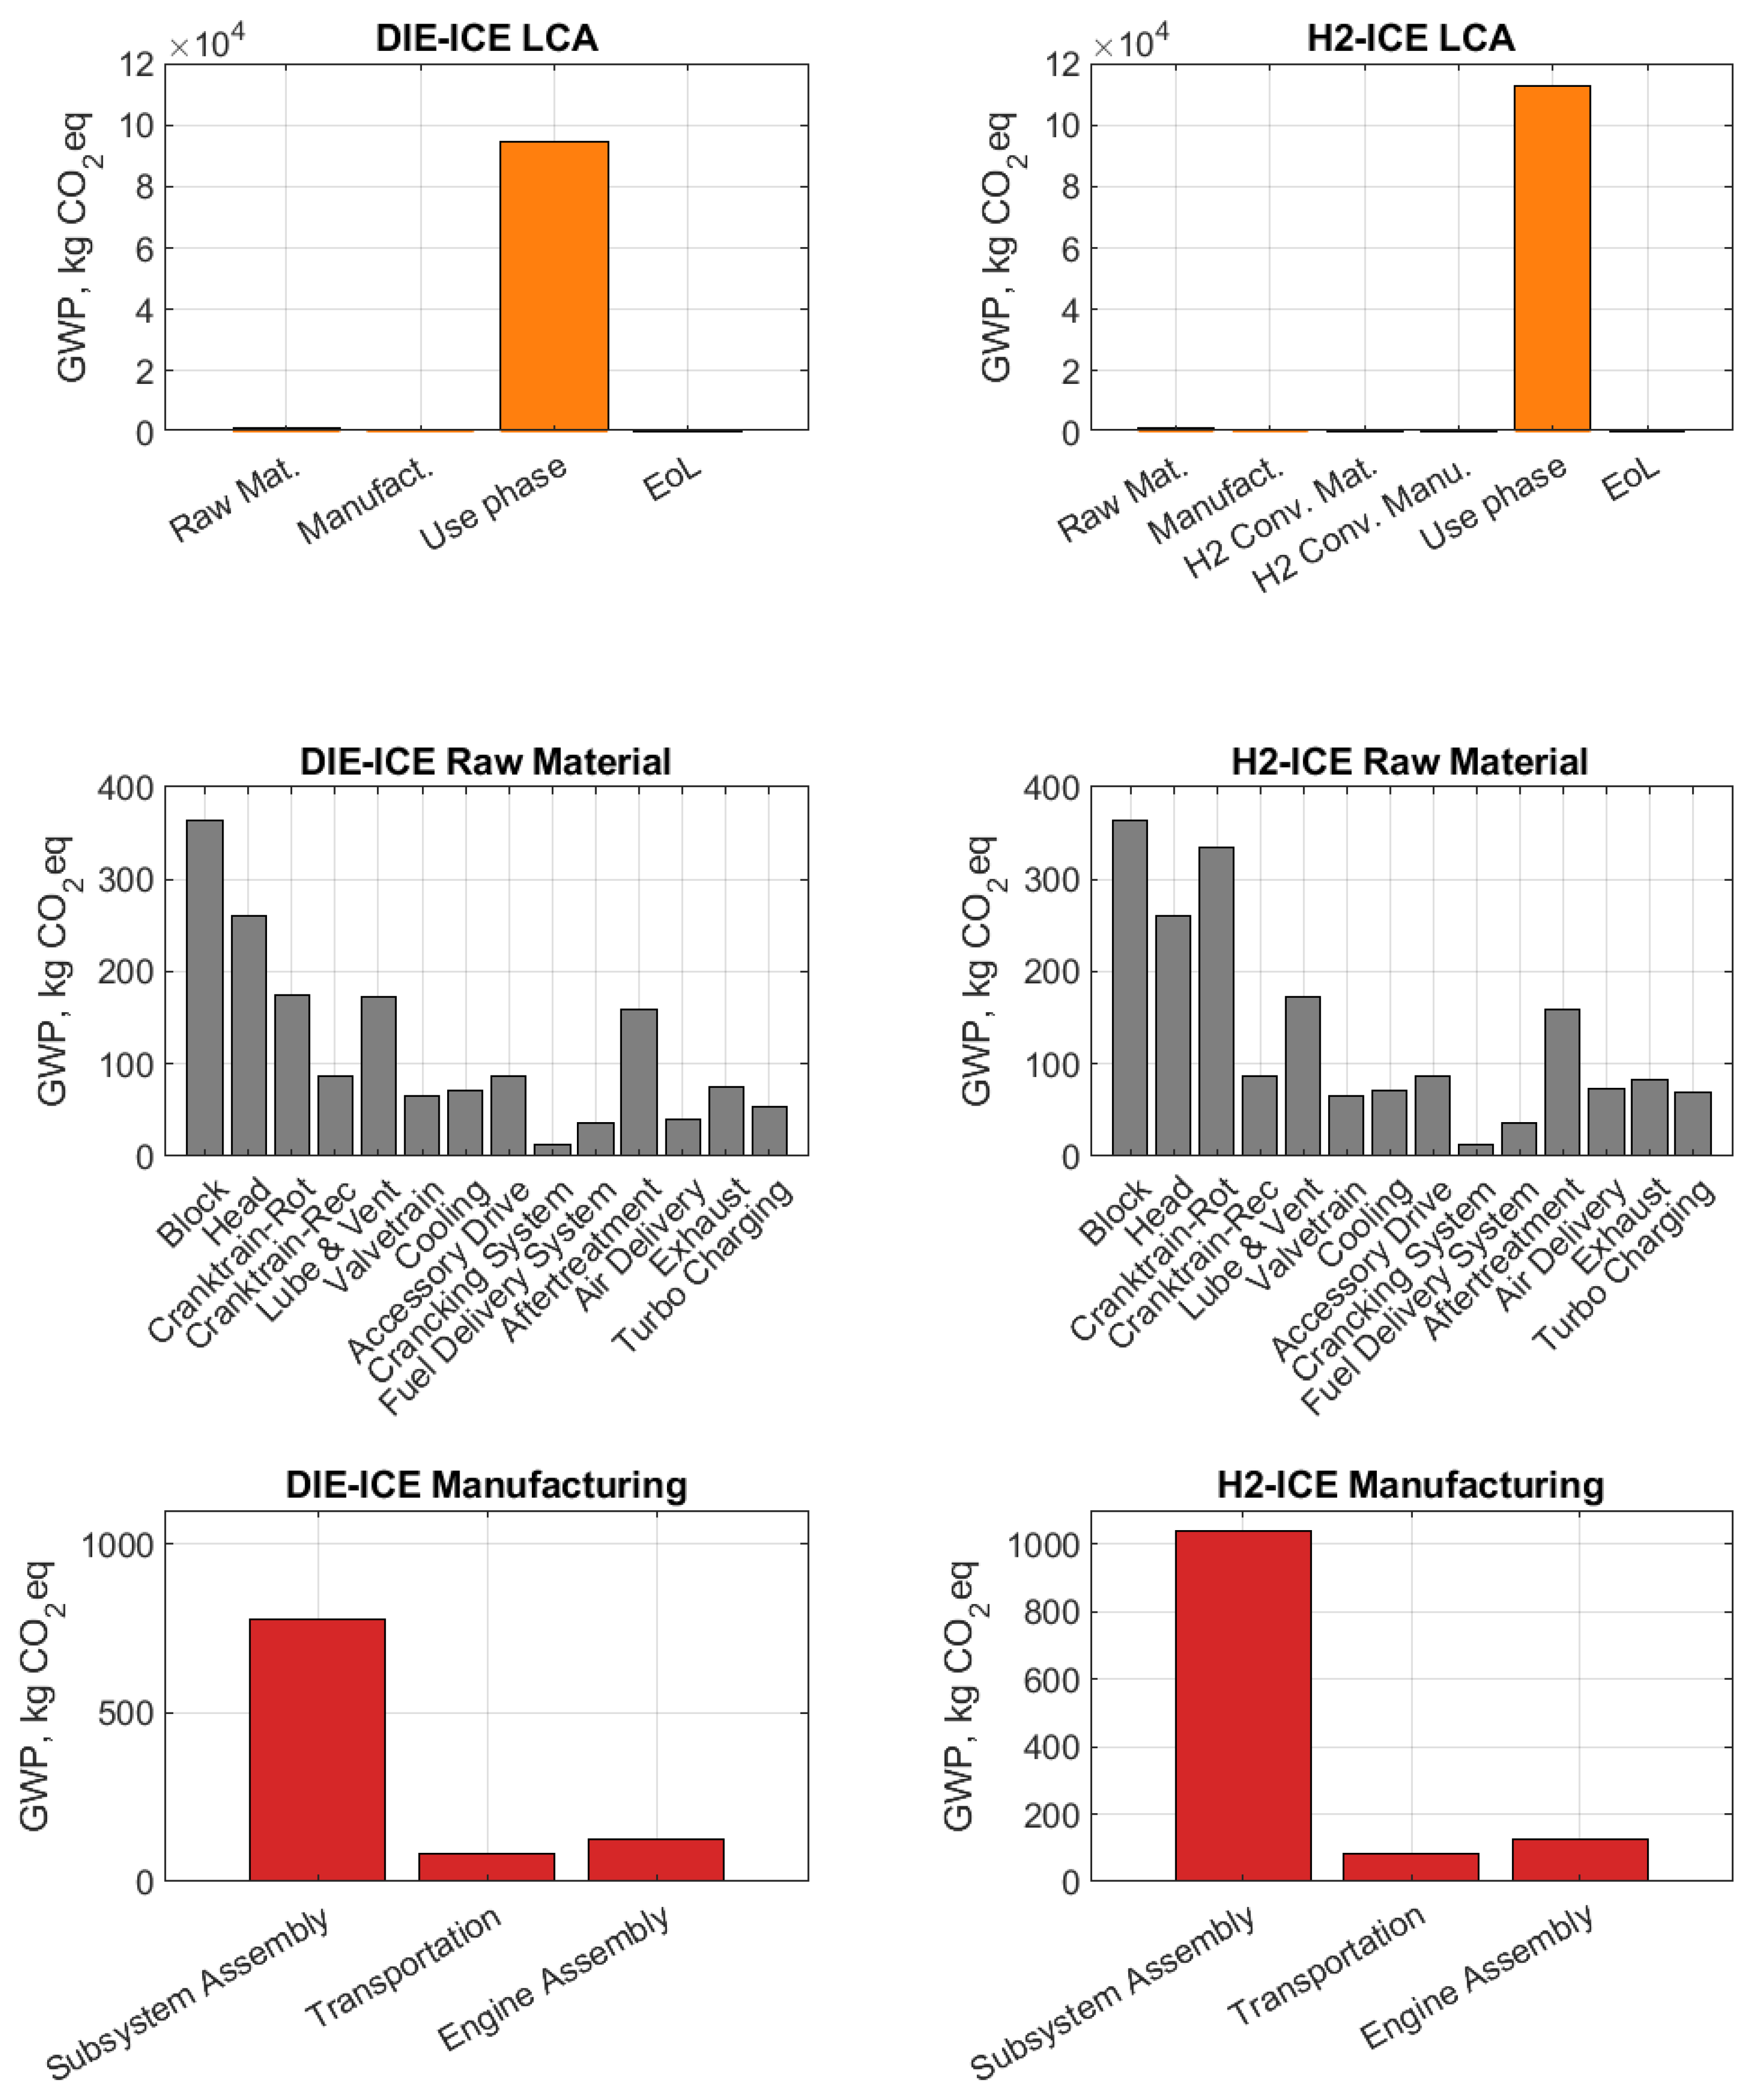
Figure 7 shows the environmental impacts of the DIE-ICE and reference scenario of H2-ICE in terms of climate change, i.e., measured in kg CO
2eq. For each engine configuration,
Figure 7 comprises the environmental impact of the entire life cycle (bar chart on the top), an insight into the raw material acquisition and pre-processing phase (bar chart in the middle), and an insight into the manufacturing phase (bar chart on the bottom). The bar charts on the top show the contribution breakdown among the (1) raw material acquisition and pre-processing phase, (2) manufacturing phase, (3) use phase, and (4) EoL phase. For H2-ICE, there are two additional phases, i.e., “H2 Conv. Material” and “H2 Conv. Manu”. The bar charts in the middle show the contribution breakdown among the engine subsystems. The bar charts on the bottom show the contribution breakdown among (1) assembly of supplier components (off-the-shelf components purchased from suppliers), (2) transportation of the supplier components to the main engine assembly plant, and (3) engine assembly.
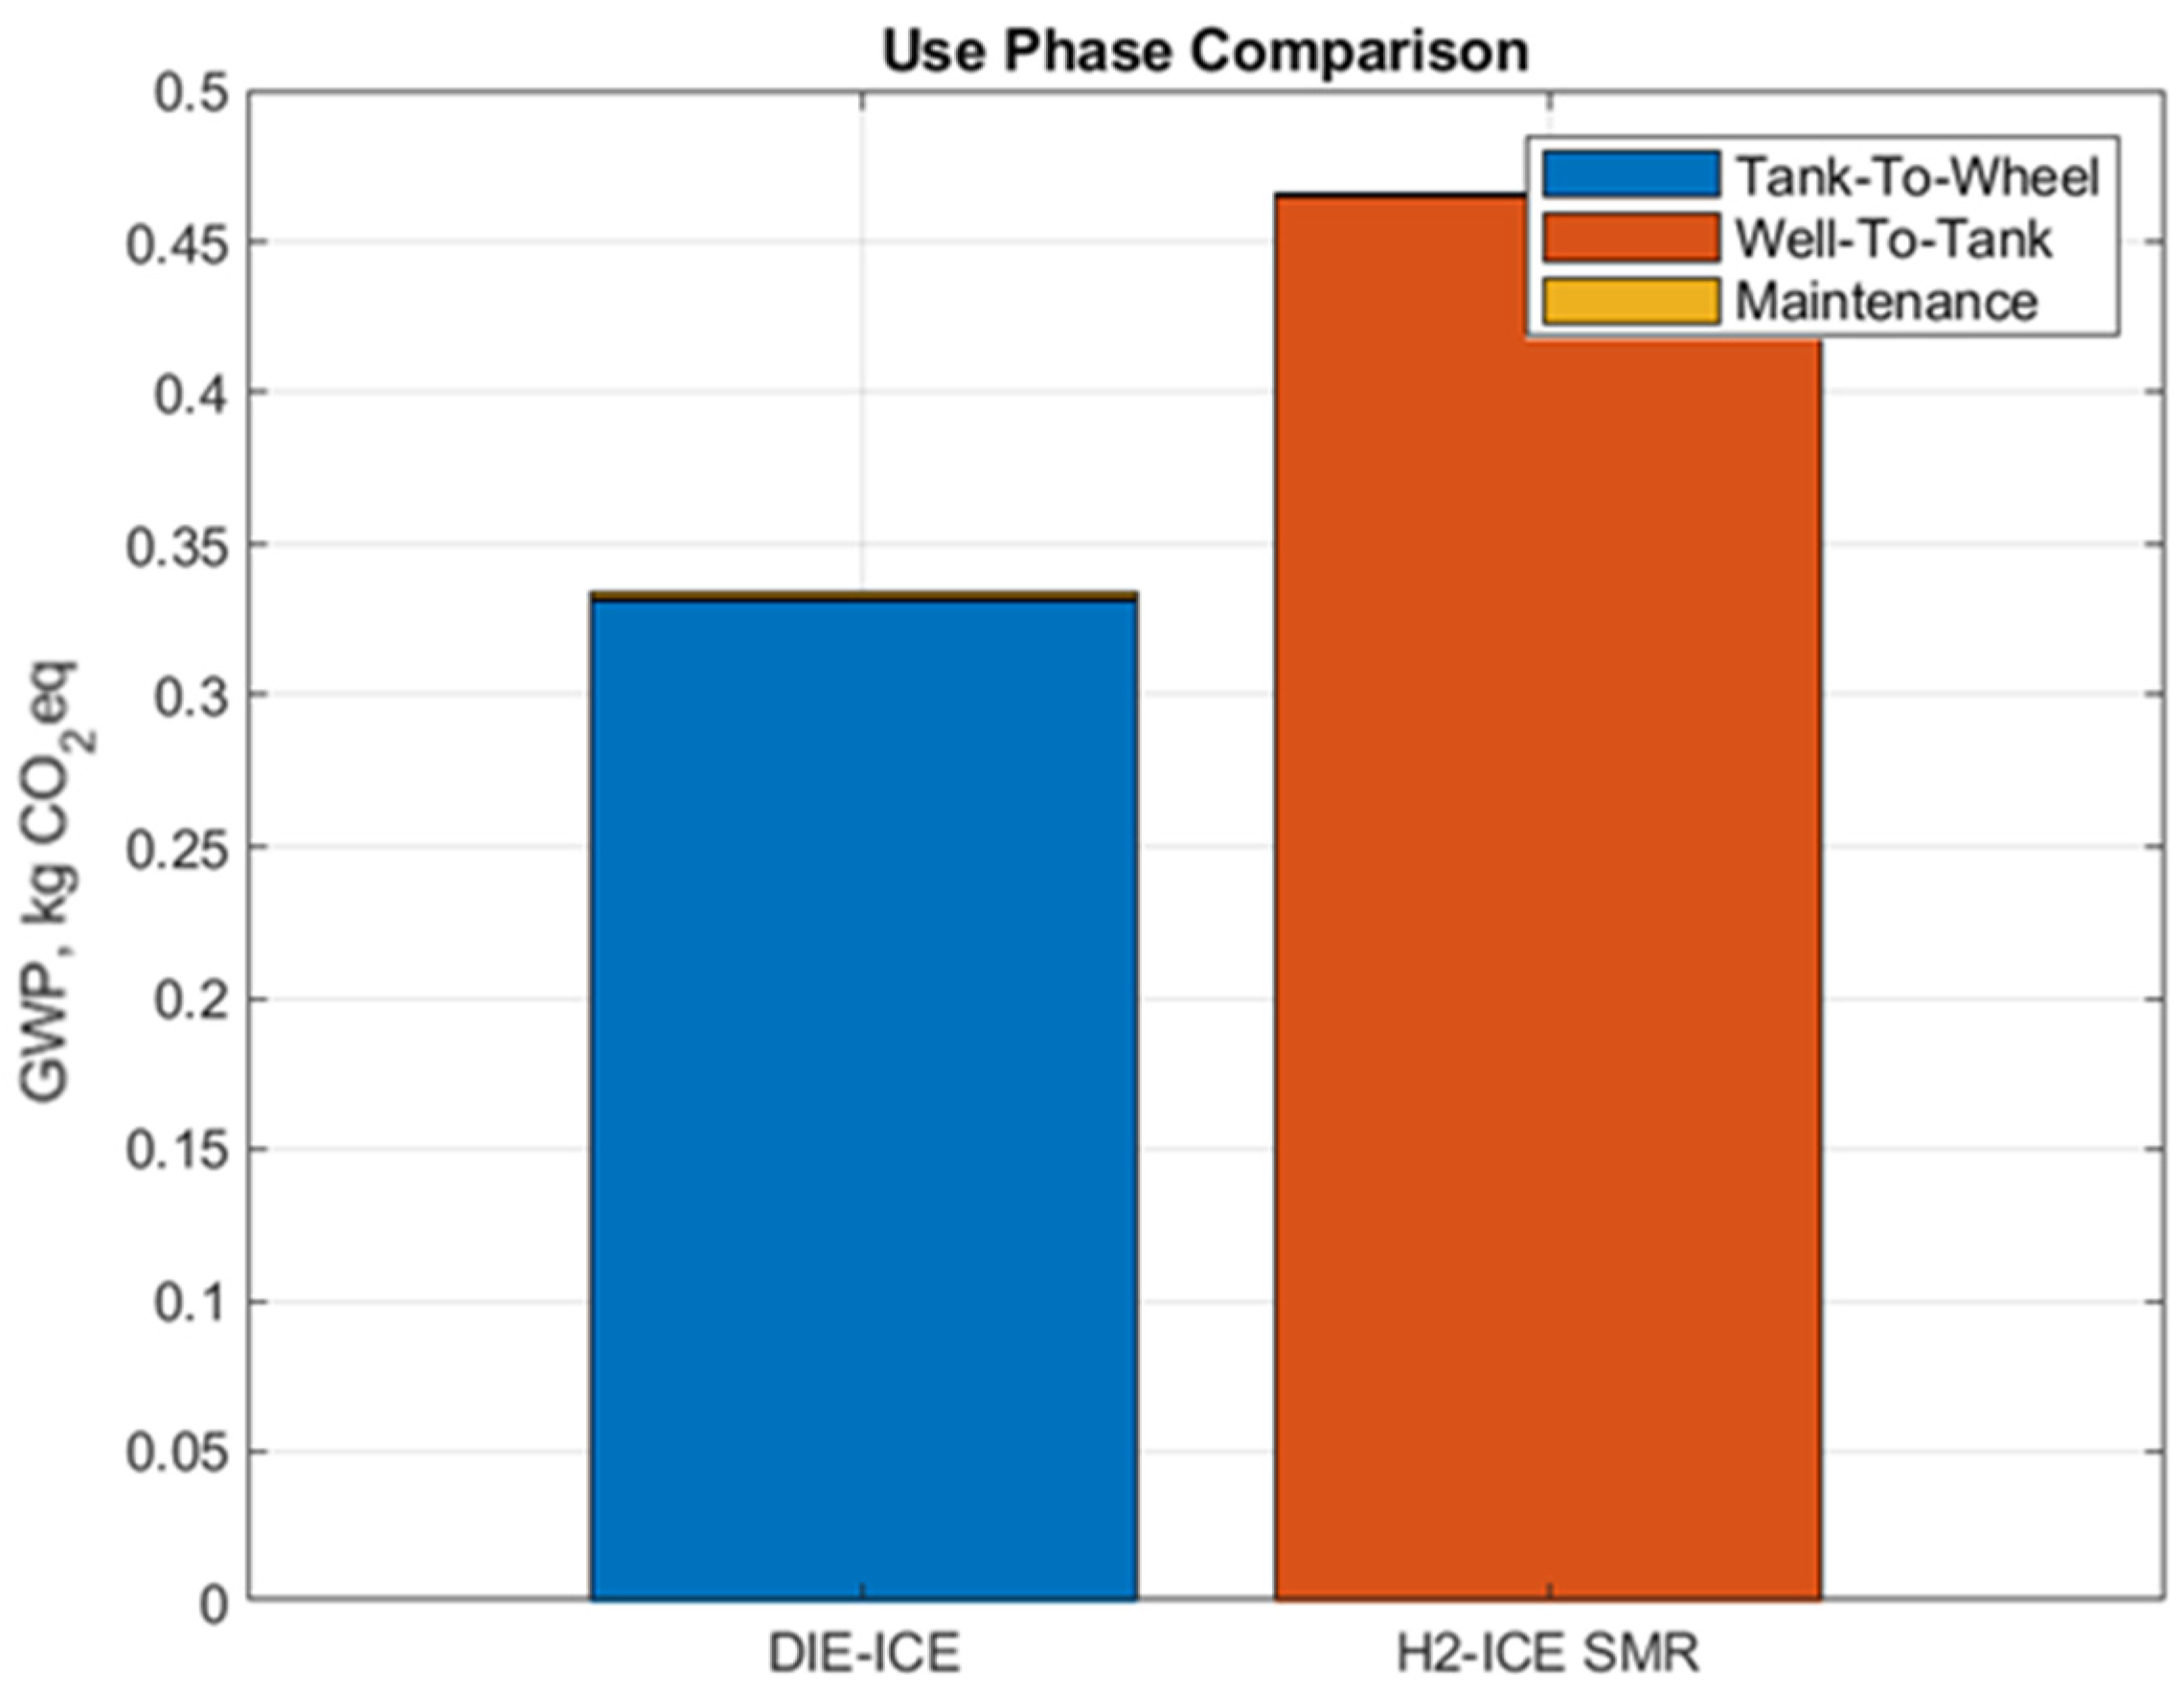
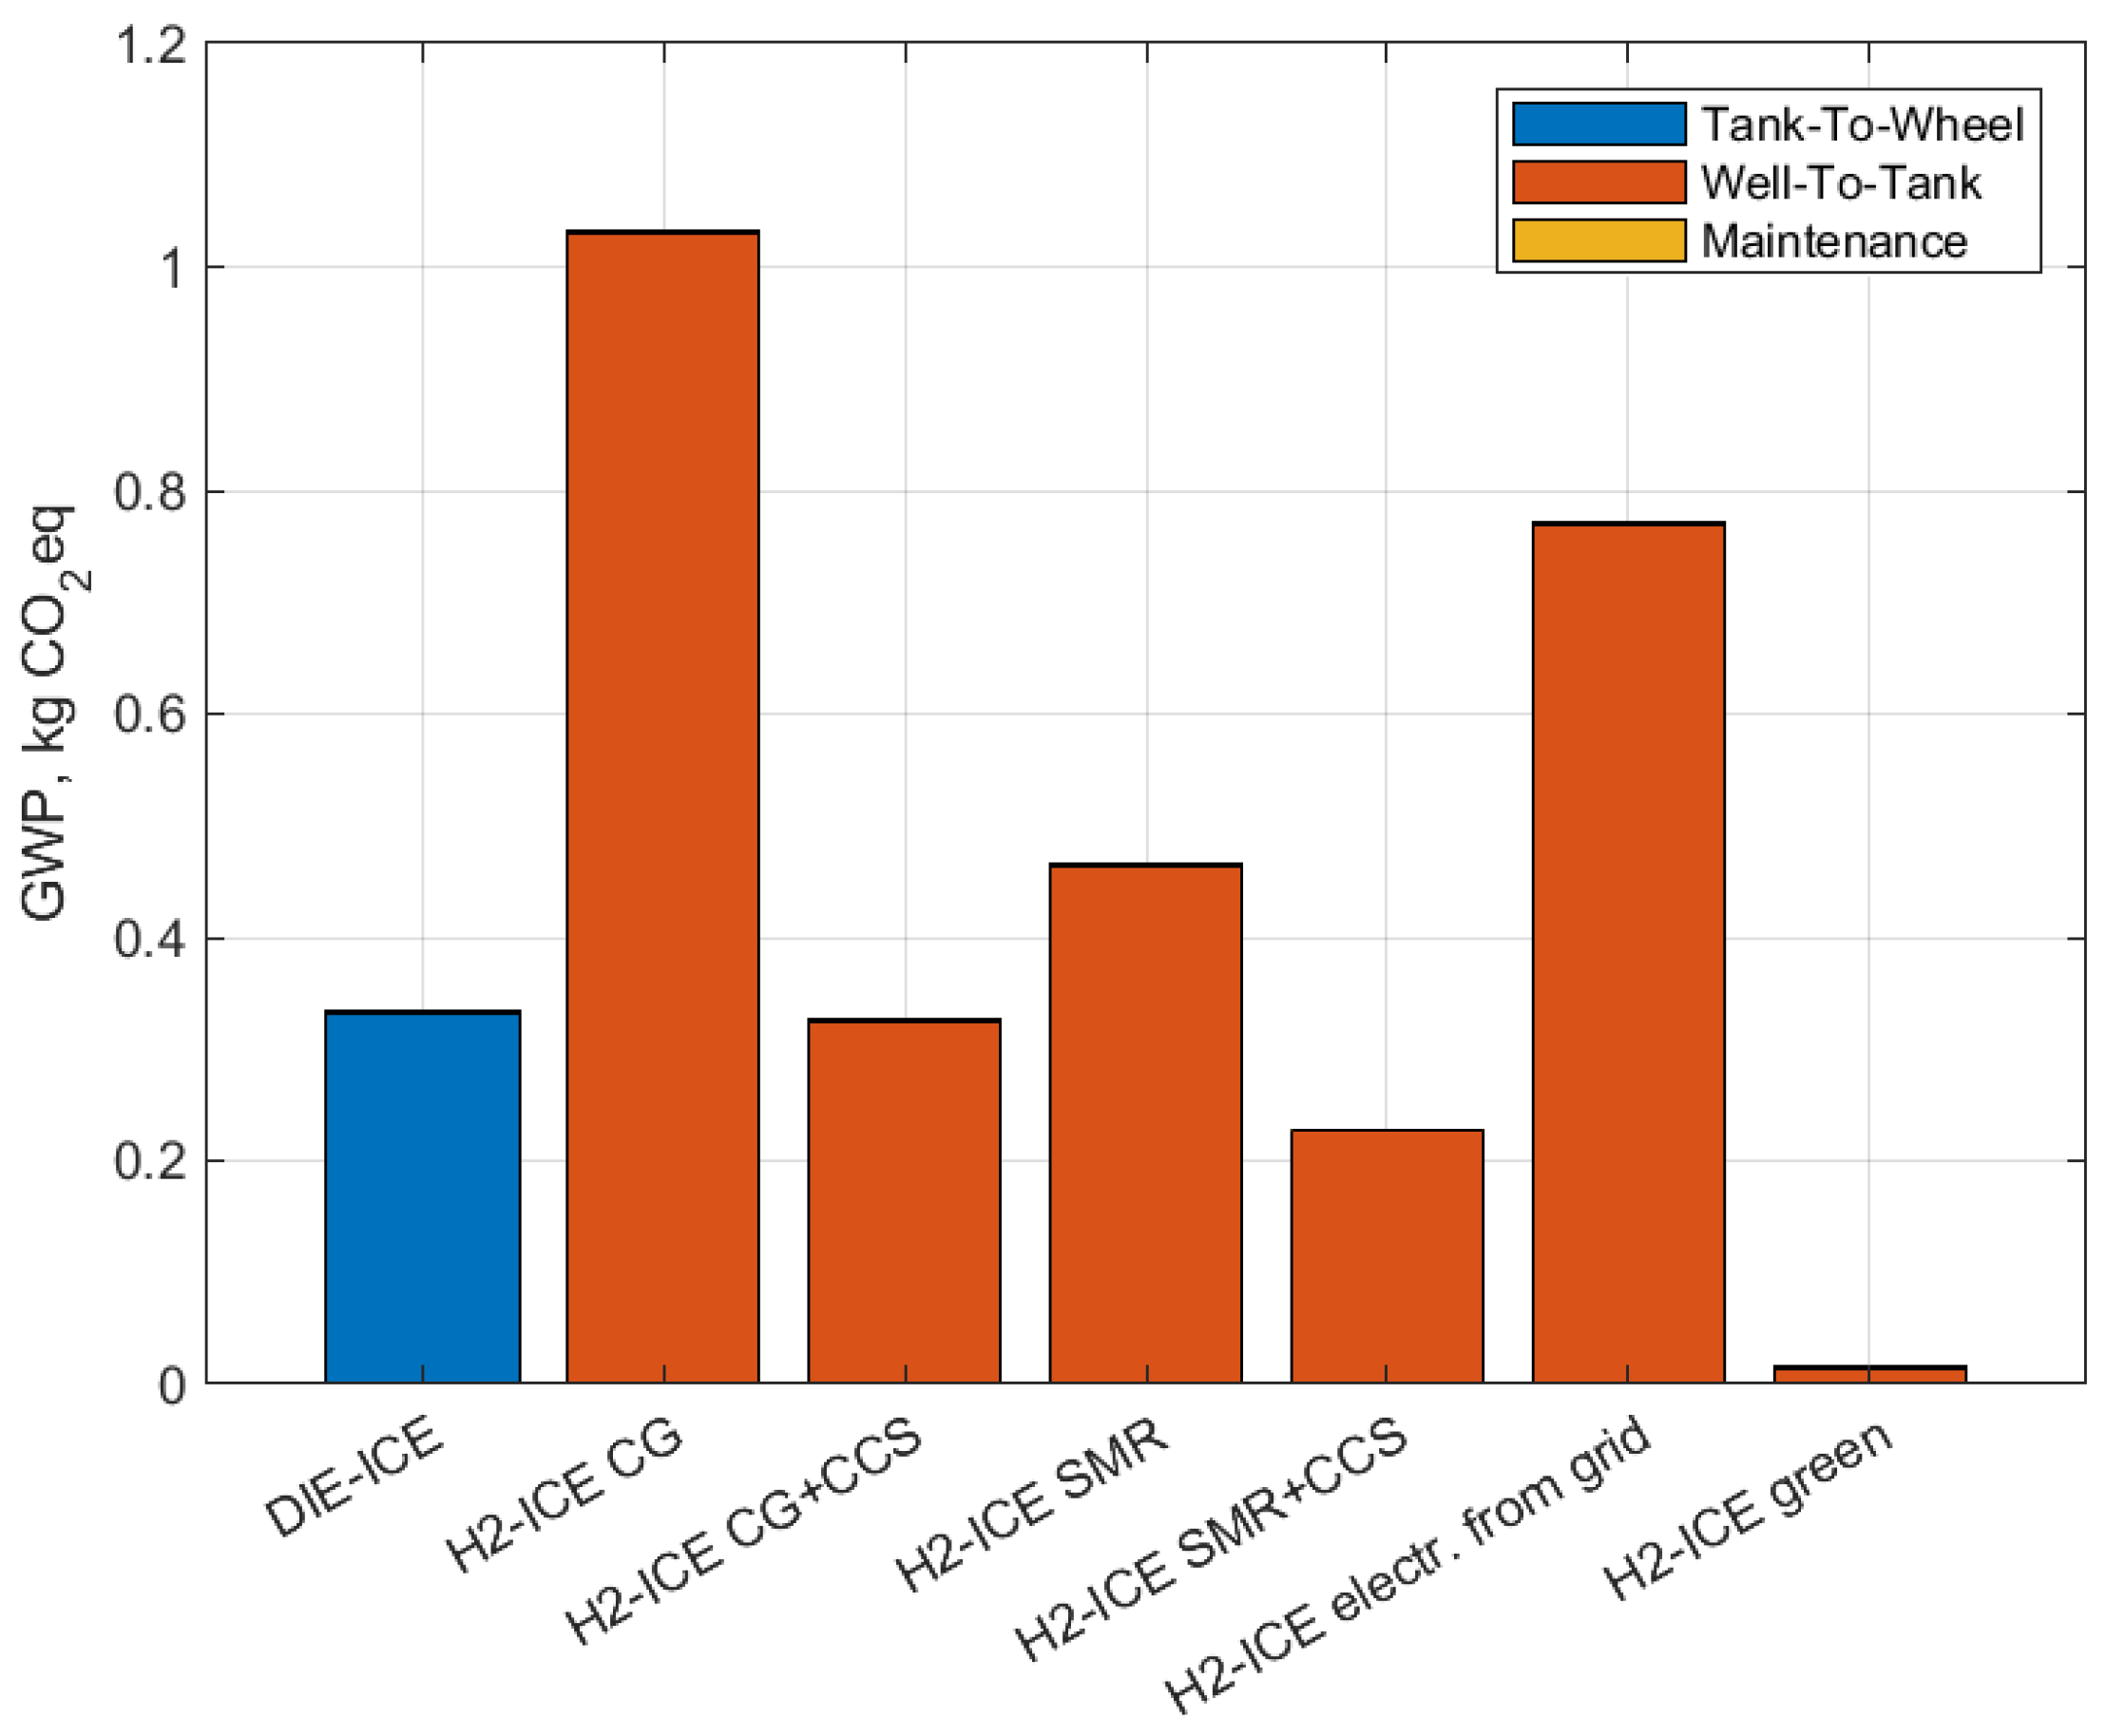
For the use phase, dedicated charts are shown in
Figure 8, where, for each engine configuration, a stacked bar chart shows the contribution breakdown between the WTT, TTW and maintenance phases in kg CO
2eq/FU.
Figure 7 shows that, for climate change, the use phase has the greatest influence on the overall life cycle in both the DIE-ICE and H2-ICE solutions. For the DIE-ICE, this is mainly due to the TTW (i.e., 84.6%) emissions generated during the engine operation (
Figure 8). In terms of the contribution breakdown between CO
2 and pollutant emissions (i.e., CO, NO
x, HC, and PM), the impact of the TTW contribution is mainly caused by the carbon dioxide exhaust emissions in DIE-ICE. On the other hand, in the case of the H2-ICE, the TTW contribution is zero and the WTT is the most relevant contribution (i.e., 99.6%) (
Figure 8). The contribution of maintenance to the overall use phase is negligible (<1%) in terms of climate change in both the engines (
Figure 8).
For the raw material acquisition and pre-processing phases, the contribution of each subsystem depends on material type and quantity that constitute the components belonging to each subsystem. In terms of climate change, among all the material flows, aluminum has the greatest impact on climate change, mostly because of the emissions generated during the alumina electrolysis process. Aluminum is then followed by stainless steel, which is produced by further refining of cast iron and consequently has greater and significant impacts. For this reason, in the case of DIE-ICE, subsystems like head or lube and vent, which are primarily composed of aluminum and stainless steel, make roughly comparable contributions to subsystems like block and cranktrain-rotating (
Figure 7), which are considerably heavier but primarily composed of cast iron and steel, respectively.
As far as manufacturing is concerned, the most significant input to the entire engine manufacturing process is the assembling of supplier components, which contributes 79% in the case of the DIE-ICE and 83.5% in the case of H2-ICE to the overall manufacturing GHG impact. The three supplier components with the greatest GHG impact are the cylinder block, cylinder head, and crankshaft in both the DIE-ICE and H2-ICE. This is due to their high electricity consumption and manufacturing process expenditure on auxiliary inputs, such as sand for block casting, lubricating oil for machining, and compressed air for forging.
Finally, the electricity required for material recycling is the primary factor influencing the EoL impact on climate change. In any case, over the course of the engine life cycle, the EoL results as the least impacting life-cycle phase.
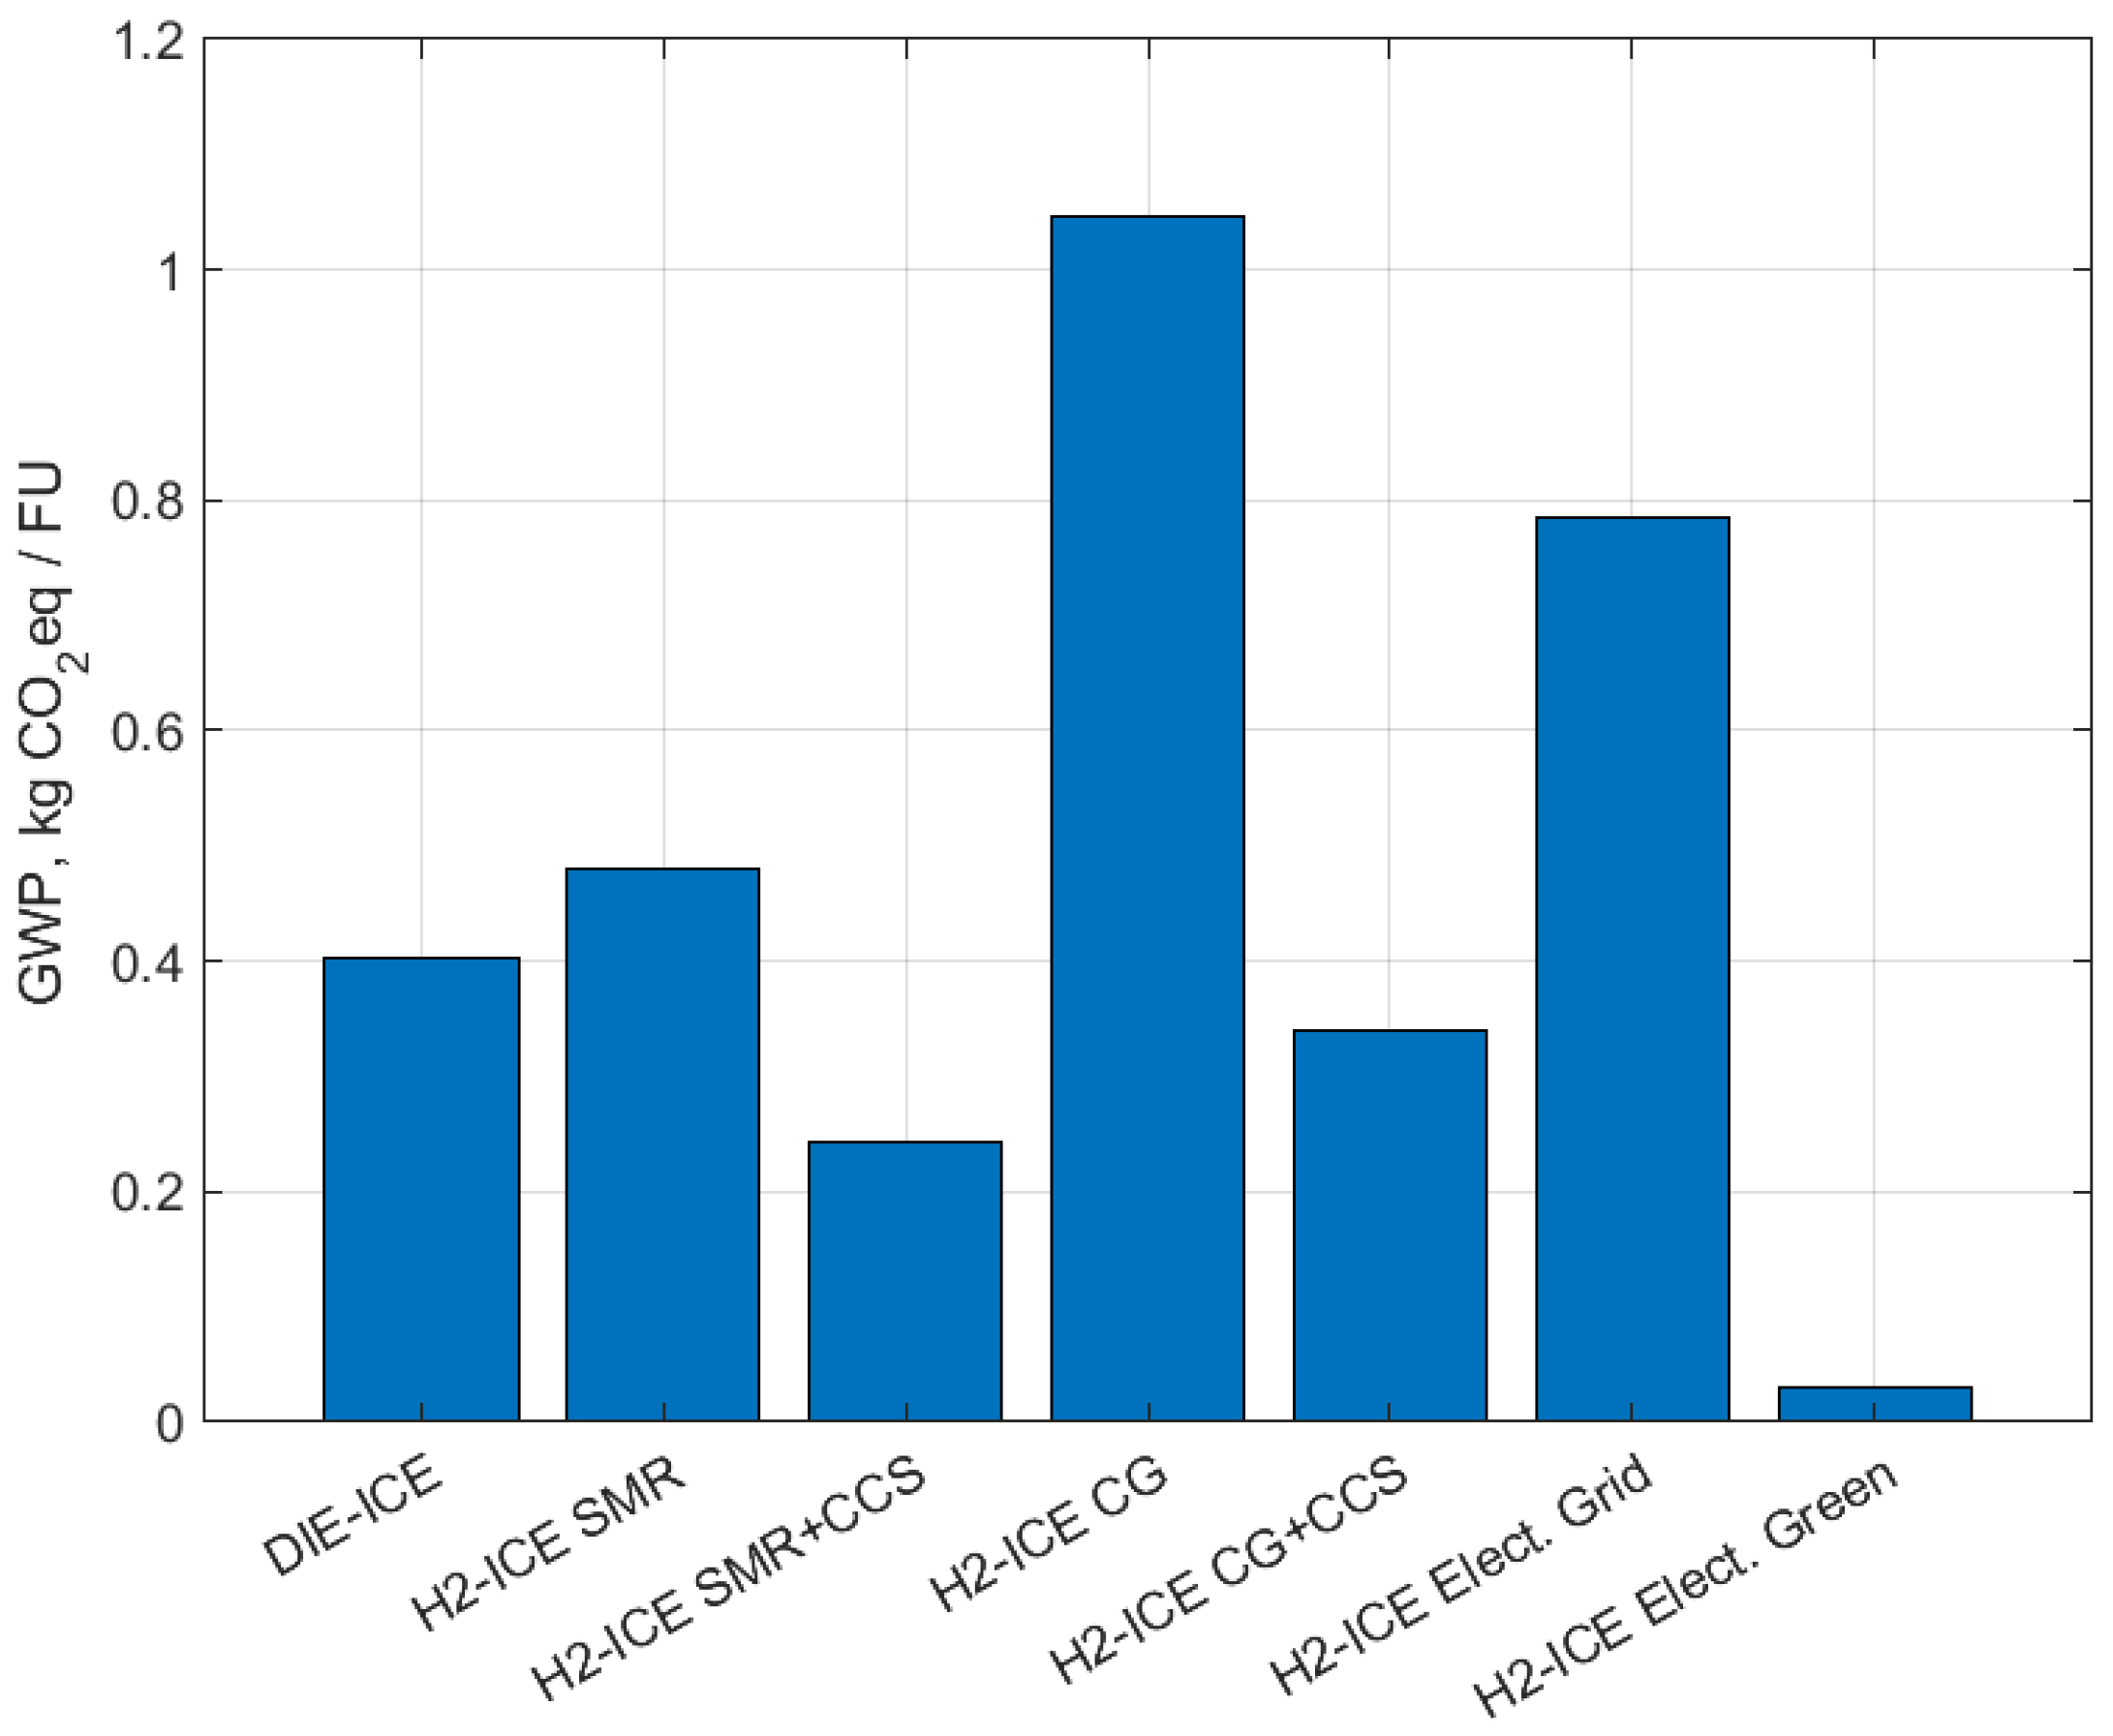
Because the environmental impacts of a diesel engine are predominantly caused by the use phase,
Figure 9 shows the comparison between DIE-ICE and H2-ICE in terms of climate-change results and focusing on the use phase. Moreover, because hydrogen engines do not emit carbon dioxide and have a TTW contribution of almost zero,
Figure 9 also shows the results of the sensitivity assessment where six distinct hydrogen production routes have been investigated, namely:
SMR (i.e., “H2-ICE SMR”)
SMR + CCS (i.e., “H2-ICE SMR + CCS”)
Coal gasification (CG) (i.e., “H2-ICE CG”)
CG + CCS (i.e., “H2-ICE CG- + CCS”)
Electrolysis of water (i.e., “H2-ICE electr. from grid”)
Electrolysis of water (from wind) (i.e., “H2-ICE green”)
As shown in
Figure 9, if the focus is on the use phase, producing hydrogen by SMR, CG, or current water electrolysis routes without any CCS system leads to a significant increase in CO
2eq emissions of the H2-ICE concerning DIE-ICE. Instead, SMR + CCS and CG + CCS scenarios can mitigate the climate-change impact of the H2-ICE use phase. Lastly, the water electrolysis route can be the most beneficial, but only if electricity is obtained from renewable sources, i.e., electrolysis of water (from wind) scenario. In this case, the climate-change impact is only due to the transport of hydrogen from the production plant to the retail station, assuming conventional vehicles and vessels are utilized for transport. A future investigation could explore the potential outcomes if the transportation phase were also environmentally optimized.
It is important to note that the results shown below apply to the case in which hydrogen is stored on board in liquid form. Contrarily to the gaseous storage, the potential hydrogen benefits are partly offset by the significant burdens associated with the liquefaction process, being it an energy-intensive process.
Figure 10 shows the comparison between the two engine configurations and the sensitivity assessment along the entire life cycle. The results demonstrated that, if the focus is on the whole life cycle, differences are solely dependent on use phase variations, and, therefore, on the hydrogen production route. In fact, cradle-to-gate changes never have a substantial impact on the whole life cycle. Moreover, as shown in
Table 6, in the case of water electrolysis with green electricity, the relevance of the WTW contribution on the overall life cycle significantly dropped. Instead, the relevance of the cradle-to-gate (i.e., raw material acquisition and processing, manufacturing, and redesign phases) increased. The findings reported in
Figure 10 indicate that current hydrogen production methods like steam methane reforming and coal gasification do not result in reduced CO
2eq emissions compared to traditional diesel internal combustion engines. Instead, they can contribute to significant climate-change impacts. Even electrolysis, which relies on electricity mostly generated from fossil fuels, does not offer much improvement. Therefore, unless renewable energy sources power the process, using hydrogen as a fuel may not offer any advantages and might even increase emissions. However, coupling SMR with carbon capture and storage (CCS) technology can lead to substantial reductions in climate-change impacts, with a 31.4% decrease in emissions for the H2-ICE solution. A 15% reduction is achievable with CCS coupled with CG. Additionally, when water electrolysis is powered by wind energy, the H2-ICE solution becomes highly beneficial, with over 90% reduced climate-change impact compared to DIE-ICE. In this optimal scenario, the benefits of transitioning to H2-ICE outweigh the emissions associated with the redesign process, making it a promising solution for upgrading existing internal combustion engines.
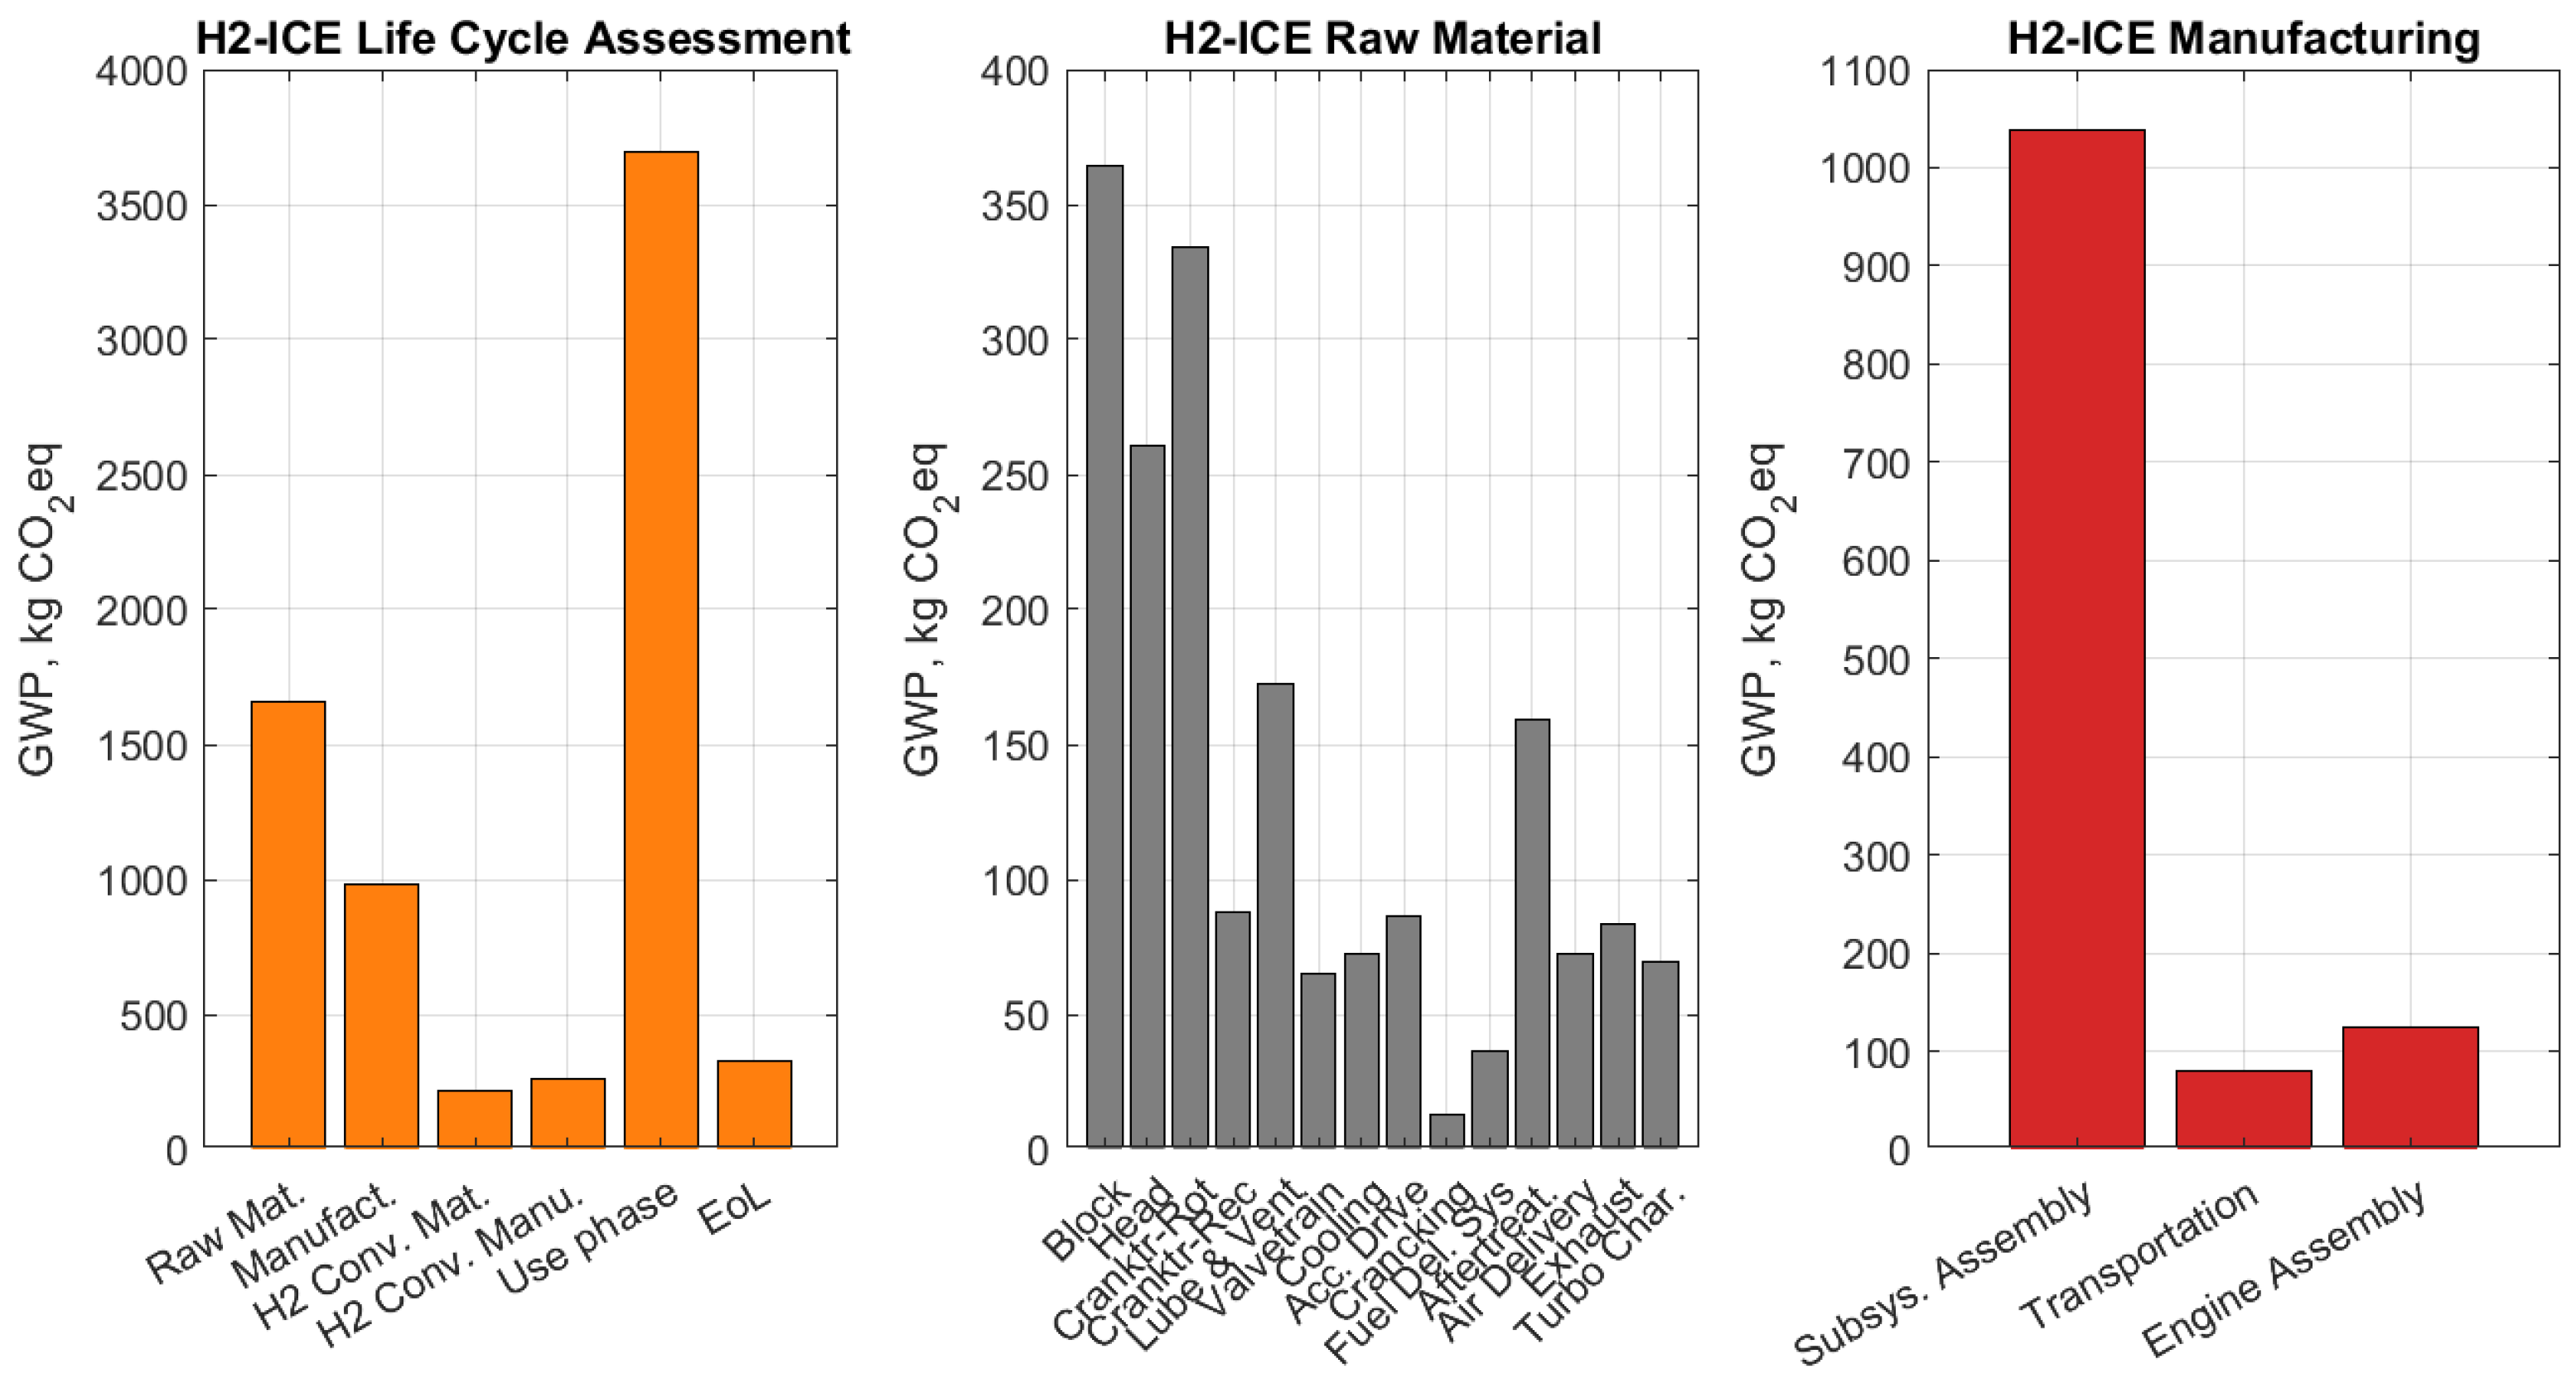
Figure 11 shows the climate-change impact in the case of green hydrogen (i.e., water electrolysis (from wind) scenario) which was revealed to be the best-case scenario, accounting for 7242 kgCO
2eq per engine on its entire life cycle. As shown in the left bar chart (orange bars), the contribution related to raw material acquisition and pre-processing, manufacturing, and redesign (i.e., the so-called “H2 Conv. Mat” and “H2 Conv. Man”) is relevant (i.e., 43%) and almost equal to the contribution of the use phase (i.e., 51%). Actions finalized to the decarbonization of those phases can reduce the climate-change impact of hydrogen engines significantly further. For the raw material acquisition and pre-processing phases, among all the material flows, efforts should be concentrated on decarbonizing aluminum and stainless-steel production (i.e., by using green aluminum and steel). In terms of components, the efforts should concentrate on reducing the impact of the production of block, head, cranktrain-rotating, and lube and vent subsystems. Lastly, for the manufacturing and EoL phases, efforts should concentrate on decarbonizing the electricity mix.
5. Conclusions
The current study evaluates the climate-change impact (i.e., CO2eq or GHG emissions) of a hydrogen engine (H2-ICE) that has been redesigned from a mass-produced engine initially intended to be fueled by diesel oil (DIE-ICE). A comparison has been made between this innovative solution and its diesel counterpart to evaluate potential environmental advantages and disadvantages. The LCA technique has been used to evaluate the impacts from a life-cycle perspective, i.e., from the initial phase of acquiring raw materials to the EoL phase. In the case of the H2-ICE, this study also considers the emissions related to the extra raw materials and energy needed for the redesign, i.e., the production of the novel monofuel hydrogen-powered engine as a replacement for the initial diesel counterpart. Lastly, a reference scenario has been set up for the H2-ICE, in which it is assumed that hydrogen is produced by means of SMR from natural gas. Five additional hydrogen production scenarios were assessed in the latter comparison as a sensitivity assessment.
The redesign process resulted in a slight increase in terms of CO2eq emissions. However, in the reference scenario, the results confirmed that the use phase is the primary driver of the life-cycle climate-change impact in both engines, as stated in the literature. Therefore, the most significant life-cycle variations with respect to the current DIE-ICE solely depend on the use phase variations. Results show that, on one hand, with the current hydrogen production routes, i.e., SMR and CG, the H2-ICE solution does not have reduced CO2eq emissions compared to the DIE-ICE. Instead, they would lead to significant increases in terms of climate change. Even the electrolysis route with the current electricity mix, still largely based on fossil fuels, would not be beneficial. Therefore, similarly to electricity used as a fuel, the use of hydrogen as a fuel may not lead to any advantages (i.e., this can lead either to an increase in emissions), if the electricity used is not from renewable sources.
Instead, if SMR is coupled with CCS technology (i.e., SMR + CCS scenario), the H2-ICE solution would achieve significant reductions in terms of climate change (i.e., 31.4%). A reduction of 15% is achieved if CG is coupled with CCS. Lastly, in the case of water electrolysis with electricity produced from wind, the H2-ICE solution would be significantly beneficial, having considerably reduced climate-change impact with respect to DIE-ICE (i.e., over 90%). In this latter best-case scenario, the benefits of the new H2-ICE solution outweigh the increase in emissions related to the redesign process, making it a potentially beneficial solution also for reconditioning current, and used internal combustion engines.
Lastly, it must be noted that the impact of the best-case scenario can be further reduced. In fact, reducing the impact of the use phase increases the importance of other life-cycle phases for decarbonization. Green electricity can be assumed, not only for hydrogen production, but also for the other life-cycle phases, it being the main driver of climate change in the manufacturing and EoL phases. The use of green aluminum and green steel should also be investigated, them being the most impactful material flows in the raw material acquisition and pre-processing phases in terms of climate change.
Future research will focus on the TTW contribution of the H2-ICE to estimate the consequences on the environment of other exhaust emissions (i.e., NOx, HC, and PM) and in the perspective of performing a thorough LCA, broadening the scope to include other impact categories (e.g., acidification potential, ozone depletion, use of mineral and metal resources, particulate matter formation, and ecotoxicity). In fact, emissions that do not directly affect the climate-change indicator may occur in the manufacturing, use, and EoL phases. Finally, future research will focus on the life-cycle costing evaluation to explore the techno-economic feasibility of this novel solution. Although hydrogen can be produced via green routes from renewable sources, the hydrogen costs produced by these routes are high when compared to fossil fuels and the potential break-even point identification requires further investigation.


 ,
, 
