Abstract
Under the dual-carbon target, the popularization and application of building integrated photovoltaic (BIPV) and ground source heat pump systems have made active buildings a research hotspot in the field of architecture and energy. Aiming at this issue, based on the building energy consumption model of active buildings, an active building energy management system (EMS) control strategy based on multi-energy load collaborative optimization is proposed. Firstly, based on the thermal dynamic characteristics and building performance parameters of active buildings, the overall refined energy consumption model of active buildings is constructed. Secondly, based on the construction of BIPV, the ice storage air conditioning system, the ground source heat pump system, and the integrated demand response (IDR) model, a tiered carbon transaction cost model is introduced, and an energy management strategy that leverages the synergistic application of renewable and active technologies is proposed. This strategy aims to meet the comprehensive needs of active buildings in terms of economic benefits, comfort, and environmental protection. Finally, the strategy’s effectiveness is demonstrated through a practical example.
1. Introduction
Faced with the global energy crisis and escalating environmental challenges, coupled with China’s dual carbon goals, the efficient management of residential building energy consumption has become a crucial issue. According to the China Building Energy Efficiency Annual Development Research Report 2023, urban and rural residential buildings respectively account for 25% and 21% of total building energy consumption, collectively generating nearly one billion tons of CO2 [1]. With the continuous expansion of urban and rural residential areas, traditional building models are increasingly unable to meet the developmental needs of modern society. In this context, active buildings have garnered widespread attention for their significant capabilities in optimizing energy use and reducing environmental impacts, quickly becoming a focal point in the energy sector. Compared to traditional passive buildings, active buildings further utilize advanced renewable energy technologies and active technologies, and through an EMS, achieve real-time monitoring, analysis, and dynamic adjustment of energy. This system can respond to immediate demands and incentive signals from the power grid while considering internal comfort and energy efficiency, actively participating in demand response programs to optimize the supply demand balance with the power grid. This shift indicates that research in the building sector is gradually moving from focusing solely on energy consumption in passive buildings to considering multiple dimensions such as “energy consumption”, “environment”, “comfort”, and “proactivity” in active buildings [2].
The objectives of this study are to consider the synergistic effects of renewable energy technologies and active technologies in active buildings, as well as to comprehensively consider the enhancement of multi-dimensional goals in active buildings.
The main contribution of this paper lies in proposing a multi-energy load collaborative optimization strategy for energy management in active buildings, aimed at improving energy management within active buildings to meet multi-dimensional energy management goals. The study initially builds an overall refined energy consumption model based on the thermal dynamic characteristics and building performance parameters of active buildings. Subsequently, the proposed strategy focuses on the synergy between renewable energy technologies (such as BIPV and ground source heat pump system) and active technologies (such as ice storage air conditioning system and energy storage technologies). Moreover, the study explores the impact of multi-type flexible loads, including thermal, electric, and cold loads participating in IDR on energy management strategies, ensuring user comfort. Finally, the paper introduces a stepped carbon trading cost model to deeply analyze the potential environmental benefits of these strategies. Based on the comprehensive refined energy consumption model of active buildings, this strategy provides an energy management approach that considers and optimizes energy efficiency, minimizes environmental impact, enhances residential comfort, and balances energy supply and demand comprehensively.
2. Related Works
In recent years, energy management in active buildings has emerged as a significant research focus within the energy sector. For example, Ref. [3] explored the optimization of combined heat and power systems in residential buildings through a mixed integer nonlinear programming approach aimed at minimizing operating costs. Ref. [4] proposed a multi-source building energy management system capable of efficiently integrating and managing energy across various power system environments. Ref. [5] developed an optimal scheduling model for building microgrids based on traditional microgrid technology, aiming to reduce the operational costs of buildings by optimizing distributed generation units and energy loads. Ref. [6] introduced a building energy management strategy based on neural network predictive control, which experiments have shown can improve the heating efficiency of building boilers by nearly 20%. Ref. [7] introduced scheduling strategies for HVAC and battery storage systems, utilizing model predictive control methods to optimize building energy efficiency, which were applied to demand response scenarios. Ref. [8] analyzed EMS case reports from 1976 to 2014 and found that managing HVAC systems through BEMS could save about 14% in costs. Furthermore, Ref. [9] demonstrated how integrating PV, batteries, and electric vehicles can maximize cost-effectiveness at the household level and respond to changes in grid demand. At the same time, Ref. [10] discussed in depth the comprehensive utilization of photovoltaic output and emphasized the importance of distributed energy management in the energy transition. Facing the challenges of energy system uncertainties, Ref. [11] proposed a robust optimization management framework for residential microgrids, addressing uncertainties in demand and renewable energy generation to enhance system adaptability and flexibility. However, current research often focuses on single or limited energy and load combinations, particularly lacking in the joint optimization of cooling, heating, and electrical systems, thus not fully tapping into the potential of active buildings in an integrated multi-energy load environment.
On the other hand, although current active building energy management strategies have achieved significant progress in reducing energy consumption and improving economic benefits, there is still a lack of detailed consideration of user comfort, as well as systematic research on the demand response and environmental impacts of various load types. For instance, while Ref. [12] deeply analyzed the relationship between HVAC load characteristics and user comfort, it did not explore synergistic optimization with other energy devices. Meanwhile, Ref. [13] focused on user satisfaction while studying electric vehicle charging and discharging management strategies, and Ref. [14] focused on analyzing the effects of EV charging participation in demand management on the consumption of renewable energies in buildings, but these analyses were mainly limited to the impact of managing single load types on building energy consumption. Ref. [15] proposed a method to reduce peak electricity usage in buildings through end-use load control, but did not consider the interaction of renewable energy generation and storage with demand-responsive buildings. Additionally, although References [16,17] discussed the optimal scheduling of energy resources, they failed to treat the building energy system as a comprehensive multi-energy integrated system. Similarly, References [18,19,20], despite analyzing the impact of various load management strategies on energy efficiency from multiple perspectives, often did not integrate these strategies with the overall optimization of the building’s energy system. Most of these studies only addressed the optimization of building energy consumption dimensions and did not comprehensively reflect the complex demands of active buildings for multi-dimensional objectives.
Distinguished from the limitations of existing research, this paper constructs a refined model of energy consumption in active buildings and comprehensively integrates a variety of technologies commonly used in active buildings. It delves into the synergistic optimization effects of renewable energy technologies and active technologies, specifically emphasizing the integration and coupling of cooling, heating, and electrical modules within the building.
Moreover, the paper employs a detailed behavioral analysis and classification modeling approach to discuss the potential impacts of various flexible loads actively participating in demand response mechanisms on building energy management, ensuring that user comfort is not compromised. To further explore the environmental benefits of active buildings, the research introduces a stepped carbon trading cost model, an innovative method that not only optimizes energy efficiency but also fully considers environmental protection factors.
Overall, this study provides an efficient energy management strategy for optimizing active buildings across multiple dimensions under multi-energy load collaboration, demonstrating its comprehensive integration and innovative approach in reducing energy consumption, enhancing economic benefits, ensuring user comfort, and achieving environmental sustainability.
3. Active Building Structure and Energy Consumption Model
3.1. Active Building Structure
Traditional passive buildings primarily focus on incorporating high-performance thermal insulation materials, strategically designed enclosure structures, and other passive strategies during the architectural design process to reduce energy consumption. This approach minimizes dependency on external energy sources and passively enhances building energy efficiency. Building on the characteristics of passive designs, active buildings further decrease energy demand by integrating a variety of renewable energy technologies and advanced active technologies. This integration endows buildings with the capabilities to independently generate, store, and dynamically control energy.
As the core of intelligent management in active buildings, EMS continuously monitors and analyzes the building’s energy consumption patterns, occupants’ comfort levels, real-time user loads, renewable energy outputs, and the immediate status of the power grid. Leveraging this comprehensive information, EMS customizes and optimizes scheduling strategies to ensure that optimal control commands are issued to each controllable device, fulfilling scheduling objectives. The structure of an active building is depicted in Figure 1.
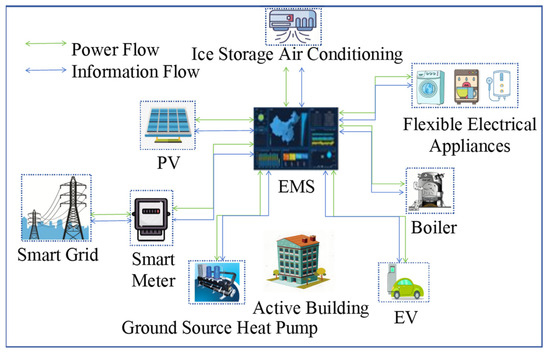
Figure 1.
Active building structure diagram.
3.2. Active Building Energy Consumption Model
By integrating building performance parameters with thermodynamic principles, this paper establishes an energy consumption model that offers a comprehensive framework for analyzing energy use in active buildings. The model accurately depicts the sources of thermal gains and the pathways of energy flow within the building, highlighting key factors such as heat generated by human bodies, heat output from household appliances, solar radiation gains through windows, and heat transfer losses through walls and windows. Furthermore, it provides essential parameters for evaluating and optimizing the comfort levels of occupants, utilizing advanced EMS to finely tune indoor environmental conditions, ensuring occupant comfort and health.
- 1.
- Heat Gain Inside the Building
- 2.
- Heat Dissipation from Human Sources Inside the Building
- 3.
- Heat Dissipation from Equipment Inside the Building
- 4.
- Solar Heat Radiation
- 5.
- Heat Exchange between the Exterior Walls and the External Environment
- 6.
- Heat Exchange between Exterior Windows and the External Environment
4. Active Building Source-Load Equipment Model
In the current field of building energy management, renewable energy technologies primarily based on BIPV and heat pump technologies are extensively utilized. Additionally, widely adopted active technologies like ice storage air conditioning systems and boiler systems leverage their efficient energy conversion and storage capabilities, further enhancing the utilization of renewable energy and the stability of the energy supply in buildings.
4.1. BIPV Model
The BIPV model developed in this study integrates crucial parameters such as regional climate data, the physical layout of photovoltaic panels, photoelectric conversion efficiency, and system configurations, alongside battery performance indicators under standard test conditions provided by manufacturers. By incorporating a compensation coefficient, a simplified prediction model for photovoltaic output is achieved. Moreover, the battery units in BIPV can store surplus photovoltaic energy and provide a continuous energy supply when solar irradiation is insufficient, thereby enhancing the building’s energy self-sufficiency and optimizing the overall efficiency of green energy utilization.
where represents the reference temperature of the photovoltaic cells, in °C; represents the reference value for solar irradiance, in kW/m2; represents the difference in actual cell temperature relative to the reference condition, in °C; represents the difference in actual solar irradiance relative to the reference condition, in kW/m2; represents the predicted power output of the photovoltaic system, in kW; represents the maximum output power of the photovoltaic array under standard conditions, in kW; a, b, c are the compensation coefficients; represents the stored energy in the battery at time t, in kW; is the self-discharge coefficient of the battery, set to 0.001 based on negligible self-discharge over a one-day period; is the charging coefficient of the battery; is the discharging coefficient of the battery; represents the charging power of the battery at time t, in kW; represents the discharging power of the battery at time t, in kW.
4.2. Ground Source Heat Pump System Model
Heat pump technology, another efficient and clean source of renewable energy, is widely utilized in the construction sector. Currently, the most commonly used types in China include ground source and air source heat pumps. This paper focuses on modeling studies using a ground source heat pump as an example.
The model concentrates on the energy efficiency and power consumption of the heat pump unit. It achieves an accurate evaluation of the ground source heat pump’s performance by monitoring the inlet and outlet water temperatures of the condenser and evaporator, in conjunction with hourly power consumption data [21].
where represents the performance coefficient of the unit; is the inlet cooling water temperature of the condenser, in °C; is the outlet cooling water temperature of the condenser, in °C; is the outlet cooling water temperature of the evaporator, in °C; is the heating capacity of the unit under rated conditions, in kW; is the internal heat loss in the condenser, in kW; is the internal heat loss in the evaporator, in kW; is the coefficient reflecting changes in working conditions; is the electrical power consumption of the ground source heat pump, in kW; f is the coefficient to be determined; G is the mass flow rate of cooling water, in kg/s.
Regression using the least squares method yields the following:
where represents the load factor of the ground source heat pump; represents the heat output of the ground source heat pump, in kW.
4.3. Ice Storage Air Conditioning System Model
The ice storage air conditioning system integrates components such as an electric refrigerator, an absorption refrigerator, and a cold storage tank to form an integrated cold storage and cooling system [22]. The electric refrigerator uses the period of low night electricity prices to produce cooling energy, effectively reducing the operating costs of the building. At the same time, the absorption refrigerator enhances the flexibility and adaptability of the ice storage air conditioning system by using the residual heat from the building’s heating module as a power source. As the energy storage center in the ice storage air conditioning system, the cold storage tank effectively mitigates the peak electricity demand.
- (1)
- Electric Refrigerator
The electric refrigerator cools by consuming electrical energy, and its cooling power is shown in Equation (16).
where represents the cooling power output of the electric refrigerator, in kW; represents the electrical power consumed by the electric refrigerator, in kW; is the energy efficiency ratio of the electric refrigerator.
- (2)
- Absorption Refrigerator
The absorption refrigerator is driven by the residual heat from the building system, and its cooling power is shown in Equation (17).
where represents the cooling power output of the absorption refrigerator, in kW; represents the efficiency of the heat exchange device; represents the input thermal power to the absorption refrigerator, in kW; is the energy efficiency ratio of the electric refrigerator.
- (3)
- Cold Storage Tank
The cold storage tank is an important component of the ice storage air conditioning system. The model takes into account the loss coefficient, refrigeration efficiency, release efficiency, and maximum storage capacity. The amount of stored cooling is shown in Equation (18).
where represents the stored cooling capacity of the cold storage tank during period t, in kW; represents the self-loss coefficient of the cold storage tank; represents the storage coefficient; represents the release coefficient; represents the cooling power during period t, in kW; represents the release power during period t, in kW.
4.4. Boiler Integrated System
An integrated boiler system that combines a gas boiler and an electric boiler serves as a key unit in the building’s heating module. It also plays a supplementary role in a ground source heat pump system, ensuring that the building can continuously and stably obtain the required heat during periods of high demand.
- (1)
- Gas Boiler
The heating power of the gas boiler is as shown in Equation (19).
where represents the heat output of the gas boiler, in kW; represents the heat production efficiency of the gas boiler; represents the input natural gas power, in kW.
- (2)
- Electric Boiler
The heating power of the electric boiler is shown in Equation (20).
where represents the heat output of the electric boiler, in kW; represents the heat production efficiency of the electric boiler; represents the input electrical power to the electric boiler, in kW.
5. Active Load Control Technology
Active load control technology, as another core active technology, actively guides flexible loads to participate in IDR, aiming to achieve optimal energy scheduling and low-carbon, energy-saving goals while ensuring user comfort. It involves highly detailed modeling and management of shiftable, transferable electrical loads, as well as reducible cooling and heating loads within the building, ensuring that active buildings are precisely controlled according to the specific characteristics of user loads.
5.1. Modeling of Shiftable Electrical Loads
This type of load characteristic is manifested by continuously running until a complete load cycle is finished once started within the preset start and stop time range set by the user. The operating time of such loads is set by the user based on personal needs, effectively balancing energy management and user experience when participating in energy scheduling. Typical shiftable electric loads in residential buildings include washing machine loads and dishwasher loads.
- (1)
- Washing machine load
- (2)
- Dishwasher load
For the shiftable load, the power distribution vector before scheduling and after scheduling are shown as follows.
where represents the starting time before scheduling; represents the ending time before scheduling; represents the duration of the scheduling, in h.
The compensation costs for load participation in IDR are as follows.
where represents the unit shiftable power compensation coefficient, in CNY/kW.
5.2. Modeling of Transferable Electrical Load
The electricity consumption of such loads can be flexibly adjusted during their designated usage periods. This means that even if there are interruptions or changes in the electricity usage period, the total energy demand must remain unaffected. For loads with storage capabilities, such as electric vehicles, the key is to complete the charging task before a specified time point.
According to the 2022 National Household Travel Survey (NHTS) by the U.S. Department of Transportation [23], the daily driving distance of electric vehicle users and the time of the last trip’s conclusion approximately follow a log-normal distribution and a Weibull distribution, respectively.
The daily driving distance of electric vehicle users approximately follows a log-normal distribution, with the probability density function being as follows:
where D represents the driving distance, in km; represents the shape parameter of the distribution, set at 3.019; represents the scale parameter of the distribution, set at 1.123.
The state of charge (SOC) of electric vehicle batteries and their driving distance approximately satisfy a linear relationship.
where represents the SOC of the battery; represents the maximum driving range of the electric vehicle, in km.
By calculating with the two equations mentioned above, the probability density function for the initial SOC value of electric vehicles when they connect to the grid is obtained as follows.
The end time of users’ last trip approximately follows a Weibull distribution, with the probability density function as follows.
where represents the shape parameter of the distribution, set at 5.427; represents the scale parameter of the Weibull distribution, set at 18.618 [12].
Thus, the state at the end of any electric vehicle’s journey can be represented by a one-dimensional matrix [24].
where M represents the charging and discharging identifier for electric vehicles, with 1 indicating charging mode and 0 for other times; represents the state of charge of the electric vehicle when parked; represents the desired state of charge when off-grid; represents the grid connection time for the electric vehicle; represents the expected time for going off-grid; represents the rated capacity of the electric vehicle, in kW; represents the charging power, in kW; represents the discharging power, in kW.
The battery charge level of the electric vehicle is given by the following formula.
where represents the battery power of the electric vehicle during period t, in kW; represents the charging coefficient of the electric vehicle; represents the discharging coefficient of the electric vehicle; represents the charging indicator; represents the discharging indicator.
For transferable loads, the power distribution vector before participating in scheduling and the power distribution vector after scheduling are as follows.
where represents the start time before scheduling; represents the end time before scheduling; represents the start time after scheduling; represents the end time after scheduling.
The compensation costs for the load participating in IDR is as follows.
where represents the unit transfer power compensation coefficient, in CNY/kW.
5.3. Modeling of Reducible Thermal Load
In terms of reducible thermal load, the EMS manages hot water load through IDR, considering that the main reducible thermal loads in active buildings are the users’ hot water loads. To accurately account for the dynamic characteristics of hot water temperature under the influence of various factors, this paper establishes a mathematical model that reflects the hourly temperature changes of the water heater. The model takes into consideration numerous factors including the volume of hot water used by users, the temperature of the hot water, the temperature of the supplementary cold water, and the heat exchange between the water heater and the environment.
where represents the specific heat of water, in J/(kg·°C); represents the water temperature in the storage tank at time t, in °C; represents the temperature of the cold water entering the storage tank to replace the used hot water at time t, in °C; represents the total volume of stored water, in m3; represents the total volume of cold water replacing the used hot water, in m3; represents the heat required to supply hot water at time t, in kW; A represents the surface area of the thermal storage water tank, in m2; represents the heat transfer coefficient, in kW/m2.
5.4. Modeling of Reducible Cooling Load
In the study of active building energy management strategies, air conditioning load is a key reducible cooling load. Therefore, this paper establishes an air conditioning load model based on user comfort. The model reflects the real-time relationship between the air conditioning load and factors such as the temperature difference between indoor and outdoor environments, light intensity, and the thermal conductivity characteristics of the building.
where represents the air density inside the building, in kg/m3; C represents the specific heat capacity of the air inside the building, in J/(kg·°C); V represents the volume of air inside the building, in m3; represents the cooling demand of the building, in kW.
The IDR model based on tiered subsidies focuses on managing the flexible cooling and heating loads of active buildings by adjusting indoor temperatures and water temperatures, while ensuring user comfort [25]. The subsidy levels are adjusted based on the actual temperature deviation from the set temperatures, encouraging users to participate in demand response activities by fine-tuning their temperature settings without sacrificing comfort.
where represents the unit subsidy coefficient, in CNY/kW; represents the reduced cooling load, in kW; represents the reduced heating load, in kW.
where x represents the indoor air temperature or water temperature; represents the temperature boundary for classification, in °C. The greater the deviation from , the lower the user comfort and the higher the subsidy.
6. Active Building Energy Management Strategy
This paper proposes an innovative multi-energy load collaborative optimization energy management strategy in the field of active building energy management. Aiming to minimize economic costs and carbon emissions as dual objectives, while considering user comfort as a constraint, the strategy employs the EMS to precisely schedule the operation of source-load equipment and optimize user flexible loads. The strategy is designed to achieve multiple objectives: energy use efficiency, environmental sustainability, user comfort, and proactive management. This ensures the comprehensive sustainable development of active buildings in terms of economy, energy, environment, and comfort.
6.1. Objective Function
6.1.1. Economic Cost
- (1)
- Electricity Purchase and Sale Cost
- (2)
- Gas Purchase Cost
- (3)
- Tiered Carbon Emission Penalty Cost
- (4)
- Equipment Operation and Maintenance Cost
- (5)
- Flexible Load Compensation Cost
6.1.2. CO2 Emissions
6.2. Constraints
- (1)
- Electric Power Balance Constraint
- (2)
- Cooling Power Balance Constraint
- (3)
- Thermal Power Balance Constraint
- (4)
- BIPV Constraints
Photovoltaic Output Constraint
Battery Capacity Constraint
Battery Charging Power Constraint
Battery Discharging Power Constraint
- (5)
- Ice Storage Air Conditioning System Constraints
Electric Refrigeration Power Constraint
Absorption Refrigeration Power Constraint
Thermal Storage Tank Capacity Constraint
Thermal Storage Tank Charging Power Constraint
Thermal Storage Tank Discharging Power Constraint
- (6)
- Ground Source Heat Pump Constraint
Ground Source Heat Pump Power Constraint
- (7)
- Boiler Integrated System Constraint
Gas Boiler Power Constraint
Electric Boiler Power Constraint
- (8)
- Flexible Load Constraint
Shiftable Electric Load Constraint
Transferrable Electric Load Constraint
Electric Vehicle Energy Constraint
Electric Vehicle State Constraint
Electric Vehicle Charging Demand Constraint
Indoor Temperature Constraint
Hot Water Temperature Constraint
Water Heater Storage Tank Capacity Constraint
This paper constructs an energy management strategy model for active buildings, which is a mixed integer linear model. The optimal energy management strategy, considering energy consumption, environmental impact, comfort, and active dimensions comprehensively, is obtained through the combined use of is obtained through the combined use of Yalmip (Linköping University, Linköping, Sweden) and the CPLEX commercial solver (IBM, Armonk, NY, USA).
7. Case Study Analysis
7.1. Parameter Settings
The simulation is conducted on a Lenovo Legion R7000 PC equipped with an AMD Ryzen 7 7840H processor and 16GB RAM, running Windows 11. This setup ensures efficient data processing and smooth execution of the simulation. The study involves a 15-story residential building in Nanjing, covering an area of 1056 m2, during summer. The energy management cycle for the system is set for 24 h with an interval of 1 hour per unit of energy management. The building is oriented north–south, with solar panels covering 233 m2 (about 20% of the total area) installed on the rooftop. These panels face south with a tilt of 30 degrees. The installation includes 249 TSM-175D high-efficiency monocrystalline silicon solar modules, achieving a peak power of 430 kW.
The building houses 120 residents, averaging 44 m2 per person. The average human body heat dissipation in the building is calculated at 43.84 W per person. It is assumed that 90% of the 120 households own vehicles, including electric and traditional fossil-fuel vehicles, totaling 108 vehicles. Electric vehicles constitute 30% of this fleet, amounting to 32 vehicles. In terms of active building comfort, the loads controlled in the active load management include those from washing machines, dishwashers, electric vehicles, air conditioners, and water heaters.
The percentage of people at home during each time period and the related parameters for each load are shown in Table 1 and Table 2.

Table 1.
Percentage of personnel at home.

Table 2.
Load-related parameter settings.
The interactive pricing between the active building system and the external electric grid is based on the peak and valley electricity prices for residential use in Nanjing. Specific electricity and natural gas prices are shown in Table 3.

Table 3.
Electricity and gas prices.
The thermodynamic parameters of the building and the parameters of each device are shown in Table 4.

Table 4.
Building thermodynamic parameters and equipment parameters.
The outdoor temperature, solar irradiance, and various building load curves for a typical summer day over 24 h are shown in Figure 2.
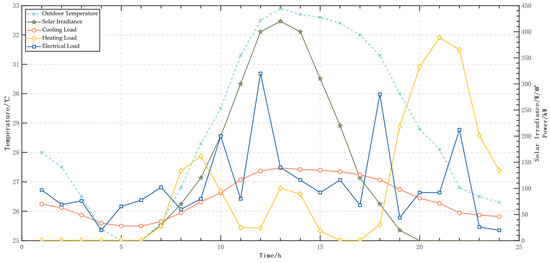
Figure 2.
24 h environment and load curve.
7.2. Scenario Comparative Analysis
For a comparative analysis of the utility of the multi-energy load collaborative optimization proposed in this article for active buildings, four energy management scenarios are set for analysis. The specific scenario settings are shown in Table 5 and explained as follows:

Table 5.
Specific scene settings.
Scenario 1 only considers the use of passive technologies in active buildings at the design stage, without considering active technologies and renewable energy technologies.
Scenario 2 only considers the application of active technologies, i.e., considering ice storage air conditioning systems and active load control technologies, without considering the application of renewable energy technologies.
Scenario 3 only considers the application of renewable energy technologies, i.e., considering BIPV and ground source heat pump systems, without considering the application of active technologies.
Scenario 4 considers the collaborative application of renewable energy technologies and active technologies in active buildings.
The comparison of operational schemes under different scenarios is shown in the following table.
This paper sets up four different energy scheduling scenarios to deeply explore the application benefits of multi-energy load collaborative optimization strategies in active buildings. The results shown in Table 6 indicate that Scenario 4, which integrates renewable energy technologies and active technologies in active buildings, significantly outperforms the other scenarios. It not only exhibits lower operating costs (2504.7 CNY) but also demonstrates lower carbon emissions (162.2 kg). The achievement of these results is primarily due to the multi-energy load collaborative optimization strategy, which can ensure energy supply security while effectively balancing energy supply and demand, optimizing energy flow, improving energy utilization efficiency, and reducing energy consumption and related environmental impacts.

Table 6.
Comparison of different scene operation schemes.
In comparison, although Scenario 3, which solely applies renewable energy technologies, and Scenario 2, which relies only on active technologies, also reduce operating costs and carbon emissions, their effects are not as pronounced as in Scenario 4. This is mainly because these technologies, when applied independently, cannot fully realize their potential for energy saving and emission reduction due to the lack of effective energy complementation and integration mechanisms, thus limiting the improvement of energy efficiency and the reduction of environmental impacts. Additionally, as a contrast, Scenario 1 only considers the passive technologies used in the initial design of active buildings, ignoring the application of active and renewable energy technologies, resulting in the highest operating costs (3611.5 CNY) and carbon emissions (319.1 kg). This highlights the limitations of single technologies and the importance of multi-energy load collaborative optimization in modern building energy management.
7.3. Analysis of Energy Management Strategy under the Optimal Scheme
From Section 7.2, it is evident that the active building energy management strategy, which involves the collaborative application of renewable energy technologies and active technologies, is the optimal solution. The experimental results indicate that the computational efficiency of solving the optimization problem using YALMIP and CPLEX solvers is high. The specific calculation times are as follows: YALMIP time: 1.5935 s; solver time: 0.4145 s; total optimization time: approximately 2 s.
The cooling, heating, and electrical operation plans under this scheme are shown in Figure 3, Figure 4 and Figure 5:
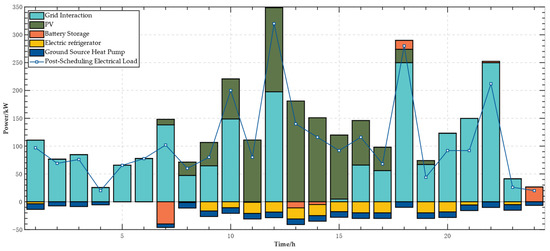
Figure 3.
Power operation plan.
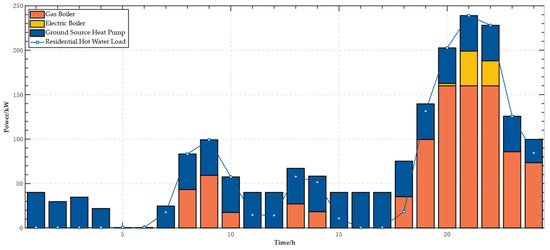
Figure 4.
Thermal operation plan.
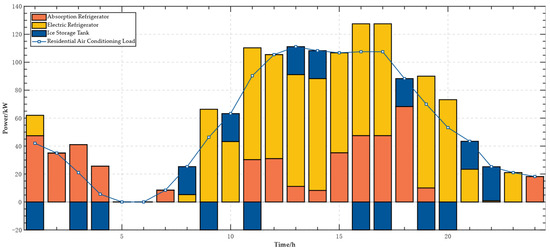
Figure 5.
Cooling operation plan.
Analyzing the data shown in Figure 3, Figure 4 and Figure 5, it is evident that from midnight to early morning (0:00~7:00), as the building’s power demand reaches its daily low and there is no solar irradiation at night, the photovoltaic generation system outputs zero power, and the building solely relies on electricity purchased from the grid to meet its electrical load demand. Notably, during periods of lower electricity prices, the EMS utilizes the residual heat produced by the ground source heat pump to primarily meet the cooling load via the absorption chiller, while the electric cooling system provides supplemental cooling and stores excess cold energy in the thermal storage system, preparing in advance for high demand periods during the day. From 7:00 to 11:00, the EMS prioritizes scheduling photovoltaic system output to cover power demands and strategically purchases additional electricity from the grid during off-peak price periods to store in batteries, aiming to release it during peak price periods to alleviate grid load. Additionally, the EMS controls the collaborative operation of the ground source heat pump and gas boiler to effectively meet heating load demands. As the heating load increases, the EMS intelligently decides to activate the electric chiller to ensure cooling load demands are met, and further, when the stored cold energy in the thermal storage is depleted, it supplements and stores cold energy through the electric chiller to cope with the increased cooling load due to rising afternoon outdoor temperatures. From 11:00 to 17:00, as solar irradiance increases, PV can fully cover the electricity demands, and the residual heat from the ground source heat pump is effectively used to provide cooling through the absorption chiller, demonstrating the exceptional capability of active technologies and renewable energy working in synergy to promote comprehensive energy utilization and environmental benefits. In the evening and nighttime, as photovoltaic output decreases, the EMS system once again purchases electricity from the grid to meet the increased power demands, ensuring the continuity and stability of energy supply. During periods when the heating load peaks, the EMS system coordinates the simultaneous operation of the gas boiler and ground source heat pump, as well as the backup role of the electric boiler, to collectively ensure that the system’s heating load demands are met. This precise energy scheduling exemplifies the EMS system’s effectiveness in comprehensive energy management and promoting environmental sustainability.
Analysis from Figure 6 and Figure 7 indicates that the electric vehicle charging load prior to scheduling is primarily concentrated between 16:00 and 22:00, reflecting the typical behavior of residents starting to charge their vehicles immediately after returning home in the evening. After optimization by the EMS, the charging times were shifted to the low electricity price period from 00:00 to 07:00, significantly reducing charging costs and optimizing grid load. Similarly, the washing machine load was shifted from the evening peak period to the afternoon hours of 13:00 to 16:00. Although the electricity prices are slightly higher during this period, reliance on the efficient generation from the photovoltaic system substantially reduced the need to purchase electricity from the grid and also avoided potential curtailment of solar energy. The same applies to the dishwasher load.
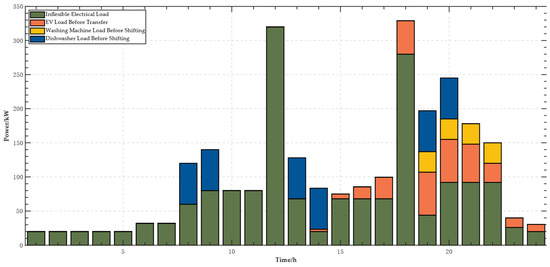
Figure 6.
Electric load distribution before scheduling.
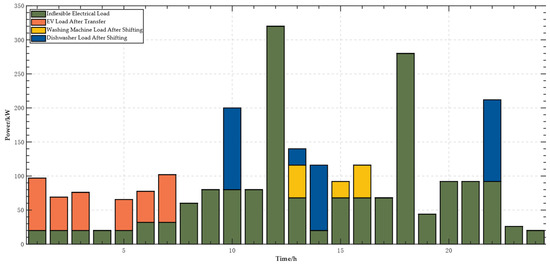
Figure 7.
The electric load distribution after scheduling.
As shown in Figure 8: the hot water system maintains a stable temperature during the deep night to early morning when user demand is very low and moderately cools down after the morning rush to reduce energy consumption. When the water temperature drops to about 62 °C, far from the set comfortable temperature, the system adjusts the compensation strategy to slow down the temperature decline until the evening when hot water usage increases.
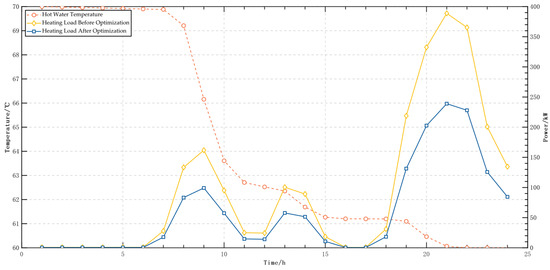
Figure 8.
Hot water temperature and heat load.
As shown in Figure 9: in terms of indoor temperature control, the system reduces the cooling load by raising the temperature. Especially in the 11:00~15:00 period, despite the highest external temperatures and cooling load demand of the day, indoor temperatures are effectively stabilized thanks to the photovoltaic output, showcasing the system’s excellent ability to maintain indoor comfort. As the external temperature drops at 17:00, the demand for cooling decreases correspondingly, and the indoor temperature drops slightly, stabilizing around 24.8 °C, demonstrating a good balance between indoor temperature stability and energy efficiency.
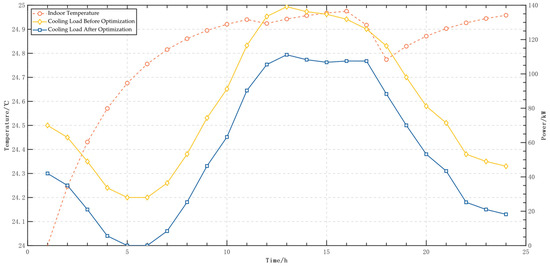
Figure 9.
Indoor temperature and cooling load.
In summary, this strategy, by coordinating renewable energy and active technologies, significantly reduces building operational costs and carbon emissions, contributing to building energy efficiency enhancement and environmental sustainability and providing a reference for the field of active building energy management.
8. Conclusions
This paper proposes an energy management strategy that comprehensively considers system energy consumption, environment, comfort, and proactivity through the coordinated optimization of renewable energy technologies and active technologies for active buildings with multi-energy load synergies. The following conclusions can be drawn:
- The proposed energy consumption model, which considers the thermal dynamic characteristics of active buildings and integrates various disturbance factors such as building envelope structure and outdoor temperature, can more accurately describe the energy consumption of active buildings and the demands of various loads under different external environments.
- Active buildings, under the synergistic effects of renewable energy technologies and active technologies, can efficiently utilize renewable energy and significantly reduce energy costs. Experimental scenarios show that, compared to using only passive technologies, the optimal strategy that integrates renewable energy and active technologies can reduce operating costs by 30.64% and completely avoid curtailment of photovoltaic energy.
- By introducing a tiered carbon trading model, this strategy significantly enhances the environmental friendliness of buildings. It achieves efficient energy savings and emission reductions while fully ensuring user comfort. The study results indicate that the proposed strategy can reduce carbon emissions by 49.20%. Overall, this strategy comprehensively improves active buildings across multiple dimensions.
- Future research can further explore the application of active buildings under broader climatic conditions and various building types, as well as their integration potential with urban energy systems. Additionally, issues such as the uncertainty of renewable energy output and load demand need to be further addressed in subsequent work.
Author Contributions
Conceptualization, M.W.; methodology, H.G.; software, D.P.; validation, X.S.; formal analysis, Q.W.; investigation, C.X.; resources, H.G.; data curation, H.G.; writing—original draft preparation, H.G.; writing—review and editing, M.W.; visualization, H.G.; supervision, H.G.; project administration, H.G.; funding acquisition, M.W. All authors have read and agreed to the published version of the manuscript.
Funding
This research was funded by State Grid Corporation of China for science and technology projects (No. 52090R230002).
Data Availability Statement
The original contributions presented in the study are included in the article, further inquiries can be directed to the corresponding author.
Conflicts of Interest
The authors declare no conflicts of interest.
References
- Tsinghua University Building Energy Efficiency Research Center. China Building Energy Conservation Annual Development Research Report 2023; China Building Industry Press: Beijing, China, 2023; pp. 2–43. [Google Scholar]
- Active Building Evaluation Standard T/ASC14-2020; Chinese Architecture Association. China Construction Industry Press: Beijing, China, 2020.
- Malekshah, S.; Hovanessian, A.; Gharehpetian, G.B. Combined heat and power sizing in residential building using mixed integer nonlinear programming optimization method. In Proceedings of the 2016 24th Iranian Conference on Electrical Engineering (ICEE), Shiraz, Iran, 10–12 May 2016; IEEE: Piscataway, NJ, USA, 2016; pp. 1208–1213. [Google Scholar]
- Yoon, S.-H.; Kim, S.-Y.; Park, G.-H.; Kim, Y.-K.; Cho, C.-H.; Park, B.-H. Multiple power-based building energy management system for efficient management of building energy. Sustain. Cities Soc. 2018, 42, 462–470. [Google Scholar] [CrossRef]
- Guan, X.; Xu, Z.; Jia, Q.S. Energy-efficient buildings facilitated by microgrid. IEEE Trans. Smart Grid 2010, 1, 243–252. [Google Scholar] [CrossRef]
- Macarulla, M.; Casals, M.; Forcada, N.; Gangolells, M. Implementation of predictive control in a commercial building energy management system using neural networks. Energy Build. 2017, 151, 511–519. [Google Scholar] [CrossRef]
- Vedullapalli, D.T.; Hadidi, R.; Schroeder, B. Combined HVAC and battery scheduling for demand response in a building. IEEE Trans. Ind. Appl. 2019, 55, 7008–7014. [Google Scholar] [CrossRef]
- Lee, D.; Cheng, C.C. Energy savings by energy management systems: A review. Renew. Sustain. Energy Rev. 2016, 56, 760–777. [Google Scholar] [CrossRef]
- Yan, D.; Li, T.; Ma, C.; Lai, L.L.; Tsang, K.F. Cost effective energy management of home energy system with photovoltaic-battery and electric vehicle. In Proceedings of the IECON 2020 the 46th Annual Conference of the IEEE Industrial Electronics Society, Singapore, 18–21 October 2020; IEEE: Piscataway, NJ, USA, 2020; pp. 3611–3616. [Google Scholar]
- Fujimoto, Y.; Kikusato, H.; Yoshizawa, S.; Kawano, S.; Yoshida, A.; Wakao, S.; Murata, N.; Amano, Y.; Tanabe, S.-I.; Hayashi, Y. Distributed energy management for comprehensive utilization of residential photovoltaic outputs. IEEE Trans. Smart Grid 2016, 9, 1216–1227. [Google Scholar] [CrossRef]
- Hosseini, S.M.; Carli, R.; Dotoli, M. Robust optimal energy management of a residential microgrid under uncertainties on demand and renewable power generation. IEEE Trans. Autom. Sci. Eng. 2020, 18, 618–637. [Google Scholar] [CrossRef]
- Liu, H.; Wang, Y.; Li, J.; Ge, S.; Li, J.; Li, S. Electric-thermal joint dispatching of rural micro-energy grid considering building heat balance and flexible comfort. Power Syst. Autom. 2019, 43, 50–58. [Google Scholar]
- Li, X.; Zhu, L.; Weng, X. Day-ahead scheduling of microgrid with building phase change energy storage system. J. Sol. Energy 2023, 44, 84–90. [Google Scholar]
- Sehar, F.; Pipattanasomporn, M.; Rahman, S. Demand management to mitigate impacts of plug-in electric vehicle fast charge in buildings with renewables. Energy 2017, 120, 642–651. [Google Scholar] [CrossRef]
- Arun, S.L.; Selvan, M.P. Intelligent residential energy management system for dynamic demand response in smart buildings. IEEE Syst. J. 2017, 12, 1329–1340. [Google Scholar] [CrossRef]
- Liu, X.; Liu, X.; Zhang, T.; Li, H.; Jiang, Y. Description and design method of generalized energy storage resources in building area. Chin. J. Electr. Eng. 2024. Available online: https://kns.cnki.net/kcms2/article/abstract?v=RsYUK1W_GsgAXP0DgUcqr8FR7r8yFnjT1DFt8mVVqUM7fynA62xtgThRrYDS66r-ftO-qo85-p-itNhgO-dRYBiO2wtbNuttPZ0en6imc6IYVSAQhOvmHw7KwE3nIqi4e0qyFVL13bc=&uniplatform=NZKPT&language=CHS (accessed on 14 March 2024).
- Pedrasa, M.A.A.; Spooner, T.D.; MacGill, I.F. Coordinated scheduling of residential distributed energy resources to optimize smart home energy services. IEEE Trans. Smart Grid 2010, 1, 134–143. [Google Scholar] [CrossRef]
- Barchi, G.; Miori, G.; Moser, D.; Papantoniou, S. A small-scale prototype for the optimization of PV generation and battery storage through the use of a building energy management system. In Proceedings of the 2018 IEEE International Conference on Environment and Electrical Engineering and 2018 IEEE Industrial and Commercial Power Systems Europe (EEEIC/I&CPS Europe), Palermo, Italy, 12–15 June 2018; pp. 1–5. [Google Scholar]
- Van Roy, J.; Leemput, N.; Geth, F.; Büscher, J.; Salenbien, R.; Driesen, J. Electric vehicle charging in an office building microgrid with distributed energy resources. IEEE Trans. Sustain. Energy 2014, 5, 1389–1396. [Google Scholar] [CrossRef]
- Jin, X.; Qi, F.; Qi, F.; Mu, Y.; Jia, H.; Yu, X.; Li, Z. HVAC model predictive control method considering building thermal dynamic characteristics. Chin. J. Electr. Eng. 2020, 40, 3928–3940. [Google Scholar]
- Sun, C.; Zhang, L.; Zhang, G.; Ju, X.; Lu, Y. Research on control strategy and operation characteristics of solar-ground source heat pump system. J. Sol. Energy 2024, 45, 95–101. [Google Scholar]
- Cheng, S.; Huang, T.; Wei, R. Multi-time scale optimal scheduling of CCHP microgrid with ice storage air conditioning. Power Syst. Autom. 2019, 43, 30–38. [Google Scholar]
- U.S. Department of Transportation. National Household Travel Survey. Available online: https://nhts.ornl.gov (accessed on 11 April 2024).
- Wang, X.; Shao, C.; Wang, X.; Du, C. Review of electric vehicle charging load and scheduling control strategy. Chin. J. Electr. Eng. 2013, 33, 1–10. [Google Scholar]
- Liu, R.; Qi, Q.; Yang, X.; Chen, S.; Qi, B. Active Balance Control Method of Temperature Control Load Based on Energy Block Distribution Mechanism. Chin. J. Electr. Eng. 2024. Available online: https://kns.cnki.net/kcms2/article/abstract?v=s5eXW7nWjw36xEjkI7OuFzPN4UpLxSJV6zv9T79peUWmR57kSE0F5LD1zf3RuIt69ZLEIs6qxsjkZAca4HXG4h1q5HcgUW5YsMRC9ZejACL8EcEvPqUPgPMpO5vo8H4JLew9tFILl1c=&uniplatform=NZKPT&language=CHS (accessed on 30 January 2024).
- Zhang, X.; Liu, X.; Zhong, J. Integrated energy system planning considering reward-penalty ladder carbon trading and electricity-heat transfer load uncertainty. Chin. J. Electr. Eng. 2020, 40, 6132–6142. [Google Scholar]
- Deng, J.; Jiang, F.; Wang, W.; He, G.; Zhang, X. Cascade optimal operation of park integrated energy system considering dynamic energy efficiency model. Grid Technol. 2022, 46, 1027–1039. [Google Scholar]
Disclaimer/Publisher’s Note: The statements, opinions and data contained in all publications are solely those of the individual author(s) and contributor(s) and not of MDPI and/or the editor(s). MDPI and/or the editor(s) disclaim responsibility for any injury to people or property resulting from any ideas, methods, instructions or products referred to in the content. |
© 2024 by the authors. Licensee MDPI, Basel, Switzerland. This article is an open access article distributed under the terms and conditions of the Creative Commons Attribution (CC BY) license (https://creativecommons.org/licenses/by/4.0/).