Article

Proposal and Verification of the Application of an Expert Inference Method to Present the Probability of Lithium-Ion Battery Thermal Runaway Risk

1
Department of Equipment and Fire Protection Engineering, Gachon University, Seongnam-Si 13120, Republic of Korea
2
Department of Electrical Engineering, Gachon University, Seongnam-Si 13120, Republic of Korea
*
Author to whom correspondence should be addressed.
Energies 2024, 17(11), 2566; https://doi.org/10.3390/en17112566
Submission received: 2 May 2024 / Revised: 17 May 2024 / Accepted: 20 May 2024 / Published: 26 May 2024
(This article belongs to the Section D: Energy Storage and Application)

Abstract

:
This study proposes a probabilistic quantification technique that applies an expert inference method to warn of the risk of a fire developing into a thermal runaway when a lithium-ion battery fire occurs. Existing methods have the shortcomings of low prediction accuracy and delayed responses because they determine a fire only by detecting the temperature rise and smoke in a lithium-ion battery to initiate extinguishing activities. To overcome such shortcomings, this study proposes a method to probabilistically calculate the risk of thermal runaway in advance by detecting the amount of off-gases generated in the venting stage before thermal runaway begins. This method has the advantage of quantifying the probability of a fire in advance by applying an expert inference method based on a combination of off-gas amounts, while maintaining high reliability even when the sensor fails. To verify the validity of the risk probability design, problems with the temperature and off-gas increase/decrease data were derived under four SOC conditions in actual lithium-ion batteries. Through the foregoing, it was confirmed that the risk probability can be accurately presented even in situations where the detection sensor malfunctions by applying an expert inference method to calculate the risk probability complexly. Additionally, it was confirmed that the proposed method is a method that can lead to quicker responses to thermal runaway fires.

1. Introduction

Secondary batteries can efficiently store and reuse energy by undergoing repeated charging and discharging cycles. During charging, chemical substances store electrical energy, which is then converted back into electricity and delivered to the external circuit during discharging. NCM batteries, which utilize nickel (Ni), cobalt (Co), and manganese (Mn), belong to the ternary system and boast higher energy density compared to other active materials, making them suitable for large-capacity battery production with the capability of enduring thousands of charge–discharge cycles. However, they are relatively susceptible to thermal runaway compared to LFP batteries. On the other hand, LFP batteries utilize lithium iron phosphate (LiFePO4) and are prized for their cost-efficiency and safety. These batteries exhibit high thermal stability and can be produced at relatively low costs. In particular, LFP batteries pose less risk of thermal runaway compared to other lithium-ion batteries, hence boasting superior safety. Such lithium-ion batteries, a type of secondary battery, are widely utilized in various applications including mobile phones, laptops, electric vehicles, and energy storage systems (ESS) due to their high energy density and lightweight nature [1,2,3,4,5,6].
However, lithium-ion batteries with advantages in many different spheres are constantly questioned in terms of safety because they suffer from the chronic problem of the thermal runaway phenomenon, which leads to temperature rises within a short period of time due to internal and external stressors, such as mechanical damage including shock, dropping, and crushing; electrical defects due to overdischarging, overcharging, and short circuits; and secondary thermal emissions accompanied by explosion, which are observed in lithium-ion batteries and cause large-scale fires in lithium-ion batteries [5,6,7,8].
In lithium-ion battery fires, there is a time when off-gases are detected before smoke is generated, and the detection of fire through the detection of off-gases earlier than the moment when smoke is detected has a great effect on securing the golden time. However, because off-gas components and generation rates differ depending on the SOC of the battery, a clear standard for the occurrence of thermal runaway is lacking when off-gases are detected using off-gas sensors alone [7,8,9,10,11,12,13].
Therefore, in this study, the possibility of developing thermal runaway before the thermal runaway of a lithium-ion battery occurs was defined as a risk, and a measure to calculate the risk probability based on fuzzy logic, an expert inference method, so that thermal runaway can be detected before the golden time, is proposed. This measure refers to a structure in which the increases or decreases in temperature and off-gases during a thermal runaway fire are analyzed to derive the correlation, and the possibility of a thermal runaway fire is presented at an early stage based on the proposed algorithm so that the fire damage can be reduced to a minimum.
The remainder of this paper is organized as follows. In Section 2, the mechanism and fuzzy logic of thermal runaway fires according to the basic lithium-ion battery structure are explained in detail, and the problems in the event of a thermal runaway fire are described. In addition, the proposed battery fire risk probability calculation method is described. In Section 3, a simulation is performed using random number substitution to prove the effectiveness of the proposed battery fire risk probability calculation method. Thereafter, the effectiveness of the proposed design method was verified using actual battery thermal runaway fire experimental data. Finally, Section 4 summarizes and concludes the study.

2. LIB Structure and Thermal Runaway Fire Mechanism and Compositional Reasoning Design Applying the Fuzzy Logic

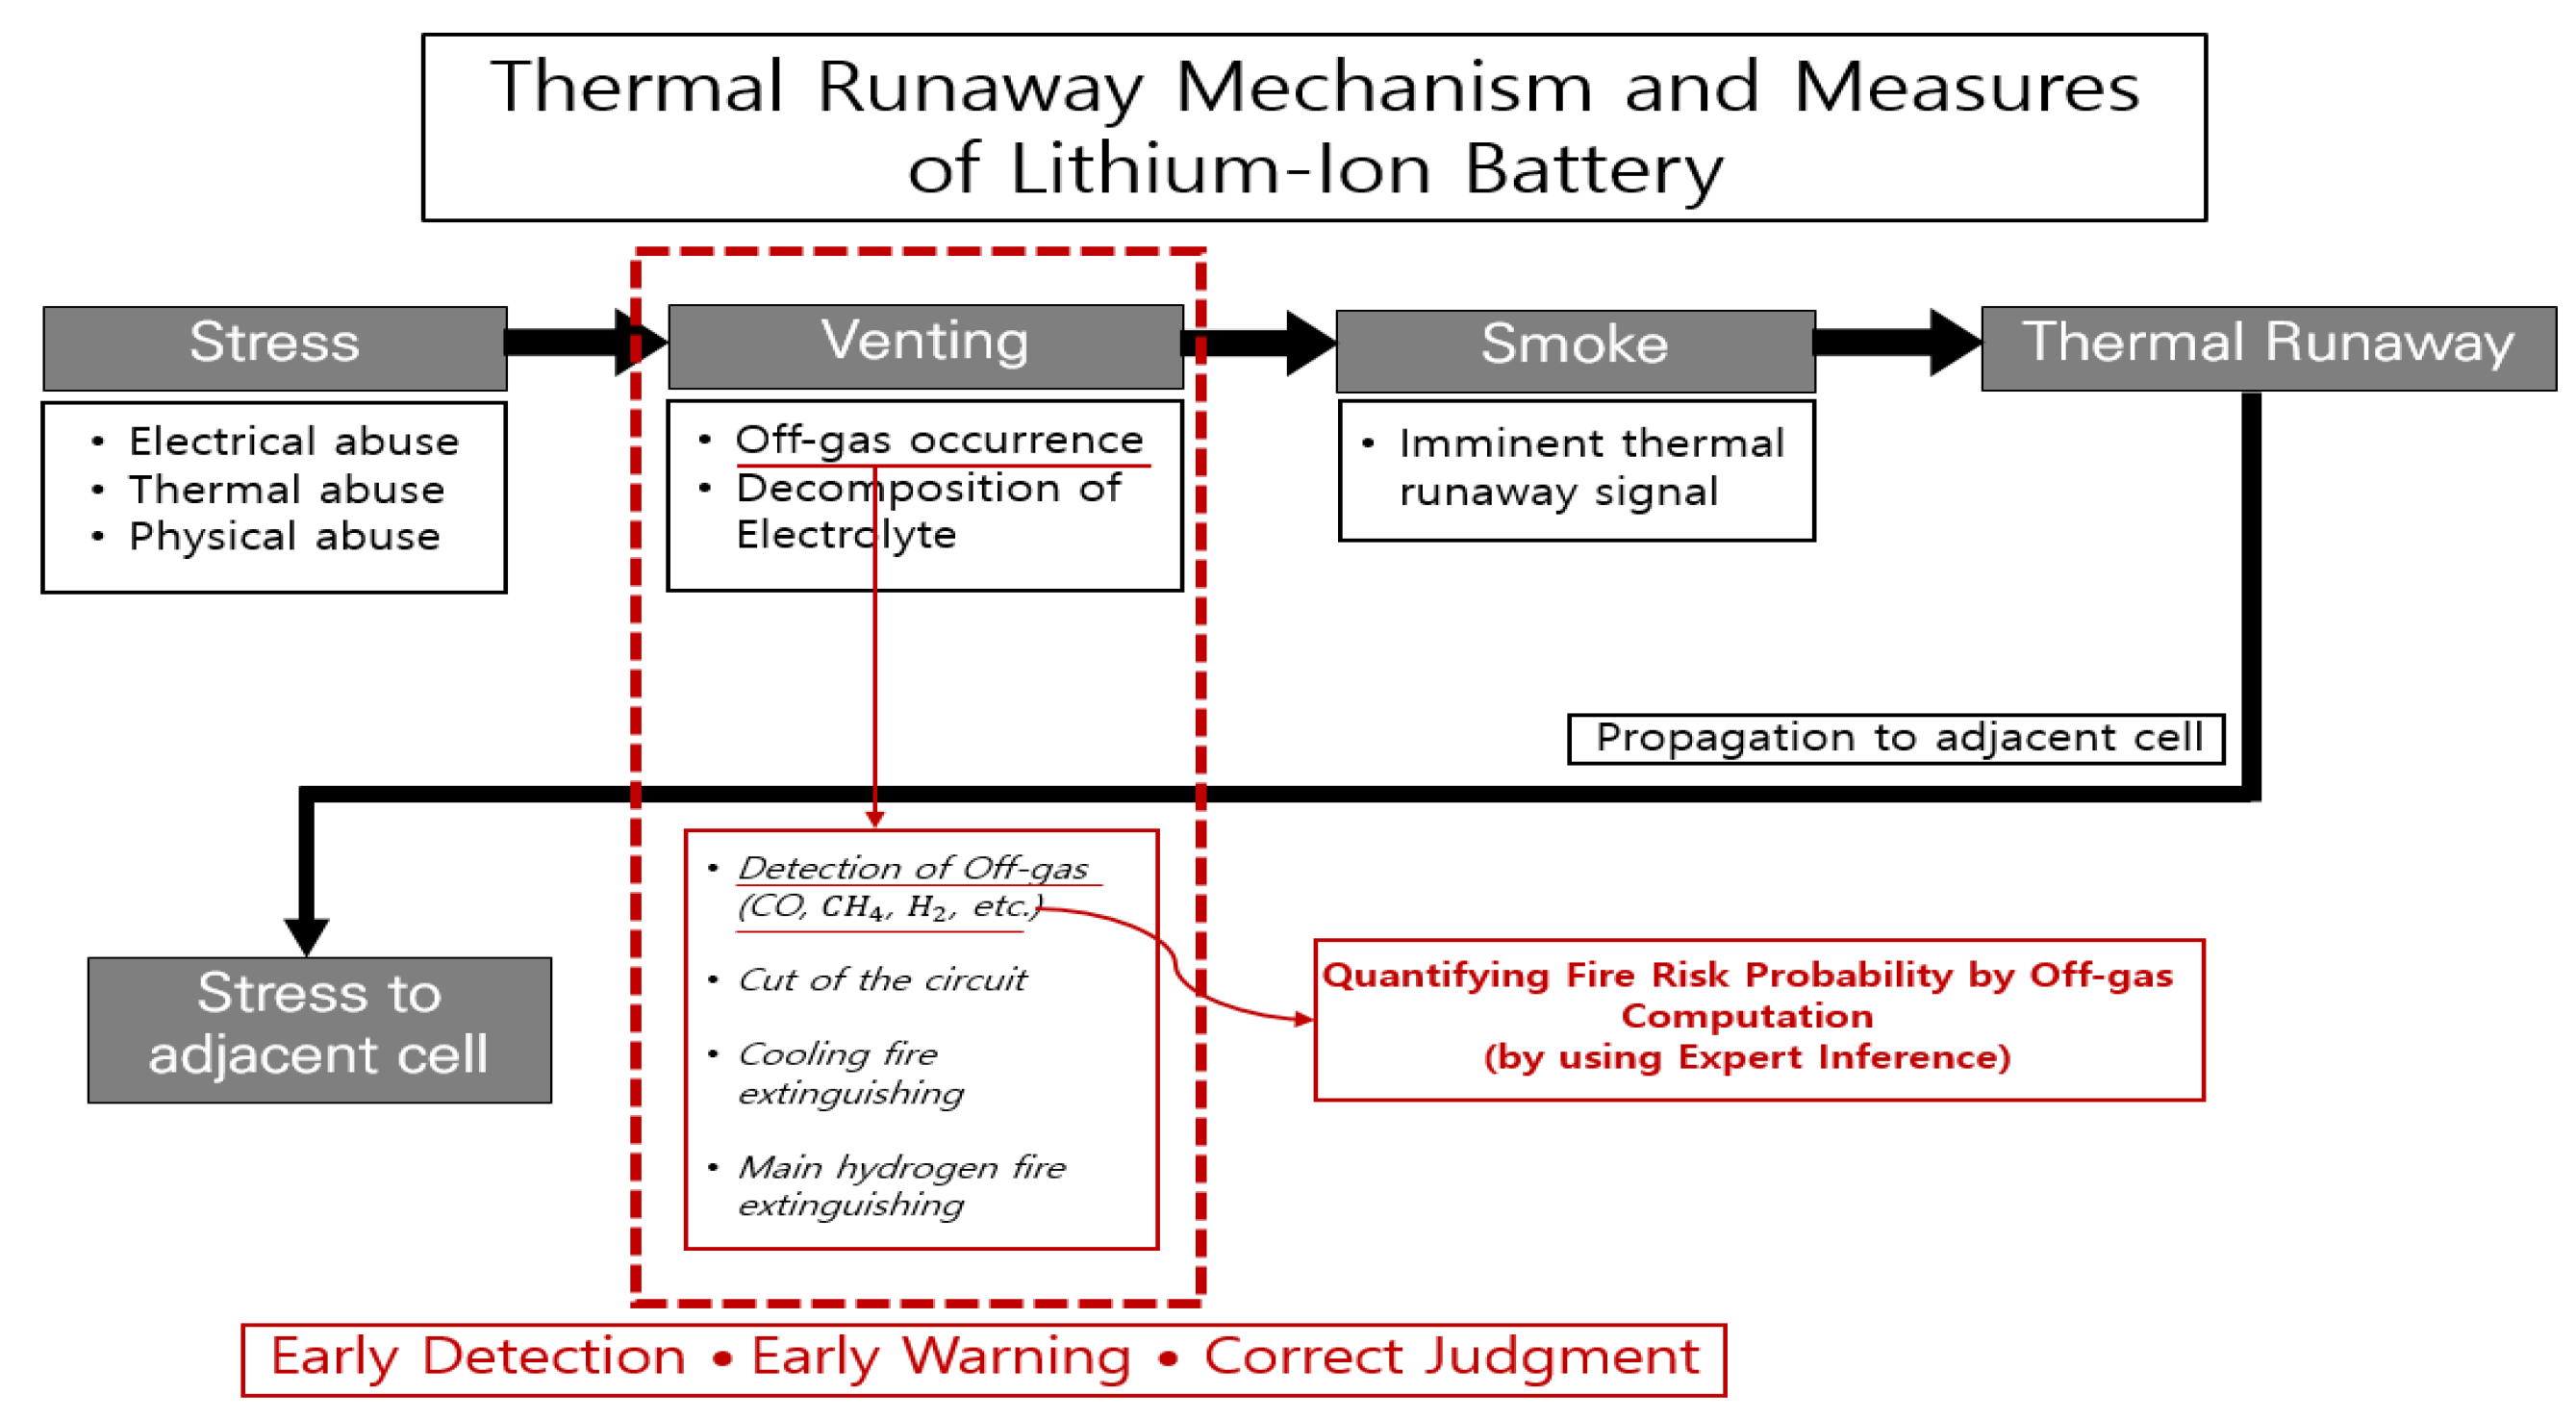
2.1. LIB Structure and Thermal Runaway Fire Mechanism

A lithium-ion battery (LIB) generally consists of four elements: a cathode, an anode, an electrolyte, and a separator, and is an electrochemical device that converts chemical energy into electrical energy through oxidation and reduction reactions [14].
Figure 1 shows the structure of a typical lithium-ion battery. The separator, which blocks physical contact between the anode and cathode, was designed to have microscopic holes to block the contact between the anode and cathode and enable lithium ions to move. When the anode and cathode come into contact, an electrical reaction occurs such that no electricity is produced and only heat energy is generated. Lithium-ion batteries, in which thin separators are used, can be easily damaged owing to their electrical and mechanical requirements. When the separator is destroyed and the temperature of the battery is maintained above a certain level, the electrolyte in the cell is vaporized, and the internal pressure increases such that a rapid temperature rise begins. Thermal runaway begins with a rise in temperature following the destruction of the separator between the anode and cathode materials [15].
UL 9540A defines the battery thermal runaway phenomenon as an event in which an electrochemical cell heats itself in an uncontrollable manner, thereby increasing its temperature. In addition, lithium-ion batteries generate flames that ignite again after a certain period of time, even after a fire starts, and are extinguished through fire-extinguishing activities. Owing to the nature of lithium-ion batteries, in which a large number of battery cells exist in aggregate form, such as in electric vehicles and energy storage devices, even when the initial flame has been removed, adjacent battery cells cause thermal runaway owing to thermal damage by conductive heat, radiant heat, etc., leading to re-ignition [16].
The greater the amount of electrical energy stored in the lithium-ion battery, that is, the higher the state of charge (hereinafter referred to as SOC) of the lithium-ion battery, the more heat generation increases proportionally.
Figure 2 shows the mechanism of battery thermal runaway fires. The thermal runaway of lithium-ion batteries progresses through four stages: the stress stage, in which internal pressure increases in the cell as the temperature rises, leading to the venting stage where electrolyte gases and decomposition gases are expelled from the cell, followed by the smoke stage where the separator melts, causing significant smoke generation due to the internal temperature rise, and finally the thermal runaway stage, where a fire ignites in one cell due to high temperatures and spreads to adjacent cells, resulting in a chain reaction of fires. Common factors initiating the stress stage include electrical, mechanical, and physical factors. Accidents resulting from overcharging and overdischarging of lithium-ion batteries are diverse, primarily stemming from thermal stability issues of the batteries. Especially in lithium-ion batteries used in electric vehicles and energy storage systems, incidents of fires and explosions due to overcharging have garnered global attention. For instance, exceeding the battery’s voltage limit due to overcharging can compromise its structural stability, leading to potential fires or explosions. Despite ongoing research and technological advancements, accidents resulting from the limitations of battery technology and user negligence persist, necessitating continuous efforts to mitigate them [17,18].
In the venting stage, during the process through which the temperature of the electrolyte rises and the electrolyte evaporates, a venting phenomenon occurs in which the internal pressure of the lithium-ion battery increases and the battery surface bursts simultaneously, and the electrolyte vapor and decomposed gases evaporated owing to the high temperature are discharged to the outside. In this case, the electrolyte vapor evaporates at the beginning of the venting stage, and the gases generated by the decomposition of the electrolyte component molecules are collectively defined as off-gases [19].

2.2. Problems in the Quantification of Thermal Runaway Probability Using Off-Gases

Here, the cell, which is the core of a lithium-ion battery fire, has characteristics that are generally inaccessible, and fires can be extremely difficult to extinguish. It is known that cases in which flames spread to adjacent cells are more dangerous than the risk to a single cell. Because the longer the flames spread, the more heat is generated, and the more difficult it is to extinguish the fire, the detection of the media must be suppressed, and early detection of the media significantly increases the effectiveness of the effort to extinguish the fire. Therefore, the initial detection of off-gases at the venting stage earlier than the smoke stage can act as a key to extinguishing battery thermal runaway fires. However, because the patterns of thermal runaway differ according to the SOCs of the battery, it may be difficult to quantify thermal runaway using a certain figure [20,21,22,23,24,25].
Figure 3 shows the temperature, carbon monoxide, and methane measured during the thermal runaway experiment according to the battery SOCs [26]. Looking at Figure 3a, where the SOC is 25%, thermal runaway did not occur, but the maximum value of methane measured was about 100 ppm, and the maximum values of temperature and carbon monoxide were shown to be about 220 °C and approximately 1050 ppm, respectively. In Figure 3b, where the SOC is 50%, thermal runaway occurred, and the maximum values of temperature, methane, and carbon monoxide were shown to be approximately 270 °C, 100 ppm, and 260 ppm, respectively. At the SOC of 75%, shown in Figure 3c, thermal runaway occurred, and the maximum values of temperature, methane, and carbon monoxide were shown to be 220 °C, 100 ppm, and 760 ppm, respectively, and at the SOC of 100% shown in Figure 3d, thermal runaway occurred and the maximum values of temperature, methane, and carbon monoxide were 100 °C, 100 ppm, and 55 ppm, respectively. Additionally, at SOC 100%, methane was detected in higher concentrations compared to carbon monoxide, unlike in other states. When comparing the thermal runaway experiments at SOC 25%, 50%, 75%, and 100%, it was observed that the highest temperature was recorded at SOC 50%, and notably, at SOC 100%, methane exhibited a higher ppm level compared to carbon monoxide, unlike at SOC 25%, 50%, and 75%. In all SOC conditions (25%, 50%, 75%, and 100%), there was a sharp increase in off-gas production at the onset of venting. However, at SOC 50%, 75%, and 100%, there was a slight decrease in temperature accompanied by a reduction in off-gas concentration. Because the thermal runaway patterns and maximum values of the off-gases generated are different for individual SOCs of the battery, as shown in Figure 3, it is very difficult to stochastically quantify thermal runaway with only a certain figure [23].
Accordingly, this paper presents a design method to calculate the risk as a probability based on the detection of off-gases generated in the thermal runaway mechanism of lithium-ion batteries. The method was designed by applying fuzzy logic based on the temperature rise and drop in the battery fire pattern and the elements and concentrations of the detected off-gases. In addition, it is designed by adopting the highly reliable Mamdani inference method and center of area calculation [27,28].

3. Application of the Expert Inference Method and Trend Analysis and Effectiveness Verification According to the Thermal Runaway Risk Calculation Method

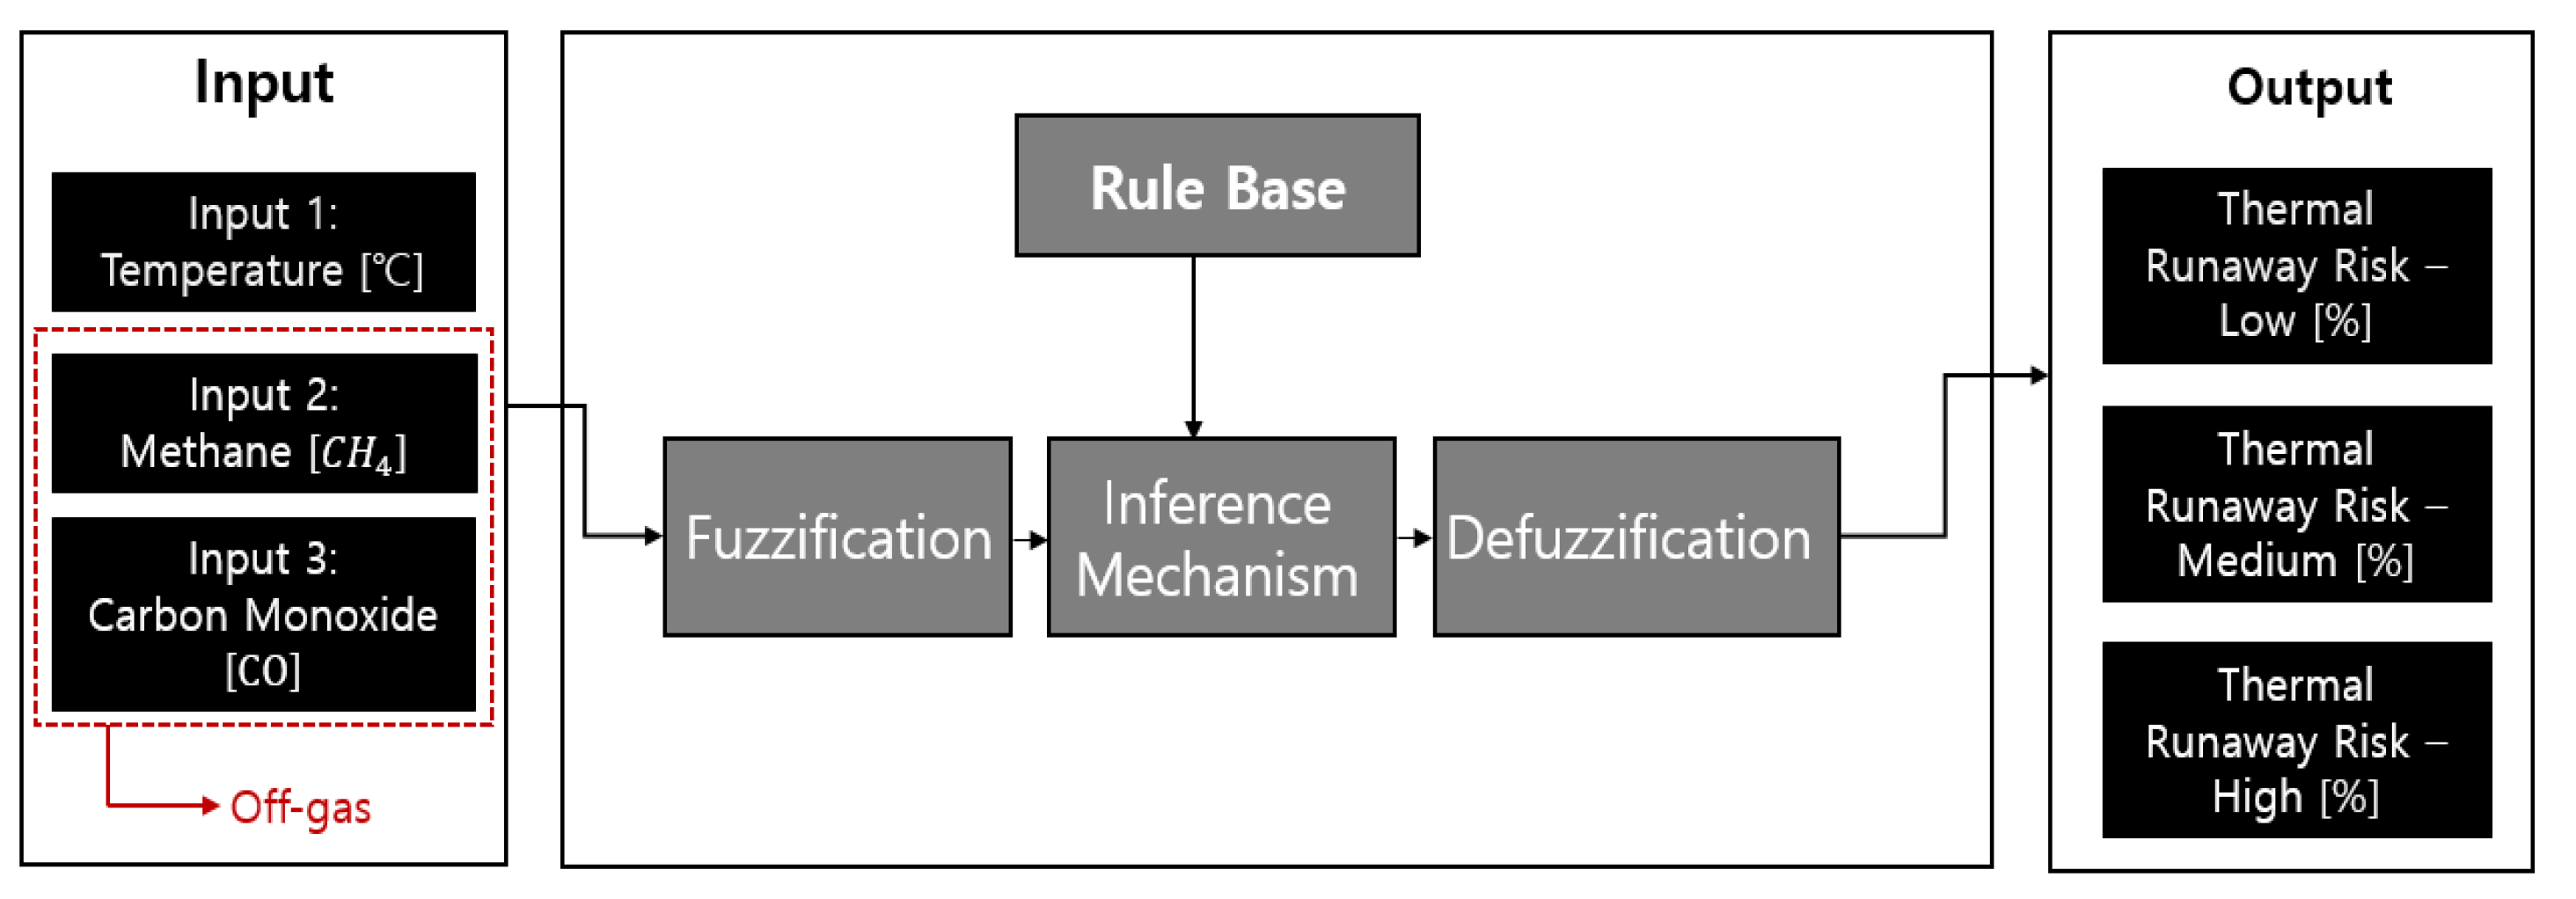
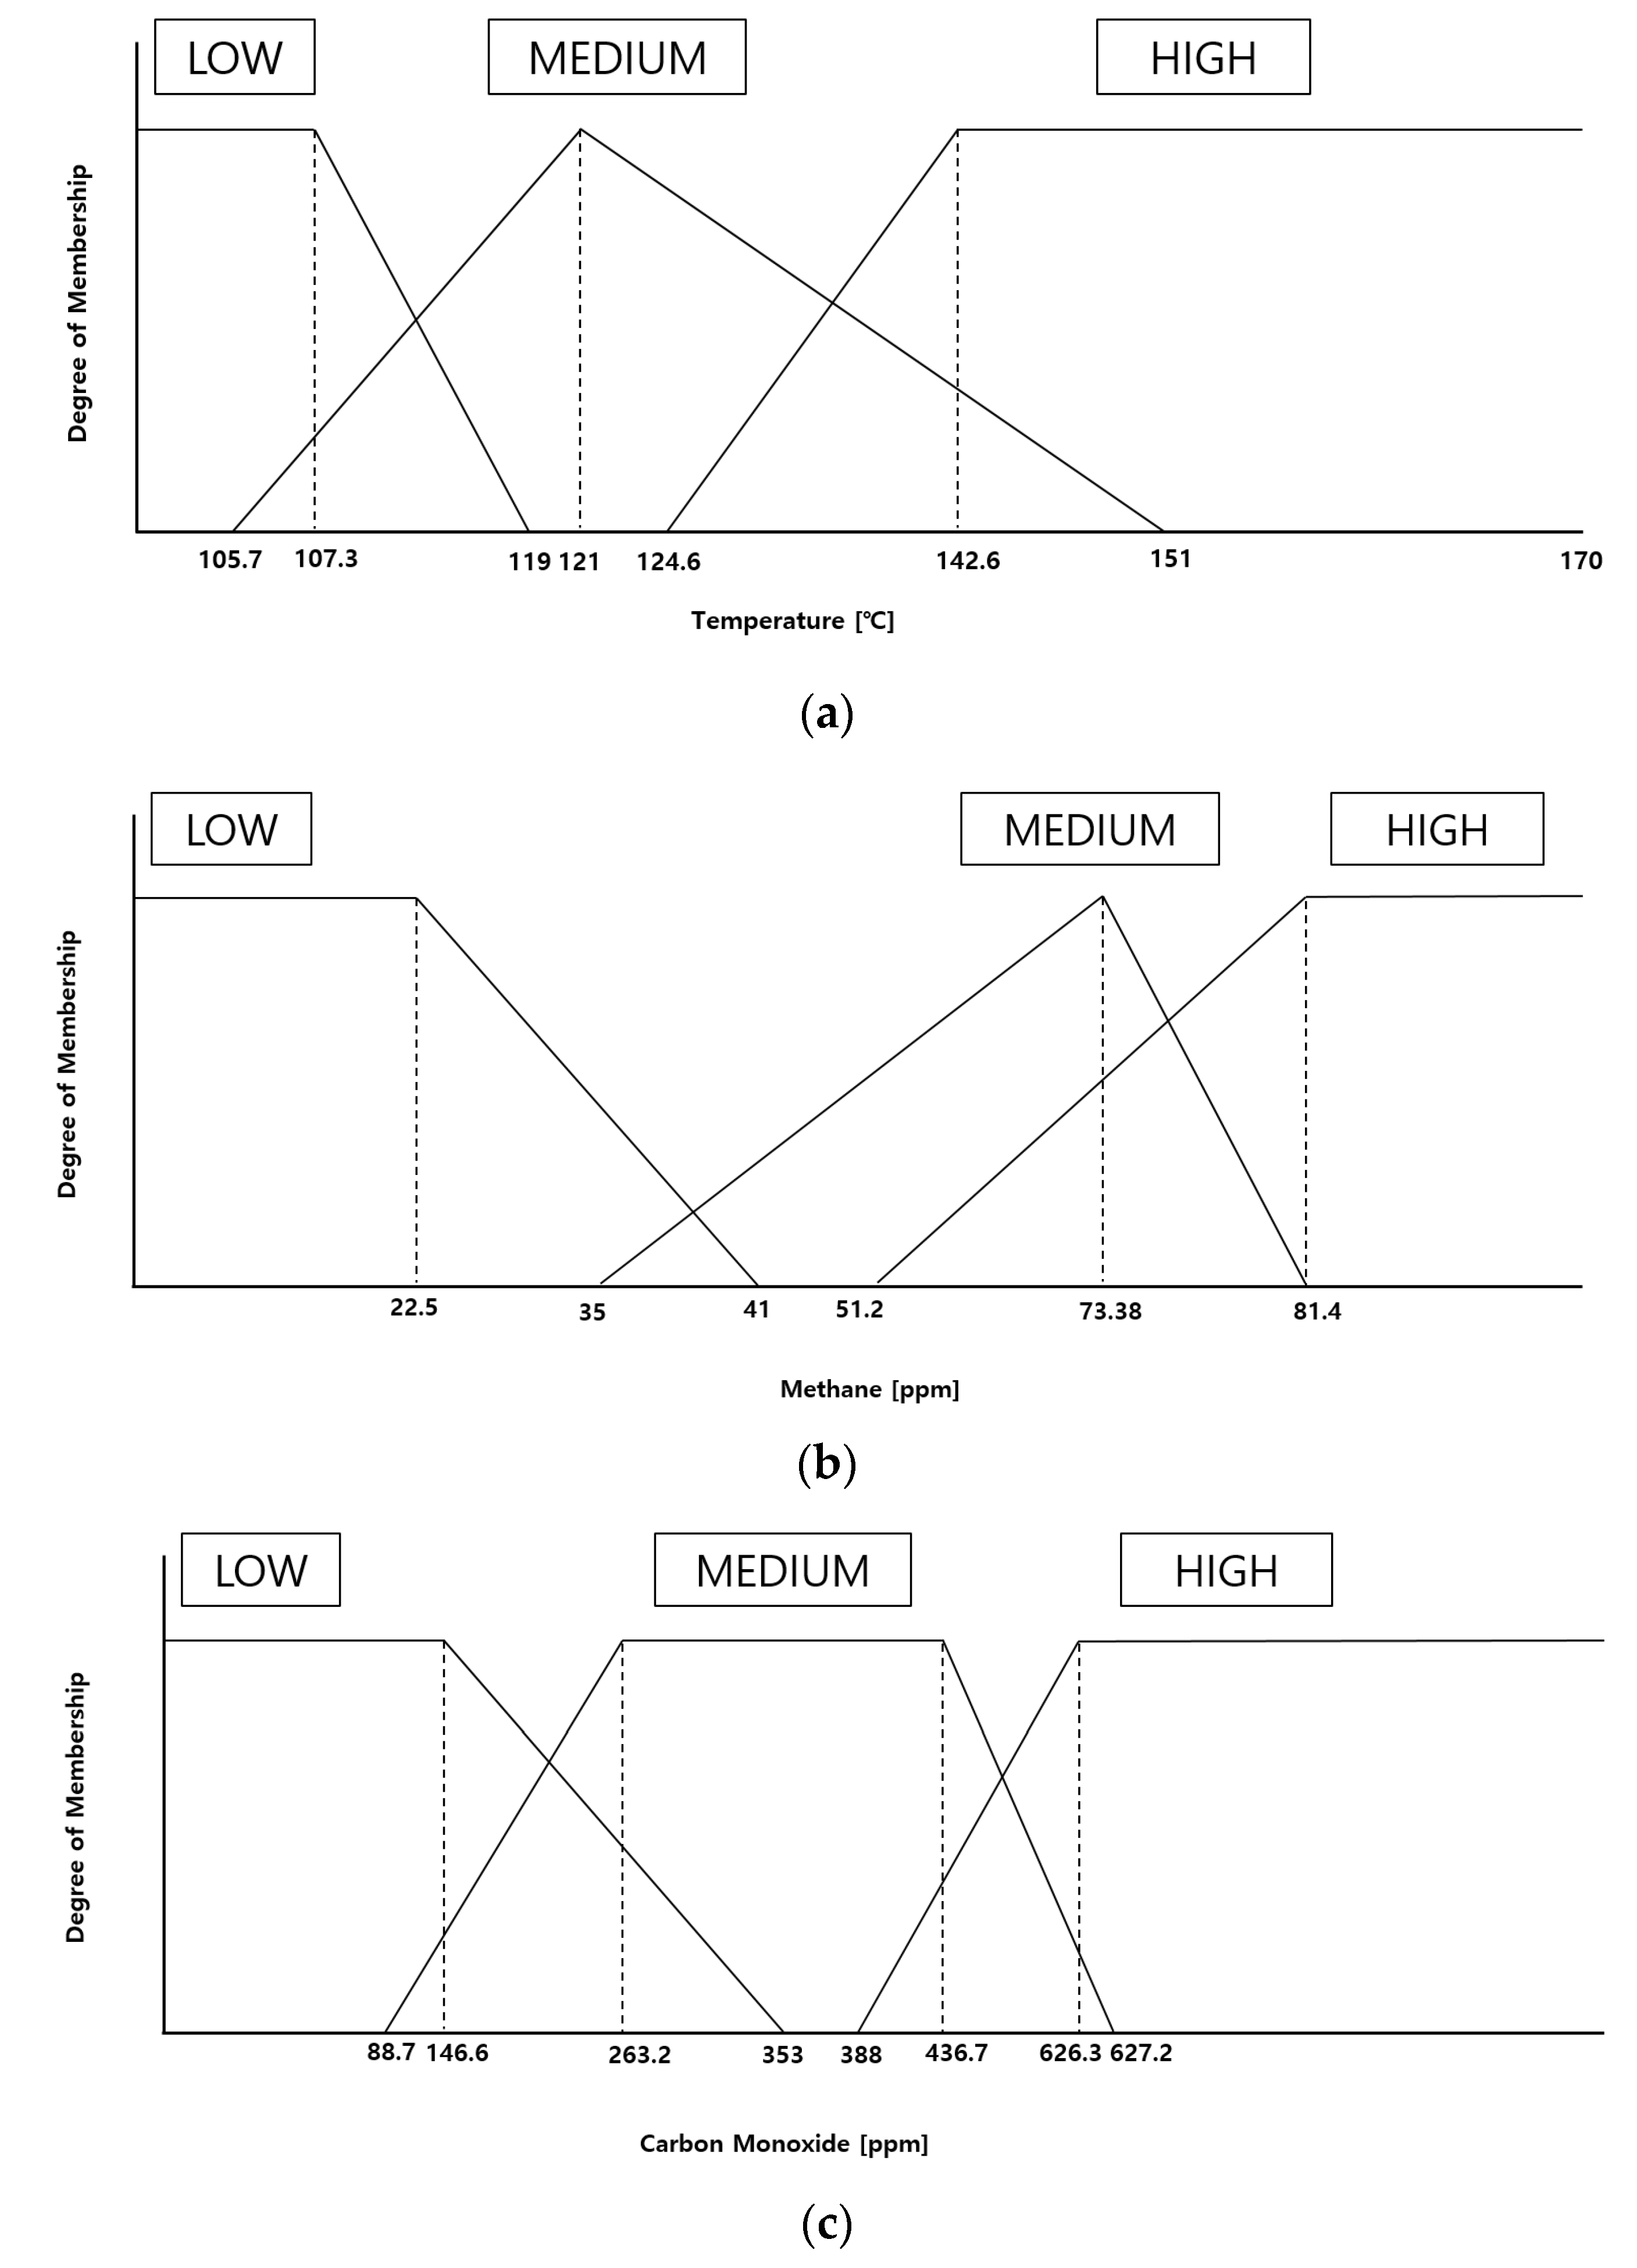
3.1. Proposal of Compositional Reasoning Design Utilizing Expert Inference Methods through Off-Gas Detection

Accordingly, in this study, the fuzzy logic used in expert inference methods was applied to calculate the risk as a probability based on the detection of off-gases generated in the thermal runaway mechanism of lithium-ion batteries.
Figure 4 shows the composition and stages of the fuzzy logic used to derive the thermal runaway risk of lithium-ion batteries. Fuzzy logic has four stages: fuzzification, which converts input and output values into membership functions; a rule base, which creates rules for correlations between membership functions; inference, which calculates the fusion of fuzzified values and the rule base; and defuzzification, which converts the fused values back into output values [29].
In the fuzzification stage, the low, medium, and high boundaries for each input value were set by setting the ranges of the input and output values. Fuzzification is the process of converting the data to be used into the degree of membership and expressing the degree to which data belong under conditions to be controlled as the degree of membership.
The rule base and inference define the relationship between the input and the output in the fuzzification stage in the form of IF, which is the antecedent, and THEN, which is the consequent [30]. Finally, the defuzzification stage converts the result values obtained through fuzzy inference back into a crisp set. Finally, in the defuzzification stage, the results obtained through fuzzy inference are converted back into crisp sets. Various methods are used for defuzzification, each with its advantages and limitations. The maximum membership method is intuitive and computationally efficient, but it may fail to provide a representative output when membership functions have multiple peaks. The mean of maximum method, particularly useful when membership functions are symmetric, may not work well when membership functions are flat or have multiple peaks. Another method is the centroid technique, which calculates the center of the membership function and provides a weighted average for the result. Among these methods, the centroid technique is widely used due to its ability to simplify complex calculations into a straightforward process. The commonly used simplified center of gravity method uses the following equation:
y = i = 1 n y i µ Y ( y i ) i = 1 n µ Y ( y i )
Here, y i is the singleton of the i th fuzzy term, and µ Y ( y i ) is the function value of membership in y i [31,32,33,34].
In this study, the center value of the area expressing the membership function was calculated, and the center of gravity method was introduced to defuzzify the value to reflect the characteristics of the fuzzy set more accurately. When the fuzzy logic design modeling process is completed, better decision-making and control become possible for the consideration and judgment of uncertain or ambiguous information.
To satisfy the minimum conditions for applying fuzzy logic, an appropriate inference engine and sufficient data or experience are necessary, and the variables must be fuzzified. In order to satisfy the minimum conditions for applying fuzzy logic, appropriate inference engines, sufficient data, or expert experience, and the fuzzification of variables are required. In this study, to enhance the reliability of such experience and knowledge, the design could be based on measured data. Fuzzy logic design and risk calculation were performed based on Figure 3 regarding the thermal runaway fire patterns of lithium-ion batteries. Accordingly, Equations (1)–(10) presented herein are derived by setting the required ranges for design based on the correlation between temperature and off-gas observed in Figure 3 [26].
A lithium-ion battery was heated on a heating pad, and various off-gases such as hydrogen, methane, and carbon monoxide were detected during the venting stage. Methane and carbon monoxide, which had large fluctuations, were set as fuzzy logic inputs 2 and 3, respectively. In addition, the temperature value most closely related to the occurrence of thermal runaway was selected as input 1 for each fuzzification case.
Figure 5 shows graphs in which the crisp sets of temperature, methane, and carbon monoxide were fuzzified into fuzzy sets after dividing the crisp sets into low, medium, and high sections based on the investigated SOCs, that is, thermal runaway fire patterns according to charge amounts. Figure 5a shows the fuzzification performed after dividing the temperature range into a section of temperatures below 119 °C as a low section, a section of temperatures between 105.7 °C and 151 °C as a medium section, and finally, a section of temperatures above 124.6 °C as a high section. The low, medium, and high sections are expressed as follows:
L o w             x   107.3       y = 1           107.3     x   119         y = 10 117 x + 1190 117    119   x                y = 0        
M e d i u m        105.7     x   107.3        y = 10 153 x 1057 153       121     x     151         y = 1 30 x + 151 30    151   x                   y = 0       
H i g h      x     124.6         y = 0       124.6     x     142.6         y = 1 18 x + 623 90    142.6     x                   y = 1        
The thermal runaway graphs by the SOC were analyzed, and according to the results, the lowest temperature was about 25 °C and the highest temperature was about 260 °C. It was confirmed that thermal runaway was accelerated at about 170 °C when the SOCs were 25%, 50%, 75%, and 100%. Since it was judged that the risk of thermal runaway should already be considered from the point at which the temperature of the lithium-ion battery rises above 170 °C, the minimum value of the temperature, which is the first fuzzification factor, was set to 100 °C and the maximum value was set to 170 °C.
Figure 5b shows a graph in which the crisp set was fuzzified into a fuzzy set after dividing methane within the range of 0 to 100 ppm into low, medium, and high sections. Fuzzification was performed after dividing the range of methane concentrations to design a section of concentrations below 22.5 ppm as a low section, a section of concentrations between 22.5 ppm and 81.4 ppm as a medium section, and finally, a section of concentrations above 51.2 ppm as a high section. The low, medium, and high sections are expressed, as follows:
L o w             x     22.5       y = 1           22.5     x     41        y = 2 37 x + 82 37 41     x               y = 0    
M e d i u m       35     x     73.38         y = 50 1919 x 1750 1919       73.38     x     81.4          y = 50 401 x 4070 401         81.4     x                 y = 0                
H i g h           x     51.2        y = 0       51.2     x     81.4        y = 5 151 x 256 151     81.4   x                y = 1       
Figure 5c shows a graph in which the creep set was fuzzified into a fuzzy set after dividing the range of carbon monoxide concentrations from 0 ppm to 1100 ppm into low, medium, and high sections. Fuzzification was performed after dividing the range of carbon monoxide to design a section of concentrations below 353 ppm as a low section, a section of concentrations between 88.7 ppm and 627 ppm as a medium section, and finally, a section of concentrations above 388 ppm as a high section. The low, medium, and high sections are expressed as follows.
L o w             x     146.6       y = 1           146.6     x     353        y = 5 1032 x + 1765 1032 353   x              y = 0       
M e d i u m          88.7     x     263.2        y = 2 349 x 887 1745 263     x     436.7        y = 1             436.7     x     627.2        y = 2 381 x 418 127
H i g h            x     388           y = 0          388     x     627.2         y = 1 1196 x 485 299    627   x                   y = 1        
In the output fuzzification stage, the probability of occurrence of thermal runaway ranging from 0 to 100% was fuzzified, as shown in Figure 6. The possibility of TR occurrence was proposed as a thermal runaway risk, and the ranges were set to low, medium, and high thermal risk. Fuzzification was designed after dividing the range into a section of risk ranging from 0 to 34.8% as a thermal risk—low section, a section of risk ranging from 14.04 to 65.84% as a thermal risk—medium section, and a section of risk ranging from 52.9 to 100% as a thermal risk—high section.
It was confirmed that all measured temperatures, types of off-gases, and amounts of off-gases detected by the SOC % of the lithium-ion battery showed different patterns. Therefore, in this study, to present a unified thermal runaway probability regardless of the SOC %, a rule base applicable to all SOCs of 50%, 75%, and 100% was designed and applied to fuzzification.
As shown in Figure 7, in the SOCALL rule base, the individual rule bases in SOC 50%, SOC 75%, and SOC 100% were matched in a 1:1 ratio, and all SOC% patterns were analyzed to design TR-L, TR-M, and TR-H.

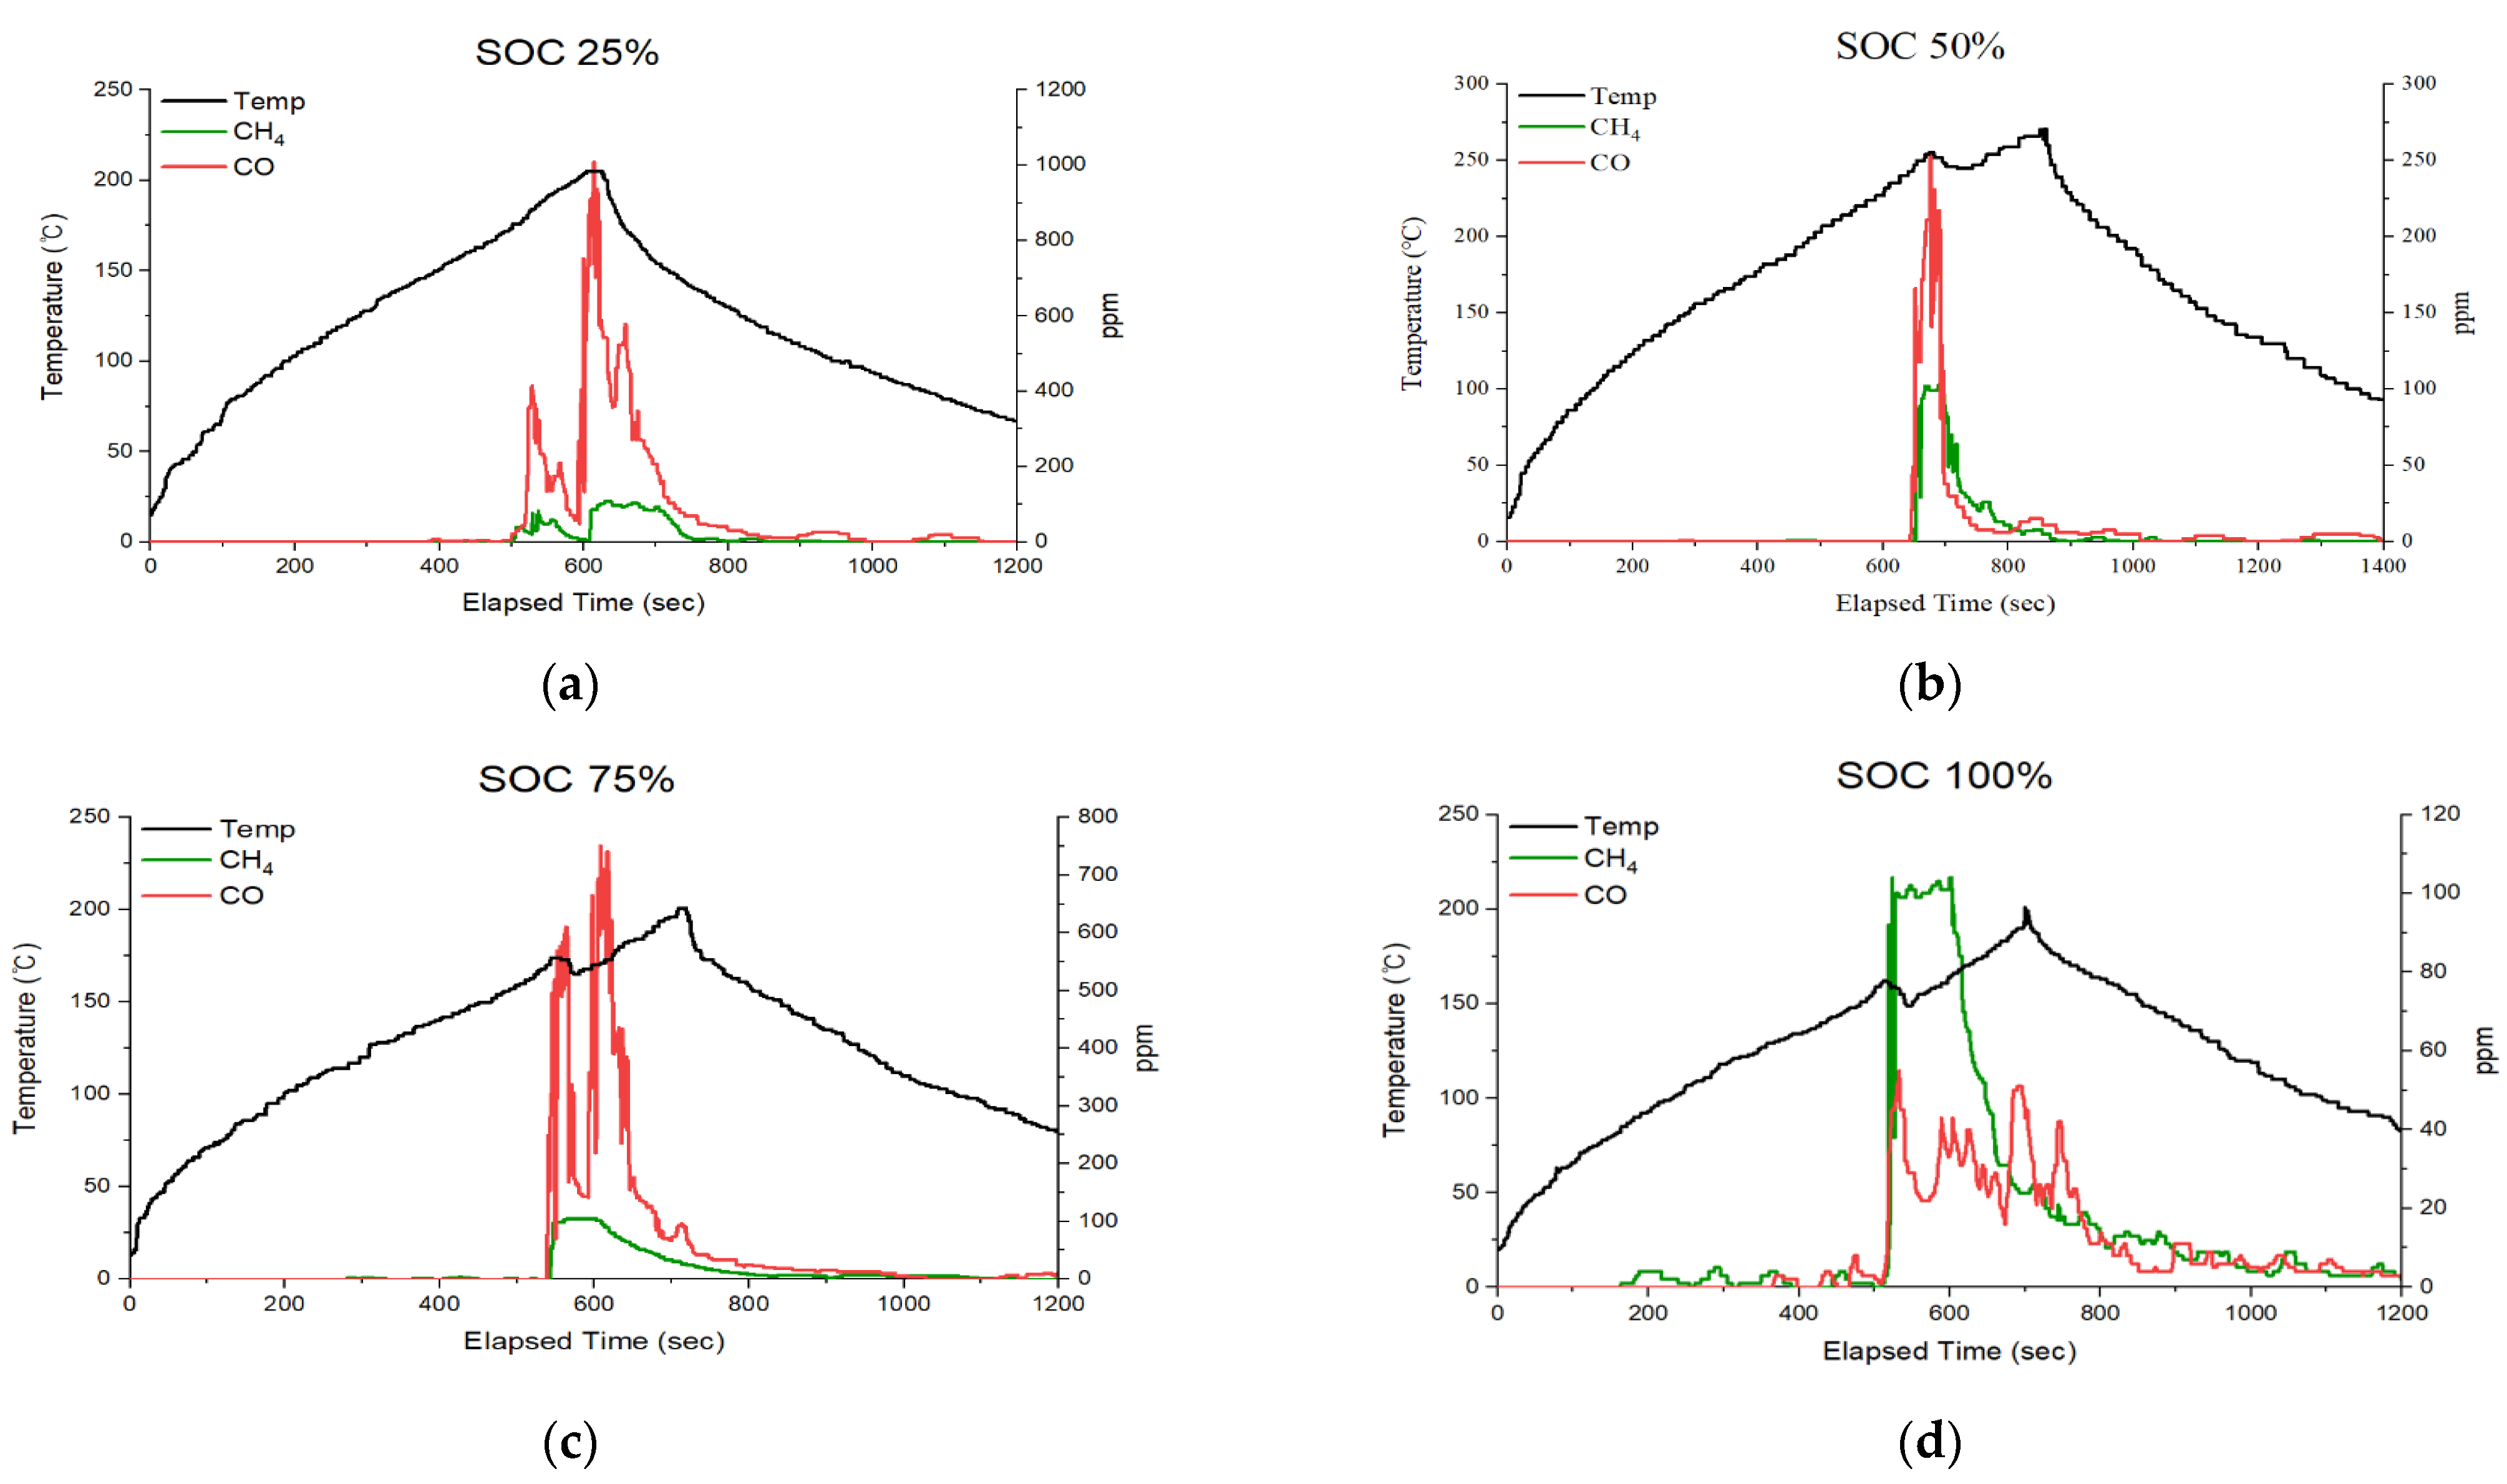
3.2. Trend Analysis According to the Proposed Thermal Runaway Risk Calculation Method

To determine the probability of the risk of specific values, in addition to actual lithium-ion battery fires, fuzzification calculations in the form of 3D graphs were performed after fixing the specific values of temperature, methane, and carbon monoxide using MATLAB R2023b.
Figure 8a–c show the predicted distributions of thermal runaway probabilities according to the amounts of methane and carbon monoxide generated at the temperatures of 100 °C, 130 °C, and 170 °C, respectively, using the probabilities defuzzified using MATLAB in three-dimensional graphs. The x-axis was set to methane, the y-axis to carbon monoxide, and the z-axis to the thermal runaway probability. It can be seen that as the temperature rises in the order of 100 °C, 130 °C, and 170 °C, the distribution of higher probabilities increases.
Figure 9a–c show the thermal runaway probability prediction distribution table in three-dimensional graphs at points where 25 ppm, 75 ppm, and 100 ppm of methane were detected, respectively. The x-axis was set to the temperature, the y-axis to carbon monoxide, and the z-axis to the probability of thermal runaway. As it was confirmed that the probabilities were distributed from a minimum of about 3% to a maximum of about 40% at a methane concentration of 25 ppm, from a minimum of about 50% to a maximum of about 95% at a methane concentration of 75 ppm, and from a minimum of about 93% to a maximum of 100% at a methane concentration of 100 ppm, it can be seen that the probability distribution shows higher probabilities depending on the amount of methane detected.
Figure 10a–c show the thermal runaway probability prediction distribution table in three-dimensional graphs at points where 400 ppm, 800 ppm, and 1050 ppm of carbon monoxide were detected, respectively. The x-axis was set to temperature, the y-axis to methane, and the z-axis to thermal runaway probability. When carbon monoxide 400 ppm and carbon monoxide 800 ppm are compared, it can be seen that lower temperatures and lower amounts of methane have higher probability distributions when the concentration of carbon monoxide is high, and that the differences are insignificant between carbon monoxide 800 ppm and carbon monoxide 1050 ppm.

3.3. Verification of the Effectiveness of the Proposed Thermal Runaway Risk Calculation Method

To verify the effectiveness of the proposed thermal runaway risk calculation method, the battery fire risk calculation result values based on the rule base designed so that all of SOC 25%, 50%, 75%, and 100% can be applied based on the fuzzy logic designed for risk calculation were substituted into Figure 3, which is the result of actual thermal runaway fire experiments of an actual lithium-ion battery to analyze the effectiveness. Possibility refers to graphs showing the probabilities of thermal runaway risk calculated using a fuzzy logic design.
The probabilities depicted in Figure 11a–d represent results calculated based on fuzzy logic using actual experimental data from lithium-ion battery fire tests. As thermal runaway did not occur at SOC 25%, unlike at SOC 50%, 75%, and 100%, we concluded that assigning a risk probability of 100% as equivalent to a thermal runaway probability of 100% is not justified. Therefore, we designed the scenario assuming a risk probability of 100% for situations where there is concern that venting may lead to thermal runaway. It can be confirmed in Figure 11a–d that the risk probability reaches 100% at the onset of the venting stage.
Figure 11a shows a graph comparing the temperature, carbon monoxide, methane, and battery fire risk probabilities in the thermal runaway fire pattern graph at 25%. From 0 s to about 392 s, the risk probability gradually increased from 39.92% and then was maintained at about 41% for about 136 s from about 393 s to 528 s. Thereafter, it increases vertically until the venting stage, which is the design point for a TR-H value of 100%. It can be seen that the risk level is affected by the temperature until the venting stage, and thereafter increases or decreases in proportion to the amount of off-gases detected.
Figure 11b shows a graph comparing the temperature, carbon monoxide, methane, and battery fire risk probabilities in the thermal runaway fire pattern graph at an SOC of 50%. From 0 to approximately 282 s, the risk probability gradually increased from 39.28%, and thereafter was maintained at approximately 41% for approximately 370 s from approximately 283 s to 652 s. Thereafter, it increases vertically to 99.99% until the venting stage, which is the design point for a TR-H value of 100%. Compared to SOC 25%, as the temperature in the thermal runaway fire experiment graph slowly rises, the section where the risk probability of 41% is maintained increases further. The time at which the off-gas was detected in the actual thermal runaway fire experiment graph was 642 s, and the time at which a 41% risk probability, which was within the PR value range, was first detected was approximately 283 s. Therefore, it is possible to present a risk probability approximately of 359 s before the first off-gas is detected.
Figure 11c shows a graph comparing the temperature, carbon monoxide, methane, and battery fire risk probabilities in the thermal runaway fire pattern graph at an SOC of 75%. From 0 s to about 450 s, the risk probability gradually increased from 39.28%, and thereafter was maintained at about 41% for about 93 s from about 451 s to 543 s. Thereafter, it increased vertically to 94.88% until the venting stage, which was the design point of a TR value of 100%. When compared to the risk probability graph at 50%, it was confirmed that the section where the risk probability of 41[%] was maintained was relatively shorter at approximately 277 s. The time at which the off-gas was detected in the actual thermal runaway fire experiment graph was 540s, and the time at which a 41% risk probability, which was within the range of the TR-M values, was approximately 451 s. Therefore, it was possible to present a risk probability of approximately 89 s before the first off-gas was detected.
Figure 11d shows a graph comparing the temperature, carbon monoxide, methane, and battery fire risk probabilities in the thermal runaway fire pattern graph at an SOC of 100%. From 0 s to about 481 s, the risk probability gradually increased from 39.28%, and thereafter was maintained at about 41% for about 36 s from about 482 s to 518 s. Thereafter, it increased vertically to 99.99% until the venting stage, which was the design point of a TR value of 100%. The section where the risk probability of 41% is maintained is shortened from 370 s at SOC 50% to 93 s at SOC 75%, and 36 s at SOC 100%, excluding SOC 25%, where thermal runaway fire did not occur.
The time at which off-gas was detected in the actual thermal runaway fire experiment graph was 518 s, and the time at which the 41% risk probability was within the range of TR-M values was approximately 482 s. Therefore, it was possible to present a risk probability of approximately 36 s before the first off-gas was detected.

4. Discussion

This paper makes a significant contribution to the field of battery safety and risk management. The research utilizes fuzzy logic, an expert inference method, to predict the risk of thermal runaway, with a focus on lithium-ion batteries widely used in consumer and industrial applications.
A key strength of this research lies in proposing a new approach to predict the likelihood of thermal runaway, overcoming the technical limitations of existing management systems such as smoke detection or battery management systems (BMS). While conventional methods often rely on temperature and smoke detection sensors, the proposed approach integrates off-gas detection into the model, addressing issues of response time delay and low prediction accuracy. The application of fuzzy logic enables ambiguous interpretation of off-gas data, facilitating early detection and timely intervention, thereby reducing the risk of total loss and preventing thermal runaway leading to large-scale fires.
Furthermore, by validating the fuzzy logic model with actual battery experimental data at different states of charge (SOC), this research enhances the reliability of the model and demonstrates its applicability in actual situations.
Future research directions include conducting long-term or comparative studies to determine the most effective technologies for predicting thermal runaway in lithium-ion batteries or discerning appropriate timing for fire suppression actions. These efforts aim to advance scholarly understanding and provide immediately actionable practical tools.

5. Conclusions

In this paper, we analyze the four stages preceding thermal runaway in lithium-ion battery fires and investigate them using expert inference techniques based on the correlation between off-gas and temperature detected during the venting stage, while identifying the types of off-gas detected during the exhaust stage. Expert inference techniques can utilize various input data, but in this paper, the design is solely based on methane, carbon monoxide, and temperature. Therefore, it is deemed meaningful in this paper to compare the existing data and its characteristics rather than comparing different methods of calculating the venting stage. We propose the application of expert inference-based design to enable clear and efficient judgment when off-gas are detected during the venting stage before thermal runaway occurs in lithium-ion battery fires. Through the mechanism of thermal runaway fires in lithium-ion batteries, four stages before thermal runaway occurred were analyzed, the types of off-gases detected in the venting stage were identified, and correlations were analyzed. Thereafter, a fuzzy design method was proposed for application in expert inference methods. Thereafter, a rule base was designed based on the correlation between the off-gases generated in the venting stage of a battery thermal runaway fire and the temperature. To conduct a study predicting the risk of battery fires, a manual calculation of the battery fire risk was performed using fuzzy logic, and the risk was analyzed through comparison with the temperature and off-gas increase/decrease patterns during an actual battery fire.
It was confirmed that the graph of the thermal runaway fire pattern of lithium-ion batteries was similar to the battery risk graph derived from our own design. Based on the foregoing, it was determined that the application of expert inference methods is effective in the analysis of battery fire risks.
Through the application of expert inference methods, it is possible to detect a probability not lower than 41% even when one of the three factors (temperature, methane, and carbon monoxide) is 0; that is, at the point where three detection sensors are judged to have broken down, it was confirmed that risk analysis was possible. That is, the detection or extinguishing action is judged to be the most efficient from the point where the risk probability increases in the thermal risk-M section, where there is a risk probability of 41[%].
The feasibility of applying fuzzification in the event of thermal runaway fires in current lithium-ion batteries was confirmed. Hereafter, various experimental studies should be conducted based on this study, such as those that would propose additional fuzzification standards for the early detection of thermal runaway fires.

Author Contributions

Conceptualization, J.W.S. and D.C.; methodology, H.L. and D.C.; software, J.W.S.; validation, D.C. and S.-Y.S.; formal analysis, H.L. and S.-Y.S.; writing—original draft preparation, J.W.S.; writing—review and editing, J.W.S. and D.C.; supervision, D.C. and S.-Y.S. All authors have read and agreed to the published version of the manuscript.

Funding

This work was supported by the Human Resources Development of the Korea Institute of Energy Technology Evaluation and Planning (KETEP) grant funded by the Korean government Ministry of Trade, Industry and Energy (No.20214000000060) and by the MSIT (Ministry of Science and ICT), Korea, under the ITRC (Information Technology Research Center) support program (RS-2023-00259004) supervised by the IITP (Institute for Information & Communications Technology Planning & Evaluation).

Data Availability Statement

The original contributions presented in the study are included in the article, further inquiries can be directed to the corresponding author.

Conflicts of Interest

The authors declare no conflicts of interest.

References

  1. Seoul National University. A Development on the Electrode Materials for Li Ion Secondary Batteries; Seoul National University: Seoul, Republic of Korea, 1999. [Google Scholar]
  2. Ioakimidis, C.S.; Murillo-Marrodán, A.; Bagheri, A.; Thomas, D.; Genikomsakis, K.N. Life Cycle Assessment of a Lithium Iron Phosphate (LFP) Electric Vehicle Battery in Second Life Application Scenarios. Sustainability 2019, 11, 2527. [Google Scholar] [CrossRef]
  3. Gang, M.B.; Kim, W.Y.; Kim, N.J. Numerical Comparative Study on the Thermal Runaway of NCM/LFP Batteries of the Same Geometry. J. Korean Soc. Geotherm. Hydrothermal. 2022, 18, 1–11. [Google Scholar]
  4. Song, Y.W. Manufacturing of All-Solid-State Lithium Secondary Batteries with Gel Polymer Electrolytes and Evaluation of Electrochemical Properties. Master’s Thesis, Chonnam National University, Gwangju, Republic of Korea, 2021. [Google Scholar]
  5. Lowe, M.; Tokuoka, S.; Trigg, T.; Gereffi, G. Lithium-ion Batteries for Electric Vehicles: The U.S. Value Chain; Duke University Center on Globalization, Governance & Competitiveness: Durham, NC, USA, 2010. [Google Scholar] [CrossRef]
  6. Batteries, L.I.R. Lithium Ion Rechargeable Batteries Technical Handbook; Panasonic: Tokyo, Japan, 2013; pp. 27–29. [Google Scholar]
  7. Kim, D.H. A Study on the Explosive Hazard of Lithium-ion Batteries and the Separation Distance for Storage and Handling of Spent Lithium Secondary Batteries. Master’s Thesis, Inha University Graduate School, Incheon, Republic of Korea, 2021. [Google Scholar]
  8. Kang, K.S. Analysis of Factors Increasing Thermal Runaway Hazard in Lithium-ion Battery Hi-nickel NCM Cathode Materials. Unpublished. Doctoral Dissertation, Seoul Metropolitan University Graduate School, Seoul, Republic of Korea, 2024. [Google Scholar]
  9. Lee, M.A. A Study on the Establishment of Response Systems for Thermal Runaway Fires in Electric Vehicle Charging Infrastructure: Focused on Comparison with Chinese Standards. Master’s Thesis, Gachon University Graduate School of Industrial Environment, Seongnam, Republic of Korea, 2023. [Google Scholar]
  10. Oh, E.Y.; Min, D.S.; Han, J.Y.; Jung, S.H.; Kang, T.S. Consequence Analysis of Toxic Gases Generated by Fire of Lithium Ion Batteries in Electric Vehicles. J. Korean Inst. Gas 2019, 23, 54–61. [Google Scholar] [CrossRef]
  11. Lee, S.; Park, J. Early Detection of Lithium-Ion Battery Thermal Runaway for Enhanced Safety in Electric Vehicle Applications. Energies 2022, 15, 1234–1256. [Google Scholar]
  12. Ahn, S.; Kim, H. Real-time Gas and Temperature Monitoring System for Lithium-ion Battery Safety. Energies 2021, 14, 2468. [Google Scholar]
  13. Hasoun, M.; Afia, A.E.; Chikh, K.; Khafallah, M.; Benkirane, K. Early Detection of Thermal Runaway in Lithium-ion Batteries by Coupling Differential Scanning Calorimetry with Acoustic Emission. In Proceedings of the 2019 International Conference of Computer Science and Renewable Energies (ICCSRE), Agadir, Morocco, 22–24 July 2019; pp. 1–6. [Google Scholar]
  14. Hong, S.H.; Choi, K.O.; Park, M.O.; Park, J.M.; Lee, S.H. An Experimental Study on the Fire Hazards of Cylindrical Lithium-ion Battery. Korean J. Hazard. Mater. 2019, 7, 64–69. [Google Scholar] [CrossRef]
  15. Lim, B.J.; Cho, S.H.; Lee, G.R.; Choi, S.M.; Park, C.D. Characteristics Analysis of Measurement Variables for Detecting Anomaly Signs of Thermal Runaway in Lithium-Ion Batteries. Trans. Korean Hydrog. New Energy Soc. 2022, 33, 85–94. [Google Scholar] [CrossRef]
  16. KFPA. Final Report on Fire Safety Measures for Energy Storage Devices. Fire Research Institute Policy Research Data. 2019. Available online: https://www.nfa.go.kr/nfa/publicrelations/policyarchive/policyresearch/?boardId=bbs_0000000000000613&mode=view&cntId=17&category=&pageIdx=&searchCondition=&searchKeyword= (accessed on 29 February 2024).
  17. Hwang, S.Y.; Choi, S.M.; Jian, S.; Choi, H.S.; Rh, D.S. A Study on the Detection Algorithm of Off-gas to Prevent Thermal runaway of Li-ion Battery for ESS. Trans. Korean Inst. Electr. Eng. 2022, 71, 1787–1795. [Google Scholar] [CrossRef]
  18. Lai, X.; Yao, J.; Jin, C.; Feng, X.; Wang, H.; Xu, C.; Zheng, Y. A Review of Lithium-Ion Battery Failure Hazards: Test Standards, Accident Analysis, and Safety Suggestions. Batteries 2022, 8, 248. [Google Scholar] [CrossRef]
  19. Choi, H.S.; Kim, J.M.; Lee, M.G.; Lim, M.G.; Rho, D.S. A Study on the Assessment Algorithm for Fire Stages in Li-ion based ESS. Korea Acad.-Ind. Coop. Soc. 2023, 339–342. Available online: https://www.kais99.org/jkais/springNfall/spring2023/oral/2023_spring_104.pdf (accessed on 29 February 2024).
  20. Chen, M.; Liu, J.; Ouyang, D.; Weng, J.; Wu, X.; Cao, S.; Wang, J. A large-scale experimental study on the thermal failure propagation behaviors of primary lithium batteries. J. Energy Storage 2020, 31, 101657. [Google Scholar] [CrossRef]
  21. Huang, Z.; Liu, J.; Zhai, H.; Wang, Q. Experimental investigation on the characteristics of thermal runaway and its propagation of large-format lithium ion batteries under overcharging and overheating conditions. Energy 2021, 233, 121103. [Google Scholar] [CrossRef]
  22. Huang, Z.; Zhao, C.; Li, H.; Peng, W.; Zhang, Z.; Wang, Q. Experimental study on thermal runaway and its propagation in the large format lithium-ion battery module with two electrical connection modes. Energy 2020, 205, 117906. [Google Scholar] [CrossRef]
  23. Jia, Y.; Uddin, M.; Li, Y.; Xu, J. Thermal runaway propagation behavior within 18,650 lithium-ion battery packs: A modeling study. J. Energy Storage 2020, 31, 101668. [Google Scholar] [CrossRef]
  24. Kong, D.; Wang, G.; Ping, P.; Wen, J. A coupled conjugate heat transfer and CFD model for the thermal runaway evolution and jet fire of 18650 lithium-ion battery under thermal abuse. eTransportation 2022, 12, 100157. [Google Scholar] [CrossRef]
  25. Xu, C.; Zhang, F.; Feng, X.; Jiang, F.; Ren, D.; Lu, L.; Yang, Y.; Liu, G.; Han, X.; Friess, B.; et al. Experimental study on thermal runaway propagation of lithium-ion battery modules with different parallel-series hybrid connections. J. Clean. Prod. 2021, 284, 124749. [Google Scholar] [CrossRef]
  26. Yang, M.; Rong, M.; Pan, J.; Ye, Y.; Yang, A.; Chu, J.; Yuan, H.; Wang, X. Thermal runaway behavior analysis during overheating for commercial LiFePO4 batteries under various state of charges. Appl. Therm. Eng. 2023, 230 Pt B, 120816. [Google Scholar] [CrossRef]
  27. Mamdani, E.H.; Assilian, S. An experiment in linguistic synthesis with a fuzzy logic controller. Int. J. Man-Mach. Stud. 1975, 7, 1–13. [Google Scholar] [CrossRef]
  28. Tobi, T.; Hanafusa, T. A practical application of fuzzy control for an air-conditioning system. Int. J. Approx. Reason. 1991, 5, 331–348. [Google Scholar] [CrossRef]
  29. Omrane, H.; Masmoudi, M.S.; Masmoudi, M. Fuzzy Logic Based Control for Autonomous Mobile Robot Navigation. Comput. Intell. Neurosci. 2016, 2016, 9548482. [Google Scholar] [CrossRef]
  30. Rubio, F.R.; Berenguel, M.; Camacho, E.F. Fuzzy logic control of a solar power plant. IEEE Trans. Fuzzy Syst. 1995, 3, 459–468. [Google Scholar] [CrossRef]
  31. Mert, A. Defuzzification of Non-Linear Pentagonal Intuitionistic Fuzzy Numbers and Application in the Minimum Spanning Tree Problem. Symmetry 2023, 15, 1853. [Google Scholar] [CrossRef]
  32. Chakraborty, A.; Mondal, S.P.; Alam, S.; Ahmadian, A.; Senu, N.; De, D.; Salahshour, S. The Pentagonal Fuzzy Number: Its Different Representations, Properties, Ranking, Defuzzification and Application in Game Problems. Symmetry 2019, 11, 248. [Google Scholar] [CrossRef]
  33. Hofmann, P. Defuzzification Strategies for Fuzzy Classifications of Remote Sensing Data. Remote Sens. 2016, 8, 467. [Google Scholar] [CrossRef]
  34. Kwak, S.; Choi, B.-J. Defuzzification Scheme and Its Numerical Example for Fuzzy Logic based Control System. J. Korean Inst. Intell. Syst. 2018, 28, 350–354. [Google Scholar] [CrossRef]
Figure 1. Lithium-ion battery structure diagram.
Energies 17 02566 g001
Figure 2. Schematic diagram of the mechanism of and measures against lithium-ion battery thermal runaway fire.
Energies 17 02566 g002
Figure 3. The 18650 cylindrical lithium-ion battery thermal runaway fire experiment [26]: (a) When the SOC is 25%; (b) when the SOC is 50%; (c) when the SOC is 75%; (d) when the SOC is 100%.
Energies 17 02566 g003
Figure 4. Fuzzy logic composition and inference engine stages.
Energies 17 02566 g004
Figure 5. Fuzzified graph transformation in the crisp sets of input factors: (a) Fuzzified graph of temperature; (b) fuzzified graph of methane; (c) fuzzified graph of carbon monoxide.
Energies 17 02566 g005
Figure 6. Sections of the degree of membership functions of outputs.
Energies 17 02566 g006
Figure 7. Rule base table according to low, medium, and high temperature, methane, and carbon monoxide.
Energies 17 02566 g007
Figure 8. 3D distribution maps of the results of fuzzy design of temperatures: (a) 3D probability distribution at temperature 100 °C; (b) 3D probability distribution at temperature 130 °C; (c) 3D probability distribution at temperature 170 °C.
Energies 17 02566 g008
Figure 9. 3D distribution maps of the results of fuzzy design of methane: (a) 3D probability distribution at methane 25 ppm; (b) 3D probability distribution at methane 75 ppm; (c) 3D probability distribution at methane 100 ppm.
Energies 17 02566 g009
Figure 10. 3D distribution maps of the results of fuzzy design of carbon monoxide: (a) 3D probability distribution at carbon monoxide 400 ppm; (b) 3D probability distribution at carbon monoxide 800 ppm; (c) 3D probability distribution at carbon monoxide 1050 ppm.
Energies 17 02566 g010
Figure 11. Results of calculation of fire risk probabilities by SOC: (a) Probability at SOC 25%; (b) Probability at SOC 50%; (c) probability at SOC 75%; (d) probability at SOC 100%.
Energies 17 02566 g011
Disclaimer/Publisher’s Note: The statements, opinions and data contained in all publications are solely those of the individual author(s) and contributor(s) and not of MDPI and/or the editor(s). MDPI and/or the editor(s) disclaim responsibility for any injury to people or property resulting from any ideas, methods, instructions or products referred to in the content.

