Abstract
Anaerobic wastewater treatment is, in many cases, a justified alternative to typical activated sludge processes, from a technological, economic, and ecological point of view. The optimisation of fermentation reactors is primarily concerned with increasing the biodegradation of organic compounds and biogas production, as well as improving efficiency in the removal of nitrogen and phosphorus compounds. The aim of the research was to determine the impact of using low-cost recycled filling on the efficiency of treating real confectionery wastewater in a vertical anaerobic labyrinth flow bioreactor. The experiments focused on selecting the organic loading rate that would allow for the effective biodegradation and removal of pollutants, as well as the efficient production of biomethane. It was found that the tested reactor can operate efficiently at a maximum organic loading rate (OLR) of 7.0–8.0 g of chemical oxygen demand (COD)/L·d. In this OLR range, high efficiency was guaranteed for both wastewater treatment and biogas production. However, increasing the OLR value to 8.0 g COD/L·d had a significant negative effect on the methane (CH4) content in the biogas. The most efficient variants achieved a biodegradation efficiency of around 90% of the organic compounds, a CH4 content of over 70% in the biogas, and a biogas yield of over 400 L/kg of COD removed. A significant influence of the applied OLR on the ratio of free organic acids (FOS) to total alkaline capacity (TAC) and pH was observed, as well as a strong correlation of these indicators with the specific biogas yield and CH4 content. The application of a solution based on the use of a hybrid system of anaerobic granulated sludge and an anaerobic filter resulted in an efficient treatment process and an almost complete elimination of suspensions from the wastewater.
1. Introduction
The confectionery sector, which produces various sweets, such as chocolate, pudding desserts, and baked goods, is one of the most widespread and important industries in the world [1]. This industry produces large amounts of wastewater, with high concentrations of pollutants [2]. This wastewater is heavily contaminated with organic and biogenic compounds, which pose a considerable risk to the hydrosphere, in particular [3]. The diversity of production and the wide range of products lead to considerable fluctuations in the quantity and qualitative composition of confectionery wastewater. This fact leads to technological complications and difficulties in selecting the best purification method for this wastewater [4]. Physicochemical, biological, aerobic and anaerobic, or multistage processes are used [5]. Adsorption and coagulation or flocculation are considered ineffective methods for the treatment of confectionery wastewater. These techniques only partially reduce the organic load and simultaneously generate large amounts of sediment [6]. Electrocoagulation and membrane techniques can lead to a considerable reduction in the oxygen index, with short retention times. However, they are associated with high operating costs. In addition, leachates are produced that contain significant quantities of pollutants [7]. A frequently practised solution is therefore to discharge these pollutants into the municipal wastewater system, where they are diluted with domestic wastewater and then biodegraded in municipal wastewater treatment plants. In many cases, complicated and expensive systems based on the aerobic activated sludge process are used [7]. Due to the possibility of reducing the cost of the biodegradation of pollutants, methods based on methane fermentation are increasingly being used [8].
The popularity of these types of solutions is also increasing because their properties integrate with the assumptions of global energy and climate policy [9]. The main argument in this case is the fact that the pollutants become a substrate for the production of energy, which accumulates in biogas, as well as become a source of other economically useful value-added products, especially fertilisers [10]. Therefore, anaerobic wastewater treatment methods fulfil the recycling and recovery postulates of a circular economy, supporting the achievement of the targets set in various energy and climate packages and supporting ambitious plans to reduce greenhouse gas emissions into the atmosphere [11].
The competitiveness of anaerobic wastewater treatment solutions is also based on their technological advantages and economic benefits related to the reduction of investment and operating costs [12]. This is directly related to the fact that they can operate efficiently with very high loads of organic compounds (OLR) in the digesters, which are many times higher than the permissible values in classical aerobic activated sludge processes [13]. Literature reports and operating data from industrial-scale plants indicate that in many design and technology solutions for anaerobic bioreactors, the OLR values used in practise can reach a value of 20 kg COD/m3·d [14,15]. For comparison, in oxygen technology, effective removal of organic compounds can be achieved with OLR values of a maximum of 0.6 to 1.0 kg COD/m3·d at a dry mass concentration of 3.0 kg/m3 of the bacterial biomass [16]. In aerobic activated sludge systems focusing on the removal of nitrogen and phosphorus compounds, the values of this parameter are even lower and generally cannot exceed 0.45 kg COD/m3·d [17].
The possibility of achieving satisfactory biodegradation performance at high OLR values is directly related to the fact that the volumes of the anaerobic reactors are relatively small, and therefore, the plants require small areas [18]. This also eliminates the most energy-intensive element of traditional wastewater treatment methods, namely aeration, which is estimated to consume 50 to 60% of the energy for the entire technological line [19]. Other advantages of anaerobic reactors include a significantly lower amount of excess sludge, limited dispersion of aerosols and odours, and a relatively quick start-up of the plant, even after a long break in operation [20].
Unfortunately, due to the removal of pollutants during methane fermentation, it is generally not possible to discharge the treated wastewater directly into watercourses. This is because the transformations taking place under anaerobic conditions prevent the effective removal of nitrogen and phosphorus compounds, i.e., nutrients that are responsible for accelerating the processes of eutrophication and degradation of natural water reservoirs [21]. The binding of these pollutants in fermentation reactors only correlates with their accumulation in the biomass of the growing population of anaerobic microorganisms [22]. The efficiency of this process is very low, and only rarely reaches a level several dozen percentage points [23]. Another problem is the loss of anaerobic sludge, which leads to a decrease in the concentration of anaerobic microorganisms in the environment and determines the limitation of the final technological effects in terms of the efficiency of wastewater treatment and the efficiency of biogas production [24]. The observed outflow of anaerobic sludge bacteria from the digesters is related to the small size and low density of the anaerobic microbial cells, the extended amount of time they require for their formation and growth, and the fact that they do not form heavy and compact flocs, as is the case for classical aerobic activated sludge [25].
Therefore, from both a scientific and a practical point of view, and in terms of implementation, it is justified to look for solutions that allow for the simultaneous improvement of several operational aspects of the anaerobic chambers [26]. These include improving the efficiency of wastewater treatment, converting pollutants into gaseous products, limiting the discharge of anaerobic sludge from the bioreactors, and implementing solutions that improve the efficiency of the removal of nitrogen and phosphorus compounds. Currently, the most advanced and effective solutions for the design of anaerobic reactors are based on the use of granulated sludge [27], the operation of anaerobic oxygen systems [28], and the less frequent the use of zeolites for the removal of nitrogen compounds or the chemical precipitation of phosphorus in separate coagulation, flocculation, and sedimentation chambers [29].
An alternative to these solutions is the use of fillings that provide a surface for the growth of anaerobic microorganisms in the form of a biological membrane and anaerobic filters [30]. It has been proven that the significant active surface of the fillings limits the outflow of the dispersed and fragmented biomass of anaerobic bacteria from the technological system, favours their retention in the reactors, and improves the final effect of the biodegradation of pollutants [31]. The fillings used are usually made of plastic, are characterised by a very large active surface area of up to 1000 m2/m3, enable faster operation and faster adaptation of the reactors to technological conditions, shorten the time to achieve the desired efficiency, and eliminate the phenomenon of secondary contamination of sewage with chemical compounds used in the chemical precipitation of phosphorus with coagulants [32]. The important properties of the fillings include their sufficient mechanical strength, their non-reactivity with the compounds contained in the sewage, their biological neutrality, and the largest possible surface area that can be colonised by anaerobic microorganisms [33].
The operational problems reported by operators in regards to typical UASB reactors using granulated sludge became the basis for the search for new technological solutions. The stated shortcomings of UASB systems involve the high cost of obtaining the anaerobic sludge inoculum [34]; the long adaptation period of the microbial biomass [35]; the absolute need to remove fats and suspensions before the wastewater is introduced into the anaerobic chamber [36]; the lack of separation of the phases, requiring different technological conditions for the fermentation process [37]; a sometimes too-small gas exchange surface [38]; the destruction of the granulated sludge and its removal outside the reactor [39]; the clogging of the space between the anaerobic sludge granules [40]; and the inability to effectively remove phosphorus compounds, which are an element limiting the eutrophication of natural water reservoirs [41]. Hybrid reactors can be a competitive and often technologically justified alternative. An example of this is the VAL-FB, which has been tested in our own research. The design, as well as the functional solutions used in it, combine the positive characteristics of different types of anaerobic bioreactors to ensure a more effective biodegradation of organic compounds, increase the efficiency of biogas production, and increase the efficiency of biogenic compound removal [42]. In VAL-FB, a separation of the hydrolysis, acidogenesis, and methanogenesis phases, as well as a separation and biomass collection tank, were used. This is a reasonable solution, as each of the mentioned metabolic pathways is carried out by different groups of anaerobic microorganisms that require different and specific environmental and technological conditions for efficient and effective functioning [43]. VAL-FB is a hybrid of a UASB reactor and an anaerobic filter. The reactor design extended the retention time of the anaerobic biomass, provided a larger exchange surface between the liquid and gas phases, and reduced problems related to sludge flotation and sludge loss prevention. The use of LCRF also determines the effective removal of phosphorus compounds.
The aim of the research was to determine the efficiency of the treatment of real confectionery wastewater in a vertical anaerobic labyrinth flow bioreactor, integrating the technology of anaerobic granulated sludge and an anaerobic biological biofilm growing on a filling, based on waste materials containing aluminium, iron, and copper. The aim of the research was to determine the efficiency of the removal of phosphorus compounds and to optimise the organic loading rate of the reactor for the efficient biodegradation of organic compounds, with a simultaneous efficient production of biomethane.
2. Materials and Methods
2.1. Vertical Anaerobic Labyrinth Flow Bioreactor (VAL-FB)
The tested confectionery wastewater was treated in the VAL-FB, with a total active volume of 110 L. The reactor consisted of three coaxially arranged sections with different technological functions. The confectionery wastewater was fed into an internal tank with an active volume of 20 L, which was inoculated with anaerobic granulated sludge. This section of the VAL-FB functioned as a hydrolyser and an acid fermentation reactor, with an upward wastewater flow (from bottom to top). The appropriate flow rate of wastewater, which stimulated the development of the anaerobic granular sludge in this section of the VAL-FB, was ensured by an internal recirculation, with a flow rate of 30 L/min. The inlet connection was located 5 cm below the wastewater level in the reactor, while the outlet connection was connected to the raw wastewater pipe. The confectionery wastewater in the upper part of the bioreactor was then channelled by piston flow into the methanogenic section of the VAL-FB. This was a tank with an active volume of 80 L, which was equipped with an LCRF.
In this part of the VAL-FB, the anaerobic sludge grew in the form of a biofilm, and the flow of confectionery wastewater was descending (from top to bottom). Under the conditions of this section, metagenesis and the binding of phosphorus compounds took place. The wastewater was fermented in the external section, with an active volume of 10 L, and the sewage was fermented. Functionally, this section also served as an anaerobic sludge separator and settler, where sludge traps were used to clarify the CW by collecting, retaining, and sedimenting the anaerobic sludge. In this section, an upward flow (from bottom to top) was ensured, and the treated wastewater was discharged via an overflow outside the reactor. The VAL-FB was equipped with a gas-tight lid, which was sealed with a water seal. Stable temperature conditions of 35 ± 1 °C in the VAL-FB were ensured by the use of a water jacket. The hot water tank had a volume of 40 L, and the power of the electric heater was 2000 W. Hot water circulation in the system was ensured by a circulation pump with a capacity of 4 m3/h and automatic operation control based on temperature sensor readings. VAL-FB was insulated with a 50 mm thick layer of mineral wool. The confectionery wastewater was delivered daily and stored in a retention tank with an active volume of 200 L, which was equipped with a mixing system with a nozzle. The wastewater was pumped from the retention basin into the VAL-FB hydrolysis area using a submersible pump. The dosing pump was switched on 10 times per day. The VAL-FB diagram is shown in Figure 1.
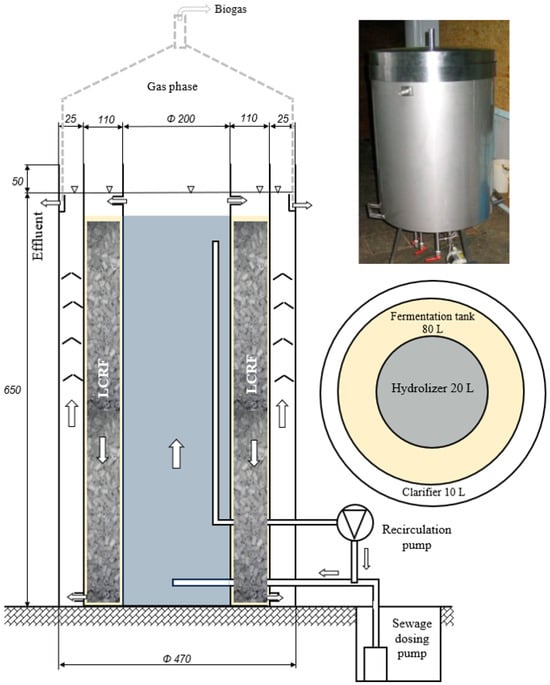
Figure 1.
Semi-technical scale vertical anaerobic labyrinth flow reactor (VAL-FB).
2.2. Low-Cost Recycled Filling (LCRF)
The filling tested in the experiment was produced from waste from a company specialising in the recovery of metals from used wires and electrical appliances. After the metal recovery process, approximately 5% by weight of aluminium, 3% by weight of iron, and 2% by weight of copper remained in the shredded material. A detailed description of the process and the technological sequence of material recycling that led to the raw material for the production of LCRF was provided in a previous article [44]. A total of 80 L of VAL-FB were introduced into the methanogenesis section. The basic properties and strength parameters of the individual filling elements were as follows: active surface area, 500 m2/m3; height, 24 mm; outer diameter, 18 mm; inner diameter, 10 mm; bulk density, 300 kg/m3; mechanical fracture strength in the vertical axis, 3.2 N/mm2; mechanical fracture strength in the horizontal axis, 0.04 N/mm2. The filling elements are shown in Figure 2.
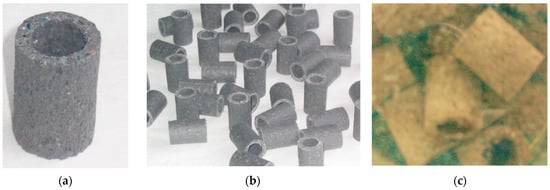
Figure 2.
LCRF elements: (a) simple module with visible porous structure; (b) filling elements after the extrusion process); (c) LCRF with anaerobic biological membrane.
2.3. Materials
2.3.1. Confectionery Wastewater
The confectionery wastewater comes directly from a company that produces sweets, including shortbread, gingerbread, jelly, and various types of sweets and confectionery for special occasions. The company employs 60 people. The CW consisted of a mixture of post-production process water, with a small admixture of social sewage. It was produced at a rate of about 30 m3/day. The concentrations of the main indicators of pollution in the CW are shown in Table 1.

Table 1.
Composition of the confectionery wastewater used in experimental work (n = 110).
2.3.2. Anaerobic Sludge
The anaerobic granular sludge was originally obtained from an upflow anaerobic sludge blanket (UASB) reactor that treats wastewater from fruit and vegetable processing (Tybark GMW Ltd., Olsztynek, Poland). The anaerobic granular sludge used was adapted to the confectionery wastewater tested in the experiments by operating the reactor over a period of 24 weeks. The anaerobic granular sludge was introduced into the hydrolysis and acid fermentation zone of the reactor. The filling with settled anaerobic sludge (anaerobic biological membrane) came from reactors operated on a semi-industrial scale for the purification of dairy wastewater [44]. The fillings were inoculated with anaerobic sludge for 10 weeks, and then the reactors were operated for 20 weeks. The filling with settled sludge was placed in the methanogenic zone of the reactor. The LCRF with an anaerobic biological membrane used in the experiment was adapted to the wastewater from the confectionery industry by operating the reactor for a period of 24 weeks. The properties of the anaerobic sludge are listed in Table 2.
Table 2.
Characteristics of the anaerobic granular sludge and anaerobic biofilm used in the experiment.
2.4. Organisational and Technological Research Design
The initial parameters of the experiments were developed based on the results of previous studies by the authors regarding the treatment of confectionery wastewater (CW) in a vertical anaerobic labyrinth flow bioreactor (VAL-FB) [45]. Optimisation work was carried out to determine the most effective technological parameters for the fermentation process. Based on the previous experience of the authors, it was proposed to introduce a low-cost recycled filling (LCRF) from plastic waste into the VAL-FB after metal recovery to further improve the efficiency of CW methane fermentation [44]. The studies on the treatment of confectionery wastewater in VAL-FB/LCRF were divided into five stages (S), depending on the applied organic loading rate (OLR) of the VAL-FB: S1—5 g COD/L·day; S2—6 g COD/day; S3—7 g COD/L·day; S4—8 g COD/L·day; S5—9 g COD/L·day. The experimental work focused on evaluating the effectiveness of the removal of indicators contained in the standards for permissible concentrations of wastewater pollutants discharged into the environment. Each stage lasted so long that the VAL-FB hydraulics had to be replaced at least 20 times. The effects of the purification process on the concentrations of organic compounds (COD, TOC, BOD5) and biogenic compounds (TN, N-NH4, TP, P-PO4) were evaluated. Indicators characterising the progress, stability, and efficiency of the anaerobic digestion process were also monitored, including pH, the ratio of free organic acids (FOS) to total alkaline capacity (TAC), biogas production efficiency, and CH4 content. The operating parameters used for the tested technological variants are listed in Table 3.
Table 3.
Research organisation and process parameters used in subsequent stages.
2.5. Analytical Methods
The methods and equipment employed to analyse the parameters of the anaerobic sludge used and the pollution indicators in the confectionery industry wastewater, as well as to monitor the efficiency of biogas production and methane content, are summarised below:
- -
- Chemical oxygen demand (COD), total nitrogen (TN), ammonia nitrogen (N–NH4), total phosphorus (TP), orthophosphate (P–PO4)—cuvette tests, using a DR 2800 spectrophotometer with a mineralizer (HACH Lange, Düsseldorf, Germany);
- -
- Total solids (TS), mineral solids (MS), volatile solids (VS)—gravimetric method, using part E EPA Standard Method 2540;
- -
- Suspended solids—gravimetric method, using Method 8271;
- -
- Biological oxygen demand (BOD5)—specific method according to PN-EN ISO 5815-1:2019-12 [46];
- -
- Total organic carbon (TOC)—TOC 1200 analyzer (Thermo Scientific, Waltham, MA, USA);
- -
- Lipids (ether extract)—gravimetric method for determining the total content of organic substances extractable with ether (PN-C 04573-01:1986) [47];
- -
- pH—pH meter (VWR, Radnor, PA, USA);
- -
- FOS/TAC ratio—titration method (Tritlab AT 1000, Hach, Düsseldorf, Germany);
- -
- Biogas yield—Aalborg mass flow meter equipped with an instantaneous flow display and a counter (Aalborg, Orangeburg, NY, USA);
- -
- Biogas composition—gas-tight syringe (injection volume 20 mL) and gas chromatograph (GC, Agilent Technologies, Santa Clara, CA, USA) equipped with a thermal conductivity detector (TCD). Additionally, biogas was analyzed using a GMF 430 analyzer (Gas Data, Coventry, UK). Methane (CH4), and carbon dioxide (CO2) contents were measured.
2.6. Statistical Analysis
All analyses of the experimental variants were carried out in triplicate. Based on the Statistica 13.3 PL package (Statsoft, Inc., Tulsa, OK, USA) and assuming a significance level of p = 0.05, the following statistical analyses of the results were performed: the Shapiro–Wilk test, testing the hypothesis regarding the distribution of each tested variable; ANOVA testing, determining the significance of the differences between the variances; Levene testing, testing the homogeneity of the variances in the groups; Tukey’s HSD testing, determining the significance of the differences between the analysed variables.
3. Results and Discussion
3.1. Organic Compounds Removal
The COD concentration in the raw wastewater was 12,740 ± 2130 mgO2/L (Table 4). High removal efficiencies of over 80% were observed over a range of tested OLR values extending from 5.0 g COD/L·d (S1) to 7.0 g COD/L·d (S3) (Table 4, Figure 3). For these technological variants, the COD concentration at the effluent ranged from 2320 ± 91 mgO2/L (S1) to 2490 ± 308 mgO2/L (S3) (Figure 3a). A statistically significant lower treatment efficiency of 68.8 ± 5.3% was observed in S5 (p < 0.05) (Figure 3b). The operation of VAL-FB at an OLR of 9.0 g COD/L·d made it possible to achieve a COD concentration in the effluent of 3970 ± 417 mgO2/L (Figure 3a). The analysis of TOC and BOD5 concentrations in the effluent shows that the efficiency of the removal of organic compounds characterised by these indicators was comparable, regardless of the OLR used (p > 0.05) (Figure 3). In raw wastewater, the concentrations of these pollution indicators were 4990 ± 380 mg/L (TOC) and 7270 ± 1010 mgO2/L (BOD5) (Figure 3a). Regardless of the operating variant used, no statistically significant differences were found (p > 0.05). In the case of TOC, the concentrations in the treated wastewater ranged from 770 ± 102 mg/L (S2) to 1020 ± 93 mg/L (S5), resulting in an achieved efficiency of 84.6 ± 6.6% to 79.6 ±4.6% (Figure 3). The efficiency of BOD5 removal was above 90%, regardless of the technological variant used (p > 0.05) (Figure 3b). An OLR of 5.0 g COD/L·d (S1) enabled a biodegradability of 93.2 ± 1.2% and a concentration in the VAL-FB effluent of 491 ± 12 mgO2/L (Figure 3). The highest OLR value tested during the experiments, 9.0 g COD/L·d, allowed for a BOD5 removal efficiency of 90.1 ± 2.2% and a concentration of 723 ± 32 mgO2/L in the treated wastewater (Figure 3).
Table 4.
Characteristics of concentrations, efficiency of organic compound removal, and CH4 production, depending on the technological variant of the experiment.
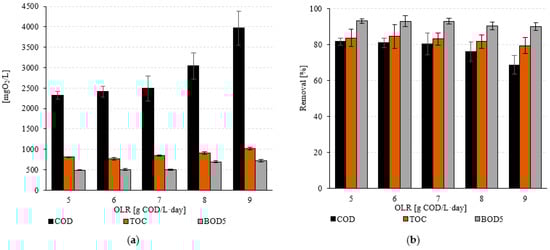
Figure 3.
(a) Values of indicators characterising the content of organic compounds in the treated wastewater and (b) the removal efficiency as a function of the technological variant.
The influence of applied OLR using different reactors for the treatment of sugar and confectionery wastewater under anaerobic conditions has been described in the literature. Barrera et al. (2019) [48] used upflow UASB reactors to treat sugar cane wastewater at OLRs of 3.03, 5.66, 7.34, and 10.01 g COD/L∙d. The COD inflow ranged from 4320 to 12,690 mgO2/L. The COD removal efficiencies were 72.8%, 88.8%, 80.0%, and 78.0%, respectively [48]. Other researchers [49] treating sugar wastewater in UASB found that the COD removal efficiency ranged from 80.6 to 89.4 when the OLR was increased from 8 to 16 g COD/L∙d. Increasing the OLR to 24 g COD/L∙d led to a drastic decrease in COD removal efficiency to 53.3% [49].
The results of the experimental work presented in the literature show that higher efficiencies can be achieved than that obtained using the VAL-FB reactor equipped with LCRF in the treatment of wastewater from the sugar and confectionery sector [50]. It has been proven that the biodegradation of organic compounds can also take place when using OLR with a value of 16 g COD/L·d [49]. However, the achievement of such extremely high efficiencies is rarely reported. This may be due to many factors that directly affect the results of the experimental work. First of all, the characteristics of the wastewater, which vary greatly in the confectionery sector and depend directly on the range of goods produced, are important [51]. The second important element is the scale of the work carried out. In studies carried out under optimised conditions on a laboratory scale, the results obtained are often very promising [10]. However, their proper verification can only take place during the long-term operation of pilot reactors, under conditions close to actual operating conditions and using real, non-synthetic wastewater [52]. Increasing the technological maturity of the solution often makes it possible to verify the previously achieved high efficiency of the processes for the biodegradation of pollutants. It should be emphasised that in the research presented here, real wastewater with high variability was used, and it was treated in a reactor operated on a fractionated technical scale under conditions similar to those of an industrial plant.
In previous studies by the authors [45] in which VAL-FB was used without LCRF for the treatment of confectionery wastewater, it was found that the highest removal rate of organic compounds of about 75%, expressed in COD, was achieved at an OLR of 5.0 g COD/L·d and 6.0 g COD/L·d. In the effluent, 2.76 ± 0.17 gO2/L and 2.80 ± 0.06 gO2/L were measured. It was found that an increase in OLR to 7.0 g COD/L·d resulted in a decrease in COD removal efficiency to 61.6 ± 4.4% and yielded 4.30 ± 0.48 gO2/L in the effluent. Similar observations were made for the BOD5 and TOC indices [45]. At OLRs of 5.0 g COD/L·d and 6.0 g COD/L·d, BOD5 removal efficiencies of 83.9 ± 2.7% and 82.2 ± 3.6% were achieved, respectively. The BOD5 concentration in the effluent was 0.82 ± 0.03 gO2/L and 0.91 ± 0.04 gO2/L, respectively. Increasing the OLR to 7.0 g COD/L·d led to a decrease in BOD5 removal to 70.7 ± 6.2%, resulting in an effluent rate of 1.49 ± 0.13 gO2/L. For TOC, similar removal rates of 77.4 ± 3.4% and 75.2 ± 5.2% were found at an OLR of 5.0 g COD/L·d and 6.0 g COD/L·d, resulting in an effluent TOC concentration of 0.85 ± 0.04 gO2/L and 0.93 ± 0.06 gO2/L, respectively. At an OLR of 7.0 g COD/L·d, a decrease in TOC consumption of 64.9 ± 8.7% was observed. The TOC concentration of the wastewater was 1.32 ± 0.12 gO2/L [45]. The LCRF used in this study provided a higher removal efficiency of all analysed indicators. Regardless of the OLR used, the removal efficiency of BOD5 and TOC was comparable, while in the case of COD, a statistically significant lower treatment efficiency was observed at an OLR of 9.0 g COD/L·d.
The use of fillings in anaerobic reactors is technologically justified in many cases [21]. This is because the highly dispersed suspended biomass of anaerobic bacteria very often tends to flow out of the reactors along with the treated wastewater [53]. This phenomenon directly reduces the concentration of the fermentation microorganisms, which in turn leads to lower purification performance and biogas production [54]. Moreover, the effluent biomass secondarily contaminates the treated wastewater, leading to an increase in monitored pollution rates [55]. Therefore, the use of highly filling moulds, with a pronounced structure and a large active surface area, allows for a longer residence time for the bacteria in the area where the biodegradation of pollutants takes place [56]. In many cases, this is crucial for the possibility of achieving high purification efficiencies with limited values of technological parameters, including high OLR and short HRT. In many cases, hybrid solutions are used, namely a combination of UASB reactors with anaerobic filters, an example of which is VAL-FB [57].
Research based on a similar solution was described by Beal and Raman (2000) [50], who used a sequential system consisting of a UASB and an anaerobic filter with ascending flow (from top to bottom) under mesophilic conditions to treat confectionery wastewater. At an OLR of 12.5 g COD/L∙d, the COD removal efficiency reached 98%, suggesting that the efficiency of organic compound removal can be increased by using a sequential anaerobic treatment system compared to the results of a single-stage process [50]. Farhadian et al. (2007) [58] applied the upflow anaerobic fixed bed (UAFB) at a pilot scale. Different types of standard fillings available on the market were used. The COD concentration in the influent was in the range of 2000–8000 mgO2/L, and the maximum efficiency of organic compound removal in the reactor was between 75% and 93%. The biofilter tolerated a very high organic load of up to 10 g COD/L∙d. It was found that the reactor equipped with standard polypropylene rings was more effective than the reactor employing cut polyethylene pipes and the reactor with PVC filling. In the case of PE pipes, a decrease in efficiency of 2–7% was observed, while in the case of PVC, it decreased by 10–16% compared to that of the standard baffle rings [58]. D. Balcıoğlu et al. (2021) [3], on the other hand, used an anaerobic membrane bioreactor (AnMBR) with OLRs of 1.1, 2.2, 4.4, 6.6, and 7.9 g COD/L∙d. In these tests, a COD removal efficiency of up to 99% was achieved in all technological variants. However, an increase in the OLR above 4.4 g COD/L∙d had a negative effect on the anaerobic biofiltration performance. When this value was exceeded, the transmembrane pressure (TMP), the production of extracellular polymeric substances (EPS) and soluble microbial products (SMP), and the filtration resistance increased drastically. It was found that the mechanism of membrane fouling can be attributed to the formation of a cake layer, consisting mainly of proteins and carbohydrates [3].
3.2. Biogas and CH4 Production
The efficiency of biogas production per COD load removed was similar when the OLR values tested ranged from 5.0 gCOD/L·d (S1) to 7.0 gCOD/L·d (S3) (Figure 4a). The observed values ranged from 345 ± 11 mL/gCODrem. (S1) to 308 ± 16 mL/gCODrem. (S3) (Figure 4a). After conversion to the introduced COD load, the biogas production efficiency ranged from 282 ± 13 mL/gCOD (S1) to 248 ± 20 mL/gCOD (S3). The observed variability in biogas productivity in these technological variants (S1–S3) was not statistically significant (p > 0.05). However, a significant difference was observed in the CH4 content in the gaseous products of anaerobic bacterial metabolism (p < 0.05). Monitoring the concentration of this biogas component showed that the highest CH4 concentration was observed in the range of OLR used, extending from 5.0 g COD/L·d (S1) to 6.0 g COD/L·d (S2). In these variants, 70.7 ± 2.3% and 69.6 ± 1.7% CH4 were found in the biogas (Figure 4b), which ensured a CH4 yield of 134 ± 4.6 L CH4/d and 153 ± 5.2 L CH4/d, respectively (Table 4). Based on the COD load introduced, the CH4 yield ranged from 244 ± 8.5 mL CH4/gCODin. (S1) to 230 ± 7.6 mL CH4/gCODin. (S2) (Table 4). The qualitative composition of the biogas changed significantly in the next two OLR stages tested (S3–S4) (p < 0.05). Very similar CH4 concentrations were obtained for these variants, which were 64.1 ± 1.2% (S3) and 64.2 ± 1.9% (S4) (Figure 4b). CH4 production was 151 ± 5.5 L CH4/d (197 ± 6.8 mL CH4/gCODin.) in S3 and 165 ± 6.3 L CH4/d (188 ± 6.5 mL CH4/gCODin.) in S4 (Table 4). A significantly lower CH4 content in the biogas of 60.7 ± 2.8% was observed in the variant with an OLR of 9.0 g COD/L·d (S5) (p < 0.05) (Figure 4b). Results of 166 ± 6.2 L CH4/d were obtained here, which corresponded to 168 ± 7.8 mL CH4/gCODin. (Table 4).
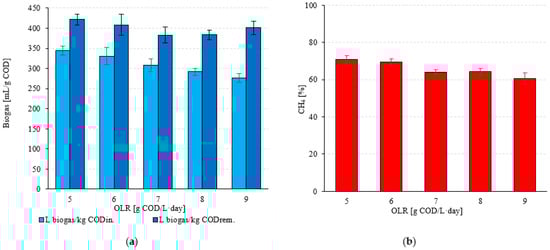
Figure 4.
(a) Biogas production per COD introduced and removed and (b) CH4 concentration as a function of the technological variant.
The use of LCRF led to an increase in biogas and CH4 production compared to methane fermentation in VAL-FB without filling [45], with the highest biogas production being achieved at an OLR of 5.0 g COD/L·d and 6.0 g COD/L ·d. The biogas production was 135.0 ± 12.0 g COD/L·d, respectively. The methane fermentation was 135.0 ± 12.6 L/d (0.32 ± 0.03 L/gCODrem.) and 145.8 ± 10.0 L/d (0.29 ± 0.02 L/gCODrem.), respectively. At an OLR of 5.0 g COD/L·d, the highest CH4 concentration in the biogas was found to be 70.1 ± 0.7%, comparable to that obtained in the present experiment. In turn, the highest daily CH4 production was measured at an OLR of 6.0 g COD/L·d and was 97.1 ± 5.1 L CH4/d. A further increase in the OLR to 7.0 g COD/L·d led to a decrease in biogas and CH4 production [45]. Compared to the CH4 yield observed when using VAL-FB/LCRF, a significantly lower methanogenesis efficiency was observed when treating confectionery wastewater in UASB reactors. Barrera et al. (2019) [48], for example, achieved 244.3, 249.6, 331.4, and 302.8 mL CH4/g CODrem. when using OLRs of 3.03, 5.66, 7.34, and 10.01 g COD/L∙d, respectively. In the study by Tanksali et al. (2013) [59], an OLR of 4 g COD/L·d produced 15 L/d of biogas, with a CH4 content of 71%. In the study by Hampannavar and Shivayogimath (2010) [49], biogas and CH4 production peaked at an OLR of 16 g COD/L·d, 4.66 L/L·d, and 3.8 L/L·d, respectively. After increasing the OLR from 16 to 24 g COD/L·d, biogas production decreased from 37.1 to 25.71 L/d [49]. In the study by Balcıoğlu et al. (2021) [3] on the use of the AnMBR reactor for the treatment of sugar wastewater, the average CH4 yields were 0.33, 0.31, 0.31, 0.26, and 0.26 L CH4/gCODrem. at an OLR of 1.1, 2.2, 4.4, 6.6, and 7.9 g COD/L∙d, respectively. Next-generation sequencing (NGS) analysis showed that after increasing the OLR value above 4.4 g COD/L∙d, the dominance of hydrogenotrophic methanogens shifted towards acetoclastic methanogens, which led to a decrease in the CH4 concentration in the biogas [3]. When using single-stage anaerobic reactors, there is a risk of destabilisation of the methane fermentation process at high OLR due to acidification [60]. This can lead to process interruptions and considerable downtimes [61]. In VAL-FB with LCRF, the individual phases of anaerobic digestion take place in separate chambers, which favours the treatment of heavily contaminated confectionery wastewater. The same filling was used for the anaerobic treatment of dairy wastewater [44]. It was found that the filling used had an influence on the stabilisation of the anaerobic microbial community structure in all tested technological variants. This resulted in an efficient biogas production between 0.67 ± 0.12 and 1.94 ± 0.08 m3/d, with an OLR between 3.0 and 7.0 kg COD/m3·d. The use of the highest OLRs, 6.0 and 7.0 kg COD/m3·d, resulted in the highest CH4 concentration in the biogas, 68.2 ± 0.6% and 67.3 ± 0.8%, respectively [44].
The fillings of the anaerobic reactors for the methane fermentation of waste and wastewater from the food sector have also been used in other experiments. For example, researchers [32] used an active filling reactor produced with microcellular extrusion technology for the purification of sugar wastewater. OLR values of 4.0, 6.0, and 8.0 g COD/L·d were used. In this experiment, 638 ± 98, 1134 ± 127, and 1206 ± 96 L/day of biogas were produced. The specific biogas production was 356 ± 25, 427 ± 14, and 364 ± 11 L/g COD removed, respectively. An increase in CH4 concentration in the biogas was observed in the OLR range of 4.0–6.0 g COD/L·d, amounting to 69.6 ± 1.4–72.0 ± 1.9%. Increasing the OLR to 8.0 g COD/L·d led to a decrease in the CH4 concentration to 61.9 ± 3.1% [32]. Microwave irradiation was used to treat dairy wastewater in the initial COD range of 2.0 to 8.0 g COD/L [62]. It was found that active filling (AF) had no significant effect on biogas production. However, a significant effect of electromagnetic microwave radiation (EMR) on CH4 concentration was observed at an initial COD in the range of 4.0 to 8.0 g COD/L, with a filling of 5% Cu and 95% Fe [62]. The influence of magnetoactive microporous filling media produced by extrusion technology and modified by the addition of metal catalysts and magnetic activation on the production of biogas from dairy wastewater in a pilot-scale hybrid anaerobic biofilm reactor with full stirring was also determined [63]. The highest biogas production, ranging from 56.7 to 310.9 L/kg COD removed, was found at an OLR of 6.0 to 8.0 g COD/L·d. CH4 production ranged from 420.6 to 557.1 L/d, depending on the technological variants used [63]. Patel et al. (1995) [64], on the other hand, used an anaerobic upflow fixed film reactor, with various fillings such as charcoal, gravel, bricks, PVC pieces, and pumice for the biodegradation of cheese whey. The biogas volumes obtained were 6.0 ± 0.011, 5.1 ± 0.020, 5.4 ± 0.008, 4.3 ± 0.013, and 3.8 ± 0.013 L/day/L digester, and the CH4 concentration in the biogas was 70 ± 0.66%, 68 ± 0.83%, 68 ± 1.33%, 67 ± 0.16%, and 64 ± 0.83%, respectively [64].
3.3. Biogenic Compounds Removal
The concentration of nitrogen compounds in the raw wastewater fed to the VAL-FB was 210 ± 35 mg TN/L and 159 ± 27 mg N-NH4/L. In the range of OLR variants used, from 5.0 g COD/L·d (S1) to 8.0 g COD/L·d (S4), similar TN concentrations were found in the treated wastewater (p > 0.05). The observed values ranged from 147 ± 9 mg TN/L (S1) to 153 mg TN/L (S4) (p > 0.05) (Figure 5a). The treatment efficiencies were exhibited in a narrow range from 30.0 ± 3.1% (S1) to 27.1 ± 3.9% (S4) (p > 0.05) (Figure 5b). A statistically significant increase in effluent TN concentration of 172 ± 10 mg TN/L, with a removal efficiency of 8.1 ± 2.9%, was achieved when an OLR of 9.0 g COD/L·d was used (p < 0.05) (Figure 5). The observations of N-NH4 concentrations in raw and treated wastewater show that no significant differences in the concentration of this pollutant indicator were observed in the VAL-FB effluent, regardless of the OLR variant used (p > 0.05). The lowest value of 127 ± 21 mg N-NH4/L was found in S2, while the highest value was 149 ± 18 mg N-NH4/L in S5 (p > 0.05) (Figure 5a). The observed N-NH4 values in the treated wastewater were the result of the removal of this pollutant indicator, and they ranged from 20.1 ± 8.3% to 6.3 ± 6.0% (Figure 5b).
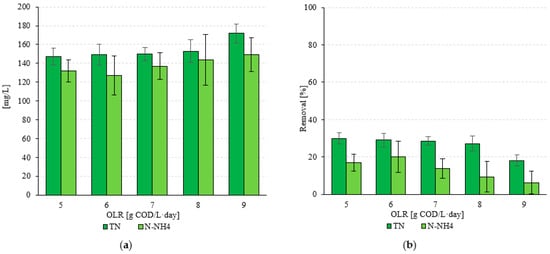
Figure 5.
(a) Concentrations of nitrogen compounds in the effluent and (b) their removal efficiency as a function of the technological variant.
A significantly higher efficiency of wastewater treatment was observed for phosphorus compounds (p < 0.05). The TP and P-PO4 content in the tested confectionery wastewater was 24 ± 6 mg TP/L and 18 ± 5 mg P-PO4/L, respectively. In the variants where the lowest OLR values were tested (S1, S2), a TP removal efficiency of over 72% was achieved. This resulted in effluent values of 6.2 ± 1.7 mg TP/L (S1) and 6.6 ± 2.3 mg TP/L (S2) (Figure 6a). The use of OLR of 7.0 g COD/L·d (S3) resulted in a decrease in TP removal efficiency to 67.1 ± 17.1% and a concentration of 7.9 ± 2.7 mg TP/L in the treated wastewater (Figure 6). An increase in OLR led to a decrease in TP removal efficiency to below 60% (Figure 6b). In S4, 57.5 ± 18.6% and 10.2 ± 3.8 mg TP/L were found, while in S5, 53.8 ± 13.1% and 11.1 ± 2.9 mg TP/L were found in the effluent of VAL- FB (Figure 6). A significantly higher efficiency was found in the case of P-PO4 (p > 0.05). In S1 and S2, 1.7 ± 0.6 mg P-PO4/L, with a treatment efficiency of 90.6 ± 8.8%, and 1.9 ± 0.3 mg P-PO4/L, with a process efficiency of 89.4 ± 7.9%, were obtained in the effluent after the anaerobic treatment process (Figure 6). The use of OLR at the level of 7.0 and 8.0 g COD/L·d led to an increase in the concentration of this pollution indicator to 2.6 ± 0.8 mg P-PO4/L (S3) and 2.8 ± 1.1 mg P-PO4/L (S4) (Figure 6a). Using the highest OLR resulted in an 82.2 ± 3.1% efficiency in the treatment of confectionery wastewater and an effluent concentration of 3.2 ± 0.7 mg P-PO4/L (S5) (Figure 6). Strong positive correlations were found between the applied OLR and the concentration of TN and N-NH4 in the treated wastewater, as shown by the coefficients of determination R2 = 0.703 and R2 = 0.8262, respectively (Figure 7a). However, very strong positive correlations were found between the OLR and the concentration of TP and P-PO4 in the effluent. The coefficients of determination were R2 = 0.9521 and R2 = 0.9676, respectively (Figure 7b).
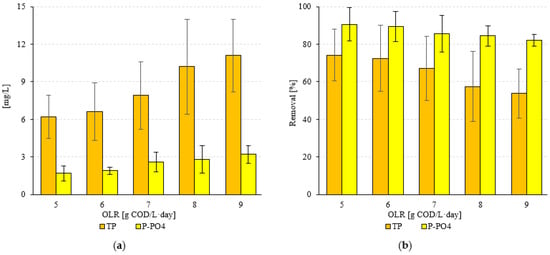
Figure 6.
(a) Concentrations of phosphorus compounds in effluent and (b) their removal efficiency as a function of the technological variant.
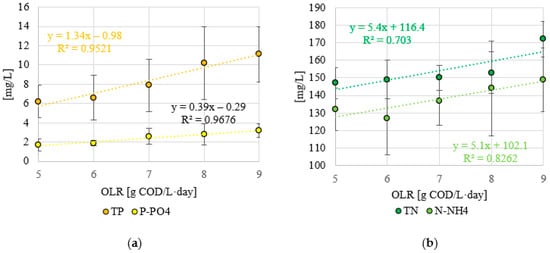
Figure 7.
(a) Correlations between the applied OLR and the concentration of nitrogen and (b) phosphorus compounds in the outflow.
In previous studies, when treating confectionery wastewater in an unfilled anaerobic labyrinth flow bioreactor [45], it was found that the removal rate of nitrogen and phosphorus compounds from confectionery wastewater was low and mainly related to biomass cell growth. At an OLR of 5.0 g COD/L·d and 6.0 g COD/L·d, the TN concentration of the wastewater was 170 mg TN/L and 172 mg TN/L, respectively. Increasing the OLR to 7.0 g COD/L·d resulted in a higher TN concentration in the effluent of 188.7 ± 5.2 mg/L. The concentration of TN in raw wastewater was 198 ± 27 mg TN/L. No differences were found in the TP content of the effluent for any of the test variants [45]. Therefore, the filling used in this study led to a significantly higher efficiency of wastewater treatment regarding phosphorus compounds. This was probably due to the adsorption of orthophosphates by iron and aluminum contained in the LCRF fillings, on the one hand, and on the other hand, to a further limitation of secondary contamination of the effluent by suspensions, mainly anaerobic sludge. When using LCRF in previous studies [44], the efficiency of TN removal from dairy wastewater was in a narrow range from 10.2 ± 1.6% during the adaptation period to 11.9 ± 1.7% with an OLR of 5.0 g COD/L·d. This provided TN concentrations in the effluent ranging from 214.0 ± 4.2 mg TN/L to 218.2 ± 3.8 mg TN/L. The TP removal efficiency ranged from 22.1 ± 3.5% to 36.9 ± 4.6%. TP removal efficiency decreased with increasing OLR values between 3.0 g COD/L·d and 7.0 g COD/L·d [44]. During methane fermentation, the removal of nitrogen and phosphorus compounds from wastewater is low and is mainly related to the growth of biomass cells [65]. This is a time-consuming process because the microorganisms grow slowly [66]. This fundamentally limits the versatility of this technology and represents a serious barrier to the further development of anaerobic methods.
The conversion of organic forms of phosphorus into orthophosphates facilitates their removal in subsequent treatments. Methods used for this removal include oxygen conversion, hydrophyte-based treatments, chemical precipitation with iron- or aluminium-based inorganic coagulants, biological beds, and microalgae [44]. One of the ways to eliminate this disadvantage is the use of reactor fillings, whose properties improve nutrient removal. An innovative solution, which has not yet been used in the treatment of wastewater from the sugar industry, was the use of fluidized active filling (FAF) of anaerobic reactors [32]. The TN removal rate ranged from 17.3 ± 4.0% at an OLR of 4.0 g COD/L·d to 8.7 ± 30% at an OLR of 8.0 g COD/L·d.TP removal efficiency was even higher than in the present study, ranging from 64.4 ± 2.4 to 81.2 ± 8.2% at an OLR of 4.0 to 8.0 g COD/L·d [32]. Researchers have shown that insoluble vivianite compounds are formed by the reaction of metals with phosphates, which leads to a decrease in the phosphorus concentration in the treated wastewater [67]. The process of removing phosphorus compounds by dissolving metals is based on assumptions similar to those of the electrocoagulation method. However, in this case, the metal ions enter the wastewater through the spontaneous corrosion process and become responsible for the removal of phosphates due to the changes in the wastewater environment [68]. The methods based on corrosion phenomena differ from the electrocoagulation method in that no external power source is required [69]. This mechanism was observed through the use of LCRF.
The removal of phosphorus by corrosion processes is closely related to the amount of metal ions that pass from the anode material into the solution or which are adsorbed on the filling surface. Iron in oxidation state 0 is used in the treatment of wastewater from coking plants [70], the textile industry [71], or even domestic wastewater [72]. Methods that use iron in oxidation state 0 also include the metal dissolution method, which utilises the electrode corrosion processes that occur in wastewater [73].
Anaerobic mobile biofilm reactors (AMBR) with ferrous media [74], magnetoactive hybrid anaerobic biofilm reactors (MA-HABR) [63], anaerobic baffles and biofilm reactors with magnetoactive filling media [75], and anaerobic reactors with active packing (AF) heated by microwave radiation (EMR) [62] have been used for wastewater treatment using the metal digestion method. The efficiency of P removal ranged from 64.4% to 90.7%, depending on the technological parameters [31]. A significant limitation of this method is the depletion of the sorption capacity of the sealant, resulting in the need to replace or regenerate it [31]. In addition, the effectiveness of such fillings often decreases with the time of reactor operation, which is related to the problem of passivation, or the formation of anaerobic biofilms that create a barrier around the filling material and reduce contact with the wastewater [76].
Another advantage of using LCRF, whose structure contains iron ions, is its ability to bind the H2S contained in the biogas, leading to its partial refinement [62]. This is particularly important when the biogas is channelled into combined heat and power (CHP) modules, where it is converted into heat and electricity [77]. Biogas filtration and upgrading systems use filters based on biological deposits and active mineral substances. Industrial filters allow for the precise separation of the sulphur compounds contained in the biogas, but this is associated with considerable operating costs [78]. As far as the protection of electricity generators or CHP plants is concerned, the techniques for cleaning the biogas from H2S have a significant impact on the cost of the plants, and abandoning them or replacing them with biological filters leads to a drastic reduction in the lifetime of generators and anaerobic reactor systems [79]. In desulphurisation technology based on the use of a steel valve bed, it is possible to easily obtain a substrate for the production of this adsorber and also to easily modify existing solutions [80]. As a result of the metal corrosion, iron ions diffuse into the solution, binding the H2S produced during methane fermentation and retaining it in the liquid phase of the reactor. This eliminates the need to install and operate external filters or biofilters.
3.4. pH and FOS/TAC Variability
A stable pH was observed within the range of OLR values of 5.0 to 7.0 g COD/L·d (p > 0.05). The values of this indicator were within narrow limits of 7.12 ± 0.07 (S1) to 6.90 ± 0.12 (S3) (Figure 8a). A significant decrease to 6.72 ± 0.05 was observed in S4 (p < 0.05) and a further decrease to pH 6.61 ± 0.04 at an OLR of 9.0 g COD/L·d (p < 0.05) (Figure 8a). A similar trend was observed for the FOS/TAC ratio. Stable and low values of this parameter were measured in S1 and S2, which were 0.32 ± 0.02 and 0.33 ± 0.01, respectively (p > 0.05) (Figure 8b). Increasing the OLR to 7.0 g COD/L·d (S3) led directly to a significant increase in FOS/TAC, to a value of 0.37 ± 0.02 (p < 0.05) (Figure 8b). In the S4 and S5 variants, the FOS/TAC values increased above 0.40 and were 0.41 ± 0.03 and 0.46 ± 0.002, respectively (Figure 8b). Very strong correlations were observed between the OLR used and pH (negative with a coefficient of determination of R2 = 0.9905) (Figure 9a) and FOS/TAC (positive with R2 = 0.9614) (Figure 9b). Very strong positive correlations were found between pH and the amount of biogas and CH4 expressed as introduced COD (R2 > 0.95) (Figure 10a) and CH4 concentration (R2 = 8904) (Figure 10b). However, there was no correlation between pH and biogas production expressed as COD removed (Figure 10a). Similar coefficients of determination were obtained for the relationship between the FOS/TAC ratio and biogas and CH4 production per unit and CH4 concentration, but these were negative correlations (Figure 11).
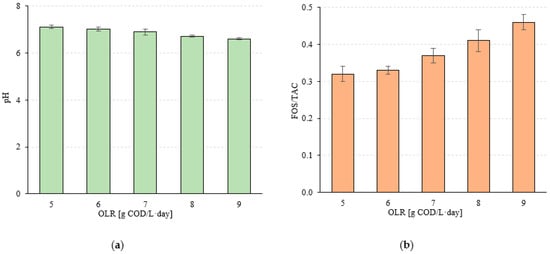
Figure 8.
(a) pH value and (b) FOS/TAC ratio in treated wastewater as a function of the technological variant.
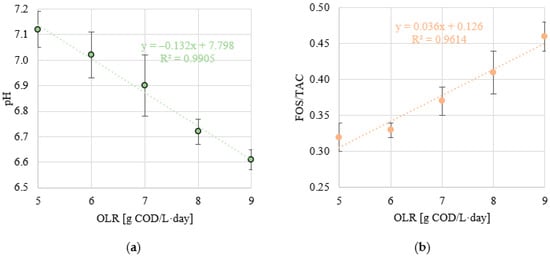
Figure 9.
(a) Correlations between OLR and pH value and (b) OLR and FOS/TAC ratio.
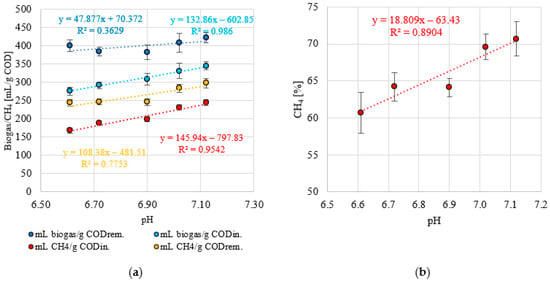
Figure 10.
(a) Correlations between pH and biogas and CH4 production and (b) between pH and CH4 content in biogas.
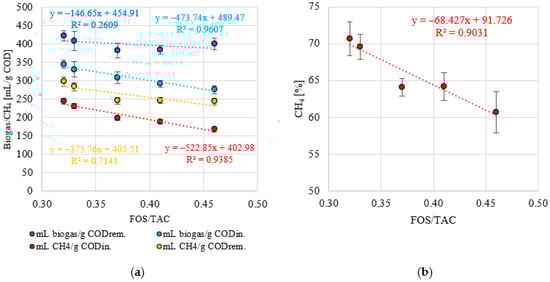
Figure 11.
(a) Correlations between FOS/TAC and biogas and CH4 production and (b) between FOS/TAC and CH4 content in biogas.
In the authors’ earlier studies [45], the pH in the reactor chamber at an OLR of 5.0–6.0 g COD/L·d ranged from between 7.04 ± 0.07 and 7.15 ± 0.04, and the FOS/TAC ratio was below 0.4. However, increasing the OLR to 7.0 g COD/L·d caused the pH to drop to 6.37 ± 0.17, and the FOS/TAC ratio increased to 0.48, resulting in a significant reduction in biogas and CH4 production [45]. In other studies [32] on sugar wastewater treatment, when the OLR increased to a value of 8.0 g COD/L·d, a decrease in pH to 6.75 ± 0.18 and an increase in the FOS/TAC ratio to 0.44 ± 0.2 were also observed, leading to a significant decrease in wastewater treatment efficiency and methane fermentation [32]. The occurrence of such a phenomenon indicates the accumulation of volatile fatty acids in the reactor chamber and its overload [81]. Balcıoğlu et al. (2021) [3], in turn, maintained the pH at 7–7.5 throughout the experiment related to the treatment of sugar wastewater, which is suitable for the hydrolysis of pollutants and the maintenance of methanogenic activity in the system. During the acclimatization phase, the pH in the reactor had to be adjusted, but this was no longer necessary during the rest of the experiment. According to the authors [3], this could be due to the ammonia ions formed by protein degradation, increasing alkalinity and pH, or it could be caused by a change in the microbial community.
4. Conclusions
The study showed that effective biodegradation of organic compounds was observed in the range of the OLR values of 5.0 g COD/L·d to 7.0 g COD/L·d. Regardless of the analysed indicator for the content of organic compounds in confectionery wastewater, the effectiveness of these technological variants was over 80%. The increase in the value of the applied OLR led to a significant increase in the COD concentration in the treated wastewater. However, the increase in OLR did not have such a significant effect on the values of BOD5 and TOC in the effluent. The use of filling enabled the effective removal of phosphorus compounds from confectionery wastewater. However, it had no influence on reducing the concentration of nitrogen compounds.
A correlation between the applied OLR and the changes in the FOS/TAC ratio and pH was demonstrated. When testing the three lowest OLRs, the values remained stable. In the range of 8.0 to 9.0 g COD/L·d, there was a significant increase in the FOS/TAC ratio and a decrease in pH. The changes in these parameters were strongly correlated with biogas production and the percentage CH4 content. The highest specific biogas production efficiency and the highest methane concentration were obtained when testing the two lowest OLRs. Increasing the value of this technological parameter led to a successive decrease in biogas and methane yields.
The use of the technological solution described enabled an effective wastewater purification process. The effluent from the reactor was clear and did not contain any suspended solids or anaerobic sludge cells. This is an important advantage of this solution, because the cells of fermentation bacteria are small, have a low density, are highly fragmented, and do not form compact and heavy conglomerates, which often leads to their detachment and a loss of biomass from the reactor. This phenomenon can limit both the efficiency of wastewater treatment and the biomethane yield, which has a direct impact on the technological and economic aspects of solutions based on anaerobic processes.
Author Contributions
Conceptualization, M.D. and M.Z.; methodology, M.D. and M.Z.; validation, M.D.; formal analysis, M.D.; investigation, M.D., J.K., A.I., S.M. and M.Z.; resources, M.D., J.K., A.I., S.M. and M.Z.; data curation, M.D., J.K., A.I., S.M. and M.Z; supervision, M.D.; writing—original draft preparation, M.D. and J.K.; writing—review and editing, M.D., J.K., A.I., S.M. and M.Z.; visualization, M.D. and J.K.; funding acquisition, M.D. All authors have read and agreed to the published version of the manuscript.
Funding
This research was financially supported by works no. 29.610.023-110 of the University of Warmia and Mazury in Olsztyn, and WZ/WB-IIŚ/3/2022 of the Bialystok University of Technology, funded by the Ministry of Science and Higher Education.
Data Availability Statement
Data are contained within the article.
Conflicts of Interest
The authors declare no conflicts of interest.
References
- Vaclavik, V.A.; Christian, E.W.; Campbell, T. Sugars, Sweeteners, and Confections. In Essentials of Food Science; Food Science Text Series; Springer: Cham, Switzerland, 2021; pp. 281–299. [Google Scholar] [CrossRef]
- Nasr, F.A.; Abdelfattah, I.; El-Shafaia, S.A. Cost Effective Management of Confectionery Industrial Wastewater. Egypt. J. Chem. 2022, 65, 391–399. [Google Scholar] [CrossRef]
- Balcıoğlu, G.; Yilmaz, G.; Gönder, Z.B. Evaluation of Anaerobic Membrane Bioreactor (AnMBR) Treating Confectionery Wastewater at Long-Term Operation under Different Organic Loading Rates: Performance and Membrane Fouling. Chem. Eng. J. 2021, 404, 126261. [Google Scholar] [CrossRef]
- Kannah, R.Y.; Banu, J.R.; Joe, J.M.; Yeom, I.T.; Do, K.U. Profitable Sludge Management via Novel Combined Ozone Disperser Pretreatment Coupled with Membrane Bioreactor for Treating Confectionary Wastewater. J. Clean. Prod. 2019, 239, 118102. [Google Scholar] [CrossRef]
- Patsialou, S.; Politou, E.; Nousis, S.; Liakopoulou, P.; Vayenas, D.V.; Tekerlekopoulou, A.G. Hybrid Treatment of Confectionery Wastewater Using a Biofilter and a Cyanobacteria-Based System with Simultaneous Valuable Metabolic Compounds Production. Algal Res. 2024, 79, 103483. [Google Scholar] [CrossRef]
- Nayyar, D.; Nawaz, T.; Noore, S.; Singh, A.P. Food Processing Wastewater Treatment: Current Practices and Future Challenges. In Energy, Environment, and Sustainability; Springer: Singapore, 2021; pp. 177–208. [Google Scholar] [CrossRef]
- Zajda, M.; Aleksander-Kwaterczak, U. Wastewater Treatment Methods for Effluents from the Confectionery Industry—An Overview. J. Ecol. Eng. 2019, 20, 293–304. [Google Scholar] [CrossRef] [PubMed]
- Esparza-Soto, M.; Alcaraz-Ibarra, S.; Lucero-Chávez, M.; Mier-Quiroga, M.; Fall, C. Influence of Low Operating Temperature on Biomass Yield during Anaerobic Treatment of Chocolate Confectionery Wastewater in a Pilot-Scale UASB Reactor. J. Water Process Eng. 2022, 48, 102918. [Google Scholar] [CrossRef]
- Karamichailidou, D.; Alexandridis, A.; Anagnostopoulos, G.; Syriopoulos, G.; Sekkas, O. Modeling Biogas Production from Anaerobic Wastewater Treatment Plants Using Radial Basis Function Networks and Differential Evolution. Comput. Chem. Eng. 2022, 157, 107629. [Google Scholar] [CrossRef]
- Nivedha Ramanathan, R.M.; Balasubramanian, N.; Chithra, K. Biogas from Confectionery Wastewater with the Application of Ultrasound Pre-Treatment. Energy Sources Part A Recover. Util. Environ. Eff. 2022, 44, 2309–2320. [Google Scholar] [CrossRef]
- Mpofu, A.B.; Kaira, W.M.; Oyekola, O.O.; Welz, P.J. Anaerobic Co-Digestion of Tannery Effluents: Process Optimisation for Resource Recovery, Recycling and Reuse in a Circular Bioeconomy. Process Saf. Environ. Prot. 2022, 158, 547–559. [Google Scholar] [CrossRef]
- Nguyen, L.N.; Kumar, J.; Vu, M.T.; Mohammed, J.A.H.; Pathak, N.; Commault, A.S.; Sutherland, D.; Zdarta, J.; Tyagi, V.K.; Nghiem, L.D. Biomethane Production from Anaerobic Co-Digestion at Wastewater Treatment Plants: A Critical Review on Development and Innovations in Biogas Upgrading Techniques. Sci. Total Environ. 2021, 765, 142753. [Google Scholar] [CrossRef]
- Eslami, H.; Hashemi, H.; Fallahzadeh, R.A.; Khosravi, R.; Fard, R.F.; Ebrahimi, A.A. Effect of Organic Loading Rates on Biogas Production and Anaerobic Biodegradation of Composting Leachate in the Anaerobic Series Bioreactors. Ecol. Eng. 2018, 110, 165–171. [Google Scholar] [CrossRef]
- Mahmoud, I.; Gao, W.J.; Liao, B.Q.; Cumin, J.; Dagnew, M.; Hong, Y. Development of a High-Rate Submerged Anaerobic Membrane Bioreactor. Environ. Technol. 2018, 39, 640–650. [Google Scholar] [CrossRef]
- Mariraj Mohan, S.; Swathi, T. A Review on Upflow Anaerobic Sludge Blanket Reactor: Factors Affecting Performance, Modification of Configuration and Its Derivatives. Water Environ. Res. 2022, 94, e1665. [Google Scholar] [CrossRef] [PubMed]
- Patil, P.G.; Kulkarni, G.S.; Kore, S.V.; Tech, M.; Kore, S.V.S. Aerobic Sequencing Batch Reactor for Wastewater Treatment: A Review. Int. J. Eng. Res. Technol. 2013, 2, 534–550. [Google Scholar]
- Helness, H.; ØDegaard, H. Biological Phosphorus Removal in a Sequencing Batch Moving Bed Biofilm Reactor. Water Sci. Technol. 1999, 40, 161–168. [Google Scholar] [CrossRef]
- Obileke, K.C.; Nwokolo, N.; Makaka, G.; Mukumba, P.; Onyeaka, H. Anaerobic Digestion: Technology for Biogas Production as a Source of Renewable Energy—A Review. Energy Environ. 2020, 32, 191–225. [Google Scholar] [CrossRef]
- Chen, Y.; Zhang, H.; Yin, Y.; Zeng, F.; Cui, Z. Smart Energy Savings for Aeration Control in Wastewater Treatment. Energy Rep. 2022, 8, 1711–1721. [Google Scholar] [CrossRef]
- Rocha-Meneses, L.; Zannerni, R.; Inayat, A.; Abdallah, M.; Shanableh, A.; Ghenai, C.; Kamil, M.; Kikas, T. Current Progress in Anaerobic Digestion Reactors and Parameters Optimization. Biomass Convers. Biorefin. 2022, 1, 1–24. [Google Scholar] [CrossRef]
- Zieliński, M.; Kazimierowicz, J.; Dębowski, M. Advantages and Limitations of Anaerobic Wastewater Treatment—Technological Basics, Development Directions, and Technological Innovations. Energies 2022, 16, 83. [Google Scholar] [CrossRef]
- Liang, T.; Elmaadawy, K.; Liu, B.; Hu, J.; Hou, H.; Yang, J. Anaerobic Fermentation of Waste Activated Sludge for Volatile Fatty Acid Production: Recent Updates of Pretreatment Methods and the Potential Effect of Humic and Nutrients Substances. Process Saf. Environ. Prot. 2021, 145, 321–339. [Google Scholar] [CrossRef]
- Ryu, H.D.; Lim, D.Y.; Kim, S.J.; Baek, U.I.; Chung, E.G.; Kim, K.; Lee, J.K. Struvite Precipitation for Sustainable Recovery of Nitrogen and Phosphorus from Anaerobic Digestion Effluents of Swine Manure. Sustainability 2020, 12, 8574. [Google Scholar] [CrossRef]
- Wu, D.; Li, L.; Peng, Y.; Yang, P.; Peng, X.; Sun, Y.; Wang, X. State Indicators of Anaerobic Digestion: A Critical Review on Process Monitoring and Diagnosis. Renew. Sustain. Energy Rev. 2021, 148, 111260. [Google Scholar] [CrossRef]
- Niu, C.; Pan, Y.; Lu, X.; Wang, S.; Zhang, Z.; Zheng, C.; Tan, Y.; Zhen, G.; Zhao, Y.; Li, Y.Y. Mesophilic Anaerobic Digestion of Thermally Hydrolyzed Sludge in Anaerobic Membrane Bioreactor: Long-Term Performance, Microbial Community Dynamics and Membrane Fouling Mitigation. J. Memb. Sci. 2020, 612, 118264. [Google Scholar] [CrossRef]
- Mooiman, C.; Bouwknegt, J.; Dekker, W.J.C.; Wiersma, S.J.; Ortiz-Merino, R.A.; De Hulster, E.; Pronk, J.T. Critical Parameters and Procedures for Anaerobic Cultivation of Yeasts in Bioreactors and Anaerobic Chambers. FEMS Yeast Res. 2021, 21, 35. [Google Scholar] [CrossRef] [PubMed]
- de Vleeschauwer, F.; Caluwé, M.; Dobbeleers, T.; Stes, H.; Dockx, L.; Kiekens, F.; Copot, C.; Dries, J. A Dynamically Controlled Anaerobic/Aerobic Granular Sludge Reactor Efficiently Treats Brewery/Bottling Wastewater. Water Sci. Technol. 2021, 84, 3515–3527. [Google Scholar] [CrossRef] [PubMed]
- Kathawala, T.M.; Gayathri, K.V.; Senthil Kumar, P. A Performance Comparison of Anaerobic and an Integrated Anaerobic-Aerobic Biological Reactor System for the Effective Treatment of Textile Wastewater. Int. J. Chem. Eng. 2021, 2021, 8894332. [Google Scholar] [CrossRef]
- Wang, X.; Dürr, V.; Guenne, A.; Mazéas, L.; Chapleur, O. Generic Role of Zeolite in Enhancing Anaerobic Digestion and Mitigating Diverse Inhibitions: Insights from Degradation Performance and Microbial Characteristics. J. Environ. Manag. 2024, 356, 120676. [Google Scholar] [CrossRef] [PubMed]
- Xu, Y.; Lu, Y.; Zheng, L.; Wang, Z.; Dai, X. Perspective on Enhancing the Anaerobic Digestion of Waste Activated Sludge. J. Hazard. Mater. 2020, 389, 121847. [Google Scholar] [CrossRef] [PubMed]
- Dębowski, M.; Zieliński, M.; Kazimierowicz, J. Anaerobic Reactor Filling for Phosphorus Removal by Metal Dissolution Method. Materials 2022, 15, 2263. [Google Scholar] [CrossRef]
- Dębowski, M.; Zieliński, M. Technological Effectiveness of Sugar-Industry Effluent Methane Fermentation in a Fluidized Active Filling Reactor (FAF-R). Energies 2020, 13, 6626. [Google Scholar] [CrossRef]
- di Biase, A.; Devlin, T.R.; Kowalski, M.S.; Oleszkiewicz, J.A. Performance and Design Considerations for an Anaerobic Moving Bed Biofilm Reactor Treating Brewery Wastewater: Impact of Surface Area Loading Rate and Temperature. J. Environ. Manag. 2018, 216, 392–398. [Google Scholar] [CrossRef]
- Bressani-Ribeiro, T.; Chernicharo, C.A.L.; Lobato, L.C.S.; Neves, P.N.P. Design of UASB Reactors for Sewage Treatment. In Anaerobic Reactors for Sewage Treatment: Design, Construction and Operation; IWA Publishing: London, UK, 2019; pp. 56–111. [Google Scholar] [CrossRef]
- Vítězová, M.; Kohoutová, A.; Vítěz, T.; Hanišáková, N.; Kushkevych, I. Methanogenic Microorganisms in Industrial Wastewater Anaerobic Treatment. Processes 2020, 8, 1546. [Google Scholar] [CrossRef]
- Gutu, L.; Basitere, M.; Harding, T.; Ikumi, D.; Njoya, M.; Gaszynski, C. Multi-Integrated Systems for Treatment of Abattoir Wastewater: A Review. Water 2021, 13, 2462. [Google Scholar] [CrossRef]
- Iribarnegaray, M.A.; Rodriguez-Alvarez, M.S.; Moraña, L.B.; Tejerina, W.A.; Seghezzo, L. Management Challenges for a More Decentralized Treatment and Reuse of Domestic Wastewater in Metropolitan Areas. J. Water Sanit. Hyg. Dev. 2018, 8, 113–122. [Google Scholar] [CrossRef]
- Dutta, A.; Davies, C.; Ikumi, D.S. Performance of Upflow Anaerobic Sludge Blanket (UASB) Reactor and Other Anaerobic Reactor Configurations for Wastewater Treatment: A Comparative Review and Critical Updates. J. Water Supply Res. Technol. 2018, 67, 858–884. [Google Scholar] [CrossRef]
- Dias, D.F.C.; Passos, R.G.; Rodrigues, V.A.J.; de Matos, M.P.; Santos, C.R.S.; von Sperling, M. Performance Evaluation of a Natural Treatment System for Small Communities, Composed of a UASB Reactor, Maturation Ponds (Baffled and Unbaffled) and a Granular Rock Filter in Series. Environ. Technol. 2018, 39, 490–502. [Google Scholar] [CrossRef] [PubMed]
- Wang, K.M.; Soares, A.; Jefferson, B.; Wang, H.Y.; Zhang, L.J.; Jiang, S.F.; McAdam, E.J. Establishing the Mechanisms Underpinning Solids Breakthrough in UASB Configured Anaerobic Membrane Bioreactors to Mitigate Fouling. Water Res. 2020, 176, 115754. [Google Scholar] [CrossRef]
- Monballiu, A.; Desmidt, E.; Ghyselbrecht, K.; Meesschaert, B. Phosphate Recovery as Hydroxyapatite from Nitrified UASB Effluent at Neutral PH in a CSTR. J. Environ. Chem. Eng. 2018, 6, 4413–4422. [Google Scholar] [CrossRef]
- Aqaneghad, M.; Moussavi, G.; Ghanbari, R. Anaerobic Baffled Reactor and Hybrid Anaerobic Baffled Reactor Performances Evaluation in Municipal Wastewater Treatment. Iran. J. Health Saf. Environ. 2018, 5, 1027–1034. [Google Scholar]
- Menzel, T.; Neubauer, P.; Junne, S. Role of Microbial Hydrolysis in Anaerobic Digestion. Energies 2020, 13, 5555. [Google Scholar] [CrossRef]
- Zieliński, M.; Dębowski, M.; Kazimierowicz, J. Performance of an Innovative Low-Cost Recycled Filling (LCRF) in Anaerobic Treatment of Dairy Effluent—A Pilot-Scale Study. Materials 2022, 15, 7815. [Google Scholar] [CrossRef] [PubMed]
- Dębowski, M.; Kisielewska, M.; Kazimierowicz, J.; Zieliński, M. Methane Production from Confectionery Wastewater Treated in the Anaerobic Labyrinth-Flow Bioreactor. Energies 2023, 16, 571. [Google Scholar] [CrossRef]
- PN-EN ISO 5815-1:2019-12; Determination of Biochemical Oxygen Demand after n Days (BODn). Th. 1. Dilution and Inoculation Method with the Addition of Allylthiourea. Health, Environment and Medicine Sector. Technical Body of Water Quality—Chemical Research—Organic Substances: Warsaw, Poland, 2019.
- PN-C-04573-01:1986; Determination of the Total Content of Organic Substances Extractable with Petroleum Ether by Weight Method. Polish Standardization Committee: Warsaw, Poland, 1986.
- Barrera, E.L.; Spanjers, H.; Romero, O.; Rosa, E.; Dewulf, J. A Successful Strategy for Start-upof a Laboratory-Scale UASB Reactor Treating Sulfate-Rich Sugar Cane Vinasse. J. Chem. Technol. Biotechnol. 2020, 95, 205–212. [Google Scholar] [CrossRef]
- Hampannavar, U.S.; Shivayogimath, C.B. Anaerobic Treatment of Sugar Industry Wastewater by Upflow Anaerobic Sludge Blanket Reactor at Ambient Temperature. Int. J. Environ. Sci. 2010, 1, 631–639. [Google Scholar]
- Beal, L.J.; Raman, D.R. Sequential Two-Stage Anaerobic Treatment of Confectionery Wastewater. J. Agric. Eng. Res. 2000, 76, 211–217. [Google Scholar] [CrossRef]
- Grahovac, J.; Rončević, Z. Environmental Impacts of the Confectionary Industry. In Environmental Impact of Agro-Food Industry and Food Consumption; Academic Press: Cambridge, MA, USA, 2021; pp. 189–216. [Google Scholar] [CrossRef]
- Alcaraz-Ibarra, S.; Mier-Quiroga, M.A.; Esparza-Soto, M.; Lucero-Chávez, M.; Fall, C. Treatment of Chocolate-Processing Industry Wastewater in a Low-Temperature Pilot-Scale UASB: Reactor Performance and in-Situ Biogas Use for Bioenergy Recovery. Biomass Bioenergy 2020, 142, 105786. [Google Scholar] [CrossRef]
- Stazi, V.; Tomei, M.C. Enhancing Anaerobic Treatment of Domestic Wastewater: State of the Art, Innovative Technologies and Future Perspectives. Sci. Total Environ. 2018, 635, 78–91. [Google Scholar] [CrossRef]
- Doelle, K.; Dölle, K.; Hughes, T.; Kurzmann, D.E. From Fossil Fuels to Renewable Biogas Production from Biomass Based Feedstock-A Review of Anaerobic Digester Systems. Artic. J. Energy Res. Rev. 2020, 5, 1–37. [Google Scholar] [CrossRef]
- Aziz, A.; Basheer, F.; Sengar, A.; Irfanullah; Khan, S.U.; Farooqi, I.H. Biological Wastewater Treatment (Anaerobic-Aerobic) Technologies for Safe Discharge of Treated Slaughterhouse and Meat Processing Wastewater. Sci. Total Environ. 2019, 686, 681–708. [Google Scholar] [CrossRef]
- Huang, J.; Zhou, Z.; Zheng, Y.; Sun, X.; Yu, S.; Zhao, X.; Yang, A.; Wu, C.; Wang, Z. Biological Nutrient Removal in the Anaerobic Side-Stream Reactor Coupled Membrane Bioreactors for Sludge Reduction. Bioresour. Technol. 2020, 295, 122241. [Google Scholar] [CrossRef]
- Lohani, S.P.; Khanal, S.N.; Bakke, R. A Simple Anaerobic and Filtration Combined System for Domestic Wastewater Treatment. Water-Energy Nexus 2020, 3, 41–45. [Google Scholar] [CrossRef]
- Farhadian, M.; Borghei, M.; Umrania, V.V. Treatment of Beet Sugar Wastewater by UAFB Bioprocess. Bioresour. Technol. 2007, 98, 3080–3083. [Google Scholar] [CrossRef] [PubMed]
- Tanksali, A.S. Treatment of Sugar Industry Wastewater by Upflow Anaerobic Sludge Blanket Reactor. Int. J. ChemTech Res. 2013, 5, 1246–1253. [Google Scholar]
- Dareioti, M.A.; Vavouraki, A.I.; Tsigkou, K.; Kornaros, M. Assessment of Single- vs. Two-Stage Process for the Anaerobic Digestion of Liquid Cow Manure and Cheese Whey. Energies 2021, 14, 5423. [Google Scholar] [CrossRef]
- Lima, V.d.O.; de Barros, V.G.; Duda, R.M.; de Oliveira, R.A. Anaerobic Digestion of Vinasse and Water Treatment Plant Sludge Increases Methane Production and Stability of UASB Reactors. J. Environ. Manag. 2023, 327, 116451. [Google Scholar] [CrossRef] [PubMed]
- Zieliński, M.; Dębowski, M.; Krzemieniewski, M.; Brudniak, A.; Kisielewska, M. Possibility of Improving Technological Effectiveness of Dairy Wastewater Treatment through Application of Active Fillings and Microwave Radiation. J. Water Chem. Technol. 2016, 38, 342–348. [Google Scholar] [CrossRef]
- Dębowski, M.; Zieliński, M.; Kisielewska, M.; Krzemieniewski, M.; Makowska, M.; Grądkowski, M.; Tor-Świątek, A. Simulated Dairy Wastewater Treatment in a Pilot Plant Scale Magneto-Active Hybrid Anaerobic Biofilm Reactor (MA-HABR). Braz. Soc. Chem. Eng. 2018, 35, 553–562. [Google Scholar] [CrossRef]
- Patel, P.; Desai, M.; Madamwar, D. Biomethanation of Cheese Whey Using Anaerobic Upflow Fixed Film Reactor. J. Ferment. Bioeng. 1995, 79, 398–399. [Google Scholar] [CrossRef]
- Yaakob, M.A.; Mohamed, R.M.S.R.; Al-Gheethi, A.; Ravishankar, G.A.; Ambati, R.R. Influence of Nitrogen and Phosphorus on Microalgal Growth, Biomass, Lipid, and Fatty Acid Production: An Overview. Cells 2021, 10, 393. [Google Scholar] [CrossRef]
- Czatzkowska, M.; Harnisz, M.; Korzeniewska, E.; Koniuszewska, I. Inhibitors of the Methane Fermentation Process with Particular Emphasis on the Microbiological Aspect: A Review. Energy Sci. Eng. 2020, 8, 1880–1897. [Google Scholar] [CrossRef]
- Schütze, E.; Gypser, S.; Freese, D. Kinetics of Phosphorus Release from Vivianite, Hydroxyapatite, and Bone Char Influenced by Organic and Inorganic Compounds. Soil. Syst. 2020, 4, 15. [Google Scholar] [CrossRef]
- Wysocka, I.; Krzemieniewski, M. The Effects of Total Phosphorus and Orthophosphates Removal with the Method of Metals Solubilisation on Steel, Aluminum, and Mixed Media. Pol. J. Nat. Sci. 2007, 22, 307–316. [Google Scholar] [CrossRef]
- Rodrigues, R.; Gaboreau, S.; Gance, J.; Ignatiadis, I.; Betelu, S. Reinforced Concrete Structures: A Review of Corrosion Mechanisms and Advances in Electrical Methods for Corrosion Monitoring. Constr. Build. Mater. 2021, 269, 121240. [Google Scholar] [CrossRef]
- Sun, G.; Zhang, Y.; Gao, Y.; Han, X.; Yang, M. Removal of Hard COD from Biological Effluent of Coking Wastewater Using Synchronized Oxidation-Adsorption Technology: Performance, Mechanism, and Full-Scale Application. Water Res. 2020, 173, 115517. [Google Scholar] [CrossRef] [PubMed]
- Khandaker, N.R.; Afreen, I.; Diba, D.S.; Huq, F.B.; Akter, T. Treatment of Textile Wastewater Using Calcium Hypochlorite Oxidation Followed by Waste Iron Rust Aided Rapid Filtration for Color and COD Removal for Application in Resources Challenged Bangladesh. Groundw. Sustain. Dev. 2020, 10, 100342. [Google Scholar] [CrossRef]
- Shahmahdi, N.; Dehghanzadeh, R.; Aslani, H.; Bakht Shokouhi, S. Performance Evaluation of Waste Iron Shavings (Fe0) for Catalytic Ozonation in Removal of Sulfamethoxazole from Municipal Wastewater Treatment Plant Effluent in a Batch Mode Pilot Plant. Chem. Eng. J. 2020, 383, 123093. [Google Scholar] [CrossRef]
- Wysocka, I.; Ładuch, W. Orthophosphates Removal from Synthetic Sewage with Low PH Using the Electrocoagulation and the Metal Digestion Method. Annu. Set. Environ. Prot. 2012, 14, 790–799. [Google Scholar]
- Zielińska, M.; Zieliński, M.; Dębowski, M. Organic Compounds and Phosphorus Removal from Dairy Wastewater by Biofilm on Iron-Containing Supports. J. Environ. Eng. 2017, 144, 04017087. [Google Scholar] [CrossRef]
- Kisielewska, M.; Dȩbowski, M.; Zieliński, M.; Krzemieniewski, M. Enhancement of Dairy Wastewater Treatment in a Combined Anaerobic Baffled and Biofilm Reactor with Magneto-Active Packing Media. J. Ecol. Eng. 2018, 19, 165–171. [Google Scholar] [CrossRef]
- You, G.; Wang, C.; Hou, J.; Wang, P.; Xu, Y.; Miao, L.; Liu, J. Effects of Zero Valent Iron on Nitrate Removal in Anaerobic Bioreactor with Various Carbon-to-Nitrate Ratios: Bio-Electrochemical Properties, Energy Regulation Strategies and Biological Response Mechanisms. Chem. Eng. J. 2021, 419, 129646. [Google Scholar] [CrossRef]
- Kabeyi, M.J.B.; Olanrewaju, O.A. Biogas Production and Applications in the Sustainable Energy Transition. J. Energy 2022, 2022, 8750221. [Google Scholar] [CrossRef]
- Ahmed, S.F.; Mofijur, M.; Tarannum, K.; Chowdhury, A.T.; Rafa, N.; Nuzhat, S.; Kumar, P.S.; Vo, D.V.N.; Lichtfouse, E.; Mahlia, T.M.I. Biogas Upgrading, Economy and Utilization: A Review. Environ. Chem. Lett. 2021, 19, 4137–4164. [Google Scholar] [CrossRef]
- Parker, W.; Celmer-Repin, D.; Bicudo, J.; Law, P. Assessment of the Use of Mainstream Iron Addition for Phosphorous Control on H2S Content of Biogas from Anaerobic Digestion of Sludges. Water Environ. Res. 2020, 92, 338–346. [Google Scholar] [CrossRef] [PubMed]
- Zhang, Y.; Jing, Y.; Quan, X.; Liu, Y.; Onu, P. A Built-in Zero Valent Iron Anaerobic Reactor to Enhance Treatment of Azo Dye Wastewater. Water Sci. Technol. 2011, 63, 741–746. [Google Scholar] [CrossRef]
- Nkuna, R.; Roopnarain, A.; Rashama, C.; Adeleke, R. Insights into Organic Loading Rates of Anaerobic Digestion for Biogas Production: A Review. Crit. Rev. Biotechnol. 2022, 42, 487–507. [Google Scholar] [CrossRef]
Disclaimer/Publisher’s Note: The statements, opinions and data contained in all publications are solely those of the individual author(s) and contributor(s) and not of MDPI and/or the editor(s). MDPI and/or the editor(s) disclaim responsibility for any injury to people or property resulting from any ideas, methods, instructions or products referred to in the content. |
© 2024 by the authors. Licensee MDPI, Basel, Switzerland. This article is an open access article distributed under the terms and conditions of the Creative Commons Attribution (CC BY) license (https://creativecommons.org/licenses/by/4.0/).