Abstract
The design and performance of a shallow geothermal system is influenced by the geological and hydrogeological context, environmental conditions and thermal demand loads. In order to preserve the natural thermal resource, it is crucial to have a balance between the supply and the demand for the renewable energy. In this context, this article presents a case study where an innovative system is created for the storage of seasonal solar thermal energy underground, exploiting geotechnical micropiles technology. The new geoprobes system (energy micropile; EmP) consists of the installation of coaxial geothermal probes within existing micropiles realized for the seismic requalification of buildings. The underground geothermal system has been realized, starting from the basement of an existing holiday home Condominium, and was installed in dry subsoil, 20 m-deep below the parking floor. The building consists of 140 apartments, with a total area of 5553 m2, and is located at an altitude of about 1490 m above sea level. Within the framework of a circular economy, energy saving and the use of renewable sources, the design of the geothermal system was based on geological, hydrogeological and thermophysical analytical studies, in situ measurements (e.g., Lefranc and Lugeon test during drilling; Rock Quality Designation index; thermal response tests; acquisition of temperature data along the borehole), numerical modelling and long-term simulations. Due to the strong energy imbalance of the demand from the building (heating only), and in order to optimize the underground annual balance, both solar thermal storage and geothermal heat extraction/injection to/from a field of 380 EmPs, with a relative distance varying from 1 to 2 m, were adopted. The integrated solution, resulting from this investigation, allowed us to overcome the standard barriers of similar geological settings, such as the lack of groundwater for shallow geothermal energy exploitation, the lack of space for borehole heat exchanger drilling, the waste of solar heat during the warm season, etc., and it can pave the way for similar renewable and low carbon emission hybrid applications as well as contribute to the creation of smart buildings/urban areas.
1. Introduction
In recent years, due to the continuous growth in energy demand, environmental problems (e.g., air pollution) and energy issues are at the heart of the political, economic, and environmental debate. Reducing the consumption of traditional fossil fuels and the effective use of renewable energy are necessary paths towards a sustainable energy system [1,2].
In Europe, 85% of buildings were constructed before 2000 and amongst those, 75% have poor energy performance. On the other hand, the buildings sector represents the single largest energy consumer in Europe. Indeed, buildings still account for 42% of the energy consumption (2021 data), and about 36% of the greenhouse gas emissions [3,4]. Also, about 80% of the energy used in households is for heating, cooling and hot water.
According the directive (EU) 2023/2413 of the European Parliament and of Council [5] (Article 15b; Mapping of areas necessary for national contributions towards the overall Union renewable energy target for 2030) ‘by 21 May 2025, Member States shall carry out a coordinated mapping for the deployment of renewable energy in their territory to identify the domestic potential and the available land surface, sub-surface, sea or inland water areas that are necessary for the installation of renewable energy plants and their related infrastructure, such as grid and storage facilities, including thermal storage, that are required in order to meet at least their national contributions towards the overall Union renewable energy target for 2030′.
Moreover, European regulations (e.g., [6]) promote the improvement of energy performance in buildings, developing the concept of nearly Zero Energy Building (nZEB), i.e., a building that has a very high energy performance and that should obtain the necessary energy from renewable sources.
In this context, solar energy and surface geothermal energy, both renewable energy resources, could contribute to achieving these goals (e.g., [7]). However, solar thermal energy represents a discontinuous and poor source in the winter months when the peak production hours commonly do not coincide with the demand of thermal energy in the buildings. Borehole heat exchangers (BHEs), which are usually installed in the ground to exploit surface geothermal energy, if properly designed, could be used for the temporary storage of long-term thermal energy underground (Borehole Thermal Energy Storage, BTES), such as, for example, solar or waste heat. The depth of BHEs usually varies from 50 to 150/200 m below ground level, depending on energy needs, available space and soil conditions. In fact, shallow geothermal exploitation is strongly affected by the thermal [8] and hydraulic properties of ground layers and the presence of aquifers [9]. Most rocks and saturated sediments have rather high volumetric heat capacities, typically around 2 MJ/(m3·K). For comparison, the water volumetric heat capacity is 4.19 MJ/(m3·K). Because of these high values, solid portions of the underground in general, and especially those containing water, can be used for thermal storage. For the use of heat extraction alone or BTES, the system becomes both environmentally and economically hardly sustainable in subsoils lacking groundwater, as circulating water could largely contribute to heat transfer [10]. In this case, and considering very low hydraulic gradients, the heat transfer fluid circulating in the BHEs exchanges heat with the surrounding rock mass or sediment mainly through heat conduction. A solution to reduce the installation costs of geothermal probes is represented by integrating the heat exchangers in the foundation piles, commonly referred to as “energy piles” (EP) [11]. Energy piles are deep foundations that function as both load support and heat exchangers between the ground and an overlying structure. In this way, the drilling costs for the geothermal plant are almost offset, as they are included in the initial investment of a standard building. Due to the construction needs, such EPs are generally short (10–20 m), and they normally work in the absence of groundwater circulation. Mohamad et al. [12], in a review study, analyzed the thermal and thermomechanical behaviors of energy piles and proposed the adoption of the so-called 4E evaluation criteria (energy, exergy, economy and environment) to ensure the safety of the foundation under cyclic thermal loads. Therefore, sometimes, EPs can represent valid solutions for storing solar heat in dry soils, with minimum additional investment [13].
In this context, it must be considered that the choice of a geoexchange system is strongly influenced by the site-specific conditions of the underground, in terms of lithological and mineralogical composition, saturation degree and groundwater flow. The subsoil is often, on both a horizontal and vertical scale, highly heterogeneous with compositional variations even at a decametric distance.
Moreover, it should be noted that large areas of the Mediterranean basin, due to its geodynamic position, are highly vulnerable from a seismic point of view and most of the old buildings are not designed to withstand seismic forces. Therefore, the seismic vulnerability assessment of the structures in areas with high seismic hazard is essential for their conservation. In this framework, during the last few decades, the seismic engineering design largely used the micropiles technology. In the 1950s, the Italian F. Lizzi [14] developed a technical solution consisting of small diameter, vertical or inclined, micropiles, used to provide additional resistance to the existing foundation and/or soil, called the “root piles” (“pali radice”). The International Micropile Association defines the micropile as ‘a small-diameter, non-displacement pile constructed by bored and cast-in-place and usually contains reinforcements’ [15]. From a technical point of view, the diameter of the micropiles is typically less than 300 mm and they are generally built out of steel (currently standard of references: EN 14199:2015; [16]), using drilling and/or pressure small diameter cast-in-place piles or inserted piles constructed using grouting technology.
Therefore, the geotechnical micropiles technology is used as a repair solution, for increasing the foundation capacity of an existing building (due to limited working spaces), thereby reducing its seismic vulnerability in terms of improving behavior with seismic wave solicitations. Also, micropiles are easy to install in areas with restrictions, such as limited access areas, those with limitations on vibrations, and difficult soil conditions. Moreover, after the Kobe earthquake (Japan, 1995), it was verified that micropiles can also be beneficial for the superstructure during the earthquake, and it started to be conceived as a foundation system [17,18,19,20,21].
In particular, the implementation of micropiles in karst terrain involves the combination of two complex systems like drilling and grouting with advanced tools. In complex geological contexts, for example, Taylor et al. [22] verified the high capacity of micropiles under karstic geological conditions and proposed universally applicable recommendations; while Bivens and Siegel [23] illustrate that micropiles can be very effective, considering both time and money, when the installation approach and quality controls are tailored to the project conditions.
Major Objectives
The objective of the research project is to transform an already existing building into an energetically autonomous building through the use of renewable energy sources; moreover, it can contribute to reducing atmospheric emissions to almost zero, in accordance with the guidelines of the European Green Deal [24]. The case study building is located in northern Italy, in a protected area, at an altitude of 1400 m above sea level, and therefore it only needs to be heated in the period between autumn and early spring. The building under investigation is a Condominium consisting of 140 apartments distributed in three floors, corresponding to a total area of 5553 m2. The building is equipped with an underground garage.
To ensure the energy needs of the building, in a very preliminary planning stage, the following was assumed:
- (a)
- the winter heating energy requirement had to be satisfied by designing a low enthalpy geothermal system (‘stable renewable resource’) consisting of double U probes, each 150 m deep, at an equidistance of 8 m from each other and in a rectangular geometry; the geometric characteristics of the layout were conditioned by the logistics of the area surrounding the building;
- (b)
- the electrical energy devoted to feeding the geothermal heat pump had to be provided by the installation of photovoltaic panels on the roof of the building.
However, subsequent site-specific analyses of the subsoil have highlighted that the geology of the area is highly heterogeneous and also contains several small karstic cavities sparse within the limestone formations within the uppermost 20 m. This geological evidence forced the planners to abandon the initial project idea due to the technical difficulties inherent in the drilling and cementing of the BHEs across the cavities and the consequent excessive costs that this would have incurred. Furthermore, the competent local authorities would have not authorized the installation of the BHEs in the case of large cavities crossed during the drilling phase; the reason being the possible negative impact on the local hydrogeological conditions. Once the solution of the BHEs was discarded, a solar thermal plant was hypothesized. However, considering the altitude, the climatic conditions and the surface of the roof, the production of thermal energy by means of a solar thermal system would have not been sufficient to cover the building’s thermal energy needs in the winter months.
Based on the Italian seismic hazard map [25], the area of interest is classified as class 2 on a scale from 1 (high) to 4 (low). Accordingly, the structural analysis highlighted that the Condominium, built in the 1970s, did require a seismic retrofit. So, engineers planned to design numerous 20 m-deep geotechnical micropiles to be installed in the floor of the underground garage. As a consequence, the distances between the micropiles and their position were strongly conditioned by the elaborated seismic design.
Following the addition of the geotechnical micropiles in the whole project and in line with the principles of the circular economy, the original energy supply project has been deeply modified by exploiting the micropiles as geothermal probes, transforming them into energy micropiles (EmP). Due to the shallow depth of the EmP, the new geothermal solution has thus been implemented together with a solar thermal system. In this way, the thermal energy produced by the solar thermal panels during the summer period is transferred and accumulated in the underground through the same system of EmP, while the stored energy is then extracted for use in space heating during the energetically demanding winter season.
In this framework, the main objective of this research was to optimize the underground balance using both solar thermal storage and geothermal heat extraction within/from a field of EmP, trying to counteract the strong energy imbalance of the demand from the building (heating only). Also noteworthy are the specific climatic conditions (1400 m altitude), the high geological heterogeneity and the hydrogeological interaction with the unsaturated zone. In particular, the present scientific contribution describes and discusses the methods adopted to allow for the creation of an energy system which has proved to be sustainable from an environmental, economic and social point of view, through the efficient integration of renewable energies.
2. Materials and Methods
This section describes the case study, the building characteristics and the energy needs, the climatic conditions, the geological and hydrogeological setting obtained from continuous core drilling, hydraulic tests, thermal response tests, and the underground temperature log.
2.1. The Case Study
From a geographical point of view, the residential building complex that includes the Condominium discussed in the present paper, is located at a locality called ‘Malga di San Giorgio’ in the central area of the Lessinia plateau, northern Italy, at an altitude of about 1490 m. In particular, the case study is represented by the southwestern building shown in the inset of Figure 1 (Condominium; yellow rectangle).
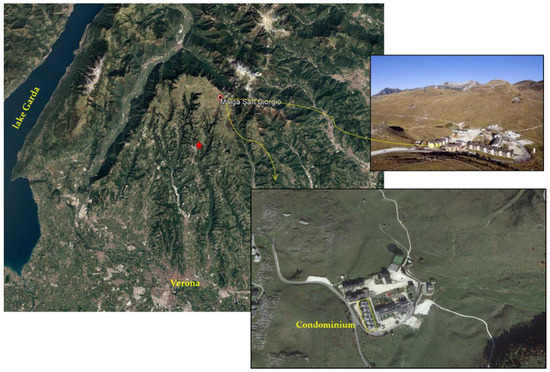
Figure 1.
Location of the case study at the center of the Lessinia plateau, north Italy, and of the Bosco Chiesanuova climatic station (red asterisk). On the right, perspective and aerial views of the residential complex.
The oldest historical testimonies in the area date back to the 11th century, when the Cimbri, an ancient population of Bavarian-German Tyrolean origin, settled in Lessinia [26]. The landscape is composed by anthropogenic features (alpine pasture areas with stone construction, stables, dirt roads and stone fences) and natural elements (woods, pastures), well integrated with each other. Thanks to this unique landscape, Lessinia also has a marked tourist vocation, both in summer and in winter seasons.
In the 1970s, the ski sector had been strongly developed, and this led to the installation of some ski-lifts more or less contemporaneously with the construction of the settlement of San Giorgio, consisting of 7 mainly residential buildings, forming the San Giorgio building complex. This small, urbanized area falls within the central sector of the Lessinia Regional Natural Park, and is located just outside the perimeter of the Natura 2000 network, at a distance of only 175 m from the protected area of “Monti Lessini—Pasubio—Piccole Dolomiti Vicentine” (IT3210040; established date: May 1995).
On average, about 56,000 L of diesel were used to heat this specific building each year (about 101 kWh/(m2 a)), emitting about 147.5 tons of CO2 into the atmosphere (reference value: 3.155 kgCO2/kg diesel) and contributing to over 23% of the total emissions of the whole Malga San Giorgio complex.
2.2. Bulding Energy Needs
From an energy point of view, the monthly load distribution (heating and domestic hot water) is represented in Figure 2. The building only needs heating, and the greatest annual energy demand is concentrated from November to March (79.5% of the total) while in the months of April and October it decreases significantly (11.5% of the total energy). In the summer period, thermal energy is used exclusively to produce domestic hot water, representing the remaining 9% of the energy consumed on an annual scale.
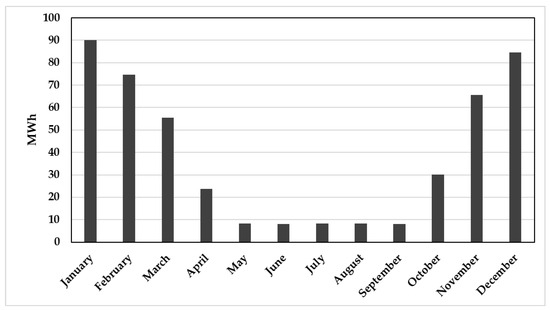
Figure 2.
Monthly distribution of the energy loads (heating and domestic hot water).
2.3. Air Temperature Data
In the absence of a climatic station at the specific site, the estimate of the air temperature distribution during the year is based on the temperature data (2 m high from the ground level) of the climatic station at Bosco Chiesanuova ([27]; red asterisk in Figure 1). The station is located south-southwest of the test site and at an altitude of 1106 m.
In particular, the monthly minimum, maximum and average temperature data relative to the period 2000–2020 were thus analyzed for estimating the temperature at the investigated test area (Figure 3). The temperature values of the reference station were corrected, applying the equation that takes into account the altitude difference [28]:
where T is the air temperature (°C) and h is the altitude (m), while indexes sg and r indicate the considered location and the reference climatic station, respectively; d is the correction factor which expresses the vertical gradient of air temperature (0.005618 °C/m).
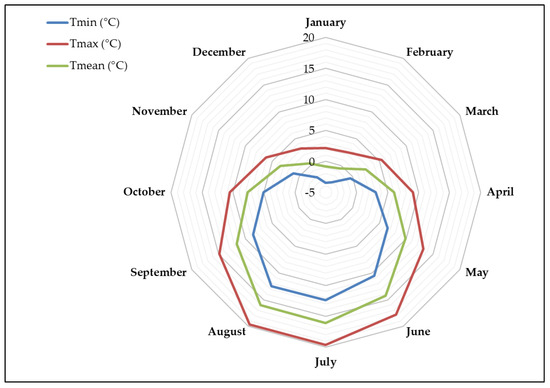
Figure 3.
Distribution of average monthly minimum (Tmin), maximum (Tmax) and mean (Tmean) air temperatures (°C) over the period 2000 to 2020.
Based on the corrected temperature data, estimated for the test area, the coldest months of the year are December, January, and February, with an average mean air temperature of +0.35, −0.80 and −0.51 °C and minimum values of −2.17, −3.48 and −3.11 °C, respectively. The hottest months are July and August with mean values of 16.3 °C and 16.05 °C, respectively. In 2010, which was the coldest year of the observation period, the maximum monthly air temperature remained below or near the freezing point for three consecutive months, from December to February.
Finally, in the observation period, an average annual temperature of +7.1 °C was calculated, with a yearly temperature wave amplitude of 8.5 °C.
2.4. Geological and Hydrogeological Investigation
From a hydrological point of view, the investigated area is located at the outlet (closure) point of a minor hydrographic basin with an extension of approximately 6 km2 (dashed line in Figure 4). Within the basin, it is possible to distinguish the presence of two valleys of fluvio-glacial origin (Valle di San Giorgio and Vallon del Malera). Although the forms of the landscape document the existence of a paleo hydrographic system, there is currently no apparent surface water flow (i.e., runoff), not even after important rainy events or periods. In this regard, an example is represented by the 350 mm of precipitation that fell in just 14 days in July 2014 without any consequence.
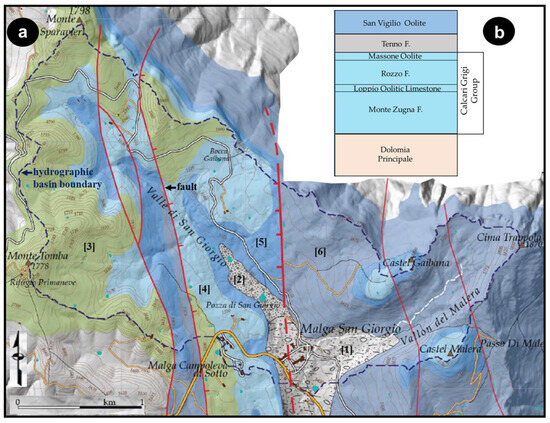
Figure 4.
(a) Simplified geological map of the broader investigated area (from [29,30]); [1] moraine materials; [2] proglacial colluvial deposits; [3] Majolica F.; [4] Rosso Ammonitico F.; [5] San Vigilio Oolite F.; [6] Calcari Grigi Group; (b) Simplified stratigraphic succession of the outcropping lithologies [29].
In general, the average annual precipitation averaged over twenty years (2000–2020) is 1400 mm with oscillations between 1006 (2015) and 2300 (2014) mm. The rainiest months are May, October, and November. The low temperatures of these months (average values less than 10 °C) and the absence of surface runoff favor the almost total infiltration of rainwater into the underground, as will be seen in more detail below.
From a geological point of view, the Lessini Mountains consist of a stratigraphic succession (about 1800 m thick) of mainly carbonate rocks deposited within a platform-basin system between Late Triassic and Middle Miocene (from 225 to 11 Ma). In the bottom of the basin, there are Quaternary deposits mainly of glacial origin. Abundant moraine materials descend from the Vallon del Malera ([1] in Figure 4), probably attributed to the last glacial retreat phase, while the San Giorgio Valley is mainly covered by proglacial colluvial deposits [2]. Locally, the presence of abundant fine matrix (silty/clayey) typical of both glacial and periglacial deposits decreases the permeability of the surficial deposits and facilitates the formation of small ponds.
Pre-Quaternary Deposits, from the most recent to the oldest are: Majolica (Barremian–Berriasian; [3]); Rosso Ammonitico Veronese (upper Bajocian–Lower Tithonian; [4]); San Vigilio Oolite (Jupper Toarcian–Aalenian; [5]); the Calcari Grigi Group ([6]), and these are subdivided into four lithostratigraphic units with similar internal macro-characteristics, such as (from Lower Jurassic to Pliensbachian) the Monte Zugna Formation, the Loppio Oolite limestone, the Rotzo Formation (upper Sinemurian–Pliensbachian) and the Massone Oolite Formation. The facies of the Rotzo unit is characterized by abundant plant remains and extensive banks of Lithiotis ostriformes deposited in a predominantly subtidal environment. Lithiotis is probably the most representative and famous fossil found in the Calcari Grigi.
The Malga San Giorgio residential complex stands on top of the Quaternary deposits, while the surrounded outcropping lithologies belong to the Jurassic–Cretaceous interval of the carbonate succession (Figure 4; [29,30,31,32,33]). Considering the complex geological structure and in the absence of direct subsoil data, a continuous core drilling was carried out to identify the lithological, hydraulic, and undisturbed ground temperature parameters. The core had a diameter of 101 mm and reached a depth of 120 m. For logistic reasons, the survey was carried out at a distance of 100 m from the building focused on in this research.
In-Hole Measurements
In order to estimate the hydraulic proprieties (hydraulic conductivity) and rock mass quality of the drilled stratigraphic units, in-hole tests were carried out during coring, namely the Lefranc test at variable water levels and in the Quaternary deposits, and Lugeon tests in the bedrock portion, as well as various measurements in the extracted core for calculating the Rock Quality Designation index (RQD).
As concerns the Lefranc test, it is a variable-head method developed to estimate the hydraulic conductivity of the geological formations [34,35,36,37,38]. The test consists of injecting water, using gravity, into a borehole cavity and measuring the subsequent water level decline over time. Percolation occurs through the hole column, filled with clean gravel. The hydraulic conductivity k and shape factor C were calculated by applying the following equations:
where A is the internal cross-section of the borehole; h1 and h2 are the differences in water levels at times t1 and t2; C is a shape factor; and L and D are the length and diameter of the injection hole column, respectively.
The Lugeon borehole test, which is also called a packer test or water pressure test, is an important tool to estimate the average hydraulic conductivity in a rock mass, both in saturated and in vadose (or non saturated) zones and it has been widely applied in hydrogeology and civil engineering (e.g., [39,40,41,42,43]).
After borehole drilling and flushing, water was injected at a constant pressure into each packer isolated section of the boreholes. At the entrance of the borehole, both pressure and flow were measured. The injection pressure increased gradually from the first to the next test only when a quasi-steady state condition was reached for each injection phase. Pressures are increased step-wise up to the maximum pressure and then progressively reduced to the initial pressure.
In the present research, Lugeon tests were conducted at depths of 34 to 59 m isolated by single pneumatic packers; five stages were performed, including the increasing and decreasing of pressure (Table 1); for each step of the test the water injection rate was observed until it was stabilized (generally up to 10 min).

Table 1.
Lugeon test. Pressure magnitudes used for each stage.
The Lugeon values (q) and the hydraulic conductivity (k) conversion for each step was calculated using the following equations [44,45]:
where Q is the flow of water across a section of test hole (L/min); L is the length of the studied segment (m); Pe is the effective pressure in the tested segment (bar); t is the time during which Q is measured (min); r is the radius of the drill hole (m); and k is the hydraulic conductivity (cm/s).
As concerns the Rock Quality Designation (RQD) index, Deere (1963) [46], developed a rock quality description for obtaining a quantitative estimate of the rock mass quality from a core log. This index depends on the degree of jointing or fractures in a rock mass, and is measured as a percentage of the borehole core in a drill run consisting of intact lengths of rock greater than, or equal to, 10 cm. This approach could be expressed as:
High-quality rocks have an RQD of more than 75% (Table 2), while for low-quality ones it is less than 50% due to the presence of discontinuities, like sedimentary layering and/or fractures. The RQD value was determined from the core samples obtained from the exploration drilling at Malga San Giorgio.

Table 2.
RQD classification index.
Based on the mean hydraulic conductivity versus the mean RQD correlation, El-Naqa, 2001 [47], and Jiang et al., 2009 [48], suggest that the mean value of the hydraulic conductivity could be estimated using the mean value of the RQD (%) as directly obtained from borehole data. In this research, in order to estimate the hydraulic conductivity, the following empirical equation (based on a determination coefficient of the regression line of R2 = 0.87) was thus applied [47]:
where k is the hydraulic conductivity in LU, and RQD is the percentage.
2.5. Undisturbed Ground Temperature and Thermal Response Test
The undisturbed ground temperature (UGT) is an important parameter in the design of (a) heat exchanger systems connected to the ground source heat pump; and (b) the temporary (seasonal) storage of thermal energy in the subsoil.
Under natural conditions, with increasing depth, it is commonly possible to distinguish three thermal macrozones that correspond to: (a) the heterothermic zone, influenced especially by the daily variations of the air temperature; (b) the transition zone, where the memory of the seasonal variations in air temperature is still evident, and (c) the homothermic zone, where the temperature, which is called the “undisturbed underground temperature”, remains almost constant throughout the year [49,50].
In order to determine the temperature variations with depth, and the undisturbed temperature of the subsoil at the site, an 80 m-deep borehole was realized in the building’s underground garage. Subsequently, a coaxial closed circuit geothermal exchanger, with an external diameter of 60 mm, was inserted and cemented in the borehole. When the borehole was in thermal equilibrium with its surroundings (25 days later), a temperature logging along the borehole was performed to determine the temperature profile. For the measurement, a temperature sensor (PT100) at the end of an 80 m cable was lowered down the water filled borehole.
Finally, based on the analysis of the previously described data and the adopted geothermal design choices (see chapter 3), a second thermal response test (TRT) was carried out in a 20 m-deep borehole drilled in the underground garage, allowing us to estimate the equivalent thermal conductivity of the ground. The latter borehole was equipped with a coaxial closed circuit geothermal exchanger (external diameter of 60 mm) properly inserted and cemented. The test consists of supplying a constant injected power into the ground with a heat carrier fluid, for a period of time (long enough to reach a steady state heat transfer rate) and recording the fluid inlet (Tin) and outlet (Tout) temperatures at the probe head. Indeed, the slope of the temperature curves (Tin, Tout) becomes stable only after a few hours of testing, and the relationship between the heat transfer rate and the average fluid temperature is approximately linear. To improve the accuracy of the results, the TRT was performed following the general specifications of ASHRAE RP-1118 [51]. The test characteristics are reported in Table 3.

Table 3.
Characteristics of thermal response test.
The analysis of the behavior of the fluid temperature curves versus time allows us to determine the principal thermophysical parameters of the ground in and around the borehole. For the interpretation of the data, the infinite line source model was adopted ([52,53,54,55,56]).
2.6. Numerical Model and Calculation of Stored Heat in the Ground
The software FEFLOW® (version 8) was later used to simulate the behavior of the EmP system and the ground, subjected to the heat loads of the building, and then used to calculate the amount of stored heat in the ground, due to solar thermal injection.
The numerical simulator FEFLOW® (Finite Element Flow Simulator), is a widely used software in the shallow geothermal sector. It is an integrated package including dynamic flow, heat and mass transportation simulation tools. It allows users to create as many layers as necessary and upload database information node by node for each layer. It has specific packages and various dedicated computational methods for single BHEs and BHE fields (linked in many possible configurations), including coaxial types [57,58]. For these reasons, it was considered appropriate for the present research.
Using FEFLOW® it is possible, among other functions, to simulate the transient behavior of temperature in all nodes of the mesh at different layers of varying depths, varying according to the workings of the geothermal system. By knowing the temperature values in the ground nodes around the EmP field at the end of the solar heat injection period, it was then possible to estimate the amount of stored heat, using the following equation:
where Qst is the energy stored (MJ), cg is the volumetric thermal capacity of the ground (MJ/(m3·K)), r is the radius of the impacted area (m), th is the thickness of the ground layer (m) and ΔTg (K) is the difference between the undisturbed ground temperature(ΔTg,i) and that at the end of the injection period (ΔTg,f).
3. Geological Model
3.1. Local Geological Model and Underground Circulation Conditions
The analysis of the cuttings collected during the drilling operations enabled us to distinguish Quaternary deposits (units a to g) down to a depth of 25.6 m, and subsequently the Mesozoic carbonate series of the Calcari Grigi Group (units h and i) down to the bottom of the borehole (Figure 5c–e). In more detail, the encountered units have the following characteristics:
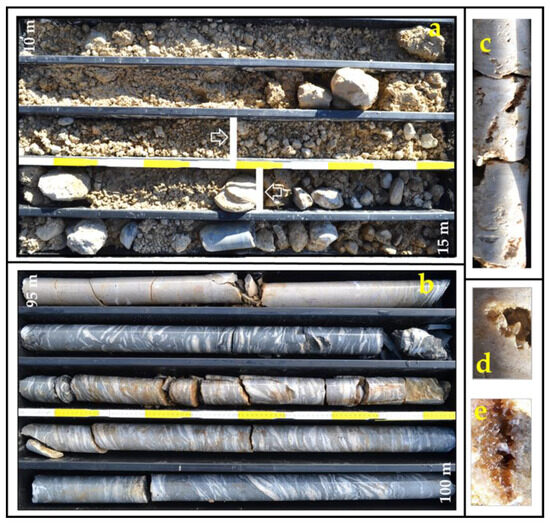
Figure 5.
Photo of the cuttings and core. (a) Quaternary deposits from −10 to −15 m showing the position of the Lefranc test (white bars and arrows). (b) Limestones of the Rotzo Formation with a bank of Lithiotis (from −96 to −100 m). (c) Example of micro cavities created by the dissolution of the limestones (−29 m) and details of the spatic calcite infilling (d,e).
- (a)
- medium coarse gravel; gravel with limestone clasts (diameter 0.5–5.0 cm), with sub-rounded pebbles, to a lesser extent, of varying diameter from 6 to 10 cm, with medium-fine gravel matrices in significant quantities (20–35%);
- (b)
- pebble gravel composed of gravel clasts of variable diameter (3 and 8 cm), with a medium-fine gravel matrix (generally <15%, but locally up to 30–35%); the clasts are calcareous, heterogeneous with angular or slightly rounded shapes;
- (c)
- gravel pebble slightly sandy deposits consisting of gravel clasts (diameter 4–10 cm), with angular to sub-rounded shapes, with a gravel–sandy matrix (35–40%) containing even a small amount of silty fraction (example in Figure 5a);
- (d)
- medium gravel weak sands consisting of poorly classed gravels, with limestone clasts (diameter 0.5–2.0 cm), with a matrix composed of fine gravel and coarse sand;
- (e)
- silty sandy gravel deposits consisting of limestone clasts (diameter 0.5–2.0 cm), generally not rounded, rarely containing sub-angular limestone pebbles up to 6 cm, with abundant (40–45%) sandy–silty matrices (example in Figure 5a);
- (f)
- gravelly–sandy silt unit formed by an abundant yellowish silty–clayey matrix, slightly sandy, with the presence of a few clasts (diameter 1–2 cm; example in Figure 5a);
- (g)
- blocks of calcarenite and bioclastic limestone with bivalves varying in dimension between 5 and 20 cm;
- (h)
- oolitic limestones (25.6 to 32.0 m) belonging to the Massone Formation (example in Figure 5c);
- (i)
- pelitic limestones (32.0 to 120.0 m) belonging to the Rotzo Formation, representing a medium to low hydrodynamic energy lagoon environment, with frequent biostromes formed by the accumulation of Lithiotis (example in Figure 5b); this unit is highly heterogeneous and locally highly fractured.
In the lower part of the Rotzo Formation and particularly in the interval between a depth of 112 and 120 m, a series of minor karst cavities partially filled by fine matrix deposits were crossed during drilling; additionally, a major empty cavity about 0.50 m wide was detected at a depth of 107 m. Moreover, chemical phenomena from the dissolution and recrystallization of the rock mass have been encountered in the calcareous horizons between −32.5 and −36.2 m and from 109 to 110 m (Figure 5c–e). These are micro cavities less than 1 cm wide (rarely up to 3 cm), partially filled by calcite cements.
Regarding the underground water circulation, the rainwater that infiltrates the subsoil is conveyed and concentrated within karst conduits. This flowing process contributes to the progressive dissolution of the carbonate bedrock and to the evolution of the micro-karst system into larger and larger cavities (Figure 5c–e). The interception at depths greater than 107 m of such empty volumes indicates the likely presence of interconnected karst conduits developed across the pelitic limestones (which otherwise act as hydraulic barriers) allowing for the potential development of locally suspended aquifers. It is worth noting that, during the drilling operation, which was carried out in a period of low rainfall, the presence of aquifers was not identified.
The local geological and hydrogeological structure, and above all the presence of cavities and the absence of underground water circulation (unsaturated conditions), would have probably compromised the efficiency and economic/environmental feasibility of a double U closed circuit geothermal system up to a depth of 150 m.
3.2. Hydraulic Parameters
In order to quantify the hydraulic characteristics of the Quaternary deposits, a Lefranc permeability test was performed between a depth of 12.5 and 13.55 m, being representative of this stratigraphic unit (Figure 5a). Indeed, in the upper section (12.5–13.0 m) there are mainly pebbly gravels with a small fraction of silty material, while in the lower one (13.0–13.55 m) gravelly–sandy silts prevail. Based on Equation (2), the average hydraulic conductivity value was calculated for the Quaternary deposits, and it is 1.3 × 10⁻⁵ m/s.
As mentioned above, the RQD approach, calculating the index by means of Equation (6), was applied in the rock mass. The results indicate the following (Figure 6; Table 3): (a) a large variability in depth is present that could be mainly attributed to the presence of the secondary porosity; (b) 24% of the rock mass is characterized by a quality of poor to very poor, 22% as fair; 25% as good and 29% as excellent; (c) from the application of the empirical relationship of Equation 7, the hydraulic conductivity of the rock mass presents variations between 10−5 and 10−7 m/s with mean, median and mode values of about 3.5 × 10⁻⁶, 0.9 × 10⁻⁶ m/s and 0.4 × 10⁻⁶ m/s, respectively.
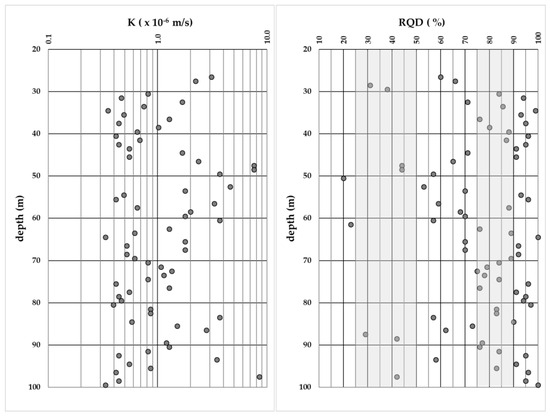
Figure 6.
Hydraulic conductivity versus depth and RQD values versus depth (left and right diagrams, respectively).
Based on Equations (4) and (5), the data acquired for the Lugeon test suggest that the values intersecting the wall of the borehole vary between 1.9 and 8.3 LU and indicate that the rock mass is characterized by the presence of close to slightly open discontinuities [59]. This observation is also in agreement with the RQD values (Figure 6). Moreover, the results of the Lugeon test allow us to calculate a hydraulic conductivity varying between 1.2 × 10⁻⁷ m/s and 1.34 × 10⁻⁶ m/s.
From the pressure versus hydraulic conductivity diagram (Figure 7) it is possible to observe, firstly, a progressive increase in the hydraulic conductivity without the linear increasing of the pressure and without a return to values recorded prior to the application of the maximum pressure. Secondly, higher hydraulic conductivity values at decreasing pressure stages (4th–5th) are comparable with those measured at the corresponding increasing stages (1st–2nd). These observations suggest a permanent wash-out of the joint-filling material caused by the increase in pressure during the ascending phase (1st–3rd).
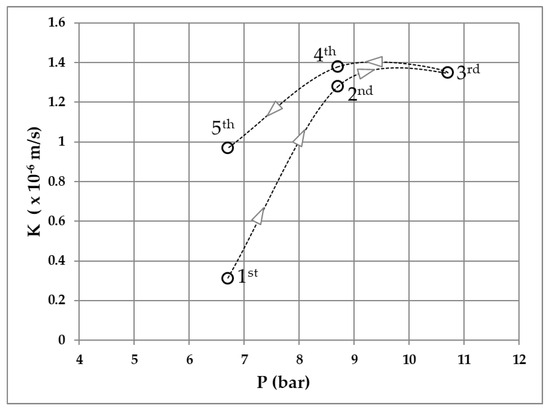
Figure 7.
Lugeon test: example of distribution of the hydraulic conductivity (m/s) values versus pressure steps (bar; 1st to 5th).
The interpretation of the Lugeon test results, based on Darcy’s law and following the estimate of the hydraulic conductivity coefficient, considers the linearity of flow versus pressure and a laminar flow regime, which could be observed only in the lower stages of pressure. Therefore, for estimating the hydraulic conductivity, the first and last pressure stages provide the most appropriate and representative values. In line with these premises, for the hydraulic conductivity it is thus possible to assume an average value of 0.7 × 10⁻⁶ m/s.
4. Design Changes and Modelling
Based on the integrated elaboration of all the collected data (Section 2), in this chapter the proposed project alternatives, the results of the modeling and the adopted design procedure are described. The results of the short- and long-term simulations together with a comparison of the potential alternatives are then presented and discussed. The contribution of BTES for reaching long-term energy stability is also highlighted. For the sake of clarity, in figures and graphs, the symbols presented in Table 4 are used.

Table 4.
Symbols used in figures and graphs.
4.1. Choice and Design of the Geothermal Solution
Based on the geological and hydrogeological information mainly obtained with the borehole and the performed tests, it was thus possible to deeply revise the preliminary project following an integrated planning process as represented in Figure 8. In this regard, we focused on two main aspects: the environmental conditions and the energy needs of the building. As concerns the environmental conditions, we must consider the climatic characteristics of the site, the geological, hydrogeological and thermophysical properties of the subsoil and especially the presence of several cavities within the bedrock, as well as the absence of an aquifer system in the first 150 m. On the other hand, the energy needs of the building are represented by the singular direction of the heat flow (from the ground to the building) and the concentrated period of heat extraction (winter months).
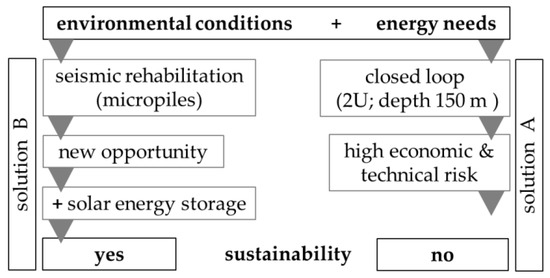
Figure 8.
Flowchart of the integrated planning process and comparison between the two alternative solutions.
For the purpose of this research, two scenarios have been analyzed. The first one (Figure 8, solution A), represented by a closed loop shallow geothermal plant (heat exchangers 150 m-deep; double U probes), was abandoned due to the high technical risks, for example during the drilling operations, as a consequence of the presence of cavities (causing the possible loss of the drilling pipes and head, needing huge amounts of circulation water and mud, requiring large quantities of grout to seal the cavities and cement the probes, etc.). All or even only some of these technical issues would have definitely increased the overall construction costs of the plant. On the other hand, the energy needs in a relatively short heating season and the energetically unbalanced system characterized only by heat extraction would have required a large geothermal field, specifically dimensioned to cover the peaks, with further increases in the logistic problems and the costs.
The alternative solution (solution B in Figure 8) considers the installation of 20 m-deep micropiles in the underground building garage. Indeed, these typically geotechnical tools are used for, and in this case have been specifically tailored for, seismic rehabilitation. As a consequence, the relative drilling and grouting costs of the micropiles should not be considered part the investment in the energy system. On the contrary, through relatively small technical mending (and costs), the micropiles have been transformed into geothermal probes (energy micropiles, EmP; Figure 9).
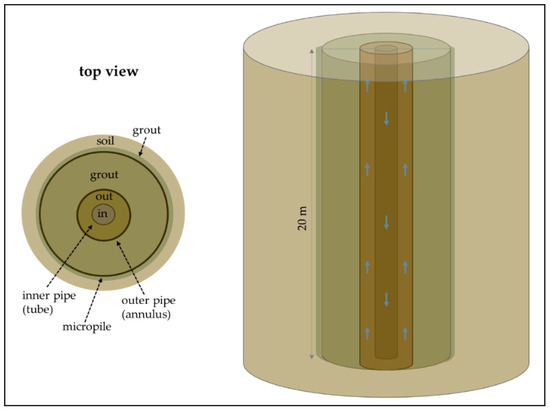
Figure 9.
Schematic representation of the coaxial micropile geothermal heat exchanger (EmP).
In particular, the EmP geothermal heat exchanger consists of a coaxial geothermal probe (Figure 9) with an external diameter of 60 mm made of aluminum (1 m prefabricated modules assembled on site) and an internal tube made of polyethylene. It was inserted and grouted inside the 140 mm diameter micropile. The geometrical and thermodynamic properties of each EmP are presented in Table 5.

Table 5.
Construction features of the energy micropiles (EmP).
The dimension of the EmP, both horizontal and vertical, was determined by which position would be most useful for the antiseismic behavior. In particular, 531 EmPs were installed with a relative distance varying from 1 to 2 m (Figure 10).
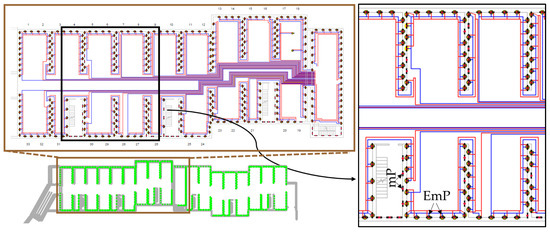
Figure 10.
Plan view of the garage with the position of the EmPs and enlarged area with the 370 EmPs selected for the numerical simulation. Red and blue lines represent horizontal connections.
Due to the shallow depth of the planned EmP (i.e., 20 m), and in order to guarantee the thermal balance of the subsoil, the installation of a solar thermal system on the roof of the building was also planned. The latter part of the plant has the function of energetically recharging the subsoil during the summer season. It should be noted that the requested energy load from all EmPs during an entire annual cycle is more than 360 MWh, with monthly peaks of ca. 65 MWh (Figure 11). The positive values refer to the heat injection, while the negative values refer to the heat extraction. The latter come exclusively from the excess thermal energy produced by the solar panels. The solar thermal system consists of 258 panels (86 with azimuth −155° and 172 with azimuth +25°) arranged on the roof of the building, resulting in a cumulatively covered area of 650 m2. The total thermal capacity is ca. 553 MWh/a, with the monthly distribution represented in Figure 11.
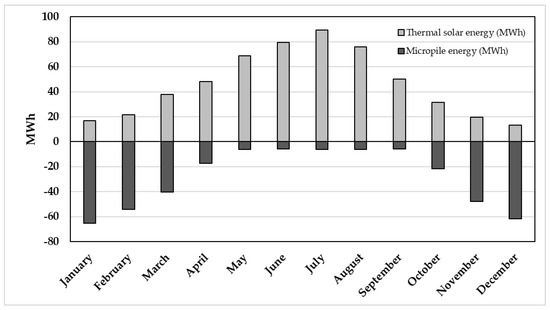
Figure 11.
Monthly energy load requested from, or introduced to, the EmPs system.
Based on the adoption of the new scenario (solution B; Figure 8), additional investigations were carried out in the building’s underground garage (−5 m from the surrounding ground level) which include:
- (a)
- the drilling of a second deep (80 m) pilot borehole to verify the lithological sequences directly underlying the building; to measure the temperature in relation to the depth in order to define the undisturbed temperature of the subsoil, conditioned by the building presence above it. This investigation allowed us to verify that the Quaternary deposits have a local total thickness of 15 m overlying the carbonate bedrock down to the borehole bottom.
- (b)
- in one of the 20 m-deep energy micropile probes, a thermal response test was carried out to define the thermophysical parameters of the shallow subsoil.
4.2. Thermophysical Parameters of the Underground
The resulting temperature measurements taken during November 2022 in relation to the depth, and are reported in Figure 12. The upper part of the measurements does not reflect the ground temperature being disturbed by the local environmental conditions (i.e., the air temperature inside the garages corresponding to 10.3 °C at 5 m depth). This value is obviously not compatible with the average external air temperature, which for the month of November was 3.5 °C. The homothermic zone, below 50 m, is characterized by temperature stability, while the measured undisturbed ground temperature is about 7.6 °C.
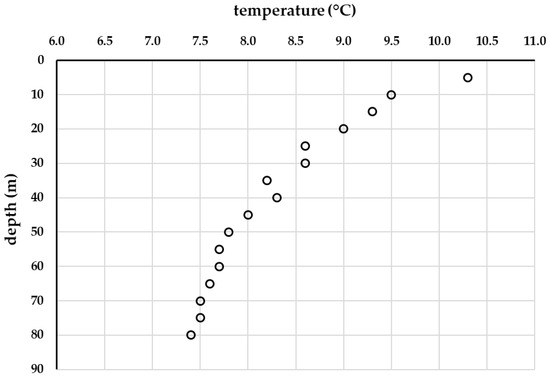
Figure 12.
Temperature measurements in relation to depth.
Based on the analysis of the thermal response test (Figure 13), the equivalent thermal conductivity value obtained from the 20 m EmP is equal to 1.5 W/(m K). The low thermal conductivity value is likely to be attributed to the dry conditions of the subsoil.
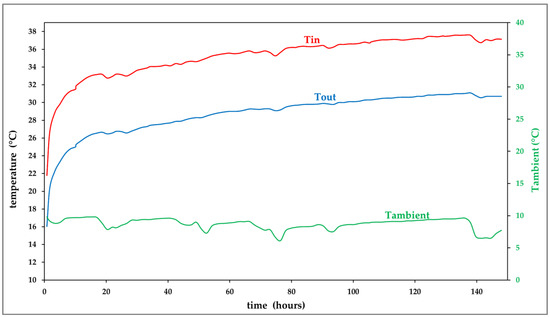
Figure 13.
Thermal response test conducted with the 20 m-deep coaxial heat exchanger.
Samples from the cored Quaternary deposits were also analyzed in unsaturated conditions at the GeoTh laboratory of the University of Ferrara [8], providing an average thermal conductivity of 1.00 W/(m·K).
Combining the above results, the thermal conductivity of the limestones in contact with the micropiles in the deepest 5 m is approximately 3.03 W/(m K). This value agrees with the commonly accepted range of values for limestones (1.5–3.3 W/m K) and the karst limestones (2.5–4.3 W/m K) as reported for example by Chiasson et al., 2000 [60].
As concerns the heat capacity of the crossed geological formations, it was estimated based on the literature data [61], while the assumed values for the hydraulic and thermophysical parameters of the same units, under the Condominium (5 m bgl), are reported in Table 6. These data constitute the starting point for the definition of the physical model of the subsoil and the subsequent numerical modelling.

Table 6.
Geological, hydrogeological and thermophysical data under the Condominium.
4.3. Numerical Model
In map view, the investigated building has an irregular shape, with a perimeter of 146 m and an area of 100 m2 (Figure 10). The system of EmPs was designed to operate exclusively in parallel, therefore the same thermal load was assigned to each EmP (Figure 10).
For creating the model and performing the numerical simulation, the software FEFLOW® was used.
4.3.1. Model Creation and Domain Discretization
Model dimensions have been horizontally fixed to 125 m, with the building in the center of the square, and 120 m in the vertical direction. These dimensions assured that boundary effects could be neglected. In order to reduce model complexity, due to the large number of EmPs, the numerical simulation was performed only on one sector of the geothermal field, precisely the one illustrated in Figure 10. The discretization of the volume was performed with a triangular mesh, fitted around the EmPs (Figure 14a).
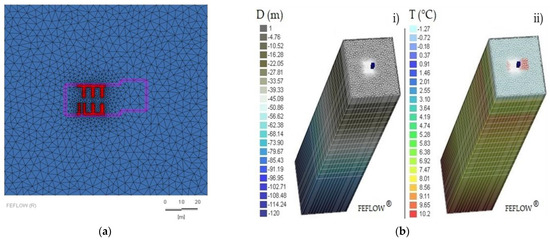
Figure 14.
(a) Plan view of the grid based on triangular meshes used in the numerical model focusing around the selected EmPs (see Figure 10). (b) 3D perspective view of the set-up model and the discretization adopted for the numerical simulation showing (i) depth (D; in m) and (ii) ground temperature evolution along depth (T; in °C).
Along the vertical direction, the model was divided in 22 layers, not equally thick, to carry out a high fitting in the shallower part, where the building and the EmP are located, and to provide an improved resolution of the results. Table 7 presents the subdivision of the layers, while Figure 14b shows the 3D discretization model in relation to the depth.

Table 7.
Model layers in relation to depth.
The information related to material properties, boundary conditions and the values of the initial variables presented in the previous section were subsequently assigned to the respective layers, and the initial state model was therefore simulated, in the absence of thermal extraction or injection into or from the ground by means of the EmPs.
For the application of the model, the following additional conditions were adopted: (a) no flow is presented in the unsaturated zone (due to the lack of groundwater in the shallow layers); (b) heat transfer is assumed as both conductive and convective; (c) a confined deep aquifer is considered at the bottom of the model; and (d) the solver SAMG—“Algebraic Multigrid” of the FEFLOW® software was selected, being applicable to both the symmetric and non-symmetric matrices.
4.3.2. Simulation of the Initial State
The initial state was simulated on the basis of a 10-year period. The thermal boundary conditions were related to (i) the seasonal climatic fluctuations, (ii) the presence of the building, and (iii) the hydraulic conditions (Table 6) related to pressure.
The observation points were set in proximity to the test borehole, in order to check the temperature and pressure trends in relevant positions. At the end of the simulation, it was thus possible to verify the thermal impact generated on the subsoil in correspondence with the building.
The final temperatures were substantially in conformity with what was previously measured, therefore it was not necessary to carry out subsequent calibrations. The simulated temperatures were 9.4 °C at 5 m depth, 8.9 °C at 10 m, 8.7 °C at 15 m and 8.4 °C at 20 m (Figure 15).
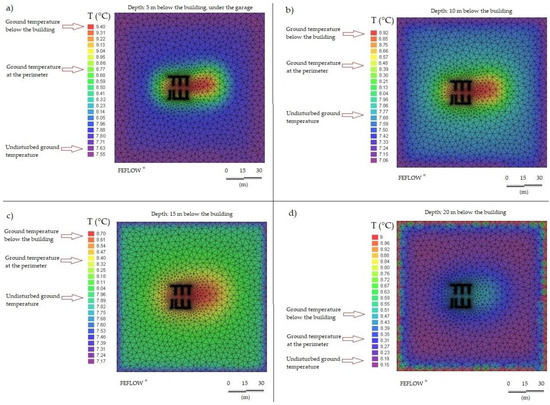
Figure 15.
Simulated initial state of ground temperature at depths of 5 (a), 10 (b), 15 (c) and 20 (d) m from the garage level.
Once the initial state was reconstructed, the models of the EmPs were introduced, following the characteristics presented in Table 5. Each modeled EmP was assigned to a dedicated node, extended along the vertical direction from 5 m to 25 m depth. According to the heat pump system design, the flow rate for each probe should be equal to 0.02 L/s (2.0736 m3/d), while the value of the temperature difference between inlet and outlet during the winter season was kept above 3 K. The same ΔT value (with inverted sign) was also applied for the subsoil heat recharge simulated for the summer period. Assuming a typical of mixture of water and 10% glycol, the properties of the working fluid allow temperatures to fall below 0 °C.
With such constraints, it was possible to calculate the specific heat rate of each EmP, which is 240 W, which in turn corresponds to 12 W/m. The apparently low energy value is mainly due to the total absence of groundwater and flow within the modelled subsoil.
Therefore, knowing the monthly load (Figure 11), it was possible to calculate the daily operating hours (or the monthly operating days) to ensure the full cover of the building’s thermal needs (Table 8).

Table 8.
Time steps for the correct working of the geothermal system.
The heating system provides real operation based on the number of hours per day for all days of the heating season (column 1 of Table 8). However, with regard to the numerical model, simulating the real work would cause many changes in behavior (from extraction to recharge) throughout the year, thus lengthening the simulation timing.
Therefore, we chose to perform the simulation based on the days of monthly operation (column 2 of Table 8). Regarding the total extracted/dissipated energy for the whole year, and the peaks of minimum and maximum temperatures, the results are perfectly equal, but in the second chosen case, there was an indisputable advantage in terms of simulation timing.
The simulations were made by imposing a fluid flow of 0.02 L/s for each EmP and keeping a temperature difference between the inlet and outlet equal to 3 K, then guaranteeing 240 W from each EmP.
Figure 16 shows the result of the simulation (with fluid entry towards the annulus) in terms of inlet and outlet temperatures after five years of operation, from two EmPs located in two distinct zones of the geothermal field: the first one surrounded by other EmPs (worst conditions), and the second at the border of the field (best conditions). April 1st was assumed as the starting day of the simulation, so as to initially simulate the solar heat injection in the EmPs. Figure 17 presents a comparison among the behavior in the center of the EmP field and at its borders. The difference between the results is small, emphasizing how the planned layout of the EmPs was appropriate according to the energy demand of the building and the use of the system.
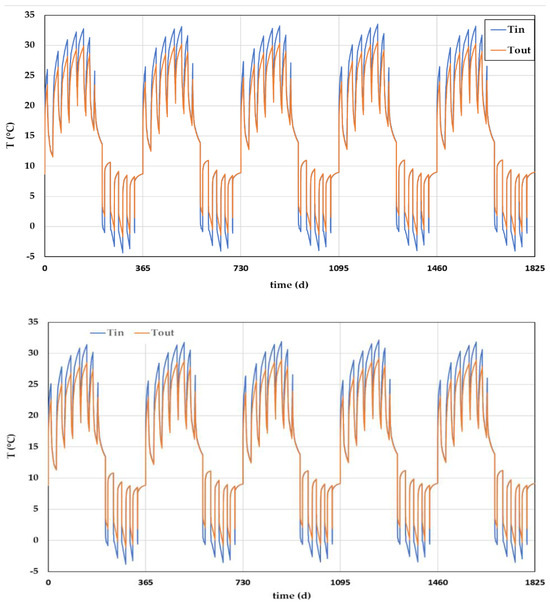
Figure 16.
The result of a 5-year simulation for an EmP located in the middle (top) and at the border (bottom) of the geothermal field, respectively.
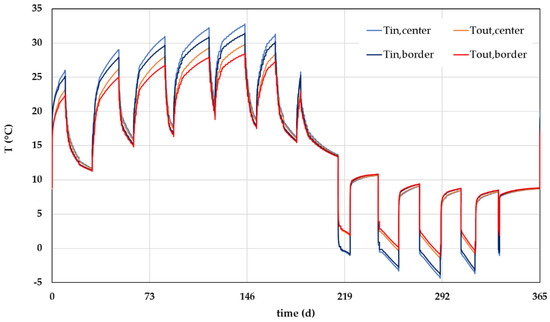
Figure 17.
Comparison of the simulation results for an EmP located in the center and one located at the border of the model, for the first year of simulation.
By comparing the different years, we see how the latter guarantees an increase in temperatures starting from the 2nd year, followed by a substantial stabilization. Table 9 shows the simulated minimum and maximum temperature values for the two EmPs.

Table 9.
Simulated minimum and maximum temperature values.
The thermal impact of the operation of the EmPs on the subsoil of the building depends on the quantity of solar heat injected and of the energy extracted during the heating season. The greatest impact is expected near each EmP, gradually decreasing towards the border of the geothermal field.
By allowing the fluid to reach temperatures below 0 °C, all the energy needs have been satisfied with the EmP solar thermal energy storage. The absence of groundwater flow guarantees a very limited dissipation of the solar energy in the ground. In particular, the rates of the injected and extracted heat are those presented in Table 10.

Table 10.
Rates of extracted (−) and injected (+) heat satisfied by the system.
However, since the EmPs are distributed along the entire building, the phenomenon of the superimposition of effects occurs, and so a notable thermal impact is expected in some specific zones of the field, where the density of EmPs with respect to the available space is high, and where a temperature difference of up to 20 K, compared to the initial state, can arise, in both injection and extraction modes. Figure 18 presents the results of the numerical simulation, in terms of the subsoil thermal state at different depths at the end of a heat injection phase.
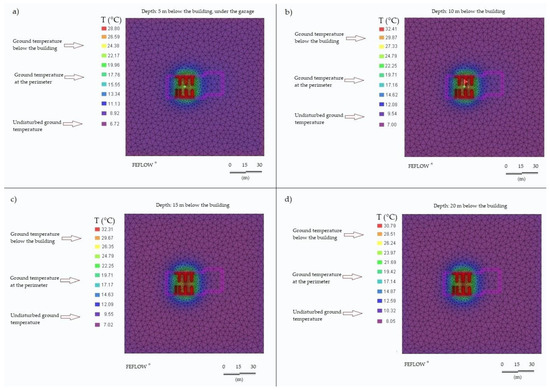
Figure 18.
Impact of the work of the geothermal field over the subsoil at the end of the solar heat injection period. Temperatures in the depths of 5 (a), 10 (b), 15 (c) and 20 (d) meters below the building.
Based on the ground temperature in the different layers at the end of the solar heat injection period, it was possible to estimate the amount of stored heat, using Equation (8).
The energy stored in the subsoil was calculated for all four layers affected by the EmPs (5–10, 10–15, 15–20 and 20–25 m below the garage; Table 11; Equation (8)).

Table 11.
Stored energy based on the results of the numerical simulations.
The radius of influence was set at 10 m, according to the results of the numerical simulation. However, since it was carried out in 87 of the 220 EmPs, the energy storage analysis was repeated by considering the radius as the entire length of the building (25 m). In such conditions, a total energy storage of about 250 MWh can be assumed.
Additional analyses were performed for checking the possibility of avoiding the use of antifreeze fluid. Due to the dry nature of the subsoil, it was not possible to find a proper solution. However, further considerations could be provided. The winter energy could be satisfied at 75% of the demand by imposing a reduced constant flow of 0.011 L/s (0.9504 m3/d) for each EmP, but with a significant increase in operational hours (almost 24 h/24 for the whole winter period). With such conditions, it could be possible to increase the minimum temperature by about 3 K (from −4 °C using 0.02 L/s, to −1 °C using 0.011 L/s). Imposing even lower flows seems unfeasible, since 0.011 L/s is the limit under which the thermal short circuit in the newly designed EmP system becomes prominent. Figure 19 presents the evolution of temperature in such conditions, for the first few years of operation, by imposing the minimum inlet temperature for each month.
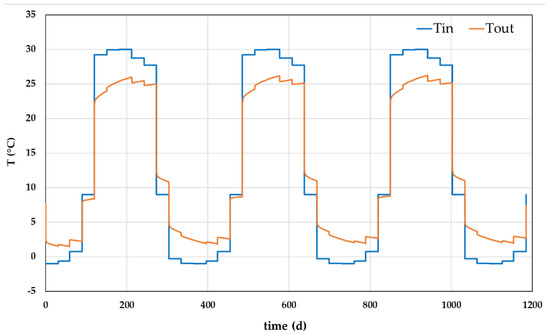
Figure 19.
System temperature evolution, by imposing the minimum flow of 0.011 L/s for each EmP and the minimum inlet temperature during each month, though respecting the energy needs.
Also in this case, the stored solar energy has provided a fundamental contribution in supporting the ground for satisfying the building energy needs.
5. Conclusions
Climate change, air pollution and the progressive increase in the costs of fossil energy sources for heating the built environment make the integration of various renewable energy sources necessary. Shallow geothermal resources, representing a continuous, low-emission and local renewable energy source, will certainly provide an important contribution to the decarbonization process. The concepts of circular economy, zero carbon, environmental sustainability, energy poverty and healthy living are the cornerstones around which this research was developed. It is worth noting that the achievement of these objectives and the related operational and design choices were guided and conditioned by the characteristics of the underground.
When designing a shallow geothermal (or geoexchange) system, it must be taken into consideration that the geological, hydrogeological, geotechnical and thermophysical conditions of the subsoil constitute the fixed boundary conditions of the project. Therefore, the subsequent design phases (thermal engineering and architectural) must consider and adapt to the characteristics of the underground.
This study was devoted to optimizing the balance between solar thermal storage and heat extraction from a shallow underground geothermal system, in a dry subsoil context. The investigated building is located at 1490 m within a mountain area of high environmental and landscape value, with tourism in both the summer and winter. The average annual air temperature is +7.1 °C, while from December to February it drops to −0.3 °C. It is worth noting that the investigated building only needs heating, and the energy demand is concentrated between November and March (79.5% of the total energy) with peaks of 90 MWh in January for both heating and domestic hot water.
The geological investigation allowed us to distinguish the presence of shallow Quaternary deposits, relatively heterogeneous at both vertical and horizontal scales. These deposits consist of alternating layers of gravel, sand and silt with the presence of centimeter-sized blocks of calcarenite and limestone rocks. The thickness varies between 10 and 20 m, reflecting the geometric characteristics of the Mesozoic bedrock mainly consisting of pelitic (Rotzo Formation) and oolitic limestone (Massone Formation) in the upper part of the succession (thickness < 6 m).
The average hydraulic conductivity of the Quaternary deposits and Mesozoic carbonate formations is about 1.3 × 10⁻⁵ and 3.5 × 10⁻⁶ m/s, respectively. Moreover, at depths greater than 100 m, several karstic cavities were crossed during drilling while in the shallower layers, wherein chemical phenomena of the dissolution and recrystallization of the rock mass are diffused. The development of these karst features and the absence of underground water circulation would have strongly compromised the sustainability of a deeper, say 80–150 m, closed loop geothermal system. Accordingly, only the integrated analysis of the local geological conditions, by means of a holistic approach, was crucial during the design process, allowing the planners and the investors to overcome some technical design barriers for a better exploitation of the subsurface geothermal energy. Moreover, this integrated approach has given us the opportunity to:
- (a)
- conceive/introduce the energy micropiles (EmPs) by combining/integrating geotechnical solutions (i.e., foundation micropiles) with geothermal ones, and hence selecting coaxial geothermal probes in accordance with the concept of circular economy;
- (b)
- install the EmPs inside the garage of the building without any additional inclusion of soil or hydraulic works;
- (c)
- conceive and design an integrated (hybrid) renewable energy supply system (geothermal and solar) to provide the thermal energy necessary for heating the building.
Finally, numerical modeling and long-term simulations enabled us to define an eco-sustainable solution by exploiting the entirely renewable summer solar energy and store it in the subsoil for its use in winter, thus enhancing the heat performance of the system. Especially in unfavorable conditions, such as dry soils and unbalanced heating demands, the BTES solution can be designed to provide the economic feasibility and sustainability of a combined exploitation of geothermal and solar energy.
Author Contributions
Conceptualization, D.R.; methodology, D.R., F.T. and C.A.C.; software, D.R. and F.T.; validation, D.R.; formal analysis, D.R., F.T. and C.A.C.; investigation, D.R.; resources, D.R. and C.A.C.; data curation, D.R.; writing—original draft preparation, D.R. and F.T.; writing—review and editing, D.R., F.T. and C.A.C.; visualization, D.R.; supervision, D.R.; project administration, D.R. All authors have read and agreed to the published version of the manuscript.
Funding
The research activities of D.R. are supported by a contract in the frame of the PON REACT EU Project by the Italian MUR; number 09-G-48651-15.
Data Availability Statement
The original contributions presented in the study are included in the article, further inquiries can be directed to the corresponding authors.
Acknowledgments
The authors would like to thank the NOVATEK srl Benefit Company, Boscochiesanuova (VR), Italy, promoter of the project “San Giorgio Zero Emission”, for their availability and collaboration. The technicians and researchers of the University of Ferrara spinoff company, the New Energies And environment, are also acknowledged for their contribution in the collection, measurement and processing of the data, and in particular Riccardo Caputo. Finally, we would like to thank the anonymous reviewers for their careful reading of our manuscript.
Conflicts of Interest
Author Dimitra Rapti was employed by the company New Energies and Environment, Spin-Off Company. The remaining authors declare that the research was conducted in the absence of any commercial or financial relationships that could be construed as a potential conflict of interest.
References
- Lund, H.; Østergaard, P.A.; Connolly, D.; Mathiesen, B.V. Smart energy and smart energy systems. Energy 2017, 137, 556–565. [Google Scholar] [CrossRef]
- Emiliano Corà—EUREC, BE. (Ed.) 2050 Vision for 100% Renewable Heating and Cooling in Europe; Bruxelles, Belgium, 2020. Available online: https://www.rhc-platform.org/content/uploads/2019/10/RHC-VISION-2050-WEB.pdf (accessed on 23 February 2024).
- Directive (EU) 2023/2413 of the European Parliament and of the Council of 18 October 2023 Amending Directive (EU) 2018/2001, Regulation (EU) 2018/1999 and Directive 98/70/EC as Regards the Promotion of Energy from Renewable Sources, and Repealing Council Directive (EU) 2015/652. Available online: https://eur-lex.europa.eu/legal-content/EN/TXT/?uri=CELEX%3A32023L2413&qid=1699364355105 (accessed on 23 February 2024).
- European Climate Foundation. Available online: https://europeanclimate.org/wp-content/uploads/2022/03/ecf-building-emissions-problem-march2022.pdf (accessed on 23 February 2024).
- Directive 2010/31/EU of the European Parliament and of the Council of 19 May 2010 on the Energy Performance of Buildings (Recast). Available online: https://eur-lex.europa.eu/legal-content/EN/TXT/HTML/?uri=CELEX:32010L0031 (accessed on 23 February 2024).
- Commission Recommendation (EU) 2016/1318 of 29 July 2016 on Guidelines for the Promotion of Nearly Zero-Energy Buildings and Best Practices to Ensure That, by 2020, All New Buildings Are Nearly Zero-Energy Buildings. Available online: https://eur-lex.europa.eu/legal-content/EN/TXT/PDF/?uri=CELEX:32016H1318&from=EN (accessed on 23 February 2024).
- Paksoy, H.O.; Andersson, O.; Abaci, S.; Evliya, H.; Turgut, B. Heating and cooling of a hospital using solar energy coupled with seasonal thermal energy storage in an aquifer. Renew. Energy 2000, 19, 117–122. [Google Scholar] [CrossRef]
- Rapti, D.; Marchetti, A.; Andreotti, M.; Neri, I.; Caputo, R. GeoTh: An Experimental Laboratory Set-Up for the Measurement of the Thermal Conductivity of Granular Materials. Soil Syst. 2021, 6, 88. [Google Scholar] [CrossRef]
- Liuzzo-Scorpo, A.M.; Nordell, B.; Gehlin, S. Influence of regional groundwater flow on ground temperature around heat extraction boreholes. Geothermics 2015, 56, 119–127. [Google Scholar] [CrossRef]
- Zilong, Z.; Lin, Y.-F.; Stumpf, A.; Wang, X. Assessing impacts of groundwater on geothermal heat exchangers: A review of methodology and modeling. Renew. Energy 2022, 190, 121–147. [Google Scholar] [CrossRef]
- Cunha, R.P.; Bourne-Webb, P.J. A critical review on the current knowledge of geothermal energy piles to sustainably climatize buildings. Renew. Sustain. Energy Rev. 2022, 158, 112072. [Google Scholar] [CrossRef]
- Mohamad, Z.; Fardoun, F.; Meftah, F. A review on energy piles design, evaluation, and optimization. J. Clean. Prod. 2021, 292, 125802. [Google Scholar] [CrossRef]
- Da Silva Oliveira Morais, T.; de Hollanda Cavalcanti Tsuha, C.; Bandeira Neto, L.A.; Martand Singh, R. Effects of seasonal variations on the thermal response of energy piles in an unsaturated Brazilian tropical soil. Energy Build. 2020, 216, 109971. [Google Scholar] [CrossRef]
- Lizzi, F. First Patents on Root Piles and Reticulated Root. Piles, Fundedile. 1950-52, Naples. Patent no. 497736, March 1952. [Google Scholar]
- Armour, T.; Groneck, P.; Keeley, J.; Sharma, S. Micropile Design and Construction Guidelines Implementation Manual; Priority Technologies Program (PTP) Project. Report No. FHWASA-97-070; Federal Highway Administration: Washington, DC, USA, 2000; pp. 1–376. [Google Scholar]
- EN 14199:2015; Execution of Special Geotechnical Works—Micropiles. CEN—European Committee for Standardization: Brussels, Belgium, 2015.
- Sabatini, P.J.; Tanyu, B.; Armour, T.; Groneck, P.; Keeley, J. Micropile Design and Construction Guidelines; FHWA: Washington, DC, USA, 2005; p. 380.
- El Kamash, W.; El Naggar, H.; To, P.; Sivakugan, N. The Effect of Long-Term Consolidation on Foundations Underpinned by Micropiles in Soft Clay. Ain Shams Eng. J. 2022, 13, 101487. [Google Scholar] [CrossRef]
- Alsaleh, H.; Shahrour, I. Influence of Plasticity on the Seismic Soil-Micropiles-Structure Interaction. Soil Dyn. Earthq. Eng. 2009, 29, 574–578. [Google Scholar] [CrossRef]
- Xie, W.; Limin, S. Assessment and Mitigation on Near-Fault Earthquake Wave Effects on Seismic Responses and Pile-Soil Interactions of Soil-Pile-Bridge Model. Soil Dyn. Earthq. Eng. 2021, 143, 106596. [Google Scholar] [CrossRef]
- Capatti, M.C.; Dezzi, F.; Carbonari, S. Full-Scale Experimental Assessment of the Dynamic Horizontal Behavior of Micropiles in Alluvial Silty Soils. Soil Dyn. Earthq. Eng. 2018, 113, 58–74. [Google Scholar] [CrossRef]
- Traylor, R.P.; Cadden, A.W.; Bruce, D.A. High capacity micropiles in karst: Challenges and opportunities. In Deep Foundations 2002: An International Perspective on Theory, Design, Construction, and Performance; ASCE: Reston, VA, USA, 2002; pp. 743–759. [Google Scholar]
- Bivens, M.J.; Siegel, T.C. Case histories of micropile in karst: The influence of installation on design performance. In Contemporary Issues in Deep Foundations; ASCE: Reston, VA, USA, 2007. [Google Scholar] [CrossRef]
- European Commission. The European Green Deal; Communication (Document 52019DC0640); European Commission: Brussels, Belgium, 2019; Available online: https://eur-lex.europa.eu/legal-content/EN/TXT/HTML/?uri=CELEX:52019DC0640 (accessed on 22 February 2024).
- Department of Civil Protection as at 31 March 2022. Available online: https://rischi.protezionecivile.gov.it/static/c7650fa8eac014a28ef074236bb234f7/mappa-classificazione-sismica-aggiornata-al-31-marzo-2022-provincia.pdf (accessed on 20 February 2024).
- Sauro, U.; Bidese, E.; Bonomi, E. Cimbri dei Monti Lessini; Grafica, L., Ed.; La Grafica: Verona, Italy, 2017; 408p, ISBN 978-88-6947-154-4. [Google Scholar]
- ARPAV Database. Available online: https://www.arpa.veneto.it/dati-ambientali/dati-storici/aria/ (accessed on 1 April 2023).
- UNI 10349:1994/EC; Riscaldamento e Raffrescamento Degli Edifici, Dati Climatici. Ente Nazionale Italiano di Unificazione: Milan, Italy, 1997. (In Italian)
- Masetti, D.; Fantoni, R.; Romano, R.; Sartorio, D.; Trevisani, E. Tectonostratigraphic evolution of the Jurassic extensional basins of the eastern Southern Alps and Adriatic foreland based on an integrated study of surface and subsurface data. Am. Ass. Petrol. Geol. Bull. 2012, 96, 2065–2089. [Google Scholar] [CrossRef]
- Sauro, U. Geomorfological Map of the Upper Part of the Lessini (Prealpi Venete); scale: 1:25.000; Istituto Geografico Militare (autorizzazione n. 506 del13-12-1971), Litografia Artstica Cartografica: Firenze, Italy, 1973. [Google Scholar]
- Zampieri, D.; Zorzin, R. Carta geologica dei Lessini Centro-Occidentali tra la Valpantena e la Val d’Illasi. In Geologia, Idrogeologia e Qualità dei Principali Acquiferi Veronesi; A cura di Memoria del Museo Civico di Storia Naturale di Verona, 2. Serie, sezione Scienze della Terra, B4; Gutenberg: Povegliano Veronese, Italy, 1993. [Google Scholar]
- Preto, N.; Breda, A.; Dal Corso, J.; Franceschi, M.; Rocca, F.; Spada, C.; Roghi, G. The Loppio Oolitic Limestone (Early Jurassic, Southern Alps): A prograding oolitic body with high original porosity originated by a carbonate platform crisis and recovery. Mar. Pet. Geol. 2017, 79, 394–411. [Google Scholar] [CrossRef]
- Posenato, R.; Masetti, D. Environmental control and dynamics of Lower Jurassic bivalve build-ups in the Trento Platform (Southern Alps, Italy). Palaeogeogr. Palaeoclimatol. Palaeoecol. 2012, 361–362, 1–13. [Google Scholar] [CrossRef]
- Lefranc, E. Procédé de mesure de la perméabilité des sols dans les nappes aquifères et application au calcul du débit des puits. Le Génie Civ. 1936, 109, 306–308. [Google Scholar]
- Lefranc, E. La théorie des poches absorbantes et son application à la détermination du coefficient de perméabilité en place et au calcul du débit des nappes d’eau. Le Génie Civ. 1937, 111, 409–413. [Google Scholar]
- Hvorslev, M.J. Time-Lag and Soil Permeability in Ground-Water Observations; Bulletin 36; U.S. Army Engineer Waterways Experiment Station: Vicksburg, MI, USA, 1951; p. 50. [Google Scholar]
- Chapuis, R.P. Overdamped slug test in monitoring wells: Review of interpretation methods with mathematical, physical, and numerical analysis of storativity influence. Can. Geotech. J. 1998, 35, 697–719. [Google Scholar] [CrossRef]
- Association Française de Normalisation (AFNOR). Recognition and Tests, LEFRANC Water Test; Norme Française NF P 94-132 Sols; AFNOR: La Plaine Saint-Denis Cedex, France, 2000. (In French) [Google Scholar]
- Lugeon, M. Barrages et Géologie; Dunod: Paris, France, 1933. [Google Scholar]
- Wang, T.T.; Zhan, S.S.; Huang, T.H. Determining transmissivity of fracture sets with statistical significance using single-borehole hydraulic tests: Methodology and implementation at Heshe well site in Central Taiwan. Eng. Geol. 2015, 198, 1–15. [Google Scholar] [CrossRef]
- Shahbazi, A.; Saeidi, A.; Chesnaux, R. A review of existing methods used to evaluate the hydraulic conductivity of a fractured rock mass. Eng. Geol. 2020, 265, 105438. [Google Scholar] [CrossRef]
- Vaskou, P.; de Quadros, E.F.; Kanji, M.A.; Johnson, T.; Ekmekci, M. ISRM Suggested Method for the Lugeon Test. Rock Mech. Rock Eng. 2019, 52, 4155–4174. [Google Scholar] [CrossRef]
- Houlsby, A. Routine Interpretation of the Lugeon Water-Test. Q. J. Eng. Geol. 1976, 9, 303–313. [Google Scholar] [CrossRef]
- Nonveiller, E. Grouting Theory and Practice, Development of Geotechnical Engineering; Elsevier: Amsterdam, The Netherlands, 1989. [Google Scholar]
- Dou, J.X.; Zhang, G.J.; Zhou, M.X.; Wang, Z.L.; Gyatso, N.; Jiang, M.Q.; Safari, P.; Liu, J.Q. Curtain grouting experiment in a dam foundation: Case study with the main focus on the Lugeon and grout take tests. Bull. Eng. Geol. Environ. 2020, 79, 4527–4547. [Google Scholar] [CrossRef]
- Deere, D.U. Technical description of rock cores for engineering purposes. Rock Mech. Eng. Geol. 1963, 1, 18–22. [Google Scholar]
- El-Naqa, A. The hydraulic conductivity of the fractures intersecting Cambrian sandstone rock masses, central Jordan. Environ. Geol. 2001, 40, 973–982. [Google Scholar] [CrossRef]
- Jiang, X.W.; Wan, L.; Wang, X.S.; Wu, X.; Zhang, X. Estimation of rock mass deformation modulus using variation sin transmissivity and RQD with depth. Int. J. Rock Mech. Min. Sci. 2009, 46, 1370–1377. [Google Scholar] [CrossRef]
- Tinti, F.; Barbaresi, A.; Benni, S.; Torreggiani, D.; Bruno, R.; Tassinari, P. Experimental analysis of shallow underground temperature for the assessment of energy efficiency potential of underground wine cellars. Energy Build. 2015, 80, 451–460. [Google Scholar] [CrossRef]
- Baggs, S.A. Remote prediction of ground temperature in Australian soils and mapping its distribution. Sol. Energy 1983, 30, 351–366. [Google Scholar] [CrossRef]
- Kavanaugh, S.P.; Xie, L.; Martin, C. Investigation of Methods for Determining Soil and Rock Formation Thermal Properties from Short-Term Field Tests; Final Report for ASHRAE 1118 RP-1118; American Society of Heating, Refrigerating and Air-Conditioning Engineers, Inc.: Peachtree Corners, GA, USA, 2000; p. 77. [Google Scholar]
- Carslaw, H.G.; Jaeger, J.C. Conduction of Heat in Solids; Oxford University Press: Oxford, UK, 1959; ISBN 0198533683. [Google Scholar]
- Mogensen, P. Fluid to duct wall heat transfer in duct system heat storage. In Proceedings of the International Conference on Subsurface Heat Storage in Theory and Practice, Stockholm, Sweden, 6–8 June 1983; Ed. Swedish Council for Building Research, Sweden, 1983. pp. 652–657. [Google Scholar]
- Eskilson, P. Thermal Analysis of Heat Extraction Boreholes. Ph.D. Thesis, Department of Mathematical Physics, University of Lund, Lund, Sweden, 1987; p. 264. [Google Scholar]
- Bandos, T.V.; Montero, Á.; Fernández, E.; Santander, J.L.G.; Isidro, J.M.; Pérez, J.; de Córdoba, P.J.F.; Urchueguía, J.F. Finite Line-Source Model for Borehole Heat Exchangers: Effect of Vertical Temperature Variations. Geothermics 2009, 38, 263–270. [Google Scholar] [CrossRef]
- Spitler, J.D.; Gehlin, S.E.A. Thermal response testing for ground source heat pump systems—An historical review. Renew. Sustain. Energy Rev. 2015, 50, 1125–1137. [Google Scholar] [CrossRef]
- Al-Khoury, R.; Bonnier, P.G.; Brinkgreve, R.B.J. Efficient finite element formulation for geothermal heating systems: Part I: Steady state. Int. J. Num. Methods Eng. 2005, 63, 988–1013. [Google Scholar] [CrossRef]
- Al-Khoury, R.; Bonnier, P.G. Efficient finite element formulation for geothermal heating systems: Part II: Transient. Int. J. Num. Methods Eng. 2006, 67, 725–745. [Google Scholar] [CrossRef]
- Quiñones-Rozo, C. Lugeon test interpretation, revisited. In Collaborative Management of Integrated Watersheds, US Society of Dams, Proceedings of the 30th Annual Conference; Sacramento, CA, USA, 12–16 April 2010, Hosted by Bureau of Reclamation: Washington, DC, USA, 2010; pp. 405–414. [Google Scholar]
- Chiasson, A.; Rees, S.J.; Spitler, J.D. A preliminary assessment of the effects of ground-water flow on closed-loop ground-source systems. ASHRAE Trans. 2000, 106, 380–393. [Google Scholar]
- Verein Deutscher Ingenieure-VDI. VDI 4640 Part 1. In Thermal Use of the Underground: Fundamentals, Approvals, Environmental Aspects; Verein Deutscher Ingenieure: Düsseldorf, Germany, 2010.
Disclaimer/Publisher’s Note: The statements, opinions and data contained in all publications are solely those of the individual author(s) and contributor(s) and not of MDPI and/or the editor(s). MDPI and/or the editor(s) disclaim responsibility for any injury to people or property resulting from any ideas, methods, instructions or products referred to in the content. |
© 2024 by the authors. Licensee MDPI, Basel, Switzerland. This article is an open access article distributed under the terms and conditions of the Creative Commons Attribution (CC BY) license (https://creativecommons.org/licenses/by/4.0/).