Abstract
Nuclear graphite plays a crucial role in thermal-spectrum thorium molten salt reactors (TMSRs) as both the neutron moderator and the construct for the coolant flowing channel. When subjected to irradiation and elevated temperatures, graphite components experience considerable deformation due to a combination of dimensional changes, thermal expansion, irradiation creep, elastic deformation, and changes in thermomechanical characteristics. The lifespan of the graphite component is a limiting factor in TMSR designs as it strongly correlates with the dimensional changes of the graphite. To evaluate the thermal and mechanical reactions of graphite component under TMSR core conditions, it is necessary to couple models of thermal-hydraulics, neutronics, and thermal-mechanics. This paper presents an enhanced methodology for analyzing the deformation of graphite components using the finite element method. Then, this method was applied to analyze a 10-year deformation history of a hexagonal prism assembly (HPA) and it was compared with the traditional hexagonal round channel assembly (RCA). The results demonstrate that the stress–strain field of both types of graphite components undergo significant variations with the increasing neutron fluence from irradiation. HPA graphite exhibits a slower deformation as compared to RCA graphite when subjected to identical operating conditions. In this case, HPA graphite has a lifespan of approximately 10 years, while RCA graphite lasts only 8.8 years.
1. Introduction
Nuclear energy is considered a clean and efficient energy source that plays a crucial role in meeting global energy demands and the urgent need to reduce carbon emissions to achieve carbon neutrality. Molten salt reactors (MSRs) [1,2] are one of the six Generation IV technologies presented in the Technology Roadmap for Generation IV Nuclear Energy Systems [3,4,5] that have garnered tremendous interest from both academic and business communities. Among all the designs of the Generation IV reactor systems, MSRs [6,7,8,9] have emerged as the most promising and revolutionary reactor type, showcasing unparalleled potential for diverse applications [10,11,12,13]. The MSR stands out for its unique design, which features the use of a circulating fluid fuel [14,15,16,17]. This design offers several advantages, such as the ability to operate at near atmospheric pressure, the elimination of risks associated with the melting of solid fuel, and the capability to consistently control the fuel inventory, eliminating the need for refueling outages and unnecessary reactivity during initial fuel loading.
Most of the space within the MSR reactor core [6,8,15,18,19,20,21,22] is occupied by multiple graphite arrays, fulfilling the roles of moderator, reflector, and structural material. In addition, the graphite arrays offer a variety of channels for coolants, control rods, measurement devices, and other necessary components. Throughout the entire service life of the reactor, the graphite will face various demanding conditions, such as high temperatures and intense exposure to fast neutron irradiation. Graphite undergoes dimensional changes when exposed to neutron irradiation in a reactor core. The effects of neutron irradiation on the dimensional change of graphite were reviewed by Neighbour [23] and Marsden [24]. At the micro level, the exposure to fast neutron fluence results in radiation damage, causing graphite crystals to undergo growth along the c-axis direction and shrinkage along the a-axis direction [25]. Macroeconomically, the graphite dimensions first reduce to a minimum, then expand with increasing neutron fluence irradiation, as Figure 1 illustrates [26]. Such geometry deviations could have a significant impact on coolant flow paths, fuel and control device movement, and interaction with interfacing metallic components or structures. The irradiation damage ultimately results in stresses, deformation, and fractures of the graphite structures within the core. Therefore, the structural integrity of the graphite components is crucial for ensuring safety and maximizing the lifetime of an MSR. In order to ensure the safety of an MSR, careful consideration must be given to the design, ensuring that dimensional change of the graphite core components caused by irradiation should not negatively affect the stability or functionality of the core assembly. Furthermore, it is essential that the dimensional change of the graphite resulting from irradiation and temperature effects remains within acceptable limits to preserve the stability and functionality of the core assembly.
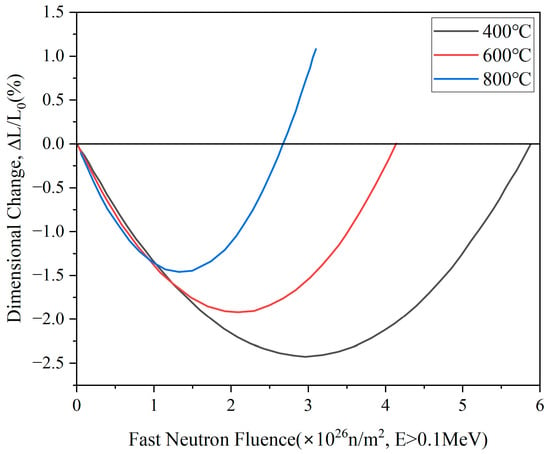
Figure 1.
Curves of dimensional change of IG-110 graphite in relation to temperature and fast neutron fluence [26].
Moreover, the lifespan of the graphite component is a limiting factor in MSR designs as it strongly correlates with the dimensional changes of the graphite. It is commonly described as the time interval during which the dimension of the graphite component gradually returns to its initial value after decreasing to a minimum [21,27,28,29,30]. The lifespan of the graphite component in the reactor has been defined in a variety of ways. The idea that the lifespan of a graphite component should correspond to the irradiation dose required to regain its original volume was first proposed by Kasten [27]. Kelly [28] also proposed that the end of the lifespan of the graphite component be determined by the point at which its original dimensions are fully restored, following shrinkage-induced exhaustion. Platonov [31] applied the identical criterion and determined the lifespan of the graphite components by measuring the critical fluence, the level at which the graphite volume returns to its original state following shrinkage. The subsequent literature [21,22,32] adopted the same calculation method. However, the methods used in these analyses often fail to account for the rapid changes in fast neutron flux within a single graphite component and the influence of temperature on dimensional changes. Consequently, this may result in a notable level of inaccuracy when predicting the lifespan of graphite components. To address this issue, Zhu [29] has developed a comprehensive burnup code that takes into account various physical aspects, including fuel management, neutron transport, and thermal-hydraulic calculations, to investigate dimensional changes in graphite. Additionally, Wang [30] has introduced a one-way coupling approach that integrates neutronics and thermal-hydraulics calculations to assess the dimensional changes in graphite. In summary, the methods mentioned in the above literature are all based on polynomial fitting analysis. In fact, as the structural part of the thorium molten salt reactor (TMSR) core, the graphite components are subject to thermal expansion, irradiation creep, and elastic deformation caused by the extreme conditions of high temperatures, neutron irradiation, and mechanical load [25,27,33]. As a result, the prediction of deformation for graphite components may be inaccurate if only dimensional changes are taken into account.
Hence, the finite element method (FEM) is widely used in graphite stress analysis and lifetime assessments. The innovative FEM code for stress analysis of nuclear graphite components, which was first openly reported in 1970, was developed by Chang [34]. Posterior research conducted by Smith [35] introduced a FEM methodology and software designed for stress analysis of high temperature reactor graphite components. The methodology operated under the assumption that graphite exhibits linear viscoelastic behavior, with total strains being a linear combination of elastic strains. One of the early applications of the FEM for stress analysis was pioneered by Elcoate and Payne [36] in their work on Magnox reactors. Li [37] reported another early modern FEM stress analysis code for gas- cooled reactors, including Magnox reactors. These researchers utilized a User Material (UMAT) interface in Abaqus [38], incorporating adjustments to mechanical properties resulting from fast neutron irradiation and temperature variations. Tsang conducted similar research [39] and compared the results of different methodologies and numerical methods for simulating dimensional change [40]. Recent research has mainly focused on the structural integrity of nuclear graphite bricks in advanced gas-cooled reactors [41,42,43]. It is evident that the overwhelming majority of these studies focus on gas-cooled reactors. However, there is limited literature available that utilizes the FEM for investigating graphite components in molten salt reactors. This study resolves the restriction by presenting an enhanced approach to investigating the irradiated dimensional change strain of graphite components. This method combines the use of the nuclear graphite constitutive model with the FEM to provide a more comprehensive analysis of the behavior of graphite components under irradiation.
In previous research [30], a novel solid hexagonal prism assembly (HPA) was proposed and contrasted with the conventional round channel assembly (RCA) in order to increase the lifespan of the graphite components. The schematic diagram of the two types of assemblies is shown in Figure 2, where Figure 2a represents the HPA and Figure 2b represents the RCA. The HPA transforms the molten salt flowing inside the graphite into flowing outside the graphite, which is the main distinction between the HPA and the RCA. Due to a substantial increase in the heat-exchanging surface area, the temperature distribution of HPA graphite is noticeably more uniform compared to RCA graphite. Additionally, the average temperature within HPA graphite is lower than that of RCA graphite. The fast neutron flux distribution of the HPA is flatter than that of the RCA, and its average fast neutron flux is similarly lower than that of the RCA [30]. Previous research [30] conducted a comparative analysis on the lifespan of two types of graphite components using polynomial fitting analysis. However, these analyses are preliminary and rough. To achieve more significant engineering guidance, this paper uses the FEM to investigate the dimensional change strain caused by irradiation on the graphite components. This study considered elastic deformation, irradiation creep, dimensional change, and thermal expansion, using a material constitutive model of graphite.
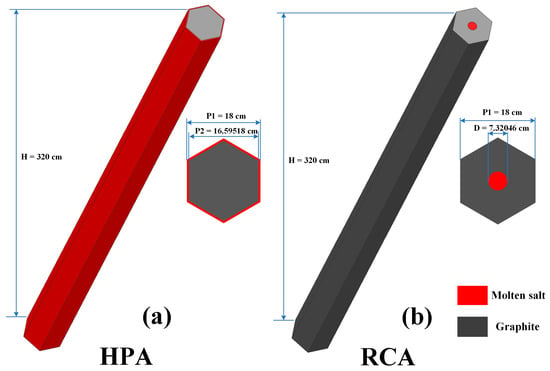
Figure 2.
The schematic diagram of the HPA (a) and the RCA (b).
2. Methodology
2.1. Constitutive Equations for UMAT
Graphite components exposed to high temperatures and irradiation experience thermal expansion, elastic deformation, and irradiation creep, in addition to changes in dimensions. Thermal and irradiation gradients can also cause stress, which is induced by thermal and irradiation effects. The impact of irradiation on creep behavior is generally not as significant as the change in graphite dimensions. Nonetheless, in graphite component designs, the strain caused by irradiated graphite creep can play a key role. Creep in graphite helps to relieve stresses caused by temperature variations and dimensional shifts, ultimately preventing premature failures of graphite components [41]. The model that elucidates the correlation between irradiation neutron fluence, temperature, and graphite deformation is commonly referred to as the graphite material constitutive model [44,45]. The total strain within irradiated graphite is the sum of five different strain components:
where is the total strain, is the elastic strain, is the primary creep strain, is the secondary creep strain, is the dimensional change strain, and is the thermal strain. This paper addresses the stress–strain analysis of a graphite component, which presents challenges such as small deformation and material nonlinearity. To tackle the issue of material nonlinearity, Abaqus employs the Newton iteration method for solving the problem [38]. At the commencement of each successive step, the Abaqus main program transfers the strain increment to the UMAT subroutine. This action prompts UMAT to update the stress value and tangent operator matrix needed by the Newton iteration algorithm [38]. Therefore, this paper introduces the incremental form of the constitutive model. Then, Equation (1) can be written as Equation (2):
where is the elastic strain increment vector, is the primary creep strain increment vector, is the secondary creep strain increment vector, is the dimensional change strain increment vector, and is the thermal strain increment vector.
The primary creep strain increment vector is given in Equation (3), and the secondary creep strain increment vector is given in Equation (4).
where is the stress vector; is the stress increment vector; is the primary creep coefficient [26], as given in Equation (5); is the secondary creep coefficient [26], as given in Equation (6); is the product of the fast neutron flux and time , as given in Equation (7); and is a creep relationship matrix [38] that illustrates the correlation between the creep stress vector and strain vector, as given in Equation (8).
where is elastic modulus before irradiation, [26], [26], is the temperature (), and is Poisson’s ratio.
The empirical model of the dimensional change [26] is given in Equation (9). The dimensional change strain increment vector is given in Equation (10) [38].
where are the temperature-dependent empirical constant, as shown in Table 1.

Table 1.
Values of and .
The thermal expansion strain increment vector is given by Equation (11):
where , , represents the temperature (), and represents the thermal expansion coefficient after irradiation.
The thermal expansion coefficient is a crucial physical indicator for assessing the thermodynamic properties of IG-110 graphite. In a study conducted by the Japan Atomic Energy Agency [26], a comprehensive collection of data on the thermal expansion coefficient of IG-110 graphite post-irradiation was compiled. These data were used to create graphs showing the variations in the thermal expansion coefficient at different temperatures and neutron doses, as illustrated in Figure 3. The corresponding relationship can be expressed as Equation (12):
where is the thermal expansion coefficient before irradiation; is the thermal expansion coefficient after irradiation; , , , , are constants varied with the temperature, the values shown in Table 2; is the accumulated irradiation fast neutron fluence; and is the fast neutron fluence at turnaround.
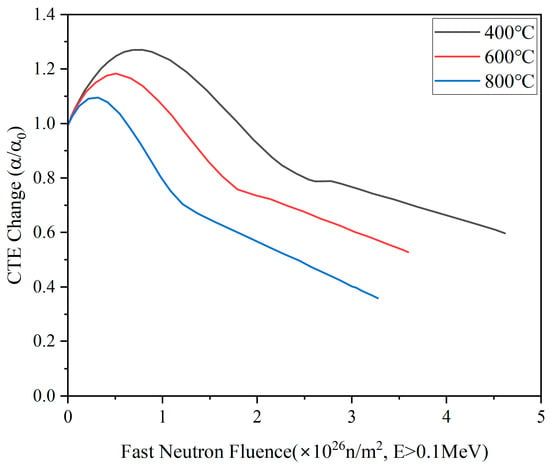
Figure 3.
Curves of thermal expansion coefficient change of IG-110 graphite in relation to temperature and fast neutron fluence [26].

Table 2.
Values of , , , , , and .
Equation (13) elucidates the incremental form of the stress–strain relationship during the elastic stage, which can be simplified as Equation (14).
where is the elastic matrix and is the elastic increment matrix.
where is the Lame constant, is the shear modulus, is elastic modulus after irradiation.
The elastic modulus of IG-110 graphite undergoes rapid increase during the initial stage of neutron irradiation, eventually reaching a peak after a certain period of time. Subsequently, with the ongoing increase in irradiation dose, the elastic modulus of IG-110 graphite gradually decreases. Moreover, it is observed that at higher irradiation temperatures, the maximum value of the elastic modulus of IG-110 graphite is smaller, with a corresponding lower dose. The variation is shown in Figure 4 and Equation (19).
where is the elastic modulus after irradiation; is elastic modulus before irradiation; is the fast neutron fluence at the beginning of the high fluence region; and , , , , are constants varied with the temperature, the values of which are shown in Table 3.
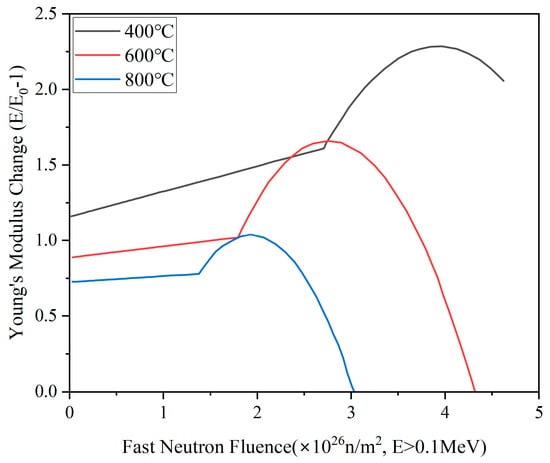
Figure 4.
Curves of elastic modulus change of IG-110 graphite in relation to temperature and fast neutron fluence [26].

Table 3.
Values of , , , , , and .
2.2. Coupling Method for Dimensional Change Strain
The primary factors that influence the deformation of graphite are the level of fast neutron fluence and the temperature it is exposed to. The conventional method utilizes a quadratic function to explain dimensional changes, allowing for the calculation of graphite deformation and lifespan [29,30]. While this method is easy to use, it overlooks factors such as thermal expansion, elastic deformation, and irradiation creep. In order to overcome this limitation, this paper proposes an enhanced approach for assessing graphite deformation by utilizing the nuclear graphite constitutive model and the FEM. The calculation process is illustrated in Figure 5.

Figure 5.
Coupling calculation scheme.
The temperature and density of the fuel salt and graphite were first assumed to be uniform in the OpenMC [46] input file to start the neutronics calculation. After initializing the codes, the following steps were performed.
- OpenMC ran the coupled neutron–photon transport simulation to get the relative power distribution, which was then normalized and multiplied by the known total power to get the actual power density. A power density array was then written to a UDF file as the heat source for Fluent [47]. The fast neutron flux distribution (E > 0.1 MeV) was also tallied.
- After compiling the UDF file, Fluent was launched to start the thermal-hydraulic calculation. The calculation concludes once the temperature and velocity fields satisfy the residual convergence criteria defined by the user. At this point, a precise temperature distribution was derived.
- The array containing the temperature distribution with 3D coordinates was saved into a CSV file. The same processing method was used for the fast neutron flux distribution. Then, the two files were loaded as predefined fields in the load module of Abaqus. Finally, a calculation job was submitted that calls the UMAT subroutine.
- In the neutronics calculation model, the HPA was divided into 320 regions, as shown in Figure 6. The same processing method was used for the RCA. In the neutronics calculation model, each region is composed of multiple meshes for thermal-hydraulic calculation using Fluent. The average temperature for each region was calculated based on the specific material number assigned in DAG-OpenMC [48]. Each region is assigned a unique material number for reference. DAG-OpenMC then read the temperature data to update the properties and cross-sections, assuming that cross sections are accessible at temperatures , and a region material is designated a temperature , where . Statistical interpolation is implemented in the following manner: A random number is generated from a uniform distribution within the range of 0 to 1. If , the cross sections at temperature were utilized. Otherwise, the cross sections at were utilized.
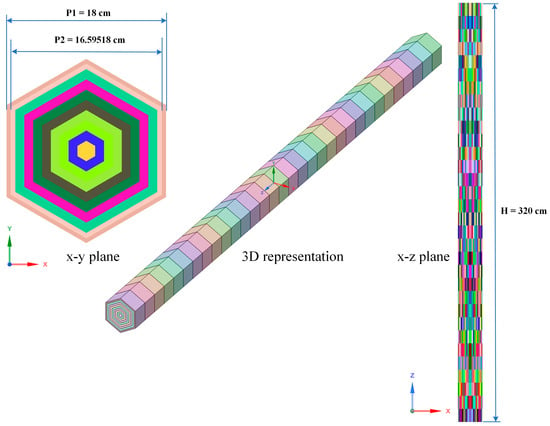 Figure 6. Schematic view of HPA neutronic regions.
 - The above iteration was carried out until calculations were manually stopped.
2.3. Neutronics Model
OpenMC is an exceptional open-source continuous-energy neutron–photon Monte Carlo code that offers a wide range of capabilities, including the ability to perform cell and libMesh unstructured mesh tallies, k-eigenvalue and fixed source calculations, and many other advanced features [46]. Direct Accelerated Geometry Monte Carlo (DAGMC) is a software package that allows users to perform Monte Carlo radiation transport directly on CAD models [48]. DAGMC (version 3.2.3) has been implemented in OpenMC and is referred to as DAG-OpenMC in this paper. The libMesh library provides a framework for the numerical simulation of partial differential equations using arbitrary unstructured discretizations on serial and parallel platforms [49]. The libMesh library has also been implemented in OpenMC through compiling source code. In the present work, the neutronics models were built using DAG-OpenMC for CAD-based geometries and libMesh for unstructured mesh tallies. The geometric and material properties used in the neutronics calculation are displayed in Table 4. Reflective BCs were applied to the six lateral faces, with vacuum BCs on the top and bottom faces. A neutron population of 100,000 was utilized per generation, with 1100 total batches and 100 batches discarded. A total of 1,468,800 hexahedron meshes were constructed in the HPA, while a total of 1,522,800 hexahedron meshes were built in the RCA for the purpose of tallying energy deposition and fast neutron flux (E > 0.1 MeV).

Table 4.
Geometric and material properties of HPA and RCA.
In this paper, based on the ENDF/B-VIII.0 [50] nuclear data, a cross-section library between 873.15 K and 1023.15 K with 3 K internals was produced by NJOY2016 [51]. HDF5 files were created by first processing source ENDF files into ACE files, then using the openmc.data python module to convert ACE data into HDF5.
2.4. Thermal-Hydraulics Model
The Fluent code [47] was selected as the Computational Fluid Dynamics (CFD) code to solve the temperature distribution in the HPA and the RCA. The user-defined function (UDF) in Fluent is utilized to incorporate the energy deposition tallied by OpenMC as a source term in thermal-hydraulic computations. By utilizing the UDF function supported by Fluent, the intricate energy deposition distribution can be converted into a power distribution and integrated into the calculation. The realizable k-ε turbulence model [47,52] was selected together with the scalable wall-function. The inlet temperature and inlet velocity of the fuel salt were 873.15 K and 1.75 m/s, respectively. Symmetry boundary conditions were applied to the six lateral faces. The thermo-physical properties of the fuel salt and the graphite are presented in Table 5. Irradiation has a notable impact on the thermal conductivity of graphite, which experiences an initial sharp decrease, followed by stabilization at a constant state, before decreasing further, as shown in Figure 7. In order to accurately calculate graphite temperature under varying irradiation fluences, it is imperative to take into account the corresponding thermal conductivity of the graphite, as rapid changes in thermal conductivity can result in significant temperature fluctuations.

Table 5.
Thermo-physical properties of fuel salt and graphite.
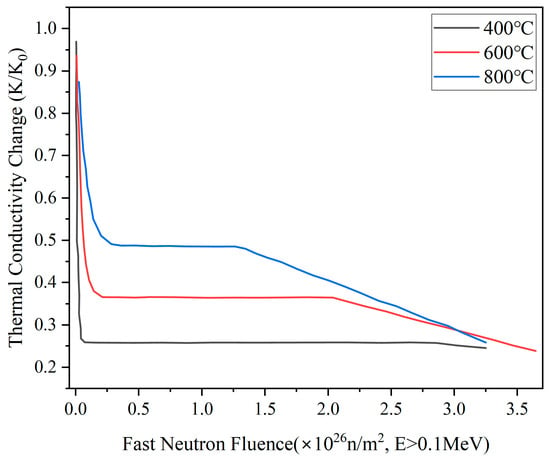
Figure 7.
Curves of thermal conductivity change of IG-110 graphite in relation to temperature and fast neutron fluence [26].
2.5. Mechanical Model
Figure 8a illustrates the FEM model of HPA graphite, while Figure 9a depicts the FEM model of RAC graphite. The material properties of the graphite used in the Abaqus calculations are shown in Table 5. The FEM model of HPA graphite comprised 341,120 C3D8 elements, while the FEM model of RAC graphite consisted of 311,040 C3D8 elements. The C3D8 element is a general-purpose linear brick element, fully integrated (2 × 2 × 2 integration points) [38]. Three supple spring constraints were implemented in the FEM model to restrict the displacement of the axial rigid body. A ten-year deformation history for both HPA and RCA was calculated.
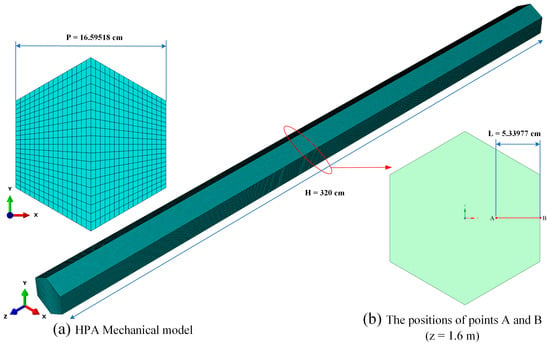
Figure 8.
FEM model of HPA graphite and position of Path-AB in HPA.
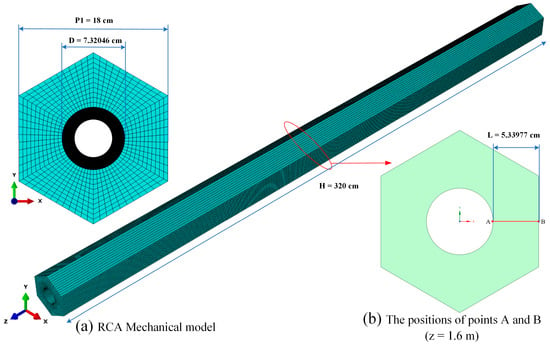
Figure 9.
FEM model of HPA graphite and position of Path-AB in RCA.
3. Analysis and Discussion
3.1. Verification of UMAT
A graphite cylinder model was utilized for verification [44], with the goal of validating the accuracy of the modified stress algorithm implementation and tangent operator matrix in the graphite constitutive model. The cylinder has dimensions that include a length of 13.6 m, an inner diameter of 1.55 m, and an outer diameter of 2.3 m. The neutron fluence of irradiation was assumed to be , and the temperature was consistently maintained at 873.15 K. As depicted in Figure 10, the axial and radial stress profiles on the inner wall of the cylinder in this study closely mirror those observed in the reference study [44]. This apparent concordance demonstrates the precision of the implementation of the constitutive model and the tangent operator matrix. It establishes a strong foundation for the subsequent deformation analysis of the graphite components in the TMSR.
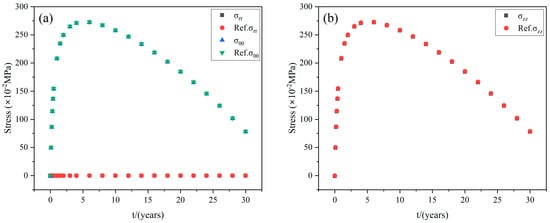
Figure 10.
Comparison of solutions of radial (a) and axial stress (b) on the inside wall.
3.2. Analysis of Stress–Strain Field
As shown in Figure 11, the neutron fluxes in the RCA and the HPA both exhibit a cosine distribution along the axial direction, with the peak neutron flux occurring at the center of the axial assembly. In the HPA, the fast neutrons have increased opportunities to penetrate graphite from the fuel salt, as the contact area between the molten salt and graphite has expanded. Figure 11a,d depict that the overall distribution of fast neutron flux in the HPA is more evenly spread out compared to that in the RCA. The maximum principal stress inside the graphite increases with a higher neutron flux distribution gradient. Consequently, when running at the same power level, the stress generated by the irradiation flux gradient in RCA graphite might be greater than that in HPA graphite.
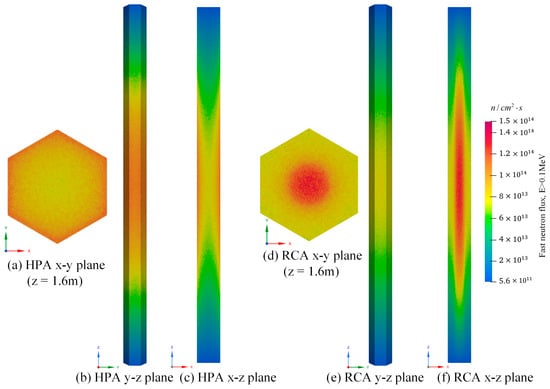
Figure 11.
Fast neutron flux distribution of HPA and RCA.
Due to their distinct structures, the RCA and HPA exhibit significant variations in temperature distribution. Figure 12a,b illustrate the axial temperature distribution of the HPA and RCA, respectively. The axial temperature of the graphite component initially increases to its maximum value, subsequently decreasing gradually. The highest temperature is recorded in the upper-middle portion of the graphite component. The center temperature of HPA graphite is the highest, while its outer boundary temperature is the lowest. In contrast, RCA graphite exhibits the opposite pattern. As shown in Figure 12c,d, the temperature distribution of the HPA is more evenly distributed compared to that of the RCA. The decreased operating temperature in the HPA leads to a slower rate of dimensional change compared to the RCA. This results in an extended lifespan for graphite in the HPA. Additionally, the lower temperature gradient in the HPA results in reduced thermal stress when compared to the RCA.
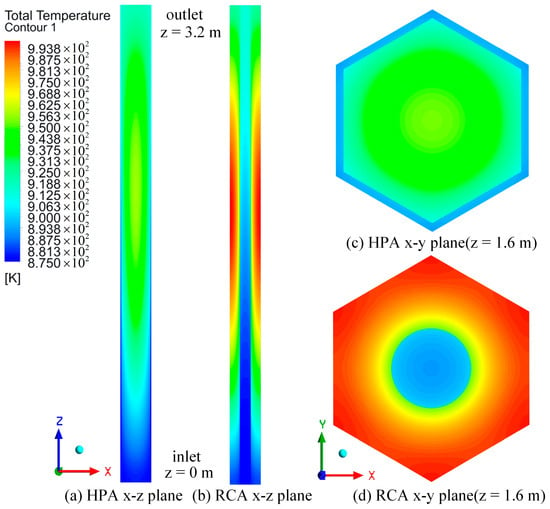
Figure 12.
Temperature distribution of HPA and RCA.
In the early stages of life, thermal stress occurs in the graphite component as a result of the uneven distribution of temperature, as illustrated in Figure 12. A greater temperature gradient results in higher levels of thermal stress. Following irradiation, dimensional changes and irradiation creep lead to the development of irradiation stress in graphite components. The stress distribution within the graphite component experiences significant changes as time progresses. The peak stress of von Mises gradually increases as the neutron fluence generated by irradiation increases. Initially, the maximum stress is concentrated at the midpoint, then it shifts towards the upper and lower midsections, before finally returning to the midpoint.
Figure 13 illustrates the variation in radial strain along Path-AB within the cross-sectional plane at a height of 1.6 m as depicted in Figure 9b, observed over different time intervals. The total strain at year 0 is not zero, as it is influenced by the thermal expansion caused by the ambient temperature rising to the operating temperature. However, in the case of the HPA, this value is relatively small due to the lower temperature of the HPA, as illustrated in Figure 12c,d. Both the total strain and dimensional change strain along Path-AB show an initial decrease, followed by an increase over time. During the initial stage of strain reduction, it is indicated that graphite is undergoing contraction. As the irradiation time increases, the strain gradually intensifies, indicating that the graphite is expanding. It is important to note that the trend observed in the total strain curve closely follows that of the dimensional strain curve. This implies that the primary factor influencing graphite deformation is the change in dimensions.
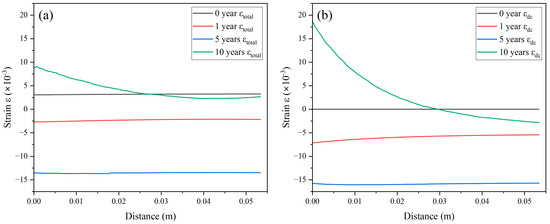
Figure 13.
Curves illustrating the total strain (a) and dimensional change strain (b) over time along Path-AB in RCA.
The distribution of strain along Path-AB has progressively become more horizontal following five years of operation. At this point in time, RCA graphite has reached its minimum volume state. At this stage, the axial center position of RCA graphite is experiencing uniform deformation, resembling unconstrained isothermal expansion. This deformation occurs without any visible signs of stress at the axial center position of RCA graphite, which explains the low stress levels observed in the axial direction at this specific location. For HPA graphite, this stage is expected to be reached in approximately 6.5 years.
The stress field within the graphite component is significantly influenced by both changes in temperature and the level of neutron fluence from irradiation. The radial stress along Path-AB in Figure 14 decreases initially after 0, 1, and 10 years of operation, followed by an increase. Both types of graphite demonstrate this simultaneous trend of change. Detailed stress distributions for both types of graphite at different times are presented in Figure 15 and Figure 16, which show distinct patterns and variations over time. HPA graphite exhibits a more gradual change in stress compared to RCA graphite, as shown by the data presented in Figure 14. The primary reason is that the fast neutron flux distribution of HPA graphite is more uniform compared to RCA graphite, and its average fast neutron flux is similarly lower than that of the RCA. According to Figure 14, RCA graphite reaches a state of uniform stress distribution in the fifth year, while HPA graphite achieves this in the sixth and a half year. This implies that HPA graphite has a longer lifespan. It is worth noting that the stress level of HPA graphite is lower than that of RCA graphite at this stage.
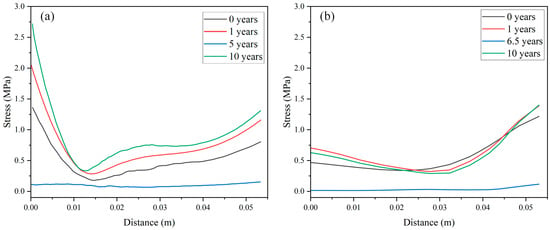
Figure 14.
Stress change curves along Path-AB in RCA (a) and HPA (b) in relation to time.

Figure 15.
Cross-section (z = 1.6 m) of von Mises stress (MPa) of RCA graphite under different operation years.

Figure 16.
Cross-section (z = 1.6 m) of von Mises stress (MPa) of HPA graphite under different operation years.
The transition observed in the four stress curves indicates that irradiation has the potential to significantly impact the stress distribution within the component, even when other variables are held constant. Figure 15 and Figure 16 offer additional detailed evidence that supports and bolsters this argument. High stress zones are primarily found in areas with high fast neutron flux, as opposed to areas with high temperatures. Although elevated temperatures can contribute to increased stress, the stress level in the high-temperature region is significantly lower than in the high-neutron flux region. From this perspective, it can be seen that HPA has superior radiation resistance compared to RCA.
3.3. Analysis of Graphite Lifespan
As illustrated in Figure 17 and Figure 18, over the course of 10 years of operation, there were dynamic fluctuations observed in the total strain, elastic strain, irradiation creep strain, dimensional change strain, and thermal expansion strain. Observing both figures, it is evident that the thermal strain initially rises before gradually decreasing. This pattern is attributed to variations in the coefficient of thermal expansion as neutron fluence levels increase. Simultaneously, it is evident that the strain in terms of dimensional change and total strain initially decreases and subsequently increases. Irradiation creep strain typically manifests itself at a later stage, whereas the elastic strain remains relatively minimal in comparison.
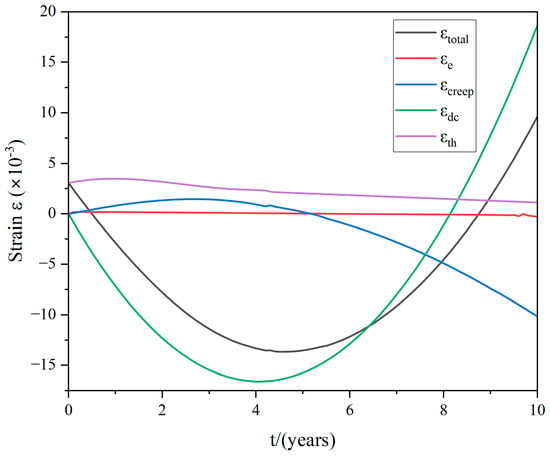
Figure 17.
Strain change curves at the points B in RCA.
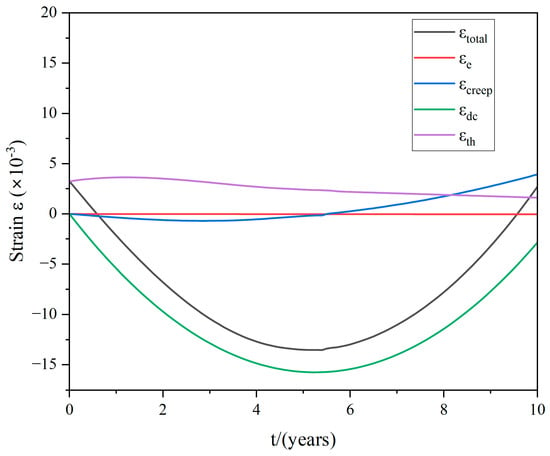
Figure 18.
Strain change curves at the points B in HPA.
The irradiation creep trend suggests that it insidiously minimizes deformation, resulting in an overall decrease in strain when compared to strain caused by dimensional changes. Furthermore, the higher irradiation neutron fluence at RCA graphite results in a faster rate of change in the total strain compared to HPA graphite.
The lifespan of a graphite component is determined by the time it takes for its dimensions to return to their original state at the Beginning of Life (BOL). However, variations in axial neutron flux and temperature result in differing recovery times to the BOL state at various heights of the component. The center position of the graphite along the axial direction, where Path-AB is located, restores to the BOL state the fastest. Hence, the lifespan of the graphite is determined by the duration required for the total strain at point B to revert back to its initial state at the BOL. The HPA graphite lifespan is 10 years, and the RCA graphite lifespan is 8.8 years.
4. Conclusions
This paper presents an enhanced approach for determining the lifespan of graphite using a combination of the graphite constitutive model and the FEM. A 10-year deformation history of two types of graphite components in TMSR was estimated by the improved method. The following conclusions can be drawn from this paper:
- The factors influencing graphite deformation under high temperatures and irradiation are numerous. These include thermal expansion, irradiation creep, changes in thermo-mechanical physical parameters, and dimensional changes. Simply analyzing graphite lifespan based solely on dimensional changes may lead to inaccuracies. By utilizing an improved method that incorporates a graphite material constitutive model, all these factors can be comprehensively considered. As a result, the calculated graphite lifespan using the improved method is likely to be more accurate. The HPA graphite lifespan is 10 years, and the RCA graphite lifespan is 8.8 years.
- An examination of the behavior of stress–strain and lifespan indicates that dimensional changes play a crucial role in graphite deformation, significantly impacting the overall trend. Furthermore, irradiation creep is shown to reduce stress significantly. The stress field undergoes significant changes as irradiation neutron fluence increases. The peak stress within the graphite component also increases with higher levels of irradiation neutron fluence. When the volume decreases to a minimum, the center of the component experiences uniform deformation with the least amount of stress. For HPA graphite, this stage is expected to be reached in approximately 6.5 years. However, RCA graphite will reach that stage more rapidly.
It should be noted that the objective of this work was not to perform an exact engineering design analysis, but rather to develop a theoretical background to evaluate the dimensional change and lifespan of graphite components in a thorium molten salt reactor (TMSR). The method developed in this work allows for the implementation of parametric design for various graphite components, thus enabling the identification of the most suitable candidates that align with the specified requirements. The next primary objective is to meticulously screen graphite components to ensure that they are of an optimal size. The objective of future research will be to concentrate on the practical engineering applications of this topic.
Author Contributions
Conceptualization, Y.Z.; methodology, Y.Z.; software, Y.Z.; resources, C.Z. and G.Z.; data curation, Q.W. and Z.W.; writing—original draft preparation, Y.Z.; writing—review and editing, Y.Z., C.Z. and G.Z.; visualization, Y.Z. and Q.W.; supervision, C.Z., G.Z. and W.G.; project administration, W.G.; funding acquisition, C.Z. and G.Z. All authors have read and agreed to the published version of the manuscript.
Funding
This research was funded by the Youth Innovation Promotion Association of the Chinese Academy of Sciences, grant number 2022258, and the National Natural Science Foundation of China, grant number 12005290.
Data Availability Statement
The data presented in this study are available on request from the corresponding author. The data are not publicly available due to privacy.
Conflicts of Interest
The authors declare no conflicts of interest.
References
- Serp, J.; Allibert, M.; Beneš, O.; Delpech, S.; Feynberg, O.; Ghetta, V.; Heuer, D.; Holcomb, D.; Ignatiev, V.; Kloosterman, J.L.; et al. The Molten Salt Reactor (MSR) in Generation IV: Overview and Perspectives. Prog. Nucl. Energy 2014, 77, 308–319. [Google Scholar] [CrossRef]
- Ignatiev, V.V. Molten Salt Reactors. In Encyclopedia of Nuclear Energy; Greenspan, E., Ed.; Elsevier: Oxford, UK, 2021; pp. 553–568. ISBN 978-0-12-819732-5. [Google Scholar]
- Doe, U.S. A Technology Roadmap for Generation IV Nuclear Energy Systems. 2002. Available online: https://www.gen-4.org/gif/jcms/c_40481/technology-roadmap (accessed on 10 April 2024).
- Locatelli, G.; Mancini, M.; Todeschini, N. Generation IV Nuclear Reactors: Current Status and Future Prospects. Energy Policy 2013, 61, 1503–1520. [Google Scholar] [CrossRef]
- Kelly, J.E. Generation IV International Forum: A Decade of Progress through International Cooperation. Prog. Nucl. Energy 2014, 77, 240–246. [Google Scholar] [CrossRef]
- Jorgensen, L. 19—ThorCon Reactor. In Molten Salt Reactors and Thorium Energy; Dolan, T.J., Ed.; Woodhead Publishing: Sawston, UK, 2017; pp. 557–564. ISBN 978-0-08-101126-3. [Google Scholar]
- Zhu, G.-F.; Yan, R.; Peng, H.-H.; Ji, R.-M.; Yu, S.-H.; Liu, Y.-F.; Tian, J.; Xu, B. Application of Monte Carlo Method to Calculate the Effective Delayed Neutron Fraction in Molten Salt Reactor. Nucl. Sci. Tech. 2019, 30, 34. [Google Scholar] [CrossRef]
- Carter, J.P.; Borrelli, R.A. Integral Molten Salt Reactor Neutron Physics Study Using Monte Carlo N-Particle Code. Nucl. Eng. Des. 2020, 365, 110718. [Google Scholar] [CrossRef]
- Wu, J.; Chen, J.; Cai, X.; Zou, C.; Yu, C.; Cui, Y.; Zhang, A.; Zhao, H. A Review of Molten Salt Reactor Multi-Physics Coupling Models and Development Prospects. Energies 2022, 15, 8296. [Google Scholar] [CrossRef]
- He, L.; Chen, L.; Xia, S.; Zou, Y. Minor Actinides Transmutation and 233U Breeding in a Closed Th-U Cycle Based on Molten Chloride Salt Fast Reactor. Energies 2022, 15, 9472. [Google Scholar] [CrossRef]
- Peng, M.; Liu, Y.; Zou, Y.; Dai, Y. Preliminary Design and Study of a Small Modular Chlorine Salt Fast Reactor Cooled by Supercritical Carbon Dioxide. Energies 2023, 16, 4862. [Google Scholar] [CrossRef]
- Yu, K.; Cheng, M.; Zuo, X.; Dai, Z. Transmutation and Breeding Performance Analysis of Molten Chloride Salt Fast Reactor Using a Fuel Management Code with Nodal Expansion Method. Energies 2022, 15, 6299. [Google Scholar] [CrossRef]
- Yang, P.; Lin, Z.-K.; Wan, W.; Zhu, G.-F.; Yu, X.-H.; Dai, Z.-M. Preliminary Neutron Study of a Thorium-Based Molten Salt Energy Amplifier. Nucl. Sci. Tech. 2020, 31, 41. [Google Scholar] [CrossRef]
- Zou, C.; Yu, C.; Wu, J.; Cai, X.; Chen, J. Transition to Thorium Fuel Cycle in a Small Modular Molten Salt Reactor Based on a Batch Reprocessing Mode. Ann. Nucl. Energy 2020, 138, 107163. [Google Scholar] [CrossRef]
- Zou, C.; Zhu, G.; Yu, C.; Zou, Y.; Chen, J. Preliminary Study on TRUs Utilization in a Small Modular Th-Based Molten Salt Reactor (smTMSR). Nucl. Eng. Des. 2018, 339, 75–82. [Google Scholar] [CrossRef]
- Zou, C.Y.; Cai, C.Z.; Yu, C.G.; Wu, J.H.; Chen, J.G. Transition to Thorium Fuel Cycle for TMSR. Nucl. Eng. Des. 2018, 330, 420–428. [Google Scholar] [CrossRef]
- Bei, X.; Dai, Y.; Yu, K.; Cheng, M. Three-Dimensional Surrogate Model Based on Back-Propagation Neural Network for Key Neutronics Parameters Prediction in Molten Salt Reactor. Energies 2023, 16, 4044. [Google Scholar] [CrossRef]
- Engel, J.R.; Bauman, H.F.; Dearing, J.F.; Grimes, W.R.; McCoy, H.E.; Rhoades, W.A. Conceptual Design Characteristics of a Denatured Molten-Salt Reactor with Once-Through Fueling; Oak Ridge National Lab: Oak Ridge, TN, USA, 1980.
- Honma, Y.; Shimazu, Y.; Narabayashi, T. Optimization of Flux Distribution in a Molten-Salt Reactor with a 2-Region Core for Plutonium Burning. Prog. Nucl. Energy 2008, 50, 257–261. [Google Scholar] [CrossRef]
- Nuttin, A.; Heuer, D.; Billebaud, A.; Brissot, R.; Le Brun, C.; Liatard, E.; Loiseaux, J.-M.; Mathieu, L.; Meplan, O.; Merle-Lucotte, E.; et al. Potential of Thorium Molten Salt Reactorsdetailed Calculations and Concept Evolution with a View to Large Scale Energy Production. Prog. Nucl. Energy 2005, 46, 77–99. [Google Scholar] [CrossRef]
- Nagy, K.; Kloosterman, J.L.; Lathouwers, D.; van der Hagen, T.H.J.J. The Effects of Core Zoning on the Graphite Lifespan and Breeding Gain of a Moderated Molten Salt Reactor. Ann. Nucl. Energy 2012, 43, 19–25. [Google Scholar] [CrossRef]
- Mitachi, K.; Yamamoto, T.; Yoshioka, R. Three-Region Core Design for 200-MW(Electric) Molten-Salt Reactor with Thorium-Uranium Fuel. Nucl. Technol. 2007, 158, 348–357. [Google Scholar] [CrossRef]
- Neighbour, G.B. Modelling of Dimensional Changes in Irradiated Nuclear Graphites. J. Phys. D Appl. Phys. 2000, 33, 2966. [Google Scholar] [CrossRef]
- Marsden, B.J.; Haverty, M.; Bodel, W.; Hall, G.N.; Jones, A.N.; Mummery, P.M.; Treifi, M. Dimensional Change, Irradiation Creep and Thermal/Mechanical Property Changes in Nuclear Graphite. Int. Mater. Rev. 2016, 61, 155–182. [Google Scholar] [CrossRef]
- Campbell, A.A.; Burchell, T.D. 3.11—Radiation Effects in Graphite☆. In Comprehensive Nuclear Materials, 2nd ed.; Konings, R.J.M., Stoller, R.E., Eds.; Elsevier: Oxford, UK, 2020; pp. 398–436. ISBN 978-0-08-102866-7. [Google Scholar]
- Shibata, T.; Sawa, K.; Eto, M.; Kunimoto, E.; Shiozawa, S.; Oku, T.; Maruyama, T. Draft of Standard for Graphite Core Components in High Temperature Gas-Cooled Reactor; Japan Atomic Energy Agency: Tokai, Japan, 2010.
- Kasten, P.R.; Bettis, E.S.; Cook, W.H.; Eatherly, W.P.; Holmes, D.K.; Kedl, R.J.; Kennedy, C.R.; Kirslis, S.S.; McCoy, H.E.; Perry, A.M.; et al. Graphite Behavior and Its Effects on MSBR Performance. Nucl. Eng. Des. 1969, 9, 157–195. [Google Scholar] [CrossRef]
- Kelly, B.T. Irradiation Behavior of Fine-Grain Graphites. Fusion Technol. 1989, 16, 96–103. [Google Scholar] [CrossRef]
- Zhu, G.; Guo, W.; Kang, X.; Zou, C.; Zou, Y.; Yan, R.; Dai, Y. Neutronic Effect of Graphite Dimensional Change in a Small Modular Molten Salt Reactor. Int. J. Energy Res. 2021, 45, 11976–11991. [Google Scholar] [CrossRef]
- Wang, Y.; Guo, W.; Zhu, G.; Dai, Y.; Zhong, Y.; Zou, Y.; Chen, J.; Cai, X. A New Structure Design to Extend Graphite Assembly Lifespan in Small Modular Molten Salt Reactors. Int. J. Energy Res. 2021, 45, 12247–12257. [Google Scholar] [CrossRef]
- Platonov, P.A.; Chugunov, O.K.; Manevsky, V.N.; Karpukhin, V.I. Radiation Damage and Life-Time Evaluation of RBMK Graphite Stack. In Proceedings of the Graphite Moderator Lifecycle Behaviour, Bath, UK, 24–27 September 1995; pp. 79–90. [Google Scholar]
- Oku, T.; Ishihara, M. Lifetime Evaluation of Graphite Components for HTGRs. Nucl. Eng. Des. 2004, 227, 209–217. [Google Scholar] [CrossRef]
- Marsden, B.J.; Jones, A.N.; Hall, G.N.; Treifi, M.; Mummery, P.M. 14—Graphite as a Core Material for Generation IV Nuclear Reactors. In Structural Materials for Generation IV Nuclear Reactors; Yvon, P., Ed.; Woodhead Publishing: Sawston, UK, 2017; pp. 495–532. ISBN 978-0-08-100906-2. [Google Scholar]
- Chang, T.Y.; Rashid, Y.R. Viscoelastic Response of Graphitic Materials in Irradiation Environments. Nucl. Eng. Des. 1970, 14, 181–190. [Google Scholar] [CrossRef]
- Smith, P.D.; Pelessone, D. Consistent Linearization Method for Finite-Element Analysis of Viscoelastic Materials. In Proceedings of the 7th International Conference on Structural Mechanics in Reactor Technology, Chicago, IL, USA, 22–26 August 1983. [Google Scholar]
- Elcoate, C.D.; Payne, J.F.B. Pile Grade A Graphite—Constitutive Modelling. 2001. Available online: https://repository.lib.ncsu.edu/server/api/core/bitstreams/261d0537-a980-4f59-b32d-264fa2c08d51/content (accessed on 10 April 2024).
- Li, H.; Marsden, B.J.; Fok, S.L. Relationship between Nuclear Graphite Moderator Brick Bore Profile Measurement and Irradiation-Induced Dimensional Change. Nucl. Eng. Des. 2004, 232, 237–247. [Google Scholar] [CrossRef]
- Smith, M. ABAQUS/Standard User’s Manual, Version 6.9; 2009. Available online: http://orpheus.nchc.org.tw:2080/v6.12/index.html (accessed on 10 April 2024).
- Tsang, D.K.L.; Marsden, B.J. The Development of a Stress Analysis Code for Nuclear Graphite Components in Gas-Cooled Reactors. J. Nucl. Mater. 2006, 350, 208–220. [Google Scholar] [CrossRef]
- Tsang, D.K.L.; Marsden, B.J. Effects of Dimensional Change Strain in Nuclear Graphite Component Stress Analysis. Nucl. Eng. Des. 2007, 237, 897–904. [Google Scholar] [CrossRef]
- Mohanty, S.; Majumdar, S. Finite Element Based Stress Analysis of Graphite Component in High Temperature Gas Cooled Reactor Core Using Linear and Nonlinear Irradiation Creep Models. Nucl. Eng. Des. 2015, 292, 32–38. [Google Scholar] [CrossRef]
- Fahad, M.; McNally, K.; Yates, T.; Warren, N.; Marsden, B.J.; Mummery, P.M.; Hall, G.N. Finite Element Modelling of Multilayer Advanced Gas-Cooled Reactor Bricks and Creep Interaction. Nucl. Eng. Des. 2017, 324, 390–401. [Google Scholar] [CrossRef]
- McNally, K.; Yates, T.; Fahad, M.; Marsden, B.J.; Warren, N.; Hall, G.N. Design and Analysis of a Computer Experiment for the Study of the Distortion of an Advanced Gas-Cooled Reactor Moderator Brick. Nucl. Eng. Des. 2020, 367, 110766. [Google Scholar] [CrossRef]
- Gao, J.; Yao, W.; Ma, Y. Analytical and Numerical Study of Graphite IG110 Parts in Advanced Reactor under High Temperature and Irradiation. Nucl. Eng. Des. 2016, 305, 421–432. [Google Scholar] [CrossRef]
- Yang, X.; Gao, Y.-T.; Zhong, Y.; Ding, D.; Tsang, D.-K.-L. Stress Analysis of the TMSR Graphite Component under Irradiation Conditions. Nucl. Sci. Tech. 2018, 29, 173. [Google Scholar] [CrossRef]
- Romano, P.K.; Horelik, N.E.; Herman, B.R.; Nelson, A.G.; Forget, B.; Smith, K. OpenMC: A State-of-the-Art Monte Carlo Code for Research and Development. Ann. Nucl. Energy 2015, 82, 90–97. [Google Scholar] [CrossRef]
- ANSYS, Inc. ANSYS FLUENT Theory Guide; ANSYS Inc Canonsburg: Canonsburg, PA, USA, 2013; pp. 90311–90312. [Google Scholar]
- Wilson, P.P.H.; Tautges, T.J.; Kraftcheck, J.A.; Smith, B.M.; Henderson, D.L. Acceleration Techniques for the Direct Use of CAD-Based Geometry in Fusion Neutronics Analysis. Fusion Eng. Des. 2010, 85, 1759–1765. [Google Scholar] [CrossRef]
- Kirk, B.S.; Peterson, J.W.; Stogner, R.H.; Carey, G.F. libMesh: A C++ Library for Parallel Adaptive Mesh Refinement/Coarsening Simulations. Eng. Comput. 2006, 22, 237–254. [Google Scholar] [CrossRef]
- Brown, D.A.; Chadwick, M.B.; Capote, R.; Kahler, A.C.; Trkov, A.; Herman, M.W.; Sonzogni, A.A.; Danon, Y.; Carlson, A.D.; Dunn, M. ENDF/B-VIII. 0: The 8th Major Release of the Nuclear Reaction Data Library with CIELO-Project Cross Sections, New Standards and Thermal Scattering Data. Nucl. Data Sheets 2018, 148, 1–142. [Google Scholar] [CrossRef]
- Kahler III, A.C.; Macfarlane, R. NJOY2016; Los Alamos National Lab (LANL): Los Alamos, NM, USA, 2016.
- Sabharwall, P.; Aufiero, M.; Fratoni, M. 11—Heat Transfer and Computational Fluid Dynamics for Molten Salt Reactor Technologies. In Advances of Computational Fluid Dynamics in Nuclear Reactor Design and Safety Assessment; Joshi, J.B., Nayak, A.K., Eds.; Woodhead Publishing Series in Energy; Woodhead Publishing: Sawston, UK, 2019; pp. 801–834. ISBN 978-0-08-102337-2. [Google Scholar]
Disclaimer/Publisher’s Note: The statements, opinions and data contained in all publications are solely those of the individual author(s) and contributor(s) and not of MDPI and/or the editor(s). MDPI and/or the editor(s) disclaim responsibility for any injury to people or property resulting from any ideas, methods, instructions or products referred to in the content. |
© 2024 by the authors. Licensee MDPI, Basel, Switzerland. This article is an open access article distributed under the terms and conditions of the Creative Commons Attribution (CC BY) license (https://creativecommons.org/licenses/by/4.0/).