1. Introduction
A reduction in global greenhouse gas (GHG) emissions from approximately 40 Gt CO
2eq in 2020 to 10 Gt CO
2eq in 2050 [
1] is mandated. Reducing GHG emissions from the transportation sector is vital for avoiding the dangers of climate change, and the task is challenging. As such, most attention is paid to newer technology, such as electrification and hydrogen, for mobility. Such approaches can turn public opinion against the internal combustion engine (ICE); however, its history shows continual improvements. Equally important, the ICE still has potential for future technological gains and will be the main power source for light-duty vehicles (LDVs) for the foreseeable future [
2], and it can also play a role in reducing GHG emissions [
3]. Such an outcome may be especially true in a developing country such as Brazil, where vehicle prices are crucial. Although EV (electric vehicle) prices can fall, several questions remain, for instance, prices, infrastructure, second-hand ownership, and recycling. On the other hand, there are more than 40,000 stations with ethanol distribution only in the São Paulo state, and there has been a proven decarbonization of the fleet [
4]. Furthermore, future electric vehicles (EVs) will compete with future ICEs [
5,
6]. Another characteristic of Brazil is the use of ethanol in hybrid electric vehicles (HEVs), which have topped sale lists [
4]. These beneficial characteristics of ethanol are a consequence of Brazil’s continental size, making it unique. Moreover, sugarcane is already fixed in some regions and is part of the national industry with the biorefineries [
7]. These manuscripts concluded that ethanol is the transition fuel needed to decarbonize the individual sector since the carbon footprint of ethanol is similar to the country’s electrical energy mix [
8].
Public policies can help reduce GHG emissions in the transportation sector (or, in the Brazilian case, increase less than a baseline). Brazil taxes vehicle CO
2 emissions indirectly based on engine displacement. Engine displacement refers to the combined volume swept by all cylinders. All else being equal, a larger engine, i.e., one with a higher displacement, will require more energy but also deliver better performance. The usual metrics are liters (L) and cubic centimeters (cc; cm
3), where 1 L = 1000 cc. If the wrong policy is applied, as will be shown, the emission factors of the 1.0 L engine, by far the most popular in Brazil, can vary by almost 40% [
9]. While 1.0 L entry-level vehicles with lower pollution may not be economically attractive to manufacturers due to low profit margins, there are a few sport utility vehicles (SUVs) with turbo 1.0 L engines [
10]. Tight emission standards usually require improved, but more expensive, technology [
11]. Employing a cheaper vehicle may require a more economical approach, and the disappearance of the popular Brazilian car (entry-level category) may have profound environmental impacts.
Policy design is a complicated matter, with 1314 policies related to transport in the International Energy Agency Database [
12]. There are also considerable research gaps regarding the interplay [
13] of these regulations. Even for well-established, long-standing policies, such as the CAFE standards in the USA [
14,
15,
16,
17,
18], much debate about efficacy, efficiency, and equity still exists. This article proposes to move away from taxing vehicles based on displacement, which is exclusively, indirectly related to CO
2 emissions, and move toward a more efficient, direct CO
2 emission rate [
19] in order to capture differences in vehicles equipped with 1.0 L engines more effectively. A bonus–malus system or subsidy may be required to resurrect the entry-level vehicle. Technology rewards may be considered to make these vehicles economically feasible again.
Technology can be employed to achieve better fuel efficiency or performance [
10]; these are usually trade-off parameters [
20,
21]. Furthermore, consumers may prefer to pay more for performance than a comparable increase in fuel economy [
14]. Thus, better performance can impact total emissions [
10]. The metric most associated with performance is acceleration. The speed at which a vehicle reaches 100 km/h (or 60 miles per hour, about 97 km/h) from rest (0 km/h) is usually measured in seconds.
This article will examine performance improvements in the Brazilian LDV fleet from 1990 to 2020 to illustrate a series of interconnected developments: (i) due to technological evolution, the tax regime based on displacement may need an update; (ii) the entry-level car may be disappearing from the market; and (iii) delayed technological adoption makes the Brazilian fleet as efficient as that of the USA, which is larger and faster, but with the performance levels of the Japanese fleet, which is much more efficient. A complete description of the reasons for these three factors is given in the next few sections. These analyses of Brazilian society are a distinguishing feature of this article, given that no systematized data are currently available on the historicity and evolution of the fleet. This article is a logical continuation of this group’s previous study by Mosquim and Mady [
9,
10].
The objectives are thus to capture trends that support the claim that the displacement-based tax is outdated. Moreover, critical trends in the Brazilian LDV fleet are presented, focusing on acceleration performance and technological deployment. Ultimately, these parameters are related to fuel use and GHG emissions. This technological evolution, such as the use of turbochargers, necessitates the updating of direct tax based on displacement or its replacement with another metric altogether. We propose a direct CO
2 tax to help shift consumer demand away from power and size. This tax regime should complement other policies already in place in Brazil, namely, Rota 2030 [
22], directed toward fuel efficiency and targeted mainly at vehicle manufacturers, and RenovaBio [
23], related to fuel carbon intensity and ethanol and biodiesel production.
2. Policies and the Brazilian Context
This section will briefly discuss policy instruments in place in Brazil and other countries [
14,
15,
16,
17,
18,
19]. The literature dealing with some of these policies’ planned and sometimes unintentional effects was systematized. Due to insufficient raw data and subsequent studies for Brazil, some inferences will be made based on findings from other countries, mainly the USA. Comparisons with this country will be made throughout this article.
Policies to reduce carbon footprint (GHG emissions) can be categorized into the following main strategies: (i) fuel efficiency standards for new vehicles, in line with the Corporate Average Fuel Economy (CAFE) in the USA; (ii) vehicle taxation, either directly or indirectly related to CO
2 emission levels [
19]; (iii) fuel taxes; (iv) incentives toward low(er)-carbon fuels; and(v) reduced travel distance and numbers (this is especially ignored in comparison to other types of subsidies for public transport [
24]. Mechanisms can be mainly regulatory, economic, or information-based. Only a combination of policies is likely to achieve the profound GHG reductions required to achieve the 2030 SDGs, and synergies between policies are essential [
13,
19,
25].
The aim of low-carbon fuel standards (LCFSs) is to reduce the carbon intensity (CI) of the fuel used in vehicles. In 2018, the Brazilian government instituted the RenovaBio program to reduce carbon intensity and intensify other programs in Brazil. It is critical to highlight that 80% of the light vehicle fleet in Brazil are flexible-fuel vehicles, operating with varying percentages of ethanol/gasoline, from anhydrous ethanol to gasoline, which already has a percentage of ethanol [
4].Therefore, increasing the relative importance of ethanol due to its lower emission factor and decreasing its price in comparison to gasoline would lead to immediate GHG reductions (official data report 87.4 g CO
2eq per MJ for gasoline and 20.8 g CO
2eq for ethanol). CI targets are designed to induce the market toward bio-fuels and promote efficiency in producing ethanol [
26]. Other pollutants in Brazil have been controlled by the PROCONVE program since 1986 [
27]. Drastic reductions in pollutant emission rates were achieved to the point that now a vehicle may emit more particulate matter due to tire wear than fuel use [
2].
The first implementation of fuel efficiency mandates was in the USA in 1975. Since then, similar measures have been introduced in other countries and regions, such as Japan, China, India, and the European Union. Governments implement fuel efficiency targets for manufacturers to meet, with the aim of tightening them over time. These standards can be sales-weighted at the manufacturer level and are usually differentiated by vehicle weight or tire footprint (area covered by the four tires) [
19]—bear in mind that vehicle weight and size are inversely related to fuel efficiency [
10,
20,
21]. Manufacturers who fail to meet standards may face penalties, while bonuses can be earned for an accomplished target or even separate achievements. In Brazil, INOVAR-AUTO [
28] established a target of 12% improvements in corporate average fuel efficiency in 2017 compared to 2012. Further tax exemptions were in place for overachievers who attained improvements higher than 15.4% and 18.8%. Rota 2030 is the successor of INOVAR-AUTO [
22] and began in 2018. Its aims are also more general in scope than only efficiency standards and include the development of new technologies and improved safety.
The effects and discussion of fuel efficiency standards are beyond the scope of this article. Manufacturers may need to use more expensive technology to meet directives, which could increase the prices of new and used cars [
11,
29]. This is a concern of this manuscript. This may be addressed with an implicit subsidy for new, fuel-efficient vehicles or taxing vehicles with higher consumption. When considering the used car market, however, licenses may become regressive, meaning lower-income households are more affected than higher-income ones [
16] due to new vehicles increasing in price and the effect spilling over. As higher-income households tend to buy more new vehicles than lower-income used vehicles, the latter may be put at a significant disadvantage. This is named the Gruenspecht effect [
30], in which used-vehicle owners postpone scrapping due to new vehicles increasing in price. As older vehicles tend to have a lower fuel economy, this makes the whole fleet less efficient. This effect was estimated to induce 13–16% lower fuel savings from fuel economy standards due to “leakages” in the USA’s used-car fleet [
18]. Mabit [
6] found that technological evolution better explained the shift toward increased efficiency than higher fuel prices and the tax reform in Denmark. Higher fuel efficiency may also induce more travel, thus taking back some efficiency gains; while probably small [
14], this factor must be considered as well.
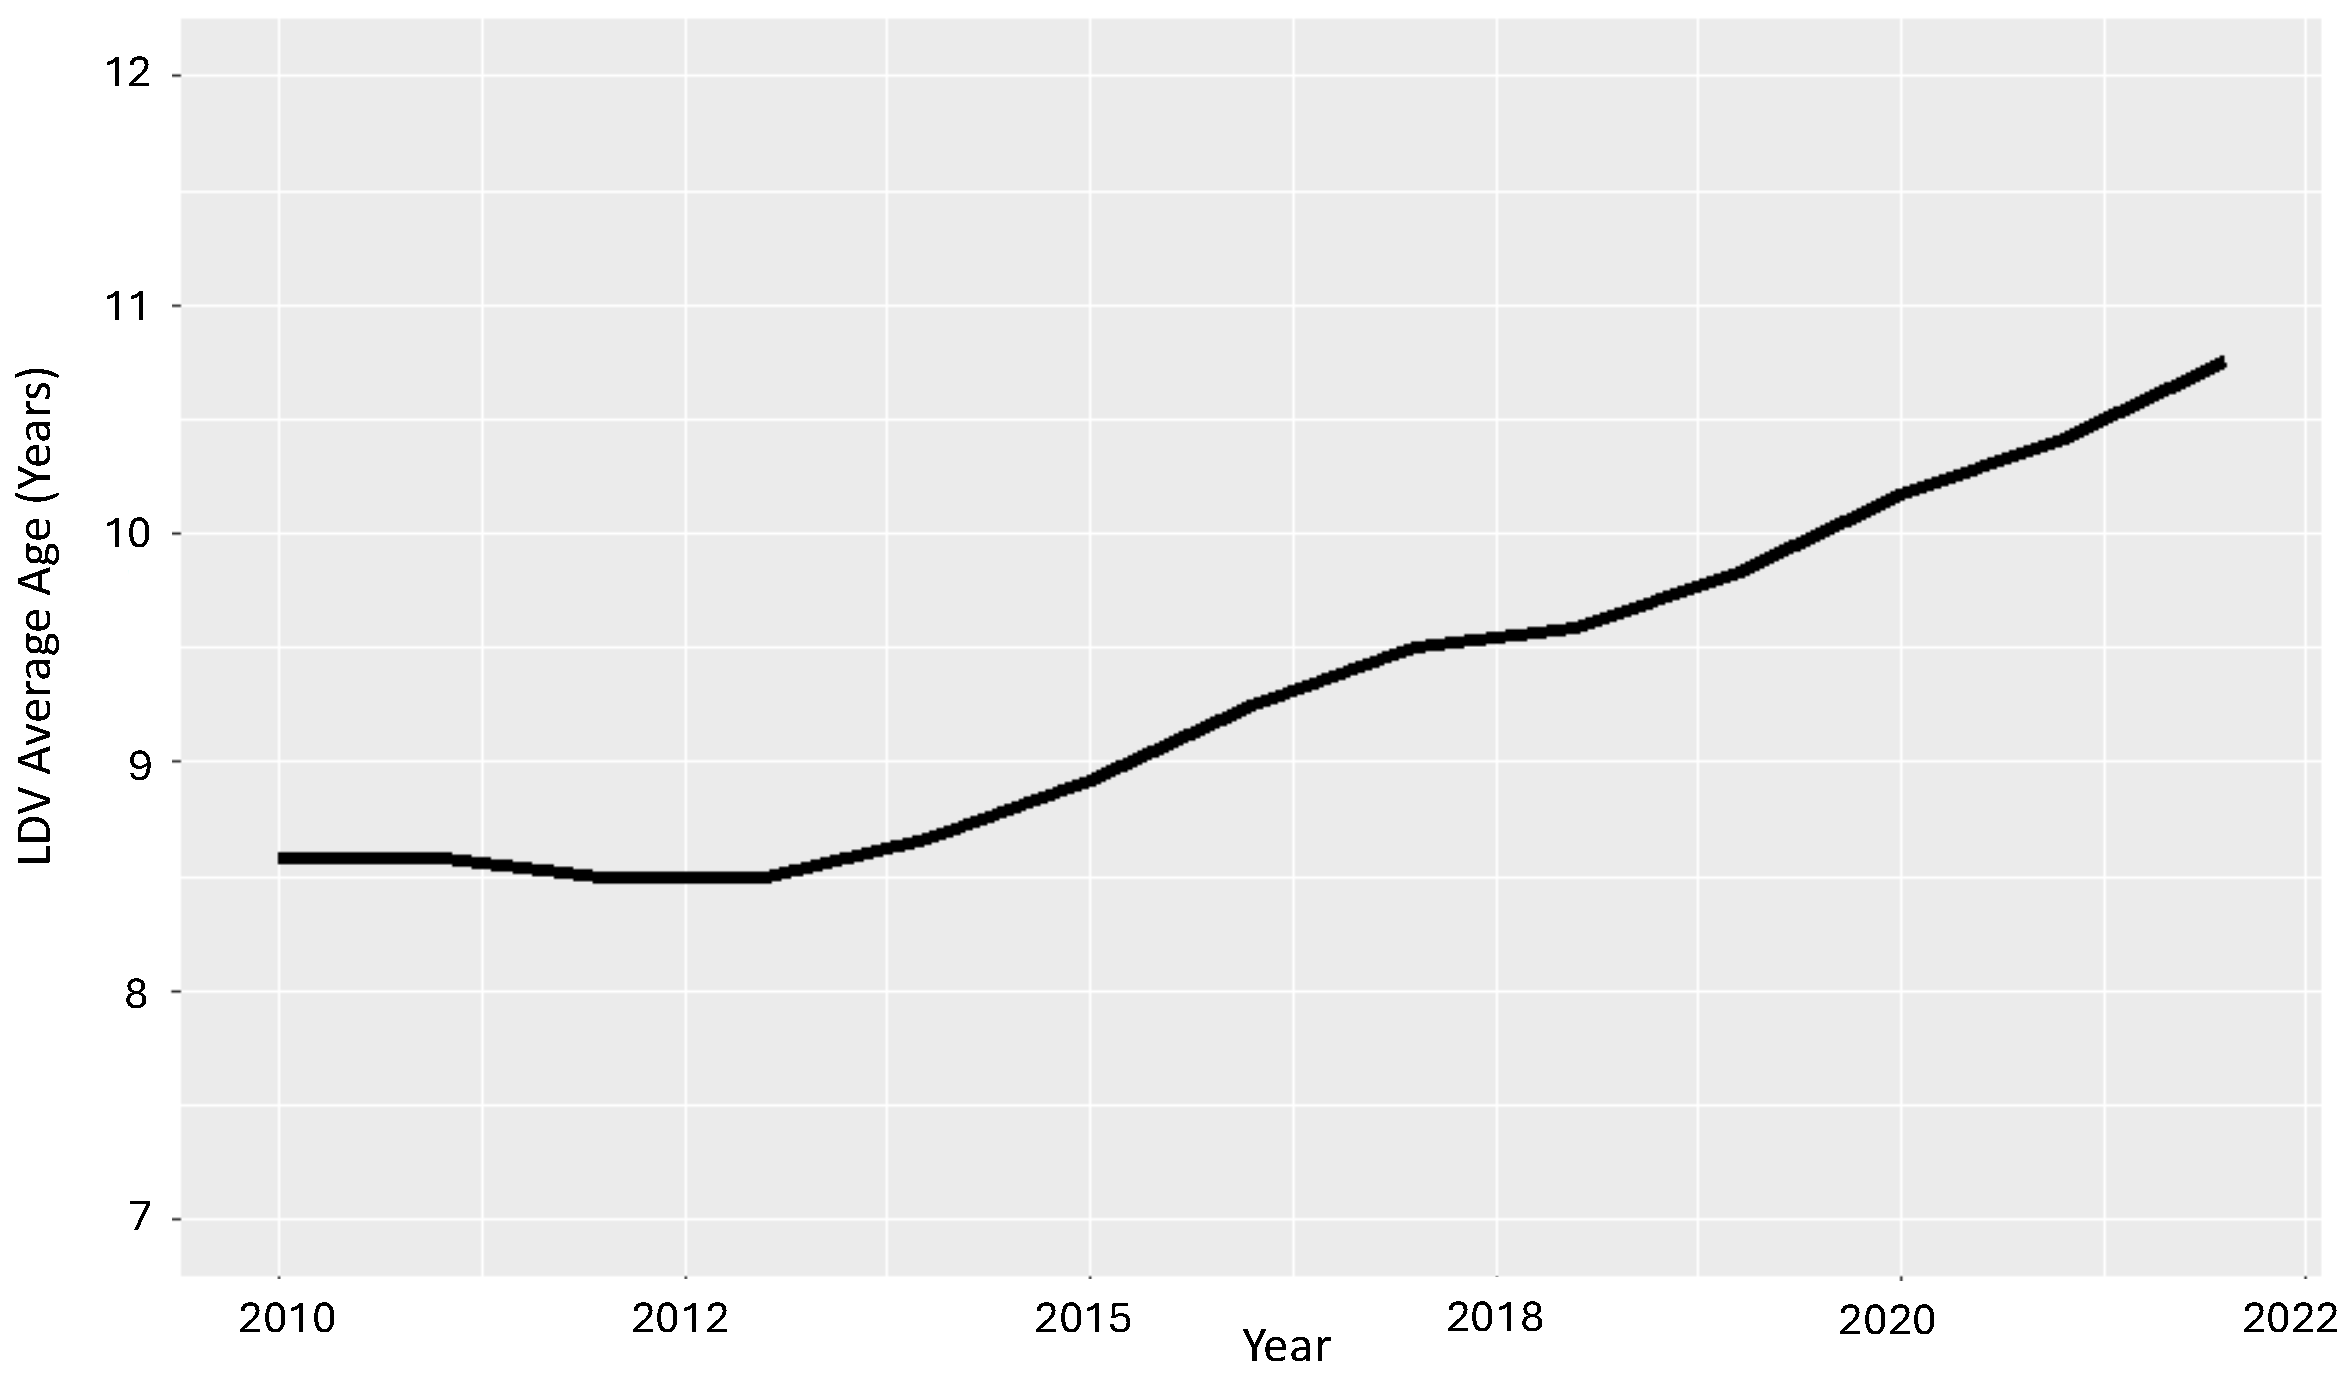
It is possible to observe in
Figure 1 that the average LDV fleet years have increased substantially in the last decade. While this may be related to the fuel policies in Brazil, this inference needs more empirical evidence to be substantiated. Brazil is also facing long-lasting economic stagnation, one of the worst in its history [
9]. The used-car market, in general, requires more research in Brazil. The greatest concern here is that the popular, cheap, and efficient Brazilian (hereafter referred to as entry-level) car may be losing its prominence, as illustrated in
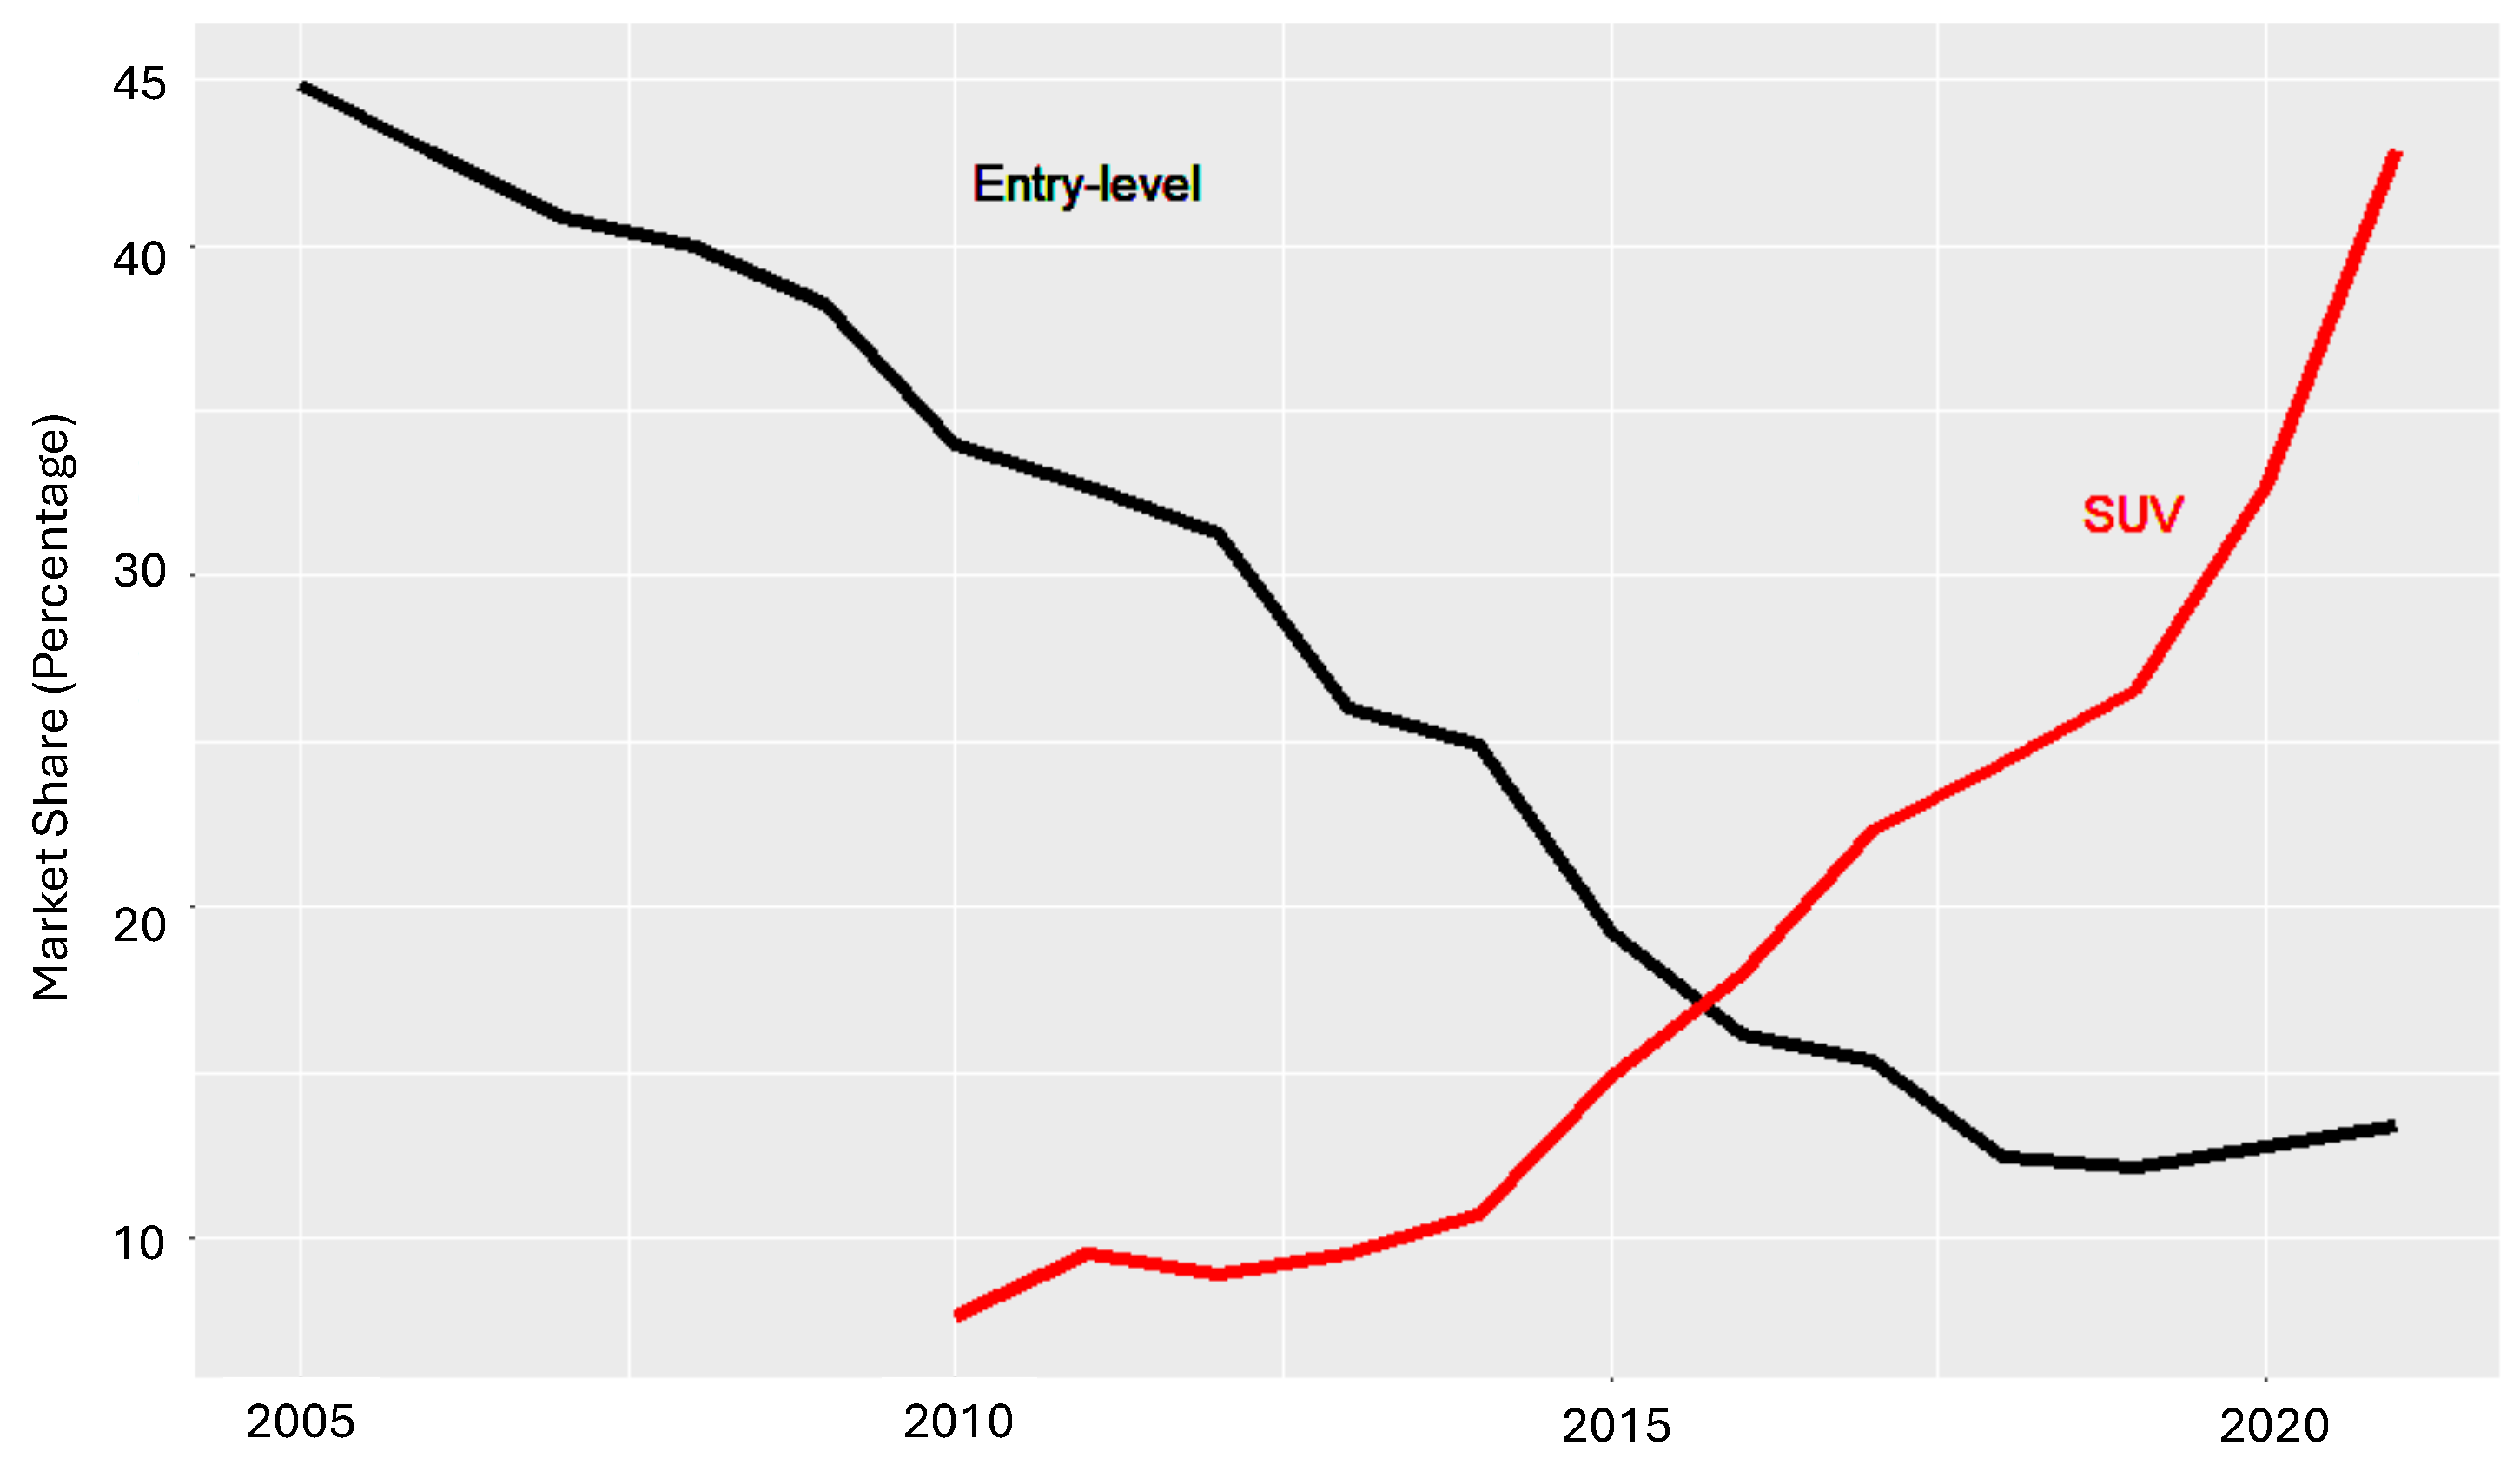
Figure 2. Moving away from entry-level options will have significant environmental consequences. This is similar to the situation in the USA, where extra-large vehicles have gained market share, causing fleet efficiency to stagnate or even decline [
31]. Later in this text, some simple examples of this phenomenon will be provided. A policy shift may be necessary to prevent this unexpected outcome.
As shown by Fusco and Mady [
4], LDVs are lighter and more energy-efficient [
9], given that electrification achieves a reduction in CO
2eq after about 40,000 km. Moreover, the advantages of decarbonization have still not been proven in the Brazilian scenario since the carbon footprint of ethanol is similar to that of electrical energy [
8]. For instance, there are statements in the literature regarding the efficiency of sport utility vehicles (SUVs) [
32] concerning sedan cars and smaller models. Fusco and Mady [
4] showed the emissions of the electrified fleets compared with several percentages of ethanol, and the conclusion was that it is better not to electrify these vehicles in Brazil at present with the abundant infrastructure for decarbonization technology. Therefore, there is time to decide on the path and use the best policy to decarbonize Brazil. However, regionality must be respected since ethanol is not available in all countries. Moreover, if battery production occurs in a country with a renewable electrical energy matrix, the use of batteries for electrifying the fleet may not address all concerns regarding the carbon footprint issue. Hence, several studies have compared several energy sources [
4,
33,
34,
35], with the work of Malaquias et al. [
35] being a necessary reference regarding the Brazilian scenario. Therefore, internal combustion engine vehicles represent a case to be addressed and discussed with regard to the decarbonization of Brazilian society, and the correct taxation and public policies must be implemented.
Figure 1.
LDV fleet age between 2010 and 2022.Original data obtained and adapted from [
36].
Figure 1.
LDV fleet age between 2010 and 2022.Original data obtained and adapted from [
36].
Figure 2.
Trends in entry-level and SUV market share in Brazil between 2005 and 2021. Original data obtained in public governmental data [
37].
Figure 2.
Trends in entry-level and SUV market share in Brazil between 2005 and 2021. Original data obtained in public governmental data [
37].
Price and tax regimes are powerful tools used to induce changes in market shares in Brazil [
38]. The average tax burden of the total vehicle price is 30.4% in the country compared to approximately 17% in some large European markets, 11.5% in Japan, and 6.8% in California, USA [
39]. The tax regime in Brazil is particularly complicated. There is a tax on industrialized products (IPIs), based on displacement, the main focus of this discussion. There is also an import tax on financial operations (IOFs), a tax for the Program of Social Integration (PIS), and the Contribution for the Financing of Social Security (COFINS). Lastly, there is a tax on the circulation of goods and the provision of transportation and communication services (ICMSs). Vehicle owners also pay the annual Property Tax on Motor Vehicles (IPVA).
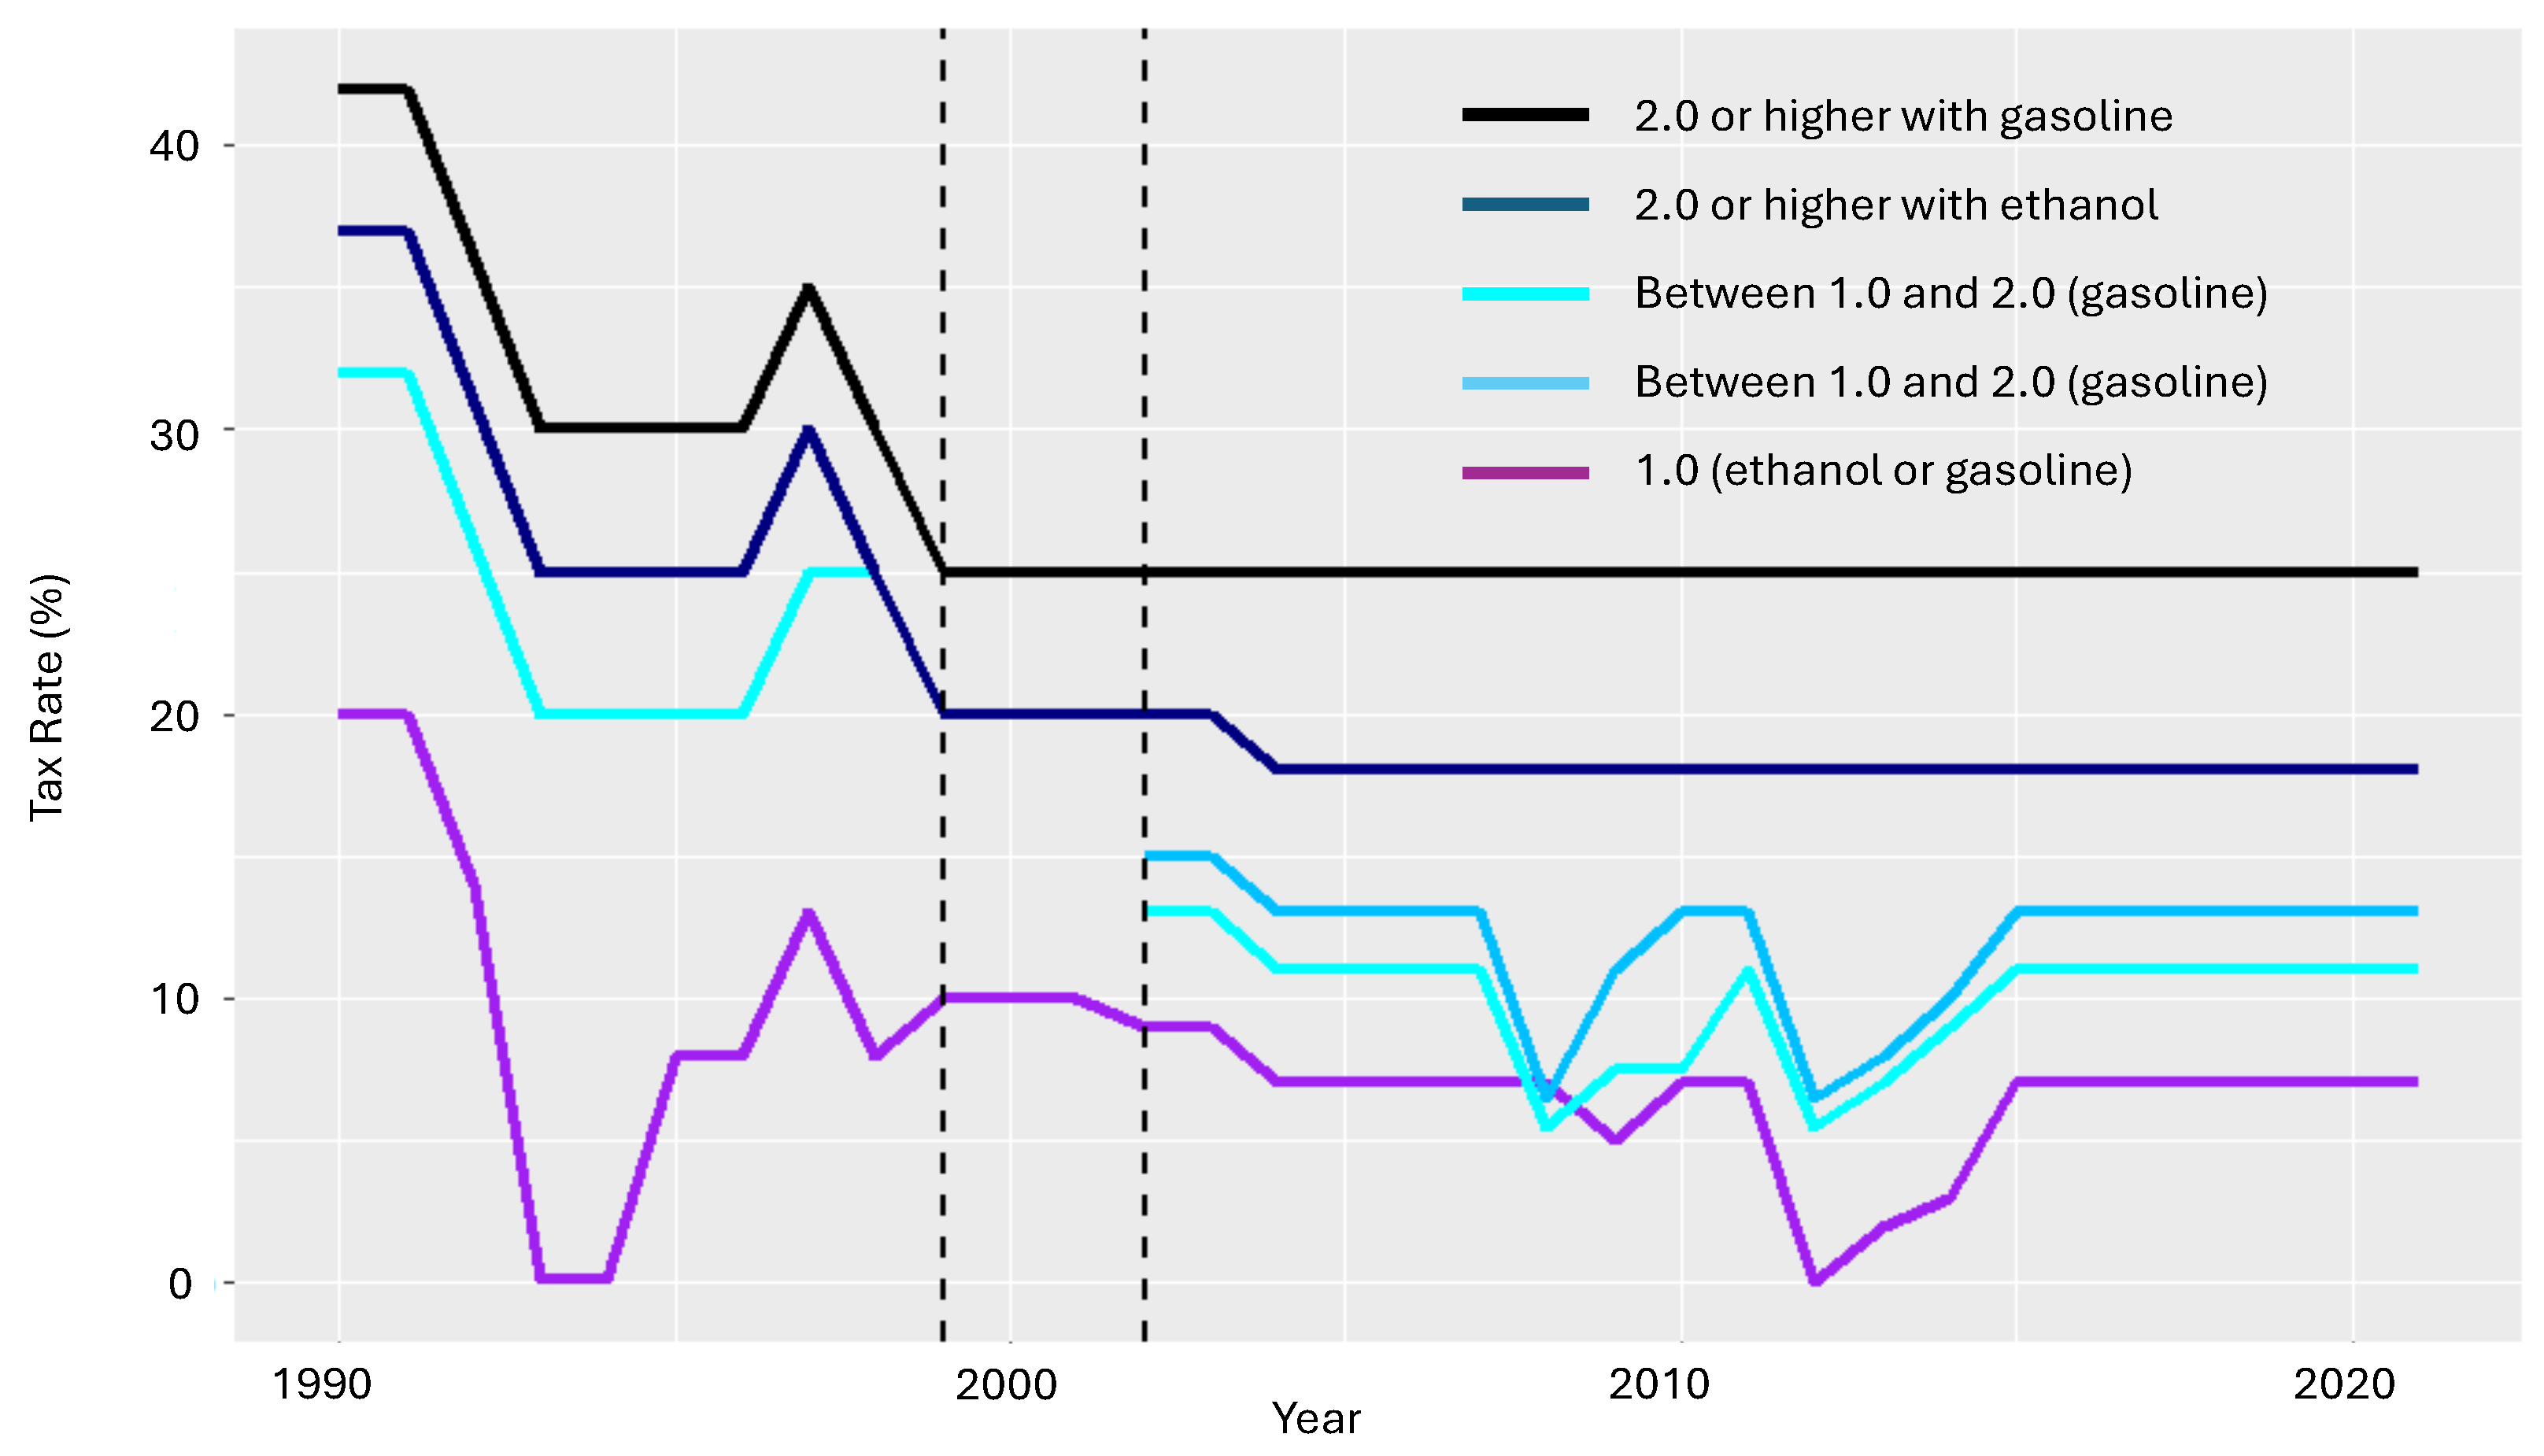
Figure 3 illustrates the progression of IPI tax rates in Brazil. In this figure, each color represents a category. From top to bottom, the black and dark blue lines represent gasoline and ethanol engines above 2.0 L, respectively. Shades of light blue represent gasoline (13%) and ethanol (11%) engines above 1.0 L but below 2.0. Dashed vertical lines represent the transitional period. Before 1999, engines above 1000 cc were taxed based on horsepower. After 2002, they were taxed based on displacement, with the creation of a bracket for engines above 2.0 L. The purple line is for 1.0 L engines.
The black and dark blue lines represent gasoline and ethanol, respectively, for engines above 2.0 L. Shades of light blue represent gasoline (13%) and ethanol (11%) engines above 1.0 L but below 2.0. Dashed vertical lines represent the transitional period. Before the first line, engines above 1000 cc were taxed based on horsepower. After the second line, they were taxed based on displacement, with the creation of a bracket for engines above 2.0 L. The purple line is for 1000 cc engines. Market dominance occurred within a decade, as
Figure 4 illustrates. However, today’s 1.0 L engines are not necessarily found in entry-level vehicles alone, which can significantly impact fleet fuel efficiency and emissions. Entry-level vehicles were above 40% market share in 2005. In 2020, this share fell to 12.7%, as displayed in
Figure 2. Entry-level vehicles emerged as a result of a new tax bracket for 1000 cc engines introduced in 1990, along with tax exemptions that started in 1993. Brazil attempted to promote dedicated ethanol engines in the late 1970s, but this effort failed due to various technological, behavioral, and economic reasons. Ethanol engines had their peak in the 1980s, but were discontinued by the 1990s. However, the tax incentives for ethanol led to the development of flexible-fuel vehicles (FFVs), which can run on either ethanol, gasoline, or a mixture of both.
3. Trends in Performance in the Brazilian LDV Fleet
In the following paragraphs, we will provide some general information on the LDV fleet and its context.
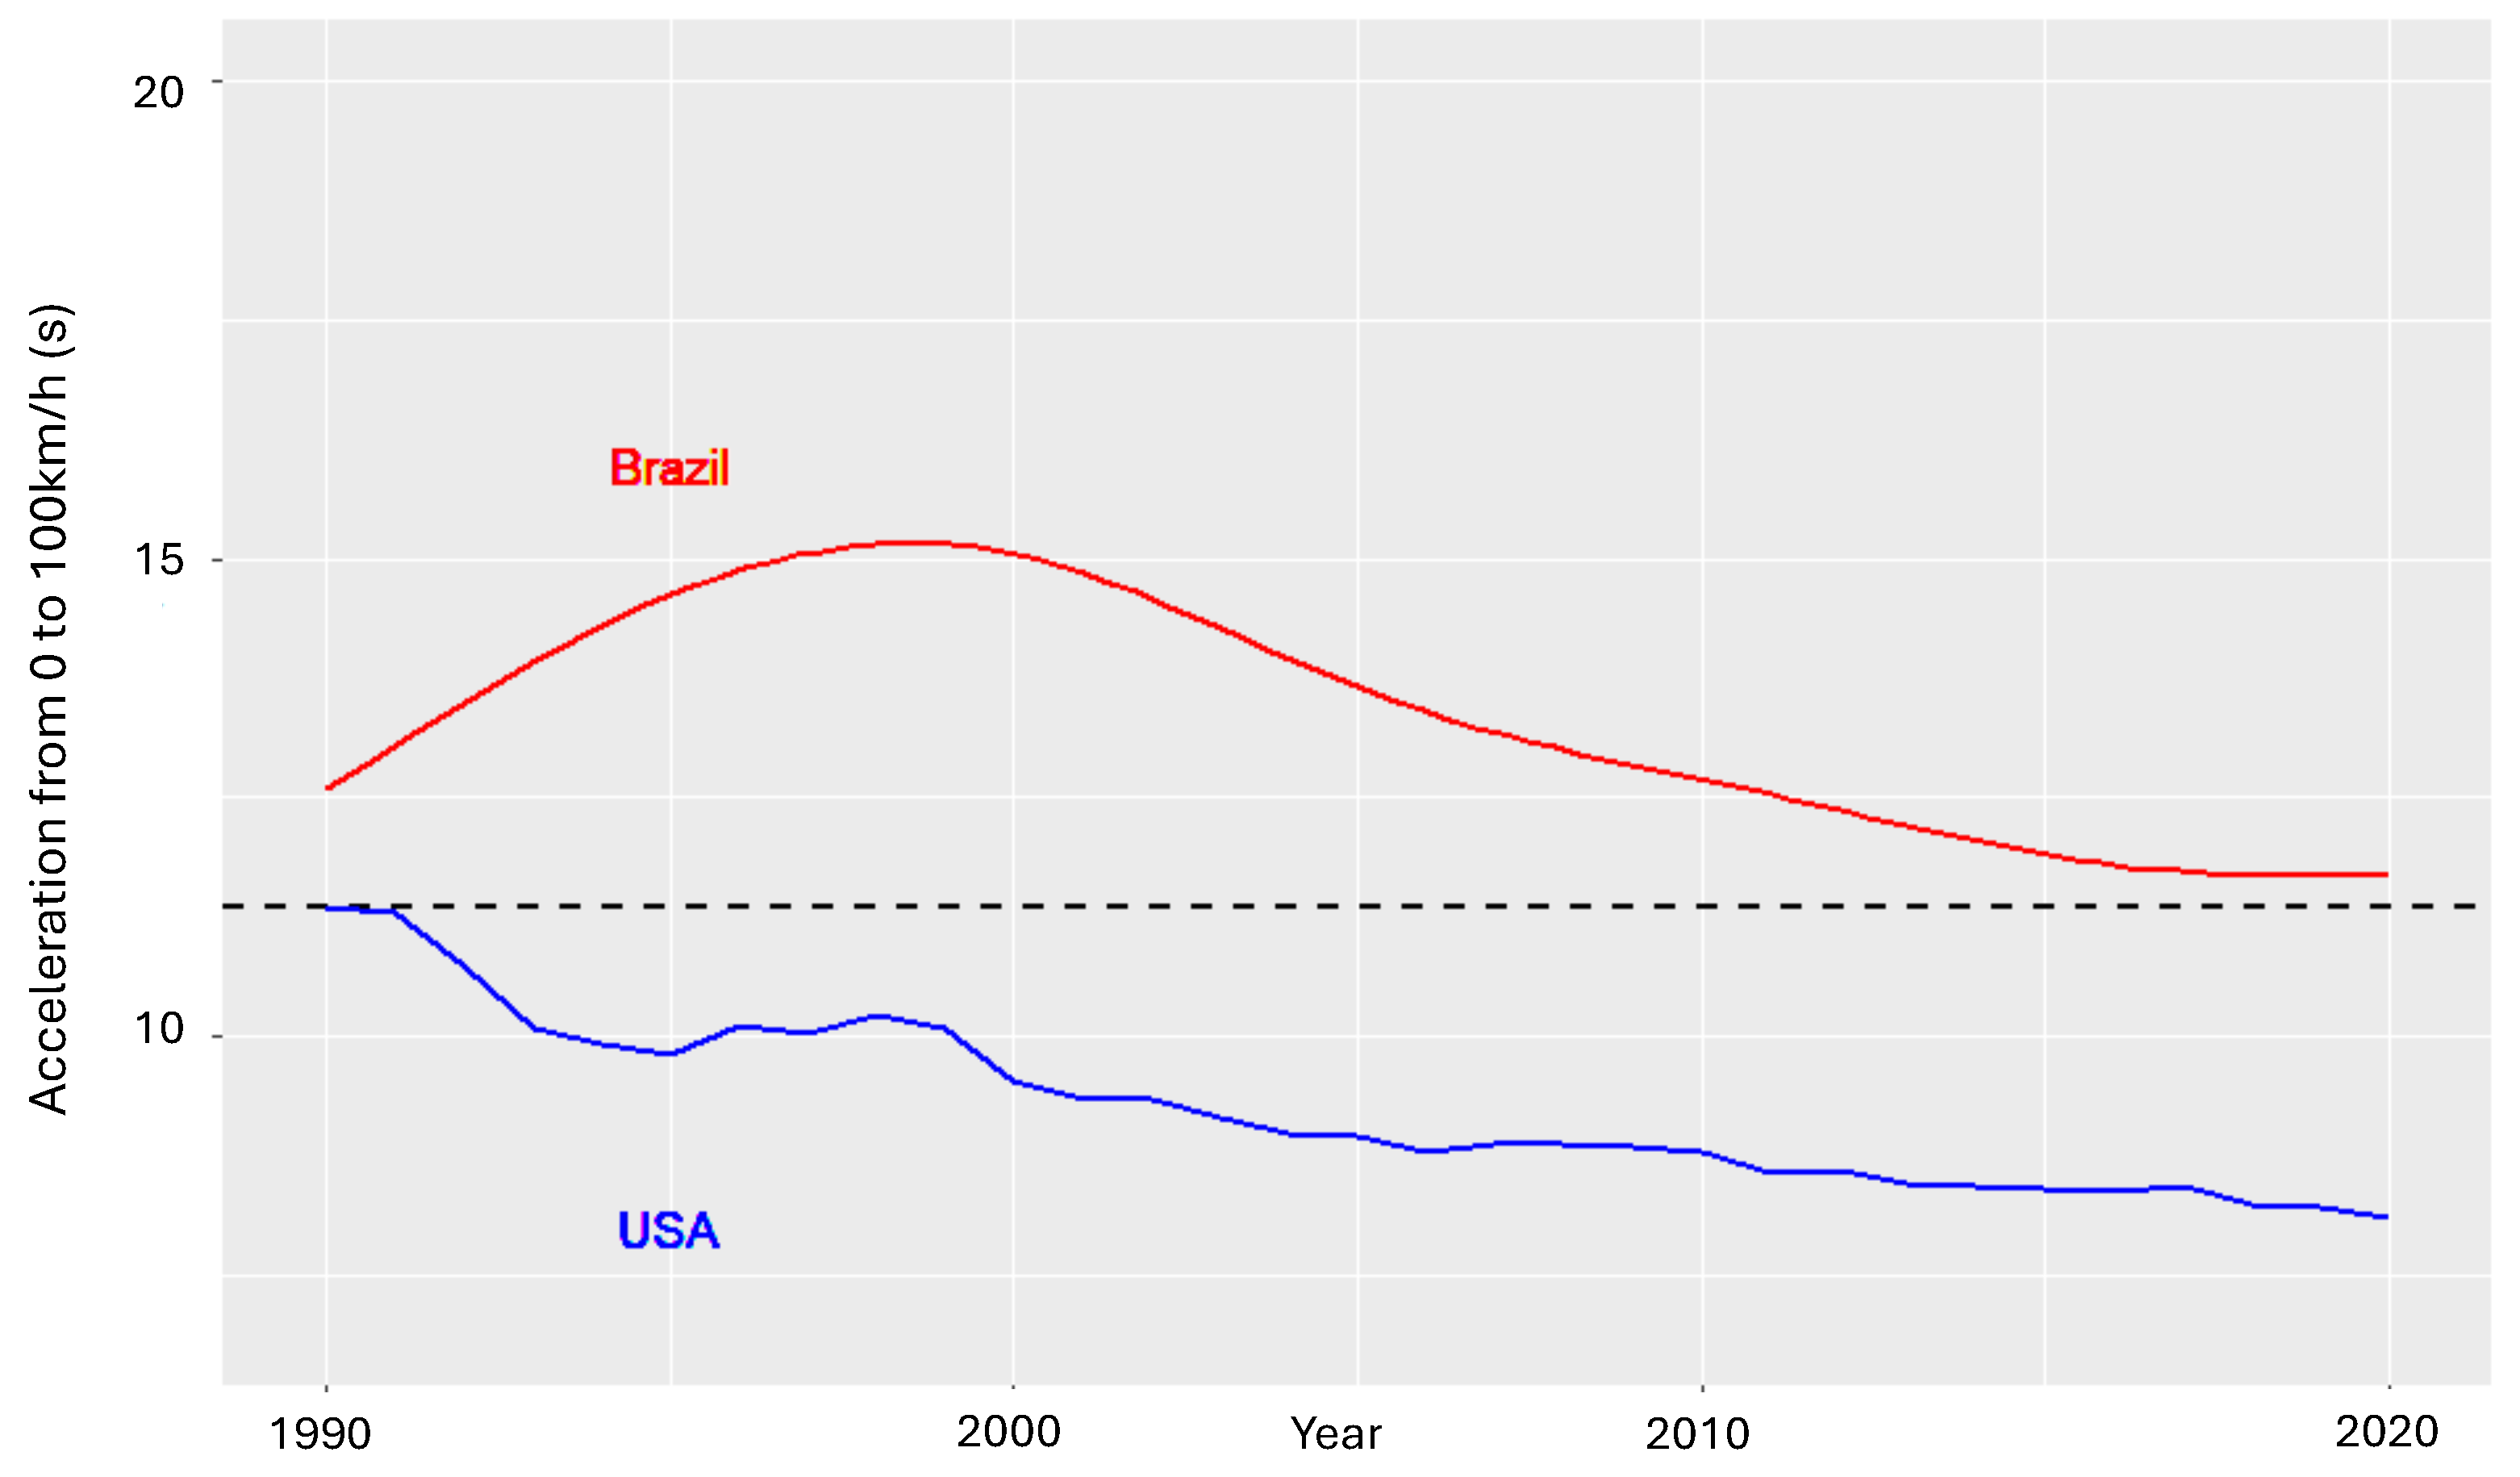
Figure 5 displays the acceleration trend for the period of 1990–2020. The red line represents Brazil, while the blue line represents the USA. The acceleration times increased from 1990 to 2002 and then steadily decreased. This trend differs from that observed in the USA since 1975 [
20,
21,
40,
41]. The rise of entry-level vehicles in the early 1990s is the primary cause of this difference. According to Mosquim and Mady [
9], the existing literature on past developments in the Brazilian LDV fleet is insufficient where performance parameters are concerned. Previous studies have focused mainly on projections based on hypothetical scenarios [
42,
43,
44,
45,
46] and shown the importance of the proper historicity of the phenomena. Light-duty vehicle research has traditionally focused on alternative fuels, mainly sugarcane-derived ethanol and the possible current pathways for HEVs and pure EVs. LDVs in Brazil are not allowed to run on diesel; therefore, energy consumption refers to gasoline, ethanol, or both in flexible-fuel vehicles. Gasoline sold at fuel stations has an ethanol content (E27, 27%, is the historical ethanol content in gasoline). All approaches have merits, whereas the lack of historicity is critical. The benefits are as follows: (i) a better understanding of the developments can help projections or at least in judging the feasibility of the construction of a specific scenario and (ii) comparisons with other countries become easier. Brazil is still in a motorization period characterized by the LDV shifting from a luxury to a common good [
47]. Therefore, following the USA’s or Japan’s trajectory would result in distinct outcomes.
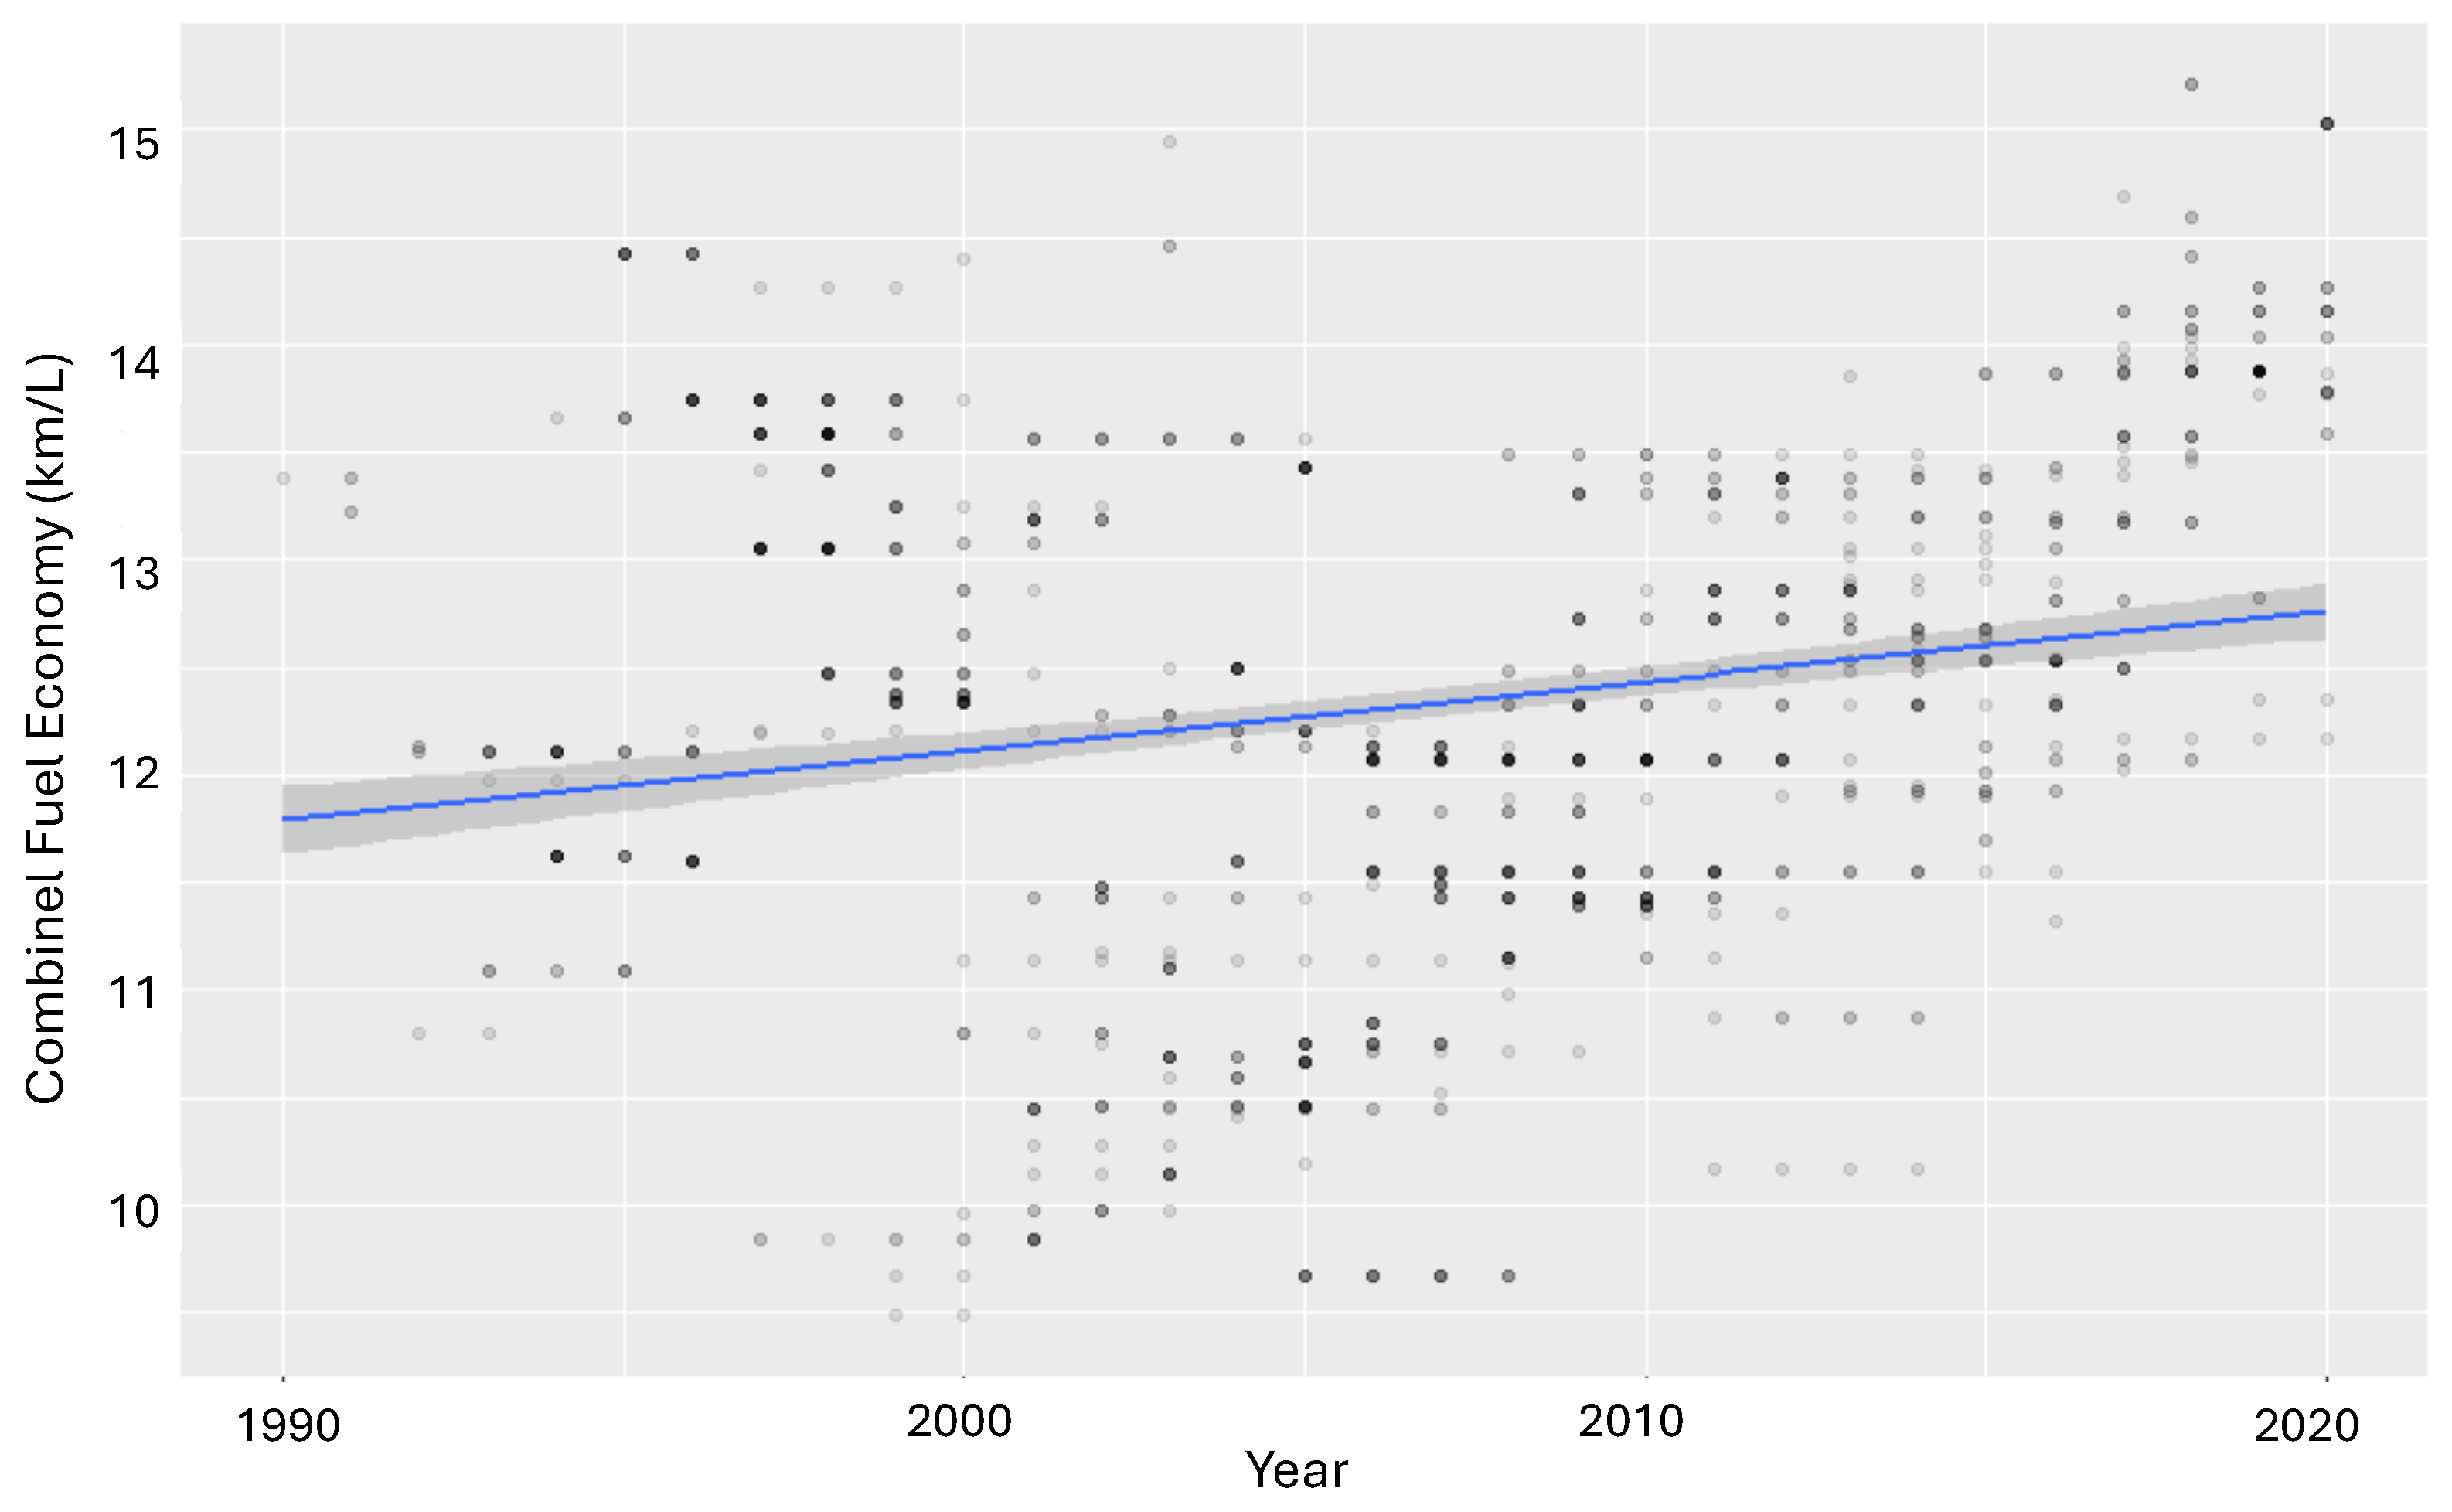
The fuel economy increased from 1990 to 1998, remained constant until around 2010, and then increased sharply. The following are some broad explanations for these trends. First, catalytic converters used in the late 1990s caused engine power reduction. Second, air conditioning systems, which began to appear in the mid-1990s, caused a loss in power (approximately 10%), and finally, safety and necessary improvements (e.g., an increase in airbag quantities) directly added some weight, affecting vehicle performance. In 2012, a government program named INOVAR-AUTO [
28] established fiscal incentives through tax reductions for automakers to reduce vehicle fuel intensity (MJ/km) by 12% in 2017 compared to the baseline levels in 2011; the higher targets were 15.4% and 18.8% reductions. Eight of the ten major automakers achieved the 15.4% goal, while two achieved 18.8%.
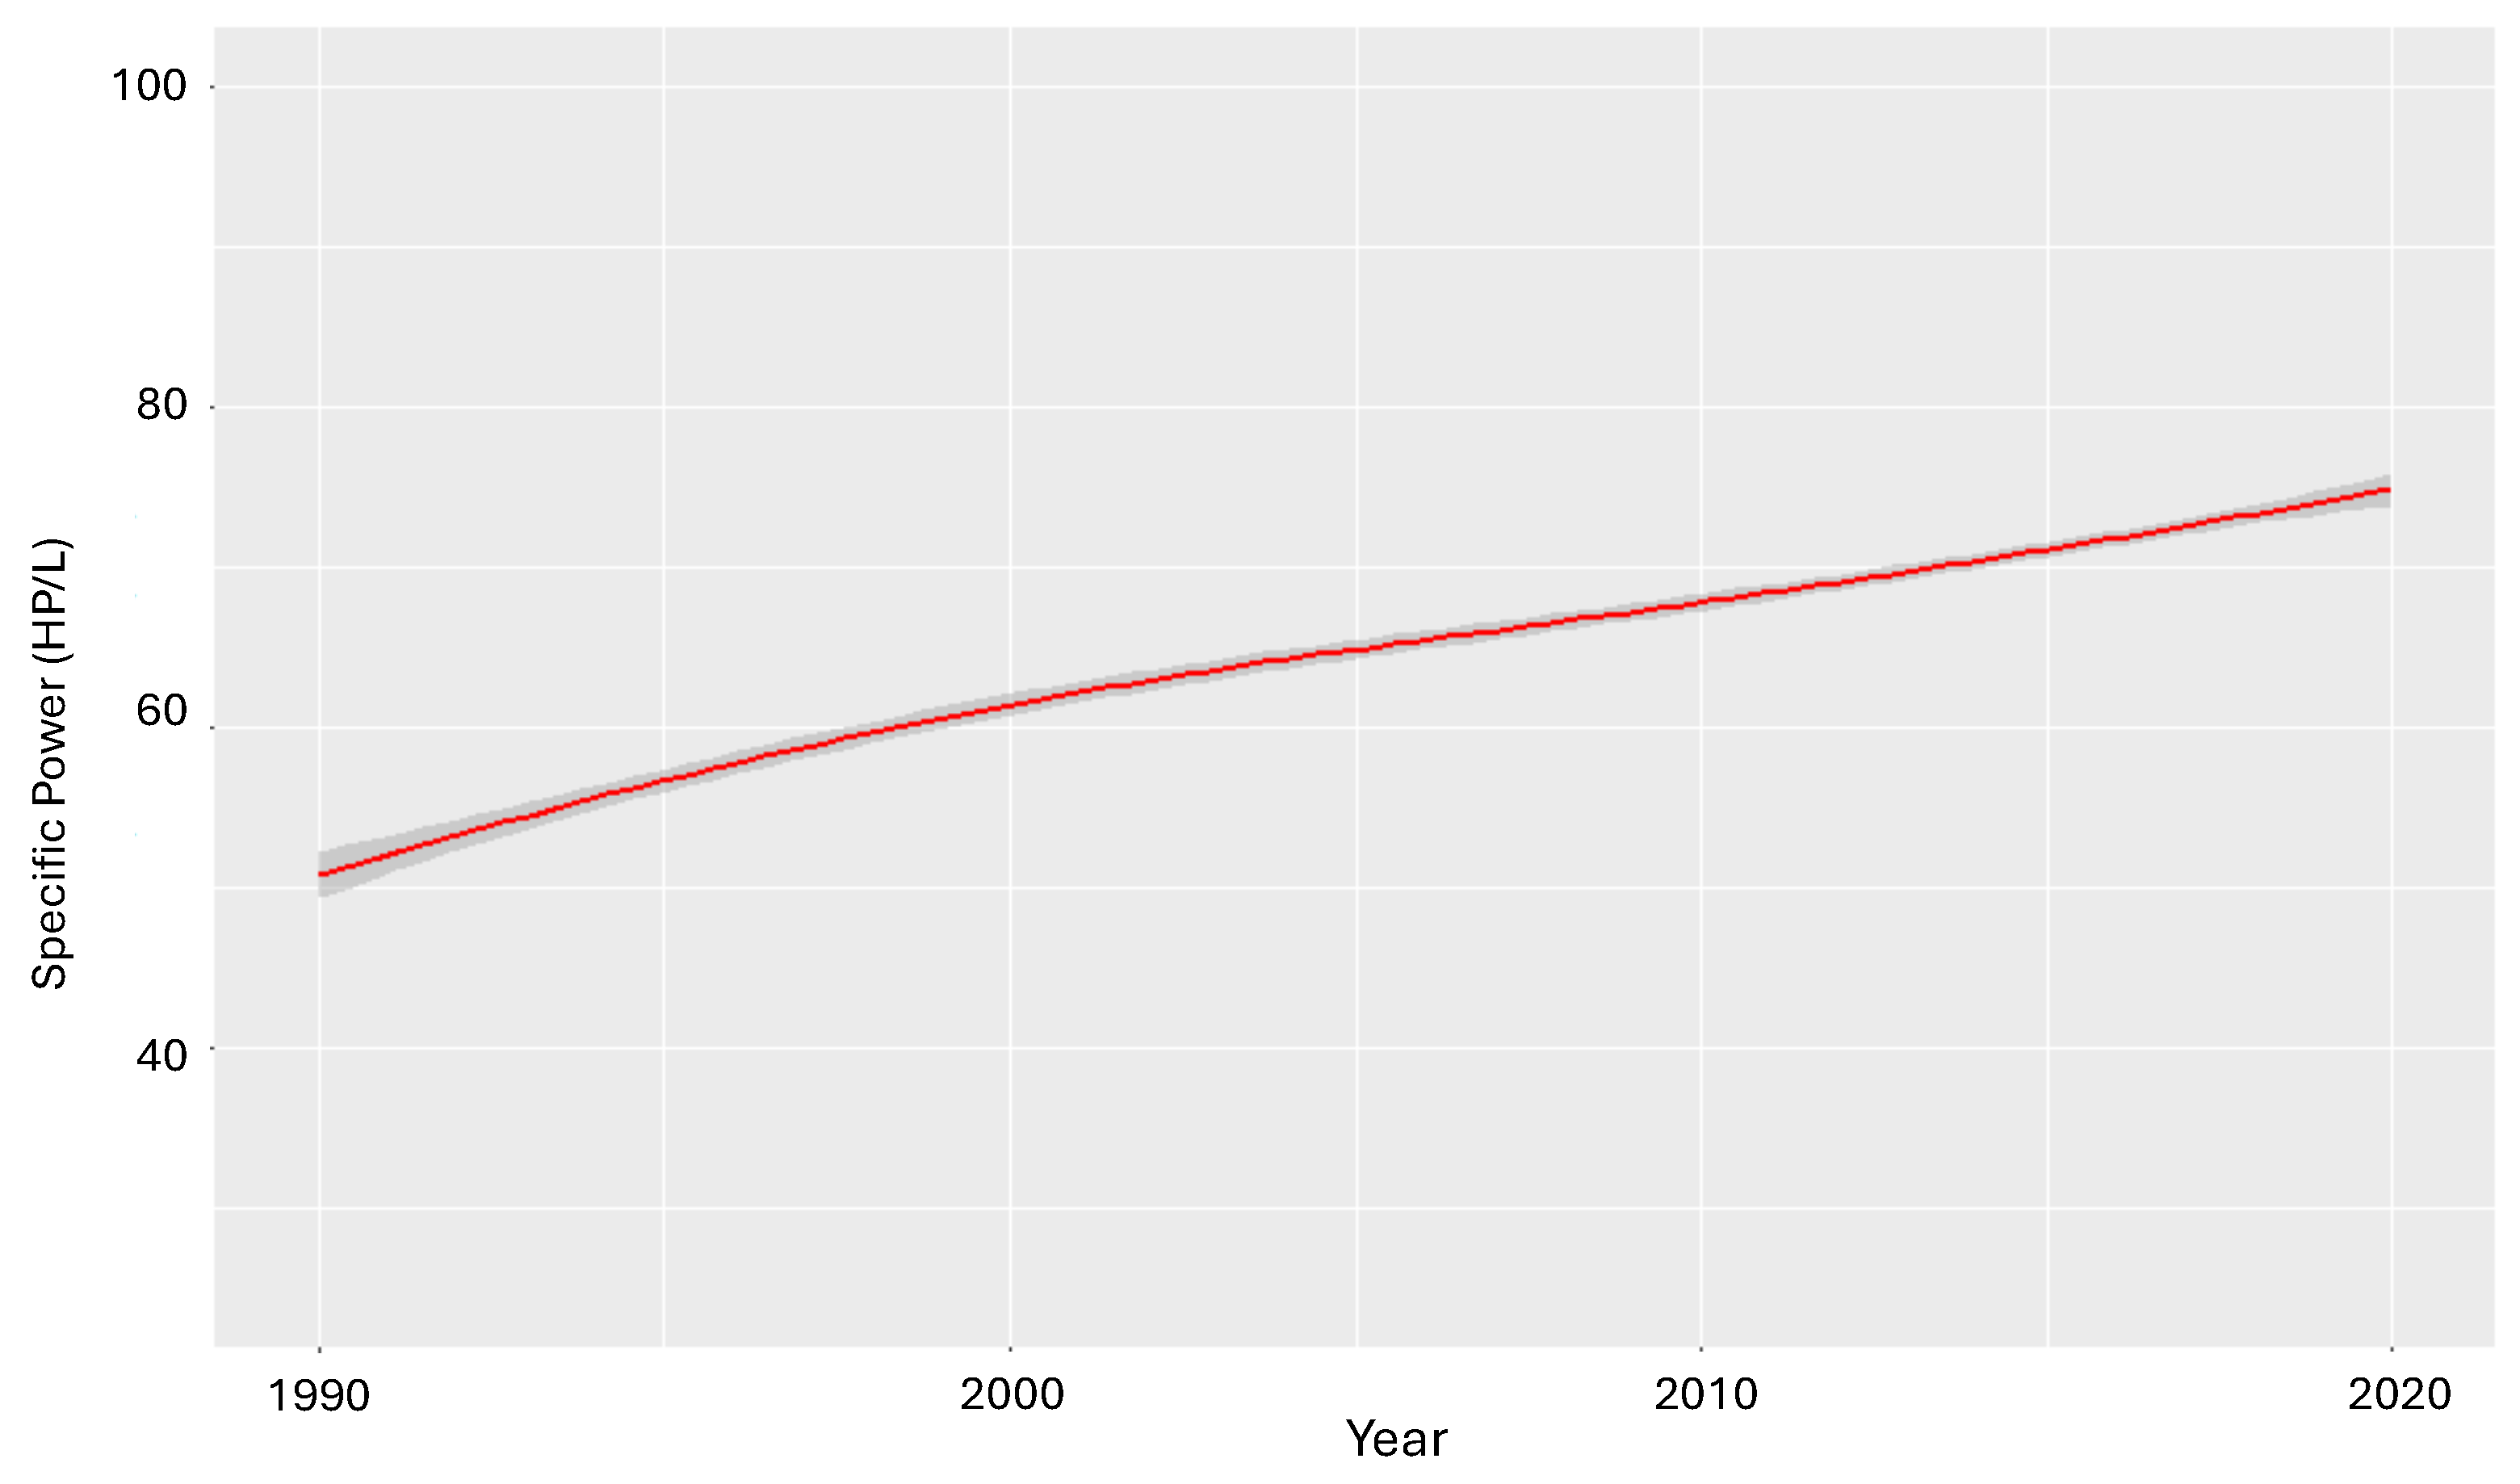
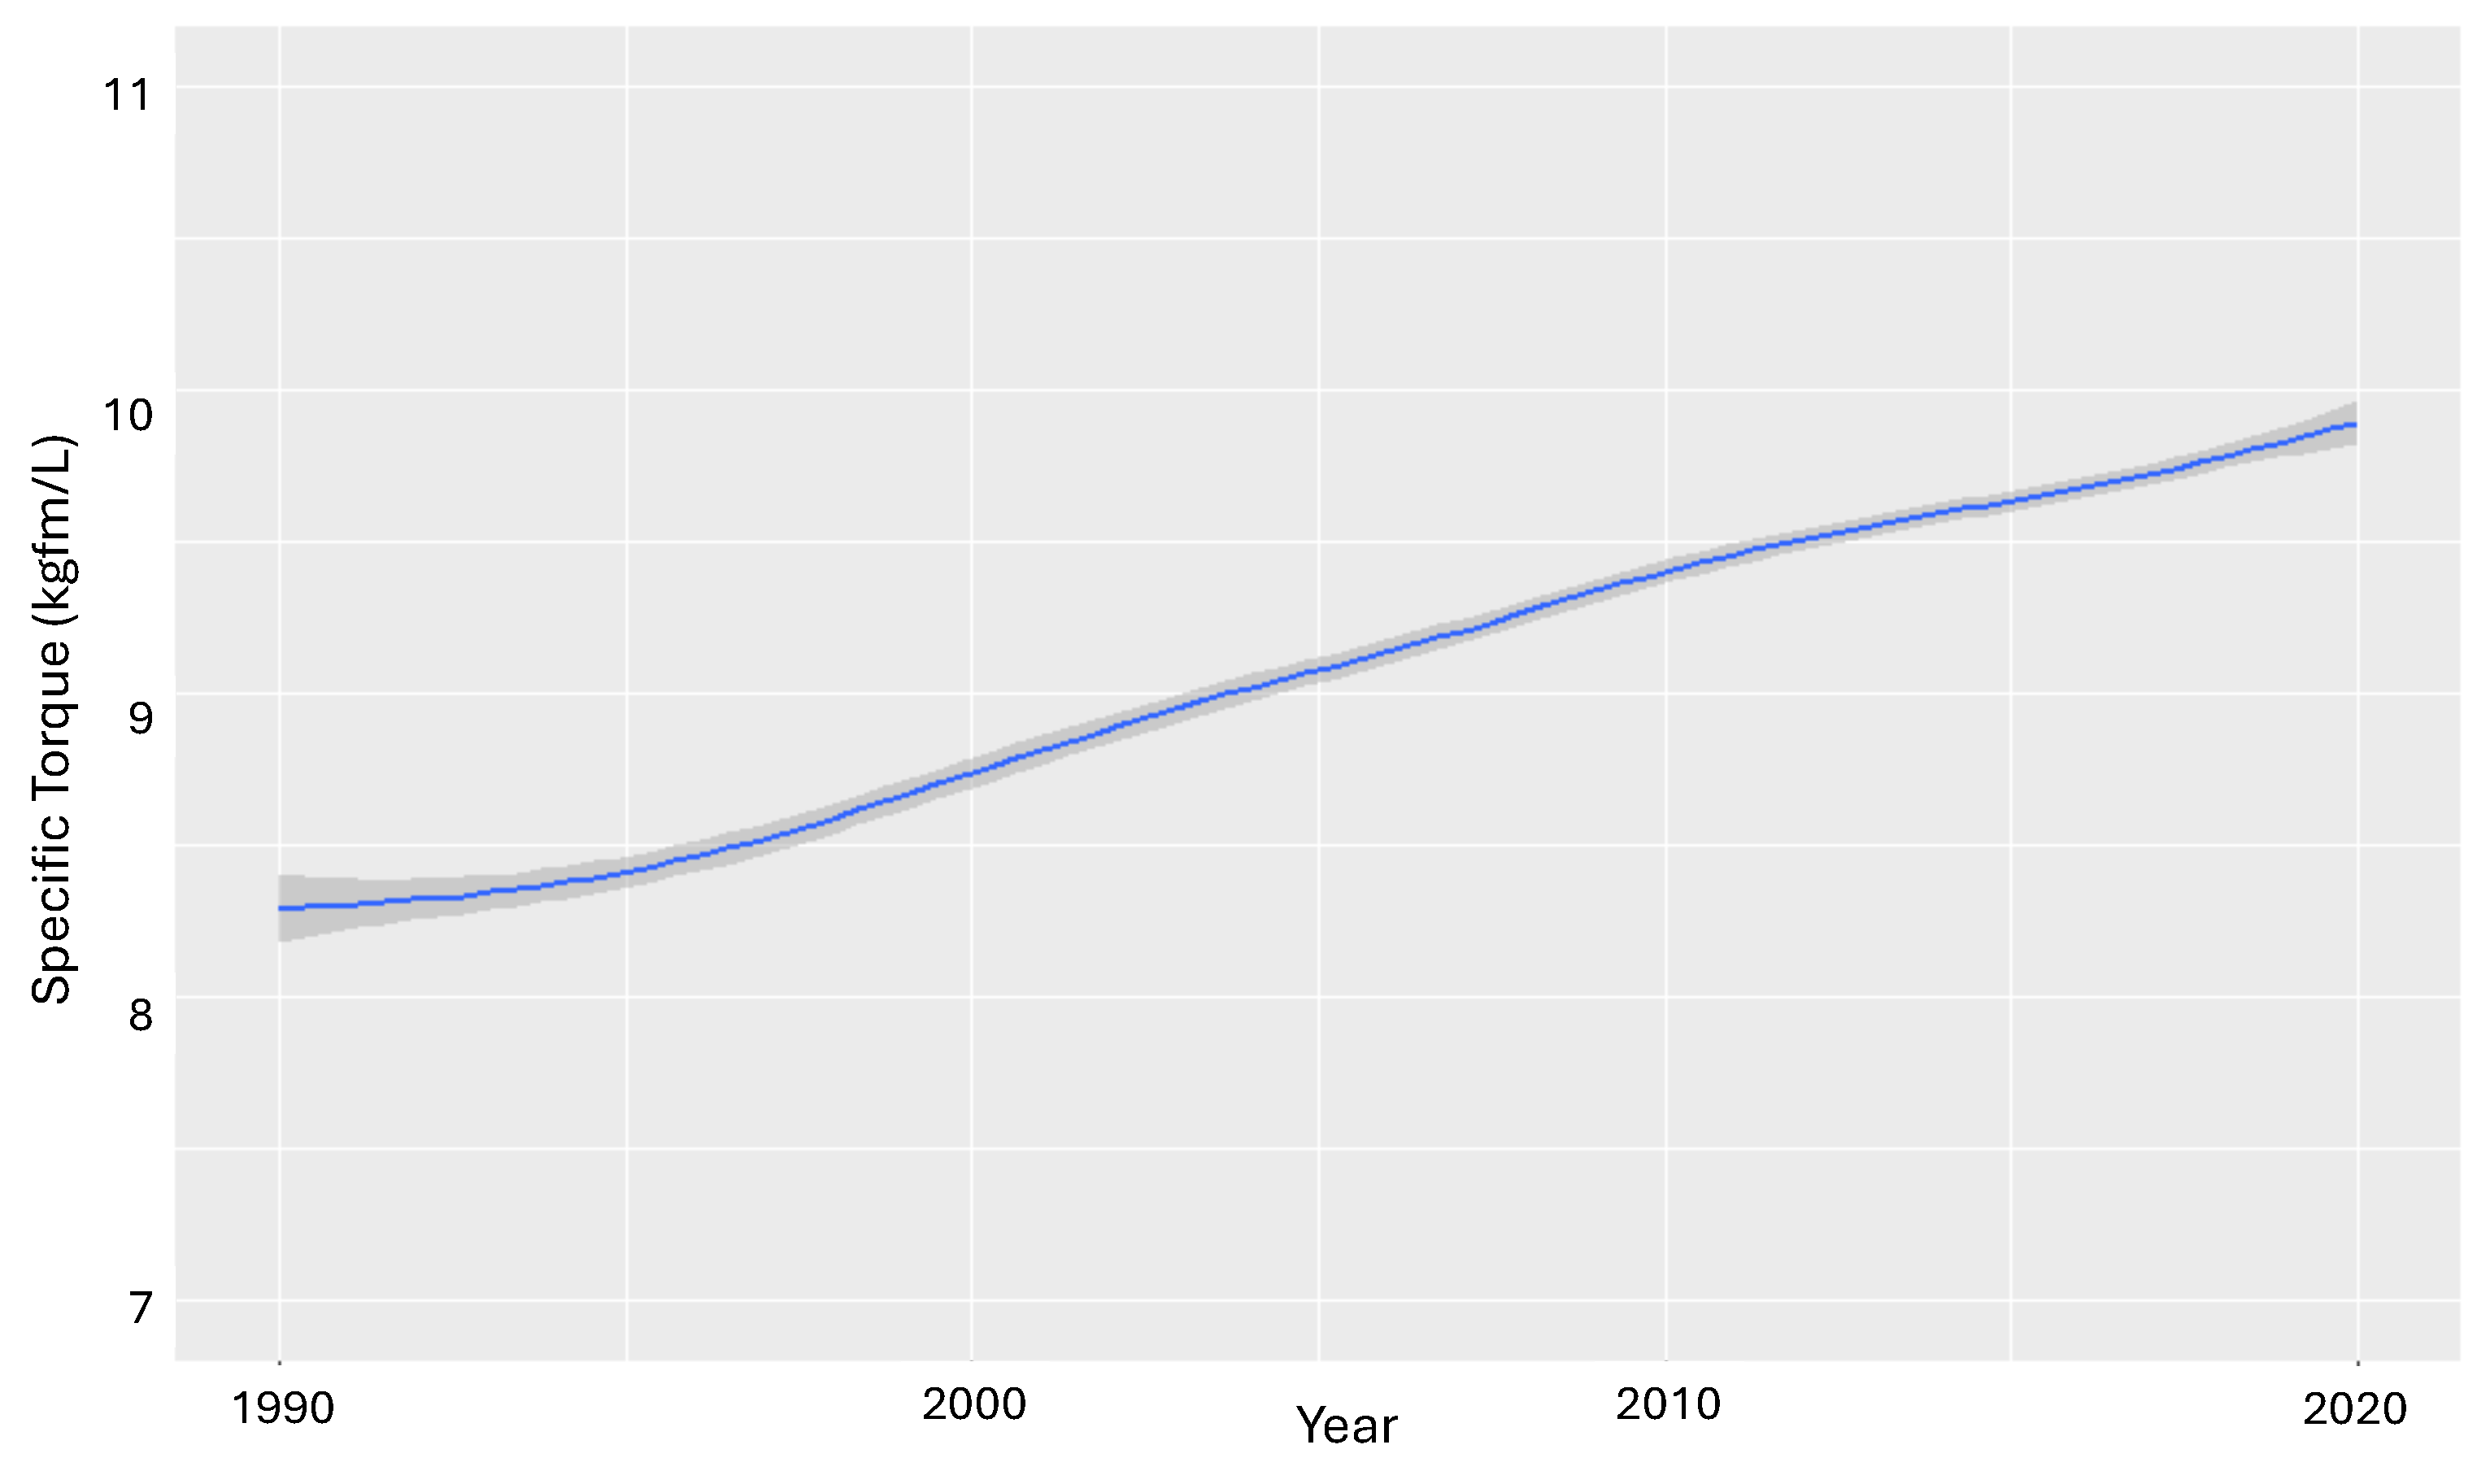
The title of this section is taken from [
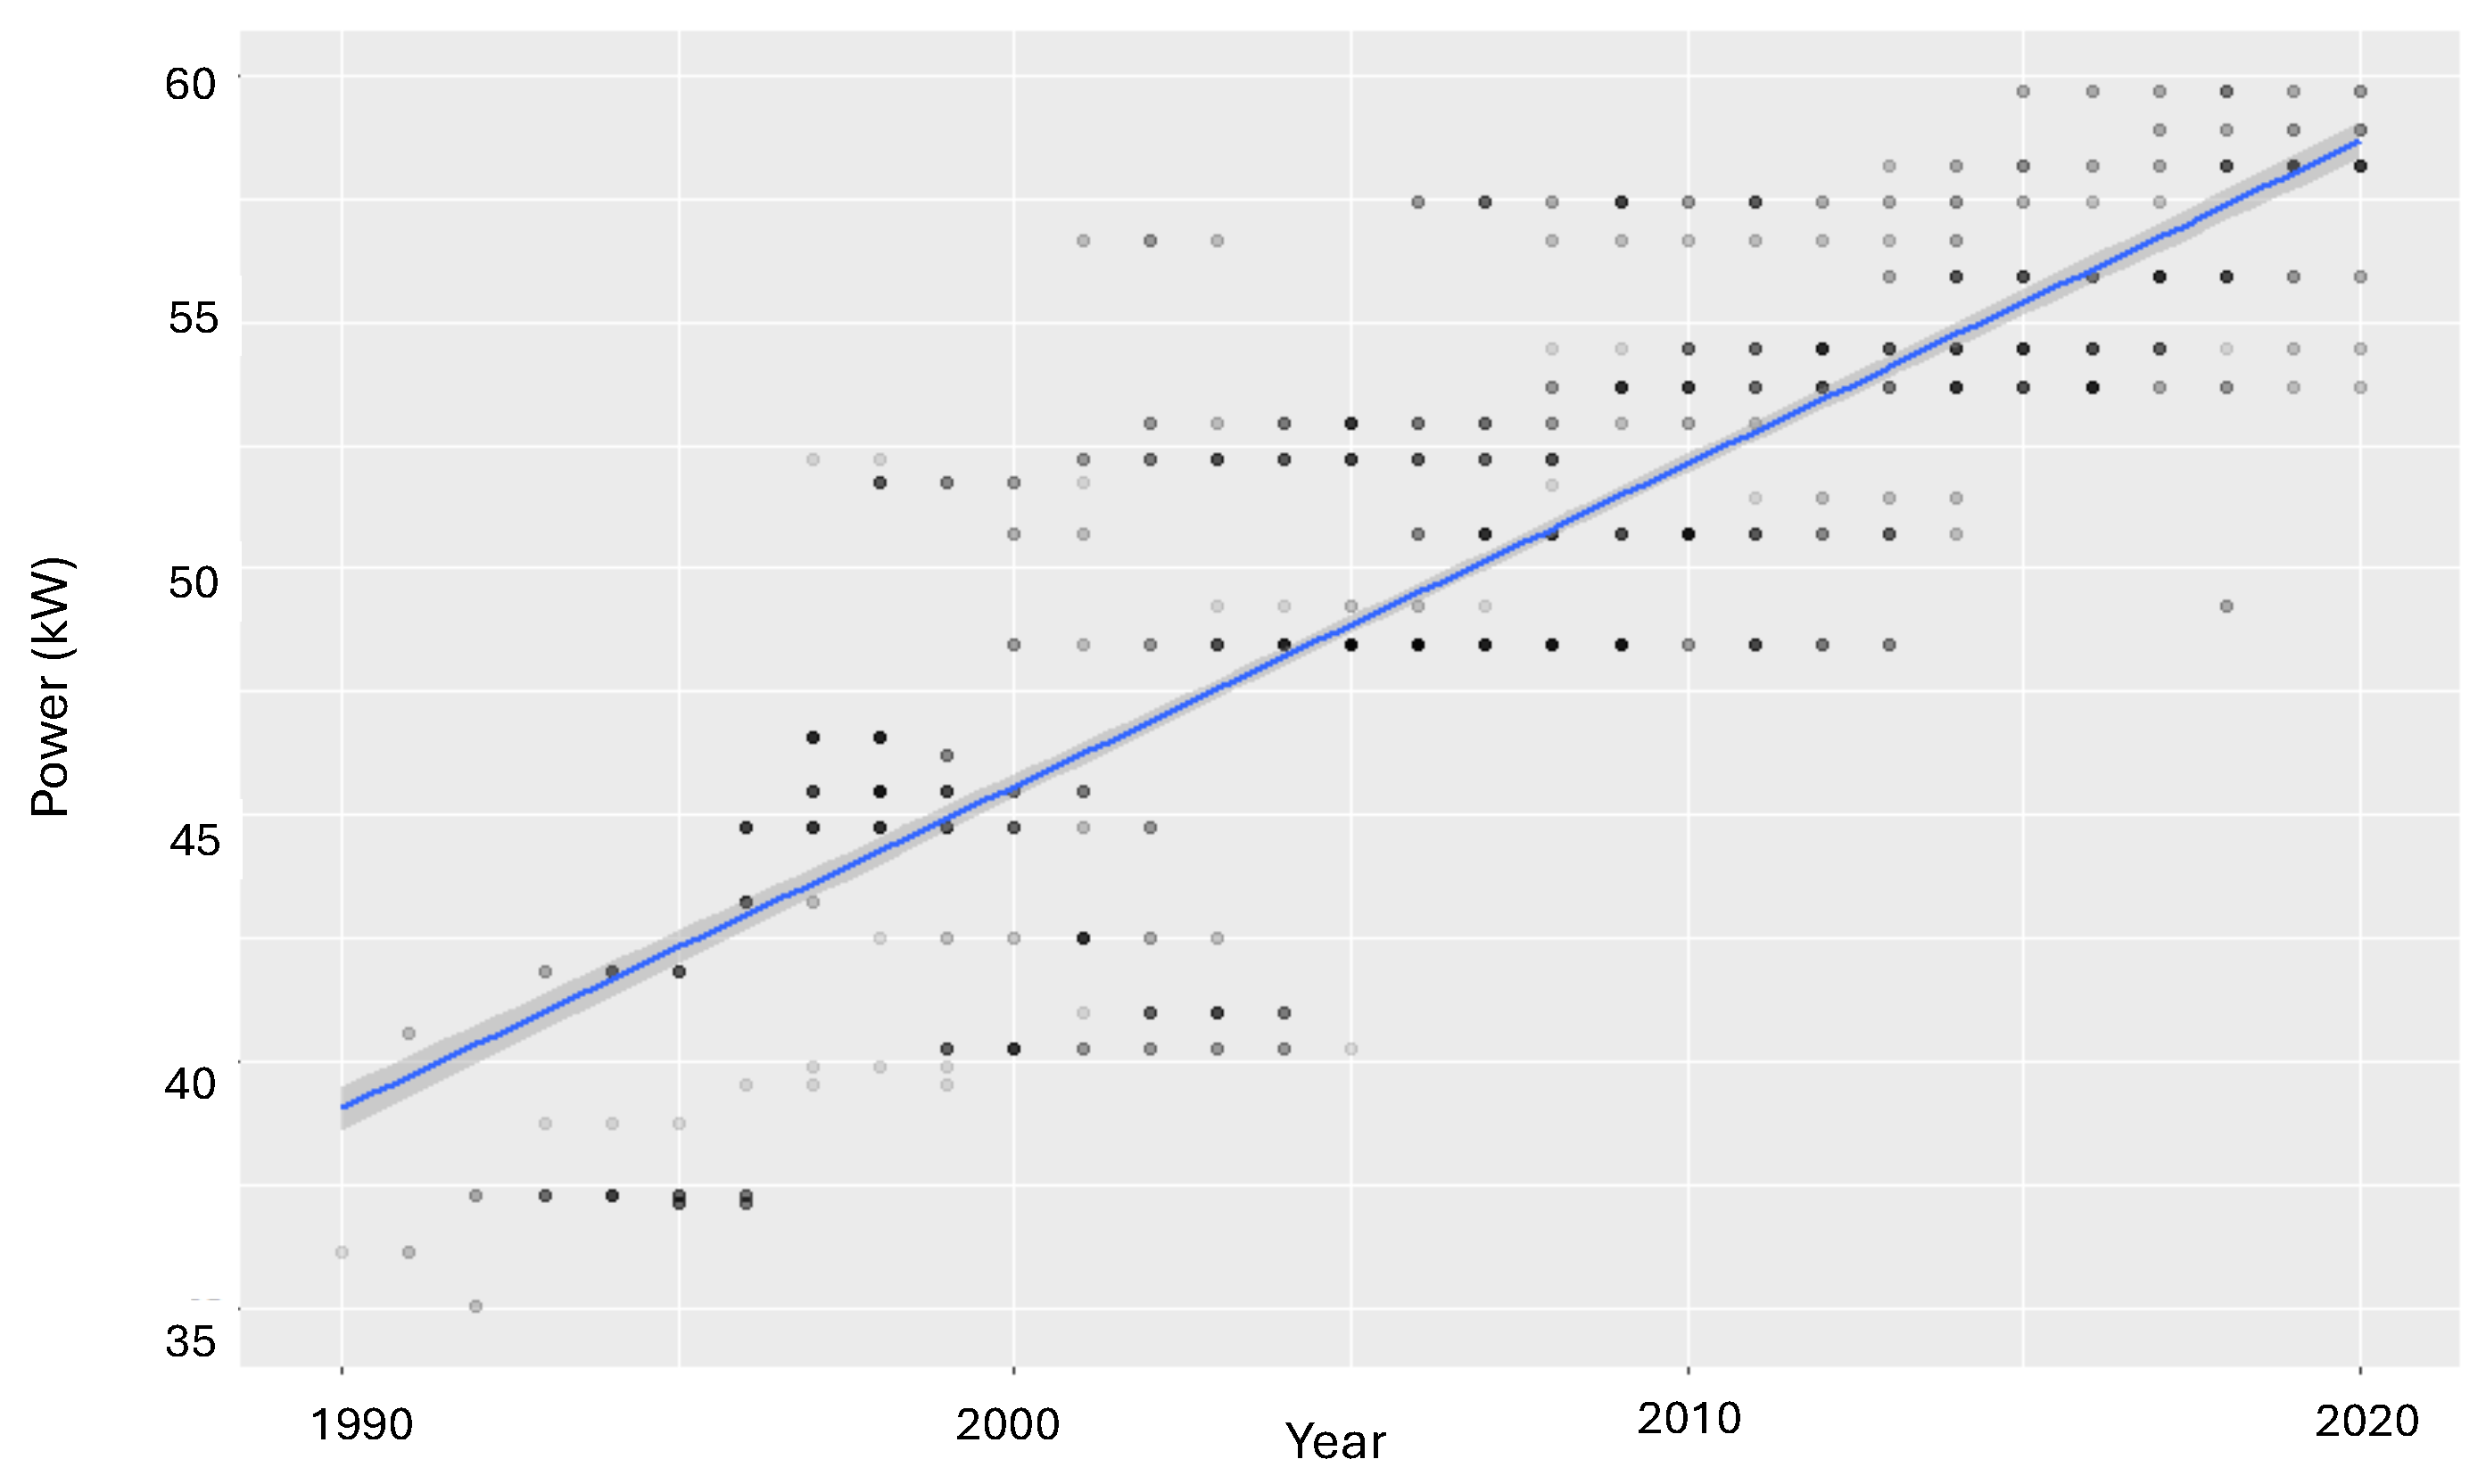
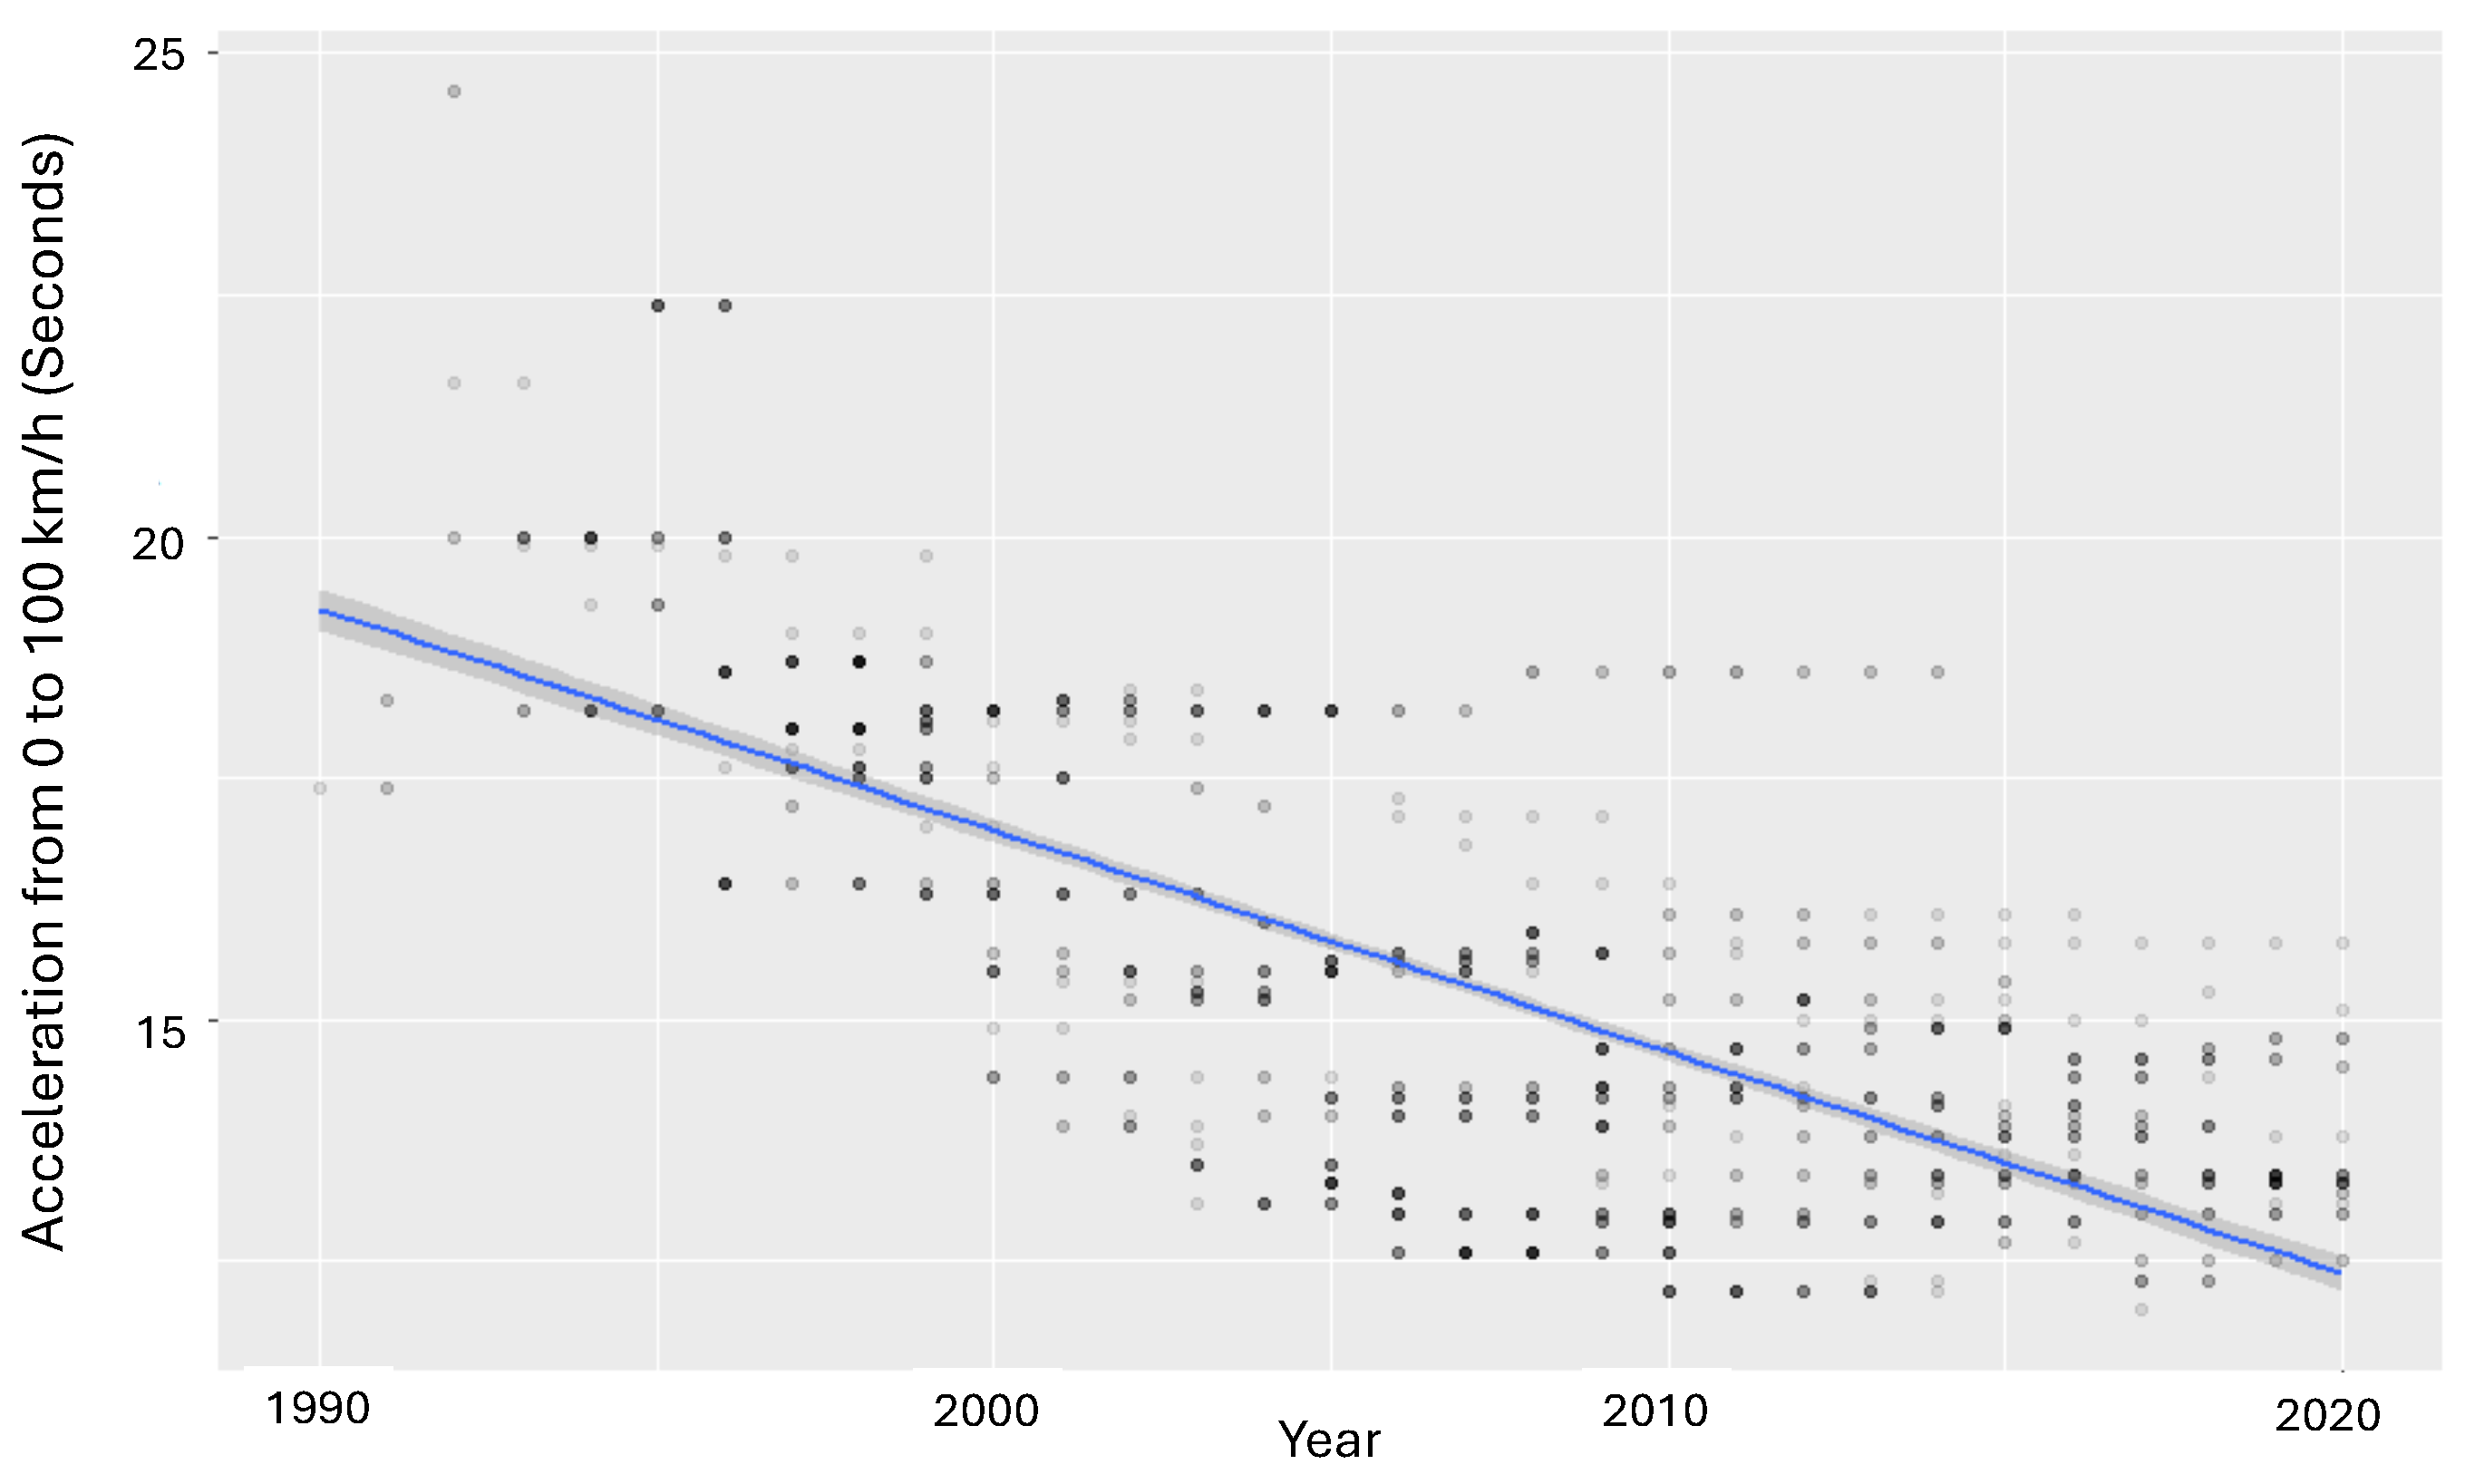
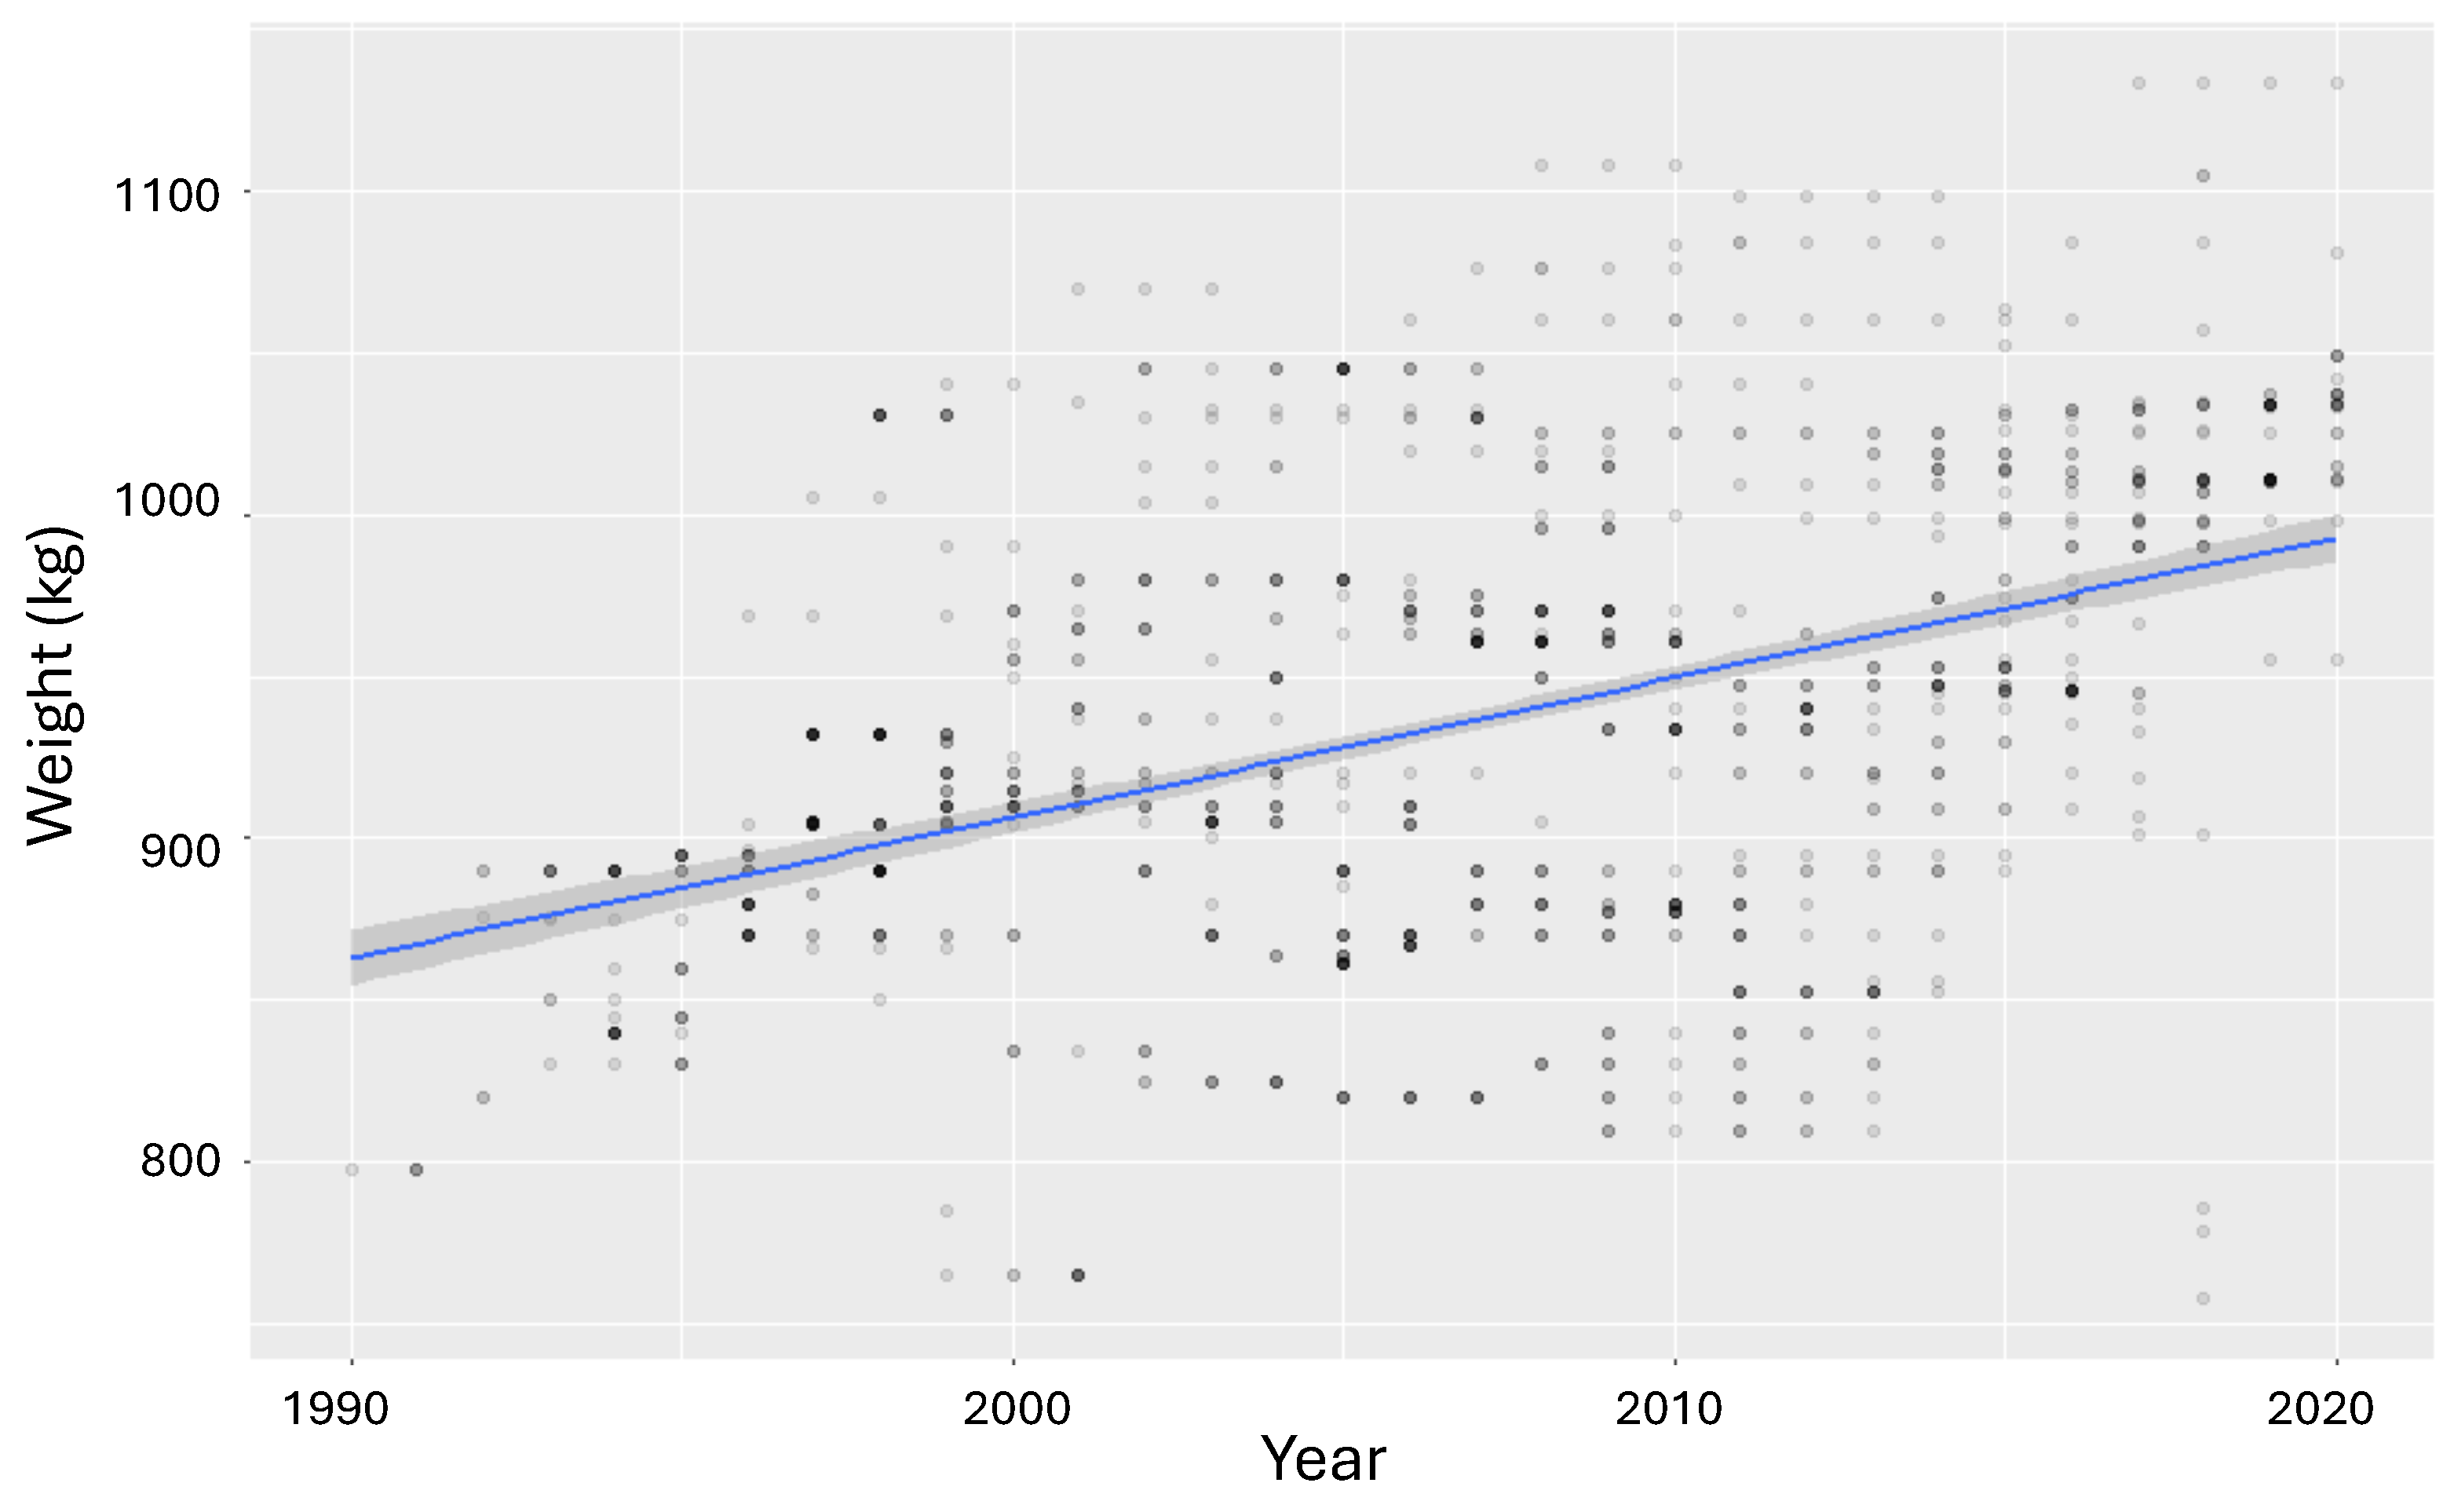
48]. The 1.0 L engines were initially synonymous with entry-level vehicles. Over time, the 1.0 L-engine vehicles became more powerful (
Figure 6), with a higher acceleration capability (
Figure 7) and also heavier (
Figure 8). Fuel economy, however, improved at a slower pace (
Figure 9). This trade-off is well established [
20,
21] and was estimated for the first time for Brazil in a previous study [
10]. The deployment of turbochargers in downsized engines highlighted this discrepancy further, as illustrated in
Figure 10.
Vehicle acceleration is one of the most important performance attributes perceived by drivers, and manufacturers seek to provide a “fun-to-drive” experience. Acceleration is usually measured in seconds needed for a vehicle to reach 100 km/h (or 60 miles/h) from idle. Enhancing the acceleration capability has implications for fuel economy. Throughout this article, fuel economy will refer to the kilometers traveled per liter of fuel consumed, km/L [
20,
21,
40,
41], though technology improvements may allow for a combination of efficiency and performance. The trade-off between efficiency and acceleration may not hold for future engines [
50], but this has been only determined through simulations. Estimating trends in acceleration for the LDV fleet has implications regarding future fuel use as the demand for more power will necessitate more energy. Furthermore, while completely new power trains, such as hybrids and pure electrical vehicles, may penetrate the market, the internal combustion engine (ICE) will still power most LVDs in the near future [
2].
Although not all vehicle weight increases are related to size, a correlation between the two exists. Safety and emission control have also improved over the years. While there was an improvement in weight-saving technologies throughout this period, there is no specific material tear-down for Brazil, as reported in [
51] for the USA. Zoepf and Mackenzie [
21,
52] estimated that one MY2010 car increased by 223 kg, of which 62 kg (27.8%) was related to safety, 25 kg (11.2%) to emission control, and the remaining 136 kg (60.9%) to convenience, such as a greater interior volume and entertainment equipment. The advancement of technology made a substantial difference to the characteristics of cars between 1990 and 2020. Metrics such as the specific power (HP/L), torque (kgmf/L), and power-to-weight ratio improved significantly during this period. This article focuses on the acceleration performance metrics and provides a history of the Brazilian LDV market. Along the way, this article traces the deployment of selected engine technologies and makes comparisons with the USA. A remarkably stable, roughly 10-year gap for technological adoption was also discovered in this work. However, there is a significant lack of knowledge about past developments of the LVD fleet in Brazil.
A fundamental characteristic of technological progress is the rate of its adoption. In lower-income countries, such as Brazil, the adoption of newer, more efficient technologies may be delayed compared with developed countries. A simple explanation can be that more affordable, less powerful samples are naturally less technologically developed due to price constraints. Hence, in Brazil, there are two markets, one for lower incomes and the other for higher incomes.
4. Methods
We can calculate acceleration in its most simplified form using only two parameters: peak power and weight (power-to-weight ratio). According to Malliaris et al. [
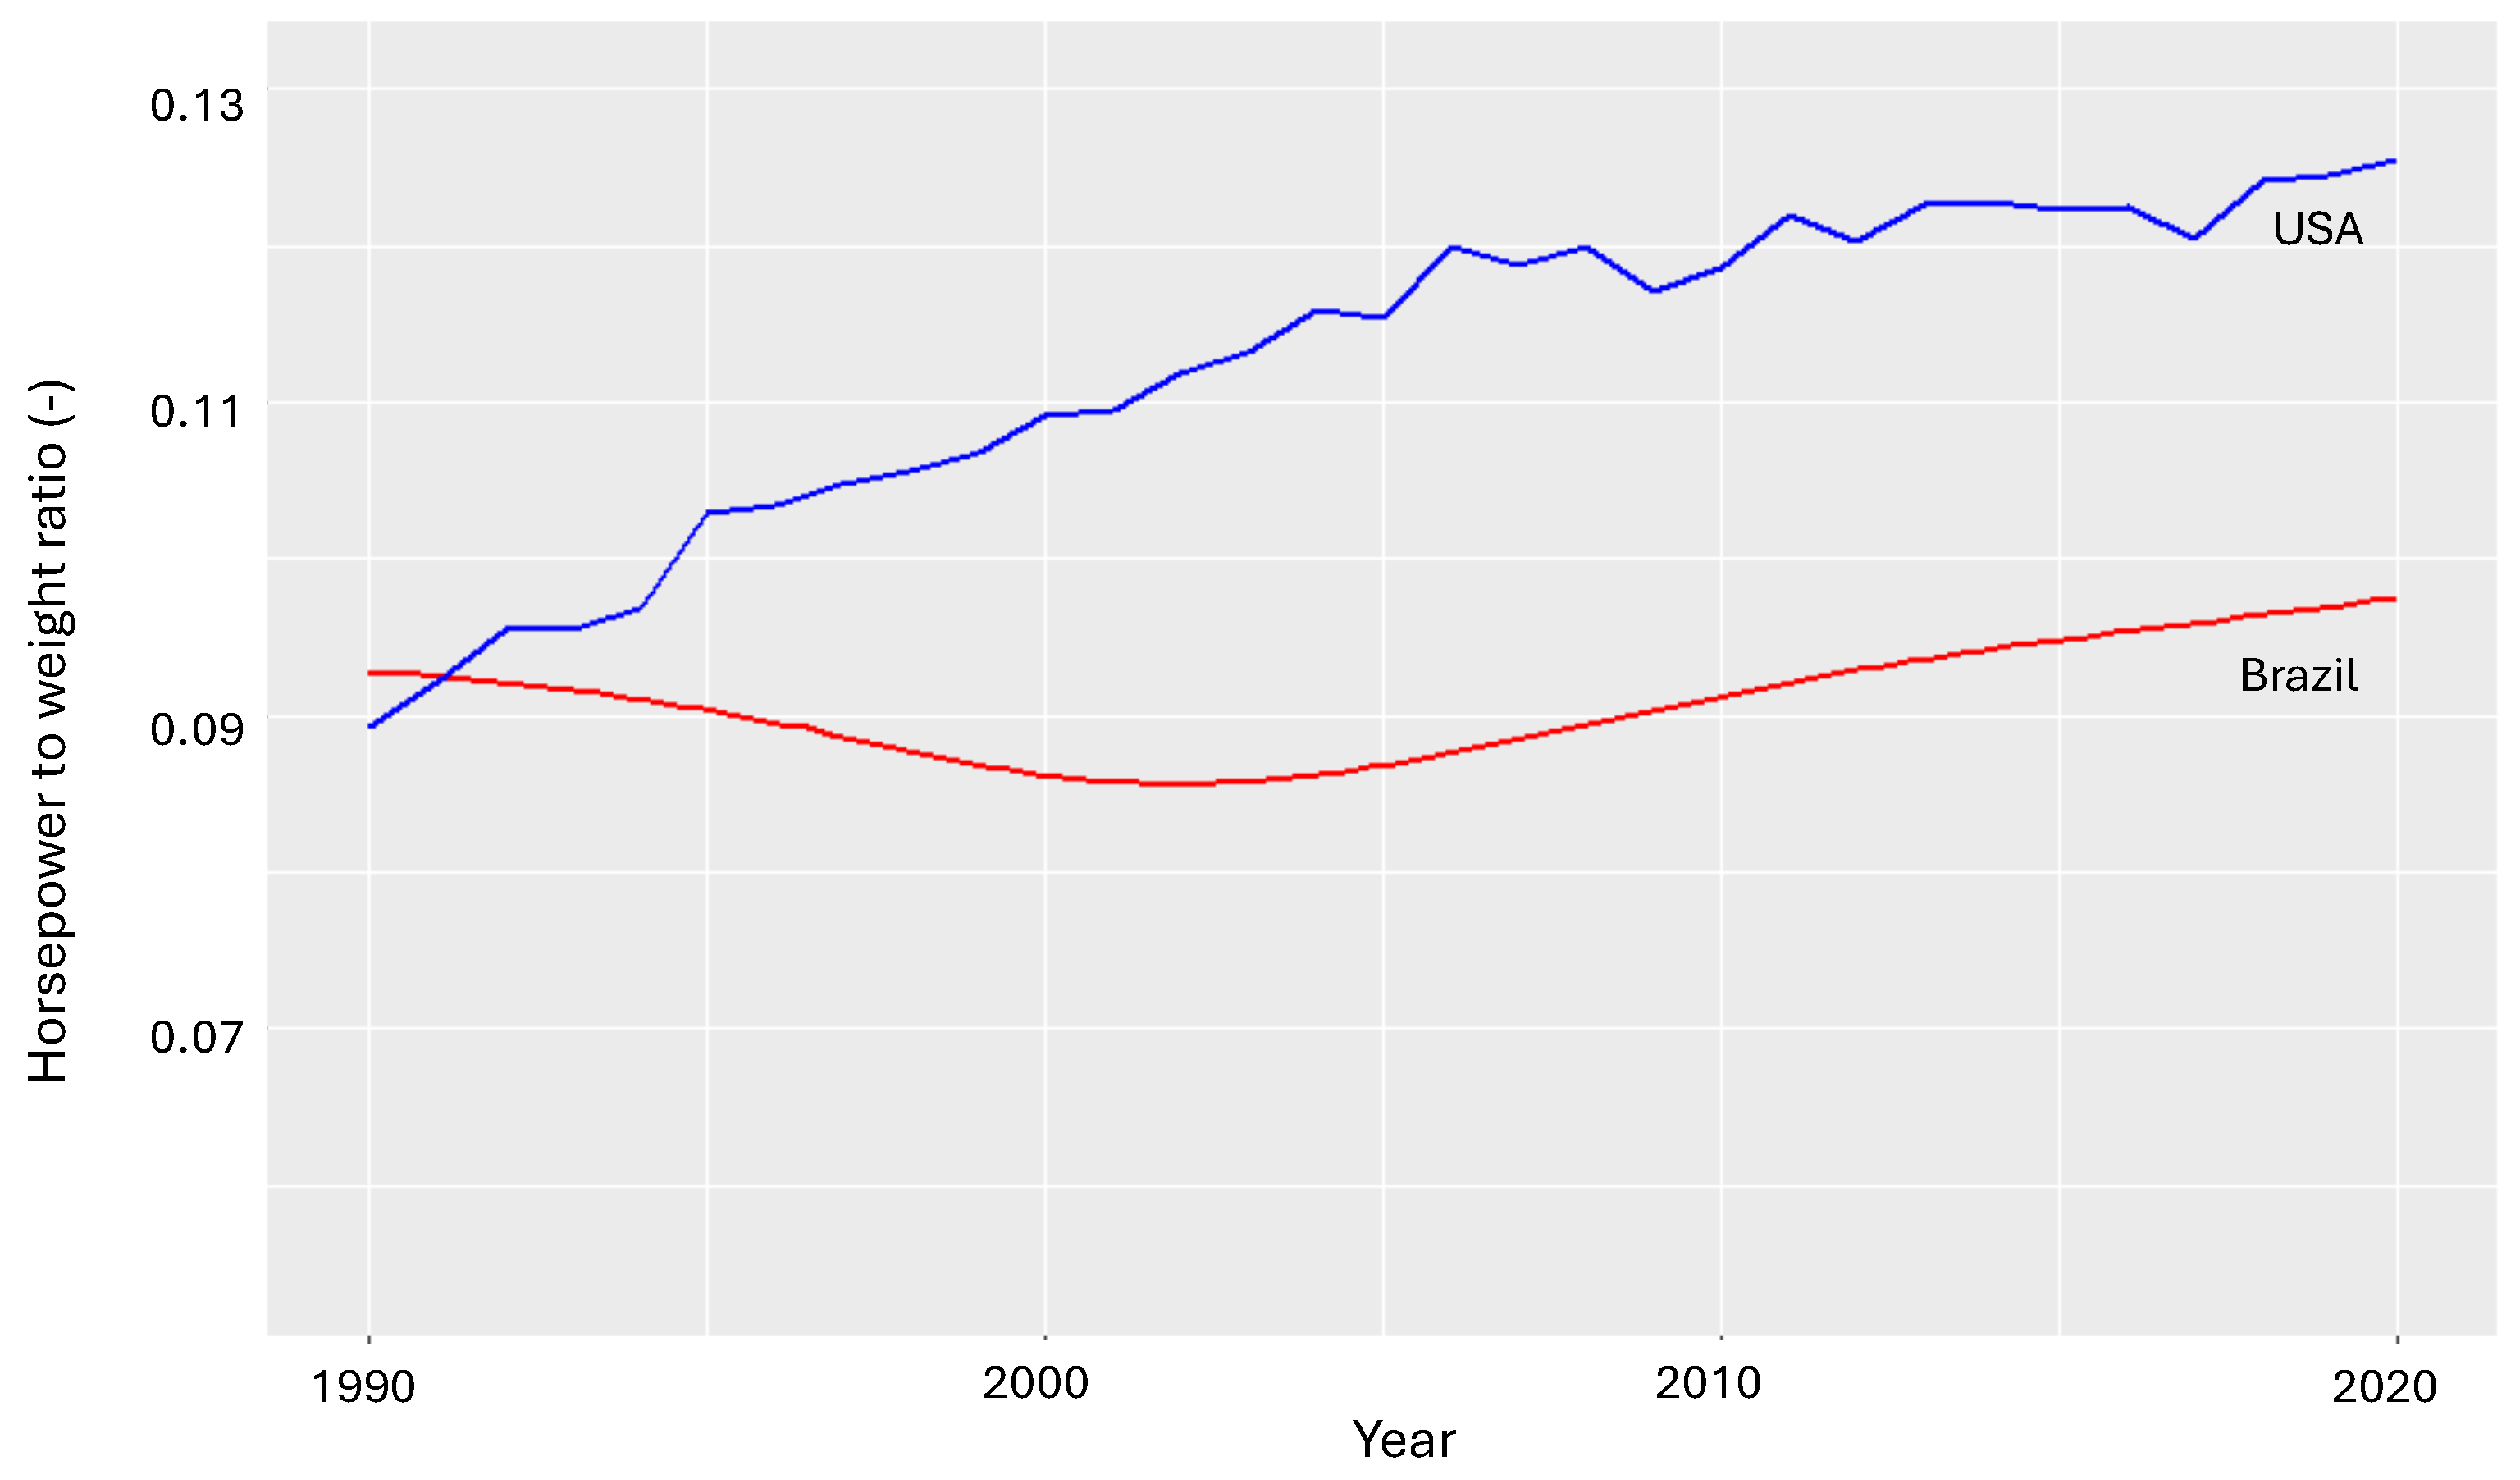
41], this relationship is “overwhelmingly influential” with regard to acceleration performance.
Figure 11 illustrates this ratio for the Brazilian (red line) and USA (blue line) light-duty vehicle (LDV) fleets between 1990 and 2020. It is important to highlight that the acceleration rate decreased for more than a decade; this trend was reversed only in 2002 and continues its upward trajectory to this day. The power-to-weight ratio reached the 1990 target levels around 2012.
Mackenzie [
21] analyzed more than 1000 models from 1975 to 2010, including vehicle attributes such as power, displacement, weight, and transmission speed. His analysis followed the approach of Knittel [
20], which included a set of variables for the acceleration performance each year. These year-fixed effects allowed the model to capture technological progress during the period. Effectively, it estimated how engineers could extract a better performance from the same power level over time [
21]. This kind of regression model was also used by Mosquim and Mady [
9,
10], who estimated some long-range characteristics of the Brazilian fleet; these data are not readily available in the literature or government reports as in the USA.
We used a series of regression models to estimate the effects of vehicle attributes on the acceleration performance, such as horsepower, torque, displacement, and weight. To this end, the approach used in [
20,
21] was employed, with Equations (
1) and (
2) representing a generalized form. The study period was 1990–2020. Year-fixed effects,
, capture the technical evolution compared to a base year, according to Equation (
2). This multiplicative model can be used to determine technological progress. The term
is the vehicles’ weight, and
is the slope of the curve and represents the rate with which the parameters’ weights and performance influence the acceleration. Finally, the parameter
relates to air intake technology,
B represents other variables with less influence,
is an average zero-error term, and
is the performance.
Finally, the engine downsizing effects were explored according to Equation (
3), following the approach of Santini and Anderson [
40], where
L is the displacement, and
P denotes power output, which could be in horsepower or torque.
C is the intercept with the ordinate axis, and
represents technologies, such as aspiration, fuel injection, valve control, valves per cylinder, transmission, and number of gears.
The dataset consisted of 2605 vehicles manufactured from 1990 to 2020. Sales were used as a rough guide to select models that best represented the actual fleet in Brazil. Data were analyzed in R Studio [
53], and all figures were generated using ggplot2 [
54].
Table 1 summarizes the values used in this study. The average acceleration performance improved by 1.13 s during the mentioned period, that is, by approximately 10%. The average value for the USA market was 8.8 s and reached an estimated asymptotic value from approximately 1 s [
21]. The average in 2020 was comparable to the 1990–1995 values for the USA market, indicating that there is still ample room for improvement in the Brazilian fleet. Working toward this improvement will probably imply a fuel economy penalty. A 2020 vehicle is heavier and more powerful while requiring less energy and featuring a smaller engine.
5. Results and Discussion
The results of the regression models, according to Equation (
2), are summarized in
Table 2. Each model represents the effect of independent variables on the acceleration. In models 1 to 3, we considered displacement, horsepower, and torque separately because they were highly correlated. Note that the weight increases the acceleration time, whereas displacement, compressors, and turbo-compressors decrease the time taken to accelerate from 0 to 100 km/h. The sensitivity of acceleration to weight was in the range of 0.542–0.809. It indicated the extent of the reduction in acceleration time with a 1% increase in mass. The results for compressors and turbo-compressors were more ambiguous than the previous findings because very few models in the dataset used these technologies. Other engine technologies were tested in some models but did not exhibit an improved fit, which was unexpected. This issue is discussed in previous sections, wherein the effects of these technologies on increasing the power and torque to be extracted from the same level of displacement are presented. Model 4 included displacement and horsepower, whereas model 5 included horsepower and torque. Sensitivities to power parameters in models 1–3 were 0.717–0.784, which are similar to those in models 4–5 when horsepower was combined with either displacement or torque. These values are similar to those found in the USA [
40,
41], where these data are available.
It is important to note that according to model 1, it can be concluded that parameters such as weight and displacement have a greater influence on acceleration. This conclusion is even more evident for model 2. For models 4 and 5, vehicle weight had the most significant effect on acceleration. This impact has already been discussed in [
10], and it has a serious impact on fuel consumption and carbon emissions. Furthermore, based on
Figure 2, it can be inferred that the current fleet is more carbon-intensive than in the past, as SUVs, which have more difficulty achieving environmental goals [
4], suggest that a different approach is needed to update the fleet.
Figure 1 shows vehicles that may have a lower carbon footprint.
Table 3 summarizes the year-fixed effects for all regression models. Values for 1990 are the baseline and are thus equal to zero.
The values in
Table 3 can be interpreted as the percent decrease in acceleration time an MY1990 vehicle would have if it had benefited from technological improvements in year
t, holding all other attributes constant. It is necessary to bear in mind that in models 1 to 3, we considered displacement, horsepower, and torque separately. Moreover, model 4 included displacement and horsepower, whereas model 5 included horsepower and torque.
This value captures technological improvements that allow the extraction of a better performance from the same power level [
21]. Equation (
4) shows that this chance is exponential. Models 1 and 3 had an upper and a lower limit for these effects at −0.327 and −0.038, respectively. Models 2, 4, and 5 were from −0.180 to 0.213. Mackenzie [
21] found values between 20% and 30% for the USA market for the period 1975–2010.
Year-fixed effects effectively capture technological improvement. The results show the extent to which performance can be increased for the same power level relative to the baseline year. Models 1 to 5 in
Table 3 indicate that this value lies somewhere around 20%. Although helpful, these models have certain limitations when quantifying the exact process of how this came to be. Parameters such as fuel injection, valve control, and valves per cylinder did not significantly improve the model accuracy, although engineering principles dictate that they must have affected the engine performance in some way. For the sake of the argument,
Figure 12 and
Figure 13 illustrate that increasing amounts of horsepower and torque can be extracted for the same level of displacement, which can be achieved along with factors such as improving tire design and aerodynamics by deploying newer engine technologies and other alternatives. Therefore, the average vehicle had an increase in acceleration, despite the increase in mass and other performance parameters, showing the necessity of the following reflection, bearing in mind the importance of safety features in a car, such as airbags and other equipment: What if all investments go to an increase in the efficiency of the vehicle [
10]?
The results for engine downsizing are summarized in
Table 4 and were estimated according to Equation (
3). The baseline engine technology is represented by a natural aspired engine with a carburetor, an overhead valve, and manual transmission.
This exercise answers the following questions: “What if the 1.0 L LDV were to maintain performance at the 1994 level?”, “By how much could fuel efficiency be improved above actual values?”, and “What is the environmental cost?”. To estimate the 2020 fuel economy shown in
Table 5, if performance held constant, values were taken from previous research [
10]. If a hypothetical vehicle was purchased in 2020 and it traveled 200,000 km [
4] in its lifetime, this would mean a difference in total fuel consumption of 1027–1197 L if this vehicle runs on gasoline with an emission factor of 2 kg/L. Here, it is necessary to clarify that since 1993, Brazilian gasoline, according to regulations, must be blended with ethanol, previously, 22%, but nowadays, around 27%. Hence, the emission factors are slightly lower than international values, usually around 2.3 kg/L. The difference in total emissions would be 2.05–2.40 t CO
2. If half of the total fleet of approximately 40 million vehicles in 2020 follow this trend, lifetime avoided emissions would be in the range of 41.1–47.9 Mt CO
2, or about two-thirds of the estimated total LDV emissions in 2021, 62.8 Mt CO
2 [
55]. Moreover, Ref. [
4] concluded that ethanol represents 50% of all fuel in an average Brazilian LDV’s tank.
A 2018 entry-level model reached 15.2 km/L combined fuel economy and accelerated from 0 to 100 km/h in 14.7 s with 66 HP. This evolution was achieved by reducing the model weight to 758 kg. This rate of weight reduction, while significant, is nowhere near the levels endorsed by Lovins [
56]. He advocated for shifting the design toward significantly reducing the traction load. As illustrated in
Table 2, this is the most effective way to improve fuel efficiency. Galvin [
48] presented a counterpoint, illustrating that EVs are catching up with ICE vehicles, narrowing the gap in size and power, with implications for emissions.
ICEs will still be the major power source for decades to come, regardless of the penetration of AFVs (alternative fuel vehicles), because the latter must start from very low bases [
2]. Furthermore, ICEs can still benefit from newer technologies to increase their efficiency and performance [
57,
58,
59]. The two main directions are improving conventional designs, such as the natural aspired engine, and engine downsizing with turbocharging. This section will present a brief overview of newer technologies that may be deployed in the near future. De Cesare et al. [
60] listed technologies for improving efficiency in the near future (2025). These include direct fuel injection (GDI) with lean combustion, Miller/Atkinson cycles, variable compression ratio (VCR), water injection (WI), cylinder deactivation (CD), external exhaust gas re-circulation (EGR), and multi-stage air charging.
Sellnau et al. [
3] demonstrated a gasoline direct-injection compression ignition (GDCI) engine with a 43% brake thermal efficiency (BTE) at 12 bar of mean effective pressure and 40% BTE over a 5 to 20 bar range (Gen3X engine). The authors stated that practical limits for the BTE in spark ignition (SI) engines are at about 40%, while for GDCI they are 50%, with possible improvements in heat loss and friction reductions as well as improved turbocharger efficiency (Gen4X). Vehicle simulations for Gen3X with six-speed automatic transmission (AU), eight-speed AU with 12 V start/stop, and eight-speed AU with a 48 V integrated starter generator resulted in 35.9%, 45.4%, and 50.9% improvements in combined FE compared with a baseline SI turbo engine. The Gen4X concept produced 68.4% and 78.1% improvements. These results compare favorably with hybrid electric vehicles (HEVs). Simulations for a 2.2 L Gen3X-equipped vehicle resulted in combined FE of around 41 to 46 mpg for differently sized SUVs and a midsize sedan.
Toyota’s 2017 2.5 L, 150 kW inline four-cylinder engine, achieved a 40% thermal efficiency and 16% improvements in fuel economy by employing an Atkinson cycle, new electrical variable valve timing (VVT), a multi-hole-type direct fuel injector (DI), a variable cooling system, and an oil pump. Specific power was targeted at 60 kW/L to provide a “fun-to-drive” experience [
61]. Honda’s 2016 1.5 L downsized turbocharged engine was intended to replace 1.8–2.4 L naturally aspired engines [
62]. The company’s aim was also to provide a “fun-to-drive” experience while meeting the environmental regulations by improving the existing 1.8 L naturally aspired design. In addition to turbocharging, the DI replaced port injection, and dual valve timing control (VTC) allowed for better optimization of the intake/exhaust valve overlap and timing. The power output increased by 21% to attain 130 kW (86.7 kW/L), and the torque increased by 26%. This design achieved 38% thermal efficiency and 16% better FE than the 1.8 L naturally aspired engine, from 33 MPG to 35 MPG for the EPA ratings. Spark ignition (SI) ICEs operate in a standard four-stroke Otto cycle in which the compression and expansion strokes are symmetrical. Two over-expanded cycles, Atkinson and Miller, can increase efficiency, the former by altering the exhaust valve opening and intake valve closing timings and the latter by having a higher expansion than the compression ratio [
63].
Middleton et al. [
64,
65] simulated the FE implications of technologies in a baseline MY2012 Ford Fusion midsize sedan. These technologies included dual-cam phasing, discrete variable valve lift (DVVL), engine friction reduction, GDI, downsizing with boost, cooled EGR, and reductions in weight, drag, and rolling resistances. The engine downsizing with a turbocharger provided the largest reduction in fuel consumption (9.6%). DVVL provided a 5.7% improvement in fuel consumption. In employing a 50% downsizing, that is, from 2.5 L NA to 1.25 l TC, the FE was improved by 4.6%. Employing all technological packages along with a 10% reduction in weight and 20% reduction in drag and rolling coefficients reduced the fuel consumption by 35%, that is, from 31.8 MPG to 48.8 MPG for the combined cycle.
As discussed above, these technical gains may be partially (or totally) offset by increased performance and sale-mix shifts. The same could occur for EVs. Galvin [
48] explained that EVs are still less potent than ICEs in the US, with 254 HP against 284 HP on average, but this gap may be closed by the emergence of super-powerful EVs with more than 600 HP. He estimated that a 5% weight increase in smaller EVs resulted in a 4.7% increase in the electricity demand, whereas for larger EVs, this number was 10.5%. If the latter were to gain market share, it would place more significant pressure on the rate of the decarbonization of electricity generation. While these findings should be considered, this exercise in shifting the EV market share should were not attempted here, as this would create yet another layer of complexity for the predictions.
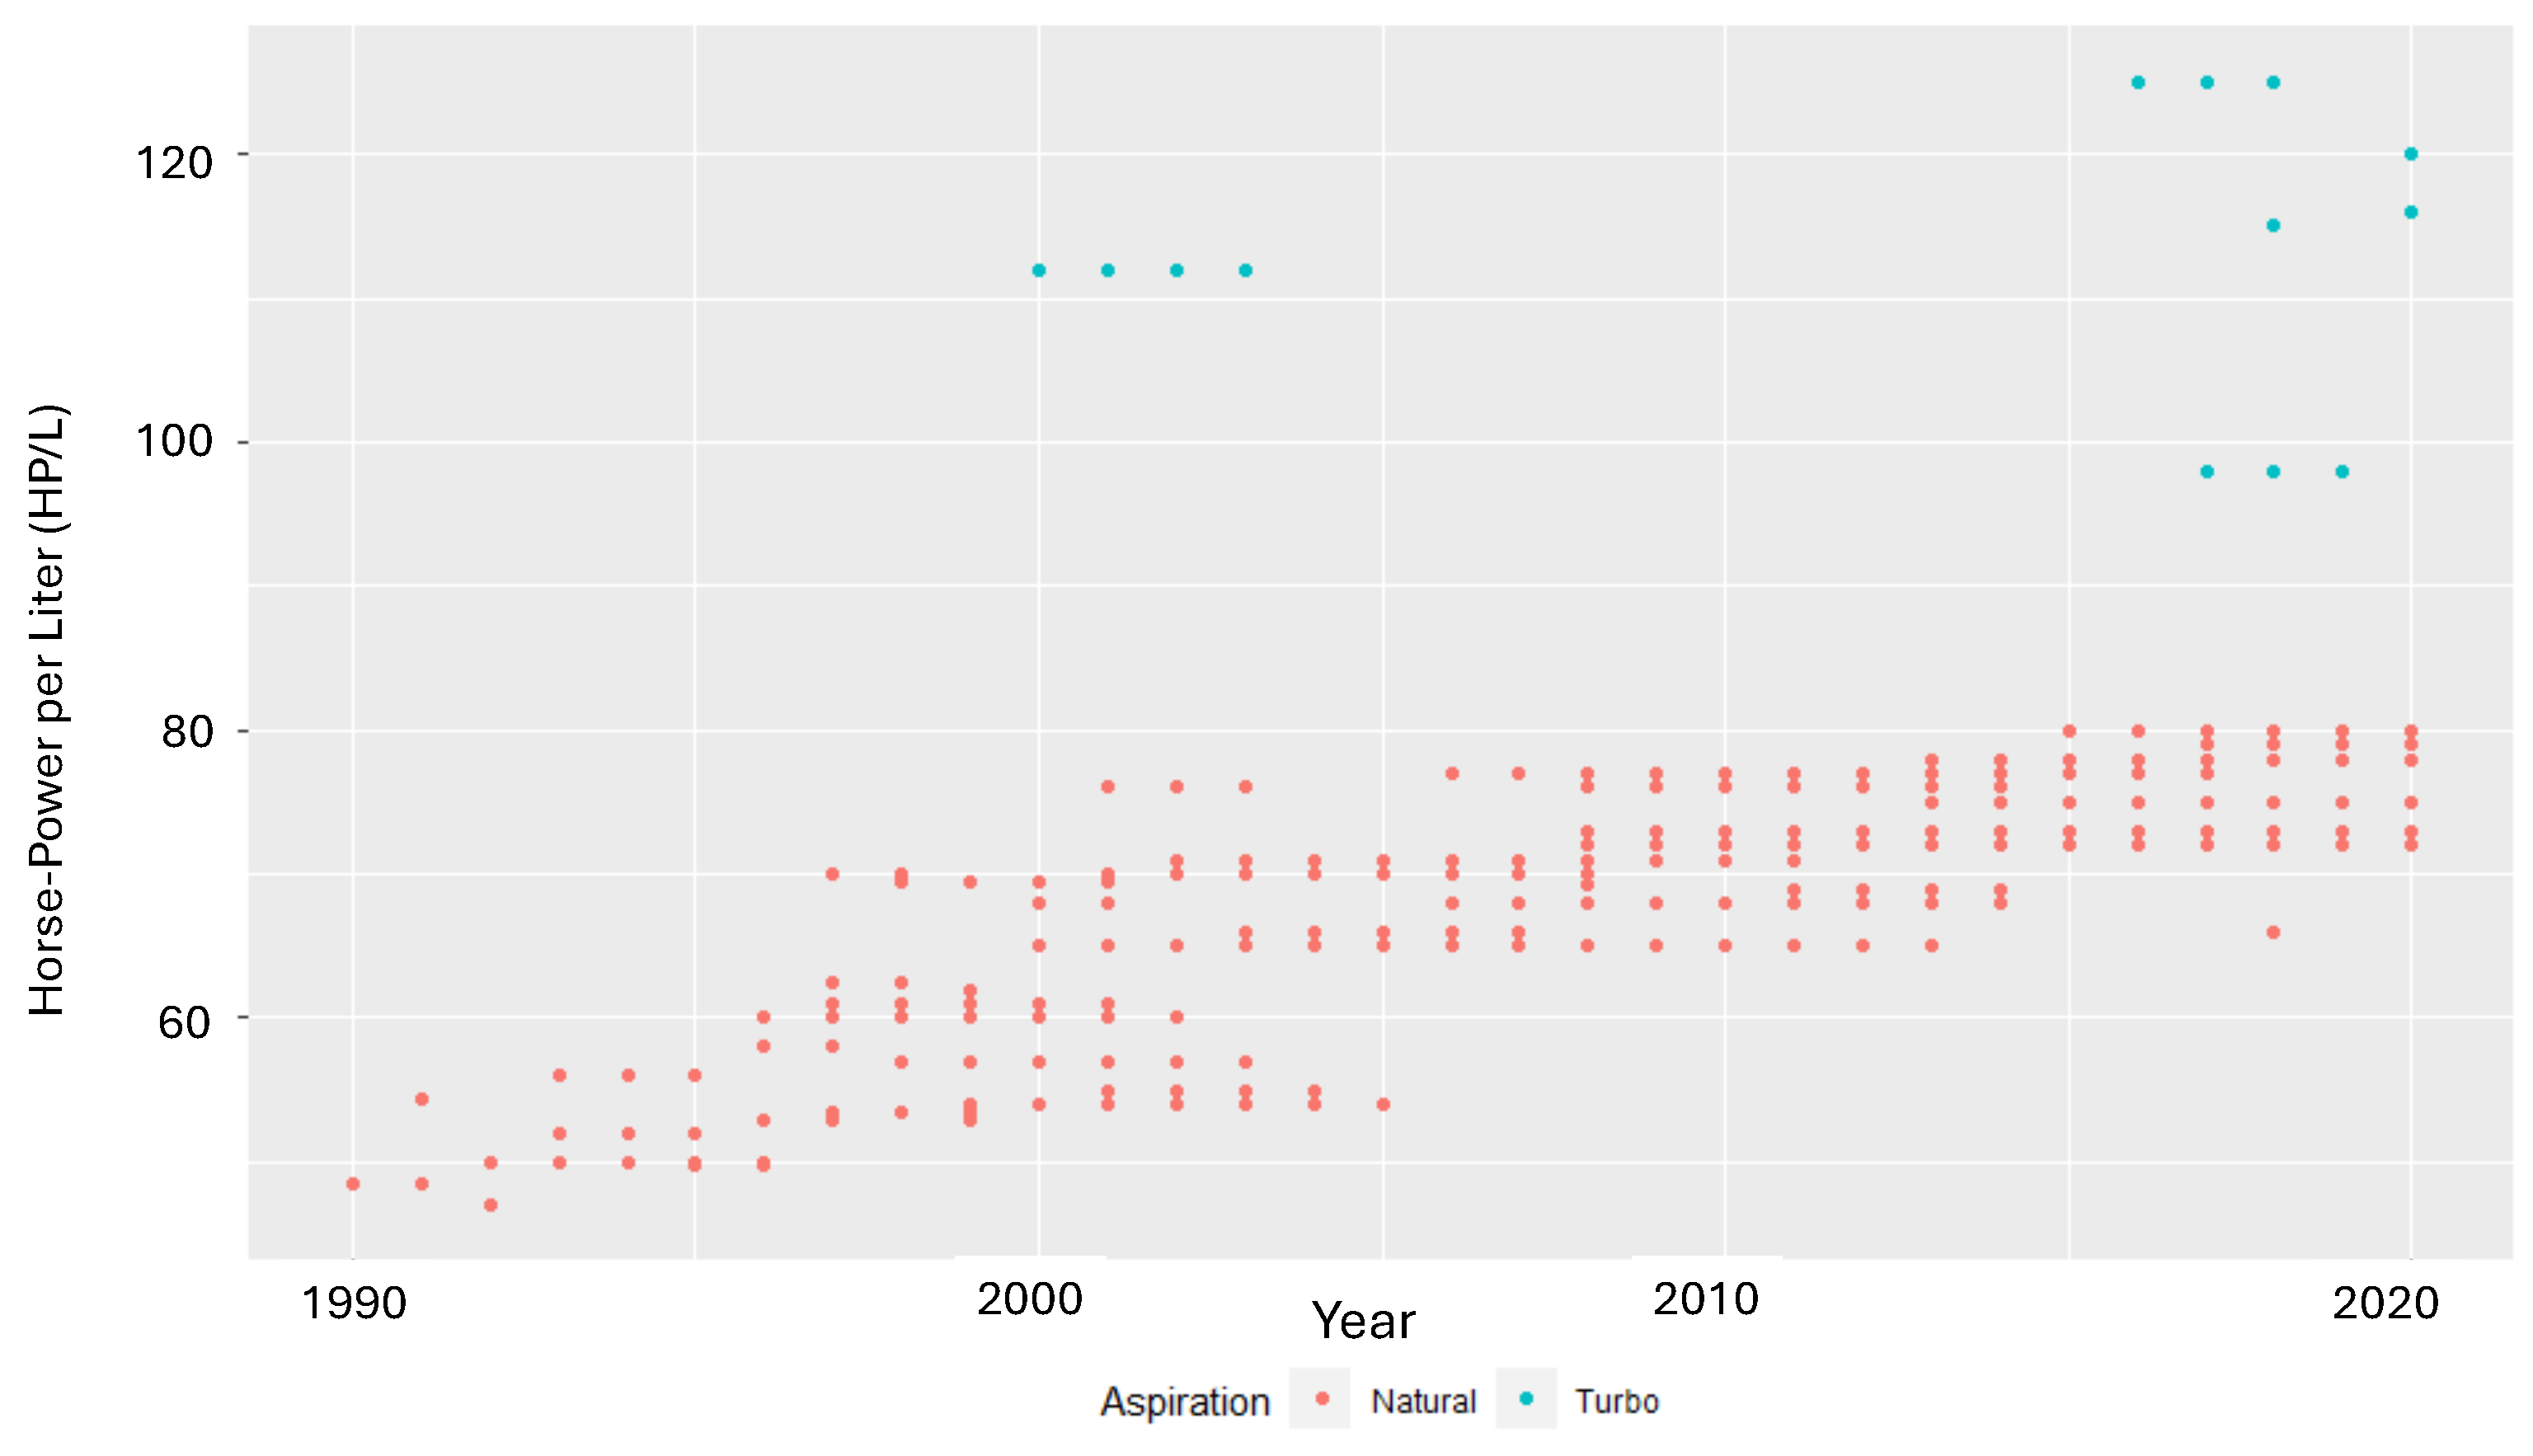
Table 6 summarizes an attempt to simplify the Brazilian LDV market into a few representative models and to establish their baseline technologies in 2020. Unsurprisingly, the subcompact 1.0 L model was the least advanced in terms of technological deployment. The most advanced was the large sedan with a turbocharger, direct injection, and CVT. Turbochargers were not deployed in any significant way until 2015; nevertheless, they are now found in 1.0 L models. Entry-level models are cheaper and have low profit margins, so trickle-down effects may take some time, delaying widespread technological adoption.
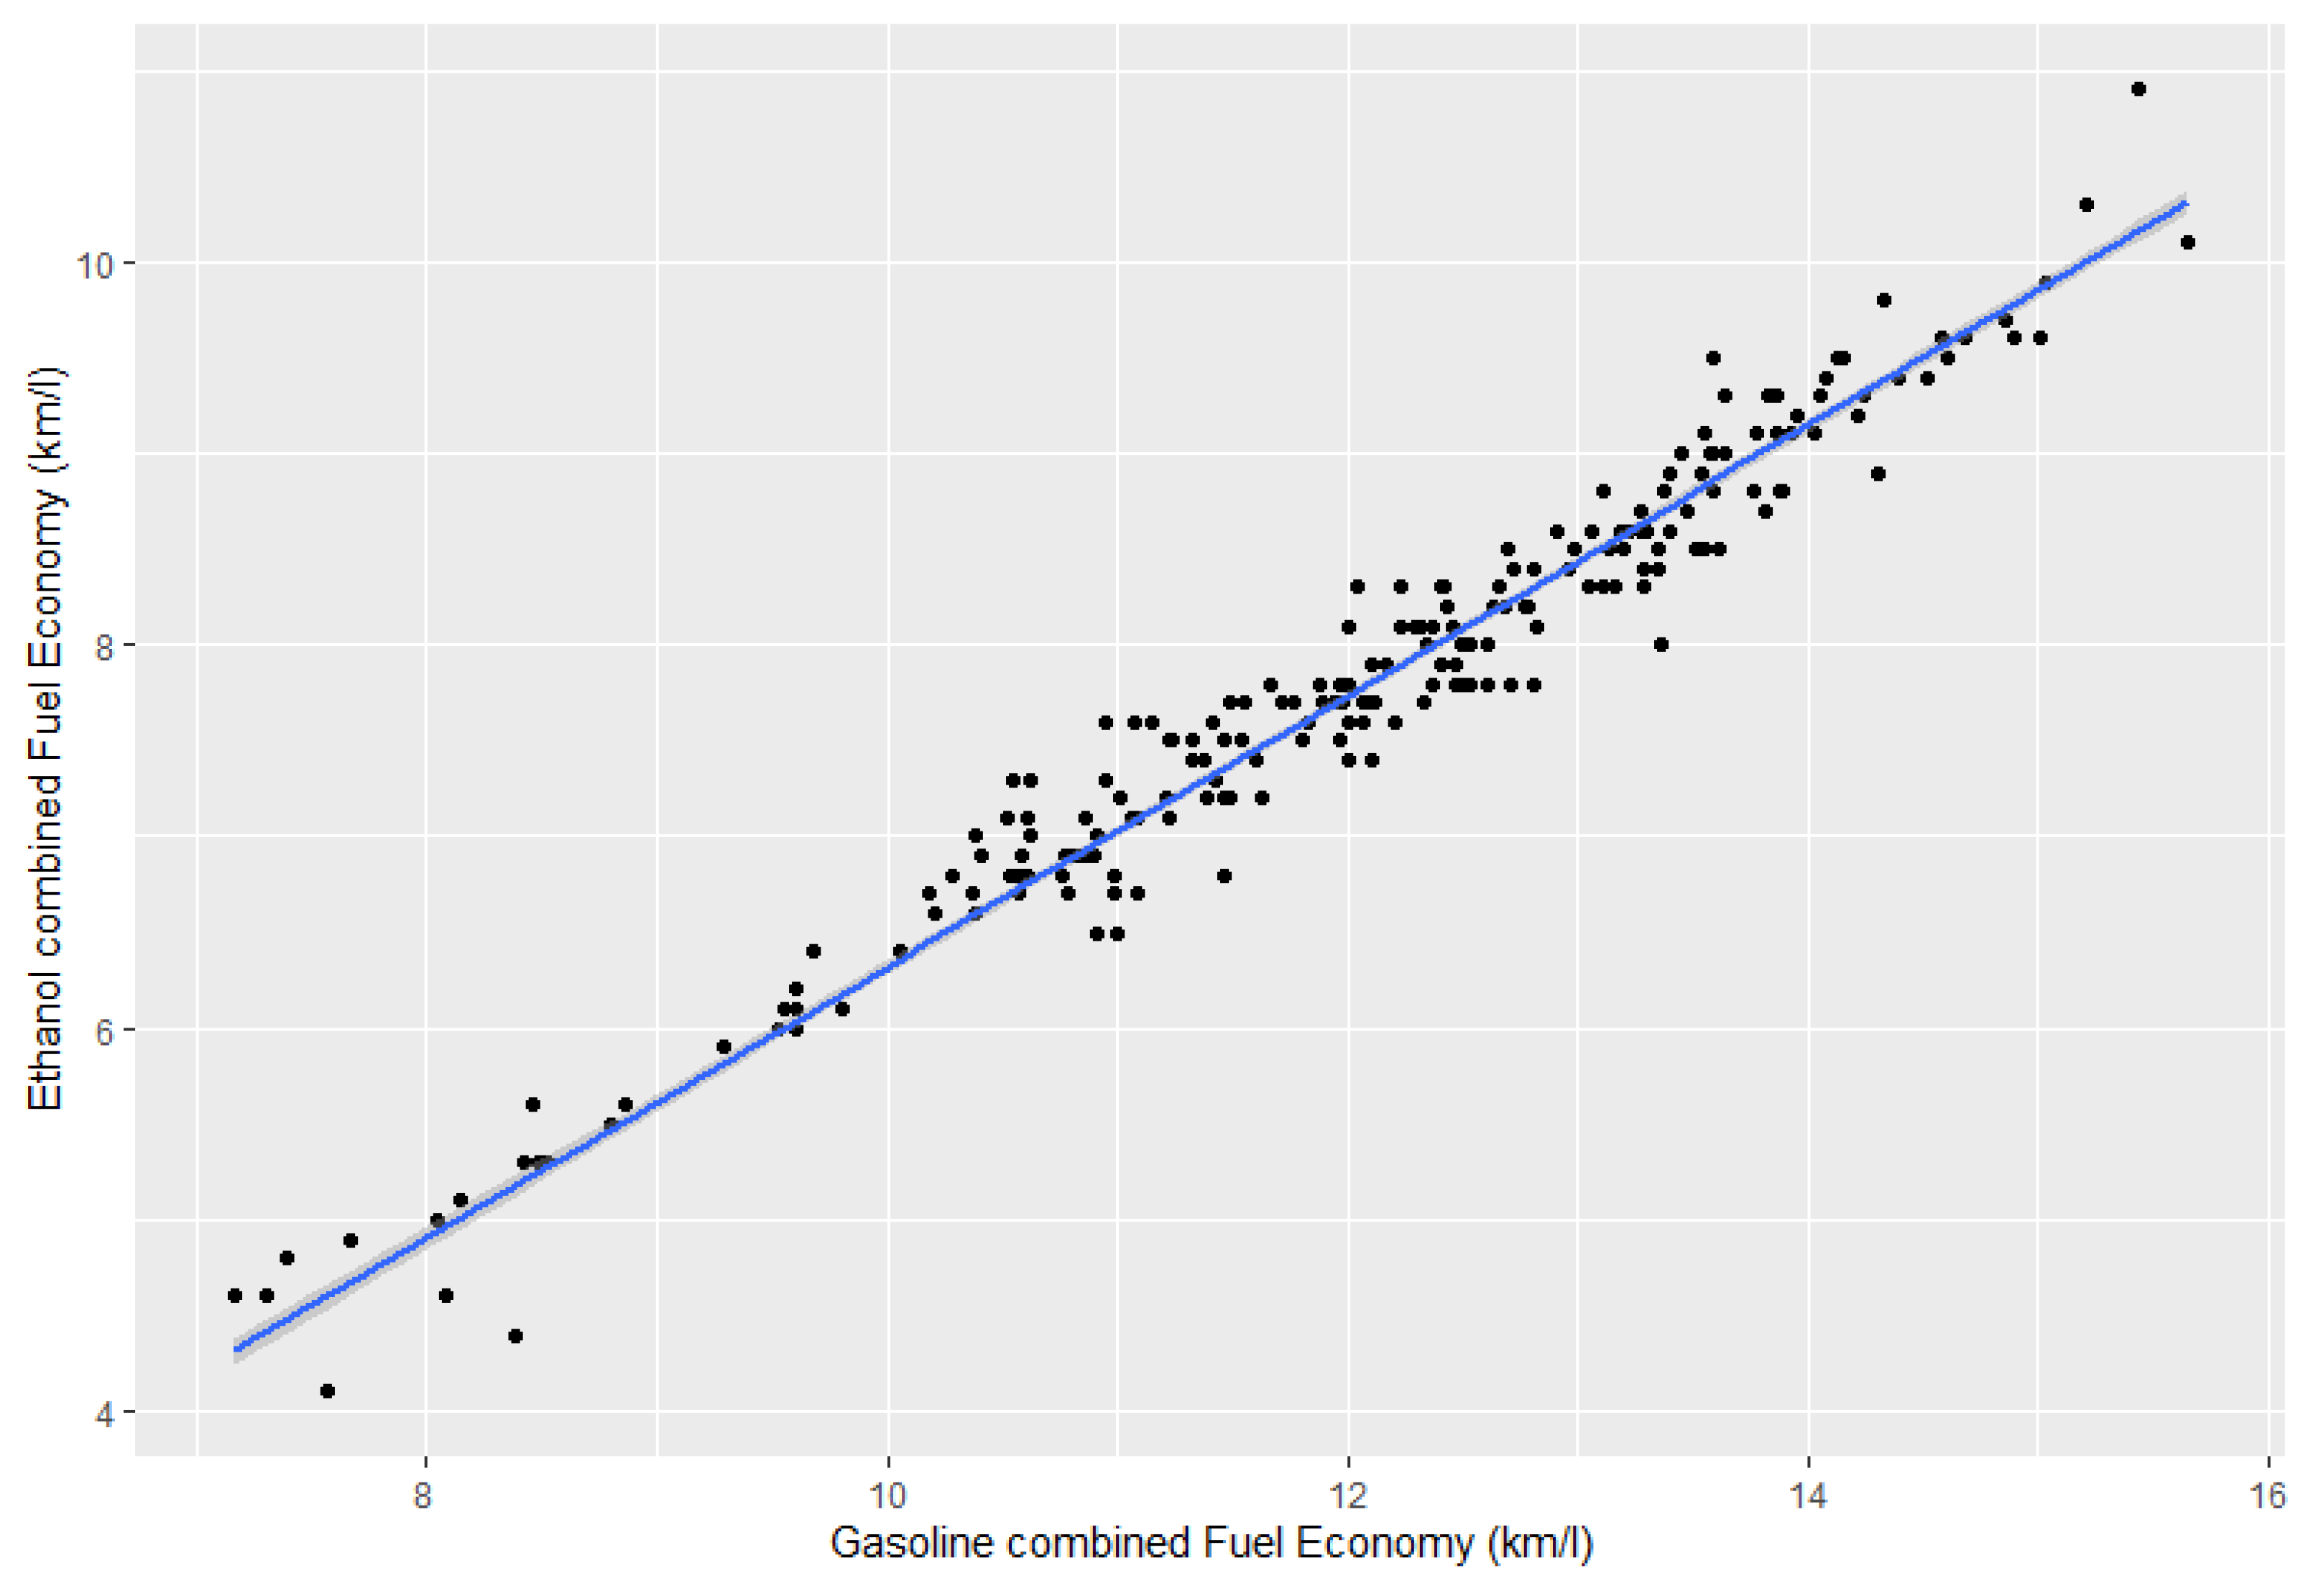
Flexible-fuel vehicles (FFVs) comprise the vast majority of sales (above 90%) and of the total fleet (above 75% and increasing). Dedicated gasoline engines are usually found in import, high-performance, and luxury vehicles. Dedicated ethanol engines are rare and may disappear. The ethanol and gasoline fuel consumption rates of flexible-fuel vehicles are almost perfectly correlated, as
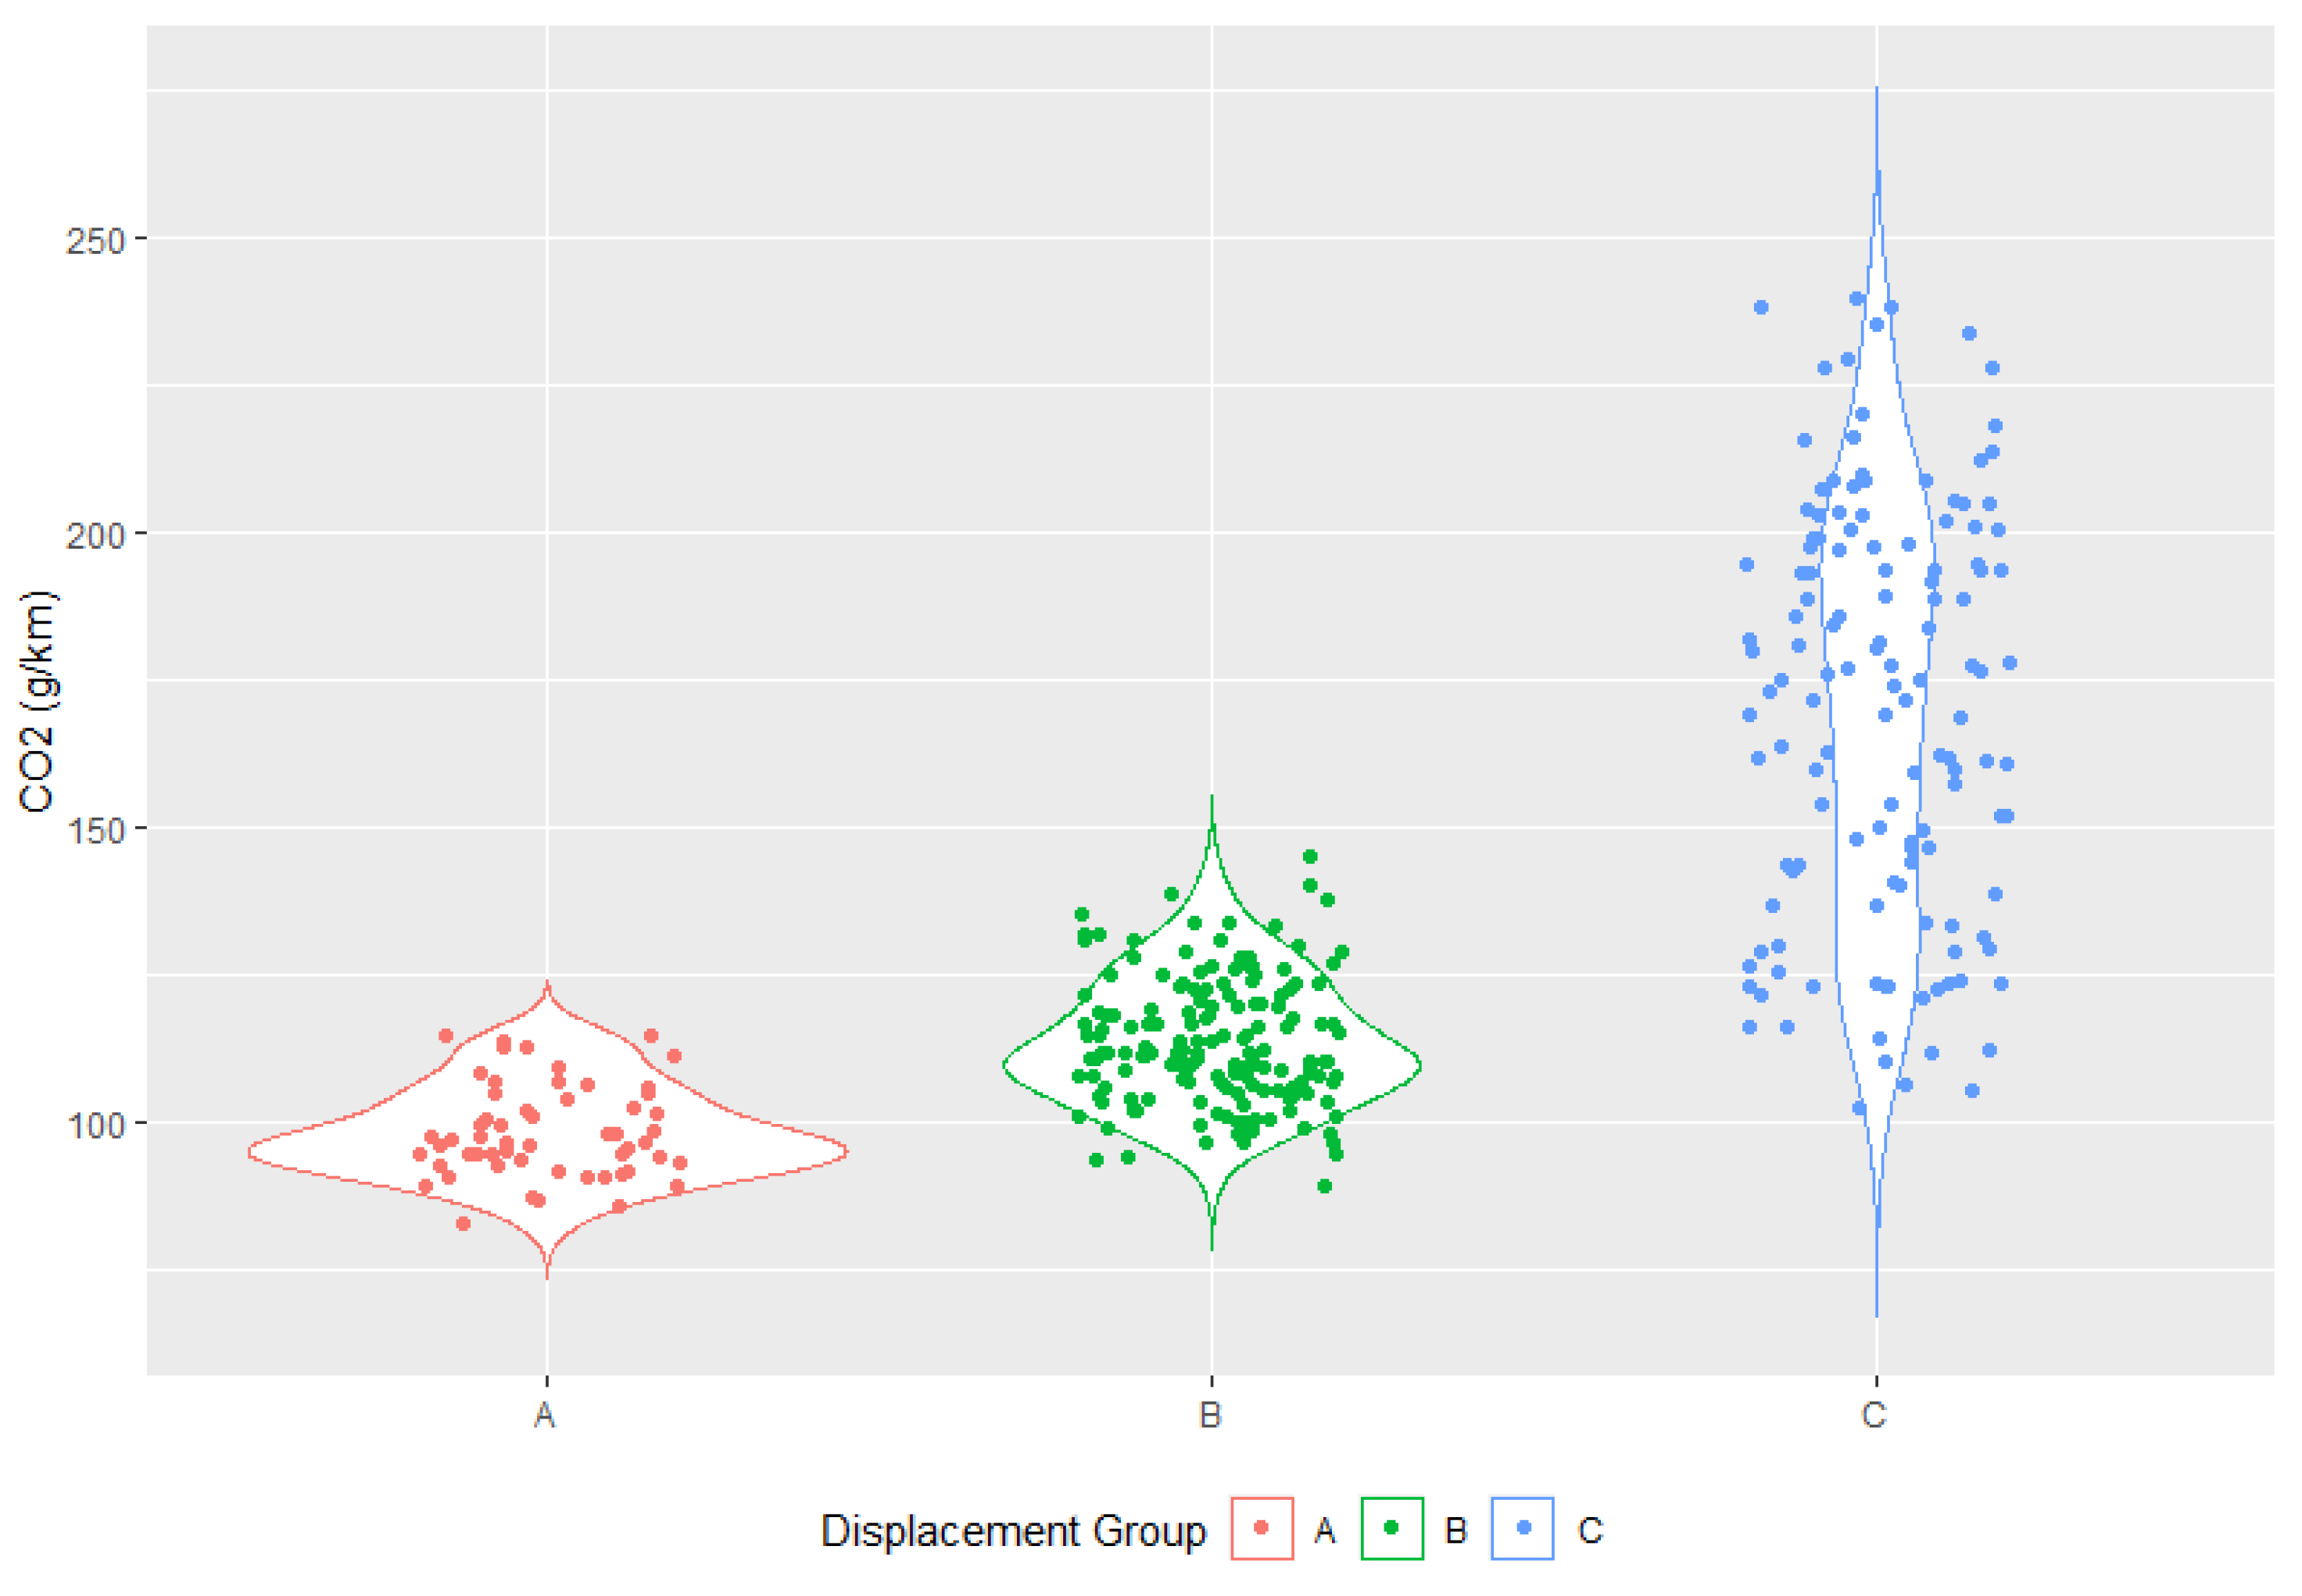
Figure 14 illustrates. Thus, basing the tax on gasoline emission rates should also translate to lower ethanol consumption. Tax incentives for FFVs should continue. A 1.0 L engine can be found today in a compact SUV equipped with a turbocharger, which is very far from being an entry-level vehicle. Emission rate dispersion in the 1.0 L engine category can be quite high, with maximum rates almost 40% higher than the lowest (115 g/km vs. 83 g/km). This difference increases to 63% (145 vs. 89 g/km) in category B and 133% in C (240 vs. 103 g/km), as illustrated in
Figure 15. Note that this figure is not sale-weighted but merely reflects available models in that year, from [
66], for the Brazilian market. This figure excludes EVs and HEVs for the following reasons. First, their sales are still not representative; these vehicles have other incentives, and Well-to-Wheel (WTW) emissions can vary substantially depending on which emission factors are used for electricity and battery production [
4,
8]. It is beyond the scope of this article to discuss whether ethanol or electricity makes more sense for Brazil; nevertheless, it is necessary to bear in mind that both have the same carbon footprint [
4,
8]. They may not be adversaries and can complement each other to substitute fossil fuels gradually, but these next steps are outside the focus of this manuscript. The idea is to increase the percentage of vehicles with lower emissions as prime sales.
These developments may have profound consequences in future emissions, especially if the consumer demand for size and power persists. Again using 200,000 km as a vehicle lifetime and 20 million vehicles, this emission rate discrepancy in the 1.0 L category may translate into an enormous 111 Mt CO2. These back-of-the-envelope calculations are not intended as forecasts but merely to illustrate the major variability in future emissions with the same tax treatment.
Thus, a taxation directly based on CO
2 emission rates is proposed for Brazil. Note that it should be based on gasoline emission rates, as the official Brazilian vehicle labeling program considers tailpipe emissions for ethanol to be zero. While WTW sugarcane ethanol emissions may not in fact be zero, their reduction compared to gasoline is well established [
67,
68,
69,
70], though land-use changes need to be carefully considered and controlled.
A bonus–malus system for LDVs was introduced in France in 2008. It consists of setting an emission rate cut-off and rewarding/punishing vehicles below/above this point [
71]. This cut-off can be tightened over time to maintain incentives in face of technological evolution. The fee is charged upon vehicle registration. The bonus/fee can be of a step-wise nature or increase/decrease as a function of emission rates. As of 2022, the cut-off is at 127 g CO
2/km, with special incentives for HEVs and EVs. In Germany, the fee is in the form of an annual ownership tax, with the cut-off at 95 g CO
2/km [
72]. In Sweden, a bonus exists for vehicles that emit less than 60 g CO
2/km and were licensed between April 2021 and July 2022. This emission rate was reduced to 50 g CO
2/km for between 12 July 2022 and 31 December 2023 and 30 g CO
2/km subsequently. If EVs are considered zero-emission vehicles, this system can be a subsidy in disguise. While incentives for the uptake of HEVs and EVs alone may be not be a problem, it is crucial to consider WTW emissions for a fairer comparison. This is evidently also true for ethanol.
In Brazil, if a bonus–malus system were to be implemented in the CO
2 tax, the cut-off should be placed in the lower bounds of category A in
Figure 15. This may be below 90 g CO
2/km, where entry-level vehicles are situated. Due to very high levels of income disparity in Brazil, tax rates could increase with emission levels to ensure a revenue-neutral regime, as sales are heavily skewed toward category A. This would be more in line with the UK, which sets the cut-off rate for registration tax at zero, but taxes increase exponentially for increasing emission rate brackets. Thus, a 91–100 g CO
2/km LDV incurs a GBP 165 first-year tax, while a 226–255 g CO
2/km incurs GBP 2200. Diesel LDVs that do not meet the RDE2 standard pay slightly more and AFVs slightly less than this base rate [
73]. It is important to highlight that diesel LDVs are not allowed in Brazil, only commercial vehicles. The lines are being blurred somewhat, as some small trucks and larger SUVs running on diesel can be bought for personal use. This is still negligible, though.
Subsidizing entry-level vehicles and heavily taxing the larger, more polluting models may be more equitable than the import-tax exemption currently in place for HEV and EVs (cut from 35% to zero in 2014 and 2015, respectively), as their prices make them unavailable for the vast majority of the Brazilian population today. The overall impact on emissions will certainly be much larger as well. A total of 1,411,662 FFVs were registered in 2021 compared to 34,849 vehicles with some degree of electrification [
39]. A MY2021 Toyota Prius was sold for about USD 36,000, and an MY2023 Nissan Leaf costs about USD 58,000. An entry-level ICE vehicle sells for about USD 14,200 and its purely electric sibling for USD 28,960 considering a BRL 5.08–USD 1 exchange rate. In Brazil, the minimum wage is currently USD 260 per month, and nearly two-thirds of the population live on less than two times this figure. While prices for hybrid electric vehicles (HEVs) and electric vehicles (EVs) are expected to decrease significantly in the future, if these technologies are not viewed as major improvements, Brazil may face similar delays in their adoption as with minor engine improvements.
It is important to consider this policy within the broader context of improving the rate of technological adoption in Brazil. It is likely that a combination of policies will be necessary to achieve the significant levels of emission reductions required. No single policy can be completely effective [
19,
25]. Brazil has recently implemented an efficiency mandate, starting with INOVAR-AUTO and then with Rota 2030. The country also has a policy to reduce average fuel carbon intensity and promote sugarcane ethanol [
23]. In 2013, the average emission rates of vehicles in Brazil were similar to those in the United States. However, Brazilian vehicles had half the average power, 50% less weight, and 70% smaller engines. Conversely, Brazil had similar numbers in these parameters to Japan but with 13% higher emission rates (compared to Japanese numbers from 2011) [
74]. This can be attributed to the slower rate of technological adoption in Brazil.
The following points have been noted. There is a significant distortion in the CO
2 emissions and vehicle model for the same displacement, e.g., 1.0 L, as shown in
Figure 15. Additionally,
Figure 2 illustrates the shift from entry-level models to SUVs (including 1.0 turbocharged vehicles). This change is likely to make vehicles unaffordable for the general population, leading to an increase in the fleet’s average age, as depicted in
Figure 1. Therefore, from the regression conducted in this manuscript, Brazilian data could be better than data from other developed countries that are unavailable in the literature. This is a continuation of the exploration of the historicity of the Brazilian fleet since 1990.
6. Conclusions
In this study, rates of technological progress for the LDV fleet in Brazil were estimated for the period 1990–2020. The main focus was the LDV acceleration performance due to its influence on fuel consumption and emissions. This article’s distinguishing feature is that there is a considerable discrepancy in the CO2 emissions for the same displacement type, e.g., 1.0, 1.4, and others. Moreover, there is an increase in SUVs sold in the market, supplemented by a decrease in entry-level vehicles. These predictions are not available to conventional users or policymakers, presenting figures to support different policies. The limitations are still in the need for more information on electric vehicles and hybrid ones (plug-in and self-recharged) to discuss some policies in Brazil that lead to tax reductions for EVs and PHEVs.
It is also the parameter that the driver usually associates with performance. On average, about a 20% increase in performance can be extracted from the same power level when comparing a 2020 with a 1990 model. A 10-year delay in technological adoption, comparing the Brazilian to the USA fleet, was found. The deployment of improved engine technologies allowed more power and torque extraction from the same engine size, and their effects are described in the last few sections. This gap makes the Brazilian fleet, while smaller and less powerful, relatively inefficient, which may have implications for future technological adoption, from minor engine improvements to power-train electrification in various degrees.
Special attention was paid to the 1.0 L engine historically associated with entry-level vehicles in Brazil. Emission factors in this category can vary by 40%. However, increased vehicle costs, due to efficiency mandates as well as safety and emission control standards, may spell the end of the road for the entry-level vehicle due to its lower price and tighter profit margins. This potential shift in the market could have profound environmental consequences, highlighting the trade-offs between environmental protection and economic factors. These calculations provide an approximate magnitude, but more research is necessary to support the claims.
For the reasons discussed above, the displacement-based tax may be outdated. While not fully designed here, we argue for a move toward directly taxing LDVs for their CO2 emission rate in line with practices in Sweden, France, Germany, and the UK. This proposed policy change could have significant benefits. First, it can be more equitable, providing different treatments to vehicles that vary considerably. Second, it may renew the incentive for entry-level vehicles, which are now only slightly above 10% of the market, as the displacement tax has lost its effectiveness. The tax may act as a subsidy for these efficient vehicles, which may be even more efficient if improved technology could be introduced. All this should be achieved while heavily charging those vehicles bought by higher-income households. Brazil is one of the world leaders in income disparity, and a more progressive tax would be welcome. This update by no means should end incentives for FFVs or discard HEVs and EVs.
It is important to note that a simple policy update cannot solve all complex problems. While there is much debate about future power trains, it is crucial not to forget about the ICE, as there are reasons, both global and specific to the Brazilian context, that make it a viable option. First, there is still potential for efficiency improvements in ICEs, as reviewed here. Second, the sales of HEVs and EVs are low, and fleet turnover takes decades, so ICEs will continue to exist for quite some time. Vehicles with some degree of electrification are still substantially more expensive, and very few Brazilians can afford one, reducing their potential impact in the near future. The country also produces sugarcane ethanol, which has favorable emission rates compared with gasoline. A shift toward more efficient, smaller LDVs can have an immediate impact, especially if ethanol is favored by the consumer at the pump. The evolution in horsepower and the torque-to-displacement ratio here has huge potential in this shift. The climate emergency does not allow us the luxury of waiting for electrification to arrive, and in any case, smaller, more efficient LDVs should be viewed as a complement to bio-fuels, not an adversary.


 and
and 
