Article

Evaluation of Lateral Sealing of Faults Based on Porosity: A Case Study of the F1 Fault of the Nanpu No. 5 Structure in the Nanpu Sag

1
Heilongjiang Oil and Gas Reservoir Forming Mechanism and Resource Evaluation Key Laboratory, Northeast Petroleum University, Daqing 163318, China
2
Daqing Yushulin Oilfield Development Co., Ltd. of CNPC, Daqing 163458, China
3
Sinopec Petroleum Exploration and Production Research Institute, Beijing 100083, China
*
Author to whom correspondence should be addressed.
Energies 2024, 17(11), 2468; https://doi.org/10.3390/en17112468
Submission received: 27 February 2024 / Revised: 15 May 2024 / Accepted: 16 May 2024 / Published: 22 May 2024
(This article belongs to the Section H1: Petroleum Engineering)

Abstract

:
The lateral sealing of a fault plays a pivotal role in the efficacy of a fault trap and its degree of hydrocarbon filling. Nevertheless, the evaluation of this phenomenon remains a challenging task, with evaluation methods either unable to accurately reflect subsurface reality or obtaining the necessary parameters difficult. In light of these considerations, a porosity-based fault laterality evaluation method was proposed, with the F1 Fault of the Nanpu No. 5 structure in the Nanpu Sag serving as the research object. First, the relationship between porosity and the product of burial depth and shale content was established using measured porosity, burial depth, and shale content data of the surrounding rocks in the study area. Subsequently, the reservoir rock porosity was obtained by employing logging data or core samples or by calculating the reservoir rock shale content from natural gamma logging data. Concurrently, the shale content of fault rock was calculated using three-dimensional (3D) seismic data, mud logging data, and natural gamma logging data, thereby enabling its porosity to be determined. Finally, the porosity difference between the two was employed to assess the lateral closure of faults. The results indicate that the porosity difference is less than 0 at lines L1~L3 of the F1 Fault, which suggests that the fault is not laterally closed at this site. Conversely, the F1 Fault is laterally sealed at this location, as indicated by the porosity difference being greater than 0 at lines L4~L10. The findings of this evaluation were found to be in close alignment with the actual distribution of oil and water, indicating that the proposed method can accurately evaluate the lateral closure of faults with developed fault rocks and provide valuable guidance for the exploration of faulted oil and gas reservoirs.

1. Introduction

Numerous studies have shown that faults play a dual role in hydrocarbon accumulation in clastic strata, serving as both migration pathways for hydrocarbon transport [1,2] and lateral sealing objects for hydrocarbon accumulation [3,4]. When operating as lateral sealing objects, the effectiveness of fault traps and their degree of hydrocarbon filling are controlled by the lateral closure of the fault [5,6].
Inherently, fault lateral sealing denotes the difference in permeability between the fault zones and the surrounding rocks [7]. It can be divided into lithology juxtaposition sealing and fault rock sealing [8], of which the former is mainly evaluated by graphical methods such as Allan diagrams [9] and Knipe diagrams [10], and the latter is quantitatively assessed by Shale Gouge Ratio (SGR) method [11,12,13,14] and fault–reservoir displacement pressure difference method [15,16,17,18]. The SGR method assesses fault lateral closure by predicting the minimum shale content of fault rocks. This value is substituted into the equation linking the shale content of fault rocks to the height of hydrocarbon columns that can be closed, resulting in the calculation of said height. Greater height is believed to result in better closure, while weaker closure is associated with lower height. The fault–reservoir displacement pressure difference method evaluates the lateral sealing of faults by comparing the displacement pressure of fault rocks and reservoir rocks. If the displacement pressure of the fault rocks exceeds that of the reservoir rocks, the faults are considered laterally closed; otherwise, they are laterally open. For faults with developed fault rocks, the SGR method and the fault–reservoir displacement pressure difference method are crucial for evaluating their lateral sealing, but they have limitations. The SGR method may be relatively simple, but its evaluation results reveal that all faults are laterally sealed and differ only in their sealing capacity [17], which is inconsistent with the subsurface actuality. The second method presents difficulties in accurately determining the compaction depth of fault rocks [19,20], which affects evaluation precision. Moreover, the widespread application of this method is limited due to the need for considerable measured data on the displacement pressure of surrounding rocks. In other words, using these two methods to evaluate the lateral sealing of faults may involve certain inconveniences or even risks when exploring faulted oil and gas reservoirs.
In this context, the F1 Fault of the Nanpu No. 5 structure in the Nanpu Sag is well suited to propose a solution to the above problem. The Nanpu Sag is dominated by mechanical compaction in the range of burial depths, less than 3100 m and greater than 3500 m, with porosity mainly influenced by compaction depth and shale content. For burial depths between 3100 m and 3500 m, constructive diagenesis dominates, and porosity is not strongly correlated with these parameters [21]. In addition, the F1 Fault throws in the lower part of the second member of the Dongying Formation (lower Ed2) (burial depth less than 3100 m) are between 20 and 185 m [22], all of which are greater than the thickness of the single sand body in lower Ed2 (2–13 m) displaced by the F1 Fault and is a fault rock sealing. This study presents an analysis of the mechanism of fault lateral sealing and its influencing factors based on the formation process of fault rocks. Utilizing the measured porosity, burial depth, and shale content data of the surrounding rocks in the study area, the relationship between porosity and the product of burial depth and shale content is established. Subsequently, the reservoir rock porosity is obtained by employing logging data or core samples or by calculating the reservoir rock shale content from natural gamma logging data. At the same time, three-dimensional (3D) seismic data, mud logging data, and natural gamma logging data are employed to calculate the shale content of fault rock and subsequently obtain its porosity. The porosity difference between the two is used to evaluate the lateral sealing of the fault. This method of evaluating the lateral closure of faults is simple and practical, providing valuable guidance for exploring faulted oil and gas reservoirs and advancing the fracture control theory.

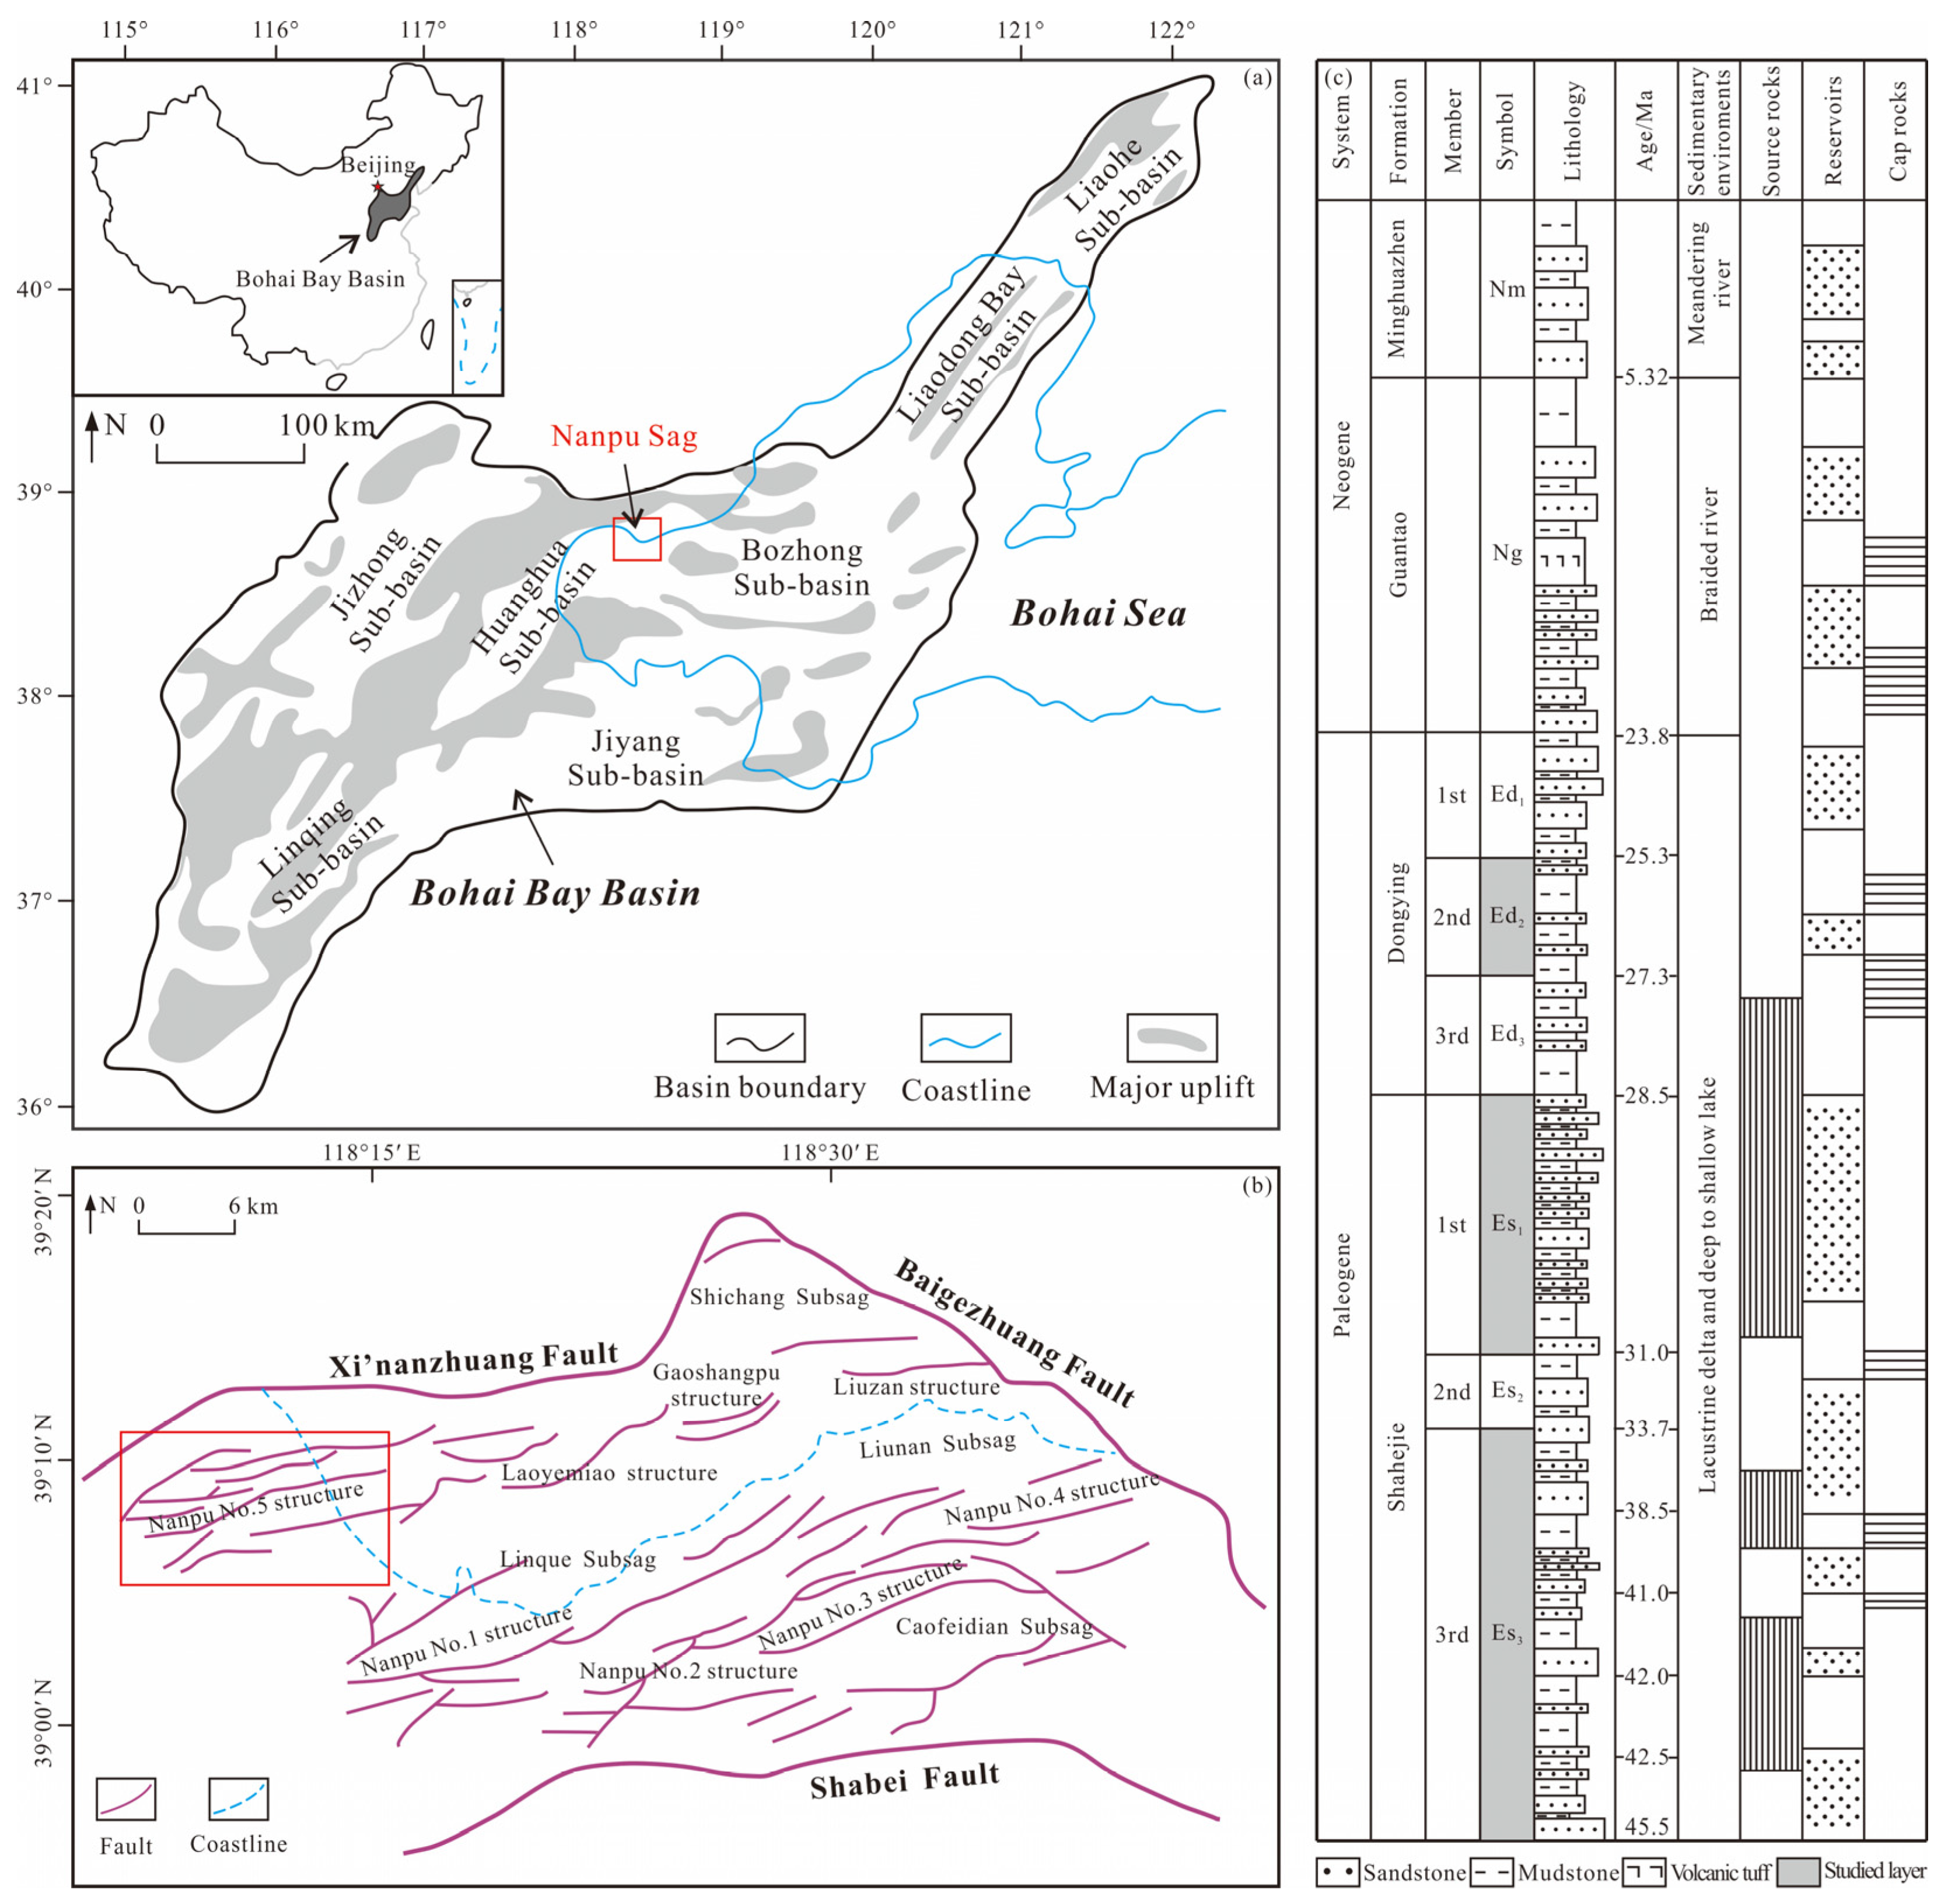
2. Geological Setting

The Nanpu Sag is located in the northern part of the Huanghua Depression, Bohai Bay Basin, East China (Figure 1a). It is connected to the Baigezhuang and Matouying Uplifts by the Baigezhuang Fault in the east, adjacent to the Beitang Subsag by the Jiandong Fault in the west, in a faulted supra-contact with the Shaleitian Uplift by the Shabei Fault in the south and separated from the Xi’nanzhuang and Laowangzhuang Uplifts by the Xi’nanzhuang Fault in the north (Figure 1b). It is generally extended along EW, with an exploration area of about 1932 km2 [23]. The Nanpu Sag has experienced multiple phases of extension (or tensional-shear) tectonic evolution [24], forming a tectonic framework with multi-convex and multi-concave, mainly including four subsags of Shichang, Liunan, Linque, and Caofeidian and eight tectonic belts of Gaoshangpu, Liuzan, Laoyemiao, and Nanpu No. 1–No. 5 [25] (Figure 1b). The strata developed in the Nanpu Sag include, from bottom to top, the Paleogene Shahejie Formation (Es) and Dongying Formation (Ed), the Neogene Guantao Formation (Ng) and Minghuazhen Formation (Nm), and the Quaternary (Q) (Figure 1c).
The Nanpu No. 5 structure, situated in the northwestern region of the Nanpu Sag (Figure 1b), has undergone a continuous deep burial process from the Ed2 period to the present. The sedimentation rate of the structure was approximately 325 m/Ma during the depositional period of Ed2 and approximately 300 m/Ma during the depositional period of the first member of the Dongying Formation (Ed1). The structure exhibited a low depositional rate during the Ng period, with an estimated rate of 30 m/Ma. However, it exhibited a notable increase in strength during the Nm period, reaching an estimated rate of 260 m/Ma [26]. The primary layers under study are the third (Es3) and first (Es1) members of the Shahejie Formation and Ed2 (Figure 1c). Among these, the dark mudstones developed in Es3 and Es1 are the primary source rocks; the sandstones developed in lower Ed2 are the primary reservoirs; the mudstones developed in upper Ed2 serve as the primary cap rocks. These rocks provide optimal conditions for the formation of oil and gas reservoirs.
The F1 Fault is located in the core of the Nanpu No. 5 anticline and extends to the northeast with a length of about 13.4 km (Figure 2a). It is a normal fault that breaks through the third member of the Dongying Formation (Ed3) at the bottom and near the surface at the top and dips to the northwest with an average dip angle of 25° (Figure 2b). The results of the fault growth index indicate that the most recent period of this fault activity occurred during the deposition of the lower Ng (about 23.8–13.3 Ma), after which the fault entered a quiescent state, i.e., the fault ceased to be active at 13.3 Ma [22].
Drilling reveals that the oil and gas discovered near the F1 Fault is mainly concentrated in Es and Ed, with lower Ed2 being the most enriched. The oil and gas are mainly generated from the source rocks of Es3 and Es1, while the regional mudstone of upper Ed2 is their direct cap rock (Figure 2c), forming a “lower source and upper reservoir” pattern [27] of source-reservoir-cap assemblage. In the lower Ed2, the footwall of the F1 Fault develops two fault traps (Figure 2a), and the F1 Fault provides lateral shielding to the up-dip directions of these traps (Figure 2b). Therefore, sealing of the shielding is crucial to the formation of fault reservoirs in lower Ed2 near the F1 Fault.

3. Methods

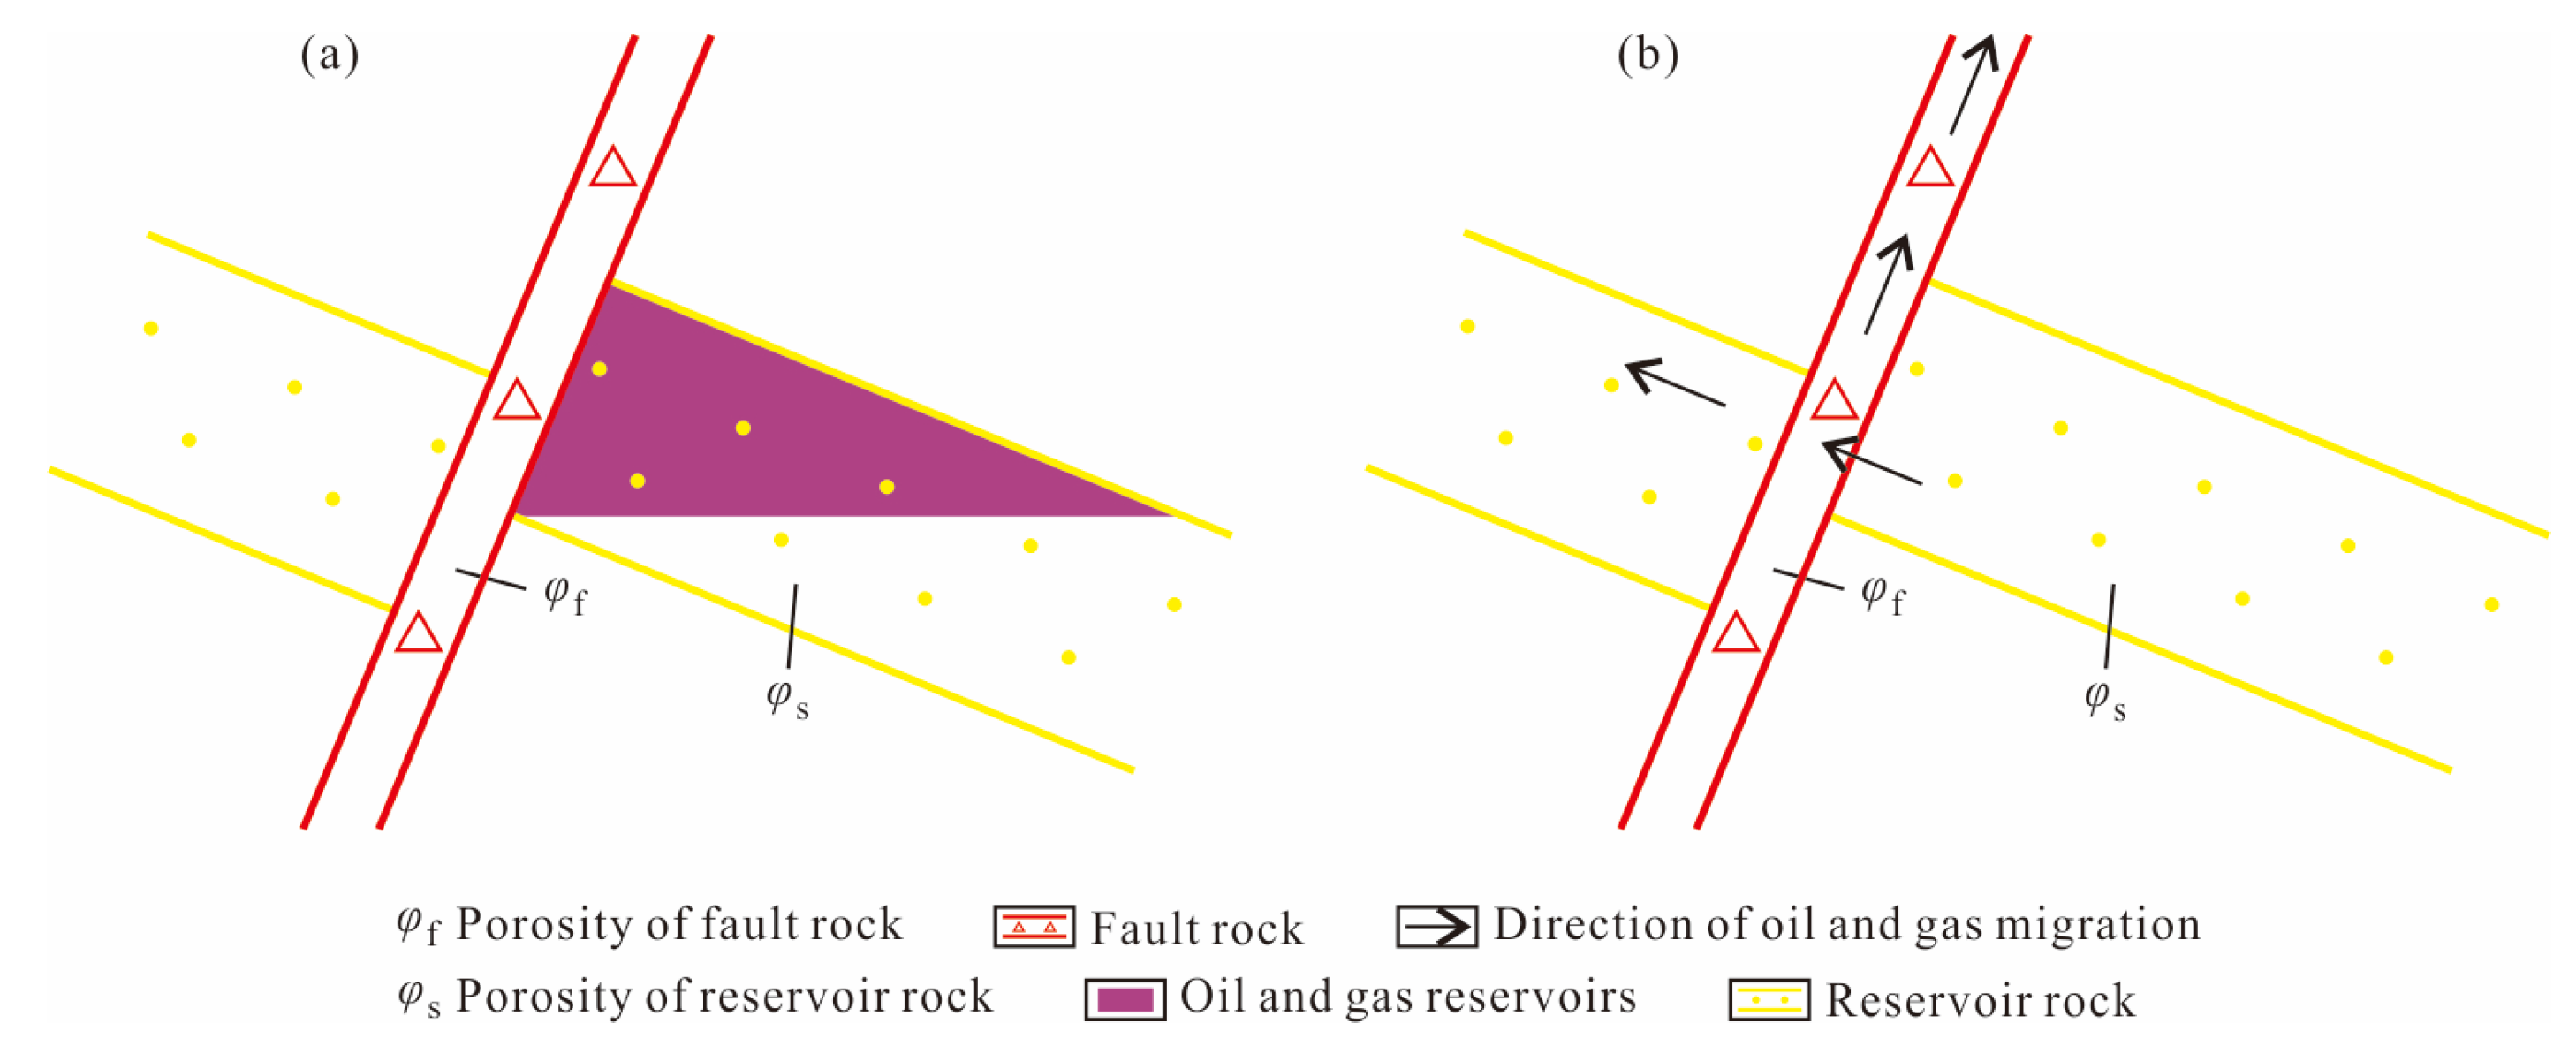
3.1. Mechanism of Fault Lateral Sealing and Its Influencing Factors

Faults are not simple faceted structures but rather belt structures with a complex internal composition. Caine et al. describe the interior of a fault zone as consisting of two parts: the fault core and the damage zone [28]. The fault core is typically located at the center of the fault zone and is characterized by the development of various types of fault rocks. The damage zone is situated on either side of the fault core and comprises subsidiary structures, including minor faults, deformation bands, and joints. These fault rocks have lower porosity and permeability compared to the damage zone, which can impede the transportation of oil and gas. In other words, it is the fault rocks that need to be considered more when studying lateral sealing of faults.
During periods of fault activity, debris falling from broken surrounding rocks and materials carried by groundwater enter the fault zones between two blocks, forming fault fills with high porosity and water content [5]. After fault activity cessation, these fills undergo continuous compaction and discharge of pore fluids, gradually forming fault rocks due to the weight of overlying sediments and the precipitation and cementation of materials carried by groundwater [15,18]. In this sense, fault rocks can be considered a type of lateral cap rock [16] with a lateral sealing mechanism primarily involving petrophysical sealing. When fault rocks possess relatively smaller pores (expressed via porosity [29]) compared to reservoir rocks, a closed petrophysical property difference arises between them. This results in the fault laterally sealing and serving as a shield for the reservoir rocks, thus preserving the hydrocarbons within them (Figure 3a). If the pores in fault rocks are larger than those in reservoir rocks and do not form a closed petrophysical property difference, the fault remains open laterally. Consequently, oil and gas in the reservoir rocks will enter the fault zone and be transported vertically along the fault zone or laterally through the fault zone into the juxtaposed fault wall sandstone layer (Figure 3b).
From the preceding discussion, it is apparent that the lateral sealing of faults with developed fault rocks is dependent on the porosity sizes between fault rocks and reservoir rocks. The porosity sizes of these rocks are influenced by their respective compaction degrees (expressed by burial depth) and compositions (expressed by shale content) in clastic strata dominated by mechanical compaction [30,31]. As a general trend, deeper burial depth and increased shale content lead to decreased porosity in both fault rocks and reservoir rocks. Conversely, higher porosity is typically observed when these variables are lower. Therefore, when determining the porosity of surrounding rocks, typical rock samples in the study area can be selected, and then the measured data can be used to establish a statistical equation (Equation (1)) for fitting the porosity of surrounding rocks with their burial depth and shale content.
φ m = f ( Z m , R m )
where φm is the porosity of surrounding rock, %; Zm is the burial depth of surrounding rock, m; Rm is the shale content of surrounding rock.

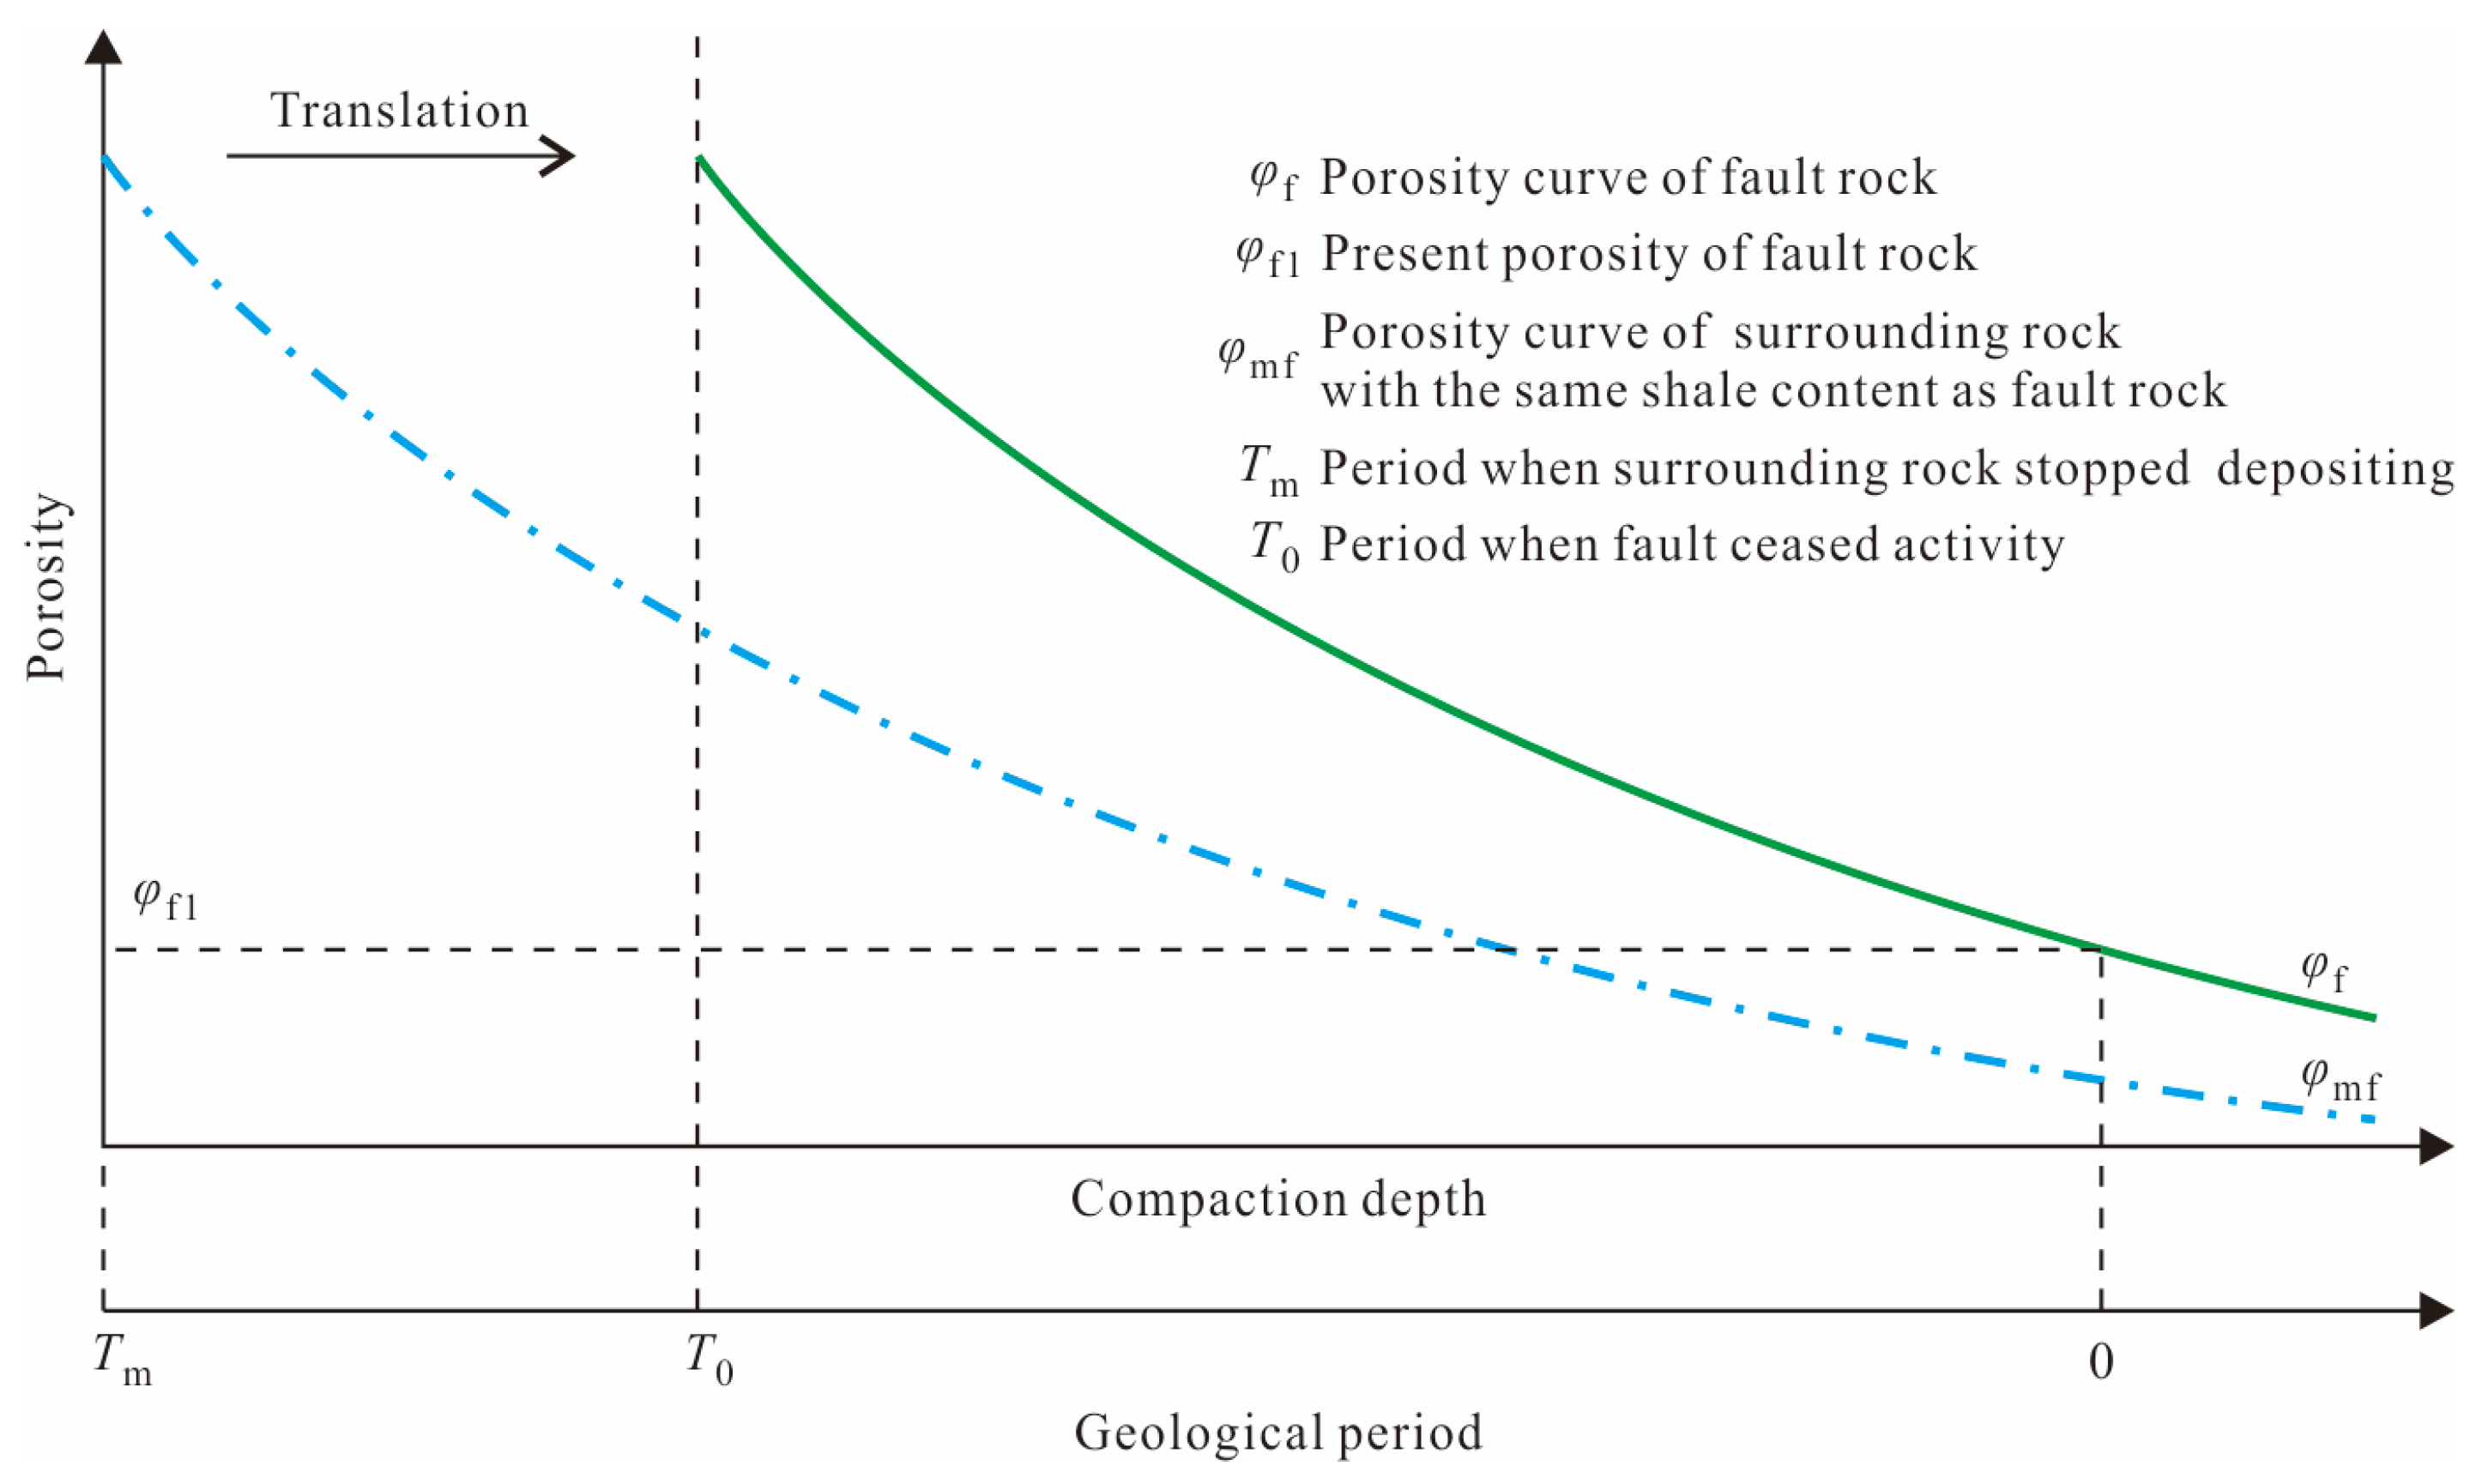
3.2. Method for Evaluating Lateral Sealing of Faults

The above demonstrates that evaluating the lateral sealing of faults involves determining the porosity of both fault rocks and reservoir rocks and then comparing their relative sizes.
The determination of porosity for reservoir rocks is relatively straightforward. The porosity formula can be calculated using logging data such as acoustic time difference, neutron, and density. Alternatively, it can be obtained by directly testing core samples in the laboratory using methods like gas testing, mercury intrusion porosimetry, and image analysis. If core samples are not available, both the compacted burial depth (which can be replaced with the present burial depth if the overlying strata have not undergone uplift and denudation) and shale content (obtained by Equations (2) and (3) [32] using natural gamma logging data) can be substituted in Equation (1) to calculate the porosity of reservoir rocks.
R = 2 GCUR I GR 1 2 GCUR 1
Among them,
I GR = GR GR min GR max GR min
where R is the shale content; IGR is the shale content ratio; GR is the natural gamma logging value of the target layer, API; GRmax is the natural gamma logging value of pure mudstone, API; GRmin is the natural gamma logging value of pure sandstone, API; GCUR is the empirical value related to strata, set to 3.7 for the Neogene strata and 2.0 for their underlying strata.
Due to drilling and coring limitations, direct testing cannot be used to obtain the porosity of fault rocks. Instead, indirect methods must be utilized, which rely on two assumptions. The space between fault surfaces can be imagined as a stratum that dips into surrounding rocks. Additionally, the porosity of fault rocks is also affected by their compaction degree (burial depth) and composition (shale content). Based on this, the following steps can be employed to determine the porosity of fault rocks. First, substitute the fault throw (obtained by 3D seismic data) in the target layer and the thickness (obtained by mud logging data) and shale content of the rock layers (obtained by Equations (2) and (3) [32] using natural gamma logging data) displaced by the fault into Equation (4) [33]. This will allow for the calculation of the shale content of fault rocks. Secondly, substitute the calculation results into Equation (1) to derive the relationship between the porosity of surrounding rocks with identical shale content as the fault rocks and their compaction depth (Figure 4). Finally, the geologic period corresponding to the compaction depth is obtained via stratigraphic paleo-burial depth recovery [34], and the aforementioned relationship is adjusted from the period when surrounding rocks stopped depositing (Tm) to the period when faults ceased activity (T0) (Figure 4). This represents the relationship between the porosity of fault rocks and time. Accordingly, the present porosity of fault rocks (φf1) can be determined, i.e., the point corresponding to the geological period of 0 (Figure 4).
R f = i = 1 n H i R i L
where Rf is the shale content of fault rock; Ri is the shale content of the ith rock layer displaced by fault; Hi is the thickness (in meters) of the ith rock layer displaced by fault, m; i is the ith rock layer displaced by fault; L is the fault throw, m; n is the number of rock layers displaced by fault.
The evaluation of lateral sealing in faults can be conducted by comparing the relative sizes of the porosity determined above of both fault rocks and reservoir rocks. If the fault rock’s porosity is lower than that of the reservoir rock, the faults are considered laterally sealed. Conversely, the faults are laterally open.

4. Results

Using the above evaluation method, we determined the lateral sealing of the F1 Fault of the Nanpu No. 5 structure in the Nanpu Sag in lower Ed2. We then analyzed the relationship between the evaluation results and the discovered oil and water distribution in the sand bodies of lower Ed2 near the F1 Fault, confirming the method’s feasibility.

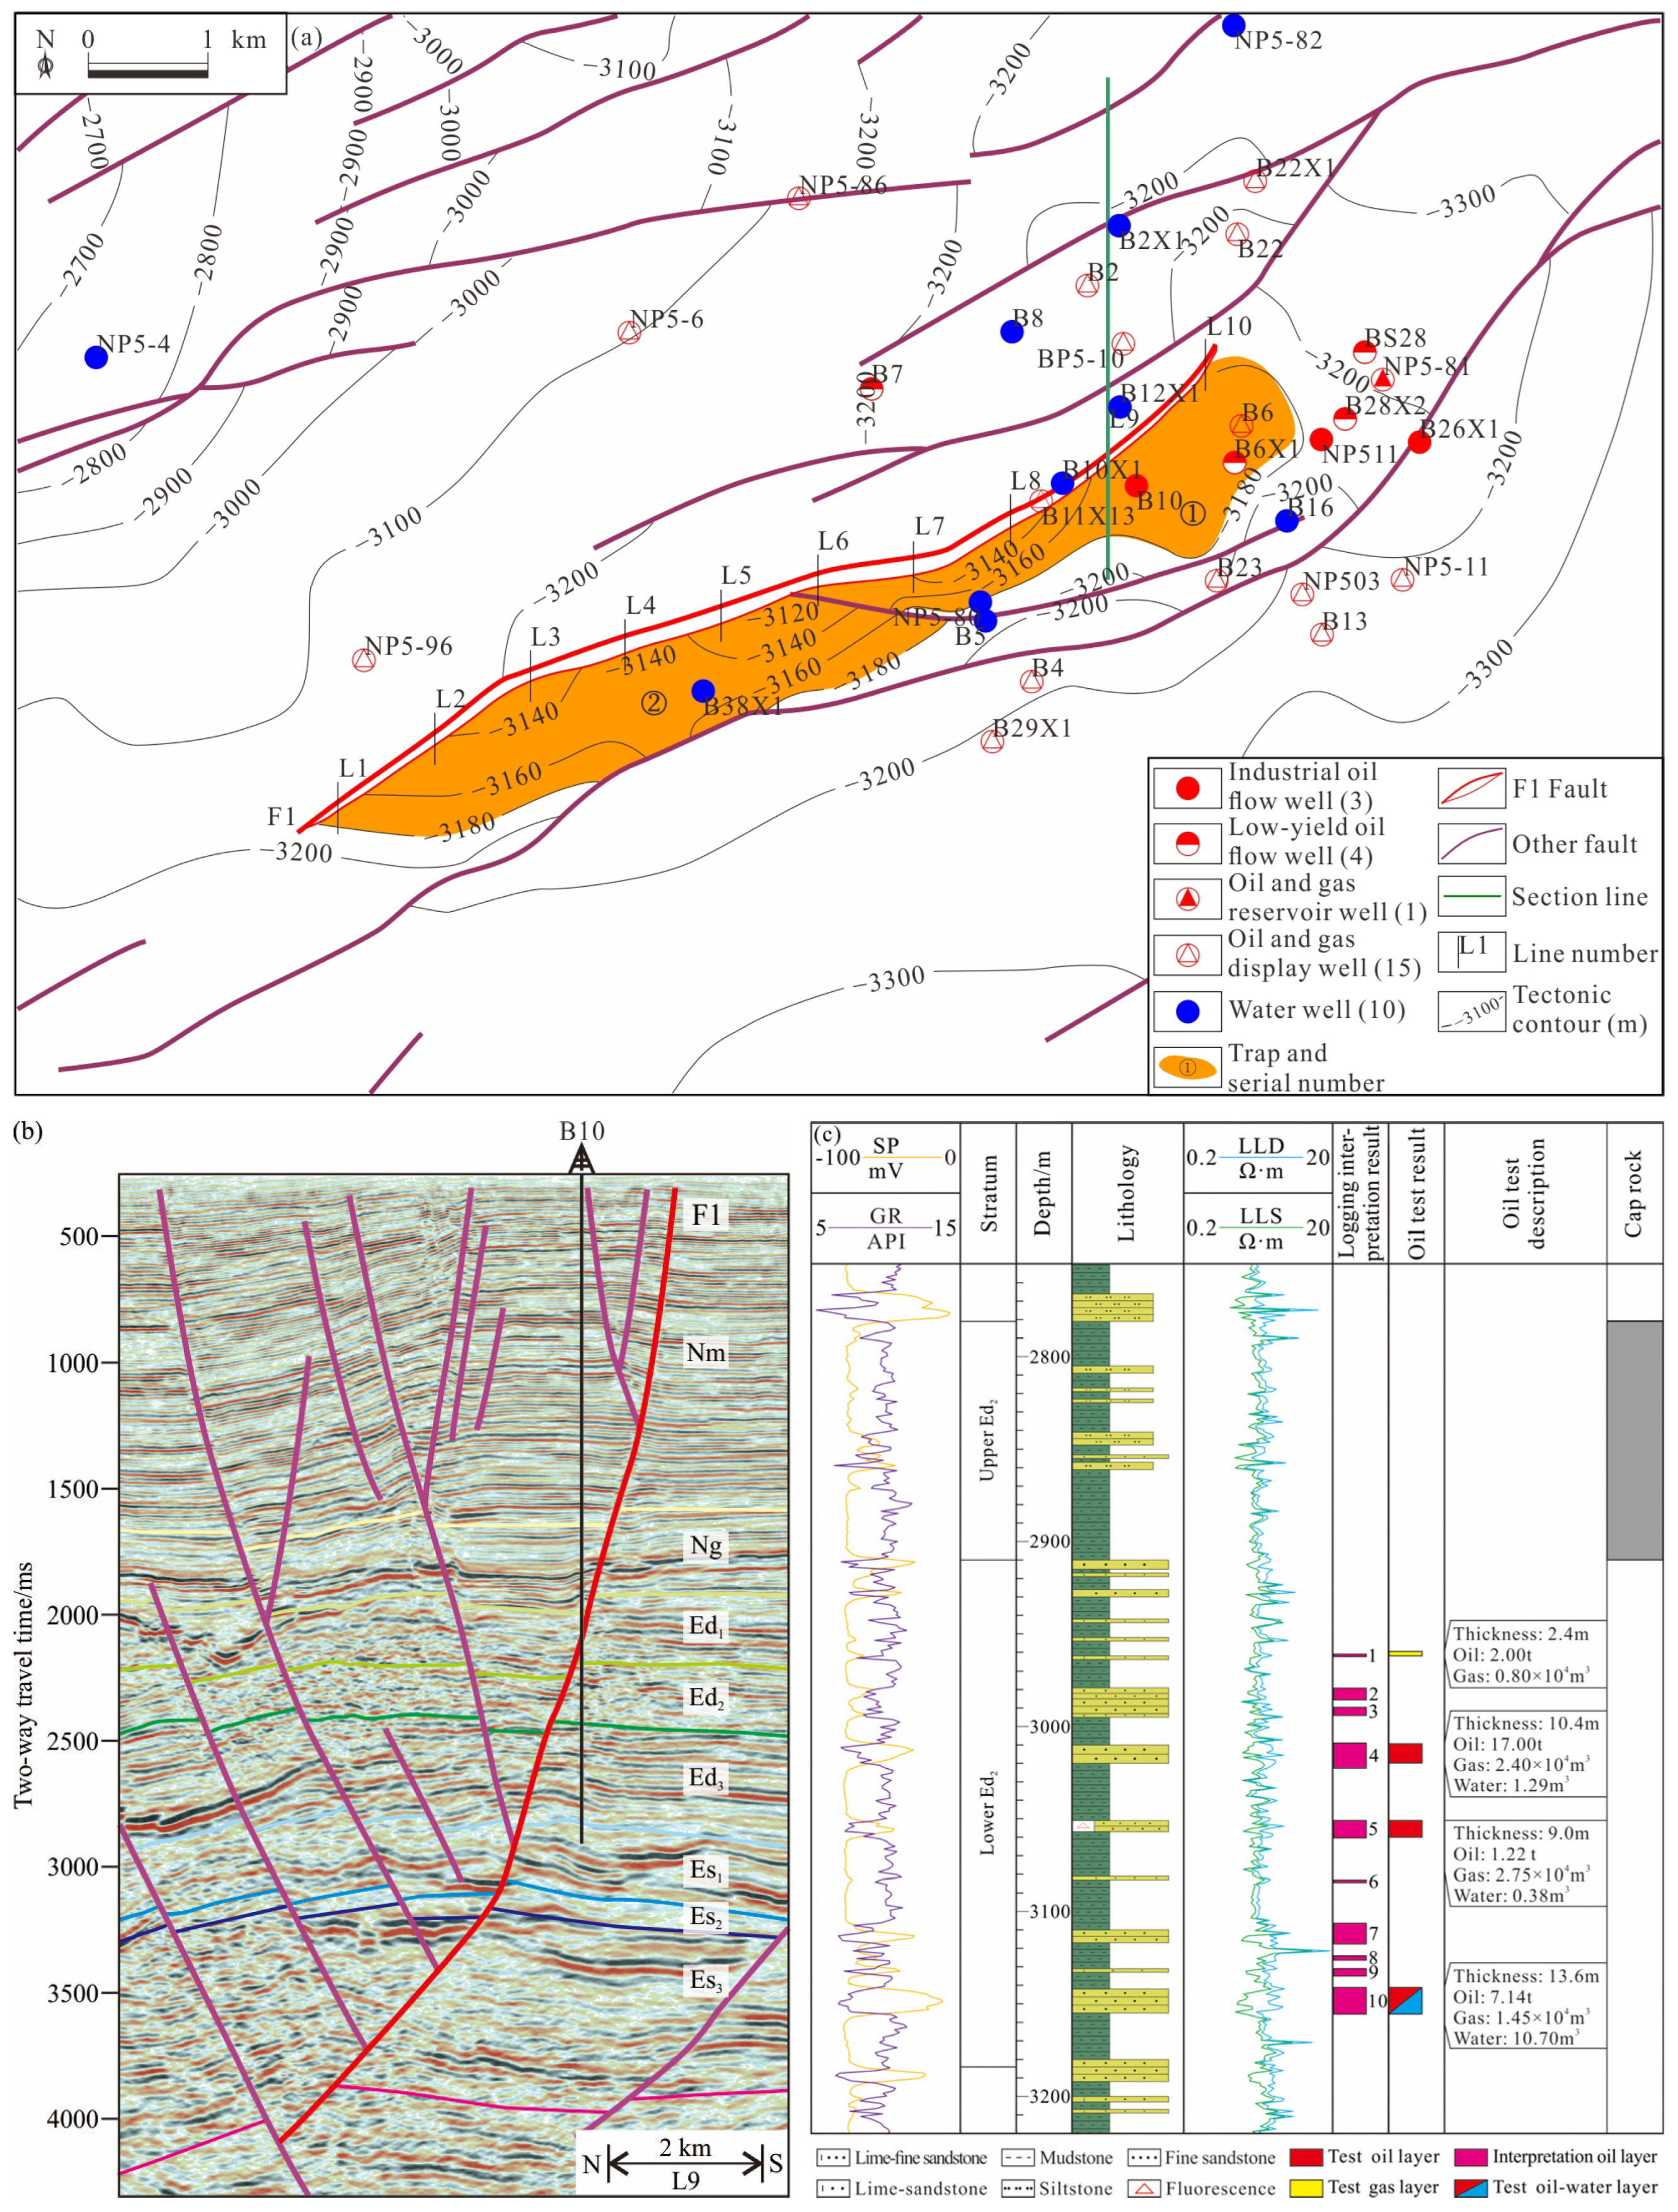
4.1. Evaluation of Lateral Sealing of the F1 Fault

From the measured porosity of the surrounding rocks of the Nanpu Sag with their burial depth and shale content (Table 1, ordered by well name), a scatter plot of the relationship between porosity and burial depth and shale content was made (Figure 5). The measured porosity of surrounding rocks decreases with increasing burial depth and shale content and, conversely, increases when these factors decrease (Figure 5a,b). Thus, it is evident that the measured porosity of surrounding rocks is negatively correlated with the product of the burial depth and shale content (Figure 5c), and the mathematical expression is shown in Equation (5).
φ m = 26.23 ( 100 Z m R m ) 0.8411
where φm is the measured porosity of the surrounding rocks, %; Zm is the burial depth of the surrounding rocks, m; Rm is the shale content of the surrounding rocks.
The strata above lower Ed2 in the Nanpu No. 5 structure have not undergone significant uplift or denudation. The present burial depth can be used instead of the compacted burial depth of lower Ed2 sand bodies. Table 2 presents the results of determining the compacted burial depth of lower Ed2 sand bodies near the footwall of the F1 Fault, as shown in Figure 2a. The shale content of the lower Ed2 sand bodies was calculated (Figure 6a) using Equations (2) and (3) based on the natural gamma logging data of known wells near the footwall of the F1 Fault. The specific values are shown in Table 2. Subsequently, the porosity of the lower Ed2 reservoir rocks was calculated by substituting the two obtained parameters into Equation (5), and the results are presented in Table 2. The porosity of the lower Ed2 reservoir rocks ranges from 3.23% to 4.65%. The porosity is generally smaller at the ends of the F1 Fault and larger in its middle. The minimum value is near line L9, while the maximum value is near line L6.
Using 3D seismic data (e.g., Figure 2b), mud logging data, and natural gamma logging data (e.g., Figure 2c) of the Nanpu No. 5 structure, we extracted the F1 Fault distance in lower Ed2 and the thickness and shale content of each layer in lower Ed2 displaced by the F1 Fault, and then calculated the shale content of the F1 Fault rocks in lower Ed2 by substituting these values into Equation (4) (Figure 6b). The specific values are shown in Table 2. By substituting the obtained parameter into Equation (5), we obtained the relationship between the porosity of the surrounding rocks and the compaction depth with the same shale content as the F1 Fault rocks in lower Ed2 (Figure 7). According to the burial history of the Nanpu No. 5 structure, the geologic period corresponding to the compaction depth was determined, and the relationship was then extended from the time when lower Ed2 stopped sedimentation (about 25.3 Ma, as indicated by the stratigraphic chronology of the Nanpu Sag, Figure 1c) to the time when the F1 Fault ceased its activity (about 13.3 Ma) (Figure 7). This defined the relationship between the porosity of the F1 Fault rocks in lower Ed2 and time and, in turn, extracted its present value, i.e., φf1 in Figure 7. Table 2 shows the values for the 10 lines, ranging from 3.10% to 3.77%. The values generally decrease with increasing line number, with the minimum value near line L9 and the maximum value near line L1.
When subtracting the porosity of the F1 Fault rocks in lower Ed2 from that of the lower Ed2 reservoir rocks, it is evident that the difference ranges from −0.30% to 1.31%. The difference is generally small at both ends of the F1 Fault and larger in its middle, with the smallest value near line L1 and the largest value near line L6 (Table 2). Specifically, the porosity difference between the two is less than 0 at lines L1~L3. This suggests that the F1 Fault is not closed laterally at this site (Figure 8). The F1 Fault is laterally sealed at this location, as indicated by the porosity difference being greater than 0 at lines L4~L10 (Figure 8).

4.2. Relationship between Lateral Sealing of the F1 Fault and Oil and Water Distribution

The reservoirs in lower Ed2 are typically developed in two fault traps. Therefore, the hydrocarbon potential of these traps is primarily influenced by the lateral sealing of the F1 Fault. The F1 Fault is closed laterally between lines L5 and L10, indicating that the No. 1 trap and the No. 2 trap near line L5 should be “effective” (Figure 8). These traps can gather and preserve the hydrocarbons generated from the source rocks of Es3 and Es1. This is supported by the oil test results from well B10, which indicate that it behaves as a test oil layer and test oil–water layer in lower Ed2, with an effective thickness of 35.40 m, a daily oil production of 27.36 t, a daily gas production of 7.40 × 10⁴ m3, and a daily water production of 12.37 m3 (Figure 2c). Around lines L1~L3, the No. 2 trap should be “invalid” (Figure 8) due to the F1 Fault not being sealed laterally. Similarly, on line L4, despite the F1 Fault being closed laterally, its tectonic height (−3137 m) is lower than that of line L3 (−3132 m), and therefore the No. 2 trap should also be “invalid” (Figure 8). These “invalid” trap sites are not conducive to the accumulation and preservation of hydrocarbons generated from the source rocks of Es3 and Es1. Often, actual drilling results in encountering a water or dry layer, as seen in the case of well B38 × 1 (Figure 8).

5. Discussion

Faults are a common occurrence in oil and gas-bearing basins, and their lateral sealing is crucial for hydrocarbon accumulation. Various methods have been explored to evaluate the lateral sealing of faults, including the SGR method, the fault–reservoir displacement pressure difference method, and so on. However, as mentioned in the introduction, these methods can be problematic because they may not accurately reflect subsurface reality or because obtaining the necessary parameters can be challenging. Porosity is a parameter that can be easily obtained. It can be calculated from logging data or tested from core samples. The relationship between the porosity of surrounding rocks and their burial depth and shale content can also be used to determine porosity. Therefore, we envision that using porosity to evaluate the lateral sealing of faults will be simpler and more practical, and it will be more widely applied.
In this study, we evaluated the lateral sealing of faults by comparing the porosity of fault rocks and reservoir rocks. The agreement between the evaluation results and the oil-water distribution indicates that the method is consistent with actual subsurface conditions and is feasible. However, this method has some limitations. Firstly, it is crucial to establish a fault rock porosity prediction method and ensure its accuracy. Secondly, this study does not consider the effect of fault rock thickness on porosity, as previous studies have shown [35]. Thirdly, the permeability of fault rocks exhibits anisotropy in the direction parallel and perpendicular to the dip of the fault [35,36], which raises questions about whether the porosity degree is the same in both directions. Additionally, most faults have undergone multiple phases of activity, resulting in corresponding phases of formation and destruction of the fault rocks. This raises the question of whether the composition of the fault rocks has changed.

6. Conclusions

(1)
The lateral sealing of faults can be evaluated by comparing the porosity of fault rocks and reservoir rocks. If the difference between the two is greater than 0, the faults are laterally closed, and vice versa;
(2)
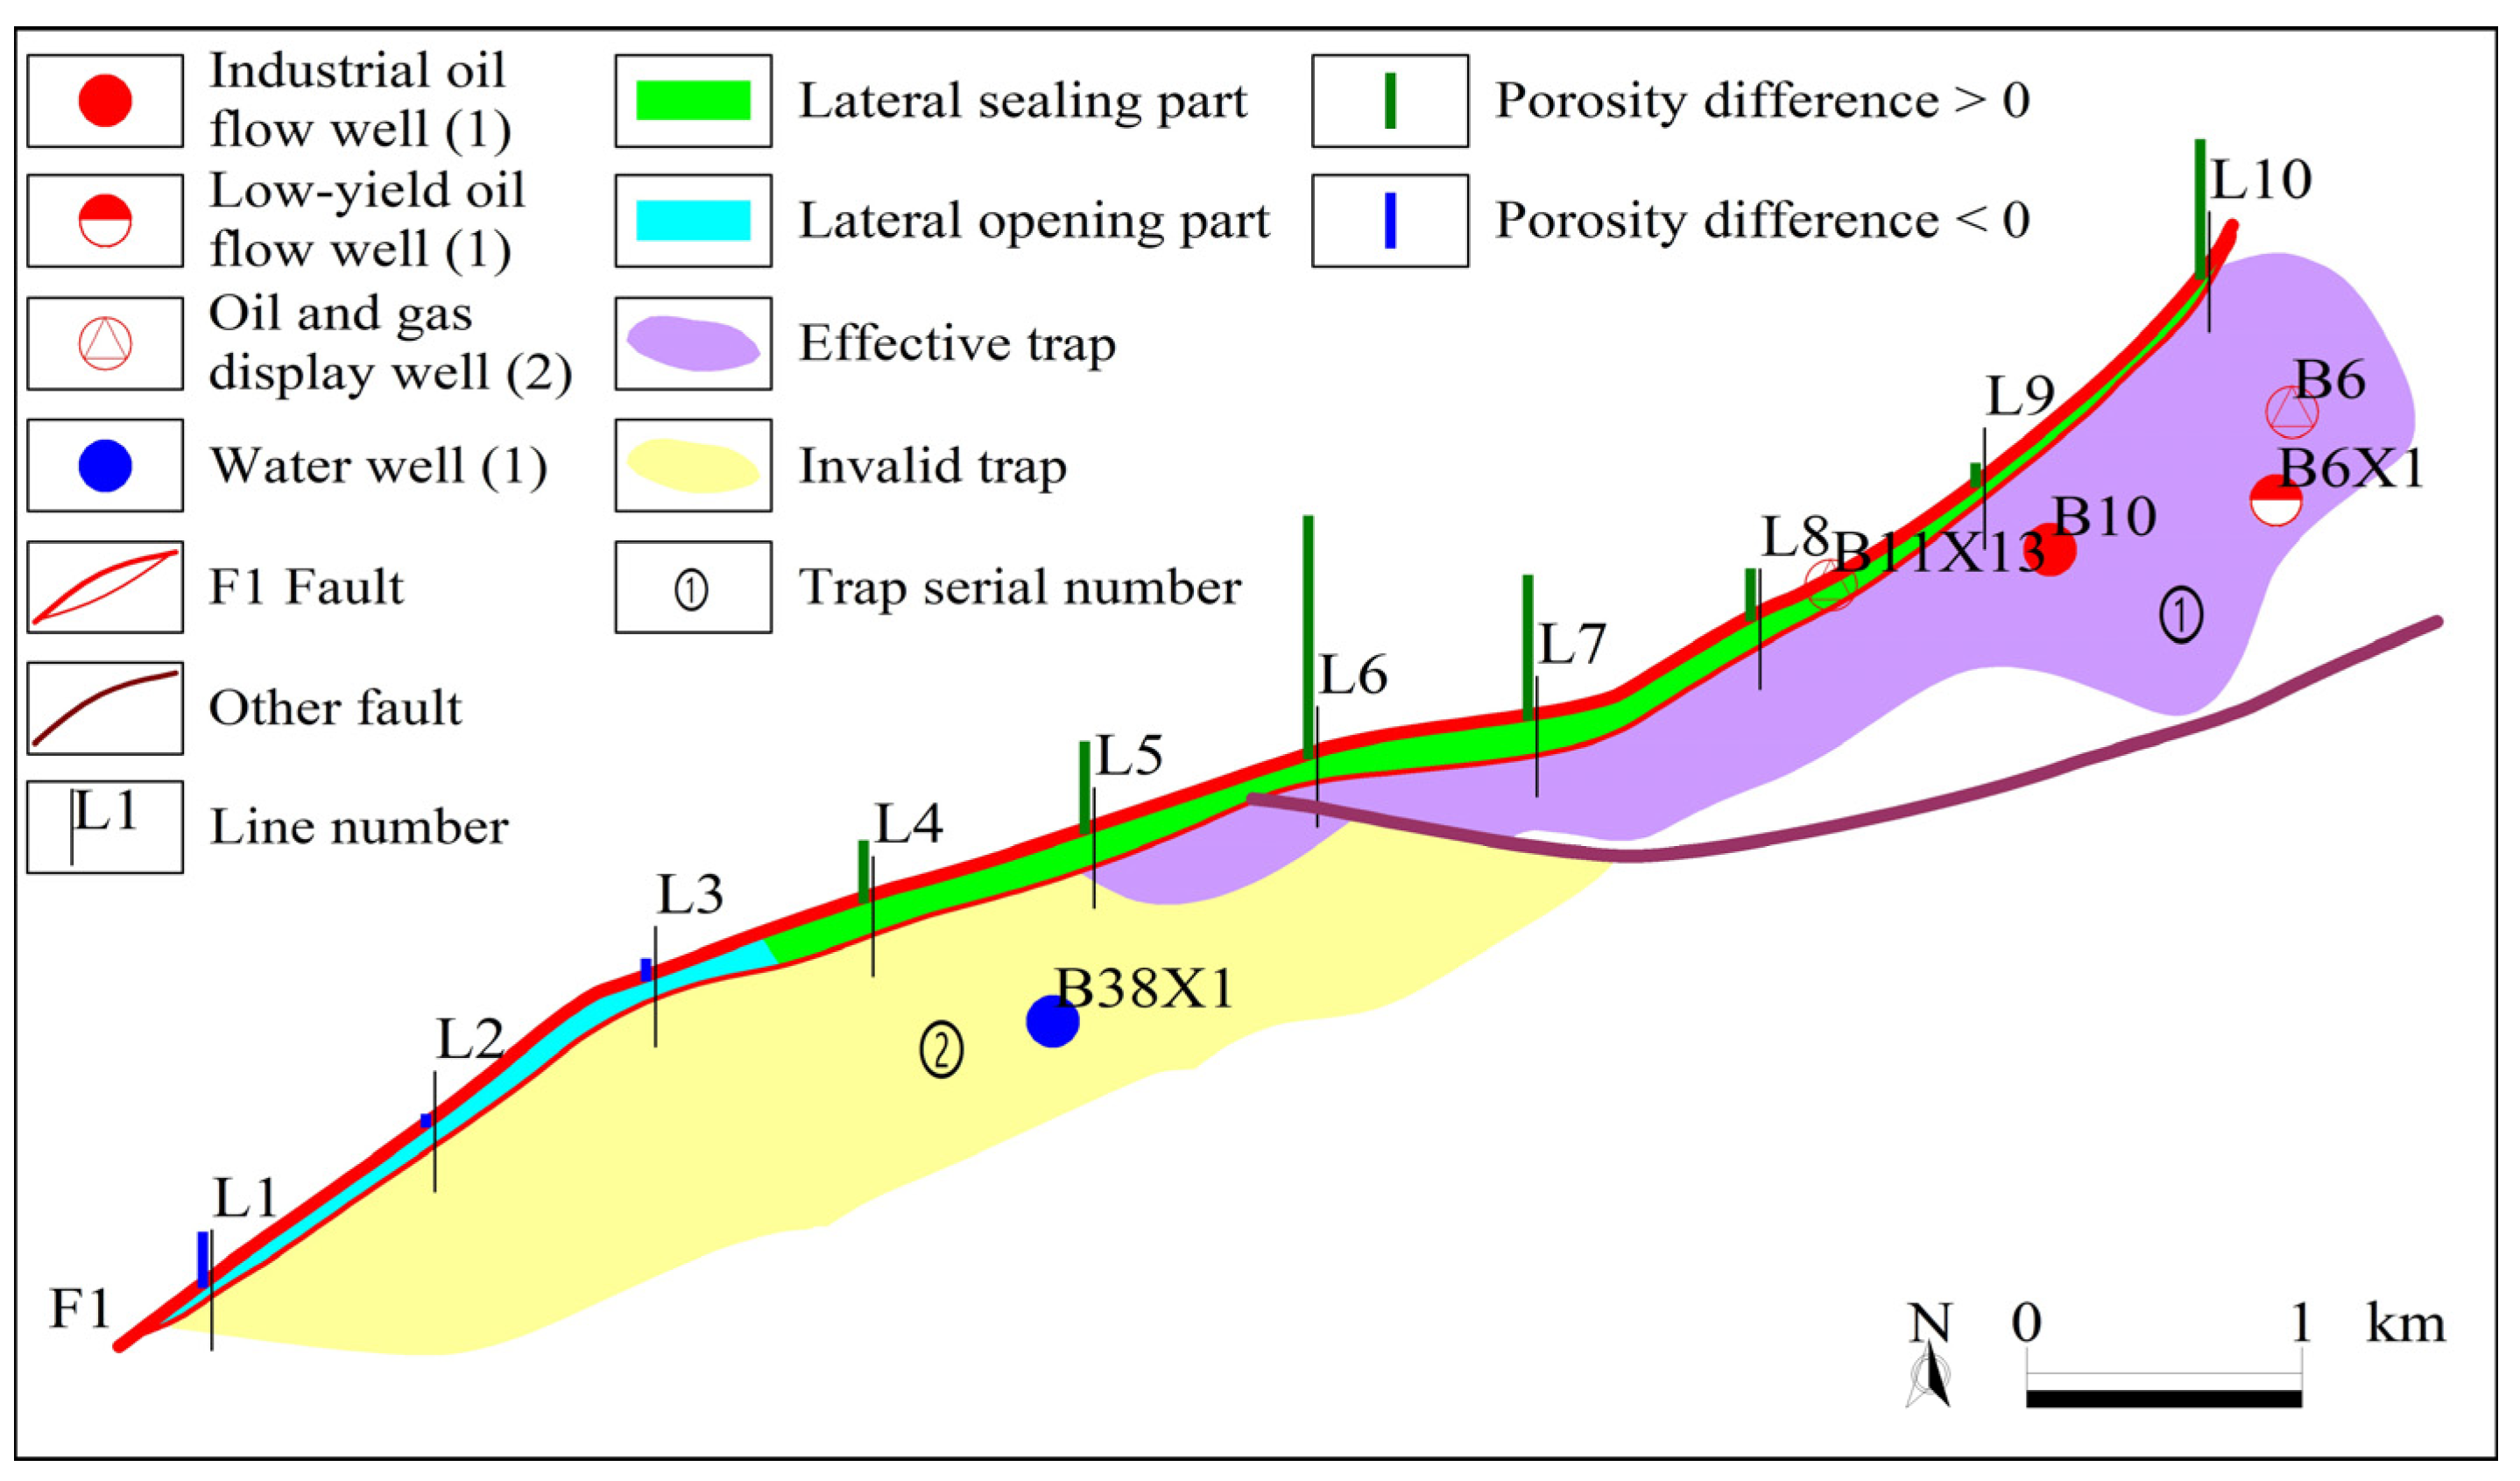
The porosity of the lower Ed2 reservoir rocks ranges from 3.23% to 4.65%, while that of the F1 Fault rocks in lower Ed2 ranges from 3.10% to 3.77%. The F1 Fault remains open laterally at lines L1~L3 but is closed at lines L4~L10, which is consistent with the oil and water distribution in the sand bodies of lower Ed2 near the F1 Fault;
(3)
The method is primarily applicable to the evaluation of lateral sealing of faults with developed fault rocks in clastic strata dominated by mechanical compaction.

Author Contributions

Conceptualization, Y.Y. and Y.Z. (Yuwei Zhang); methodology, Y.Y. and Y.Z. (Yuwei Zhang); validation, Y.Z. (Yaxiong Zhang); formal analysis, Y.Z. (Yaxiong Zhang); investigation, Y.Z. (Yuwei Zhang); resources, H.Y.; data curation, Y.Z. (Yaxiong Zhang); writing—original draft preparation, Y.Z. (Yuwei Zhang); writing—review and editing, Y.Y. and Y.Z. (Yuwei Zhang); visualization, Y.Z. (Yaxiong Zhang); supervision, Y.Y.; project administration, Y.Y.; funding acquisition, Y.Y. and H.Y. All authors have read and agreed to the published version of the manuscript.

Funding

This study was supported by the Key Research and Development Program of Heilongjiang Province (Grant No. JD22A022 to H.Y.), the Natural Science Foundation of Heilongjiang Province of China (Grant Nos. LH2022D013 to H.Y. and LH2023D005 to Y.Y.), and the Natural Science Foundation of Central Support Project for Young Talents in Local Universities in Heilongjiang Province (Grant No. 14011202101 to H.Y.).

Data Availability Statement

The original contributions presented in the study are included in the article, further inquiries can be directed to the corresponding author.

Conflicts of Interest

Author Yuwei Zhang was employed by the company Daqing Yushulin Oilfield Development Co., Ltd. of CNPC. The remaining authors declare that the research was conducted in the absence of any commercial or financial relationships that could be construed as a potential conflict of interest.

References

  1. Zhang, C.; Xie, X.N.; Jiang, T.; Liu, X.F. Hydrocarbon migration and accumulation along a long-term growth fault: Example from the BZ25-1 oilfield of Bohai basin, eastern China. J. Geochem. Explor. 2006, 89, 460–464. [Google Scholar] [CrossRef]
  2. Xu, C.G.; Peng, J.S.; Wu, Q.X.; Sun, Z.; Ye, T. Vertical dominant migration channel and hydrocarbon migration in the complex fault zone, Bohai Bay sag, China. Pet. Explor. Dev. 2019, 46, 720–728. [Google Scholar] [CrossRef]
  3. Needham, T.; Li, A.; Carr, C. Faulting and fault sealing in the TAGI Formation of the Ourhoud Field, Algeria. Pet. Geosci. 2008, 14, 379–388. [Google Scholar] [CrossRef]
  4. Liu, Y.; Wu, K.Y.; Wang, X.; Pei, Y.W.; Liu, B.; Guo, J.X. Geochemical characteristics of fault core and damage zones of the Hong-Che Fault Zone of the Junggar Basin (NW China) with implications for the fault sealing process. J. Asian Earth Sci. 2017, 143, 141–155. [Google Scholar] [CrossRef]
  5. Wen, Z.; Fu, X.F.; Lü, Y.F. Evaluation of fault seal and hydrocarbon potential prediction of fault traps. J. Cent. South Univ. (Sci. Technol.) 2016, 47, 1209–1218. [Google Scholar] [CrossRef]
  6. Fu, X.F.; Song, X.Q.; Wang, H.X.; Liu, H.T.; Wang, S.Y.; Meng, L.D. Comprehensive evaluation on hydrocarbon-bearing availability of fault traps in a rift basin: A case study of the Qikou sag in the Bohai Bay Basin, China. Pet. Explor. Dev. 2021, 48, 787–797. [Google Scholar] [CrossRef]
  7. Fisher, Q.J.; Knipe, R.J. The permeability of faults within siliciclastic petroleum reservoirs of the North Sea and Norwegian Continental Shelf. Mar. Pet. Geol. 2001, 18, 1063–1081. [Google Scholar] [CrossRef]
  8. Fu, X.F.; Pan, G.Q.; He, X.Y.; Xuan, C.J.; Lü, Y.J. Lateral sealing of faults for shallow biogas in Heidimiao Formation of the southern Daqing placanticlin. Acta Pet. Sin. 2009, 30, 678–684. [Google Scholar] [CrossRef]
  9. Allan, U.S. Model for hydrocarbon migration and entrapment within faulted structures. AAPG Bull. 1989, 73, 803–811. [Google Scholar] [CrossRef]
  10. Knipe, R.J. Juxtaposition and seal diagrams to help analyze fault seals in hydrocarbon reservoirs. AAPG Bull. 1997, 81, 187–195. [Google Scholar] [CrossRef]
  11. Liu, Z.; Fu, G.; Sun, Y.H.; Sun, T.W.; Zhou, J.; Zhang, D.W. Comprehensive evaluation of fault lateral sealing ability in Qijia-Yuanyanggou area, Liaohe depression. J. Cent. South Univ. (Sci. Technol.) 2012, 43, 1394–1404. [Google Scholar]
  12. Wang, C.; Fu, G.; Dong, Y.J.; Yang, D.X.; Cao, L.Z.; Hu, X.L. SGR algorithm-based improvement of fault lateral sealing evaluation method and its application. Acta Geol. Sin. 2017, 91, 1641–1650. [Google Scholar] [CrossRef]
  13. Hu, X.L.; Lyu, Y.F. Improvement of lateral sealing evaluation of faults based on SGR threshold. J. China Univ. Min. Technol. 2019, 48, 1330–1342. [Google Scholar] [CrossRef]
  14. Lei, C.; Yuan, X.T.; Yang, X.Y.; Xu, Q.Y.; Wang, M.; She, J.F. Quantitative characterization of fault lateral sealing capacity based on 3-D SGR model-A case from M field, Niger. Oil Gas Geol. 2019, 40, 1317–1323. [Google Scholar] [CrossRef]
  15. Lü, Y.F.; Huang, J.S.; Fu, G.; Fu, X.F. Quantitative study on fault sealing ability in sandstone and mudstone thin interbed. Acta Pet. Sin. 2009, 30, 824–829. [Google Scholar] [CrossRef]
  16. Song, G.Q.; Xiang, L.H.; Hao, X.F.; Shang, B.; Ning, F.X.; Huang, R. Quantitatively forecasting on lateral sealing performance of fault by displacement pressure method-case of Jiyang depression. Pet. Geol. Recovery Effic. 2011, 18, 1–3+111. [Google Scholar] [CrossRef]
  17. Lyu, Y.F.; Wang, W.; Hu, X.L.; Fu, G.; Shi, J.J.; Wang, C.; Liu, Z.; Jiang, W.Y. Quantitative evaluation method of fault lateral sealing. Pet. Explor. Dev. 2016, 43, 340–347. [Google Scholar] [CrossRef]
  18. Li, Q.; Tian, X.P.; He, J.; Jia, H.S.; Zhang, G.K. Quantitative characterization of fault sealing and its control on hydrocarbon accumulation. J. Southwest Pet. Univ. Sci. Technol. Ed. 2018, 40, 40–50. [Google Scholar] [CrossRef]
  19. Fu, G.; Shi, J.J.; Lyu, Y.F. Study of ancient displacement pressure of fault rock recovery and its sealing characteristics. J. China Univ. Min. Technol. 2013, 42, 996–1001. [Google Scholar] [CrossRef]
  20. Fu, G.; Wang, M.C.; Li, S.Z. A method for determining the sealing capacity evolution stage of fault rocks and its application. Nat. Gas Ind. 2017, 37, 11–16. [Google Scholar] [CrossRef]
  21. Wang, S.Q.; Xian, B.Z.; Wan, J.F.; Li, Z.P.; Yu, Q.C. Reservoir characteristics and controlling factors in the offshore areas the Eocene period of the Nanpu sag. J. Northeast Pet. Univ. 2015, 39, 54–62+87+9. [Google Scholar] [CrossRef]
  22. Liang, M.G.; Fu, G.; Li, Q.Q.; Guo, H.Y.; Zhang, B.W. Fault evolution and its effect on the sealing ability of mudstone cap rocks. Energies 2022, 15, 7676. [Google Scholar] [CrossRef]
  23. Peng, Q.H.; Zhou, J.Y.; Jie, Y.X. Erosion thickness restoration of Dongying Formation reservoir in Nanpu Depression by using interval transit time method. Fault Block Oil Gas Field 2009, 16, 50–53. [Google Scholar]
  24. Xian, B.Z.; Wan, J.F.; Dong, Y.L.; Ma, Q.; Zhang, J.G. Sedimentary characteristics, origin and model of lacustrine deepwater massive sandstone: An example from Dongying Formation in Nanpu depression. Acta Petrol. Sin. 2013, 29, 3287–3299. [Google Scholar]
  25. Wang, E.Z.; Liu, G.Y.; Pang, X.Q.; Wu, Z.Y.; Li, C.R.; Bai, H.; Zhang, Z.H. Sedimentology, diagenetic evolution, and sweet spot prediction of tight sandstone reservoirs: A case study of the third member of the Upper Paleogene Shahejie Formation, Nanpu Sag, Bohai Bay Basin, China. J. Pet. Sci. Eng. 2020, 186, 106718. [Google Scholar] [CrossRef]
  26. Zhang, L.; Xiang, C.F.; Dong, Y.X.; Zhang, M.Y.; Lyu, Y.; Zhao, Z.X.; Long, H.S.; Chen, S. Abnormal pressure system and its origin in the Nanpu Sag, Bohai Bay Basin. Oil Gas Geol. 2018, 39, 664–675. [Google Scholar] [CrossRef]
  27. Xia, J.S.; Liu, X.H.; Wang, Z.J.; Wen, W.; Tang, X.Y. Sedimentary characteristics of sandy debris flow in the 3rd Member of Dongying Formation and the 1st Member of Shahejie Formation of the western Nanpu sag, Bohai Bay Basin and its significance in hydrocarbon exploration. Acta Pet. Sin. 2017, 38, 399–413. [Google Scholar] [CrossRef]
  28. Caine, J.S.; Evans, J.P.; Forster, C.B. Fault zone architecture and permeability structure. Geology 1996, 24, 1025–1028. [Google Scholar] [CrossRef]
  29. Liu, G.D. Petroleum Geology, 5th ed.; Petroleum Industry Press: Beijing, China, 2018; pp. 43–44. [Google Scholar]
  30. Dzevanshir, R.D.; Buryakovskiy, L.A.; Chilingarian, G.V. Simple quantitative evaluation of porosity of argillaceous sediments at various depths of burial. Sediment. Geol. 1986, 46, 169–175. [Google Scholar] [CrossRef]
  31. Sha, Z.X.; Sun, Y.; Wen, Q.; Yu, D. Prediction method and its application for burial depth of fault rock compaction diagenesis in sandstone and shale strata. Fault Block Oil Gas Field 2022, 29, 654–658. [Google Scholar]
  32. Wu, G.P.; Su, J.Y.; Cheng, S.; Huang, J.Z. A method for obtaining shaliness using Wiener Filtering based on logging data natural gamma ray. Earth Sci. 2008, 33, 572–576. [Google Scholar] [CrossRef]
  33. Yielding, G.; Freeman, B.; Needham, D.T. Quantitative fault seal prediction. AAPG Bull. 1997, 81, 897–917. [Google Scholar] [CrossRef]
  34. Tan, K.J.; Wei, P.S.; Lü, X.M.; Mu, Z.H. Research on quantitative resumption method of stratum paleothickness and its application–Taking Ludong area in Zhunge’er Basin as an example. Nat. Gas Ind. 2005, 25, 48–50+59+9. [Google Scholar]
  35. Torabi, A.; Balsamo, F.; Nogueira, F.C.C.; Vasconcelos, D.L.; Silva, A.C.E.; Bezerra, F.H.R.; Souza, J.A.B. Variation of thickness, internal structure and petrophysical properties in a deformation band fault zone in siliciclastic rocks. Mar. Pet. Geol. 2021, 133, 105297. [Google Scholar] [CrossRef]
  36. Silva, M.E.; Nogueira, F.C.C.; Pérez, Y.A.R.; Vasconcelos, D.L.; Stohler, R.C.; Sanglard, J.C.D.; Balsamo, F.; Bezerra, F.H.R.; Carvalho, B.R.B.M.; Souza, J.A.B. Permeability modeling of a basin-bounding fault damage zone in the Rio do Peixe Basin, Brazil. Mar. Pet. Geol. 2022, 135, 105409. [Google Scholar] [CrossRef]
Figure 1. (a) Tectonic position, (b) tectonic features, and (c) columnar section of the Nanpu Sag (modified from Ref. [25]).
Energies 17 02468 g001
Figure 2. (a) Structure map of the lower Ed2, (b) seismic profile of the F1 Fault, and (c) columnar profile of the Ed2 of well B10 in the Nanpu No. 5 structure.
Energies 17 02468 g002
Figure 3. Schematic of fault lateral sealing mechanism: (a) fault lateral sealing (φf < φs); (b) fault lateral unclosed (φfφs).
Energies 17 02468 g003
Figure 4. Schematic representation of the determination of porosity of fault rock.
Energies 17 02468 g004
Figure 5. Relationship between measured porosity of the surrounding rocks and (a) their burial depth, (b) shale content, and (c) the product of the two in the Nanpu Sag.
Energies 17 02468 g005
Figure 6. Shale content of (a) the lower Ed2 sand bodies and (b) the F1 Fault rocks in the Nanpu No. 5 structure.
Energies 17 02468 g006
Figure 7. Determination of porosity of the F1 Fault rocks in lower Ed2 at line L9.
Energies 17 02468 g007
Figure 8. Relationship between lateral sealing of the F1 Fault and oil and water distribution of the lower Ed2.
Energies 17 02468 g008
Table 1. Measured porosity, burial depth, and shale content of the surrounding rocks in the Nanpu Sag.
Well NameStratumBurial Depth/mShale ContentPorosity/%Well NameStratumBurial Depth/mShale ContentPorosity/%
B10Ed33383.870.482.5M11Ed12362.90.517.3
B13Ed12707.310.283.1M15Ed12807.90.418.1
B22 × 1Es14061.80.581.9M17-1Ed12723.850.197
B3Ed12776.610.645.9M22Ng2066.010.1310.1
B32 × 1Ng1946.450.112.1M24Ed123030.59
B5Es14219.40.363M28 × 1 DeepEd33268.60.593.9
B6Ed23196.30.473.4M28 × 1 ShallowEd22813.30.364.7
B6 × 1Ed23093.50.321M30Ed12355.010.35.7
B7Ed33597.580.395.8M38 × 1Ed33318.70.491.9
G23Es33119.20.264.6M5Ed22768.360.515.4
G3104Es33637.130.243.6M7Ng18910.2315.8
G3106Es33899.50.371.2NP1Es14244.60.440.5
G4Es32663.90.332.5NP1-22Ng2696.380.256.4
G62Es34054.60.351.4NP1-4Ed33386.720.522
L12Es33557.050.173.3NP206Ed12540.680.149.8
L15Es32633.490.467.3NP4-51 DeepEs13745.480.421.2
L21-2Nm1730.10.0822.6NP4-51 ShallowEd12449.790.555.1
L21-5Es33110.310.265.4NP509Ed33221.860.1411.2
LP1 DeepEd23055.50.078NP5-10Ed333200.324.1
LPN1Ed12647.40.0612.8NP5-6Ed33445.050.572.7
M1Ed23432.040.660.5NP5 × 6Ed33447.90.312.5
M10Ed22678.70.35.9PG1Es13272.140.571.8
M108 × 1Ed33345.30.463.3
Table 2. Data used to evaluate lateral sealing of the F1 Fault in lower Ed2.
Line NumberBurial Depth/mReservoir RockFault RockPorosity Difference/%
Shale ContentPorosity/%Shale ContentPorosity/%
L131720.353.470.423.77−0.30
L231410.333.630.443.70−0.07
L331320.333.630.433.76−0.13
L431370.294.090.433.760.33
L531280.294.080.463.580.49
L631500.254.650.493.341.31
L731390.294.050.513.270.78
L831360.343.600.503.330.28
L931620.383.230.533.100.13
L1031800.303.910.523.140.76
Disclaimer/Publisher’s Note: The statements, opinions and data contained in all publications are solely those of the individual author(s) and contributor(s) and not of MDPI and/or the editor(s). MDPI and/or the editor(s) disclaim responsibility for any injury to people or property resulting from any ideas, methods, instructions or products referred to in the content.

