1. Introduction
There are a number of techniques to effectively concentrate solar radiation on photovoltaic (PV) systems, thereby increasing their efficiency. Among these methods, a simple approach to improving the efficiency of a PV system is the use of a sun-tracking mechanism. This mechanism allows the system to rotate and optimally align itself with the position of Sun on the horizon, ensuring that the silicon wafers are best matched to the sunlight [
1,
2,
3]. Another method is hybrid photovoltaic-thermal systems, which are designed to generate both electricity and heat, thus reducing the fluctuations in PV module output [
4]. Various concentrator technologies further facilitate the increased efficiency of photovoltaic systems. One commonly used optical element is the Fresnel lens, available in flat, circular and rectangular shapes. A study [
5] suggests that circular lenses have better transmittance (82%) compared to rectangular lenses (80%), and that the optical efficiency is closely related to the focal length. Parabolic mirrors are another option for concentration. Challenges to commercializing their use include the uneven distribution of solar flux across the receiver surface, the elevated temperature of PV cells due to concentrated solar radiation and imperfections in reflective surfaces [
6]. In most cases, performance-increment research is focused on silicon cells. However, it is worth adding that other solutions, such as dye-sensitized solar cells (DSSC) or perovskite solar cells, are also subject to optimization. Aftab et al. [
7] paid attention to MXene-modified electrodes. There are certain hopes associated with them due to their potential to accelerate sustainable energy conversion and thus increase the efficiency of DSSCs. Mai et al. received BEDCE material, which allows them to increase the efficiency of the perovskite cell from 17.20% to 19.02% [
8]. The increase in the efficiency of perovskite solar cells (PSCs) is also reported by Xu et al. [
9]. The authors studied PSCs containing formamidine (FA). An important problem with this technology is phase instability. Researchers managed to improve the performance of FA-based PSCs by treating the perovskite surface with pyrrolidinium hydride salts. The power conversion efficiency comparison showed an increase from 18.21% to 19.62%. The increase in solar cell temperature is one of the key issues inhibiting the use of concentrators. Therefore, there is a need to develop solutions to improve system performance while ensuring temperature stabilization [
10,
11].
One proposed solution is to use common pigments from the dye sensitized solar cell (DSSC) industry as concentrators. Liquid concentrators in the form of natural dyes, typically used in dye sensitized solar cells, could complement traditional silicon (1st generation) cells to increase operational efficiency. However, it is important to note that although natural dyes, especially those derived from a variety of plant sources, have minimal environmental impact, they may not provide the same level of performance as metallic dyes commonly used in DSSC cells [
11,
12,
13]. The requirements for the dyes used as concentrators differ from those used in DSSC cells. While the latter undergo chemical reactions to generate electricity, concentrating dyes serve as lenses to focus solar radiation onto silicon cells [
14]. Therefore, the most important requirements for a dye concentrator include high stability in long-term operation comparable to silicon cells and the ability to efficiently focus sunlight [
15].
Luminescent solar concentrators (LSCs) offer many advantages over conventional concentrator technologies. Most importantly, they can function without direct irradiation, which is a key feature, especially in areas with diffuse natural light [
10,
16,
17]. This significantly increases their efficiency, making them ideal for photovoltaic installations. Furthermore, the technology eliminates the need for sun-tracking mechanisms and other specific components. Research indicates that luminescent solutions have the ability to absorb light across a broad spectrum of wavelengths [
18]. LSC, which contains a luminescent pigment, effectively refracts and absorbs sunlight, emitting it at longer wavelengths [
18,
19,
20]. This process, known as the Stokes shift, determines the conversion between absorbed and emitted light during fluorescence [
16,
21]. It should be noted that this technology, combining irradiance concentration and light emission after Stokes shift, requires careful analysis of the spectral response of the solar cell before implementation [
20].
The use of a luminescent concentrator can reduce the cost of PV installations by reducing the use of active photovoltaic materials. Such designs most often consist of a plastic wafer doped with transparent materials characterized by their luminescent ion content [
22]. An example of such a photovoltaic LSC is a polymer wafer doped with a luminescent material, together with PV cells fitted to the edge of the wafer. A polymethylmethacrylate (PMMA) plate is a possible concentrator for LSCs [
23].
In this study, an attempt is made to test the effect of incorporating the concentrator, here PMMA of different types, into a PV system. Changes in the basic operating parameters of the PV system, including its efficiency, are observed depending on the test variant. The reference condition is a pure polycrystalline PV cell. Different types and colors of PMMA wafers are matched to it in subsequent variants. The tests are carried out on a dedicated laboratory stand, equipped with a device simulating the set process parameters. The variable conditions in this case basically consisted of establishing a range of irradiation and temperature combinations. The results presented in this paper are based on laboratory-scale experiments, highlighting the need for further research to investigate the actual implementation of the proposed solution.
2. Materials and Methods
2.1. Laboratory Stand
This section presents a dedicated laboratory stand and the parameters of the tested polycrystalline silicon cell with an area of 25 cm2. The tests were performed under standard test conditions (STC). For photovoltaic technology, the STC includes an irradiance of 1000 W/m2, an AM (air mass) of 1.5, and a device temperature of 25 °C. These standardized conditions streamline the comparison of results from the different technologies tested around the world, allowing them to be evaluated. Each photovoltaic technology has unique characteristics, with silicon cells and dye concentrators exhibiting distinct responses to specific light spectra.
Table 1 summarizes the basic parameters of the monocrystalline silicon cells used in the study.
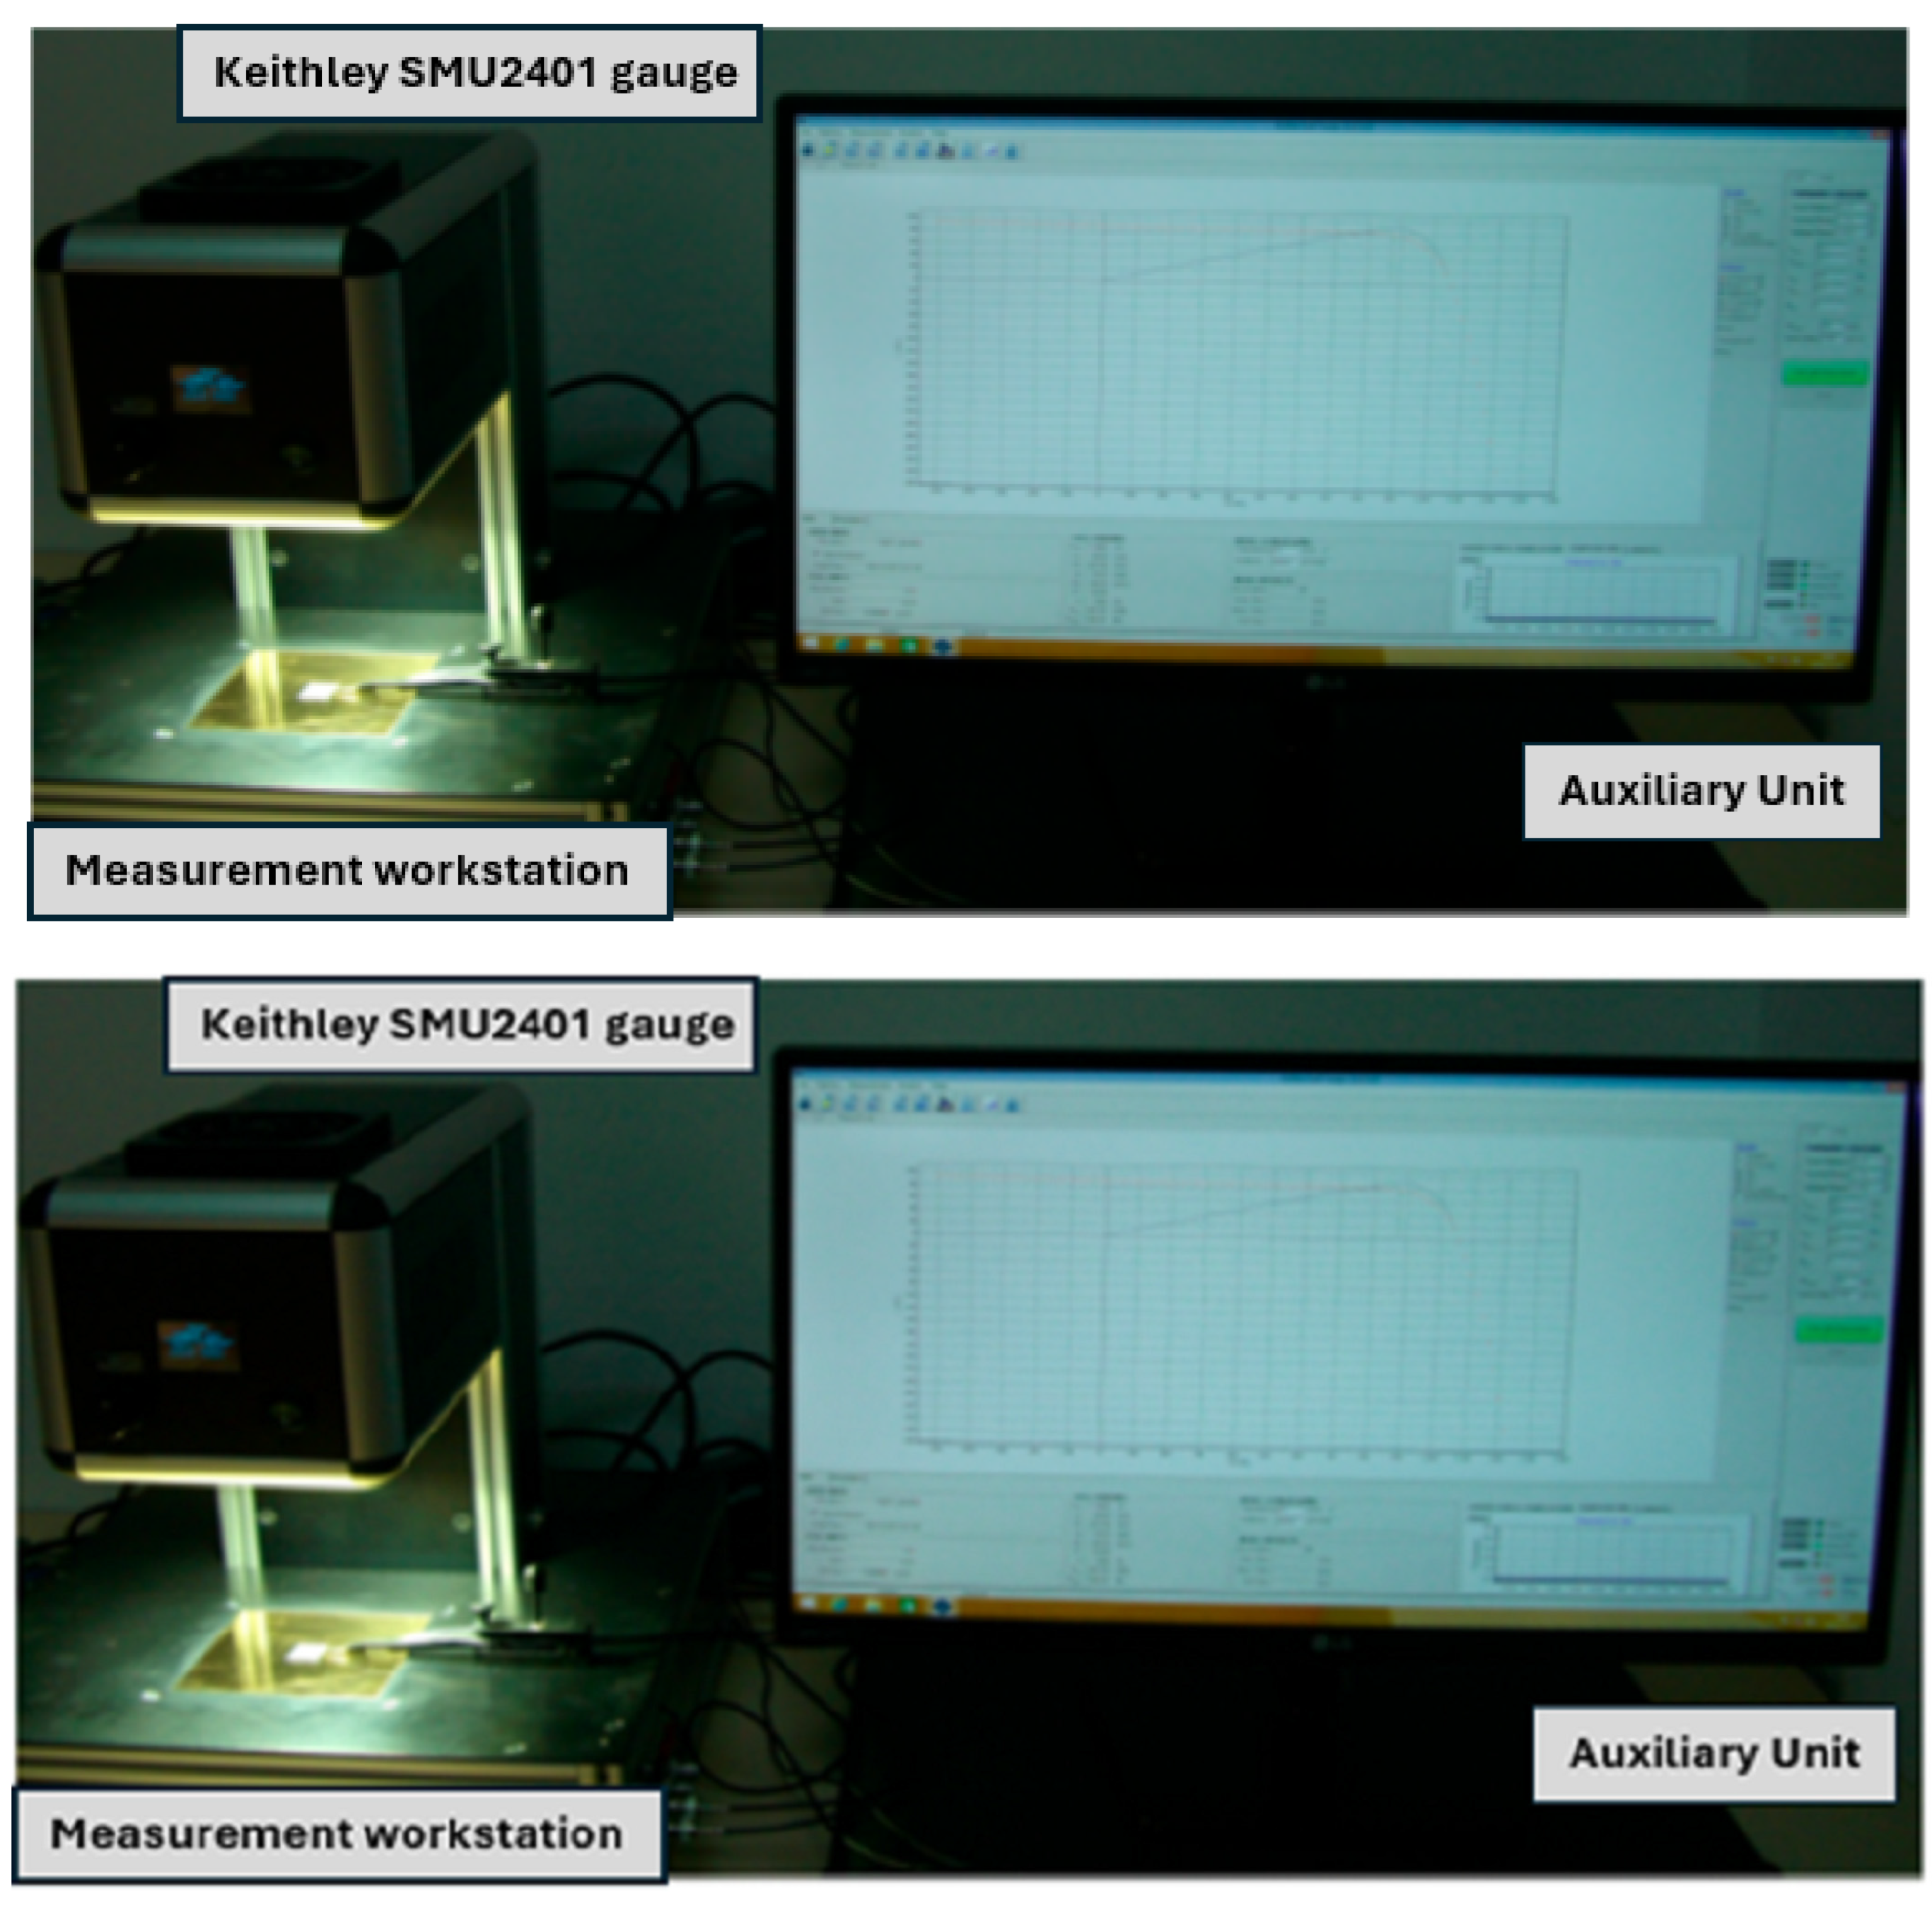
The laboratory stand consists of the following elements:
A Keithley SMU2401 gauge (Tektronix, USA) capable of measuring currents ranging from 1 nA to 1 A and voltages up to 20 V.
A measurement workstation equipped with an integrated SS05SA LED solar simulator (Primelite, Germany). It enables precise control of temperature of the tested cell within a range of 10–60 °C, facilitated by an air-cooled Peltier module. Also, it includes a solar cell suction system and a Kelvin probe.
An Auxiliary Unit ver. 3.0 with dedicated PC software (Tektronix, USA), which serves as a computer station with specialized software that enables irradiation levels, cell suction, control over temperature and probe functions.
Figure 1 shows the dedicated laboratory stand.
In order to conduct a thorough analysis of enhancing the efficiency of silicon cells through the utilization of dye concentrators, it is essential to take into account various factors, including the light source. In natural settings, sunlight serves as the primary source of irradiance, while in laboratory settings, a solar simulator is employed. The primary objective of a solar simulator is to replicate conditions akin to those of natural sunlight.
Figure 2 illustrates the spectral irradiance distribution of natural light [
24].
Every technology utilized in photovoltaics possesses distinct characteristics; silicon cells and dye concentrators exhibit varying responses to light across specific spectra. For instance, silicon cells exhibit optimal responsiveness within the wavelength range of 800 to 950 nm, while Dye-Sensitized Solar Cells (DSSC) perform best between 550 and 650 nm. Consequently, silicon cells operate with greater efficiency under red light, whereas DSSCs (depending on the materials employed in their production) thrive in green or yellow light. For these reasons, it was decided that red and yellow dye concentrators would be used for the test.
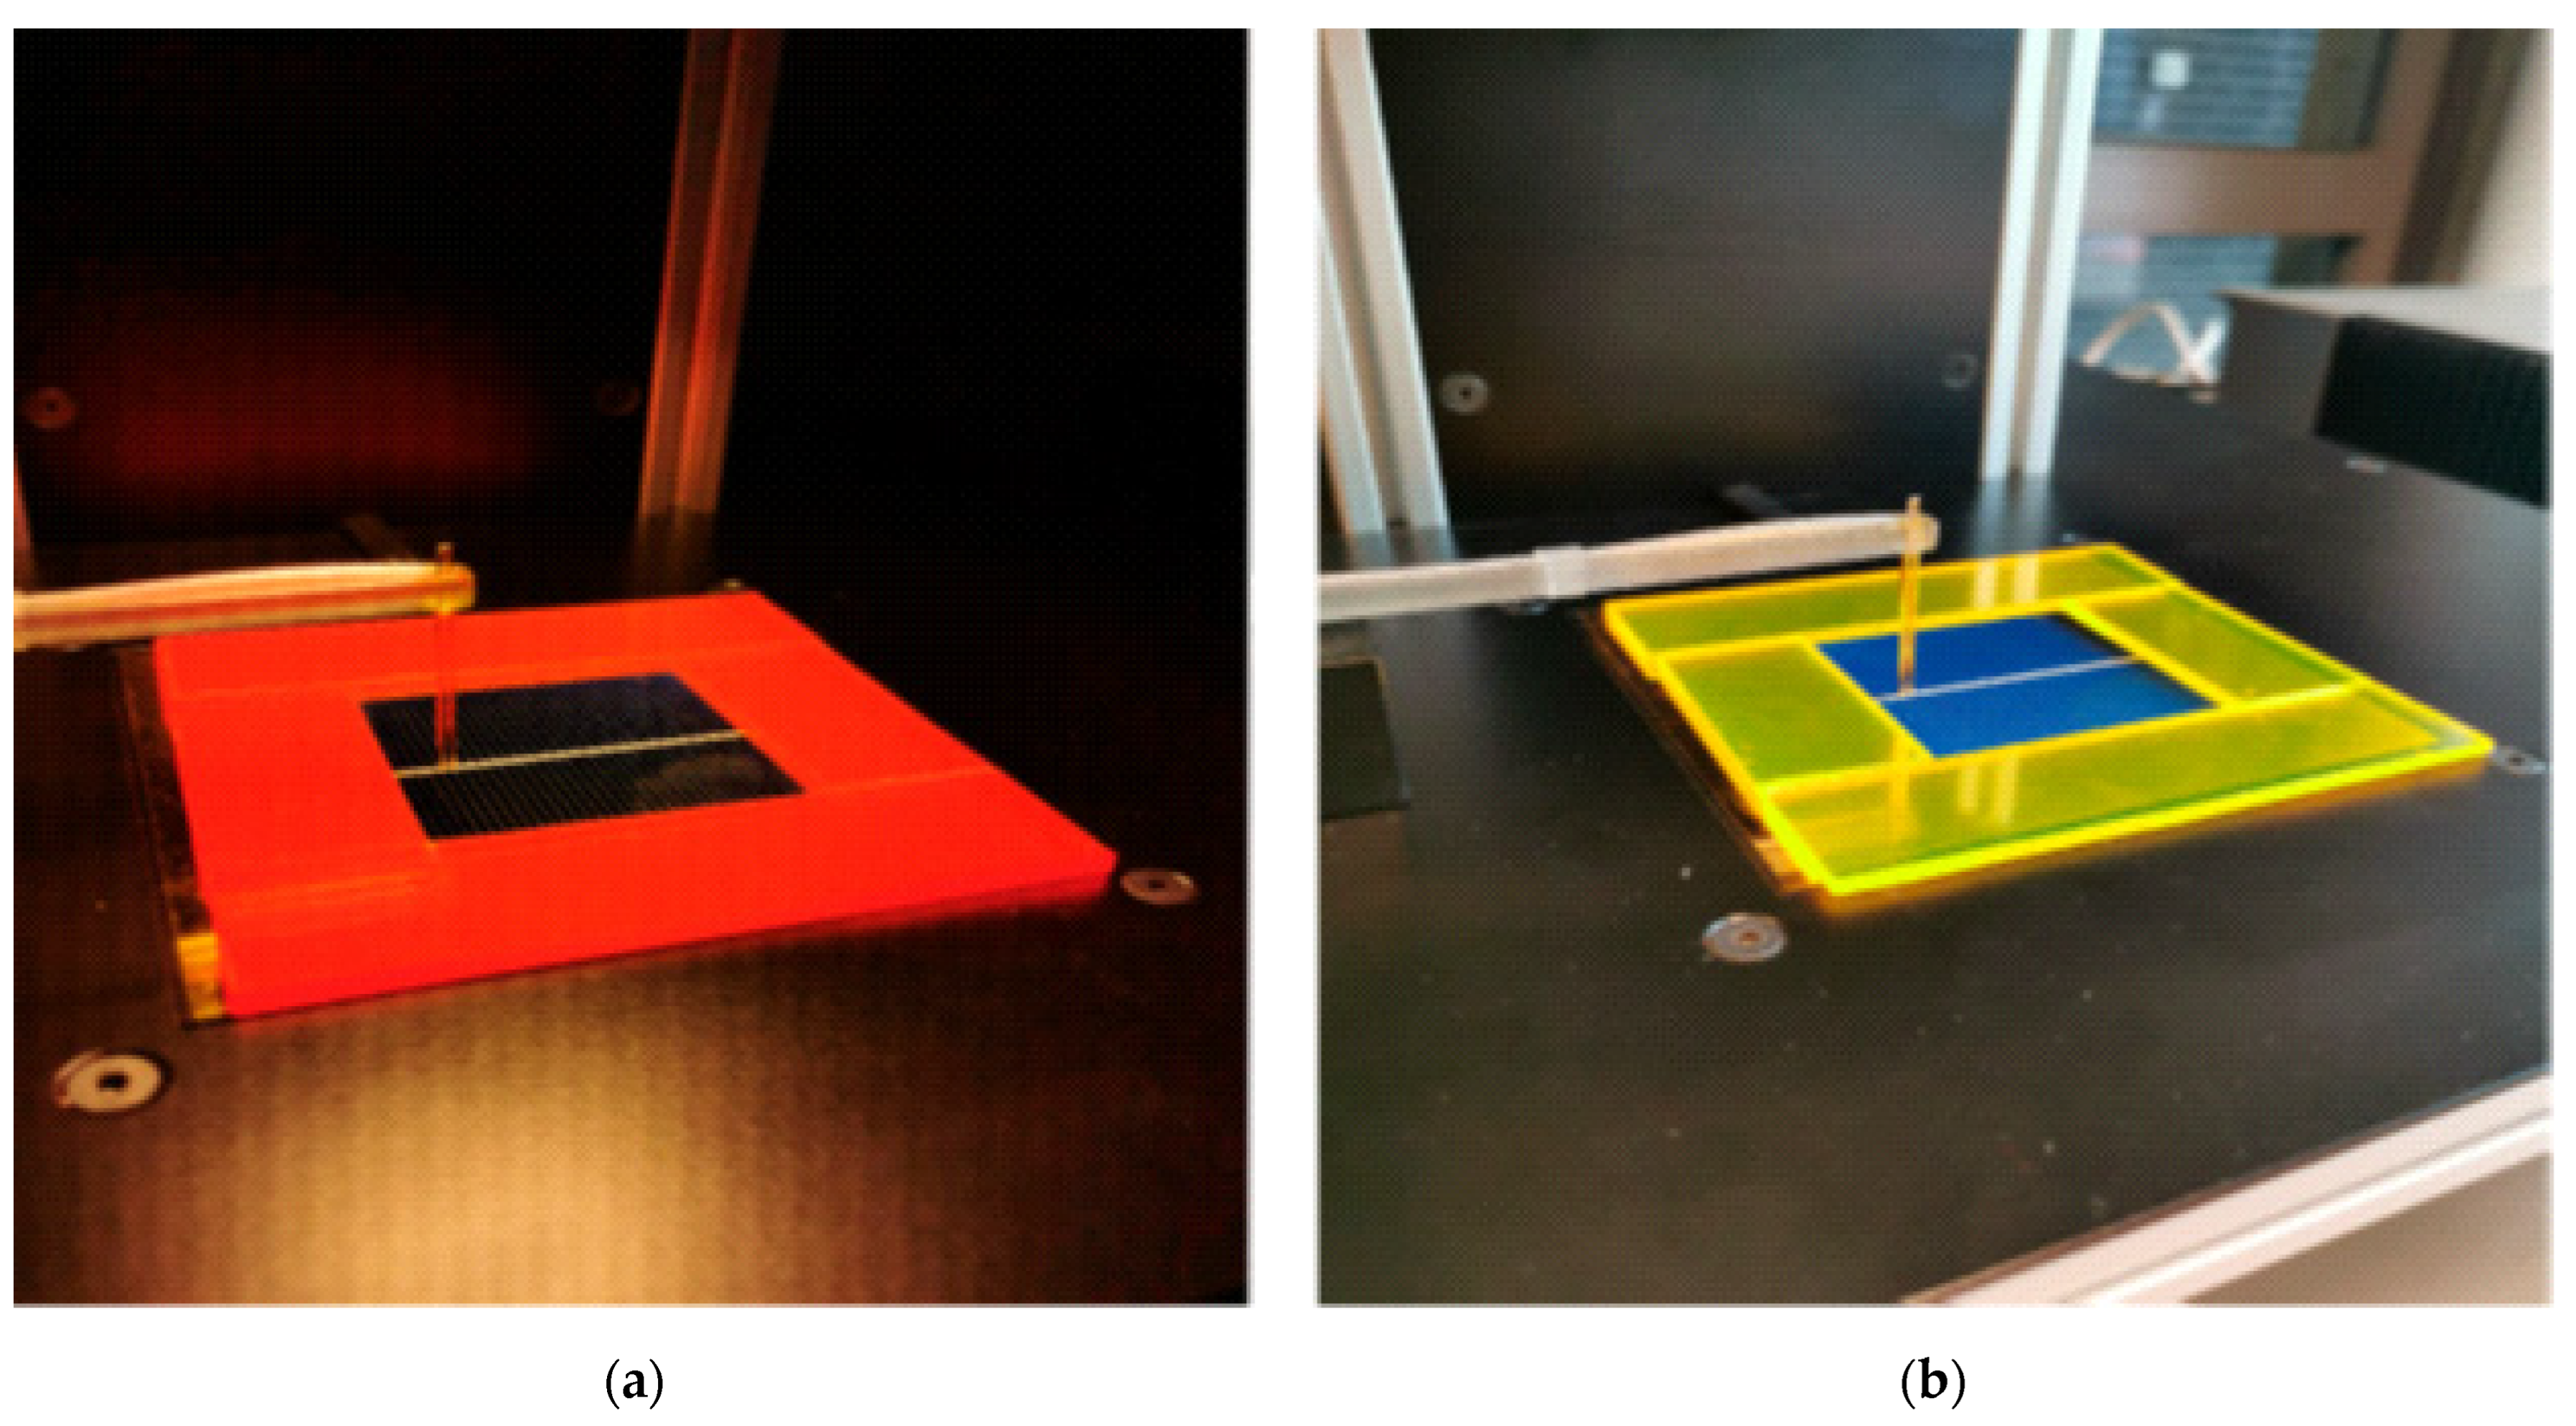
Examples of elements used to concentrate sunlight in photovoltaics are PMMA (polymethyl methacrylate) concentrators. It is a type of plastic that can be formed into various shapes and used as an optical material for concentrators. PMMA concentrators can take the form of plates or lenses of appropriate shapes and dimensions that focus solar radiation on the surface of photovoltaic cells. It is the material used in the study, here in red and yellow. These elements are shown in
Figure 3.
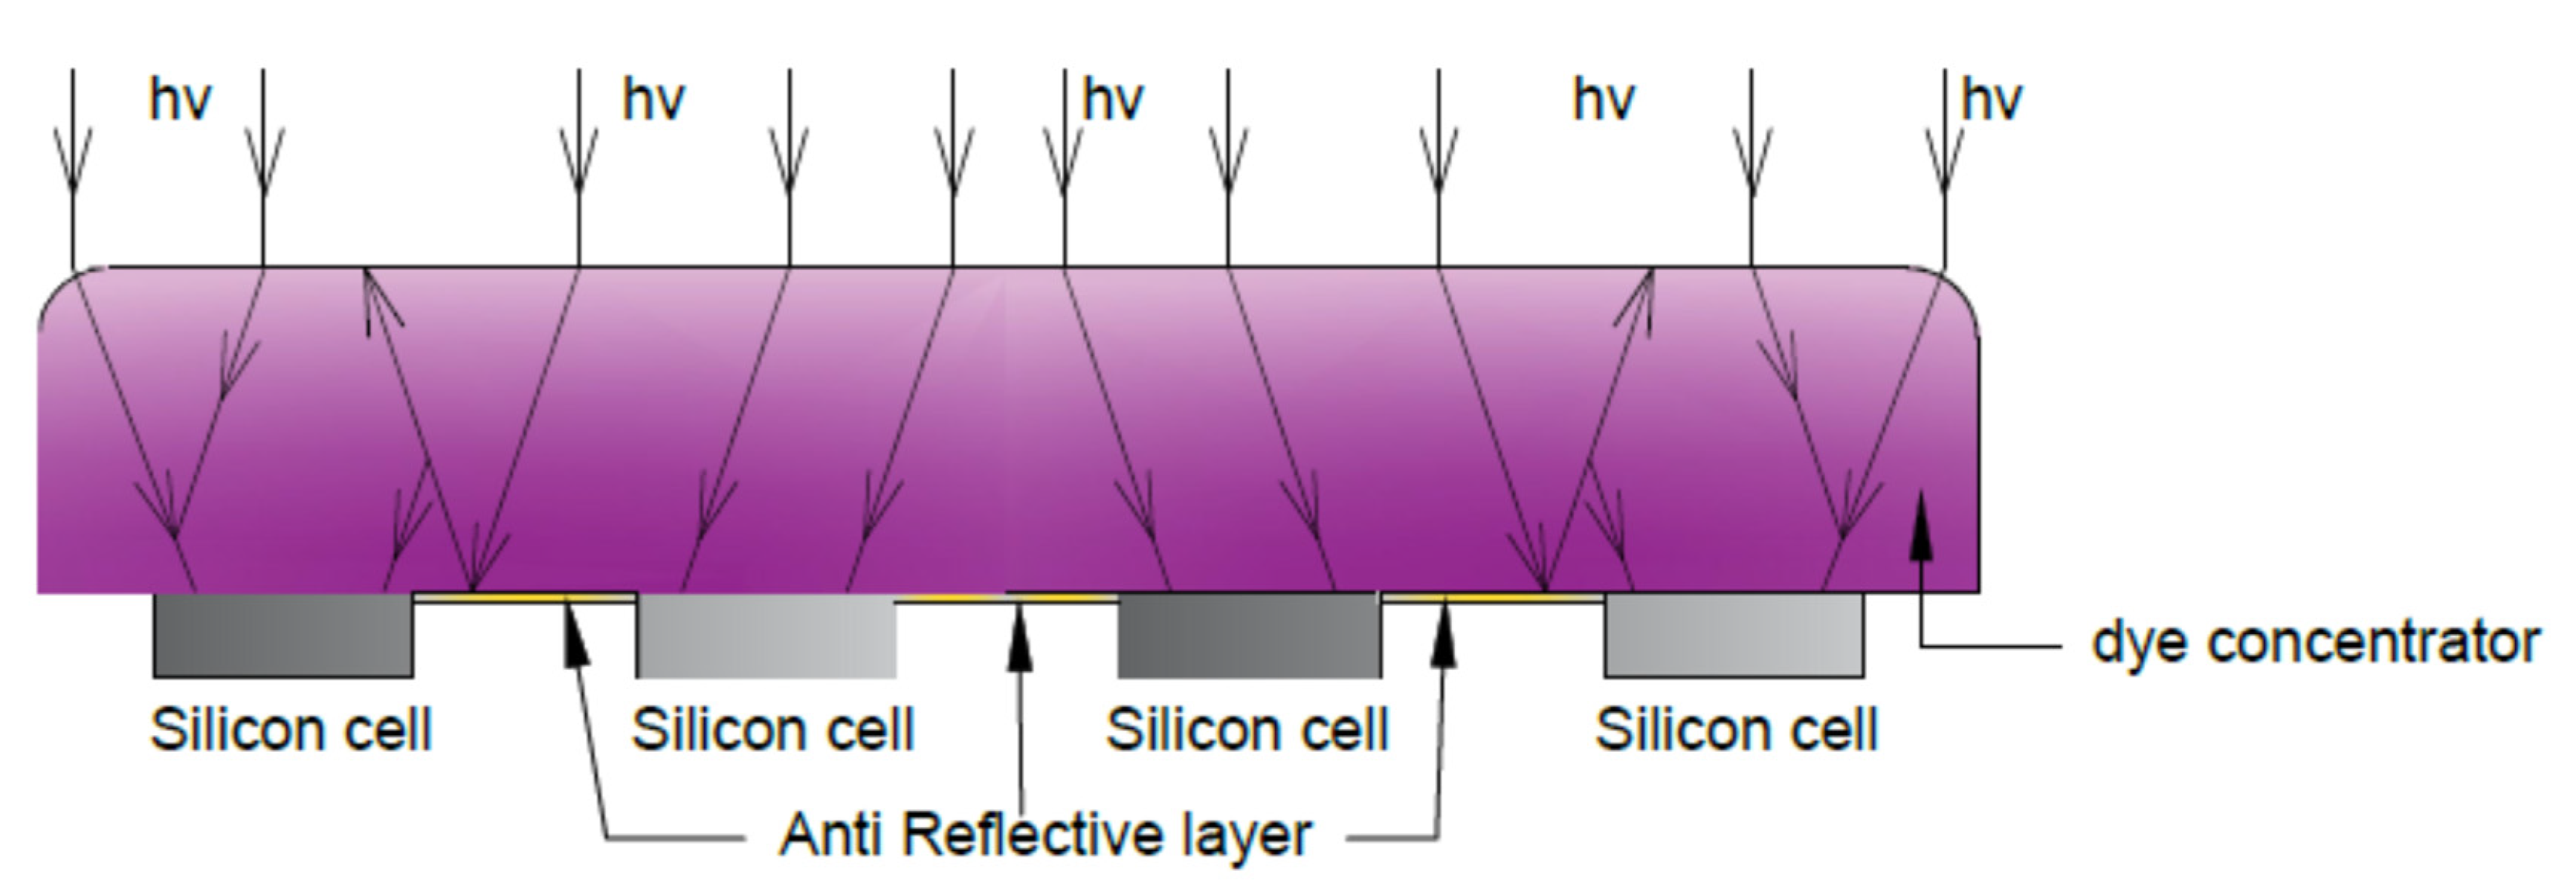
Figure 4 illustrates the operational mechanism of dye concentrator, demonstrating the path of light.
Initially, sunlight impinges upon the surface of the concentrator (1 natural irradiance), where a portion of it is absorbed (3), while the remainder is reflected by the surface of the concentrator (2). The absorbed light traverses through the material of the concentrator (4), while the remaining portions are either absorbed or reflected by the pigments (9), reabsorbed by adjacent dye molecules (5), or lost during transmission through the material (10). The numbers in the diagram represent different processes: (6) denotes escape-cone loss, (7) signifies transmitted radiation, and (8) represents non-radiative decay.
2.2. Method of Conducting Tests
The initial phase of the research involved determining the desired levels of irradiance and temperature for the measurements. All results presented in the study represent the average of a minimum of three consecutive measurements. This approach minimizes errors resulting from fluctuations in light intensity. The fundamental characteristics of the cell were assessed using the Keithley gauge and depicted in the form of I-V curves (current-voltage curves) through dedicated PC software (Tektronix, USA). In the experiment, four PMMA plates were employed as dye concentrators, encompassing the tested solar cell. Each plate had a width of 2.5 cm, with two plates totaling a length of 5 cm and the other two plates totaling a length of 10 cm.
The variants of the tested PV system are as follows:
S0—variant with PV cell,
S1—variant with PV cell and pigmented red PMMA,
S2—variant with PV cell and pigmented yellow PMMA,
S3—variant with PV cell and luminescent red PMMA,
S4—variant with PV cell and luminescent yellow PMMA.
The variable operating parameters and their values are as follows:
irradiation—200 W/m2, 400 W/m2, 600 W/m2, 800 W/m2 and 1000 W/m2,
temperature—16 °C, 25 °C, 26 °C, 28 °C and 30 °C.
The basic parameters of the photovoltaic cell were studied;
Average efficiency of PV cell η, %;
Average power output Po,av, mW;
Average open circuit voltage Voc,av, mV;
Average short circuit current Iscc,av, mA.
Throughout the measurements, the irradiance remained stable within the assumed ranges, with illumination levels varying by about 10 W/m
2. This means that measurements carried out with an irradiance of 1000 W/m
2 could be carried out in the range of 990–1010 W/m
2. The power output data can be calculated using the following formula:
where:
A—surface of the silicon cell, m2,
Pin—amount of solar radiation reaching the Earth, W/m2,
ƞ—efficiency of the silicon cell.
3. Results and Discussion
A comparison of the results from the tests carried out in all variants is summarized in
Table 2,
Table 3,
Table 4 and
Table 5. In the first one, the results of the average efficiency of the PV cells are summarized.
Comparing the average PV cell efficiency obtained for the standard configuration using only clear polycrystalline silicon cells with the results obtained for the other variants, some changes can be observed. In most cases, the inclusion of a PMMA concentrator in the PV system increased efficiency. For red, pigmented PMMA (S1), we observe a change in efficiency in the range of −0.4% to +0.26%. The negative values are particularly pronounced under low irradiance and temperature conditions. For yellow PMMA (S2), the efficiency differences range from −0.54% to +0.7%. It is worth noting that the negative values for yellow PMMA were only observed under extremely low irradiance conditions (200 W/m2) and at 16 °C. These findings suggest that PMMA with a low yellow pigment content may exhibit better light-bending properties compared to its red counterpart. When analyzing the results for systems using yellow and red luminescent PMMA, we observe a clear advantage for the system containing red luminescent PMMA. The red luminescent PMMA (S3) shows an average increase in performance of 1.21%, significantly exceeding the increase recorded for the yellow luminescent PMMA (S4), which averages 0.25%.
Table 3,
Table 4 and
Table 5 present average power output, average open circuit voltage and average short circuit current.
Comparing the current and voltage results for S1–S4 variants with those of the PV system without concentrators, it can be seen that the voltage variations are within the error margin of the measuring instrument. For the yellow, pigmented PMMA (S2), the average increase in Isc is about 14.24 mA, accompanied by a corresponding increase of 1.05 mV for Voc. For red, pigmented PMMA (S1), the results show a slightly lower increase of 3.63 mA for Isc and about 1.21 mV for Voc. For luminescent PMMA, minimal changes in Voc were observed, namely 1.89 mV for red (S3) and 0.9 mV for yellow (S4). However, the most noticeable change is observed in the current values, averaging about 14.24 mA for yellow (S4) and 38.5 mA for red (S3). These results confirm the literature thesis suggesting that the use of luminescent concentrators results in higher current values in the tested system. Comparing pigmented and luminescent concentrators, the pigmented yellow PMMA (S2) shows better characteristics than its luminescent counterpart (S4). The reverse is true when comparing red concentrators. Higher results were obtained for the luminescent PMMA variant (S3). This highlights the importance of a thorough technology analysis before implementing a luminescent concentrator.
Figure 5 graphically summarizes the average PV cell efficiency values obtained for all variants and parameters of the operating test.
Analyzing the overview, there is a clear advantage of the variant with red, luminescent PMMA (S3) over the others in terms of PV cell efficiency. The results obtained here can be considered in terms of both the highest efficiency and the highest increase with respect to the system without concentrators. In the first case, the highest average efficiency of the S3 variant was achieved under conditions of 16 °C and irradiation of 200 W/m2. The peak efficiency increase in the S3 variant was recorded for a temperature of 28 °C and irradiation of 400 W/m2, reaching 1.42%. All of the results using the red luminescent PMMA show an improvement in the performance of the silicon cell. The situation is slightly different for the other variants. The average performance here is at a similar level, but it is nevertheless possible to single out the S2 variant, i.e., with yellow pigmented PMMA, as the most favorable. The highest efficiency for the S2 variant was obtained at 16 °C and for an irradiation of 400 W/m2, while the highest increase in efficiency with respect to S0 is achieved at the same irradiation level, but at 25 °C. For this case, the increase is 0.58%. It is worth noting that three of the five measurements for the yellow option at the lowest irradiance level gave negative values.
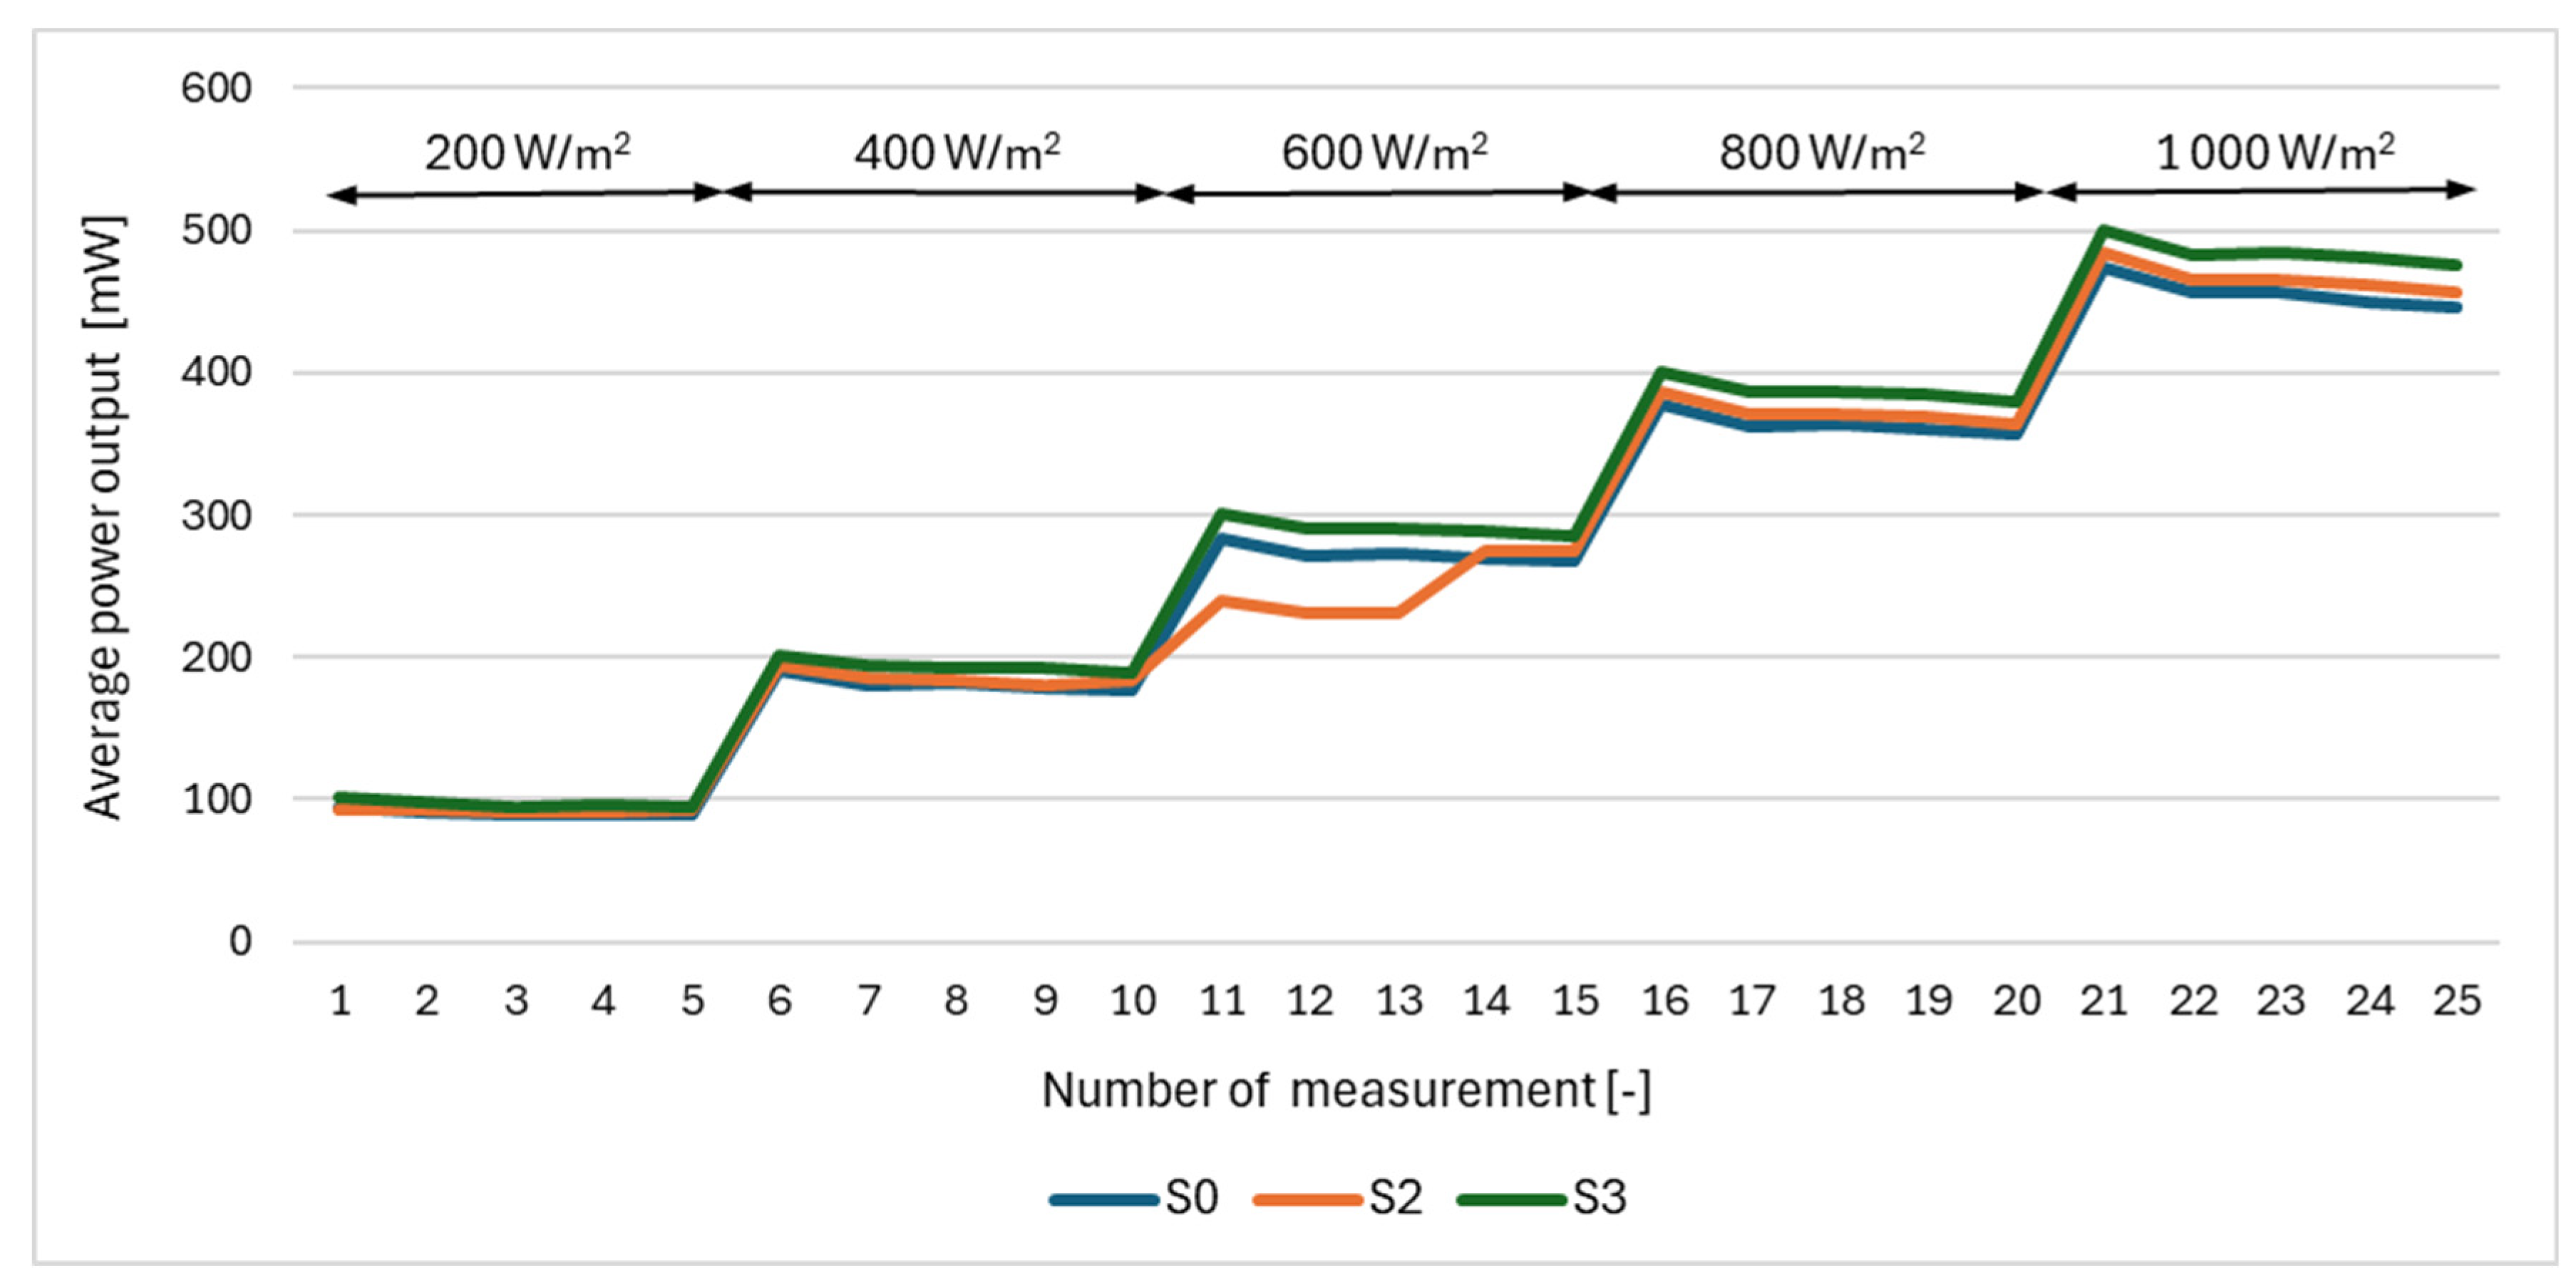
Figure 6 and
Figure 7 show a graphical comparison of average power output, average open circuit voltage and average short circuit current for the variants with favorable performance results, namely S2 and S3. These are compared with the reference condition, S0.
4. Conclusions
Renewable energy technologies will undoubtedly continue to improve, striving for ever higher energy yields. The concept of concentrators in PV systems is already well-established in the industry and typically uses mirrors and lenses. The implementation of luminescent solar concentrators (LSCs) as a light-directing element is promising. It is a viable solution for the regions where the scattering of solar radiation constrains photovoltaic development. Nations experiencing four seasons could effectively deploy this solution to optimize energy efficiency year-round, particularly during the winter when solar radiation scattering peaks. Moreover, countries in sun-drenched regions can leverage dye concentrators to bolster PV cell efficiency. Key attributes of the dye concentrators include high stability, efficient solar radiation focus on PV systems, and prolonged usability. This technology aids in reducing material consumption in silicon cell production, thus minimizing environmental impact and lifecycle waste.
The results presented in this study highlight the potential of dye concentrators, particularly in the form of luminescent PMMA. Efficiency improvements were obtained for each of the silicon cell and PMMA combinations tested. The most favorable variant was the system with red luminescent PMMA, for which an average increase of 1.21% was achieved. The second result was obtained for the variant using yellow-pigmented PMMA. In this case, the average increase in performance was 0.39%. The least beneficial systems were those with red-pigmented PMMA (0.13% average efficiency improvement) and yellow, luminescent PMMA (0.24% average efficiency improvement).
Although seemingly modest, it should be noted that this solution can be seamlessly integrated into existing silicon photovoltaic technology commonly used in the power sector. Questions need to be answered regarding the integration of this technology into whole photovoltaic modules. Given that module efficiency is theoretically limited by the efficiency of the weakest cell, increasing the efficiency of multiple cells may not yield the desired results. In addition, both the concentrator and the module must be carefully maintained to prevent damage that could reduce performance. This highlights the importance of ongoing research and development to optimize the effectiveness of this technology in real-world applications.
Author Contributions
Conceptualization, E.B. and B.M.; methodology, B.M.; validation, E.B., B.M. and A.W.; formal analysis, E.B.; investigation, B.M. and A.W.; resources, B.M. and A.W.; data curation, B.M.; writing—original draft preparation, B.M. and A.W.; writing—review and editing, E.B.; visualization, A.W.; supervision, E.B. All authors have read and agreed to the published version of the manuscript.
Funding
Research funded by the statutory research by the Faculty of Energy and Environmental Engineering, Silesian University of Technology.
Data Availability Statement
The original contributions presented in the study are included in the article, further inquiries can be directed to the corresponding author.
Conflicts of Interest
Author Bartłomiej Milewicz was employed by the company Huta Bankowa. The remaining authors declare that the research was conducted in the absence of any commercial or financial relationships that could be construed as a potential conflict of interest.
References
- Ortega-Izquierdo, M.; Del Rio, P. Benefits and costs of renewable electricity in Europe. Renew. Sustain. Energy Rev. 2016, 61, 372–383. [Google Scholar] [CrossRef]
- Korzeniowska, E.; Tomczyk, M.; Pietrzak, Ł.; Hadziselimovic, M.; Stumberger, B.; Sredensek, K.; Seme, S. Efficiency of Laser-Shaped Photovoltaic cells. Energies 2020, 13, 4747. [Google Scholar] [CrossRef]
- Singh, R.; Kumar, S.; Gehlot, A.; Pachauri, R. An imperative role of sun trackers in photovoltaic technology: A review. Renew. Sustain. Energy Rev. 2018, 82, 3263–3278. [Google Scholar] [CrossRef]
- Roberson, J.; Riggs, B.; Islam, K.; Vera Ji, Y.; Spitler, C.M.; Gupra, N.; Krut, D.; Ermer, J.; Miller, F.; Codd, D.; et al. Field Testing of spectrum-splitting transmissive concentrator photovoltaic module. Renew. Energy 2019, 139, 806–814. [Google Scholar] [CrossRef]
- Davis, A. Fresnel lens solar concentrator derivations and simulations. In Novel Optical Systems Design and Optimization XIV; International Society for Optics and Photonics: Bellingham, WA, USA, 2011; Volume 8129, p. 81290. [Google Scholar]
- Masood, F.; Mohd Nor, N.B.; Elamvazuthi, I.; Saidur, R.; Alam, M.A.; Akhter, J.; Yusuf, M.; Ali, S.M.; Sattar, M.; Baba, M. The compound parabolic concentrators for solar photovoltaic applications: Opportunities and challenges. Energy Rep. 2022, 8, 13558–13584. [Google Scholar] [CrossRef]
- Aftab, S.; Iqbal, M.Z.; Hussain, S.; Kabir, F.; Hegazy, H.H.; Goud, B.S.; Aslam, M.; Xu, F. MXene-modified electrodes and electrolytes in dye-sensitized solar cells. Nanoscale 2023, 15, 17249–17269. [Google Scholar] [CrossRef] [PubMed]
- Mai, R.; Wu, X.; Jiang, Y.; Meng, Y.; Liu, B.; Hu, B.; Roncali, J.; Zhou, G.; Liu, J.-M.; Kempa, K.; et al. An efficient multi-functional material based on polyether-substituted indolocarbazole for perovskite solar cells and solution-processed non-doped OLEDs. J. Mater. Chem. A 2019, 7, 1539–1547. [Google Scholar] [CrossRef]
- Xu, A.F.; Liu, N.; Xie, F.; Song, T.; Ma, Y.; Zhang, P.; Bai, Y.; Li, Y.; Chen, Q.; Xu, G. Promoting thermodynamic and kinetic stabilities of FA-based perovskite by an in situ bilayer structure. Nano Lett. 2020, 20, 3864–3871. [Google Scholar] [CrossRef]
- Goetzberger, A.; Hebling, C. Photovoltaic materials, past, present, future. Sol. Energy Mater. Sol. Cells 2000, 62, 1–19. [Google Scholar] [CrossRef]
- Esen, V.; Saglam, S.; Oral, B. Light sources of solar simulators for photovoltaic devices: A review. Renew. Sustain. Energy Rev. 2017, 77, 1240–1250. [Google Scholar] [CrossRef]
- Kenny, R.P.; Viganó, D.; Salis, E.; Bardizza, G.; Norton, M.; Müllejans, H. Power rating of photovoltaic modules including validation of procedures to implement IEC 61853-1 on solar simulators and under natural sunlight. Prog. Photovolt. Res. Appl. 2013, 21, 1384–1399. [Google Scholar] [CrossRef]
- El Himer, S.; El Ayane, S.; El Yahyaoui, S.; Salvestrini, J.P.; Ahaitouf, A. Photovoltaic concentration: Research and development. Energies 2020, 13, 5721. [Google Scholar] [CrossRef]
- Moraitis, P.; Schropp, R.E.I.; van Sark, W.G. Nanoparticles for Luminescent Solar Concentrators—A review. Opt. Mater. 2018, 84, 636–645. [Google Scholar] [CrossRef]
- Hasan, A.; McCornack, S.J.; Huang, M.J.; Norton, B. Evaluation of phase change material for thermal regulation enhancement of building integrated photovoltaics. Sol. Energy 2010, 84, 1601–1612. [Google Scholar] [CrossRef]
- McKenna, B.; Evans, R.C. Towards efficient spectral converters through materials design for luminescent solar devices. Adv. Mater. 2017, 29, 1606491. [Google Scholar] [CrossRef] [PubMed]
- Brennan, L.J.; Purcell-Milton, F.; McKenna, B.; Watson, T.M.; Gun’ko, Y.K.; Evans, R.C. Large area quantum dot luminescent solar concentrators for use with dye-sensitised solar cells. J. Mater. Chem. A 2018, 6, 2671–2680. [Google Scholar] [CrossRef]
- El-Bashir, S.M. Enhanced fluorescence polarization of fluorescent polycarbonate/zirconia nanocomposites for second generation luminescent solar concentrators. Renew. Energy 2018, 115, 269–275. [Google Scholar] [CrossRef]
- Baiju, A.; Yarema, M. Status and challenges of multi-junction solar cell technology. Front. Energy Res. 2022, 10, 971918. [Google Scholar] [CrossRef]
- Zhou, Y.; Benetti, D.; Fan, Z.; Zhao, H.; Ma, D.; Govorov, A.O.; Vomiero, A.; Rosei, F. Near infrared, highly efficient luminescent solar concentrators. Adv. Energy Mater. 2016, 6, 1501913. [Google Scholar] [CrossRef]
- Canavarro, D.; Chaves, J.; Collares-Pereira, M. New second-stage concentrators (XX SMS) for parabolic primaries; Comparison with conventional parabolic trough concentrators. Sol. Energy 2013, 92, 98–105. [Google Scholar] [CrossRef]
- Zhou, W.; Wang, M.-C.; Zhao, X. Poly(methyl methacrylate) (PMMA) doped with DCJTB for luminescent solar concentrator applications. Sol. Energy 2015, 115, 569–576. [Google Scholar] [CrossRef]
- Aghaei, M.; Pelosi, R.; Wong, W.W.H.; Schmidt, T.; Debije, M.G.; Reinders, A.H.M.E. Measured power conversion efficiencies of bifacial luminescent solar concentrator photovoltaic devices of the mosaic series. Prog. Photovolt. 2022, 30, 726–739. [Google Scholar] [CrossRef]
- Grandi, G.; Ienina, A. Analysis and realization of a low-cost hybrid LED-halogen solar simulator. In Proceedings of the IEEE International Conference on Renewable Energy Research and Applications (ICRERA), Madrid, Spain, 20–23 October 2013; pp. 794–799. [Google Scholar]
| Disclaimer/Publisher’s Note: The statements, opinions and data contained in all publications are solely those of the individual author(s) and contributor(s) and not of MDPI and/or the editor(s). MDPI and/or the editor(s) disclaim responsibility for any injury to people or property resulting from any ideas, methods, instructions or products referred to in the content. |
© 2024 by the authors. Licensee MDPI, Basel, Switzerland. This article is an open access article distributed under the terms and conditions of the Creative Commons Attribution (CC BY) license (https://creativecommons.org/licenses/by/4.0/).


