Abstract
In the age of energy transition that we are going through today, many research studies discuss how to develop various approaches to making forecasts aimed at obtaining quantitative assessments of the technical and economic indicators of the energy industry. This paper considers the adaptation of a comprehensive approach to forecasting the structure of energy generation based on the factor and trend approach and using autoregressive and multifactor models that apply a linear regression tool with ridge regularization. To implement this approach, we propose a tool for automated selection of the factors that have the most significant impact on the change in the structure of energy generation. This approach allows us to forecast the dynamics of electricity generation by different types of generating facilities as affected by the key factors in energy transition in the short, medium, and long term. As a result, we obtained quantitative relationships for the energy generation structure. Over the next 10 years, the share of generation using renewable energy sources will increase to 10%, and the share of thermal power plants, on the contrary, will decrease to 50%, despite the growth in demand for electricity. Also, greenhouse gas emissions will be reduced by 30%. We have also provided scientific justification for the sufficient reliability of the forecasts we present.
1. Introduction
The world economy is developing in the age of the fourth energy transition, which sees advanced production and digital technologies, the economic attractiveness of new energy sources on the one hand, and the emergence of qualitatively new factors—decarbonization trends and the fight against global climate change—on the other. The emergence and active growth of technological and digital innovations on both the generation and consumption sides of the energy sector are leading to a gradual but deep transformation of the entire fuel and energy sector (FES) [1,2,3,4].
One of the fundamental elements of the energy transition is the rapid spread of electricity and heat generation technologies based on non-conventional renewable energy sources (NCRE): solar, wind power plants, small hydropower plants (up to 10–15 MW), tidal, wave and geothermal plants [5,6,7,8]. The modern transformation of energy markets is largely caused by the appearance and development of commercially efficient renewable energy sources [9,10]. The Skolkovo report [2] notes a tendency to reduce the total present costs of electricity generation based on various RES technologies by 20–50% depending on the scenario of FEC development (conservative, innovative, energy transition-based scenarios) [5].
As a result of the advances in renewable energy technologies, the structure of energy generation is changing [11,12,13,14,15]. There is a gradual shift of energy generation in the overall structure towards increasing the share of renewable energy sources. At the same time, it is obvious that the structure of energy generation in different countries will vary significantly, taking into account the available natural reserves of carbon fuels and the policy pursued at the state level [5,16,17,18,19,20], the general level of economic development, production and digital technologies, specific climatic conditions, etc. It should be noted that energy consumption data are the basis for laying down the requirements for the amounts of energy to be generated. Correspondingly, there is a need for continuous monitoring of the current situation while forecast models should be developed to reduce uncertainty in energy generation. Having significant reserves of carbon energy sources, a large territory, and climate conditions suitable for using renewable energy sources, Russia finds it extremely important to forecast the structure of energy generation (with different planning horizons), taking into account some relevant factors.
Forecasting can be for short-term (e.g., forecasting power generation over several years), medium-term (e.g., a 1–2 year forecast says how the power system will behave in several years), and long-term (how much the structure of power generation will change over a long period of time). It can help us to assess the impact of various factors—technological, social, political, economic, and environmental ones—on the structure of power generation in further research. The results of the forecasts are important for managing the strategic development of energy generation.
The purpose of the study is to formulate a forecast of the structure of energy generation in the age of energy transition based on the automated determination of factor significance.
The paper provides an overview of the current state of energy generation in the Russian Federation and describes existing approaches to analyzing and obtaining forecasts in this area. Based on the conducted research, we have proposed an approach to predicting the structure of energy generation at different planning horizons, which takes into account such important factors as the Generation volume of the TPPs, NPPs, HPPs, RES, Heat generation, Power grid losses, Fuel and energy production, Greenhouse gas emissions, etc. The acceptable accuracy of the presented forecast was justified, taking into account different planning horizons.
2. Materials and Methods
2.1. Overview of the Fourth Energy Transition Causes: Climate Change, Technology Development, Digital Technology Development
At the stage of the fourth energy transition, differently from the previous three stages, the main driver is not only the economically attractive combination of traditional and new energy sources but also a qualitatively new factor—decarbonization and the fight against global climate change [1,2].
The global energy landscape is undergoing significant changes caused by a combination of such drivers (factors) as climate change and technological advances, including new technologies for electricity generation, distribution, storage, and the growth of digital technologies (Figure 1). These factors have combined to pave the way for the fourth energy transition. The key aspect of the fourth energy transition is the shift towards cleaner and more long-term relevant energy sources. Let us analyze the causes of the fourth energy transition in more detail.
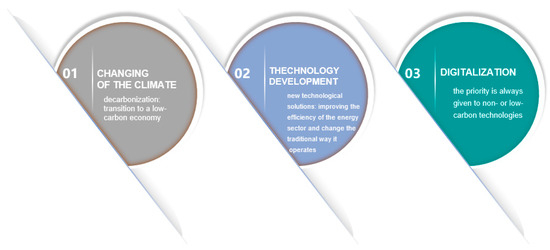
Figure 1.
Causes of the fourth energy transition.
- Climate change.
The urgency of combating climate change is a key driver of the fourth energy transition. The Paris Agreement [1], signed in 2015 by 195 countries, is the main document that sets out the need for action to limit global warming to well below 2 °C, preferably 1.5 °C, by reducing greenhouse gas emissions. It is widely believed that in order to achieve this goal, there has to be a significant shift from fossil fuels to renewable energy sources. The negative impacts of climate change, such as rising sea levels, extreme weather conditions, and ecosystem degradation, have further increased the urgency of the transition to low-carbon energy systems [21].
- 2.
- Technological advances.
Advances in energy technologies are crucial for the fourth energy transition. The rapid development and declining cost of renewable energy sources such as solar and wind power have made them increasingly competitive with traditional fossil fuels. Improvements in energy storage technologies, such as lithium-ion batteries, have made it possible to better integrate non-conventional renewable energy sources into the grid. In addition, advances in energy-efficient technologies have contributed to reducing energy consumption, minimizing the need for additional generating capacity [22]. The deployment of smart grids, advanced metering systems, and demand response technologies have also paved the way for more flexible, resilient, and decentralized energy systems.
- 3.
- Development of digital technologies.
New digital technologies have become an important driver of the fourth energy transition. The integration of digital technologies into the energy sector has led to the creation of smart energy systems. This has enabled real-time monitoring, control, and optimization of energy infrastructure, resulting in improved efficiency, reliability, and sustainability. The installation of sensors, Internet of Things (IoT) devices, cloud-based distributed power plants, and analytic platforms enables better management of demand, identification of energy-intensive processes, and optimization of energy distribution. Moreover, digitalization facilitates the efficient grid integration of distributed energy resources such as rooftop solar panels, electric vehicles, and energy storage systems.
The fourth energy transition opens up significant economic and social opportunities (job creation, improved air quality, energy access for low-income populations, etc.) [2,13,23] and promises a sustainable energy future.
2.2. Specifics of the Russian Economy and Energy System during the Energy Transition
Russia is one of the largest exporters of fuel and energy resources. The extraction of fuel and energy resources (FER) in the Russian Federation not only provides for a significant share of the state budget revenues but also fully meets the needs of domestic consumption. The generating sector of the Russian Federation consists of NPP, TPP, HPP, and RES generation facilities. The main share of the installed capacity is TPPs, accounting for more than 60%, with RES being less than 3%. The Unified Energy System of Russia (UES of Russia) consists of 71 regional energy systems, which, in turn, form seven united energy systems: East, Siberia, Urals, Middle Volga, South, Centre, and North-West. All energy systems are connected with inter-system high-voltage power lines of 220–500 kV or higher and operate in synchronous mode (in parallel). In addition to the unified energy system, there are technologically isolated systems in the Far East [24].
One of the priorities of the Energy Strategy of Russia until 2035 is “to stimulate and support innovative activities of organizations of the fuel and energy complex and related industries towards improving the efficiency of FER and the production potential of the fuel and energy complex”, which implies preserving and strengthening the carbon energy sector. However, this strategy also implies minimizing the negative impact on the environment, climate, and human health caused by the extraction, production, transportation, and consumption of energy resources, which is one of the objectives of the energy transition. This trend is confirmed in the Digital Energy Project adopted in 2017. It is aimed at transforming the energy infrastructure of the Russian Federation through the introduction of digital technologies and platform solutions to improve its efficiency and security, which is also one of the aspects of the energy transition.
Russian consumers are provided with cheap electricity and, in this respect, are among the most privileged in the world. Since the beginning of the global energy crisis in the second half of 2021, Russia’s position has only strengthened [3]. It is worth mentioning that according to the Ministry of Energy, it is likely that by 2035, RES-based power plants will eventually increase electricity generation by more than 20 times, which is another driver of the energy transition. In order to have a smooth transition to non-carbon energy, the Russian energy sector should initially focus on increasing the rate of technological development of the following technologies:
- Technologies for making electronic components for microprocessor-based diagnostics and sensor systems, communication systems, ACS systems, RPA (Relay protection and automation system) and ES (Emergency system);
- Digital technologies: electricity demand management, digital twins, Smart Houses, Smart Grid (including smart metering and real-time network monitoring), Smart Cities, and others to ensure system security during the transition to a low-carbon economy. This will bring about greater budget revenues thanks to advanced energy-efficient technologies and will reduce the dependence on the resource-based economy.
2.3. Overview of Approaches to Forecasting the Energy Generation Mix Taking into Account the Impact of Energy Transition Factors
In order to forecast the target structure of the fourth energy transition, we have to predict the changes in the energy mix, technologies, policies, and market dynamics that will shape the future energy landscape. One of the important components of energy mix forecasting is energy generation mix forecasting.
In order to produce energy generation mix forecasts, predictive analytics methods based on available historical and current data should be used. Depending on the completeness of the data and the required forecasting horizons, different approaches can be used for forecasting: trend or factor-based approaches or their combinations [25,26] (Figure 2).
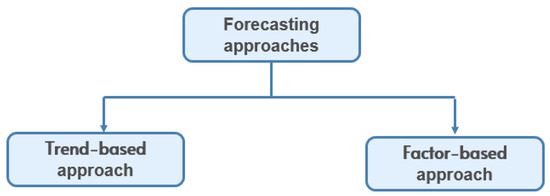
Figure 2.
Approaches to forecasting the consequences of the trend.
The trend-based method relies on the analysis and prediction of trends and patterns in the historical behavior of the energy generation and consumption market. It is typically used for short-term forecasting (up to three years) and predicting future changes in energy prices and consumption. When using this method, analysts examine historical data on energy prices, consumption figures, weather conditions, and other factors to identify patterns and trends in market behavior. They then use this data to make predictions about the future. A trend-based method can help us to identify changes in energy supply and demand over a short-term time horizon. Thus, energy companies can make effective decisions in production planning and resource procurement.
The factor-based method implies the identification and analysis of factors affecting the behavior and changes in the energy production and consumption market. It is typically used for medium-term forecasting and predicting longer-term trends and events such as economic and political factors, technological innovations, climate change, etc. Analysts use this method to identify and assess how various factors influence the electricity generation and consumption market as well as to predict its future development. The factor-based method allows companies and countries to make strategic long-term decisions related to the development of the energy sector and the optimization of its structure.
Both of the methods have their advantages and limitations and can be used in combination for more accurate forecasts in the energy sector [27,28]. In this study, we use the trend method for a short-term forecast (three years). Then, based on the short-term forecast, we make a medium-term forecast using the factor approach.
2.4. Forecasting Methodology Overview
To successfully resolve the problem of forecasting the structure of energy generation and assess the effects of the energy transition, we should understand what approach is best given the data available to make the forecast and choose the forecast horizon (short-term, medium-term, long-term). For this purpose, we analyzed the existing models, forecast types, and approaches. Table 1 presents the results of the analysis. We propose a number of modeling methods capable of describing the structure of power generation by forecasting time series that contain historical information on the total power generation volumes of different types of generating facilities. The models are also categorized according to the forecasting approach.

Table 1.
Classification of time series forecasting and clustering models by used methods.
Now, we consider two main model-building methodologies: SARIMA model-building methodology and multifactor ridge regression model-building methodology.
2.4.1. SARIMA Model Building Methodology
A general view of the SARIMA equation:
where:
- is an autoregressive operator of the p-order, which denotes the dependence of the current value in the time series yt on p previous values of this series, with lags from 1 to P, where L is the lag operator that shifts the time series one period forward;
- is a seasonal autoregressive operator of the P-order, it is applied to the seasonal component of the data with lags from s to sP, where s is the seasonality period defined before;
- is a difference operator for time series and seasonal components of d-order and D-order;
- is the observed values of the animal time series;
- A(t) is the time loss function;
- is the moving average operator of the q-order;
- is the seasonal moving average operator;
- is the time series error in time.
Table 2 summarizes the steps in building the SARIMA model.

Table 2.
Steps for building a SARIMA model.
2.4.2. Methodology of Building a Multifactor Ridge Regression Model
A general view of the Ridge regression equation is as follows:
where:
- is the displacement component;
- are the regression coefficients;
- are factors;
- is a regularization parameter
Table 3 summarizes the steps in building the SARIMA model.

Table 3.
The steps for building the multivariate ridge regression model.
3. Results
3.1. Factors Influencing the Structure of Energy Generation in the Russian Federation
The structure of the energy transition depends on an interrelated sequence: the technological direction of the energy transition ensures the development of a corresponding trend of the energy transition. The trend and its development determine the scale of the consequences of the energy transition.
One of the energy transition trends is the changing structure of energy generation. The relevance of generation structure forecasting can be explained by the following factors:
- The need for long-term planning of energy strategy, development of industry policies;
- The integration of renewable energy sources and energy-efficient technologies;
- The need to maintain energy balance between generation sources;
- The need for a more efficient energy economy;
- The need to comply with international energy agreements;
- Planning of electricity markets;
- Introduction of new capacities n into the energy system.
In order to forecast the structure of energy generation, we consider the factors that may affect it and substantiate the choice of the forecasting methods used in the study. On the basis of this research and the forecasts obtained, we analyze the structure of energy generation and possible consequences during the fourth energy transition.
Analyzing the structure of energy generation allows us to consider whether the share of hydrocarbons is going down and the use of non-fuel energy sources is increasing. In this regard, it is necessary to forecast the volume and structure of energy generation and then analyze and evaluate some consequences of the energy transition:
- How the diversification level of the energy consumption structure will change due to a more active use of renewable energy sources (technological consequence);
- How the air pollution level will decrease due to the reduced greenhouse gas emissions in the global economy as a whole and in individual regions and large cities as part of the fight against climate change;
- How the full present value of electricity generation costs based on different res technologies will change depending on the type of scenario.
Let us consider the factors influencing the structure of energy generation in the Russian Federation. We have identified five main types of factors and further elaborated on each type. Table 4 shows the result.

Table 4.
Factors influencing the structure of energy generation in the Russian Federation.
It is obvious that taking these factors into account when forecasting the structure of energy generation implies the use of various mathematical models with a certain planning horizon. Thus, it is possible to pick up the most significant factors among the identified that have a big impact on the forecasting results and to appraise the values of the forecasted power generation with a given accuracy. Then, the results obtained can be used to make decisions on modifying the structure of energy generation, including with due regard to the energy consumption needs. The factors are selected depending on the availability of statistical data. After the factors for the forecasting are defined and classified, it is necessary to search for statistical data that contain information about the factors in Table 4. Table 5 presents the variables that were found on Rosstat, the official statistics website of the Russian Federation [29].

Table 5.
Endogenous and exogenous parameters.
3.2. Forecasting Methodology Implementing
Depending on the planning horizon, quality, and volume of the data on which the forecast model is being built, we have chosen a certain methodology based on the combination of methods from Table 4. The SARIMA model was chosen for short-term forecasting of the electricity generation mix due to the completeness of the data as well as the accuracy of this popular model. The frequency of the time series is monthly, and the length is the time interval from 2005 to 2023. SARIMA allows for seasonality by including seasonal lags in the model. In addition, the power generation time series has autocorrelation, with SARIMA including autoregressive components to account for this dependence. Since the initial data are non-stationary (have trend or seasonal changes), this model is capable of differentiation and bringing the series to a stationary form. It is also worth noting that SARIMA has a clear mathematical form, which allows one to interpret the impact of different components on the forecasts.
The next step is medium- and long-term forecasting. Due to the annual frequency of time series, justified by strategic planning for a long period of time (10 years), Ridge regression, a variation of linear regression, which is adapted for data with high multicollinearity, was chosen as a modeling tool. Figure 3 shows the heat map of the correlations in the data.
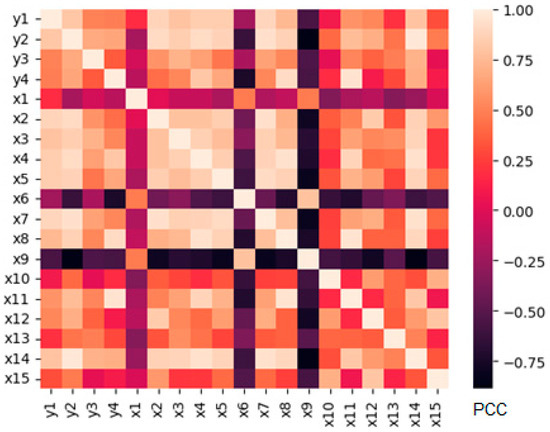
Figure 3.
Parameter correlation heat map.
Figure 3 shows the correlation between the predicted values and the factors influencing them. The correlation heat map gives an understanding of multicollinearity and the need to introduce ridge regularization into the model, as well as exclude some factors. As we can see in Figure 3, multicollinearity by the Pearson correlation coefficient (PCC) is strong. If we model the generation structure, the loss of influential factors is undesirable, so in order to avoid overfitting and worsening the predictive ability of the model, the regression coefficients in this method are “penalized” with an additional coefficient. Thus, the Ridge regression can avoid overfitting and, at the same time, consider all factors of interest.
The final methodology of full forecasting implies a combination of the trend and factor approach. The SARIMA model is used for short-term forecasting, while the multifactor regression model is helpful for medium- and long-term forecasting, which allows the most accurate description of the RF generation structure that considers many influencing factors. The relevance of this approach is due to the nature of the structure of energy generation in Russia. In the short term, statistical data with monthly frequency can most accurately describe the models based on the trend approach, whereas a longer forecast should consider the influence of external factors and use the factor approach, given the annual frequency of time series and the need to select more significant factors, so the best tool is a multifactor multiple regression model that uses regularization.
Let us consider the construction of forecast models of the energy generation structure based on a combination of trend and factor approaches.
3.2.1. Trend Approach: SARIMA Model Building Methodology
To perform the forecast, we used a combination of two approaches: the trend approach and the factor approach. Let us consider in more detail the use of these approaches for forecasting energy generation in the Russian Federation.
Below is an example of modeling results (Figure 4, Figure 5, Figure 6 and Figure 7). The SARIMAX package of the Statsmodels Library was chosen as the tool. In Figure 4, one can see the time series analysis plots for determining the data stationarity.
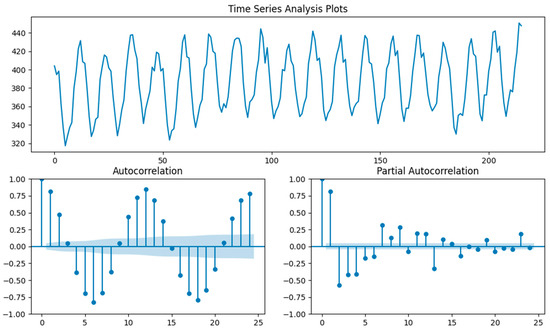

Figure 4.
Determining the data stationarity. Each blue dot represents a partial autocorrelation value for a specific lag. The light blue area shows the significant threshold value.
Next, we present the results of the model training and evaluation of the results obtained (Figure 5).
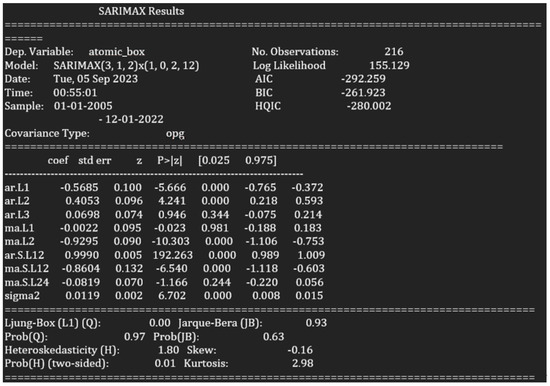

Figure 5.
Results of model training and evaluation.
Figure 6 shows the error statistics.
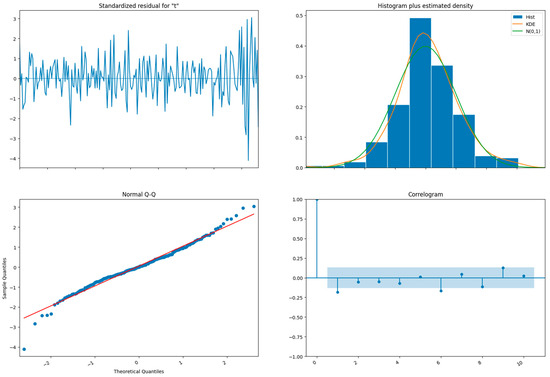

Figure 6.
Error statistics. The red horizontal line is at zero on the remainder chart. If the points on the correlogram lie within confidence intervals, this indicates the absence of autocorrelation in the residuals. The light blue area shows the significant threshold value.
Next, we compared the present model with the real data and forecast values for 36 months (Figure 7).
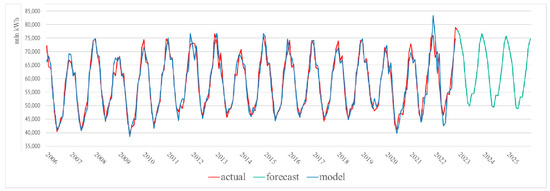

Figure 7.
Comparison of the model with real data and forecast values for 36 months.
One can see that the model values are very close to the real data values. We selected the model parameters using the cross-variation method, where the main criterion was the information criterion AIC, presented in Figure 5; that is, by repeatedly running the modeling process with different parameters, we selected the best combination of them. The model with the lowest AIC among others was selected. The results allow us to conclude that the chosen method and the variables taken into account in the model allow us to make a quite accurate forecast over a planning horizon of 36 months.
3.2.2. Factor Approach: Methodology of Building a Multifactor Ridge Regression Model
Below is an example of the modeling result of one iteration for one variable.
To explain the mechanism of the multifactor model operation, we can use the following visual representation of the one-iteration forecast result. Figure 8 shows a heat map of the correlation between factors and predicted variables. We used the Pearson correlation coefficient (PCC) as a coefficient (Figure 9).
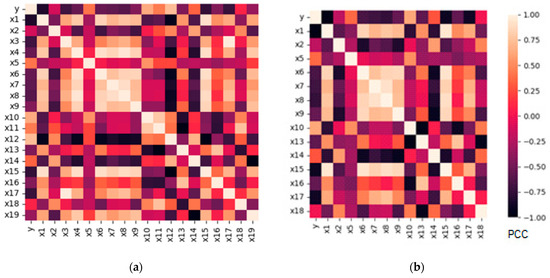
Figure 8.
(a) The following is a visual representation of one iteration forecast result: before; (b) the following is a visual representation of one iteration forecast result: after.

Figure 9.
Exogenous variables: scaling and normalization.
After training and visualizing the results, we evaluated the final model (Figure 10). For the above example, the root mean square error (RMSE) was 0.47 units, which indicates the model’s accuracy since RMSE is measured in the same units as the modeled parameter.
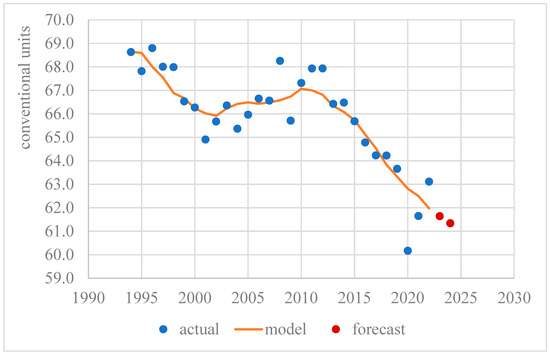
Figure 10.
The multiple regression model (): training and evaluation.
3.2.3. Analysis of the Forecasting Results
The dynamics of changes in the structure of energy generation in the Russian Federation imply a change in the ratio of electricity generation by different types of power plants. The resulting forecasts allow us to make assumptions and adjust strategies and policies that describe the future of the fuel and energy complex. The goals set by the state energy development program [30] directly affect the consequences of the energy transition. The forecasts below correlate with the Energy Development Program policy. The results presented in the paper are a forecast of the energy transition that takes into account the trends reflecting its main goals. It should be noted that, in accordance with the goals of energy transition, the forecasts made with this model consider the quantitative restrictions imposed on the dynamics of hydrocarbon consumption.
Figure 11 shows the forecast results of the final model.
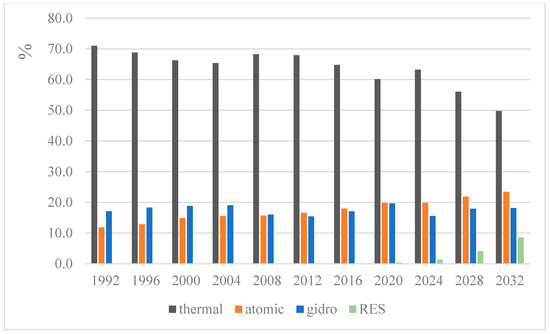
Figure 11.
The structure of electricity generation in the Russian Federation.
The diagram presented in Figure 11 shows the structure of electricity generation in Russia in the 10-year horizon. The generation by thermal power plants will decrease to 49.8% by 2033 compared to 64% in 2023 in total electricity generation, while RES generation will fall to 10%.
The reduction in energy production using thermal power plants occurs largely due to an increase in the energy efficiency of generating and network facilities in the energy complex. The use of advanced technologies, process optimization, and improved energy infrastructure contribute to the efficient use of resources, which reduces the need for thermal power plants. The growth in the share of nuclear energy is due to the introduction of new nuclear power generation facilities, which include modern nuclear power plants with improved safety systems and maximizing the power utilization factor of these plants. This increase in efficiency and safety makes nuclear energy more attractive than other energy sources. The use of hydroelectric power remains about the same as the development of other renewable energy sources, such as wind and solar, poses competition to hydropower. Pressures from digitalization trends and the energy transition will drive significant growth in renewable energy sources. This trend is already evident in data that show a steady increase in the use of wind and solar energy, supported by the desire for clean energy sources in response to the global challenges of climate change and reductions in greenhouse gas emissions.
These results indicate structural diversification, where carbon energy is actively complemented by non-carbon energy.
Greenhouse emissions resulting from the use of fuel and energy resources in the energy sector will decrease by more than 30% relative to 2022 due to reduced generation from thermal power plants and the introduction of more energy-efficient technologies (Figure 12).
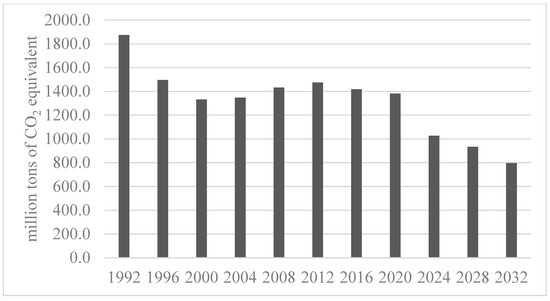
Figure 12.
Energy-related greenhouse emissions in the Russian Federation.
Forecasting greenhouse emissions is carried out using the same methodology as forecasting the energy generation mix. In this context, generation from thermal power plants (TPP) is considered an exogenous variable, that is, as a factor that explains changes in greenhouse gas emissions.
Figure 13 shows the national consumption of fuel and energy resources in the country.
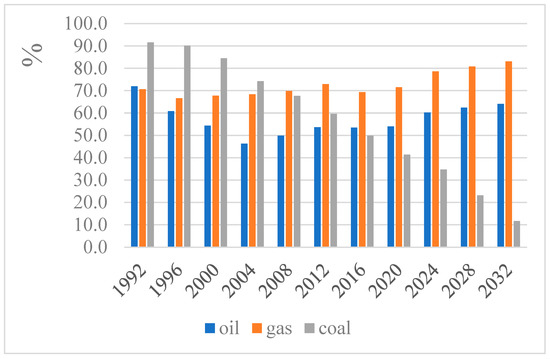
Figure 13.
Domestic consumption of fuel and energy resources.
The trend of reducing coal consumption, as the most carbon-intensive fuel in terms of greenhouse gas emissions, will lower the rate of climate change. Also, a large share of coal is exported to countries where the energy system based on coal-fired thermal power plants (TPP) has a privileged position. Yet, the development of new oil and gas complexes in the Arctic and Far East will stimulate domestic consumption of petroleum products and natural gas. Another factor affecting the need for natural gas is the regional gasification program [31] and the modernization program for coal-fired thermal power plants.
As a result of this study, the structure of electricity generation in the Russian Federation was predicted using a mathematical model that had been developed in the Python 3.10.10 programming language and combining trend and factor approaches to forecasting. We identified the main trends, looked at the dynamics of the energy transition, and considered the factors influencing the generation structure, which were included in a multifactor model for a forecast over a 10-year horizon. The results obtained can be the basis for investigating the fuel and energy complex in the context of energy transition, identifying risks, and putting forward recommendations.
4. Conclusions
This study pays much attention to climate change and the development of cutting-edge energy generation technologies. These two aspects are closely interrelated and have a considerable influence on the evolution of energy systems. At the same time, forecasts of the energy sector should consider the influence of economic trends and factors in different countries. In this regard, it is very important to make forecasts of the structure of energy generation in individual countries. As a result of the research carried out in the article, we substantiated the importance of forecasting energy generation, which is one of the components of forecasting for the future assessment of the consequences of the fourth energy transition. We analyzed the factors influencing the structure of energy generation: the volume of generation of thermal power plants, nuclear power plants, hydroelectric power plants, renewable energy sources, heat generation, losses in power grids, production of the fuel and energy complex, greenhouse gas emissions, etc. We collected data in order to use them when training the created model and forecasting. The model was created based on the use of two approaches: trend and factor approaches. As a result of our research, we proposed an approach to forecasting the structure of energy generation at different planning horizons, which, from our point of view, takes into account the above factors. We also justified the acceptable accuracy of the presented forecast, taking into account different planning horizons.
5. Discussion
Despite much research and development in the field of RES used for power generation, we find it necessary to take into account the opportunities for technological development and modernization of traditional generating facilities. These factors are crucially important for making forecasts and developing strategies in the energy sector. The results of forecasting in this work can serve as one of the bases for predicting the technological development of the energy industry. Thus, we can consider the requirements originating from climate change. In addition to the econometric models, this paper focuses on the expediency of applying ML methods, which are planned to be used in the future to forecast energy consumption and determine the energy balance. Also, a very important question is how government policies in different countries affect the structure of energy consumption and the structure of energy resources obtained because of energy production.
Author Contributions
Conceptualization, I.V.I.; methodology, I.V.I. and O.Y.I.; software, E.M.S.; validation, O.Y.I. and E.M.S.; formal analysis, O.Y.I. and E.M.S.; investigation, I.V.I. and E.M.S.; resources, O.Y.I.; data curation, O.Y.I. and E.M.S.; writing—original draft preparation, O.Y.I. and E.M.S.; writing—review and editing, I.V.I.; visualization, E.M.S.; supervision, I.V.I.; project administration, I.V.I. and O.Y.I.; funding acquisition, I.V.I. All authors have read and agreed to the published version of the manuscript.
Funding
The research was supported by the Ministry of Science and Higher Education of the Russian Federation (Agreement No. 075-15-2022-1136 dated 1 July 2022).
Data Availability Statement
Data are contained within the article.
Acknowledgments
This paper and the research behind it would not have been possible without the support of the megagrant program of the Ministry of Science and Higher Education and partners of Lab CIRETEC-GT.
Conflicts of Interest
The authors declare no conflict of interest. The funders had no role in the design of the study, in the collection, analyses, or interpretation of data, in the writing of the manuscript, or in the decision to publish the results.
References
- The Paris Agreement. Available online: https://www.europarl.europa.eu/RegData/etudes/BRIE/2016/573910/EPRS_BRI%282016%29573910_EN.pdf (accessed on 6 April 2023).
- Makarov, A.A.; Mitrova, T.A.; Kulagin, V.A. Development Forecast World and Russian Energy Sector 2019; INEI RAS—Moscow School of Management SKOLKOVO: Moscow, Russia, 2019; 210p, ISBN 978-5-91438-028-8. [Google Scholar]
- Energy Strategy of the Russian Federation for the Period until 2035. Available online: https://minenergo.gov.ru/node/1026?ysclid=lmxa2fwdv4884157398 (accessed on 10 April 2023).
- bp Energy Outlook, 2023 Edition. Available online: https://www.bp.com/ (accessed on 12 April 2023).
- Carvajal, P.E.; Miketa, A.; Goussous, N.; Fulcheri, P. Best Practice in Government Use and Development of Long-Term Energy Transition Scenarios. Energies 2022, 15, 2180. [Google Scholar] [CrossRef]
- IRENA. World Energy Transitions Outlook: 1.5 °C Pathway; International Renewable Energy Agency: Abu Dhabi, United Arab Emirates, 2021; Available online: https://www.irena.org/publications/2021/Jun/World-Energy-Transitions-Outlook (accessed on 23 April 2023).
- Mitrova, T.; Melnikov, Y. Energy Transition in Russia. Energy Transit. 2019, 3, 73–80. [Google Scholar] [CrossRef]
- Zhdaneev, O.V. Russian fuel and energy complex technology policy at the moment of energy transition. Eurasian Min. 2022, 1, 13–19. [Google Scholar] [CrossRef]
- Marzi, E.; Morini, M.; Cambarotta, A. Analysis of the Status of Research and Innovation Actions on Electrofuels under Horizon 2020. Energies 2022, 15, 618. [Google Scholar] [CrossRef]
- Strielkowski, W.; Sherstobitova, A.; Rovny, P.; Evteeva, T. Increasing Energy Efficiency and Modernization of Energy Systems in Russia: A Review. Energies 2021, 14, 3164. [Google Scholar] [CrossRef]
- IRENA. Planning and Prospects for Renewable Power: Eastern and Southern Africa. 2021. Available online: https://www.irena.org/publications/2021/Apr/Planning-and-prospects-for-renewable-power-Eastern-and-Southern-Africa (accessed on 26 April 2023).
- Vilasboas, I.F.; Mendes da Silva, J.A.; Venturini, O.J. On the Summarization of Meteorological Data for Solar Thermal Power Generation Forecast. Energies 2023, 16, 3297. [Google Scholar] [CrossRef]
- IEA. Renewables 2022: Analysis and Forecast to 2027; International Energy Agency: Paris, France, 2022. [Google Scholar]
- Chen, C.; Pinar, M.; Stengos, T. Renewable Energy Consumption and Economic Growth Nexus: Evidence from a Threshold Model. Energy Policy 2020, 139, 111295. [Google Scholar] [CrossRef]
- Luktionov, V.I. Energy consumption, GHG emissions and quality of life: The case of Russia’s institutional transition to sustainability. Geopolit. Energy 2020, 42, 2–6. [Google Scholar]
- Halkos, G.E.; Gkampoura, E.C. Assessing Fossil Fuels and Renewables’ Impact on Energy Poverty Conditions in Europe. Energies 2023, 16, 560. [Google Scholar] [CrossRef]
- Halkos, G.E.; Gkampoura, E.C. Examining the Linkages among Carbon Dioxide Emissions, Electricity Production and Economic Growth in Different Income Levels. Energies 2021, 14, 1682. [Google Scholar] [CrossRef]
- Jena, P.R.; Managi, S.; Majhi, B. Forecasting the CO2 Emissions at the Global Level: A Multilayer Artificial Neural Network Modelling. Energies 2021, 14, 6336. [Google Scholar] [CrossRef]
- World Population Prospects: The 2017 Revision. Available online: https://www.un.org/ru/desa/world-population-prospects-2017-revision (accessed on 6 June 2023).
- United Nations, Department of Economic and Social Affairs. World Urbanization Prospects: The 2018 Revision (ST/ESA/SER.A/420); United Nations: New York, NY, USA, 2019. [Google Scholar]
- Yang, Y.; Javanroodi, K. Climate Change and Renewable Energy Generation in Europe—Long-Term Impact Assessment on Solar and Wind Energy Using High-Resolution Future Climate Data and Considering Climate Uncertainties. Energies 2022, 15, 302. [Google Scholar] [CrossRef]
- Technology Review. Carbon Capture, Utilisation and Carbon Storage (CCUS). Available online: https://unece.org/sites/default/files/2021-02/CCUS%20brochure_RU_final.pdf (accessed on 8 June 2023).
- Nikonorov, V.; Ilin, I.; Titov, A.; Timofeev, A. Digitalization of Oil Refining Process (Fuel Gas Flow Rate for Hydrotreatment). In International Scientific Conference Digital Technologies in Logistics and Infrastructure; Lecture Notes on Data Engineering and Communications Technologies; Springer: Berlin/Heidelberg, Germany, 2023; Volume 157, pp. 112–120. [Google Scholar]
- Russian Power System Operator. Available online: https://www.so-ups.ru/ (accessed on 30 April 2023).
- Svetunkov, S.G.; Svetunkov, I.S. Methods of Social-Economic Forecasting. In Theory and Methodology, 1st ed.; Textbook and Practice/Bachelor, Academic Course; Higher Education: Moscow, Russia, 2019; Volume 1. [Google Scholar]
- Svetunkov, S.G.; Svetunkov, I.G. Methods of Social-Economic Forecasting. In Models and Methods, 1st ed.; Textbook and Practice/Bachelor, Academic Course; Higher Education: Moscow, Russia, 2020; Volume 2. [Google Scholar]
- Ciaburro, G.; Iannace, G. Machine learning-based algorithms to knowledge extraction from time series data: A review. Data 2021, 6, 55. [Google Scholar] [CrossRef]
- Koronatov, N.N.; Ilin, I.V.; Svetunkov, S.G. Forecast analytics of oil products production depending on the crude oil quality on the example of OOO “KINEF”. Econ. Entrep. 2020, 9, 1033–1039. [Google Scholar]
- Official Statistical Indicators of the Russian Federation. Available online: https://fedstat.ru/ (accessed on 20 April 2023).
- State Programme of the Russian Federation “Energy Development”. Available online: https://minenergo.gov.ru/node/323?ysclid=lmnhq5ez1r18797061 (accessed on 3 June 2023).
- Russian Gasification Program of PJSC Gazprom 2021–2025. Available online: https://www.gazprommap.ru/program/ (accessed on 6 June 2023).
Disclaimer/Publisher’s Note: The statements, opinions and data contained in all publications are solely those of the individual author(s) and contributor(s) and not of MDPI and/or the editor(s). MDPI and/or the editor(s) disclaim responsibility for any injury to people or property resulting from any ideas, methods, instructions or products referred to in the content. |
© 2023 by the authors. Licensee MDPI, Basel, Switzerland. This article is an open access article distributed under the terms and conditions of the Creative Commons Attribution (CC BY) license (https://creativecommons.org/licenses/by/4.0/).