
Evaluation of Temperature on the Methane Hydrates Formation Process Using Sodium Surfactin and Rhamnolipids


Abstract
:
1. Introduction
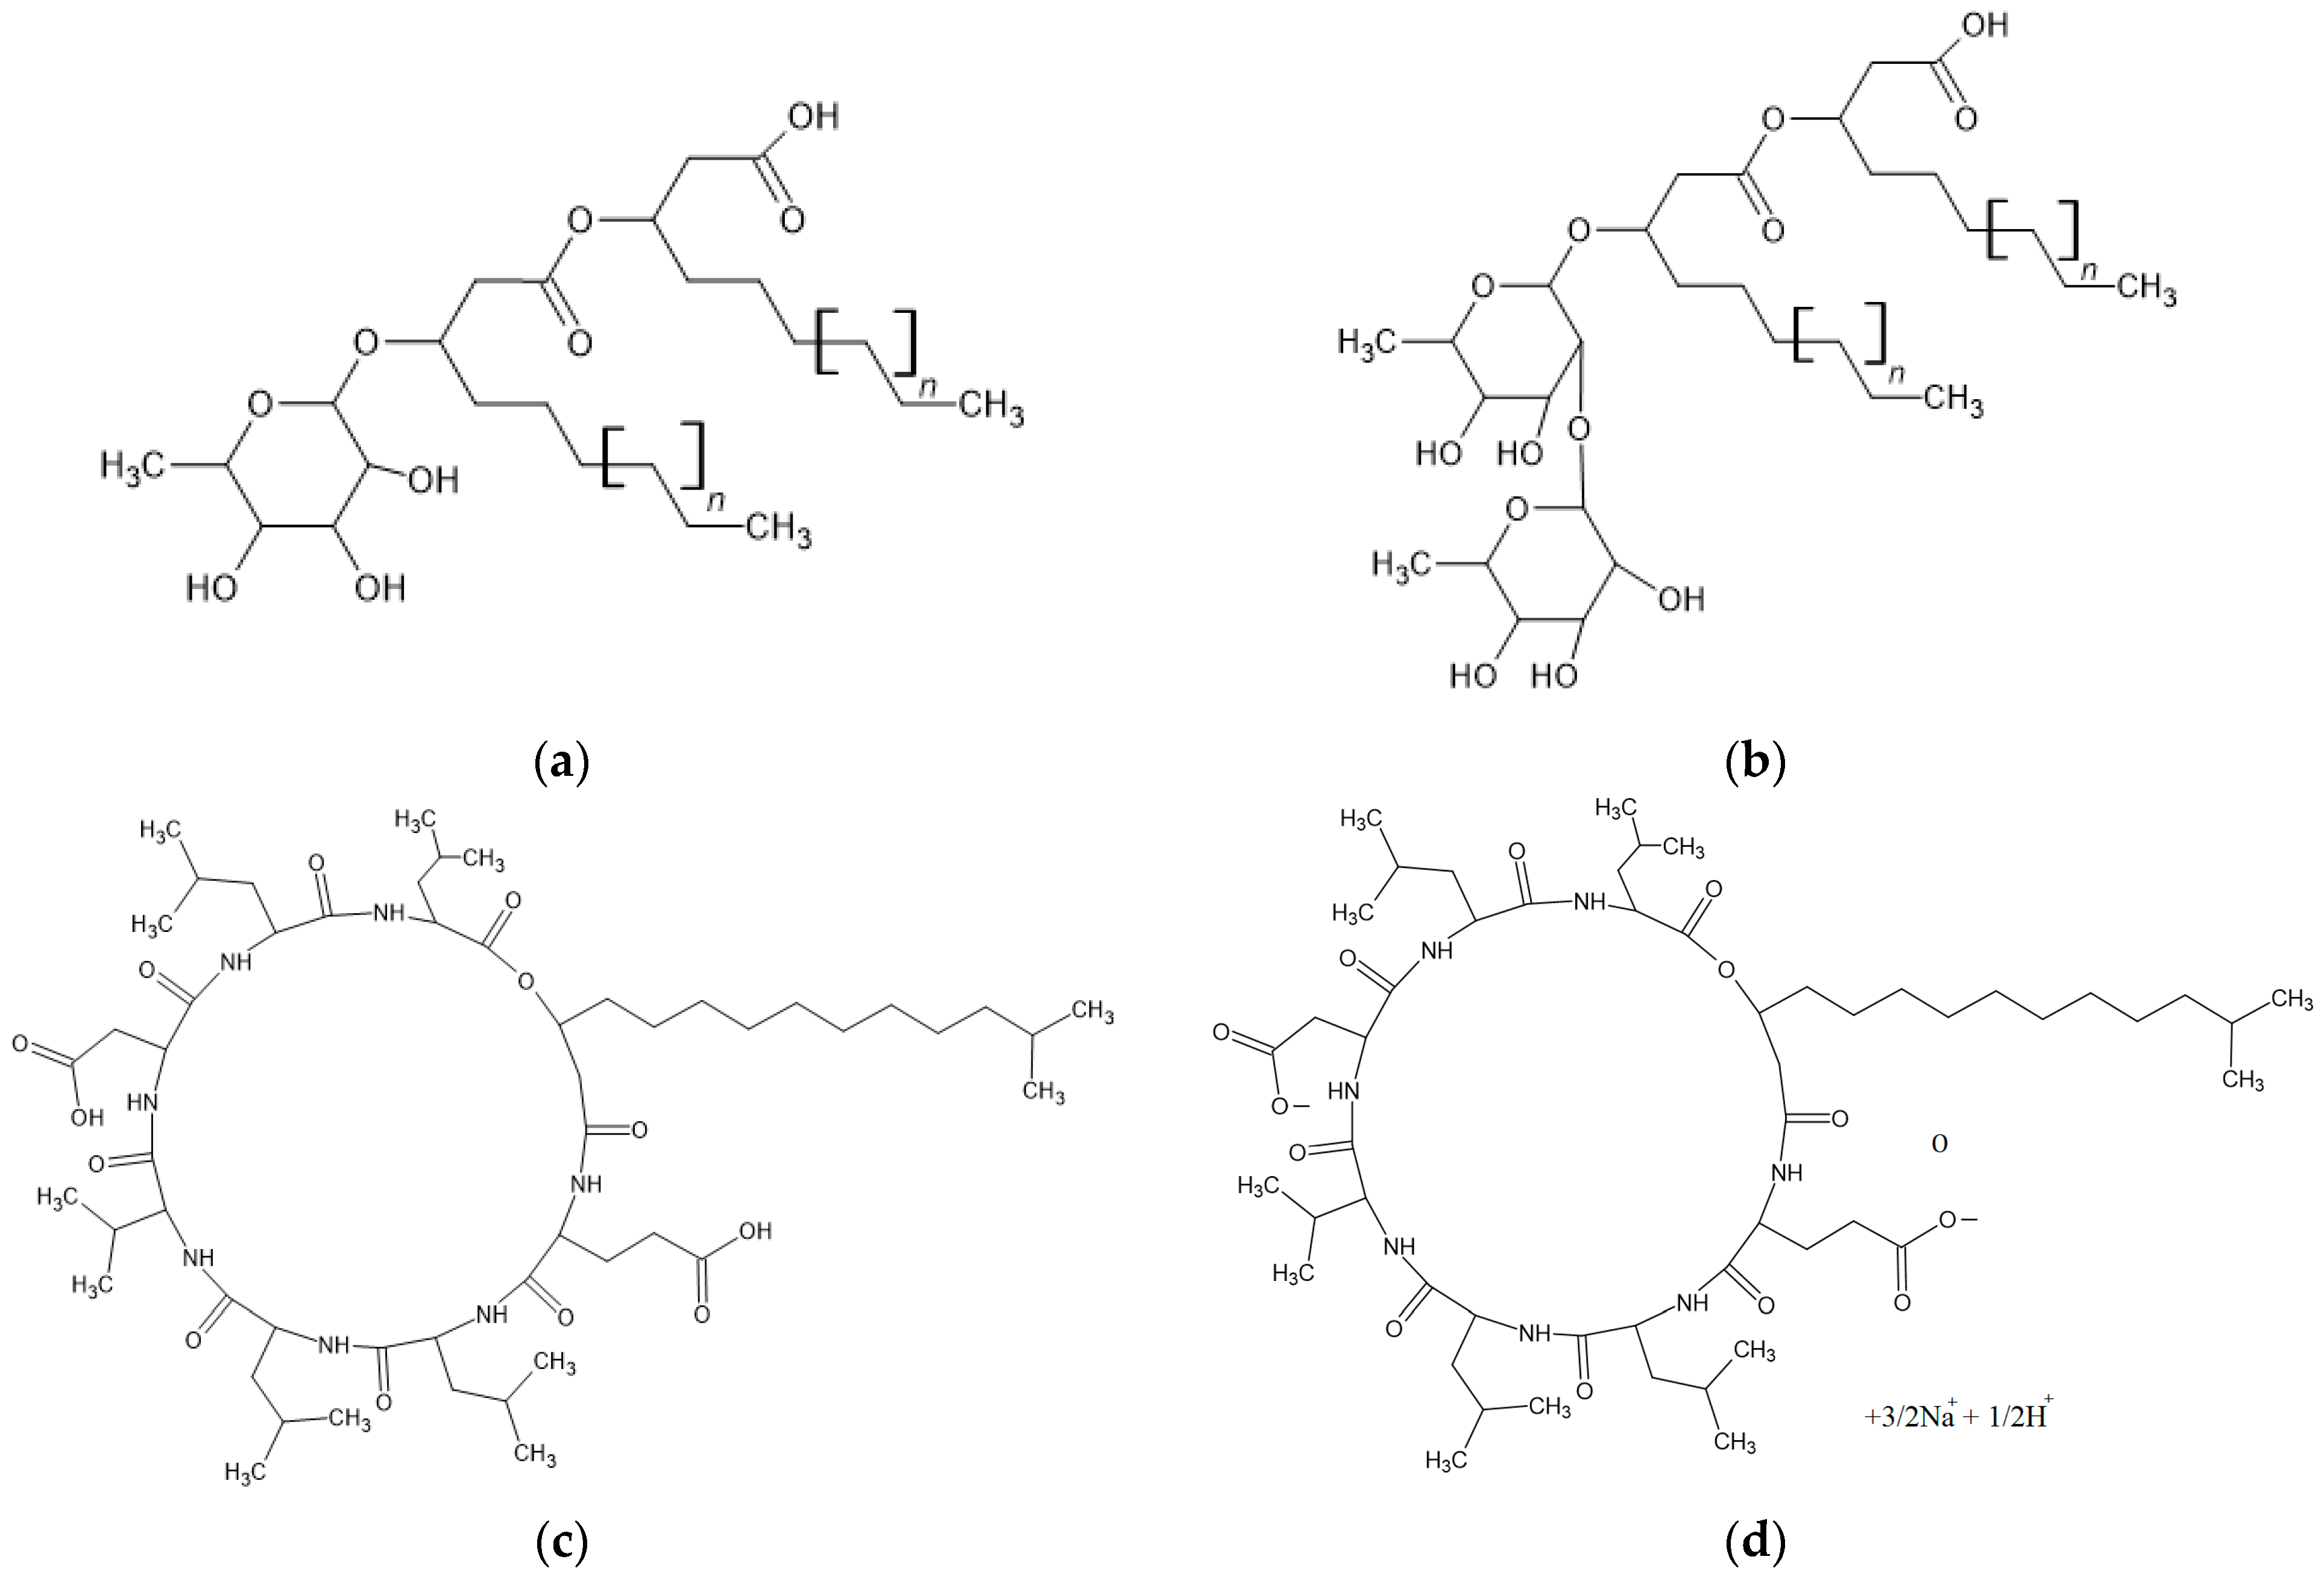
2. Materials and Methods
3. Results and Discussion
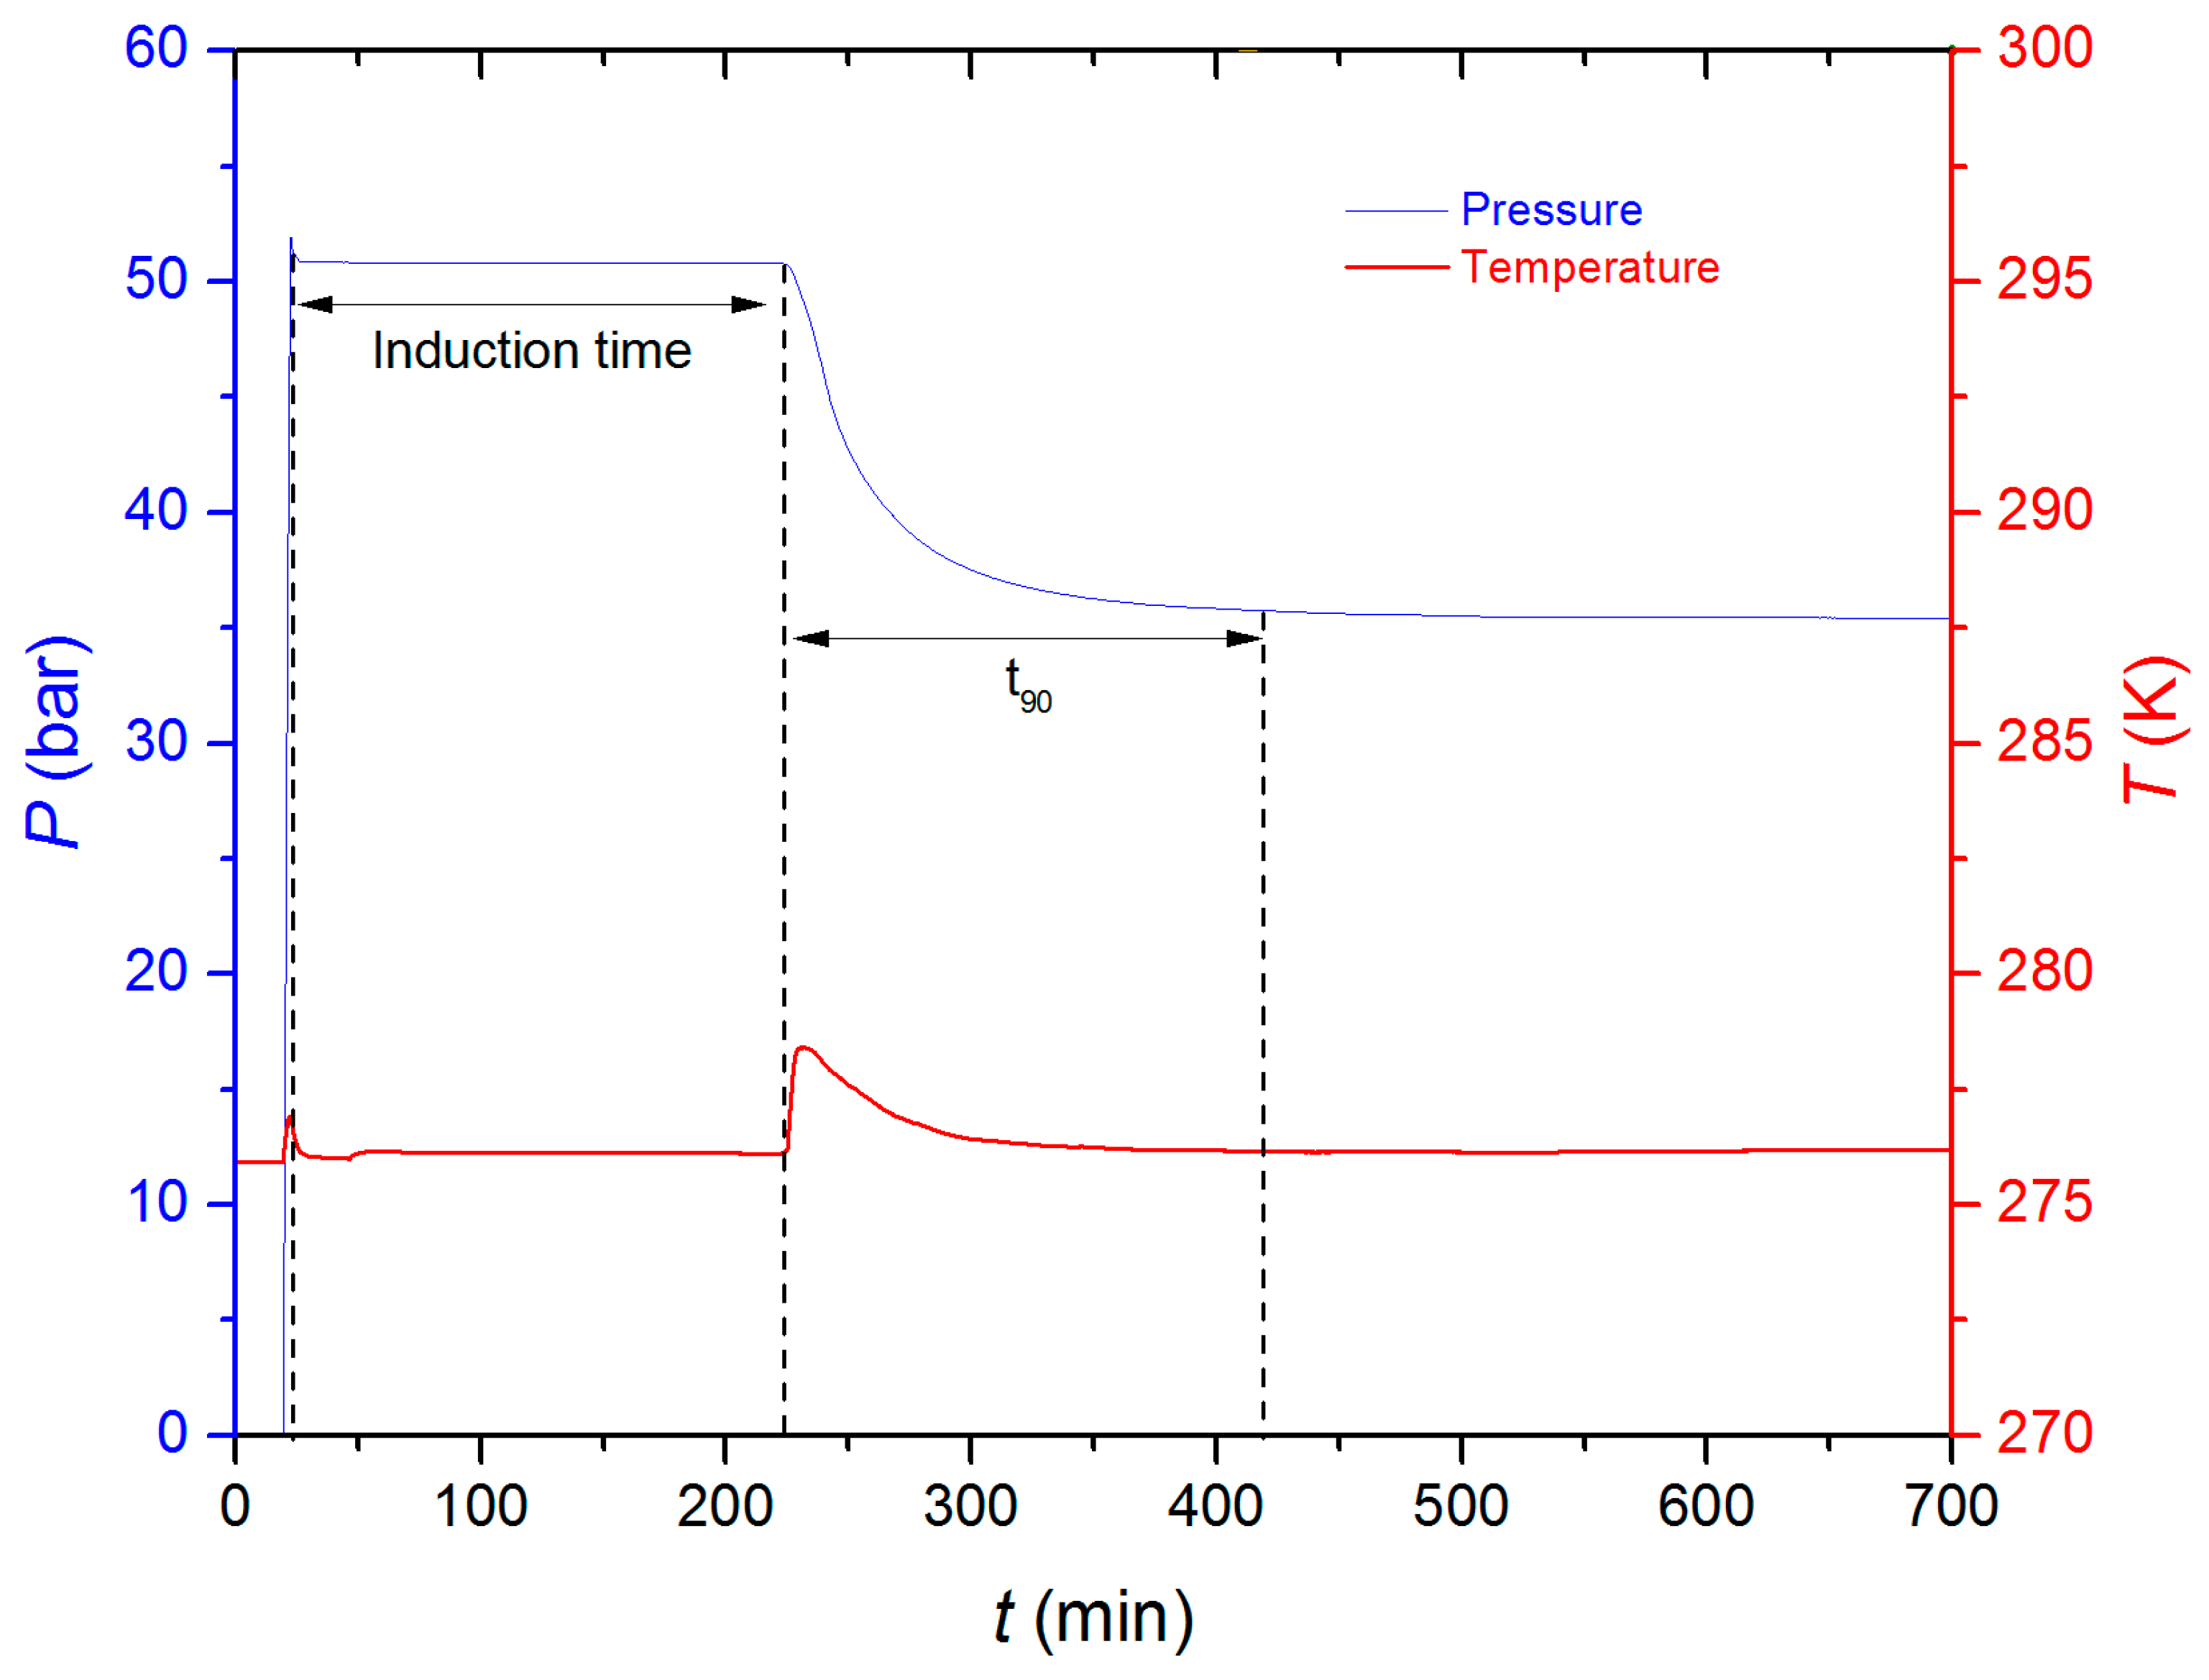
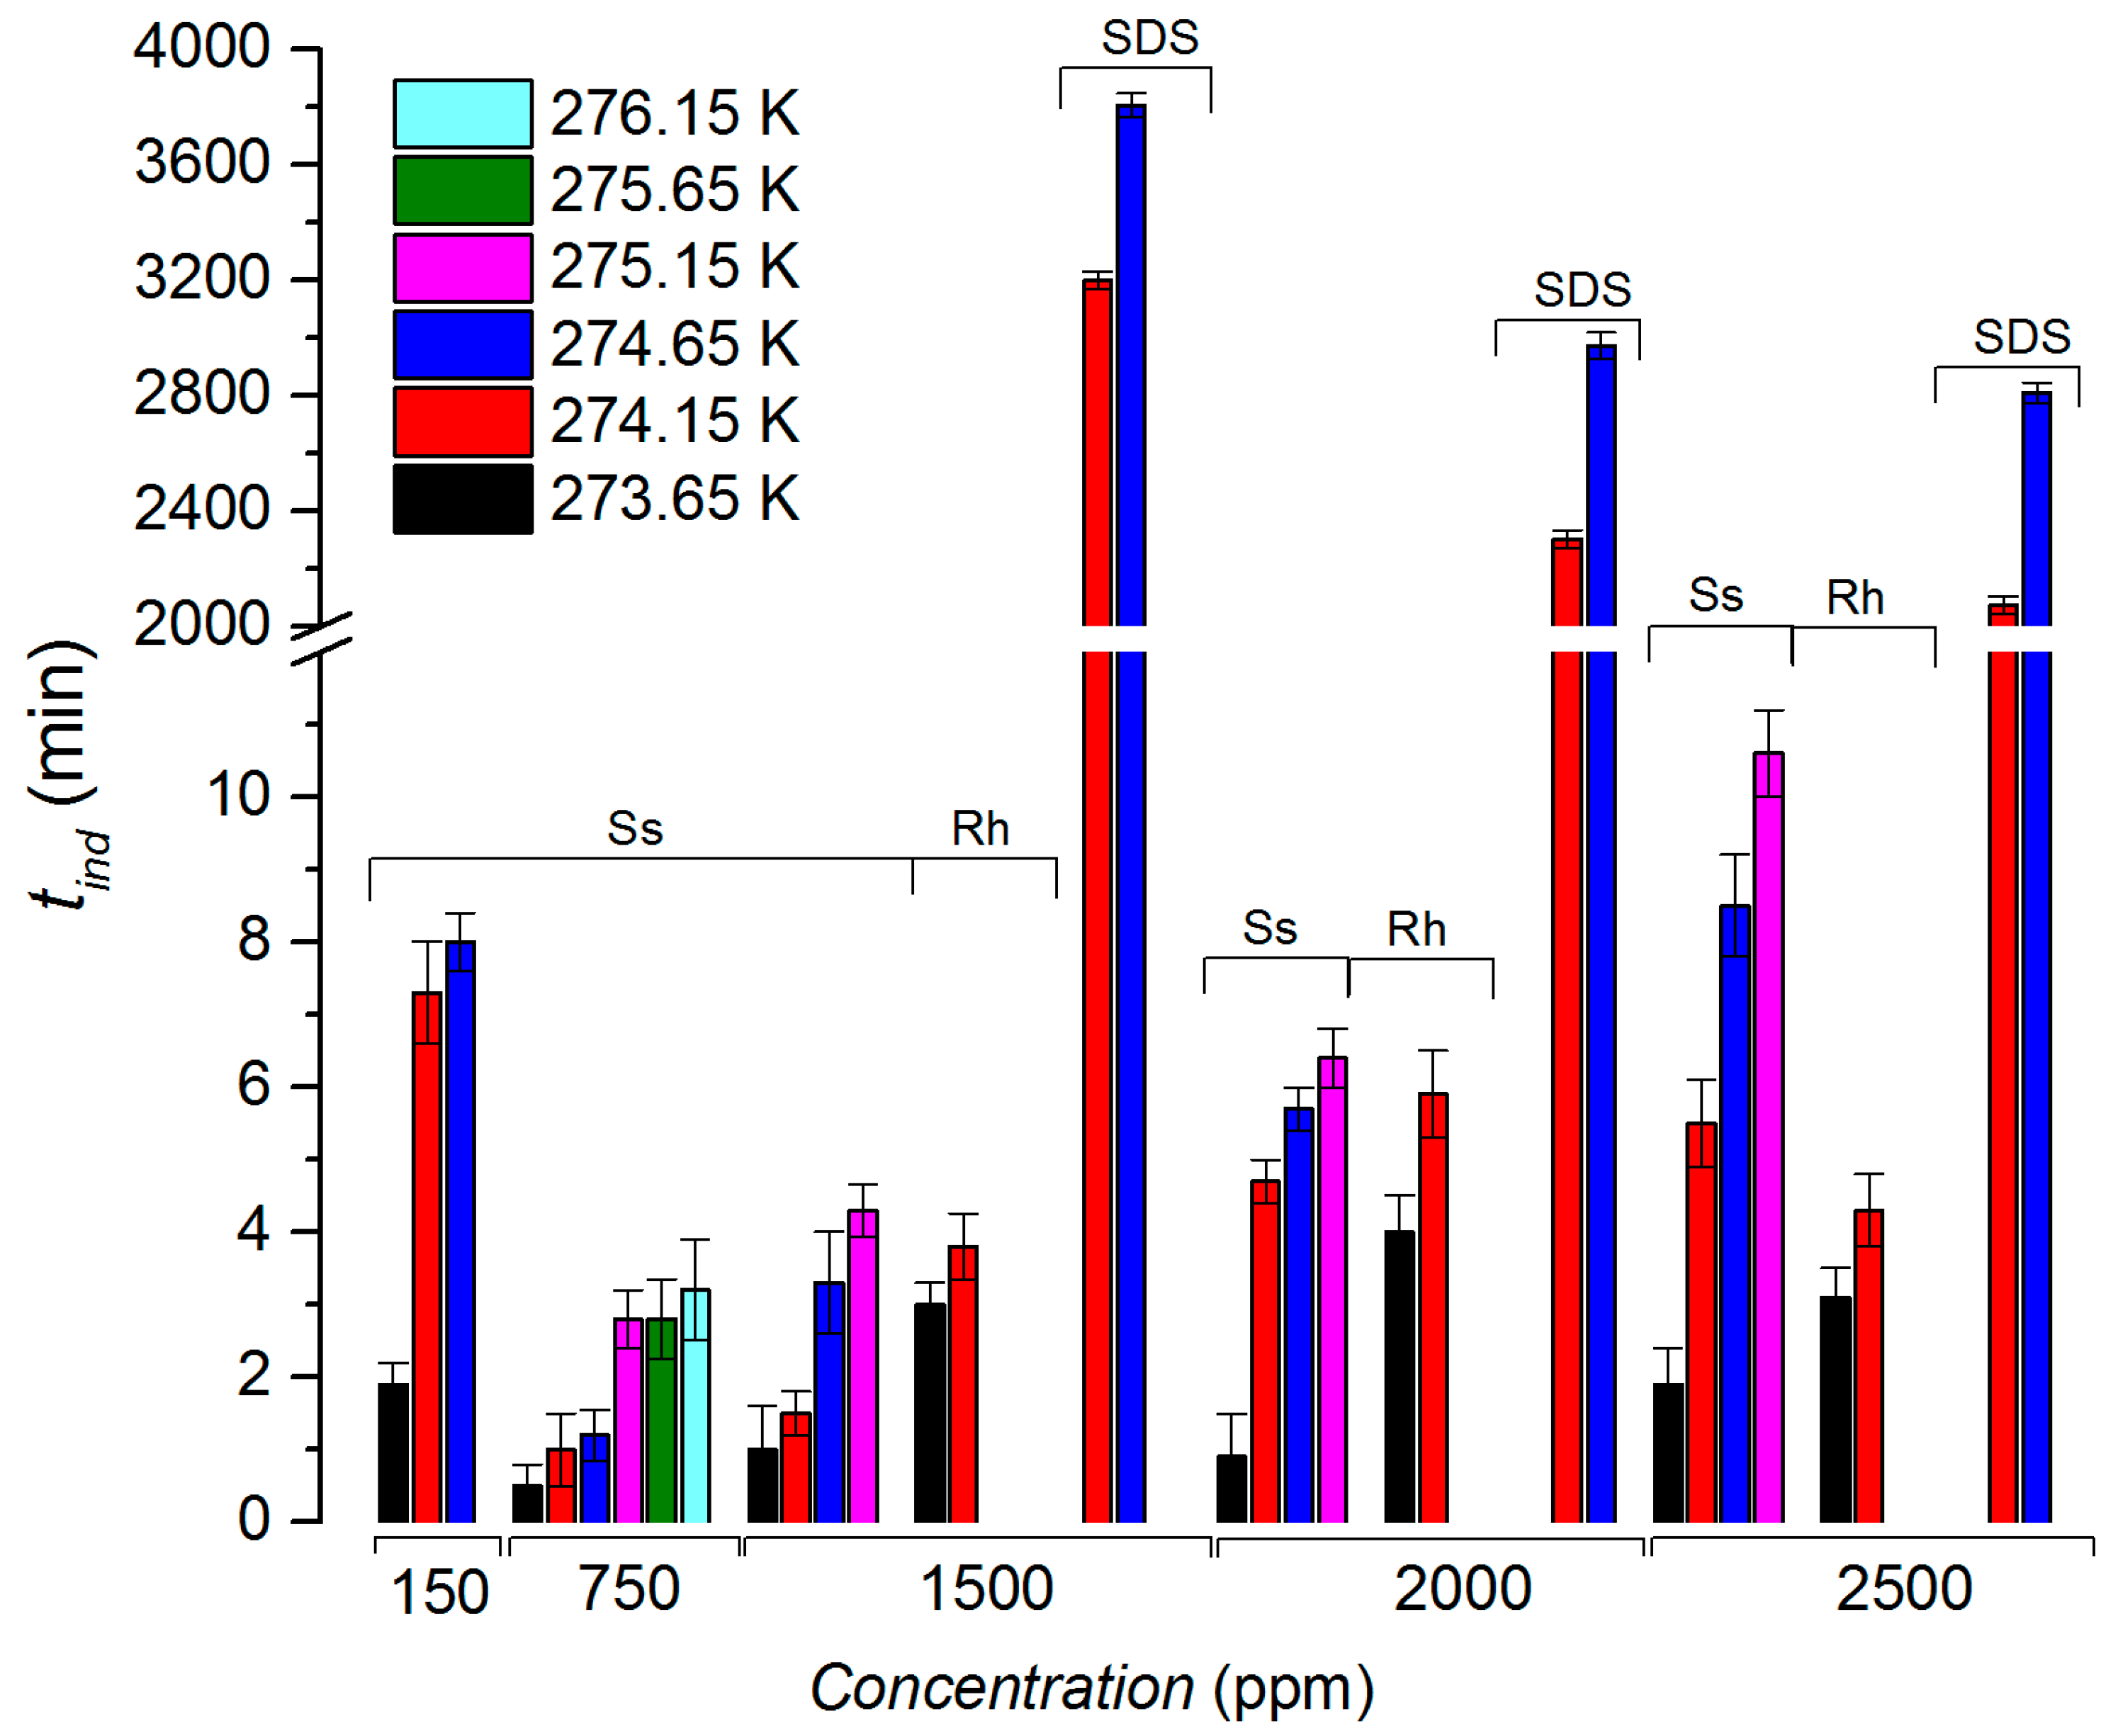
3.1. Induction Time
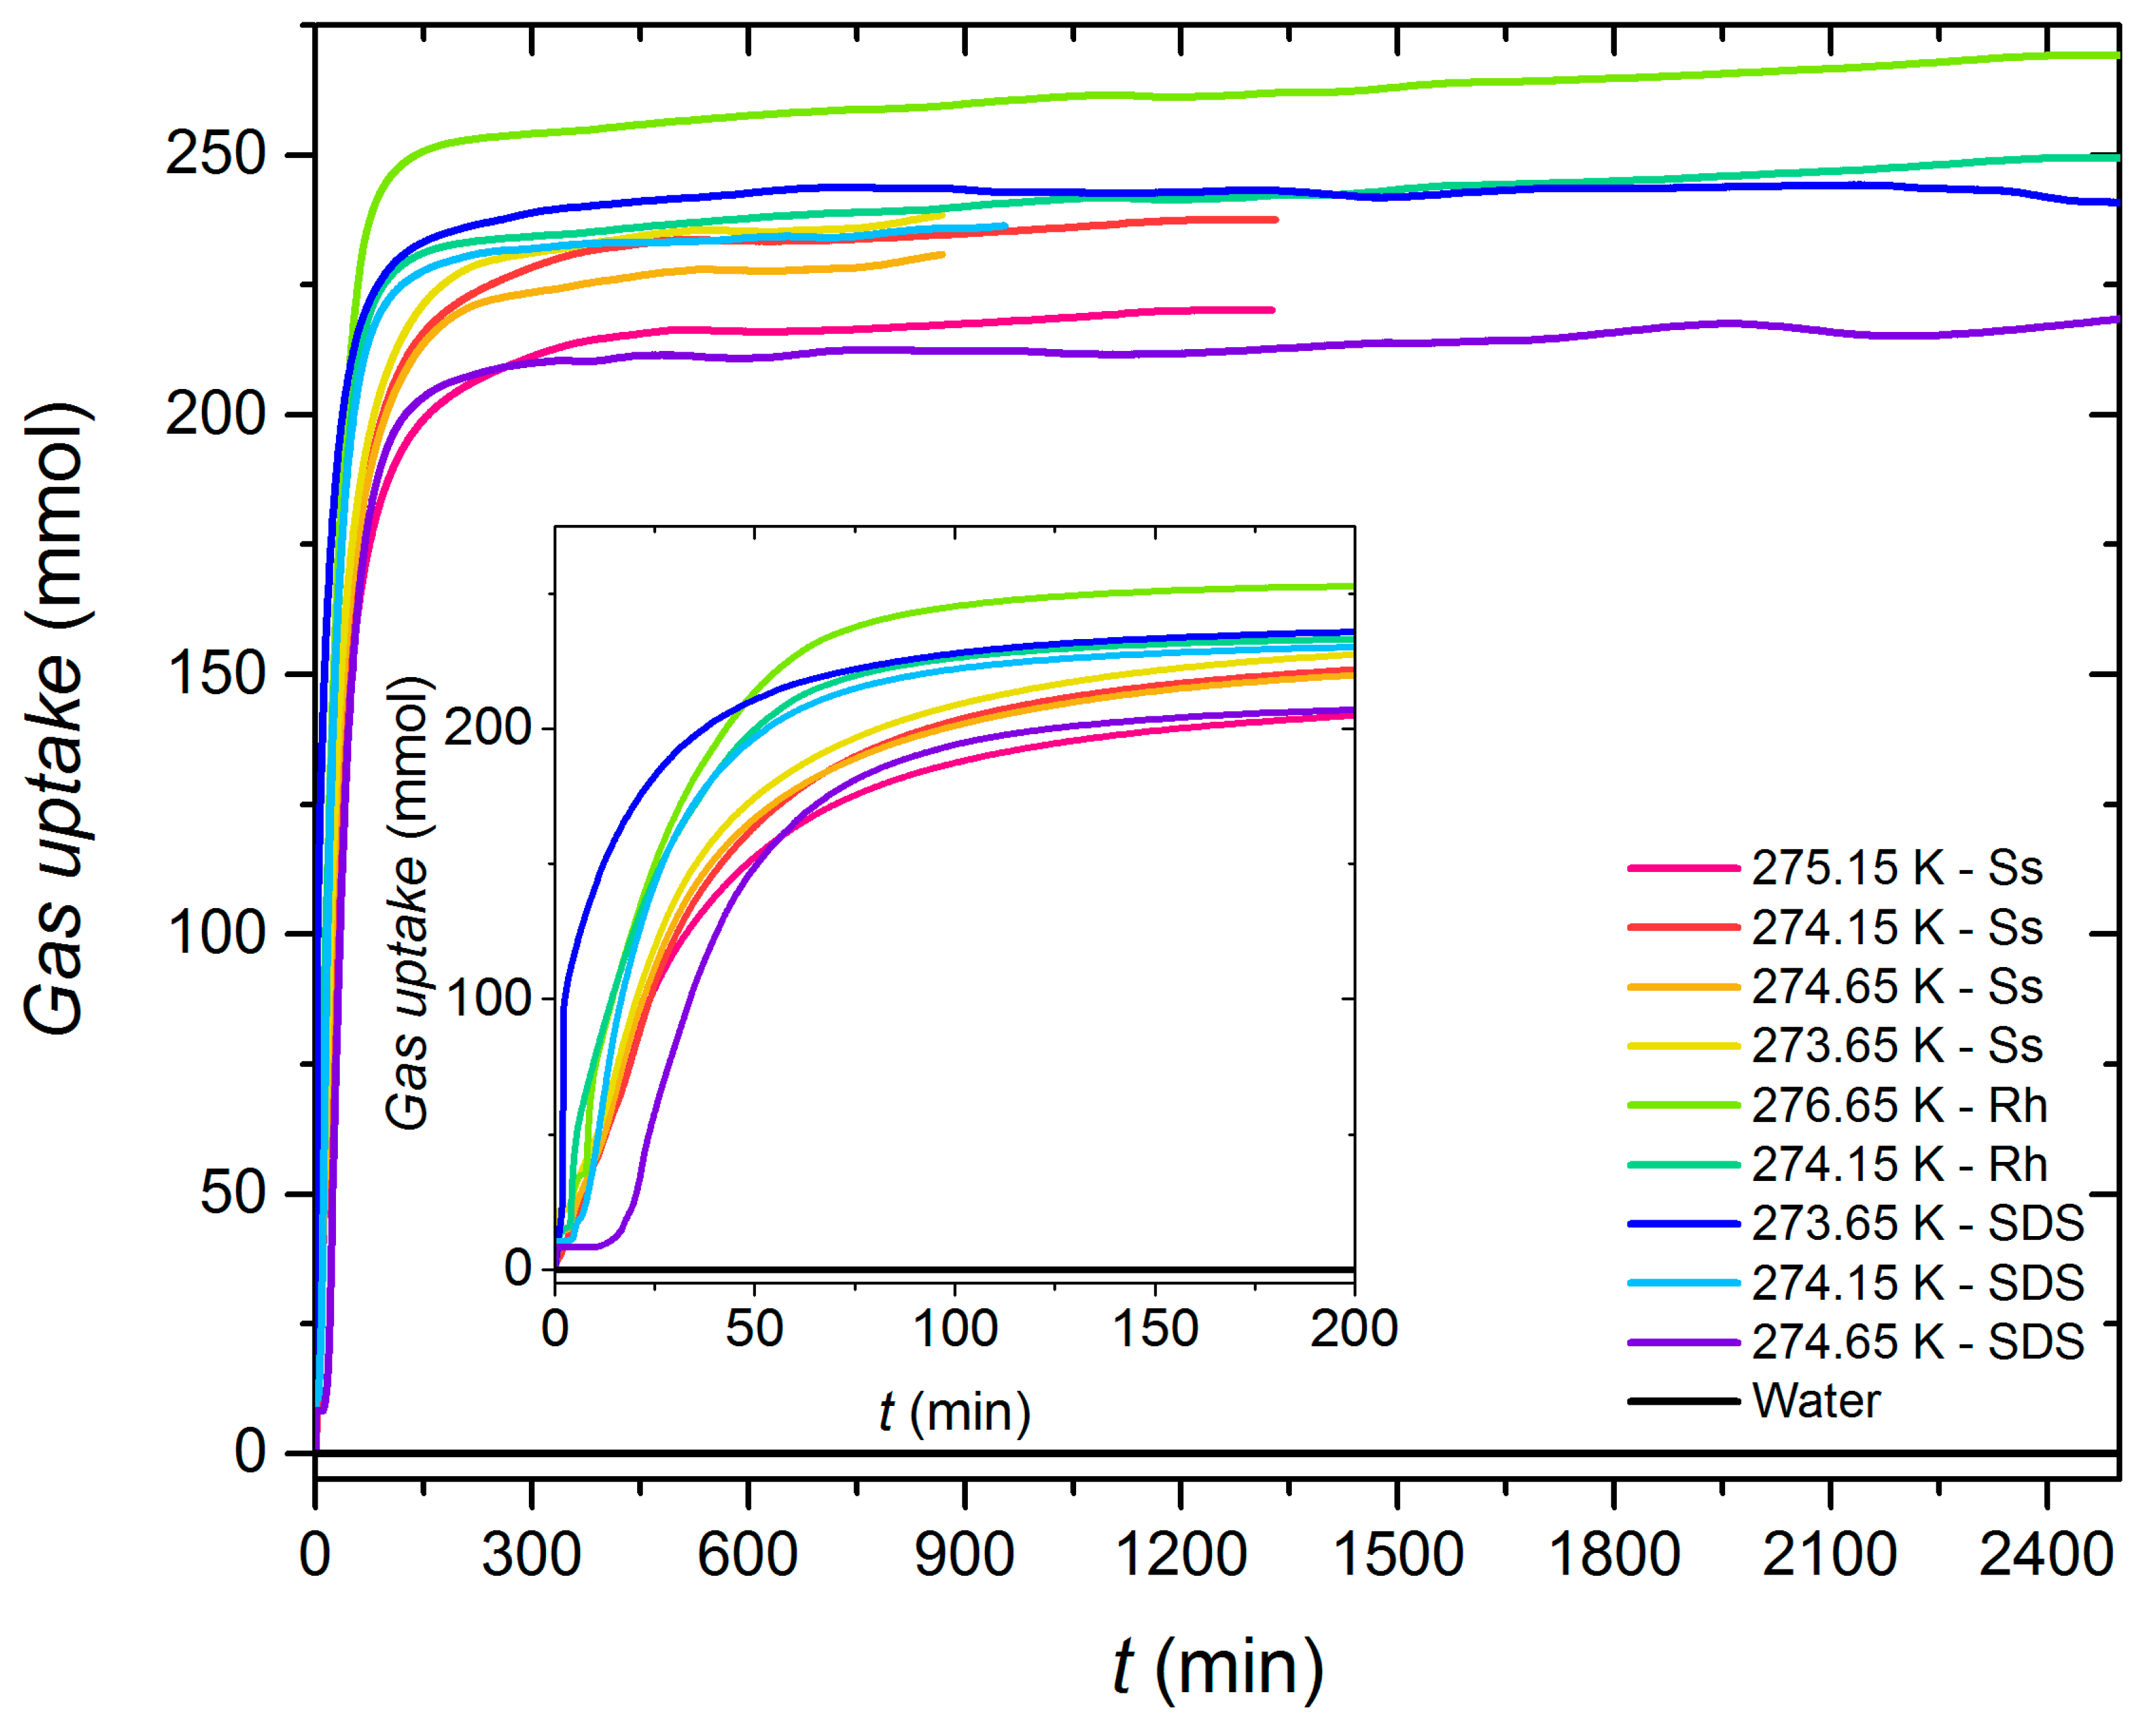
3.2. Gas Uptake
A = 0.45724αPr/Tr2
B = 0.0778Pr/Tr
α = [1 + (0.37464 + 1.54226ω − 0.26992ω2)(1 − Tr0.5)]2
3.3. Methane Conversion and Growth Rate
4. Conclusions
- ✓
- Methane hydrates were not formed using pure water (zero additive concentration); the same behavior was found for the solution at the critical micelle concentration (3 ppm) of sodium surfactin;
- ✓
- Sodium surfactin had a better impact since methane hydrates were still nucleating and growing even at 276.15 K, while SDS and rhamnolipids were not capable;
- ✓
- The period for nucleation was almost negligible for the three surfactants at the lowest temperature (273.65 K);
- ✓
- The advantage of sodium surfactin and rhamnolipids was notorious at high temperatures in the induction time; tind was still very low and did not overcome 10.6 min, in contrast with the long period observed for SDS, which reached 3808.2 min;
- ✓
- The experiments in the growth section demonstrated the good performance of sodium surfactin above 750 ppm, whose ranges for methane uptake (177.2–265.11 mmol), t90 (89.4–200.7 min), and X(W/H) (19.4–24.3%) are on the order of those obtained for SDS and rhamnolipids.
Author Contributions
Funding
Data Availability Statement
Acknowledgments
Conflicts of Interest
References
- World Energy Primary Production|Energy Production|Enerdata. Available online: https://yearbook.enerdata.net/total-energy/world-energy-production.html (accessed on 27 November 2023).
- Kumar, A.; Veluswamy, H.P.; Jadhawar, P.; Chapoy, A.; Aman, Z. Gas Hydrates in Man-Made Environments: Applications, Economics, Challenges and Future Directions. In Status and Future Challenges for Non-Conventional Energy Sources; Joshi, S.J., Sen, R., Sharma, A., Salam, P.A., Eds.; Springer: Singapore, 2022; Volume 1, pp. 173–192. [Google Scholar] [CrossRef]
- Gajanayake, S.M.; Gamage, R.P.; Li, X.S.; Huppert, H. Natural gas hydrates—Insights into a paradigm-shifting energy resource. Energy Rev. 2023, 2, 100013. [Google Scholar] [CrossRef]
- Shaibu, R.; Sambo, C.; Guo, B.; Dudun, A. An assessment of methane gas production from natural gas hydrates: Challenges, technology and market outlook. Adv. Geo-Energy Res. 2021, 5, 318–332. [Google Scholar] [CrossRef]
- Giavarini, C.; Hester, K. Gas Hydrates Immense Energy Potential and Environmental Challenges; Springer: London, UK, 2011; pp. 17–20. [Google Scholar] [CrossRef]
- Sahu, C.; Sircar, A.; Kumar, R.; Sangwai, J.S. Natural Gas Hydrates: Energy Locked in Cages. In Status and Future Challenges for Non-Conventional Energy Sources; Joshi, S.J., Sen, R., Sharma, A., Salam, P.A., Eds.; Springer: Singapore, 2022; Volume 1, pp. 155–171. [Google Scholar] [CrossRef]
- Dong, H.S.; Wang, J.; Xie, Z.; Wang, B.; Zhang, L.; Shi, Q. Potential applications based on the formation and dissociation of gas hydrates. Renew. Sust. Energy Rev. 2021, 143, 110928. [Google Scholar] [CrossRef]
- Ravichandran, S.; Pohl, M.; Abdul Majid, A.A.; Bruner, B.; Wu, D.T.; Prasad, M.; Koh, C.A. Greenhouse gas (GHG) transport as solid natural gas (SNG) hydrate Pellets: Assessment of self-preservation & dissociation controls. Fuel 2024, 357, 129545. [Google Scholar] [CrossRef]
- Sloan, E.D., Jr.; Koh, C.A. Clathrate Hydrates of Natural Gases, 3rd ed.; CRC Press: Boca Raton, FL, USA, 2007. [Google Scholar] [CrossRef]
- Guo, G.-J.; Zhang, Z. Open questions on methane hydrate nucleation. Commun. Chem. 2021, 4, 102. [Google Scholar] [CrossRef] [PubMed]
- Rossi, F.; Gambelli, A.M. Thermodynamic phase equilibrium of single-guest hydrate and formation data of hydrate in presence of chemical additives: A review. Fluid Phase Equilibr. 2021, 536, 112958. [Google Scholar] [CrossRef]
- Sun, J.; Jiang, L.; Chou, I.M.; Nguyen, N.N.; Nguyen, A.V.; Chen, Y.; Lin, J.; Wu, C. Thermodynamic and kinetic study of methane hydrate formation in surfactant solutions: From macroscale to microscale. Energy 2023, 282, 128356. [Google Scholar] [CrossRef]
- Xia, Z.; Zhao, Q.; Chen, Z.; Li, X.; Zhang, Y.; Xu, C.; Yan, K. Review of methods and applications for promoting gas hydrate formation process. J. Nat. Gas Sci. Eng. 2022, 101, 104528. [Google Scholar] [CrossRef]
- Hassanpouryouzband, A.; Joonaki, E.; Vasheghani Farahani, M.; Takeya, S.; Ruppel, C.; Yang, J.; English, N.J.; Schicks, J.M.; Edlmann, K.; Mehrabian, H.; et al. Gas hydrates in sustainable chemistry. Chem. Soc. Rev. 2020, 49, 5225–5309. [Google Scholar] [CrossRef]
- Kim, K.; Truong-Lam, H.S.; Lee, J.D.; Sa, J.-H. Facilitating clathrate hydrates with extremely rapid and high gas uptake for chemical-free carbon capture and methane storage. Energy 2023, 270, 126902. [Google Scholar] [CrossRef]
- Benmesbah, F.D.; Ruffine, L.; Clain, P.; Osswald, V.; Fandino, O.; Fournaison, L.; Delahaye, A. Methane hydrate formation and dissociation in sand media: Effect of water saturation, gas flowrate and particle size. Energies 2020, 13, 5200. [Google Scholar] [CrossRef]
- Wang, W.; Ma, C.; Lin, P.; Sun, L.; Cooper, A.I. Gas storage in renewable bioclathrates. Energy Environ. Sci. 2013, 6, 105–107. [Google Scholar] [CrossRef]
- Wang, W.; Zeng, P.; Long, X.; Huang, J.; Liu, Y.; Tan, B.; Sun, L. Methane storage in tea clathrates. Chem. Commun. 2014, 50, 1244–1246. [Google Scholar] [CrossRef] [PubMed]
- Wang, S.; Zeng, Y.; Cai, Y.; Niu, X.; Zhu, Z.; Lei, D.; Wang, W. Chinese herbs: Treasure troves for the discovery of environmentally friendly promoters for methane hydrate formation. Sustain. Energy Fuels 2020, 4, 5947–5951. [Google Scholar] [CrossRef]
- Sun, Q.; Chen, B.; Li, Y.; Yuan, G.; Xu, Z.; Guo, X.; Li, X.; Lan, W.; Yang, L. Enhanced separation of coal bed methane via bioclathrates formation. Fuel 2019, 243, 10–14. [Google Scholar] [CrossRef]
- Sun, Q.; Chen, B.; Li, Y.; Xu, Z.; Guo, X.; Li, X.; Lan, W.; Yang, L. Promotion effects of mung starch on methane hydrate formation equilibria/rate and gas storage capacity. Fluid Phase Equilibr. 2018, 475, 95–99. [Google Scholar] [CrossRef]
- Yang, L.; Wang, J.; Liu, N.; Xie, Y.; Cui, G.; Liu, D. Clathrate Hydrate Framework Construction Enhanced by Waste Bio-Shavings for Efficient Methane Storage. ACS Sustainable Chem. Eng. 2022, 10, 12127–12138. [Google Scholar] [CrossRef]
- Li, C.; Yang, L.; Liu, D.; Liu, N.; Xie, Y.; Cui, G.; Zhang, L.; Gao, M.; Zhao, Y.; Wang, J. Accelerated methane storage in clathrate hydrates using the natural tobacco. Energy 2022, 241, 122549. [Google Scholar] [CrossRef]
- Nambiar, A.; Babu, P.; Linga, P. CO2 capture using the clathrate hydrate process employing cellulose foam as a porous media. Can. J. Chem. 2015, 93, 808–814. [Google Scholar] [CrossRef]
- Farahani, M.V.; Guo, X.; Zhang, L.; Yang, M.; Hassanpouryouzband, A.; Zhao, J.; Yang, J.; Song, Y.; Tohidi, B. Effect of thermal formation/dissociation cycles on the kinetics of formation and pore-scale distribution of methane hydrates in porous media: A magnetic resonance imaging study. Sustain. Energy Fuels 2021, 5, 1567–1583. [Google Scholar] [CrossRef]
- Mirzakimov, U.Z.; Farhadian, A.; Semenov, M.E.; Pavelyev, R.S.; Heydari, A.; Chirkova, Y.F.; Varfolomeev, M.A.; Aimaletdinov, A.M.; Valiullin, L.R. Enhanced methane storage capacity in clathrate hydrate induced by novel biosurfactants: Kinetics, stability, in vivo, and biodegradation investigations. J. Energy Stor. 2023, 73, 108802. [Google Scholar] [CrossRef]
- Farhadian, A.; Heydari, A.; Maddah, M.; Hosseini, M.S.; Sadeh, E.; Peyvandi, K.; Varaminian, F. Renewable biosurfactants for energy-efficient storage of methane: An experimental and computational investigation. Chem. Eng. J. 2022, 427, 131723. [Google Scholar] [CrossRef]
- Bhattacharjee, G.; Linga, P. Amino acids as kinetic promoters for gas hydrate applications: A mini review. Energy Fuels 2021, 35, 7553–7571. [Google Scholar] [CrossRef]
- Clarke, M.A.; Chen, Z.; Ahmadi, M. A comparison of the CPA equation of state and the Trebble-Bishnoi equation of state for use in correlating methane hydrate formation conditions in the presence of aqueous amino acids. Fluid Phase Equilibr. 2023, 573, 113878. [Google Scholar] [CrossRef]
- Qin, Y.; Bao, R.; Zhou, L.; Yang, X.; Liu, C.; Wan, W.; Chen, Y.; Guo, Y. Enhanced formation kinetics of hydrates using 1,3-dioxolane, l-leucine, and β-cyclodextrin. Fuel 2023, 332, 126165. [Google Scholar] [CrossRef]
- Sinehbaghizadeh, S.; Saptoro, A.; Naeiji, P.; Mohammadi, A.H. Molecular dynamics simulations to investigate the effects of organic amines on biogas clathrate hydrate formation. J. Mol. Liq. 2023, 382, 122015. [Google Scholar] [CrossRef]
- Lee, S.; Ok, Y.; Lee, Y.; Seo, D.; Moon, S.; Park, Y. Exploring the tuning patterns of cyclopentyl amine hydrate for potential application to CH4 storage. J. Environ. Chem. Eng. 2022, 10, 108402. [Google Scholar] [CrossRef]
- Muromachi, S.; Suzuki, K.; Tenma, N. Phase equilibrium data for clathrate hydrates formed in the systems of urea + (methane or carbon dioxide) + water. Fluid Phase Equilibr. 2023, 568, 113743. [Google Scholar] [CrossRef]
- Mohammadi, A.; Babakhanpour, N.; Javidani, A.M.; Ahmadi, G. Corn’s dextrin, a novel environmentally friendly promoter of methane hydrate formation. J. Mol. Liq. 2021, 336, 116855. [Google Scholar] [CrossRef]
- Qin, Y.; Pan, Z.; Shang, L.; Sun, X.; He, J.; Yang, Y.; Yuan, B. Enhanced methane hydrate formation using l-leucine and cyclodextrin. Fuel 2023, 336, 127129. [Google Scholar] [CrossRef]
- Adamova, T.P.; Strukov, D.A.; Manakov, A.Y.; Nesterov, A.N. Acceleration of methane hydrate nucleation by crystals of hydrated sodium dodecyl sulfate. Mendeleev Commun. 2022, 32, 823–824. [Google Scholar] [CrossRef]
- Qin, Y.; Shang, L.; Lv, Z.; Liu, Z.; He, J.; Li, X.; Binama, M.; Yang, L.; Wang, D. Rapid formation of methane hydrate in environment-friendly leucine-based complex systems. Energy 2022, 254, 124214. [Google Scholar] [CrossRef]
- Lamim, M.N.; de Queiroz Venancio, F.; Kartnaller, V.; Cajaiba, J.F.; Gonçalves, V.O.O. Methane hydrate: Thermodynamic and kinetic inhibitor evaluation in PVT apparatus with image analysis. In Proceedings of the SPE Brazil Flow Assurance Technology Congress, Rio de Janeiro, Brazil, 15–18 November 2022. [Google Scholar]
- Hou, G.; Liang, D.; Li, X. Experimental study on hydrate anti-agglomeration in the presence of rhamnolipid. RSC Adv. 2018, 8, 39511–39519. [Google Scholar] [CrossRef] [PubMed]
- Chen, J.; Zeng, Y.; Liu, C.; Kang, M.; Chen, G.; Deng, B.; Zeng, F. Methane hydrate dissociation from anti-agglomerants containing oil dominated dispersed systems. Fuel 2021, 294, 120561. [Google Scholar] [CrossRef]
- Arora, A.; Cameotra, S.S.; Kumar, R.; Balomajumder, C.; Singh, A.K.; Santhakumari, B.; Kumar, P.; Laik, S. Biosurfactant as a promoter of methane hydrate formation: Thermodynamic and kinetic studies. Sci. Rep. 2016, 6, 20893. [Google Scholar] [CrossRef]
- Arora, A.; Cameotra, S.S.; Kumar, R.; Singh, A.K.; Kumar, P.; Balomajumder, C.; Laik, S. Role of Rhamnolipid: A Biosurfactant in Methane Gas Hydrate Formation Kinetics. In Proceedings of the First International Conference on Recent Advances in Bioenergy Research, Kapurthala, India, 25–28 February 2015. [Google Scholar] [CrossRef]
- Carbajal-Ortiz, H.; Pratt, L.M. Effects of clay minerals and biosurfactants on isotopic and molecular characteristics of methane encaged in pressure vessel gas hydrates. Org. Geochem. 2013, 60, 83–92. [Google Scholar] [CrossRef]
- Rogers, R.; Zhang, G.; Dearman, J.; Woods, C. Investigations into surfactant/gas hydrate relationship. J. Petrol. Sci. Eng. 2007, 56, 82–88. [Google Scholar] [CrossRef]
- Heydari, A.; Peyvandi, K. Study of biosurfactant effects on methane recovery from gas hydrate by CO2 replacement and depressurization. Fuel 2020, 227, 117681. [Google Scholar] [CrossRef]
- Jadav, S.; Sakthipriya, N.; Doble, M.; Sangwai, J.S. Effect of biosurfactants produced by Bacillus subtilis and Pseudomonas aeruginosa on the formation kinetics of methane hydrates. J. Nat. Gas Sci. Eng. 2017, 43, 156–166. [Google Scholar] [CrossRef]
- Bhattacharjee, G.; Barmecha, V.; Pradhan, D.; Naik, R.; Zare, K.; Mawlankar, R.B.; Dastager, S.G.; Kushwaha, O.S.; Kumar, R. The biosurfactant surfactin as a kinetic promoter for methane hydrate formation. Energy Proced. 2017, 105, 5011–5017. [Google Scholar] [CrossRef]
- Zhang, Y.; Zhang, J.; Xu, X.; Liu, W.; Xu, Y.; Yang, M.; Song, Y. The effects of rhamnolipid on the formation of CH4 hydrate and separation of CH4/N2 via hydrate formation. Fuel 2024, 357, 129873. [Google Scholar] [CrossRef]
- Salihu, S.M.; Abubakar, A.J.; Meisam, B.; Emmanuel, U.A.; Hassan, K.Y.; Aminu, A.Y. Effect of temperature and salt concentration on rheological behaviour of surfactin. In Proceedings of the SPE Nigeria Annual International Conference and Exhibition, Lagos, Nigeria, 5–7 August 2019. [Google Scholar] [CrossRef]
- Miyazaki, N.; Sugai, Y.; Sasaki, K.; Okamoto, Y.; Ouyang, C. Dual role of citric acid as a binding inhibitor of anionic surfactant with bivalent cations and co-surfactant on bio-surfactant EOR. In Proceedings of the Abu Dhabi International Petroleum Exhibition & Conference, Abu Dhabi, United Arab Emirates, 14 November 2018. [Google Scholar] [CrossRef]
- Mohamadi-Baghmolaei, M.; Hajizadeh, A.; Azin, R.; Izadpanah, A.A. Assessing thermodynamic models and introducing novel method for prediction of methane hydrate formation. J. Petrol. Explor. Prod. Technol. 2018, 8, 1401–1412. [Google Scholar] [CrossRef]
- Chaovarin, C.; Yodpetch, V.; Inkong, K.; Veluswamy, H.P.; Kulprathipanja, S.; Linga, P.; Rangsunvigit, P. Improvement of methane hydrate formation using biofriendly amino acids for natural gas storage applications: Kinetic and morphology insights. Energy Fuels 2022, 36, 12826–12841. [Google Scholar] [CrossRef]
- Singh, A.; Veluswamy, H.P. Investigation of kinetics of methane and carbon dioxide hydrates in the presence of biobased additives. Energy Fuels 2022, 36, 14315–14330. [Google Scholar] [CrossRef]
- Moraveji, M.K.; Ghaffarkhah, A.; Sadeghi, A. Effect of three representative surfactants on methane hydrate formation rate and induction time. Egypt. J. Petrol. 2017, 26, 331–339. [Google Scholar] [CrossRef]
- Pérez-López, H.I.; Elizalde-Solis, O.; Avendaño-Gómez, J.R.; Zúñiga-Moreno, A.; Sanchez-Minero, F. Methane hydrate formation and dissociation in synperonic PE/F127, CTAB, and SDS surfactant solutions. J. Chem. Eng. Data 2018, 63, 2477–2485. [Google Scholar] [CrossRef]
- He, Y.; Sun, M.-T.; Chen, C.; Zhang, G.-D.; Chao, K.; Lin, Y.; Wang, F. Surfactant-based promotion to gas hydrate formation for energy storage. J. Mater. Chem. A 2019, 7, 21634–21661. [Google Scholar] [CrossRef]
- Liang, H.; Guan, D.; Liu, Y.; Zhang, L.; Zhao, J.; Yang, L.; Song, Y. Kinetic process of upward gas hydrate growth and water migration on the solid surface. J. Colloid Interf. Sci. 2022, 626, 1003–1014. [Google Scholar] [CrossRef]
- Burla, S.K.; Prasad Pinelli, S.R.; Sain, K. Explicating the amino acid effects for methane storage in hydrate form. RSC Adv. 2022, 12, 10178–10185. [Google Scholar] [CrossRef]
- Bamaga, O.; Ahmed, I.; Wafiyah, A.M.; Albeirutty, M.; Abulkhair, H.; Shaiban, A.; Linga, P. Studies on methane gas hydrate formation kinetics enhanced by isopentane and sodium dodecyl sulfate promoters for seawater desalination. Energies 2022, 15, 9652. [Google Scholar] [CrossRef]
- Veluswamy, H.P.; Kumar, A.; Kumar, R.; Linga, P. An innovative approach to enhance methane hydrate formation kinetics with leucine for energy storage application. Appl. Energ. 2017, 188, 190–199. [Google Scholar] [CrossRef]
- Kumar, A.; Bhattacharjee, G.; Kulkarni, B.D.; Kumar, R. Role of surfactants in promoting gas hydrate formation. Ind. Eng. Chem. Res. 2015, 54, 12217–12232. [Google Scholar] [CrossRef]
- Zhong, Y.; Rogers, R.E. Surfactant effects on gas hydrate formation. Chem. Eng. Sci. 2000, 55, 4175–4187. [Google Scholar] [CrossRef]
- Molokitina, N.S.; Nesterova, A.N.; Podenko, L.S.; Reshetnikov, A.M. Carbon dioxide hydrate formation with SDS: Further insights into mechanism of gas hydrate growth in the presence of surfactant. Fuel 2019, 235, 1400–1411. [Google Scholar] [CrossRef]
- Pathania, A.S.; Jana, A.K. Improvement in production of rhamnolipids using fried oil with hydrophilic co-substrate by indigenous pseudomonas aeruginosa NJ2 and characterizations. Appl Biochem. Biotechnol. 2020, 191, 1223–1246. [Google Scholar] [CrossRef] [PubMed]
- Li, H.-Y.; Li, X.-S.; Yu, Y.-S.; Chen, Z.-Y. Morphologies, kinetics and structures of methane hydrate in the system containing tetrahydrofuran and cyclopentane. Fuel 2023, 340, 127585. [Google Scholar] [CrossRef]
- Zhang, M.; Ni, D.; Zhang, Z. What makes 1,3-dioxolane an efficient sII hydrate former? Fuel 2023, 334, 126714. [Google Scholar] [CrossRef]
- Yu, Y.-S.; Sun, W.-Z.; Chen, C.; Li, X.-S.; Chen, Z.-Y. Kinetics studies of methane hydrate formation and dissociation in the presence of cyclopentane. Fuel 2024, 356, 129651. [Google Scholar] [CrossRef]
- Bian, H.; Heng, J.Y.Y.; Maitland, G.C.; Hellgardt, K. Effects of chemical potential differences on methane hydrate formation kinetics. Chem. Eng. J. 2023, 452, 139084. [Google Scholar] [CrossRef]
- Zhang, Y.T.; Chen, F.L.; Yu, S.J.; Wang, F. Biopromoters for gas hydrate formation: A mini review of current status. Front. Chem. 2020, 8, 514. [Google Scholar] [CrossRef]
- Jeenmuang, K.; Viriyakul, C.; Inkong, K.; Veluswamy, H.P.; Kulprathipanja, S.; Rangsunvigit, P.; Linga, P. Enhanced hydrate formation by natural-like hydrophobic side chain aminoacids at ambient temperature: A kinetics and morphology investigation. Fuel 2021, 299, 120828. [Google Scholar] [CrossRef]


| Additive | Concentration (ppm) | Tonset (K) | tind (min) | Gas Uptake (mol) | t90 (min) | Water-to-Hydrate Conversion (%) | r mmol CH4 (min·mol H2O) |
|---|---|---|---|---|---|---|---|
| 0 | >273.65 1 | ---- | ---- | ---- | ---- | ---- | |
| Sodium surfactin | 3 | >273.65 1 | ---- | ---- | ---- | ---- | ---- |
| 150 | 273.65 | 1.9 | 47.19 | 5736.8 | 4.3 | 0.003 | |
| 274.15 | 7.3 | 34.06 | 8180.2 | 3.1 | 0.003 | ||
| 274.65 | 8 | 37.85 | 8836.2 | 3.5 | 0.003 | ||
| 275.15 1 | ---- | ---- | ---- | ---- | ---- | ||
| 750 | 273.65 | 0.5 | 219.78 | 100.2 | 20.2 | 0.240 | |
| 274.15 | 1 | 221.15 | 108.9 | 20.3 | 0.236 | ||
| 274.65 | 1.2 | 216.84 | 122.7 | 19.9 | 0.211 | ||
| 275.15 | 2.8 | 194.51 | 134.7 | 17.8 | 0.205 | ||
| 275.65 | 2.8 | 196.38 | 200.7 | 18.0 | 0.112 | ||
| 276.15 | 3.2 | 177.92 | 7550.5 | 16.3 | 0.005 | ||
| 276.65 1 | ---- | ---- | ---- | ---- | ---- | ||
| 1500 | 273.65 | 1 | 238.51 | 89.5 | 21.9 | 0.256 | |
| 274.15 | 1.5 | 237.63 | 92.7 | 21.8 | 0.258 | ||
| 274.65 | 3.3 | 230.91 | 119.8 | 21.2 | 0.242 | ||
| 275.15 | 4.3 | 220.2 | 122.9 | 20.2 | 0.236 | ||
| 275.65 1 | ---- | ---- | ---- | ---- | ---- | ||
| 2000 | 273.65 | 0.9 | 256.1 | 93.4 | 23.5 | 0.253 | |
| 274.15 | 4.7 | 247.90 | 105.9 | 22.7 | 0.241 | ||
| 274.65 | 5.7 | 239.85 | 125.3 | 22.0 | 0.230 | ||
| 275.15 | 6.4 | 211.68 | 173.5 | 19.4 | 0.183 | ||
| 275.65 1 | ---- | ---- | ---- | ---- | ---- | ||
| 2500 | 273.65 | 1.9 | 265.11 | 91.8 | 24.3 | 0.261 | |
| 274.15 | 5.5 | 258.70 | 113.2 | 23.7 | 0.251 | ||
| 274.65 | 8.5 | 235.54 | 138.0 | 21.6 | 0.215 | ||
| 275.15 | 10.6 | 211.83 | 150.1 | 19.4 | 0.179 | ||
| 275.65 1 | ---- | ---- | ---- | ---- | ---- | ||
| Rhamnolipids | 1500 | 273.65 | 3 | 272.31 | 96.4 | 25.0 | 0.322 |
| 274.15 | 3.8 | 252.52 | 98.3 | 23.2 | 0.322 | ||
| 274.65 1 | ---- | ---- | ---- | ---- | ---- | ||
| 275.15 1 | ---- | ---- | ---- | ---- | ---- | ||
| 2000 | 273.65 | 4 | 270.77 | 103.3 | 24.8 | 0.310 | |
| 274.15 | 5.9 | 247.67 | 101.6 | 22.7 | 0.316 | ||
| 274.65 1 | ---- | ---- | ---- | ---- | ---- | ||
| 275.15 1 | ---- | ---- | ---- | ---- | ---- | ||
| 2500 | 273.65 | 3.1 | 260.26 | 152.9 | 23.9 | 0.209 | |
| 274.15 | 4.3 | 245.63 | 158.3 | 22.5 | 0.202 | ||
| 274.65 1 | ---- | ---- | ---- | ---- | ---- | ||
| 275.15 1 | ---- | ---- | ---- | ---- | ---- | ||
| SDS | 1500 | 273.65 | 0 | 252.11 | 65.0 | 23.1 | 0.427 |
| 274.15 | 3199.2 | 236.43 | 93.0 | 21.7 | 0.241 | ||
| 274.65 | 3808.2 | 224.34 | 123.8 | 20.6 | 0.235 | ||
| 275.15 1 | ---- | ---- | ---- | ---- | ---- | ||
| 2000 | 273.65 | 0 | 248.55 | 74.2 | 22.8 | 0.426 | |
| 274.15 | 2303.3 | 235.85 | 83.5 | 21.9 | 0.393 | ||
| 274.65 | 2973.2 | 223.96 | 118.1 | 20.6 | 0.246 | ||
| 275.15 1 | ---- | ---- | ---- | ---- | ---- | ||
| 2500 | 273.65 | 0 | 243.60 | 98.5 | 23.1 | 0.253 | |
| 274.15 | 2071.5 | 229.91 | 135.1 | 21.1 | 0.217 | ||
| 274.65 | 2809.9 | 219.24 | 155.0 | 20.1 | 0.183 | ||
| 275.15 1 | ---- | ---- | ---- | ---- | ---- |
Disclaimer/Publisher’s Note: The statements, opinions and data contained in all publications are solely those of the individual author(s) and contributor(s) and not of MDPI and/or the editor(s). MDPI and/or the editor(s) disclaim responsibility for any injury to people or property resulting from any ideas, methods, instructions or products referred to in the content. |
© 2023 by the authors. Licensee MDPI, Basel, Switzerland. This article is an open access article distributed under the terms and conditions of the Creative Commons Attribution (CC BY) license (https://creativecommons.org/licenses/by/4.0/).
Share and Cite
Pavón-García, A.; Zúñiga-Moreno, A.; García-Morales, R.; Verónico-Sánchez, F.J.; Elizalde-Solis, O. Evaluation of Temperature on the Methane Hydrates Formation Process Using Sodium Surfactin and Rhamnolipids. Energies 2024, 17, 67. https://doi.org/10.3390/en17010067
Pavón-García A, Zúñiga-Moreno A, García-Morales R, Verónico-Sánchez FJ, Elizalde-Solis O. Evaluation of Temperature on the Methane Hydrates Formation Process Using Sodium Surfactin and Rhamnolipids. Energies. 2024; 17(1):67. https://doi.org/10.3390/en17010067
Chicago/Turabian StylePavón-García, Antonio, Abel Zúñiga-Moreno, Ricardo García-Morales, Francisco Javier Verónico-Sánchez, and Octavio Elizalde-Solis. 2024. "Evaluation of Temperature on the Methane Hydrates Formation Process Using Sodium Surfactin and Rhamnolipids" Energies 17, no. 1: 67. https://doi.org/10.3390/en17010067
APA StylePavón-García, A., Zúñiga-Moreno, A., García-Morales, R., Verónico-Sánchez, F. J., & Elizalde-Solis, O. (2024). Evaluation of Temperature on the Methane Hydrates Formation Process Using Sodium Surfactin and Rhamnolipids. Energies, 17(1), 67. https://doi.org/10.3390/en17010067