Article

Integration of Electric Vehicles and Renewable Energy in Indonesia’s Electrical Grid

Monash Energy Institute, Monash University, Wellington Road, Melbourne 3800, Australia
*
Author to whom correspondence should be addressed.
Energies 2024, 17(9), 2037; https://doi.org/10.3390/en17092037
Submission received: 21 February 2024 / Revised: 26 March 2024 / Accepted: 20 April 2024 / Published: 25 April 2024

Abstract

:
As the global transition toward sustainable energy gains momentum, integrating electric vehicles (EVs), energy storage, and renewable energy sources has become a pivotal strategy. This paper analyses the interplay between EVs, energy storage, and renewable energy integration with Indonesia’s grid as a test case. A comprehensive energy system modeling approach using PLEXOS is presented, using historical data on electricity generation, hourly demand, and renewable energy, and multiple scenarios of charging patterns and EV adoption. Through a series of scenarios, we evaluate the impact of different charging strategies and EV penetration levels on generation capacity, battery storage requirements, total system cost, renewable energy penetration, and emissions reduction. The findings reveal that optimized charging patterns and higher EV adoption rates, compared to no EVs adoption, led to substantial improvements in renewable energy utilization (+4%), emissions reduction (−12.8%), and overall system cost (−9%). While EVs contribute to reduced emissions compared to conventional vehicles, non-optimized charging behavior may lead to higher total emissions when compared to scenarios without EVs. The research also found the potential of vehicle to grid (V2G) to reduce the need for battery storage compared to zero EV (−84%), to reduce emissions significantly (−23.7%), and boost penetration of renewable energy (+10%). This research offers valuable insights for policymakers, energy planners, and stakeholders seeking to leverage the synergies between EVs and renewable energy integration to pursue a sustainable energy future for Indonesia.

1. Introduction

The global energy landscape is amid a significant transformation, driven by the pressing need to combat climate change and achieve sustainable development goals [1]. One of the main issues in this transformation is the widespread adoption of EVs, which promise to reduce greenhouse gas emissions and enhance the resilience of energy systems [2]. EVs are poised to play a pivotal role in the convergence of the transportation and energy sectors, facilitating the integration of renewable energy sources with sustainable mobility options [3]. As countries worldwide work toward meeting their emission reduction targets and transitioning to cleaner energy systems, understanding the dynamics of EV integration becomes crucial.
In the case of Indonesia, a nation marked by rapid urbanization and surging energy demand, the transportation sector emerges as a significant contributor to emissions [4]. It contributes 27% of the total carbon emissions from energy [5]. Recognizing this, Indonesia has embarked on an ambitious EV program aimed at promoting sustainable transportation and reducing its carbon footprint [5]. Indonesia has set an ambitious goal of achieving net zero emissions by 2060 [6]. This objective aligns with the country’s dual focus on advancing renewable energy sources and promoting the electrification of vehicles. This paper aims to harmonize these two pivotal targets by exploring the integration of renewable energy and EVs.
Indonesia has made notable strides in its commitment to combat climate change and reduce carbon emissions. Initially, the country pledged to reduce emissions by 29% (unconditionally) and 41% (conditionally) by 2030 when it submitted its National Determined Contribution (NDC) under the Paris Climate Agreement in 2016. However, in its more recent Enhanced NDC submission in September 2022, Indonesia has set even more ambitious targets, aiming for a reduction of 31.89% (unconditional) and 43.2% (conditional) by 2030 [7]. To realize these ambitious goals, Indonesia, under the leadership of the Ministry of Energy and Mineral Resources (MEMR), is actively crafting a Net Zero Emission Roadmap for the Energy Sector. This roadmap outlines clear objectives, including a target of reaching 422 million metric tons of CO2 equivalent emissions by 2050 and reducing total energy sector emissions to 129 million metric tons of CO2 equivalent by 2060 [6,7,8].
The strategy primarily centers on enhancing the utilization of renewable energy across various end-use sectors. Under this plan, energy sector emissions are anticipated to peak in 2030 at 680 million metric tons of CO2 equivalent. Ultimately, the roadmap envisions a transition to a power sector with zero emissions by 2060, with any remaining emissions originating from end-use sectors, specifically industry and transportation. Indonesia’s robust commitment and strategic initiatives represent significant progress in addressing climate change and advancing toward a sustainable, low-carbon future [6].
This article serves as a case study examining the effects of EVs on Indonesia’s grid system to support the integration of renewable energy in the year 2050 toward net zero emissions in 2060. It seeks to gauge the economic and environmental advantages arising from different scenarios involving EV demand, charging behavior, and their participation in V2G systems. The study employs a least-cost optimization approach as its methodology, using commercial energy modeling software. To accomplish this, a power dispatch and expansion model yearly from 2023–2050 is employed to conduct a quantitative assessment of the impact of EVs as both energy consumers and storage units, with the primary goal of reducing the overall costs and carbon emissions of the power system. Simultaneously, it aims to enhance the utilization of renewable energy sources. This research takes into consideration various critical factors, including the current fleet of electricity generators and the characteristics of the power generation mix, hourly electricity demand, existing transmission constraints, the hourly pattern of renewable energy resources in each province, investments and operations related to battery storage, and the widespread adoption of EVs. Through extensive simulation, this study computes the economic and environmental benefits associated with EVs. Consequently, it provides a data-driven foundation for the Indonesian government and other stakeholders to formulate strategies aimed at achieving a cleaner and more sustainable utilization of the energy system.
The remaining structure of the paper is as follows: Section 2 conducts a literature review on EVs and their impact on the energy system. Section 3 outlines our research methodology, detailing data gathering and analysis approaches. In Section 4, we present our research findings and engage in a thorough discussion of these results. Finally, in Section 5, we provide the key conclusions drawn from our study, offering a comprehensive overview of our research outcomes.

2. Literature Review

The recent surge in EV adoption on a global scale underscores the significant role of transportation electrification in shaping a new era of mobility. According to the International Energy Agency (IEA), the global EV stock surpassed 30 million units in 2022, with exponential sales growth exceeding 10 million in 2022 [9]. This remarkable growth is attributed to advancements in battery technology, supportive policy frameworks, and growing environmental awareness [10]. This transition is altering the transportation sector landscape, diversifying energy sources, and accelerating the shift away from fossil fuels.
In the foreseeable future, the path of EV development heralds a transformative era, marked by a fundamental shift in how we propel vehicles. Governments around the world are strongly dedicated to promoting sustainable transportation, and this dedication is evident in their plans to gradually eliminate internal combustion engine vehicles. For instance, the United Kingdom and France have announced their intentions to halt the sale of new gasoline and diesel vehicles by 2030 [11,12]. Such resolute commitments drive a substantial transformation within the automotive industry, leading to significant investments in cutting-edge EV technologies [12]. This transition is not confined to the automotive sector alone; it has a far-reaching impact on the entire energy landscape, signifying a profound recalibration of our energy systems [13].
Indonesia plays a pivotal role in the global context, embedding itself in the narrative of sustainable mobility and renewable energy integration. Indonesia’s Ministry of Energy and Mineral Resources (MEMR) has laid out an ambitious strategy, positioning EV integration as a linchpin of the nation’s energy agenda [8]. This strategy transcends transportation electrification, embodying a comprehensive commitment to sustainable development: Indonesia’s initiative bridges vehicular electrification and renewable energy propagation, embodying a holistic approach to national progress. The global electric car market has witnessed unprecedented growth, with sales topping 10 million in 2022 and accounting for 14% of all new car sales, reflecting a worldwide pivot toward sustainable transportation. Within this global context, Indonesia has emerged as a notable player in the electric vehicle (EV) sector, showcasing remarkable growth from a relatively modest base. In 2022, the nation saw its EV sales triple compared to the previous year, with electric cars making up about 1.5% of the country’s total car sales. In 2023, the government plans to offer subsidies for the sale of 200,000 electric two-wheelers and 36,000 electric cars, aiming for these to constitute 4% and 5% of sales shares, respectively. These subsidies are expected to lower the cost of electric two-wheelers by 25–50%, enhancing their competitiveness against traditional internal combustion engine (ICE) vehicles [9]. Indonesia aims to produce 1 million electric cars and 1 million electric motorbikes per year in 2035 [14]. A more optimistic report by IRENA [6] suggested that for Indonesia the number of electric cars could be 58 million in 2050.
The proliferation of lithium-ion batteries is at the heart of this transformation, catalyzing an era of electrification. Driven by the wave of EV adoption, the cost of lithium-ion batteries has witnessed a decline, making EVs both environmentally appealing and economically viable [15]. This technological shift shapes the trajectory of EV expansion while fostering a symbiotic relationship between the transportation and energy sectors. This symbiosis redefines energy generation and consumption, driven by the interplay between EVs, renewable energy, and storage systems.
The notable impacts of EVs can be summarized as below:
  • They transform the dispersed emissions arising from conventional gasoline vehicles, which are challenging to manage, into centralized emissions from power plants, which can be more effectively controlled. These emissions can then be addressed using ultra-low emission technologies within power plants, thereby reducing pollution levels [16].
  • As the proportion of renewable energy generation within the power grid rises, the widespread adoption of EVs potentially reduces carbon emissions within the transportation sector [17,18].
  • EVs can serve as valuable assets in enhancing the reliability and sustainability of, and reducing the cost of electricity [19,20].
  • EVs may be able to enhance the flexibility of the power system through V2G technology, aiding the integration of intermittent renewable energy sources. This V2G approach encompasses controlling charging from, and/or discharging to the grid so as to coordinate EV charging with grid load fluctuations and utilizing EV batteries to bolster the energy storage capacity of the power system [21,22,23].
The modes for connecting EVs to the power grid can be classified into three types [23]: uncontrolled charging vehicle (grid to vehicle), unidirectional optimized charging, and bidirectional optimized charging (vehicle to grid) [22]. In the uncoordinated charging case, EV owners charge their vehicles based on individual needs and preferences. The optimized charging option employs incentives or regulations to guide EVs in synchrony with grid operations, reducing peak-hour charging and optimizing power utilization during off-peak periods. Bidirectional V2G harnesses EV batteries as substantial energy storage units dispersed throughout the power system, absorbing and storing fluctuating renewable energy and supplying it back to the grid during peak power demand hours [22].
Several researchers have delved into the study of various aspects of EV penetration, EV charging demand, and the use of EVs as a form of energy storage. Some of these studies have focused on simulating optimal charging strategies [24,25,26] and assessing the impact of different levels of EV penetration [27]. They have explored how EVs influence renewable energy integration [27,28,29,30], emissions [31,32], and cost analysis [33,34]. Additionally, there is ongoing research on V2G strategies and their effects on energy systems and energy storage requirements [35,36,37]. Notably, researchers have investigated the potential of EVs to support renewable energy adoption using electricity systems in various contexts, including simulation data [38], microgrids [24,25,39,40], urban areas [41], regional systems in Europe [27,42], and the US [35]. However, it is important to note that there has been limited research conducted on this topic within the context of Indonesia’s energy system.
The previously mentioned existing studies in this field have focused on specific factors, such as EV charging behavior, EV demand, renewable energy integration, or emissions. Moreover, there has been limited research that considers the broader impact of EVs on a country’s energy storage planning. Furthermore, many of these studies rely on simulation data or data from regions with different electrical systems compared to Indonesia. What sets this study apart is its comprehensive approach. It aims to quantify the impact of electric vehicle penetration and charging behavior on various aspects, including cost, investment in battery energy storage, renewable energy integration, and emissions. Importantly, this research utilizes real data from Indonesia’s electrical system and renewable energy sources. The goal is to provide a detailed exploration of this critical area, with a specific focus on the Indonesian context.

3. Methodology

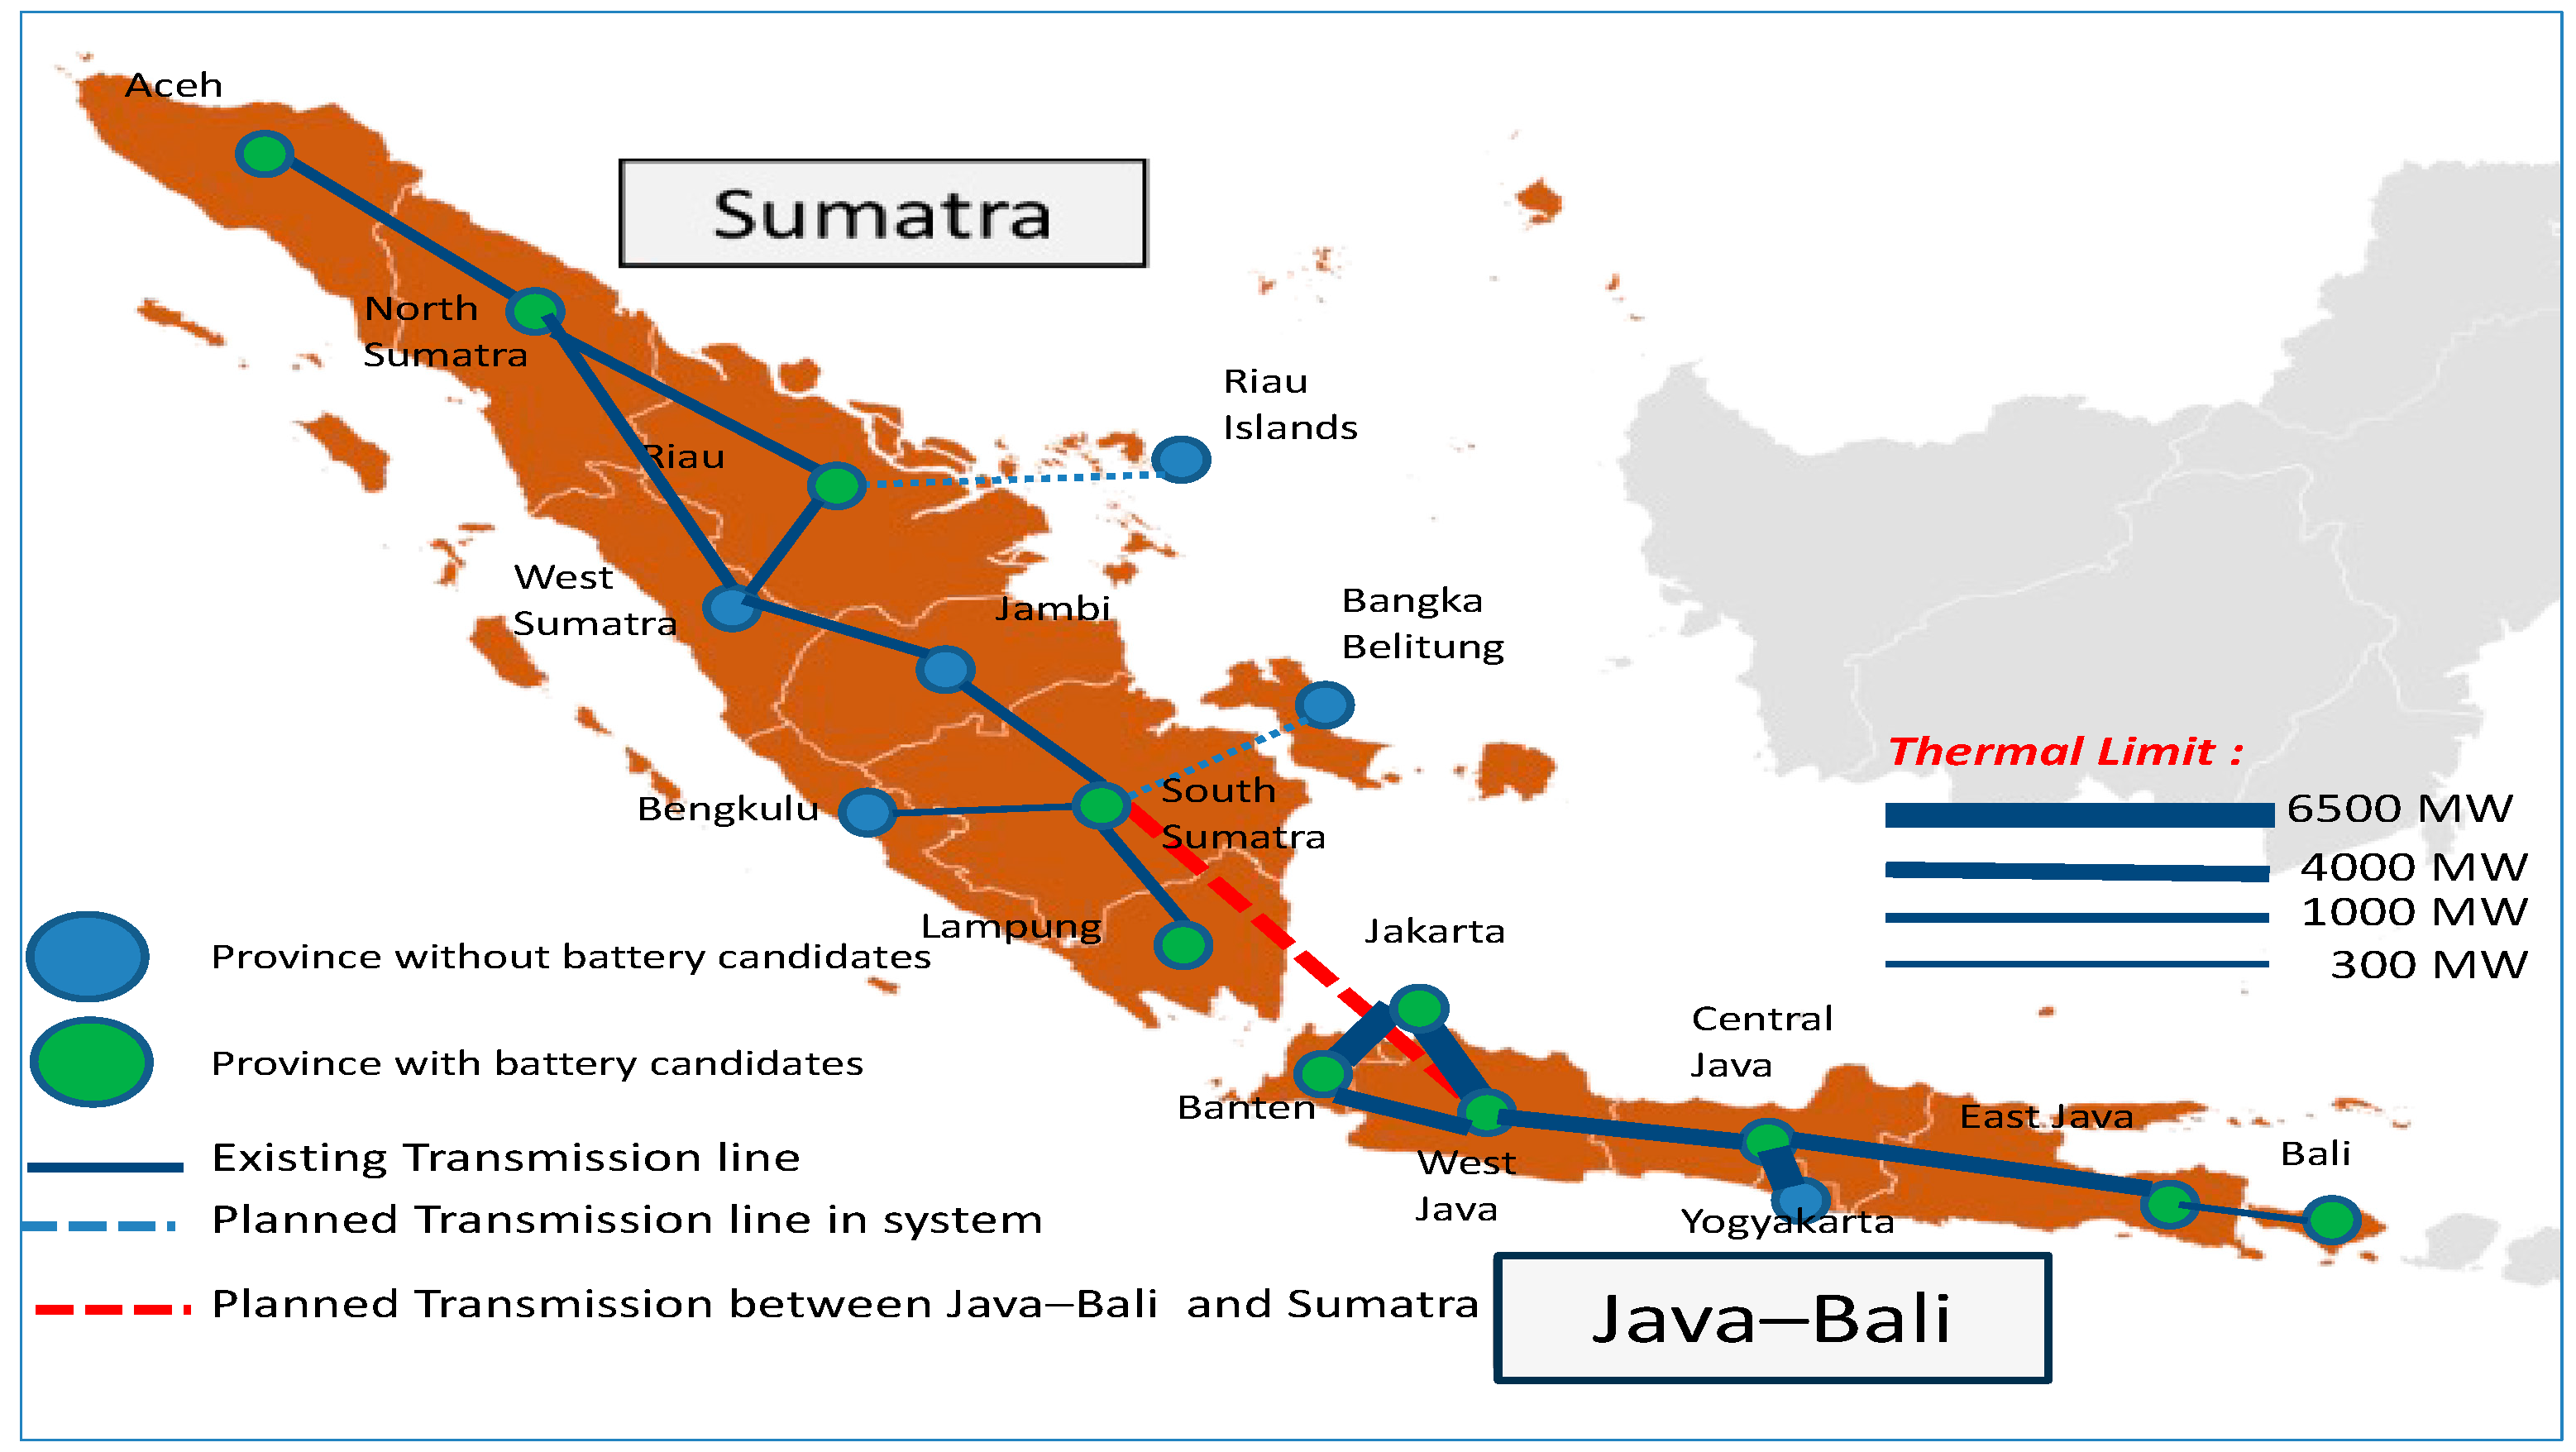
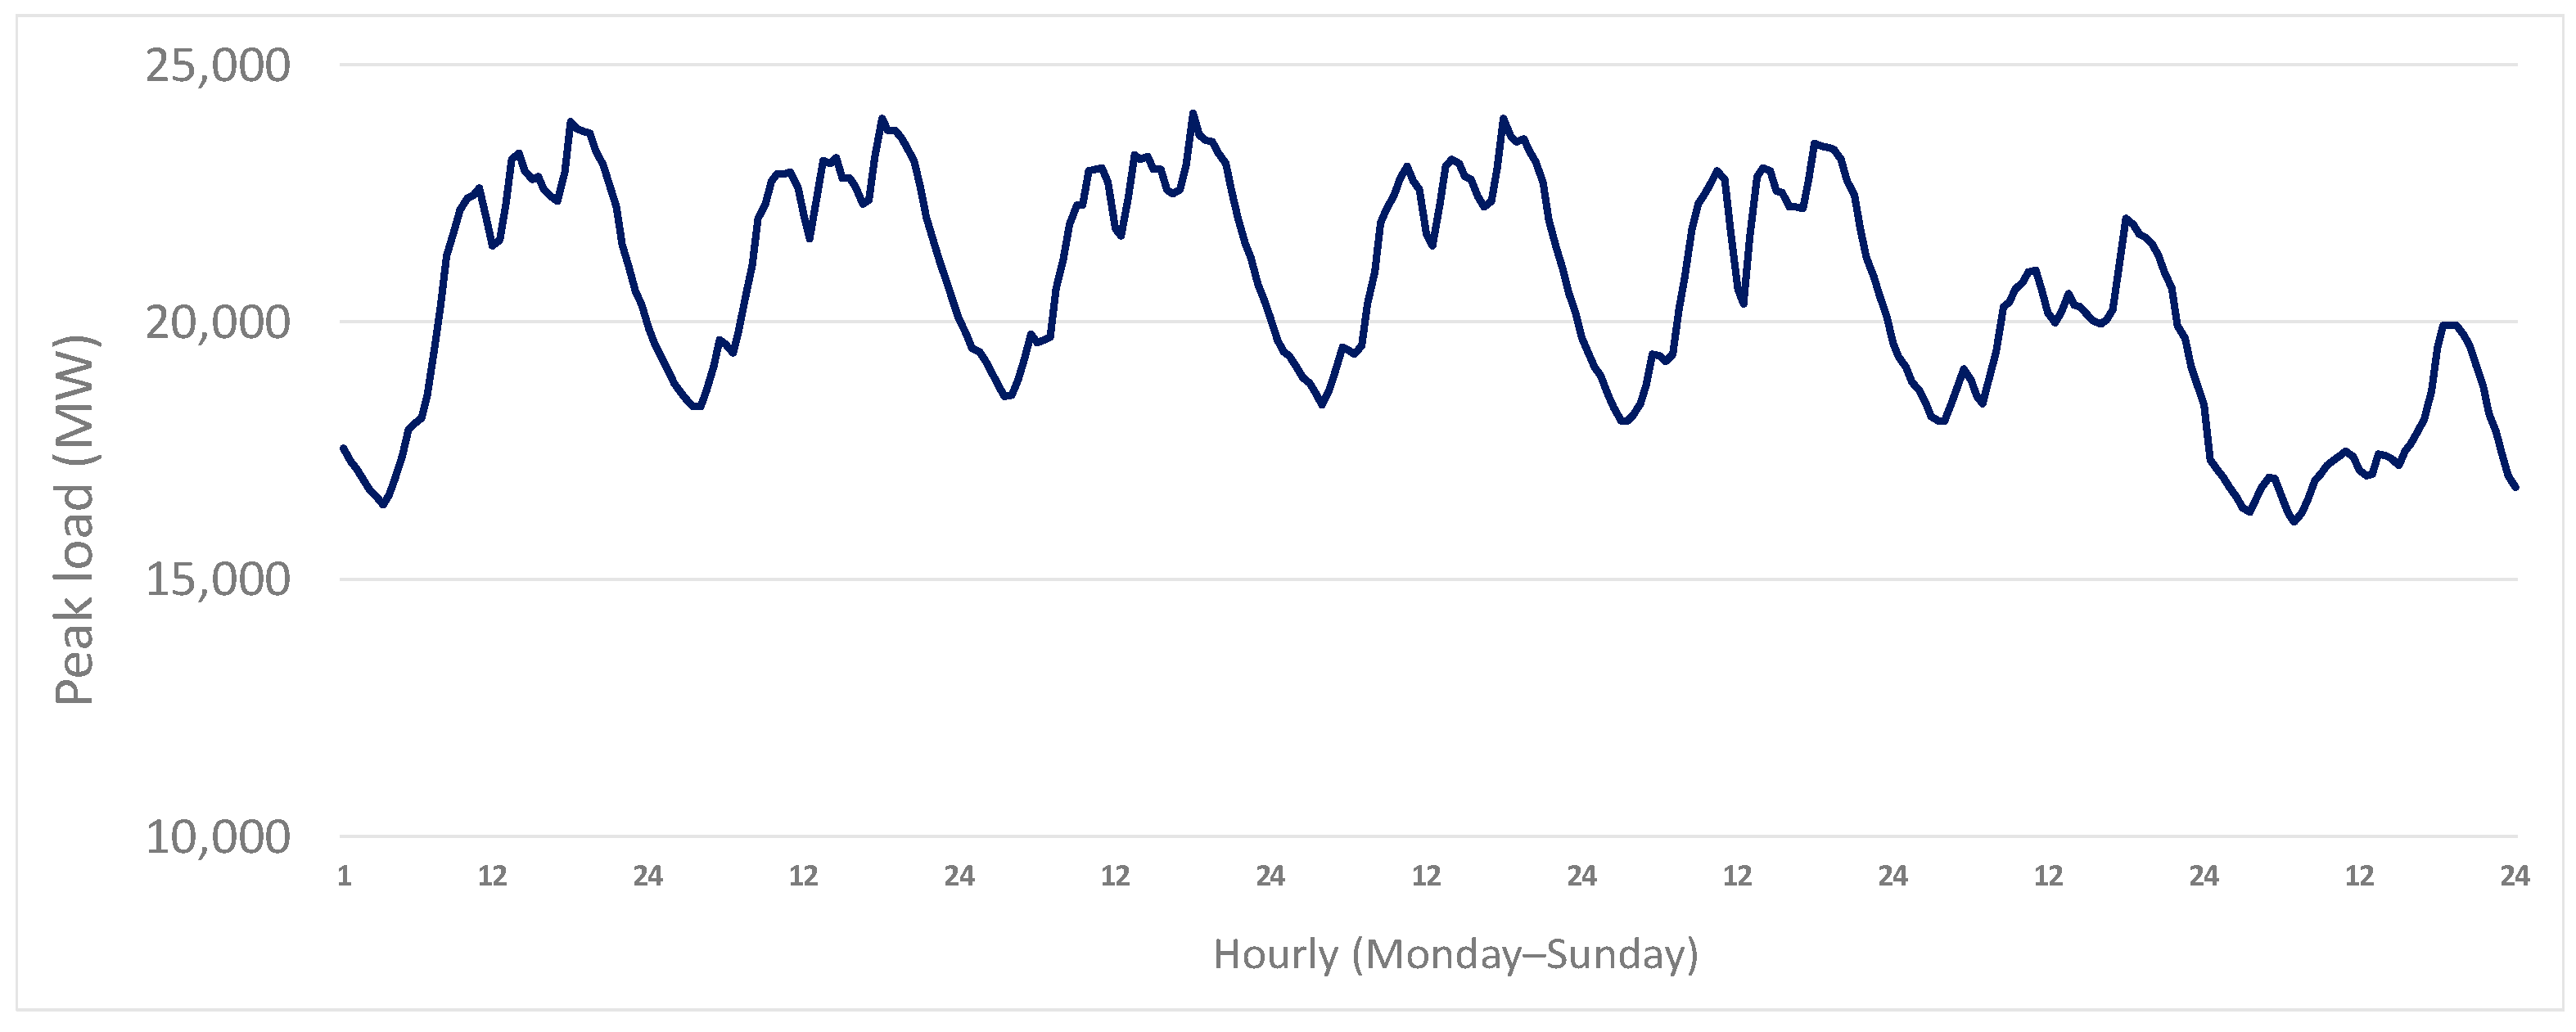
3.1. The Electricity System

The Indonesian electricity system in this model uses 17 nodes representing each province in the Java–Bali and Sumatra Electrical System, with 10 nodes in Sumatra and 7 in Java–Bali (Figure 1). Those two systems are the two biggest electrical systems in Indonesia, which account for 87% of the total demand in Indonesia. These nodes serve as connection locations for generators, power lines, energy storage, and consumers within the PLEXOS framework. In this study, we incorporate projections for integrating EVs from 2030–2050 into the electrical systems of Java–Bali and Sumatra.
This model operates from 2023 to 2050, using an annual step through the ‘Long-Term (LT)’ cost-minimization module as highlighted in Equation (1) [42,43]. This LT module determines the required investments related to power generation and energy storage, which can either function independently or in a connected manner. The LT module operates a 1-year step size on two weeks sampled per year with hourly resolution. The model internally computes the required new power generation and storage capacity, using a scenario-based approach that accounts for current data for generators, transmission lines, future installation projections, and the unique features of electrical system [44]. The hourly load is represented by historical data from the Java–Bali system in 2018 [45], with 10 years of hourly data for renewable energy resources from Renewable Ninja [46,47]. The model has some constraints, such as a minimum renewable energy requirement based on the targets of Indonesia, the ramping operation parameters of the generators, and transmission power flow constraints.
The weekly base load profile of this model is derived from the 2018 Java–Bali evaluation report [45] and is subsequently expanded each year in alignment with the Indonesian business-as-usual prediction of a 4.9% annual energy increase [44]. This profile is adopted as the basis of a zero electric vehicle (EV) charging scenario, targeting a shift to 100% renewable energy by 2060. Targeting renewable energy indirectly reduces the emissions from fossil fuels, as each type of fossil fuel is associated with a specific emission factor. Figure 2 illustrates the weekly base load profile without the inclusion of EV charging demands.

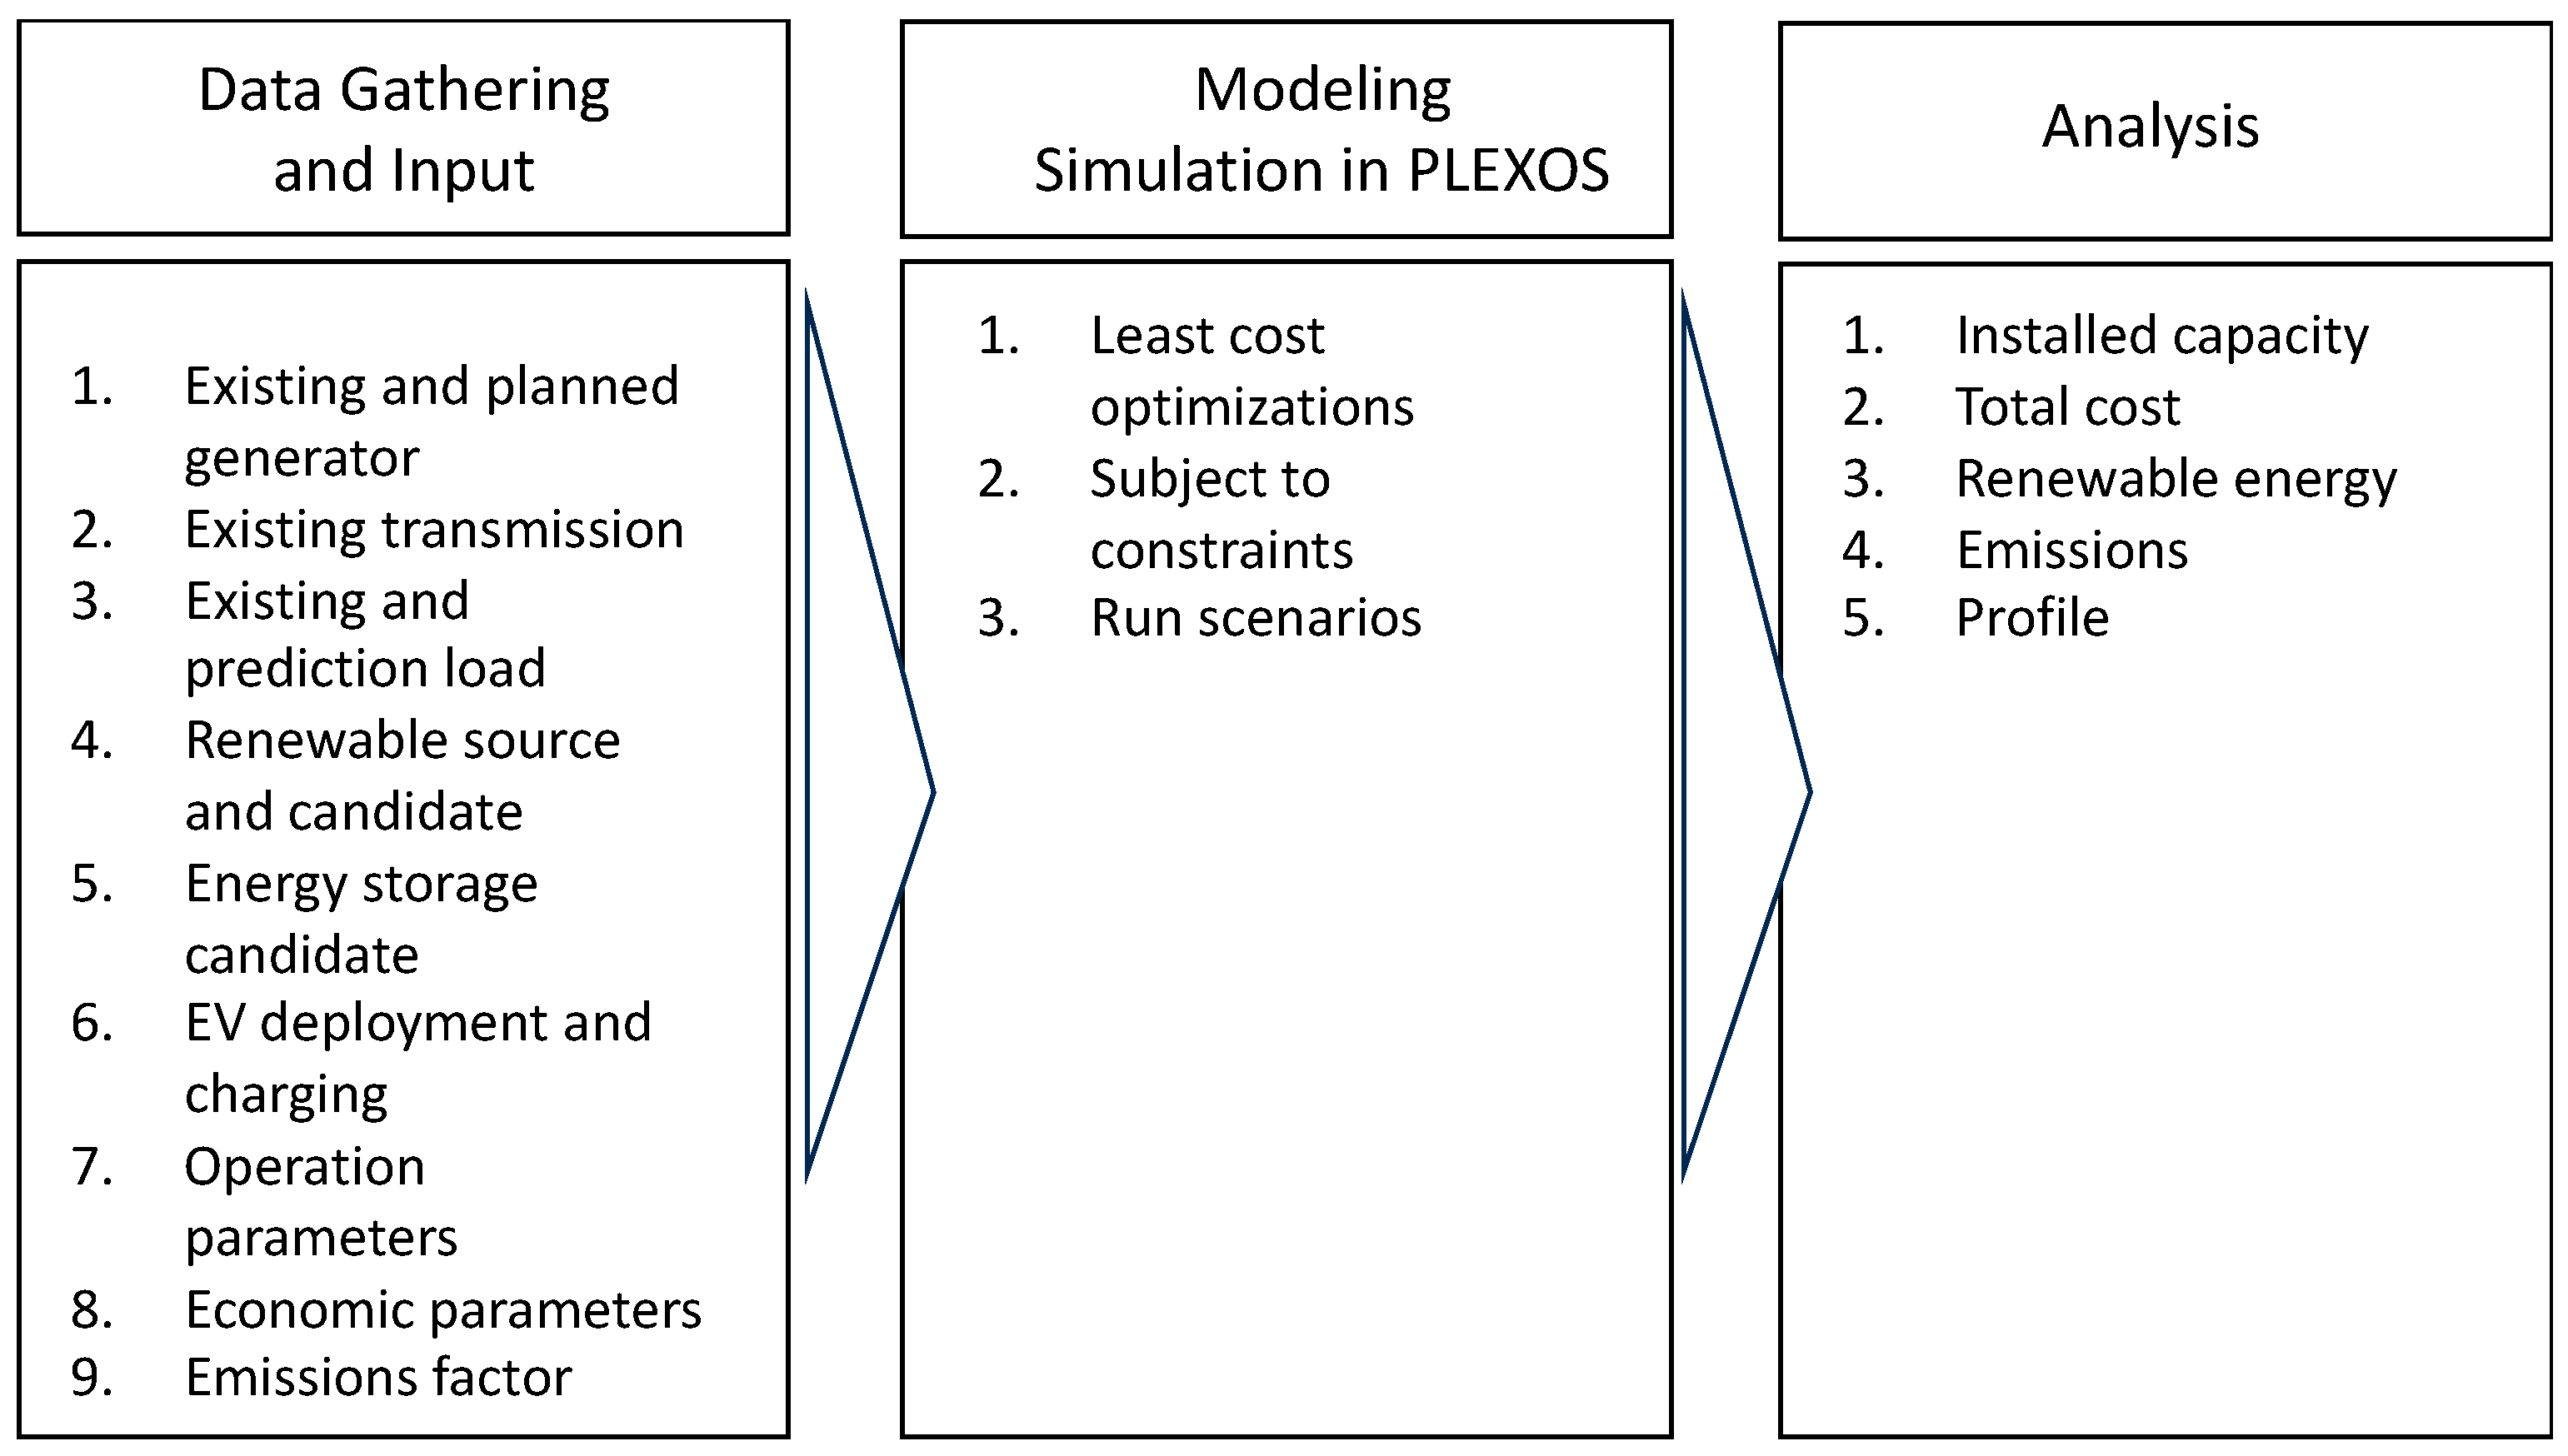
3.2. Modeling Approach

The study employs the PLEXOS simulation tool, widely recognized for its capacity to model complex energy systems and optimize cost-efficient solutions. PLEXOS is utilized to simulate Indonesia’s intricate electricity system, offering a comprehensive assessment of various parameters that shape energy dynamics. These parameters include hourly demand profiles, solar photovoltaic (PV) generation profiles, power generation characteristics, battery investments, ramping rates, fuel costs, and EV charging patterns. Using the long-term (LT) expansion cost optimization model, the objective function [48] is to minimize the net present value of the system’s cost over the period of model. This LT module tailored the required investments and operation for generation, energy storage [42], and optimal charging and discharging EV. Additionally, the LT made use of sample hourly profile two weeks per year and the outcomes were then extrapolated to represent the entire year based on that sample. The overarching methodology of the model is depicted in Figure 3, providing a visual guide to the approach taken in this study.
The formula [42,49] of the model is to minimize:
y g , b D F y ( B u i l d C o s t g G e n B u i l d g , y + B u i l d C o s t b B a t t B u i l d b , y ) + D F y ( F O M C h a r g e g 1000 P M A X g   U n i t s g + i y G e n B u i l d g , i   + [ F O M C h a r g e b 1000 B M A X b   U n i t s b + i y B a t t B u i l d b , i   ] ) + t D F t y L t [ V o L L × U S E t + g ( S R M C g × G e n L o a d g , t ) ]
where: ‘y’ is the total horizon of simulation; ‘g’ is the generator; ’b’ is battery storage; “DF” is the discount factor [DF = 1/(1 + D)y] where ‘D’ is annual discount rate; ‘BuildCost’ is the overnight build cost; ‘GenBuild’ the number of generator units built in the year ‘i’ for generator ‘g’; ‘BattBuild’ is the number of batteries built in the year ‘i’ for battery ‘b’; ‘FOMCharge’ is the Fixed operations and maintenance charge of generator ‘g’ or battery ‘b’; ‘PMAX’ is the Maximum generating capacity of each generator ‘g’; ‘BMAX’ is the Maximum generating capacity of each battery ‘b’; ‘Units’ is the number of installed generating units of generator ‘g’ or battery ‘b’; ‘GenBuild’ is the number of built generating units of generator ‘g’; ‘Lt’ is Duration of dispatch period t; ‘VoLL’ is the Value of lost load; ‘USE’ is unserved energy; ‘SRMC’ is short-run marginal cost generator = Heat Rate * Fuel Cost + Variable Operation and Maintenance Charge; ‘GenLoad’ is the dispatch level of generating unit ‘g in period ‘t’.
Subject to:
  • Energy Balance
g G e n L o a d ( g , y ) + U S E t = D e m a n d t   t D e m a n d = N a t i v e   D e m a n d + E l e c t r i c   V e h i c l e   D e m a n d
2.
Feasible energy dispatch
G e n L o a d g , t P M A X U n i t s g + i y G e n B u i l d g , i
3.
Feasible build
i y G e n B u i l d g , i   M a x U n i t s B u i l t g , y
4.
Renewable energy target
i y G e n L o a d R e n e w a b l e g , i R e n e w a b l e   E n e r g y   T a r g e t %   D e m a n d i  

3.3. General Parameters in the Model

In this model, the existing power plants and transmission lines of Indonesia’s electrical system are represented in the model’s initialization [44]. The existing power generation data are detailed in Table A1 in Appendix A. Given that the current power generation fleet is relatively new, and our simulation relatively short, we have not taken into account forced retirement of power plants. However, the model chooses whether or not to utilize the existing power plants in the optimal solution. Power plants not used in the later periods of the model would be described as stranded assets.
The power generation options for the model to add to the system include open cycle gas turbines (OCGT), combined cycle gas turbines (CCGT), biomass, geothermal, solar, hydro, and wind energy. Table A5 in Appendix A outlines the maximum generation capacities for renewable energy sources. Since Indonesia has a target to achieve 100% renewable energy in 2060, we assume there is no new-build coal generation except those plants which have already been planned [46]. There are no official plans for expanding transmission infrastructure, but in our model, the power transfer capacity between regions is set to increase by 25% every five years in line with demand growth to avoid constraints that would be likely to be addressed through network planning and capacity expansion.
Data for renewable energy resources are sourced from Renewable Ninja for 2011–2020. The settings used for solar generation are equator-facing fixed-axis PV panels with a 10-degree tilt. Wind data were only chosen from three provinces in Java–Bali and Sumatra as the data source (Aceh, Banten, and West Java), because of the limitations on wind resource in Indonesia.
Energy storage candidates are located in 10 provinces, as depicted in Figure 1, and comprise lithium-ion batteries with 2 h, 4 h, and 10 h discharge durations. Most of the above data have also been used in our previous research on optimal energy storage configurations for Indonesia. Additional parameters for generators, energy storage, fuel, and renewable energy potential can be found in Table A3, Table A4 and Table A5 in Appendix A, referencing various sources such as [8,44,50,51,52,53,54,55,56,57,58].

3.4. EV Modeling and Charging Stations

In this study, we employ a novel transport module from PLEXOS 9.2. There are still limited studies using this module in the research; the latest research uses storage as a representation of EVs [42]. This module provided two distinct methods for representing EVs. The simpler of these treats an EV as a static electrical load, which consumes a fixed amount of power, measured in kilowatts (kW), at predetermined times. This model is particularly useful for scenarios where EV charging has a predetermined hourly schedule and does not optimize (as shown in Figure 9a). On the other hand, a more complex model allows for representing EV demand in kilometers driven, incorporating additional parameters like efficiency (Wh/km) and battery capacity, as shown in Table 1. This approach can facilitate optimized charging that adjusts to the vehicle’s optimal time to charge. To further refine the model, each EV is associated with a “home” charging station capable of delivering up to 10 kW of power.
The EV and charging station modules feature key parameters, including the maximum charging and discharging rates. These rates are crucial in determining the functionality of an EV, specifically whether it serves merely as a load or includes V2G capabilities. In scenarios with a predetermined charging period, all EVs are equipped with a charging parameter, while none have the capability to discharge. For V2G scenarios, half of the EVs are allocated discharging parameters, and all vehicles have charging capabilities. Motorbikes, in contrast, have no discharging parameters and are solely equipped with the ability to charge. To ensure the model remains computationally efficient, it scales down the real world by representing 10,000 actual EVs or charging stations as a single unit within the simulation.
In the process of modeling electric vehicles (EVs), an essential factor considered is the emission reduction achieved through replacing internal combustion engine (ICE) vehicles with EVs. This is quantitatively represented by incorporating an ‘emission distance coefficient’. This coefficient effectively measures the decrease in emissions for every kilometer driven or the equivalent energy consumed in kilowatt-hours (kWh) by an EV, as opposed to an ICE vehicle. Specifically, the ‘emission distance coefficient’ is defined as the amount of emissions that would have been produced by an ICE vehicle [59] for the same distance. By introducing this coefficient into the model, it becomes possible to account for the environmental benefits of adopting EVs, showcasing the reduction in emissions attributable to the substitution of ICE vehicles with their electric counterparts.
Table 1. The parameters of electric cars and motorbikes in the model.
ParametersUnitElectric CarMotorbike
Efficiency(Wh/km)162 [60]31 [61]
DemandKm/day32.8 [62]32.8 [62]
DemandkWh/day5.3 [62]1.0192 [62]
Battery CapacitykWh64 [60]1 [61]
Emission Distance Coefficientkg CO2/km−0.216 [59]−0.0313 [59]

3.5. Deployment Scenarios

We have formulated three distinct EV deployment scenarios—base, middle, and high—considering the projected adoption of EVs. These scenarios encompass both cars and motorbikes, recognizing the dual nature of the transportation landscape in Indonesia. Our estimation for the total number of vehicles in 2050 is based on population projections from the Indonesian Central Bureau of Statistics (BPS) [63], which anticipates a population of 329 million and 84 million households by that time. We assume a ratio of one car per household and two motorbikes per household. The deployment of electric cars and motorbikes will be determined based on the percentage of the total vehicles within each scenario. The base method aligns with the roadmap set forth by the government of Indonesia [14]. In contrast, the medium and high methods represent situations where the penetration of EVs becomes a much more substantial portion of the total number of vehicles. The complete demand scenarios are shown in Table 2.
Charging patterns are segmented into fixed times, including early morning, daytime, and evening, as well as an optimized time designed to leverage flexibility to maximize the benefit of integrating EVs into the grid. These scenarios collectively capture the intricate interplay of EV charging dynamics and demand variability. The shape of the charging profiles is shown in Figure 9a in the results section.

3.6. Scenario Formulation

A total of 17 scenarios (shown in Table 3) are crafted by blending different charging times with varying EV deployment levels, V2G functionality, and additional cost for charging the EV. These scenarios encapsulate a wide spectrum of EV adoption trajectories, enabling a nuanced exploration of the challenges and opportunities associated with EV integration in Indonesia’s energy system. The diverse scenarios provide a comprehensive view of the potential impacts of EV adoption on grid operations, renewable energy integration, and emissions reductions. The charging time consists of fixed and optimized times, as shown in Figure 9a. While the discharging as part of V2G functionality results from the optimal solution. For V2G scenarios, only 50% of the electric vehicles have V2G functionality.

3.7. Treatment of Vehicle-to-Grid Charging Costs

In the current PLEXOS release, there are no parameters available to model battery degradation cost for V2G. We therefore simulate battery degradation by adding charging station charge cost for different numbers. Even though it does not directly represent the degradation of battery cost, it can show how the additional cost to make the charging station have V2G functionality can affect the capacity of generation, battery, emissions, and renewable energy. When the extra cost is more or less than USD 25/MWh, the optimal solution will choose to use the V2G rather than build additional stationary battery capacity. However, when the charge cost is USD 50/MWh, it will instead develop or use stationary battery energy storage.

3.8. The Main Contribution of the Paper

This paper introduces a new methodology employing detailed energy system modeling to analyze the dynamic interactions between EV demand, renewable energy sources (specifically solar PV), and critical power generation and battery system parameters. The main contributions of this paper are:
  • The study assesses the impact of EV integration on the optimal configuration and operation of the electricity grid. This assessment considers the penetration of renewable energy sources, the evolution of power generation, the deployment of battery systems, and the resulting emissions. The study delves into the intricate interdependencies between these factors, offering a comprehensive understanding of the potential ramifications of EV integration.
  • The adoption of an hourly energy flow analysis. By capturing the nuanced fluctuations in energy demand and supply on an hourly basis, the study offers a holistic perspective on the challenges and opportunities of EV integration. This temporal granularity allows for a more nuanced evaluation of EV impacts on energy systems, bridging the gap between real-world dynamics and modeling outcomes.
  • The utilization of real-world electricity generation data from Indonesia. This incorporation enhances the accuracy and applicability of the analysis, aligning the findings with the actual conditions of the country’s energy landscape. By grounding the analysis in empirical data, the study offers insights that resonate with Indonesia’s energy context and transition goals.
  • The study is the first of a comprehensive assessment of EVs’ impact and contribution in Indonesia toward net zero emissions by considering the hourly variation in power generation, transmission power flow, demand and dispatch of renewable energy resources combined with battery investment in the provinces in Java–Bali and Sumatra.
The combination of these contributions underscores the comprehensive nature of this paper’s exploration into the symbiotic relationship between EVs, renewable energy integration, and the dynamics of energy systems. By merging theoretical insights with real-world data, this study forms a foundation for strategic policy interventions, technological advancements, and informed decision-making that collectively drive sustainable energy transition in Indonesia and beyond.

4. Results and Discussion

The analysis reveals that optimized charging strategies increase renewable energy utilization, reduce emissions, and improve system efficiency. Integrating EVs with renewable energy sources reduces the need for conventional power generation during peak demand, enhancing overall grid sustainability. The analysis of the formulated scenarios reveals significant insights into the impacts of EV integration on Indonesia’s energy system.

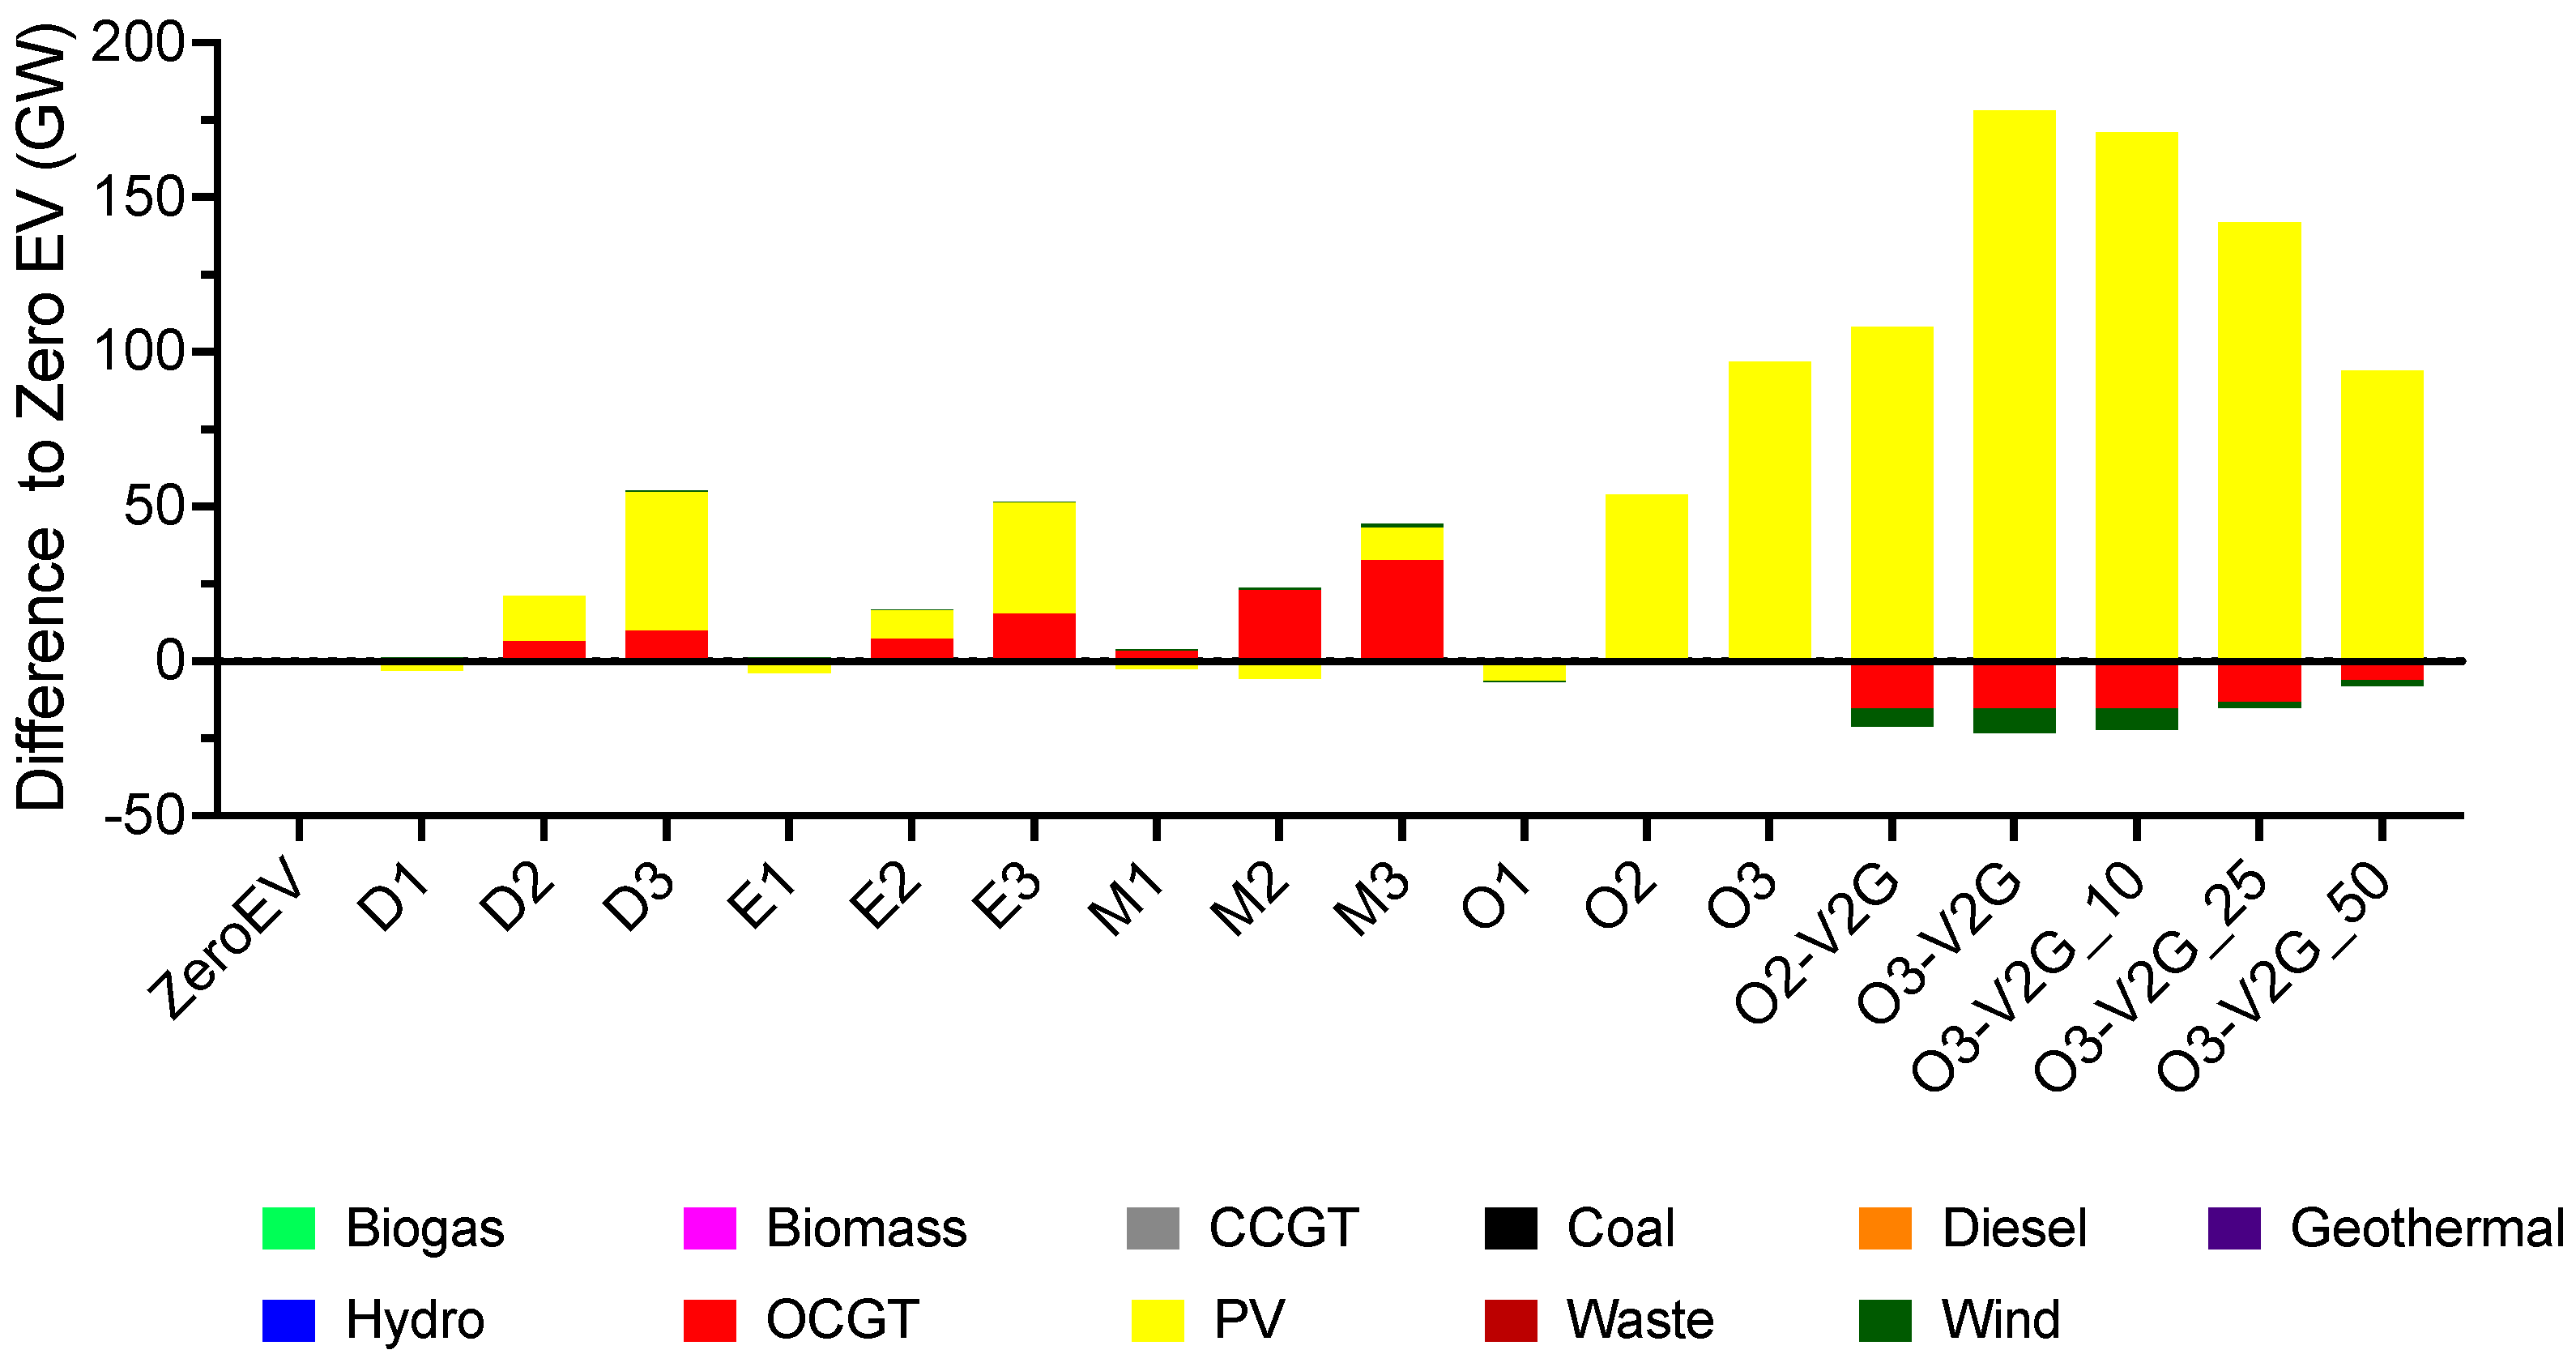
4.1. Generator Installed Capacity

Integrating EVs results in a higher demand for electricity and increased requirements for electricity generation capacity. The choice of power plant technology for expansion is contingent upon the timing of EV charging. When most charging occurs during the day, the optimal approach is to maximize solar power generation by strategically deploying PV systems. Conversely, during periods of elevated load in the middle of the night or early morning, a competition arises between constructing a thermal power plant, which offers rapid response and start-up capabilities, or investing in battery storage for storing excess energy generated from PV sources. It is noteworthy that for nighttime EV charging, the preference leans toward constructing open cycle gas turbine (OCGT) power plants rather than prioritizing battery storage infrastructure.
As shown in Figure 4, compared to the zero-EV scenario which has a total installed generation capacity of 467 GW, the installed generation capacity for daytime charging increases by 12%, for evening charging by 4%, and for early morning charging by 9%. When opting for optimized charging, the capacity requirement increases by 21% due to the increased adoption of lower-availability factor solar PV systems. The predominant technologies in these scenarios are PV systems, which dominate in optimized daytime and evening charging. Conversely, for fixed-time charging during the early morning, open cycle gas turbine (OCGT) technology is favored for capacity expansion.
Implementing V2G systems can enhance optimal PV capacity by as much as 33%, concurrently diminishing the necessity for expanding open cycle gas turbine (OCGT) and combined cycle gas turbine (CCGT) facilities. In the absence of supplementary costs, the optimal strategy involves increasing solar PV usage, with the excess energy stored in V2G batteries. However, when additional costs for V2G are considered, the installation of PV systems decreases compared to scenarios without such costs. This suggests that if V2G costs are recognized, there is no urgent need to augment the number of PV installations, as the current PV capacity is sufficient to store energy in the already-established battery systems.

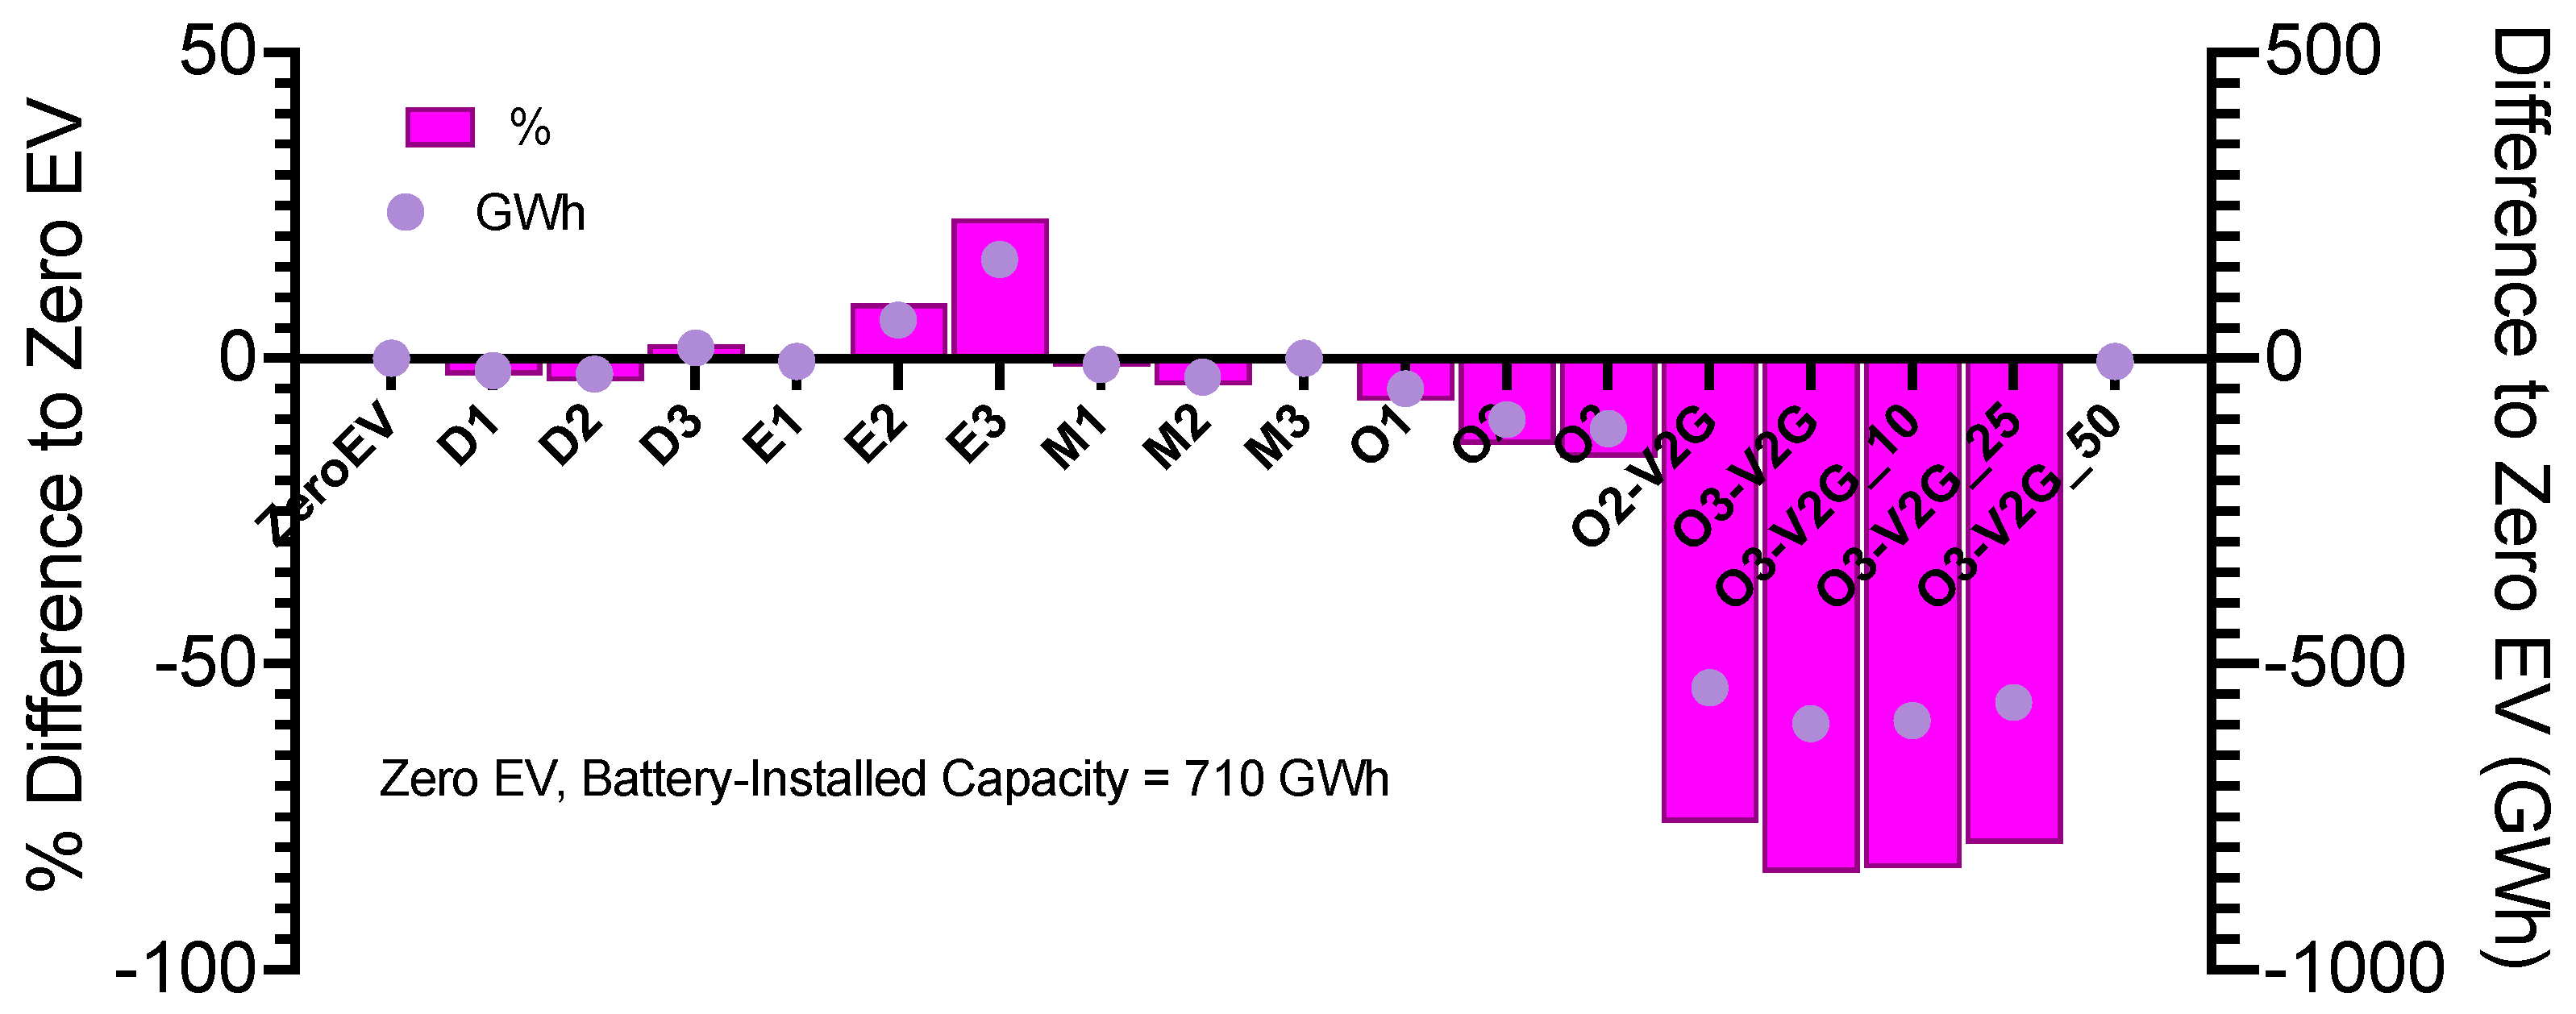
4.2. Battery-Installed Capacity
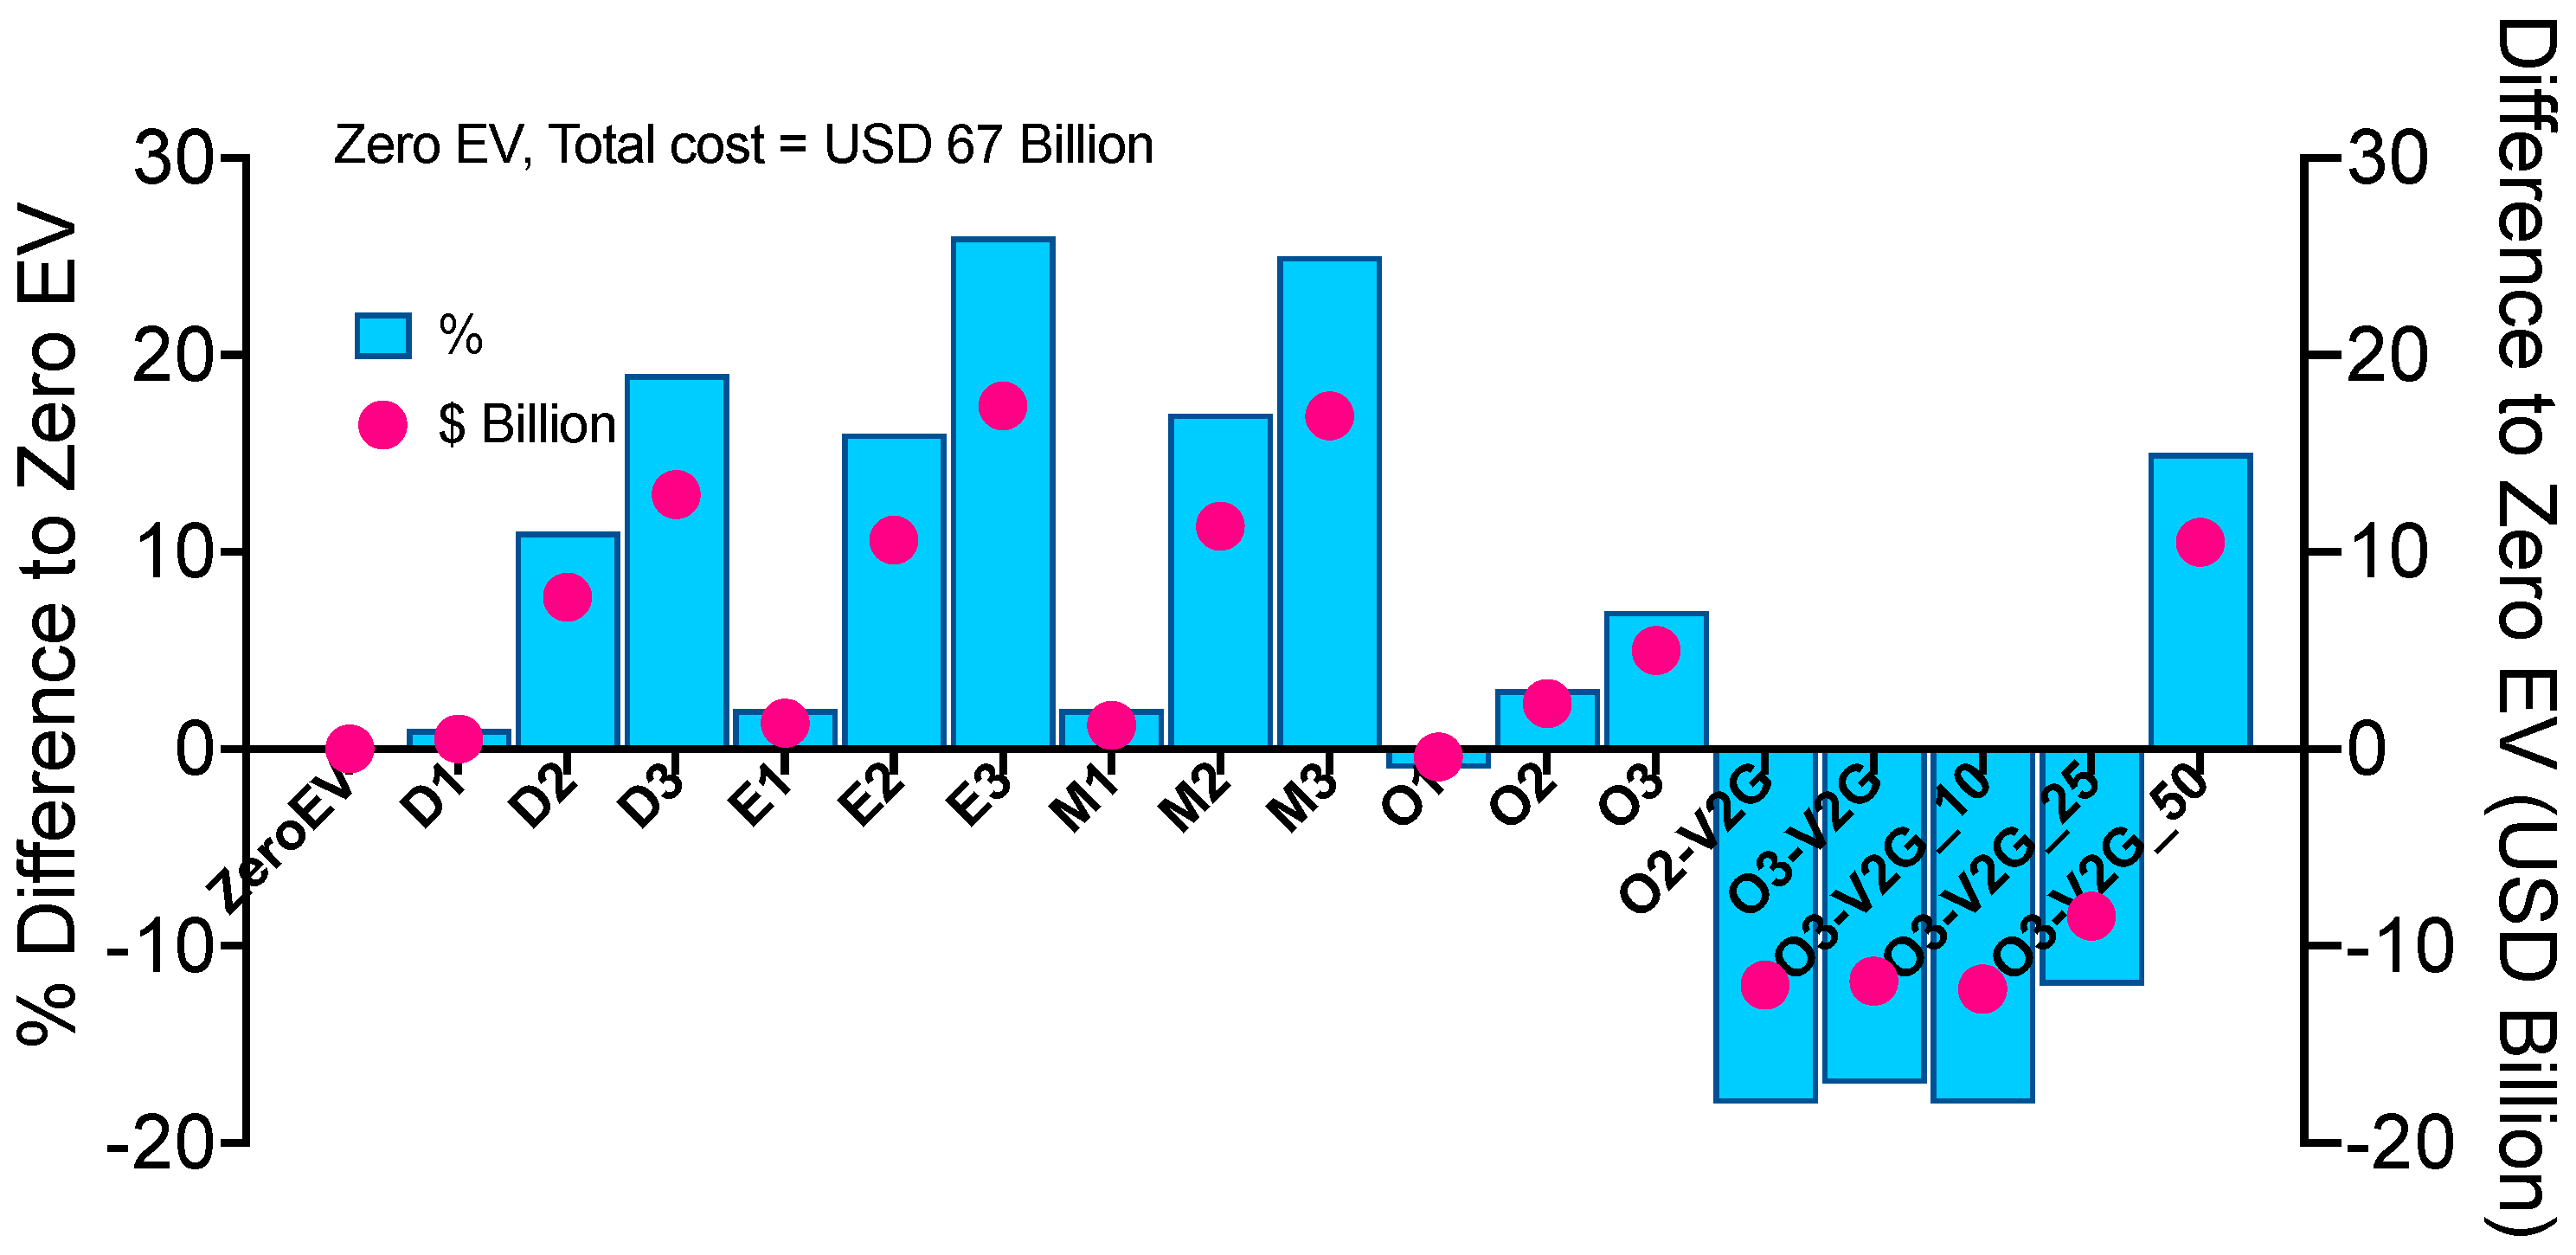
Specific charging behaviors have a direct impact on the optimal deployment pattern of batteries. Evening charging scenarios require larger battery capacities due to the surge in electricity demand during peak hours when solar PV generation is limited. In contrast, optimized charging scenarios demand comparatively smaller battery capacities, while daytime and early morning charging patterns exhibit similar battery requirements. This trend can be attributed to the effective utilization of excess solar PV energy during daytime charging. As depicted in Figure 5, a scenario with zero EVs necessitates a battery-installed capacity of 710 GWh by 2050.
Notably, the requirements are nearly identical for daytime charging (an increase of 2%) and early morning charging (a rise of 0.1%). However, there is a substantial increase of 22.8% in battery capacity needs in the evening charging scenario. In the optimized charging scenario, which primarily utilizes power directly from PV sources, the need for batteries is significantly reduced, resulting in a decrease in battery capacity by 16%.
Incorporating optimized charging and enhanced functionality could result in a significant decrease—up to 84%—in the required number of energy storage units. Energy can be efficiently stored in EV batteries and utilized as needed, a concept that is further explored in Section 4.8. Nonetheless, when factoring in additional vehicle charging costs, the optimal number of batteries increases. If the V2G charging cost reaches USD 50/MWh, the required number of batteries would be comparable to the scenario where no EVs are utilized for V2G.

4.3. Total Cost

Evaluating total system costs across different charging time scenarios demonstrates that optimal charging strategies result in the lowest prices. Following optimal charging, daytime charging emerges as the second most cost-effective approach. Conversely, early morning charging is associated with the highest total system costs due to the simultaneous rise in electricity generation demand and limited renewable generation during this period.
As depicted in Figure 6, by integrating V2G technology, the overall system costs can be reduced, provided the cost is below USD 25/MWh, compared to systems with optimized charging alone. The total system cost was reduced due to lower open cycle gas turbine (OCGT) requirements and a lesser need for energy storage construction. Despite the increased demand for photovoltaic (PV) installations, this configuration is ultimately more cost-efficient in comparison to the alternatives involving larger energy storage and OCGT setups. However, if V2G charging costs rise to USD 50/MWh, the total expenses surpass those of optimized charging systems without V2G capabilities. This indicates that V2G has the potential to lower total system costs if additional costs can be minimized effectively.

4.4. Renewable Energy Percentage

The integration of optimized charging strategies achieves a notable increase in the penetration of renewable energy sources. In contrast, non-optimized charging scenarios exhibit relatively lower renewable energy integration, particularly during evening and early morning charging periods. This observation underscores the potential of EVs to enhance renewable energy utilization.
As shown in Figure 7, in the case of zero EV penetration, a 67% renewable energy (RE) target can be achieved; however when the EV load is added with fixed-time charging it can lead to lower renewable energy uptake with an increase in the use of OCGT and coal to cover the increasing demand during the charging time (RE 64% for D3, and RE 63% for E3). The early morning charging scenario (M3) has the least renewable energy uptake (RE 60%), because it needs more OCGT to meet the load requirements. By using optimal charging, RE is increased to 71% to total supply and by combining the optimal charging with vehicle to grid, the penetration of RE can increase to 77%. V2G capabilities enhance the penetration of renewable energy by leveraging the increased storage to harness energy from PV sources. Even with V2G facility costs escalating to USD 50/MWh, V2G remains competitively priced in comparison to optimized charging systems that operate at zero cost.

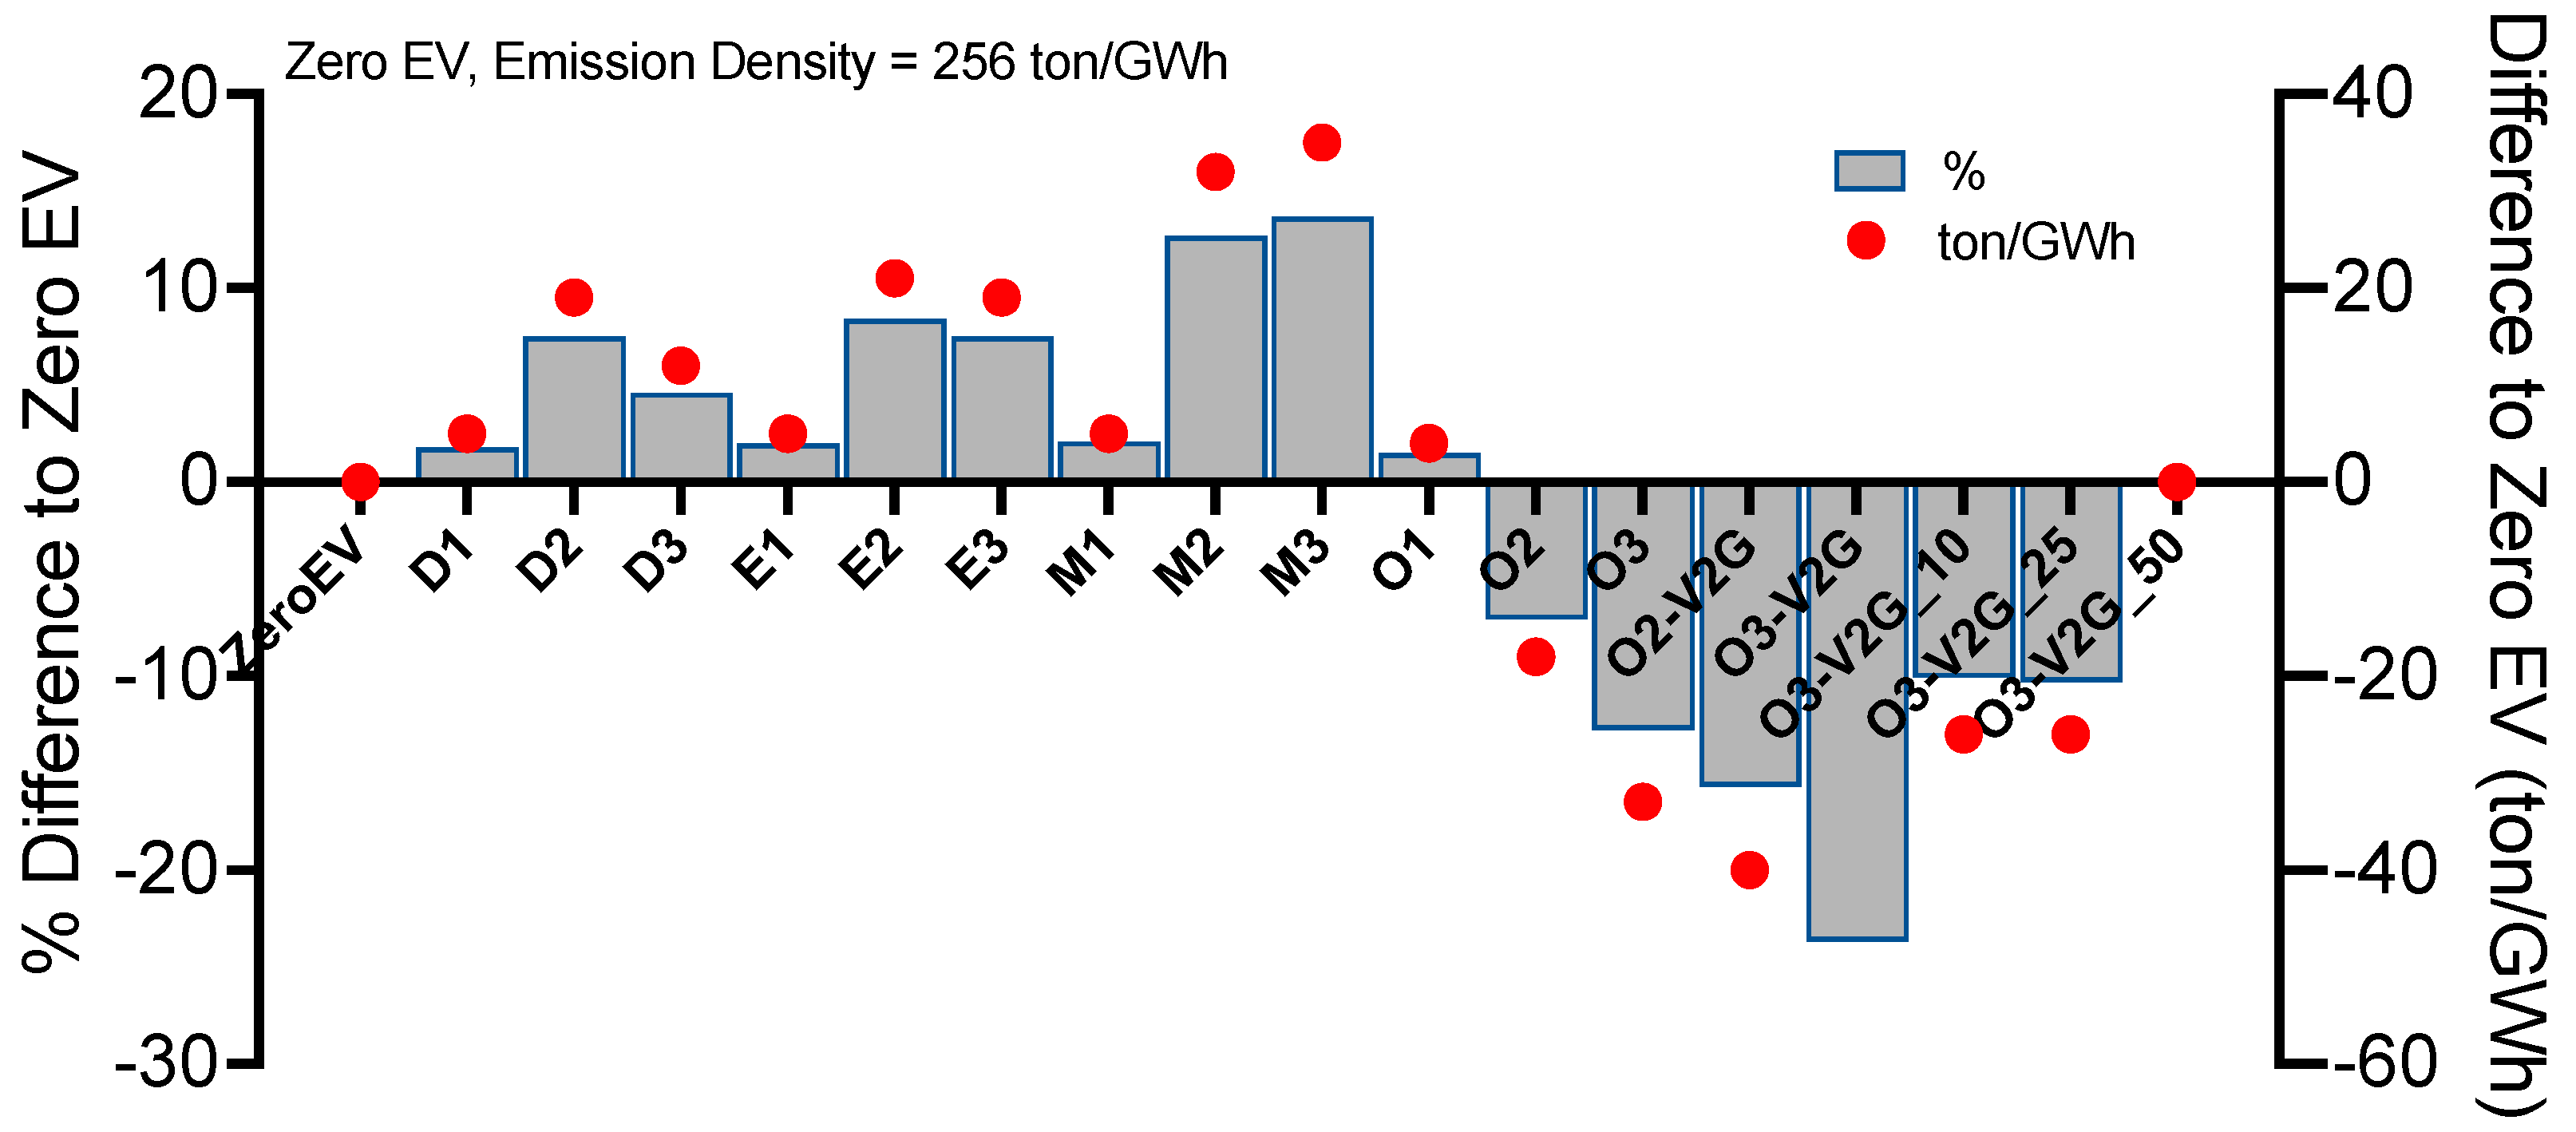
4.5. Emission Comparison

While EVs contribute to reduced emissions compared to conventional vehicles, non-optimized charging behaviors may lead to higher emissions when compared to scenarios without EVs. Early morning charging scenarios exhibit the highest emissions, followed by evening and daytime charging, highlighting the significance of efficient charging strategies in minimizing emissions.
This analysis indicates that although EVs have the potential to reduce overall emissions, as suggested by the relatively negative value assigned to EV emissions in our calculations, this is not always the case. Inefficient charging times can necessitate the increased use of fossil fuel power plants, inadvertently increasing emissions beyond those in scenarios without EVs. However, the use of V2G functionality can mitigate total emissions by optimizing the use of PV energy stored in EV batteries. As depicted in Figure 8, it is noteworthy that when V2G incurs an additional cost of USD 50/MWh, the emissions equate to scenarios devoid of EVs.

4.6. Vehicle to Grid

In both the O2-V2G and O3-V2G scenarios, total system costs are notably lower compared to scenarios O2 and O3. This cost reduction primarily stems from the choice to utilize the EV’s battery instead of constructing separate energy storage systems. The calculated value, derived from the difference in total costs between the optimized scenario with and without V2G, considering a discount rate of 10% and a 15-year lifetime, suggests that the value of V2G per unit amounts to USD 1500. However, it is crucial to note that this calculation does not yet account for additional battery degradation resulting from V2G functionality.
Battery degradation rates can vary based on several variables such as battery chemistry, the number of cycles per day, state of charge, depth of discharge, and the specific functionality of the EV’s battery, including its role as an ancillary service for tasks like peak shaving, as discussed in the literature [64,65]. Research conducted by [66] indicates that the extra battery degradation attributable to V2G functionality falls within the range of a 1–12% reduction in capacity, while another study indicates an incremental degradation rate of 0.155% per annum, attributable to daily discharge cycles in the studied context [65].

4.7. Comparison Charging Pattern
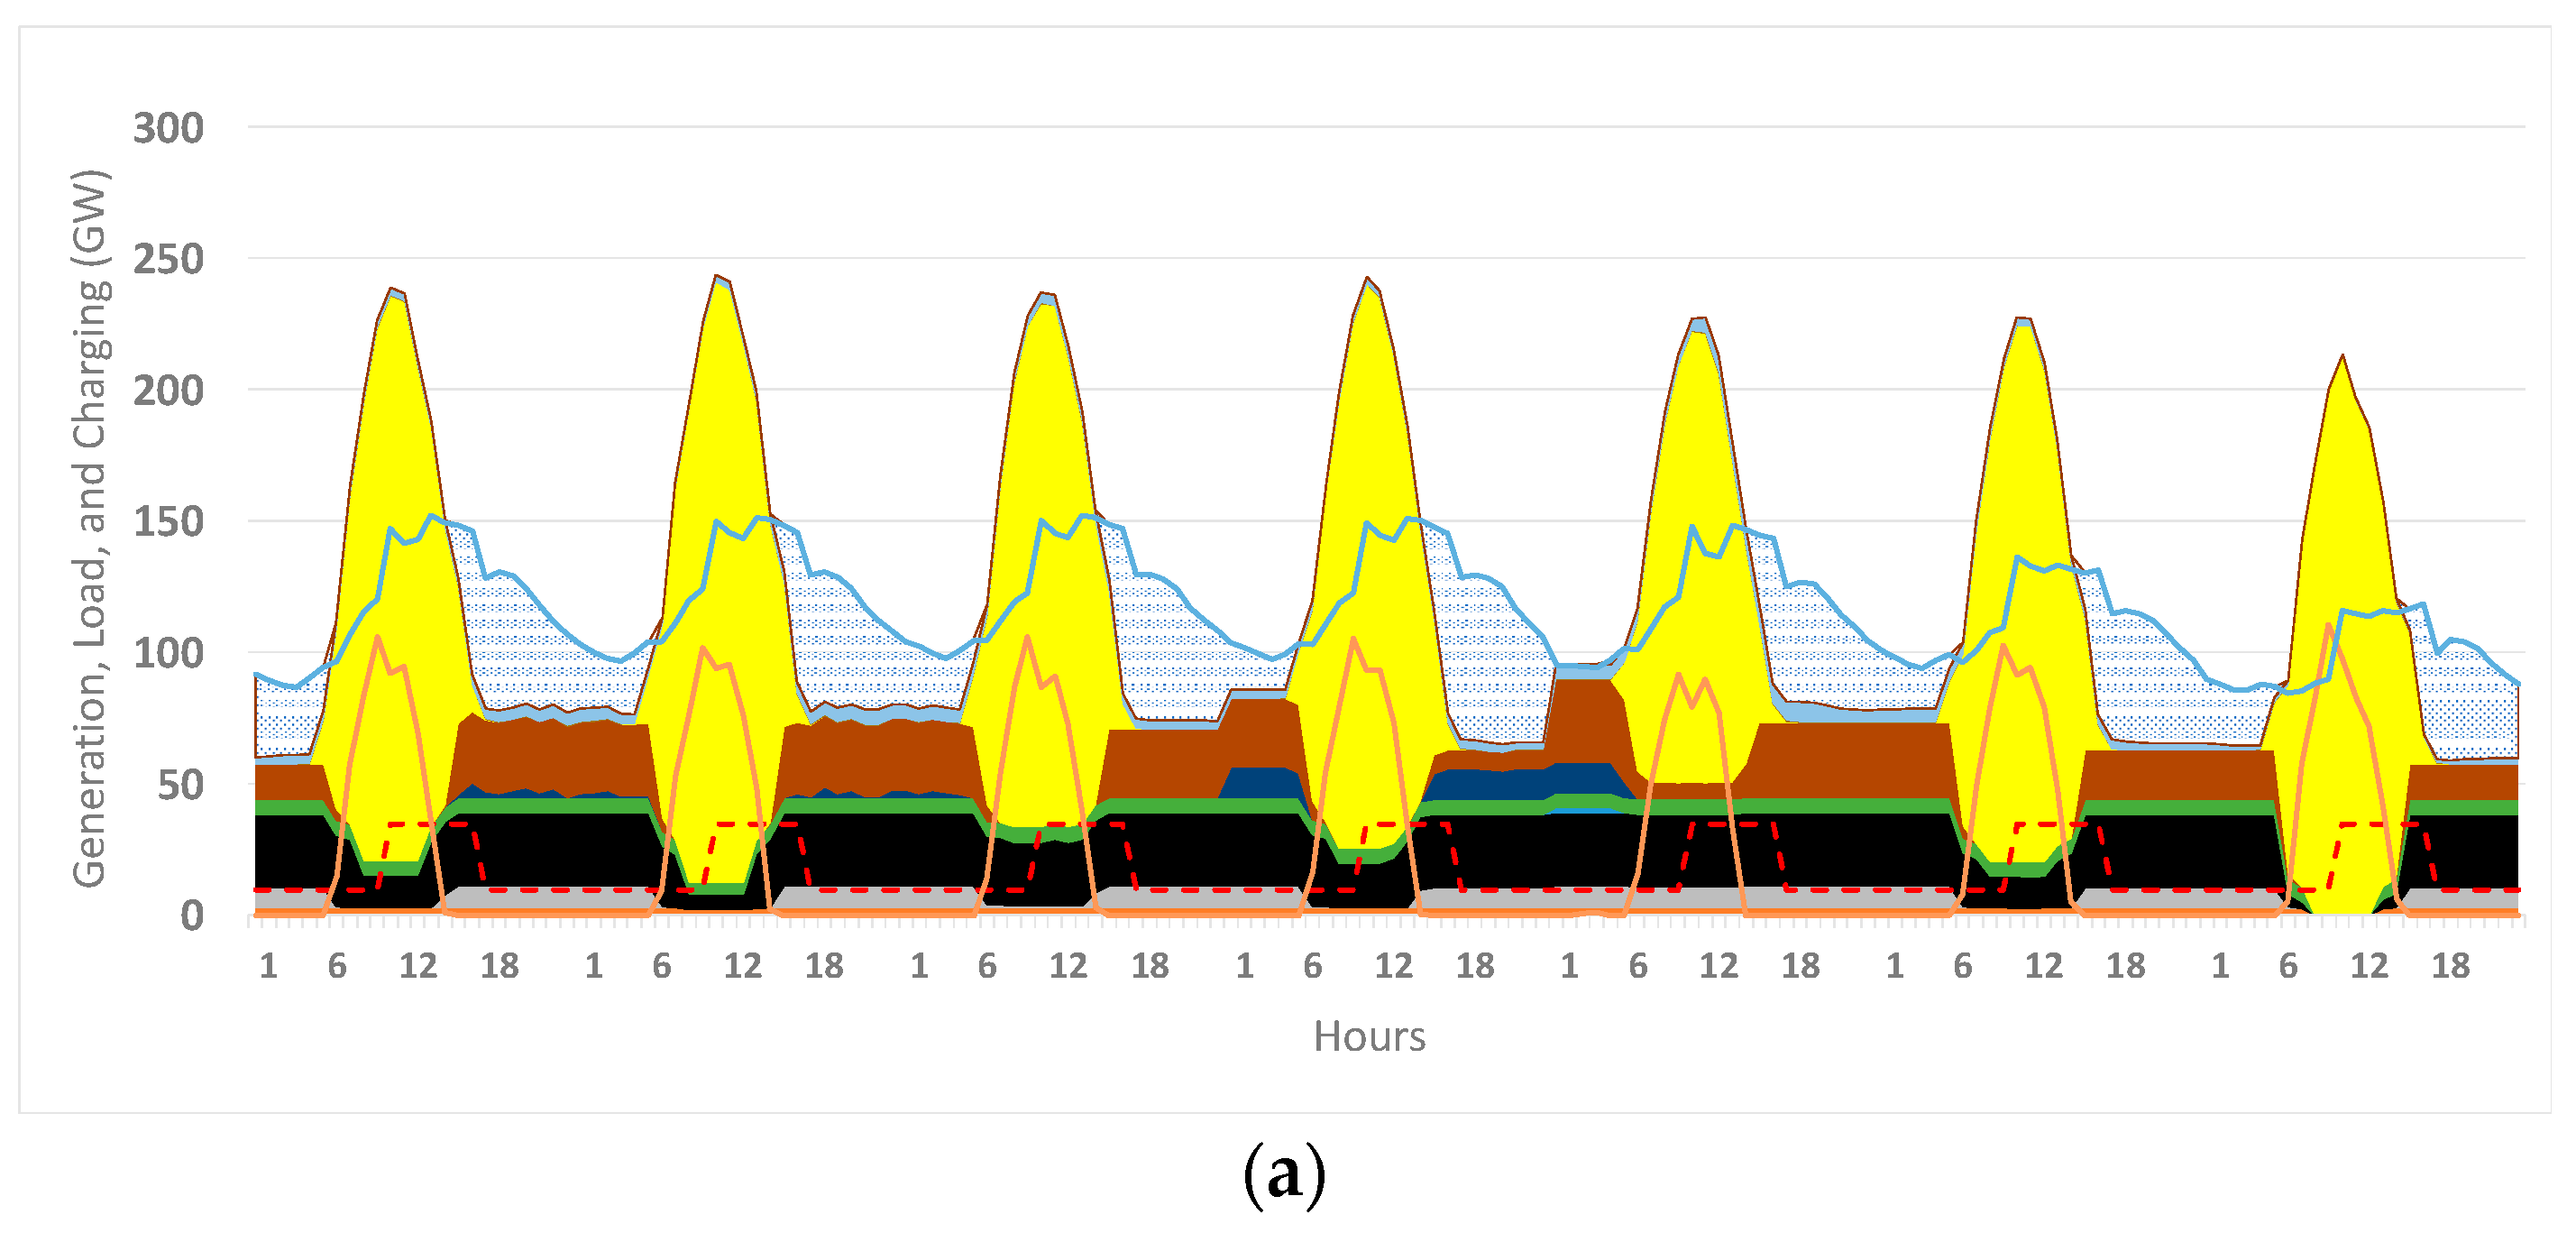
The comparison of charging scenarios reveals that optimized charging strategies yield the most favorable outcomes in terms of higher renewable energy penetration, reduced emissions, and lower total system costs. As shown in Figure 9, daytime charging presents an intermediary option, while evening charging emerges as the least economic charging strategy and the early morning charging is least favorable to reducing emissions and increasing penetration of renewable energy.

4.8. Hourly Profile

Figure 10 below shows the interaction of different technology power plants, energy storage, and charging EVs. PV systems are most productive during daylight hours, with excess energy being stored in batteries for later use, including charging EVs. Battery storage systems discharge energy during peak hours when PV generation is low. Although batteries are preferred, open cycle gas turbine (OCGT) power generation is used during peak periods to meet demand. Some days are entirely powered by renewable energy sources like wind and solar, eliminating the need for fossil fuels. The choice between fixed and optimized EV charging times has significant effects, with fixed schedules leading to evening demand peaks, while optimized charging increases demand during daytime hours, taking full advantage of PV generation.
Figure 10 illustrates hourly results from a representative week in 2050, spanning 1–8 August 2050 (Monday to Sunday). These results depict power generation across various technologies, battery operations, and EV charging and discharging through V2G systems. The figures show that PV sources dominate power generation during daylight hours. In contrast, fossil fuel generators, hydroelectric power, geothermal energy, and batteries primarily meet nighttime power requirements. Peak power demands are particularly noticeable during EV charging sessions. Specifically, daytime charging experiences its peak in the afternoon, whereas fixed-time charging has its highest need in the evening.
However, when charging times are optimized, this peak demand transitions to the daytime to harness more low-cost solar energy. Regarding the V2G feature, it is observed that when charging costs are nil, utilizing EVs as an energy resource is more favorable than establishing new energy storage systems. This preference remains even when a USD 25/MWh cost is introduced to the charging station. However, when this cost reaches USD 50/MWh, the inclination shifts toward dedicated energy storage solutions. A zero-cost V2G system bolsters the PV capacity, emphasizing the advantage of storing solar energy for later use, and more greatly relying on alternative power generation techniques.
Considering the additional expenses associated with battery discharging as energy storage, as mentioned in Section 3.7, it becomes economically viable to construct and employ large-scale energy storage systems for the majority of the time. Nevertheless, as depicted in Figure 10g, there are specific hours during which V2G technology remains beneficial. This indicates that, despite the added costs, the potential for utilizing V2G technology effectively remains.
With its vast reserves of nickel and other raw materials essential for lithium-ion battery production, Indonesia is poised to play a significant role in this burgeoning industry. Nickel is essential for cathode materials used in these batteries. The country’s vast nickel reserves present a unique opportunity to become a significant supplier in the lithium-ion battery value chain, especially in the mining, refining, and manufacturing of materials [67]. As highlighted by the Indonesian government’s policy to restrict the export of raw nickel and promote in-country processing, Indonesia aims to add value to its nickel resources and foster a domestic battery manufacturing industry [51]. Indonesia has taken proactive steps to establish a lithium-ion battery manufacturing industry. The government has initiated plans to build battery-grade nickel smelters to support this effort. As of 2022, several projects are in progress, and collaborations with international battery manufacturers have been established [68]. As countries worldwide transition to EVs to reduce carbon emissions and combat air pollution, Indonesia can become a significant player in supplying batteries for EV manufacturers.

5. Conclusions

Our study’s findings highlight the substantial benefits of optimally charging EVs in conjunction with the availability of renewable energy. Such strategic charging can significantly enhance the use of renewable energy sources, decrease reliance on fossil fuel power generation, and thereby reduce carbon emissions from the energy system. The implementation of V2G technologies amplifies these benefits, enabling a marked reduction in the dependency on traditional power generation and storage systems.
The demand for generator capacity is closely linked to the timing of EV charging. Optimized daytime charging strategies particularly require notable increases in solar PV and total capacity. V2G technology offers a promising solution, with the potential to increase PV capacity by up to 33%, thereby mitigating the need to expand gas turbine facilities. Regarding battery storage, optimized charging strategies considerably lessen the necessity for large battery systems, presenting a cost-effective method to manage the surging electricity demands due to EVs. These strategies also lead to a significant reduction in total system costs and play a pivotal role in curbing emissions.
Our analysis reveals a significant difference between optimal and fixed charging times for EVs, carrying important implications for emissions and the integration of renewable energy into the grid. Non-optimal charging typically coincides with peak energy demand, which in turn leads to increased reliance on fossil-fueled power plants and, consequently, higher emissions. A misalignment between charging times and peak renewable energy generation, notably solar and wind, means renewables are underutilized despite their availability, as our results show, thereby hampering efforts to decarbonize the energy grid.
To address this misalignment, incentivizing off-peak charging through time-of-use tariffs and providing real-time information to consumers could better align EV charging behaviors with periods of high renewable generation and low demand. Furthermore, developing smart charging infrastructures capable of responding to grid signals and charging during optimal times is crucial.
Beyond the challenge of non-optimal charging times, the introduction of V2G technology adds complexity in terms of cost and potential benefits. Adopting V2G technology entails higher initial expenses due to the need for compatible vehicles and charging stations equipped with bidirectional charging capabilities and advanced communication systems. Despite these costs, the benefits of V2G are significant. By allowing EVs to return energy to the grid, they act as mobile energy storage units, which can be particularly beneficial during peak demand periods or when intermittent renewable sources are not generating energy.
The long-term financial benefits from V2G, such as grid stabilization and potential income for EV owners through energy sales back to the grid, could counterbalance the upfront costs. Moreover, by diminishing the need for additional grid storage and peak power plants, V2G could contribute to lowering overall system costs, potentially leading to reduced energy prices for consumers. A detailed cost–benefit analysis is essential to determine the economic viability of V2G technologies. Incentives and subsidies for early adopters, along with research into cost reduction strategies, could accelerate the adoption of V2G. Policy frameworks also need to be established to ensure that the full advantages of V2G are realized and equitably distributed among all energy ecosystem stakeholders.
The integration of V2G not only bolsters the use of renewable energy but also offers a potential reduction in total system costs, especially if the additional costs can remain below USD 25/MWh. Our findings suggest that even with added costs of USD 50/MWh to account for battery degradation, V2G systems still provide a competitive edge over non-optimized charging strategies. From an environmental standpoint, applying efficient EV charging and discharging through V2G systems can considerably lower emissions, potentially equalizing emission levels to those of scenarios without EVs, even when additional costs are taken into account. In comparing different charging scenarios, optimized charging patterns emerge as the most favorable, enhancing renewable energy penetration, reducing emissions, and decreasing total system costs. The least favorable outcomes are linked to evening and early morning charging strategies.
In conclusion, for Indonesia to realize an efficient, cost-effective, and sustainable energy system, the adoption of optimized charging strategies, particularly those incorporating V2G technologies, is essential. These strategies support greater integration of renewable energy, optimized battery usage, substantial cost savings, and significant emission reductions, aligning with global sustainability targets and the advancement of renewable energy technologies.
Nonetheless, our study did not consider the potential additional costs to the electrical distribution system that could stem from increased peak demand, particularly during optimal EV charging. This oversight could affect the overall assessment of the cost-effectiveness of different charging strategies and their related infrastructure requirements. A potential solution could be to distribute some of the solar PV and battery capacity into consumers’ premises and the distribution system to closely match EV charging with the local energy and network capacity. Future research should aim to conduct a comprehensive analysis of the financial implications of increased peak demand on the local distribution and feeder networks, particularly during optimal charging periods, to provide a more complete understanding of the true costs associated with various EV charging scenarios.

Author Contributions

Conceptualization, methodology, software, visualization, writing—original draft preparation, data curation: A.A.; Conceptualization, methodology, supervision, writing—reviewing and editing, validation: R.D.; Conceptualization, methodology, software, supervision: A.L.; Validation software, methodology, writing—review and editing: R.G. All authors have read and agreed to the published version of the manuscript.

Funding

A.A. ongoing PhD Study funded by the Indonesia Endowment Fund for Education (LPDP).

Data Availability Statement

Most datasets are included in the article and Appendix A. Electricity system: RUPTL PLN 2021–2030 (https://web.pln.co.id/statics/uploads/2021/10/ruptl-2021-2030.pdf accessed on 23 December 2023). Solar and Wind resources, Renewable Ninja (https://www.renewables.ninja accessed on 28 August 2022). The model developed in PLEXOS is available to readers upon request.

Acknowledgments

Professor Ariel Liebman passed away on 9th November 2023. We acknowledge his significant contributions to this project. The First Author is especially grateful for Professor Ariel Liebman’s supervision during his PhD studies.

Conflicts of Interest

The authors declare no conflict of interest.

Appendix A

Table A1. Existing capacity of the power plants in the Java–Bali and Sumatra region (RUPTL) [44].
NoProvinceNet Capacity of Power Plant (MW)
BiogasBio
Mass
CCGTCoalDieselFuel OilGeo
Thermal
HydroOCGTSolarWindGrand
Total
1Aceh 140141 20447 749
2Bali 375605 980
3Bangka Belitung316 40288 50 397
4Banten 2367543 424 8203
5Bengkulu 11511 120 246
6Central Java
and Yogyakarta
8105995114 45495 7458
7East Java 4083507416 209 9382
8Jakarta 2419 101368 24976 5391
9Jambi 29 1223 165 230
10Lampung 17325 107115- 419
11North Sumatra 2272475179 414463397 2202
12Riau 234129 11427 504
13Riau Islands 1 133168 5761 880
14South Sumatra 66113091 55133742 1731
15West Java 322280910 114520101968 14,265
16West Sumatra 18024 8510149 440
Grand Total348820824,42819243681852366169749-53,475
Table A2. Renewable energy potential capacity in Java–Bali and Sumatra region (MW) [8,44].
NoPotential (MW)
ProvinceBioSolarWindGeothermalHydro
1Aceh293.586,0008942451.75
2Bangka Belitung55.75117,000178726.50
3Bengkulu161.2536,000151314527
4Jambi460289,00037105.5111.75
5Lampung373136,00011370.2588
6North Sumatra728309,000356108.51.25
7Riau1048.7515,0002210.25972.75
8Riau Islands4116,00092200
9South Sumatra533.25104,000301229.5887.5
10West Sumatra239.513,000428200.250.25
11Bali4823,0001019233.75
12Central Java558.25141,0005213129.25464.25
13Banten116.25190,000175365.2518
14East Java855.2528,000790790.5416.75
15Jakarta31.75189,000400
16West Java638.538,0007036539.75877
17Yogyakarta5621,000107900
Total62011,851,00031,4081918.53870
Table A3. Generation parameters in the Model [52,53,54].
TechnologyFuelMinimum Stable Level (%)Heat Rate (GJ/MWh) Variable O&M (USD/MWh) Start-Up costs (USD/MWe/start-up) Min Up Time Min Down Time Fixed O&M (USD/kW/year) Maintenance Rate (%) Forced Outage (%) Mean Time to Repair (hrs) Economic Life (year) Ramping Rate Up/Down (% of Max Capacity per minute)
Subcritical coal (<150 MW)Coal5013.330.13110484845.312%724301.0%
DieselDiesel308.796.454118.06%3242525%
GeothermalGeothermal46N/A0.25N/A484850.0 8%1024303%
OCGTGas2010.0172.3241123.2 6%2242520%
CCGTGas45%7.0682.3804423.5 10%5242520%
BiomassBiomass3012.5963110484847.6 12%7242510%
WasteBiogas3012.59624.11104848243.7 6%1242510%
BiogasBiogas3012.5960.111101197.0 10%5242520%
Hydro Large (>100 MW)Hydro0N/A0.65N/AN/AN/A37.7 12%4245050%
Hydro Medium (10–100)Hydro0N/A0.5N/AN/AN/A41.9 12%4245050%
Hydro Mini (<10 MW)Hydro0N/A0.5N/AN/AN/A53.0 12%4245050%
Super Critical coal (150–650 MW)Coal409.30.1250484841.213%724301%
Ultra Super Critical (650 MW)Coal308.5480.1150484856.613%724301%
PVSolarN/AN/A0N/AN/AN/A14.40.3%2.52425N/A
WindWindN/AN/A0N/AN/AN/A60.00.3%2.52425N/A
Table A4. Fuel parameters in the Model [5,69].
CoalGasDiesel
AttributesValueAttributesValueAttributesValue
Kg/ton907USD/MMBTU7USD/L0.46
Kcal/kg4200Kcal/MSCF252,000Kcal/L9070
Kcal/kJ4184Kcal/kJ4.184Kcal/kJ4.184
USD/ton50MMBTU to MSCF0.9756
Price (USD/GJ)3.14Price (USD/GJ)6.81Price (USD/GJ)12.12
CO2 Production rate (KgCO2Eq/GJ)99.718CO2 Production rate (KgCO2Eq/GJ)57.6CO2 Production rate (KgCO2Eq/GJ)74.067
Table A5. Battery parameters in the Model [52,57,70,71].
Operation ParametersLi-Ion
Unit2 h4 h10 h
Power CapacityMW100100100
Energy CapacityMWh2004001000
Ramp Up Rate Up/DownMW/Min10,00010,00010,000
Charge Efficiency%929394
Discharge Efficiency%929394
Max SOC%100100100
Min Soc%252525
Max Cycles 500055006000
Depth of Discharge%757575
Battery Degradation%/annum2%2%2%
Economic Life Years151515
Maintenance Rate %1%1%1%
Forced Outage Rate%0.50%0.50%0.50%
Cost Parameters
Fixed O&M Including Extended Warranty USDUSD/kW46.7515
Variable O&MUSD/MWh000

References

  1. UN. The Sustainable Development Goals Report: Special Edition; UN: San Francisco, CA, USA, 2023; Available online: https://unstats.un.org/sdgs/report/2023/ (accessed on 3 January 2024).
  2. Richardson, D.B. Electric vehicles and the electric grid: A review of modeling approaches, Impacts, and renewable energy integration. Renew. Sustain. Energy Rev. 2013, 19, 247–254. [Google Scholar] [CrossRef]
  3. Zhang, R.; Fujimori, S. The role of transport electrification in global climate change mitigation scenarios. Environ. Res. Lett. 2020, 15, 034019. [Google Scholar] [CrossRef]
  4. Ministry of Forestry and Environment Indonesia. Indonesia’s Third Biennial Update Report 2021; Ministry of Forestry and Environment Indonesia: Jakarta, Indonesia, 2021; Available online: https://unfccc.int/documents/403577 (accessed on 15 December 2023).
  5. Ministry of Energy and Mineral Resources Indonesia. Laporan Inventarisasi Emisi GRK Bidang Energi [Inventory Report of Greenhouse Gas Emissions in the Energy Sector]; Ministry of Energy and Mineral Resources Indonesia: Jakarta, Indonesia, 2020; Available online: https://www.esdm.go.id/assets/media/content/content-inventarisasi-emisi-gas-rumah-kaca-sektor-energi-tahun-2020.pdf (accessed on 15 December 2023).
  6. IEA. An Energy Sector Roadmap to Net Zero Emissions in Indonesia; IEA: Paris, France, 2022; Available online: https://www.iea.org/reports/an-energy-sector-roadmap-to-net-zero-emissions-in-indonesia (accessed on 15 December 2023).
  7. UNFCC. Enhanced National Determined Contribution Republic of Indonesia. 2022. Available online: https://unfccc.int/sites/default/files/NDC/2022-09/23.09.2022_Enhanced%20NDC%20Indonesia.pdf (accessed on 15 December 2023).
  8. Ministry of Energy and Mineral Resources Indonesia. Indonesia National Electricity Planning (RUKN) 2019-2038; Ministry of Energy and Mineral Resources Indonesia: Jakarta, Indonesia, 2020; Available online: https://www.esdm.go.id/assets/media/content/content-inventarisasi-emisi-gas-rumah-kaca-sektor-energi-tahun-2020.pdf (accessed on 15 December 2023).
  9. IEA. Global EVOutlook 2023: Catching Up with Climate Ambitions; IEA: Paris, France, 2023; Available online: https://iea.blob.core.windows.net/assets/dacf14d2-eabc-498a-8263-9f97fd5dc327/GEVO2023.pdf (accessed on 5 January 2024).
  10. IEA. Global EV Outlook 2021: Accelerating Ambitions Despite the Pandemic; IEA: Paris, France, 2021; Available online: https://iea.blob.core.windows.net/assets/ed5f4484-f556-4110-8c5c-4ede8bcba637/GlobalEVOutlook2021.pdf (accessed on 4 October 2023).
  11. IEA. Energy Technology Perspectives 2020; IEA: Paris, France, 2020; Available online: https://www.iea.org/reports/energy-technology-perspectives-2020 (accessed on 6 October 2023).
  12. Yong, J.Y.; Ramachandaramurthy, V.K.; Tan, K.M.; Mithulananthan, N. A review on the state-of-the-art technologies of electric vehicle, its impacts and prospects. Renew. Sustain. Energy Rev. 2015, 49, 365–385. [Google Scholar] [CrossRef]
  13. Williams, B.; Gallardo, P.; Bishop, D.; Chase, G. Impacts of electric vehicle policy on the New Zealand energy system: A retro-analysis. Energy Rep. 2023, 9, 3861–3871. [Google Scholar] [CrossRef]
  14. Ministry of Indutry Indonesia. Regulation of the Minister of Industry Number 6 of 2022 on Specifications, Development Roadmaps, and Provisions for Calculating Domestic Component Levels in Battery Electric Motor Vehicles; Ministry of Industry Indonesia: Jakarta, Indonesia, 2020; Available online: https://peraturan.go.id/files/bn270-2022.pdf (accessed on 5 January 2024).
  15. Briceno-Garmendia, C.; Qiao, W.; Foster, V. The Economics of Electric Vehicles for Passenger Transportation; World Bank Group: Washington, DC, USA, 2023. [Google Scholar] [CrossRef]
  16. Tang, L.; Qu, J.; Mi, Z.; Bo, X.; Chang, X.; Anadon, L.D.; Wang, S.; Xue, X.; Li, S.; Wang, X.; et al. Substantial emission reductions from Chinese power plants after the introduction of ultra-low emissions standards. Nat. Energy 2019, 4, 929–938. [Google Scholar] [CrossRef]
  17. Pearre, N.S.; Swan, L.G. Electric vehicle charging to support renewable energy integration in a capacity constrained electricity grid. Energy Convers. Manag. 2016, 109, 130–139. [Google Scholar] [CrossRef]
  18. Dik, A.; Kutlu, C.; Omer, S.; Boukhanouf, R.; Su, Y.; Riffat, S. An approach for energy management of renewable energy sources using electric vehicles and heat pumps in an integrated electricity grid system. Energy Build. 2023, 294, 113261. [Google Scholar] [CrossRef]
  19. Raveendran, V.; Alvarez-Bel, C.; Nair, M.G. Assessing the ancillary service potential of electric vehicles to support renewable energy integration in touristic islands: A case study from Balearic island of Menorca. Renew. Energy 2020, 161, 495–509. [Google Scholar] [CrossRef]
  20. Wu, W.; Lin, B. Benefits of electric vehicles integrating into power grid. Energy 2021, 224, 120108. [Google Scholar] [CrossRef]
  21. Zheng, Y.; Niu, S.; Shang, Y.; Shao, Z.; Jian, L. Integrating plug-in electric vehicles into power grids: A comprehensive review on power interaction mode, scheduling methodology and mathematical foundation. Renew. Sustain. Energy Rev. 2019, 112, 424–439. [Google Scholar] [CrossRef]
  22. Yao, X.; Fan, Y.; Zhao, F.; Ma, S.-C. Economic and climate benefits of vehicle-to-grid for low-carbon transitions of power systems: A case study of China’s 2030 renewable energy target. J. Clean. Prod. 2022, 330, 129833. [Google Scholar] [CrossRef]
  23. Aktar, A.K.; Taşcıkaraoğlu, A.; Gürleyük, S.S.; Catalão, J.P.S. A framework for dispatching of an electric vehicle fleet using vehicle-to-grid technology. Sustain. Energy Grids Netw. 2023, 33, 100991. [Google Scholar] [CrossRef]
  24. Seddig, K.; Jochem, P.; Fichtner, W. Integrating renewable energy sources by electric vehicle fleets under uncertainty. Energy 2017, 141, 2145–2153. [Google Scholar] [CrossRef]
  25. Zhou, K.; Cheng, L.; Wen, L.; Lu, X.; Ding, T. A coordinated charging scheduling method for electric vehicles considering different charging demands. Energy 2020, 213, 118882. [Google Scholar] [CrossRef]
  26. Luo, Y.; Zhu, T.; Wan, S.; Zhang, S.; Li, K. Optimal charging scheduling for large-scale EV (electric vehicle) deployment based on the interaction of the smart-grid and intelligent-transport systems. Energy 2016, 97, 359–368. [Google Scholar] [CrossRef]
  27. Colmenar-Santos, A.; Muñoz-Gómez, A.-M.; Rosales-Asensio, E.; López-Rey, Á. Electric vehicle charging strategy to support renewable energy sources in Europe 2050 low-carbon scenario. Energy 2019, 183, 61–74. [Google Scholar] [CrossRef]
  28. Lei, J.; Xiaoying, Z.; Labao, Z.; Kun, W. Coordinated scheduling of electric vehicles and wind power generation considering vehicle to grid mode. In Proceedings of the 2017 IEEE Transportation Electrification Conference and Expo, Asia-Pacific (ITEC Asia-Pacific), Harbin, China, 7–10 August 2017; pp. 1–5. [Google Scholar] [CrossRef]
  29. Klingler, A.-L. The effect of electric vehicles and heat pumps on the market potential of PV + battery systems. Energy 2018, 161, 1064–1073. [Google Scholar] [CrossRef]
  30. Chellaswamy, C.; Ramesh, R. Future renewable energy option for recharging full electric vehicles. Renew. Sustain. Energy Rev. 2017, 76, 824–838. [Google Scholar] [CrossRef]
  31. Nunes, P.; Farias, T.; Brito, M.C. Day charging electric vehicles with excess solar electricity for a sustainable energy system. Energy 2015, 80, 263–274. [Google Scholar] [CrossRef]
  32. Ou, Y.; Kittner, N.; Babaee, S.; Smith, S.J.; Nolte, C.G.; Loughlin, D.H. Evaluating long-term emission impacts of large-scale electric vehicle deployment in the US using a human-Earth systems model. Appl. Energy 2021, 300, 117364. [Google Scholar] [CrossRef]
  33. Arslan, O.; Karasan, O.E. Cost and emission impacts of virtual power plant formation in plug-in hybrid electric vehicle penetrated networks. Energy 2013, 60, 116–124. [Google Scholar] [CrossRef]
  34. Zheng, Y.; Shao, Z.; Shang, Y.; Jian, L. Modeling the temporal and economic feasibility of electric vehicles providing vehicle-to-grid services in the electricity market under different charging scenarios. J. Energy Storage 2023, 68, 107579. [Google Scholar] [CrossRef]
  35. Forrest, K.E.; Tarroja, B.; Zhang, L.; Shaffer, B.; Samuelsen, S. Charging a renewable future: The impact of electric vehicle charging intelligence on energy storage requirements to meet renewable portfolio standards. J. Power Sources 2016, 336, 63–74. [Google Scholar] [CrossRef]
  36. Wei, H.; Zhang, Y.; Wang, Y.; Hua, W.; Jing, R.; Zhou, Y. Planning integrated energy systems coupling V2G as a flexible storage. Energy 2022, 239, 122215. [Google Scholar] [CrossRef]
  37. Tian, X.; Cheng, B.; Liu, H. V2G optimized power control strategy based on time-of-use electricity price and comprehensive load cost. Energy Rep. 2023, 10, 1467–1473. [Google Scholar] [CrossRef]
  38. Fathabadi, H. Utilization of electric vehicles and renewable energy sources used as distributed generators for improving characteristics of electric power distribution systems. Energy 2015, 90, 1100–1110. [Google Scholar] [CrossRef]
  39. Atia, R.; Yamada, N. More accurate sizing of renewable energy sources under high levels of electric vehicle integration. Renew. Energy 2015, 81, 918–925. [Google Scholar] [CrossRef]
  40. Honarmand, M.; Zakariazadeh, A.; Jadid, S. Integrated scheduling of renewable generation and electric vehicles parking lot in a smart microgrid. Energy Convers. Manag. 2014, 86, 745–755. [Google Scholar] [CrossRef]
  41. Drude, L.; Pereira Junior, L.C.; Rüther, R. Photovoltaics (PV) and electric vehicle-to-grid (V2G) strategies for peak demand reduction in urban regions in Brazil in a smart grid environment. Renew. Energy 2014, 68, 443–451. [Google Scholar] [CrossRef]
  42. Zafeiratou, E.; Spataru, C. Modelling electric vehicles uptake on the Greek islands. Renew. Sustain. Energy Transit. 2022, 2, 100029. [Google Scholar] [CrossRef]
  43. Zafeiratou, E.; Spataru, C. Sustainable island power system—Scenario analysis for Crete under the energy trilemma index. Sustain. Cities Soc. 2018, 41, 378–391. [Google Scholar] [CrossRef]
  44. PLN. Electric Power Supply Business Plan (2021–2030); PLN: Jakarta, Indonesia, 2021; Available online: https://web.pln.co.id/statics/uploads/2021/10/ruptl-2021-2030.pdf (accessed on 9 October 2023).
  45. PLN. Evaluation of the Operations of the Java Bali Load Control Center for the Year 2018; PLN: Jakarta, Indonesia, 2019. [Google Scholar]
  46. Pfenninger, S.; Staffell, I. Long-term patterns of European PV output using 30 years of validated hourly reanalysis and satellite data. Energy 2016, 114, 1251–1265. [Google Scholar] [CrossRef]
  47. Staffell, I.; Pfenninger, S. Using bias-corrected reanalysis to simulate current and future wind power output. Energy 2016, 114, 1224–1239. [Google Scholar] [CrossRef]
  48. Eren, Y.; Küçükdemiral, İ.B.; Üstoğlu, İ. Chapter 2—Introduction to Optimization. In Optimization in Renewable Energy Systems; Erdinç, O., Ed.; Butterworth-Heinemann: Boston, MA, USA, 2017; pp. 27–74. [Google Scholar] [CrossRef]
  49. Dalala, Z.; Al-Omari, M.; Al-Addous, M.; Bdour, M.; Al-Khasawneh, Y.; Alkasrawi, M. Increased renewable energy penetration in national electrical grids constraints and solutions. Energy 2022, 246, 123361. [Google Scholar] [CrossRef]
  50. IESR. Beyond 207 Gigawatts: Unleashing Indonesia’s Solar Potential; IESR: Jakarta, Indonesia, 2021. [Google Scholar]
  51. Pandyaswargo, A.H.; Wibowo, A.D.; Maghfiroh, M.F.N.; Rezqita, A.; Onoda, H. The Emerging Electric Vehicle and Battery Industry in Indonesia: Actions around the Nickel Ore Export Ban and a SWOT Analysis. Batteries 2021, 7, 80. [Google Scholar] [CrossRef]
  52. Ministry of Energy and Mineral Resources Indonesia and Danish Energy Agency. Technology Data for the Indonesian Power Sector; Ministry of Energy and Mineral Resources Indonesia and Danish Energy Agency: Jakarta, Indonesia, 2021; Available online: https://ens.dk/sites/ens.dk/files/Globalcooperation/technology_data_for_the_indonesian_power_sector_-_final.pdf (accessed on 9 October 2023).
  53. ElectraNet. Generator Technical and Cost Parameters; ElectraNet: Adelaide, Australia, 2020. [Google Scholar]
  54. PLN. Operation Planning Java Bali Electricity System 2021 (Rencana Operasi Sistem Tenaga Listrik Jawa Bali Tahun 2021); PLN: Jakarta, Indonesia, 2020. [Google Scholar]
  55. AEMO. National Transmission Network Development Plan; AEMO: Victoria, Australia, 2018. [Google Scholar]
  56. Aurecon. 2020 Costs and Technical Parameter Review; Aurecon: Brisbane, Australia, 2020. [Google Scholar]
  57. Sony. Lithium Ion Rechargeable Battery Technical Information; Sony: Tokyo, Japan, 2012. [Google Scholar]
  58. Mongird, K.; Viswanathan, V.; Balducci, P.; Alam, J.; Fotedar, V.; Koritarov, V.; Hadjerioua, B. Energy Storage Technology and Cost Characterization Report; Department of Energy; Pacific Northwest National Lab.(PNNL): Richland, WA, USA, 2019. Available online: https://www.energy.gov/eere/water/downloads/energy-storage-technology-and-cost-characterization-report (accessed on 6 October 2023).
  59. Dematera, K.; Mejia, A.; Phan, N.; Tacderas, M.; Patdu, K.; Daude, L.; Nguyen, A.; Bakker, S. Tracking Sustainable Transport in Vietnam: Data and Policy Review for Energy Efficiency and Climate Change 2015; GIZ Vietnam: Hanoi, Vietnam, 2015. [Google Scholar]
  60. EV Database. Hyundai Kona Electric 64 kWh. 2021. Available online: https://ev-database.org/car/1423/Hyundai-Kona-Electric-64-kWh (accessed on 9 October 2023).
  61. Yamaha. NEO’s Yamaha Scooter Spesifications. 2023. Available online: https://www.yamaha-motor.eu/gb/en/scooters/urban-mobility/pdp/neo-s-2023/ (accessed on 1 February 2024).
  62. ABS. Survey of Motor Vehicle Use, Australia. 2020. Available online: https://www.abs.gov.au/statistics/industry/tourism-and-transport/survey-motor-vehicle-use-australia/latest-release#data-downloads (accessed on 4 October 2023).
  63. BPS. Population Projection of Indonesia 2020–2050 Based on the 2020 Population Census; Biro Pusat Statistik: Jakarta, Indonesia, 2023; Available online: https://www.bps.go.id/id/publication/2023/05/16/fad83131cd3bb9be3bb2a657/proyeksi-penduduk-indonesia-2020-2050-hasil-sensus-penduduk-2020.html (accessed on 5 January 2024).
  64. Ahmadian, A.; Sedghi, M.; Elkamel, A.; Fowler, M.; Aliakbar Golkar, M. Plug-in electric vehicle batteries degradation modeling for smart grid studies: Review, assessment and conceptual framework. Renew. Sustain. Energy Rev. 2018, 81, 2609–2624. [Google Scholar] [CrossRef]
  65. Bhoir, S.; Caliandro, P.; Brivio, C. Impact of V2G service provision on battery life. J. Energy Storage 2021, 44, 103178. [Google Scholar] [CrossRef]
  66. Calearo, L.; Marinelli, M. Profitability of Frequency Regulation by Electric Vehicles in Denmark and Japan Considering Battery Degradation Costs. World Electr. Veh. J. 2020, 11, 48. [Google Scholar] [CrossRef]
  67. IEA. The Role of Critical Minerals in Clean Energy Transitions; IEA: Paris, France, 2021; Available online: https://www.iea.org/reports/the-role-of-critical-minerals-in-clean-energy-transitions (accessed on 10 October 2023).
  68. Huber, I. Indonesia’s Battery Industrial Strategy; Center for Strategic and International Studies: Washington, DC, USA, 2022; Available online: https://www.csis.org/analysis/indonesias-battery-industrial-strategy#:~:text=The%20government%20has%20the%20ambitious,just%20starting%20to%20be%20developed (accessed on 10 October 2023).
  69. Liebman, A.; Forster, W.; Pujantoro, M.; Tumiwa, F.; Tampubolon, A. A Roadmap for Indonesia ’ s Power Sector; Institute for Essential Services Reform: Jakarta, Indonesia, 2019. [Google Scholar]
  70. Aurecon. 2021 Cost and Technical Parameter Review: Australia Energy Market Operator; Aurecon: Brisbane, Australia, 2021. [Google Scholar]
  71. Mongird, K.; Viswanathan, V.; Balducci, P.; Alam, J.; Fotedar, V.; Koritarov, V.; Hadjerioua, B. An Evaluation of Energy Storage Cost and Performance Characteristics. Energies 2020, 13, 3307. [Google Scholar] [CrossRef]
Figure 1. Nodes of Java–Bali and Sumatra and scenarios in model.
Energies 17 02037 g001
Figure 2. Hourly load profile in a typical week without EV charging influence (zero EV).
Energies 17 02037 g002
Figure 3. The general structure of the study.
Energies 17 02037 g003
Figure 4. Comparison of generator installed capacity in 2050 for different scenarios to zero EV.
Energies 17 02037 g004
Figure 5. Comparison of battery-installed capacity in 2050 for different scenarios to zero EV.
Energies 17 02037 g005
Figure 6. Comparison of total cost in 2050 for different scenarios to zero EV.
Energies 17 02037 g006
Figure 7. Comparison of renewable energy percentage in 2050 for different scenarios to zero EV.
Energies 17 02037 g007
Figure 8. Comparison of emissions in 2050 for different scenarios to zero EV.
Energies 17 02037 g008
Figure 9. Charging Time Pattern and Scenario Comparison results. (a) Charging pattern. (b) Rank comparison of scenarios (Rank 1 is preferable).
Energies 17 02037 g009
Figure 10. Typical weekly generation, load, charging EV, and charging energy storage in 2050. (a) Daytime (scenario D3). (b) Early Morning (scenario M3). (c) Evening (Scenario E3). (d) Optimized (Scenario O3) (e) Optimized with V2G functionality and zero charge cost (O3-V2G). (f) Optimized with V2G functionality and with charge cost (O3-V2G-25). (g) Optimized with V2G functionality and with charge cost (O3-V2G-50).
Energies 17 02037 g010aEnergies 17 02037 g010bEnergies 17 02037 g010c
Table 2. The demand for EVs scenarios.
DemandNumber of Electric CarsNumber of Electric Motorbikes
Base4.2 million (5% of the total)47 million (28% of the total)
Medium42 million (50% of the total)84 million (50% of the total)
High84 million (75% of the total)168 million (75% of the total)
Table 3. The scenario formulation.
GroupNameCharging TimeV2GAdditional Cost for Charging Station (USD/MWh)Demand EVs Scenarios
Base (1)Medium
(2)
High
(3)
Charging TimeEarly Morning (M)1 AM–7 AM--M1M2M3
Daytime (D)10 AM–4 PM--D1D2D3
Evening (E)5 PM–10 PM--E1E2E3
Optimized (O)Optimized--O1O2O3
V2G Scenarios
V2G Scenarios
Optimized + Vehicle to gridOptimizedp--O2-V2GO3-V2G
Optimized + Vehicle to grid_10OptimizedpUSD 10--O3-V2G_10
Optimized + Vehicle to grid_25OptimizedpUSD 25--O3-V2G_25
Optimized + Vehicle to grid_50OptimizedpUSD 50--O3-V2G_50
Disclaimer/Publisher’s Note: The statements, opinions and data contained in all publications are solely those of the individual author(s) and contributor(s) and not of MDPI and/or the editor(s). MDPI and/or the editor(s) disclaim responsibility for any injury to people or property resulting from any ideas, methods, instructions or products referred to in the content.

