Abstract
The global crisis associated with COVID-19 and the Russia-Ukraine conflict has affected progress towards the Sustainable Development Goals (SDGs). Projections for SDG7 (Ensure access to affordable, reliable, sustainable, and modern energy for all) indicate a slowdown in the pace of electrification. Thus, the problem of poverty will persist in many regions as long as access to electricity remains difficult. This work analyzes some solutions to the lack of electricity supply in a rural community using organic waste from its economic activity and the integration of other available renewable sources to make electricity affordable and reliable. A model that minimizes the levelized cost of energy and restricts the proportion of annual energy not supplied to less than 5% of the community’s annual demand optimizes the performance of off-grid and on-grid systems. These systems have in common the production of electricity from biogas produced from swine manure, supplemented with wind and solar generation. Batteries and diesel generators support the operation of off-grid systems. As expected, the grid-connected system presented the best performance; however, the result reaffirms the need for governments to ensure the policy and infrastructure conditions that facilitate the grid connection of vulnerable communities to achieve SDG7.
1. Introduction
The recent global crises associated with COVID-19 and the Russia-Ukraine conflict have affected progress toward achieving the UN Sustainable Development Goals (SDGs) [1]. Specifically, the level of poverty increased by 5 percentage points due to COVID-19, from 6.7% to 7.2% globally, undermining progress for SDG1 [2]. Regarding UN SDG7 (Ensure access to affordable, reliable, sustainable, and modern energy for all), projections indicate a slowdown in the pace of electrification in the 2020–2030 period compared to the 2010–2020 period [3].
Thus, the problem of poverty will persist in many regions as long as access to electricity remains difficult due to a lack of infrastructure and disinterest in investing for this purpose. There is a direct relationship between negative social effects and lack of electricity [4]. Rural areas are the most affected by the lack of access to electricity because most of them are in remote or isolated locations where it is very difficult and/or very costly to transport energy using the conventional networks of the electricity system [5]. Many of these communities subsist by raising animal or vegetable species for self-consumption or income generation, and their waste generates pollution problems. However, some of these communities live in regions with great potential to take advantage of renewable energy sources such as solar, wind, and biomass that, if well utilized, can meet their current and future electricity demand and create new sources of income generation. Renewable energies could enable these communities to increase their quality of life, improve their economic and social situation, have efficient educational and health services, and develop easier and more effective work techniques, among other things.
Renewable energies can play an important role in reducing the energy access gap due to their efficiency and effectiveness, thus resolving the asymmetries caused by traditional electricity systems [6]. Some authors have proposed hybrid micro-grids composed of renewable energies to reduce the electricity access gap in remote communities [4,7]. Other authors insist that, in order to achieve SDG7, the use of renewable energy must be promoted through policies, because reducing consumption alone will not work in the long term [8].
Energy access has been analyzed from different perspectives in the literature. Some authors have focused on the use of available renewable resources [9,10] or on the analysis of regulatory incentives [11]. Other authors have explored the effects of changes in renewable energy regulatory policies on the attractiveness of using micro-grids [12]. In [13], the authors break down SDG 7 into a series of indicators that facilitate the definition of actions to achieve it. For example, affordability is achieved using low-cost electricity, lower capital investment, and a lower net present cost. Those authors explain that reliable energy consists of a continuous supply of energy and the minimization of energy shortages; sustainable energy is achieved with a higher share of renewable energy and minimal emissions. Finally, the authors associate modern energy with micro-grids, hybrid energy systems, and community micro-grids. Recent research emphasizes the need to approach the modeling of hybrid renewable energy systems (HRES) from the perspective of energy sustainability, energy security, and energy affordability [4].
HRES integrate different renewable resources to generate electricity, offering a diversified strategy that provides multiple advantages [14]. In recent years, the development of HRES implementation projects in rural areas with no or poor electricity supply is increasing because they generate multiple benefits for the community. The main one is to provide clean and affordable energy to millions of people, which contributes to a better standard of living through the creation and/or restructuring of hospitals, educational institutions, and recreation centers, offering new and varied social services, local job opportunities, and more technical, agricultural, and livestock activities. All this generates the social, economic, and technological development of the communities. The World Bank reports the implementation of such systems in rural areas of countries in North America, Latin America, Europe, Asia, and Africa (https://www.worldbank.org/en/search?q=Renewable+Energy+to+Rural+Development¤tTab=2, accessed on 29 August 2023).
Table 1 shows some works, identifying the location of the case study, methods, tools, software, criteria, backup systems, and a summary of the study.

Table 1.
Studies in hybrid solar PV–wind–biomass.
The above studies show different methodologies for sizing a hybrid renewable energy system considering biomass. These works use classical optimization methods, genetic algorithms, artificial intelligence, and hybrid methods. As for specialized software, HOMER is the most widely used because it combines several technologies and metrics. All of them have advantages and disadvantages and it is not possible to say which one is the best. It is necessary to analyze the desired system and propose solutions according to its own characteristics (large- or small-scale system, available renewable sources, existence of real values of input variables, real or estimated load information, decision-making indicators, etc.) [33].
Although these works do not make explicit their relationship with the SDG7 indicators [13], they do contribute methodologically to their achievement. This work, unlike the previous ones, does establish the relationship and this implies the inclusion of on-grid HRES within the assessment, considering that the community on which the analysis was performed has the potential to be connected to the electricity grid.
Therefore, this article analyzes localized HRES [34] considering two of the perspectives indicated in the SDG7: affordability and reliability, via the levelized cost of energy (LCOE) and the probability of loss of power supply (LPSP). The electricity demand of a rural community located on the outskirts of the city of Barranquilla that is not connected to the grid served as the basis for sizing hybrid on-grid and off-grid HRES. The biogas produced by the community’s pig farming was the main energy source. This source was complemented by varying the participation of solar and wind energy to obtain the most suitable system for the community. The heuristics used to solve the problem was based on Sparse Search (SS). The SS maintains a set of solutions taking into account a selection criterion [35] and combines them in a way that minimizes the levelized cost of energy (LCOE).
The article presents three cases. Case 1 considers an isolated HRES supported by a battery bank to supplement any energy deficit. Case 2 shows the use of diesel generation to supplement any energy deficit instead of batteries, and the third case assumes an on-grid HRES without batteries or a diesel generator to make easy the purchase and sale of energy between the prosumer and the grid.
Hence, the main contributions of this work are:
- It establishes an explicit connection between the metrics commonly used in HRES modeling with SDG 7 indicators.
- It takes into account the current economic activity of the community as the main source for energy generation complemented by other renewable sources.
2. Materials and Methods
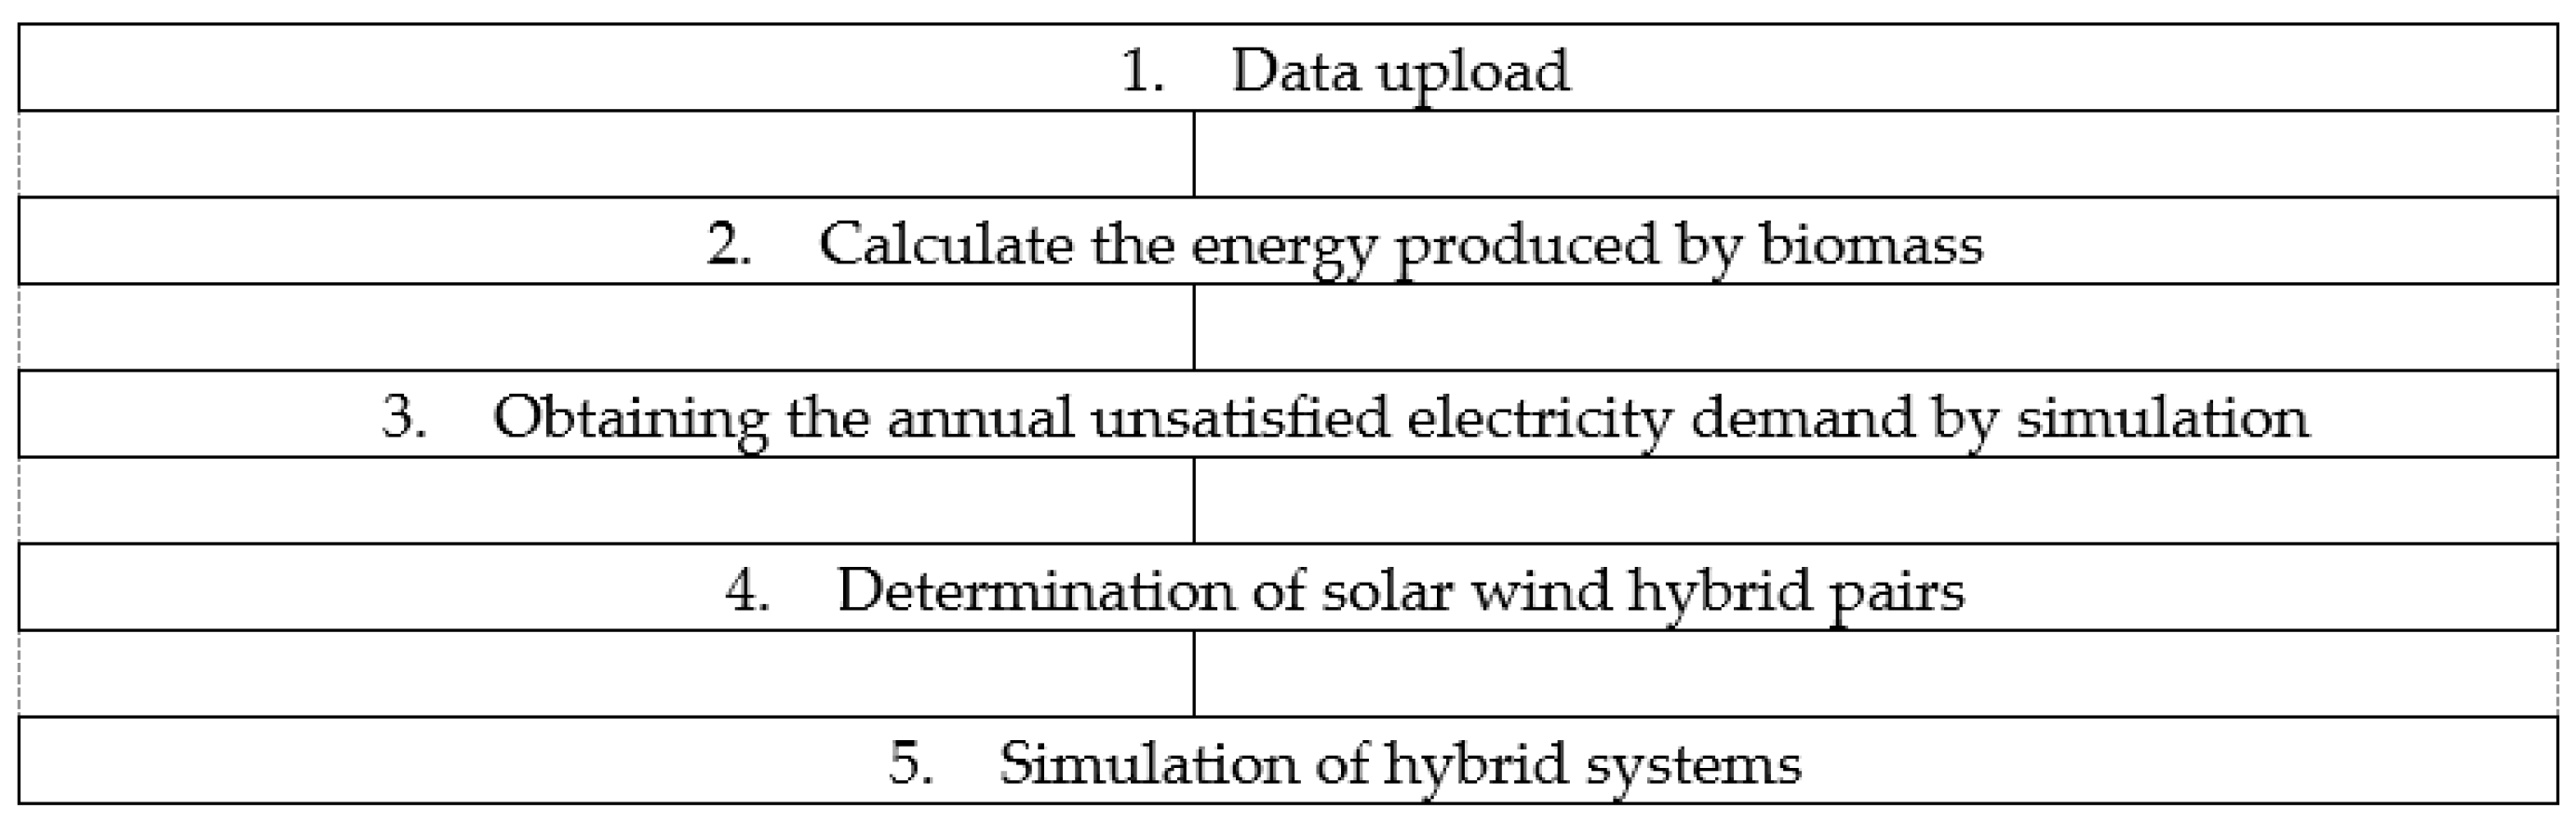
The available sources are solar, wind, and biomass, the latter obtained from pig manure. A battery bank (BAT) and diesel generation (DG) served as backup systems for the off-grid systems. Three cases were considered: Case 1. Standalone system SPV/W/BM/BAT. Case 2. Standalone system SPV/W/BM/DG. Case 3. Grid-connected system SPV/W/BM. In all three cases, the steps shown in Figure 1 were followed. The algorithm was coded in R, using the libraries cited in the references [36,37,38,39,40].
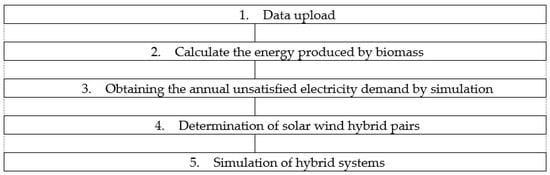
Figure 1.
Methodology.
The steps in Figure 1 are explained below:
- The first step was to load the data for a Typical Meteorological Year (TMY) for the study location as well as the minimum and maximum hourly values of daily electricity demand. The TMY data were downloaded from PVWatts Calculator® https://pvwatts.nrel.gov/pvwatts.php (accessed on 19 July 2023). Particularly, wind speed at 10 m (corrected to 50 m) and beam irradiance were useful for this research. The demand data correspond with a low social class extracted from a characterization of the load profile according to socioeconomic stratification in the city of Barranquilla [41] but adapted to the locality of interest according to a set of assumptions described in the results section.
- The second step was to calculate the energy produced by the biomass. We assumed a constant supply of electricity from biomass every hour. The procedure for estimating the production of biogas from the volatile solid content was as follows:
- The animal mass was determined, given by Equation (1), where is the number of pigs of small size , medium size , and large size . is the average weight per each size of pig.
- The number of average animal units was calculated considering that, for pigs, . In other words,
- Each animal unit () generates approximately 19 tons of swine manure per year so the amount of total swine manure was:
- Swine manure has approximately 6% dry matter and between 70% and 80% volatile solids . Hence, the total of volatile solids in the swine manure was:
- Each kilogram of volatile solids generates up to 300 L of biogas, with 60% methane content so the amount of biogas B that can be obtained from SV is:
- The amount of energy produced from biogas , considering its minimum energy content of , was:
- Equation (7) gave the capacity of the electricity-generating unit GUC for a generating unit efficiency of 30% and an annual operating time h:
- The third step consisted of building an annual unsatisfied electricity demand (the demand not covered by biomass) curve using simulation. In each iteration, random values of hourly demand were taken between the minimum and maximum values of each hour of the daily demand curve. The procedure was performed a thousand times, resulting in a normal probability distribution for the annual demand. The biomass power generation (of assumed constant capacity) was subtracted from the mean of the distribution, keeping the same variance. Thus, the demand curve not covered by biomass energy production was obtained.
- The fourth step consisted of determining the combinations of solar panels and wind turbines needed to cover the unsatisfied electricity demand. If is the fraction to be covered by panels, and the fraction to be covered by turbines, with , the number of panels and the number of turbines needed to cover the deficit were calculated according to the following equations:
Demand is the 95th percentile of the annual electricity demand curve; and are the efficiency and power of the panels, respectively; and AFS (5.88 kWh/m2/d from PVWatts® is the daily beam irradiance for the place analyzed; AFS is 5.88 × 365) is the annual full solar hours. is the amount of annual energy produced by one wind turbine, estimated by using Equation (10), with the turbine technical characteristics and wind speed from the TMY data. In Equation (10), , , , and are the cut-in wind speed, the rated wind speed, the cut-out wind speed, and the rated power of wind turbine, respectively [42]. For values of incremented by 10%, the pairs () were found.
- 5.
- The fifth step was the simulation of each hybrid system. The TMY data contain the annual hourly estimate of irradiance and wind speed for the location of interest. These hourly data, grouped by month, were taken as initial samples to generate random data for these variables using bootstrapping. The amount of hourly energy produced by each hybrid system was estimated using the equation:
Values of indicate energy surplus (set S), and indicate energy deficits (set D). is the hourly irradiance [kW/m2] given by TMY corrected by the standard irradiance of 1 kW/m2. The quotient is actually an empirical approximation that, when added on a daily basis, approximates the daily full sun hours [h/d] of the analyzed area.
The minimum hourly energy deficit, , at each iteration was calculated using Equation (12). The set of all iterations produced a probability distribution of minimum deficits, which was used in cases 1 and 2 with isolated systems.
System Optimization Model
The system was determined using the following cost minimization model.
Subject to:
Equation (13) calculated the levelized cost of energy LCOE, and it represents the cost per unit of energy produced by HRES. is the loss of power supply probability and represents the proportion of energy not supplied by the system in a year.
The values of , , , and were calculated considering the following three cases.
Case 1. Isolated hybrid system supported by a battery bank to supply the energy deficit.
The absolute value associated with a 5% probability of non-coverage of the deficit, , was extracted from the probability distribution of minimum deficits mentioned above. This value was used to calculate the number of batteries needed to cover that energy deficit. The following equation shows the required variables:
The ACS was calculated using Equation (15).
where is the annual operation and maintenance cost for each unit. is the investment cost for each unit (panel, wind turbine, battery, inverter, and biodigester). is the replacement cost of those units that have a useful life shorter than the operating time of the project, in this case, the batteries and inverters. and are the useful life for the batteries and inverters, respectively.
The costs associated with the biomass system comprise the biodigester, the power generation unit, and all additional implements and processes associated with its implementation. LPSP was calculated as follow:
All values for the number of batteries such that were considered. For all terms the was evaluated, and that term which made it as low as possible was chosen.
Case 2. Isolated hybrid system with a diesel generator to supply the energy deficit.
For each pair , was evaluated to determine the capacity of the diesel generator to supply this load. The next equations estimated the investment, operation, and maintenance costs:
is the annual fuel cost. is the investment cost of the diesel generator. The replacement cost is associated with the inverters if their useful life is less than the operating time of the project.
The energy produced by the system was:
For this case, the LPSP constraint was not considered, because the diesel generator supplemented the entire energy deficit.
Case 3. A grid-connected hybrid system.
The solar photovoltaic–wind–biomass hybrid system produced energy excess in some hours so users were able to sell energy to the grid, but in other hours, the production was insufficient, and users bought energy from the grid. Equation (11) gives information about when the user imports ( is negative) and exports ( is positive). As a result, it is possible to produce an annual profit from the sum of the monthly profits. The following equation allowed for the estimation of monthly profit:
: It is the sum of the hourly energy import of the AGPE in the period .
: It is the monthly demand in the period t.
: The sum of the hourly energy export of the AGPE in the period .
: It is the unit cost of service provision, in $/kWh of the serving supplier.
: The commercialization cost, in $/kWh.
: The amount of hourly energy exported of the AGPE in the period , which exceeds .
: Hourly exchange price of exported energy, in $/kWh.
Therefore, is given by:
was calculated by adding the values corresponding to each month. In this case, the constraint for LPSP was not considered because the grid covers the energy deficit.
3. Results
The proposed methodology was applied in a village with 25 families living in plots along a dirt road, located in the city of Barranquilla, Colombia, 3 km from the nearest highway. The village was created approximately 40 years ago by a group of peasant families, who, since then, have struggled against the adversities and lack of opportunities in the area. They raise animals such as goats, chickens, and, to a greater extent, pigs, or, in some cases, grow vegetables, legumes, and tubers in the fertile areas of the site. Other families work in recycling and others have informal jobs. There is a basic education school in the area with three classrooms where general preschool, elementary, and high-school classes are taught, with approximately 80 enrolled children.
The community does not have access to electricity from the distribution networks, which causes economic, social, and health problems, among others. The little infrastructure that the settlement has in terms of electricity service is the result of strategies generated by its inhabitants. For this reason, the service is discontinuous, unsafe, and restricted to a few.
The village has 24 houses grouped into 10 plots, a school, and a church. The number of inhabitants per plot is shown in Table 2.
Table 2.
Inhabitants per plot (Information collected on site).
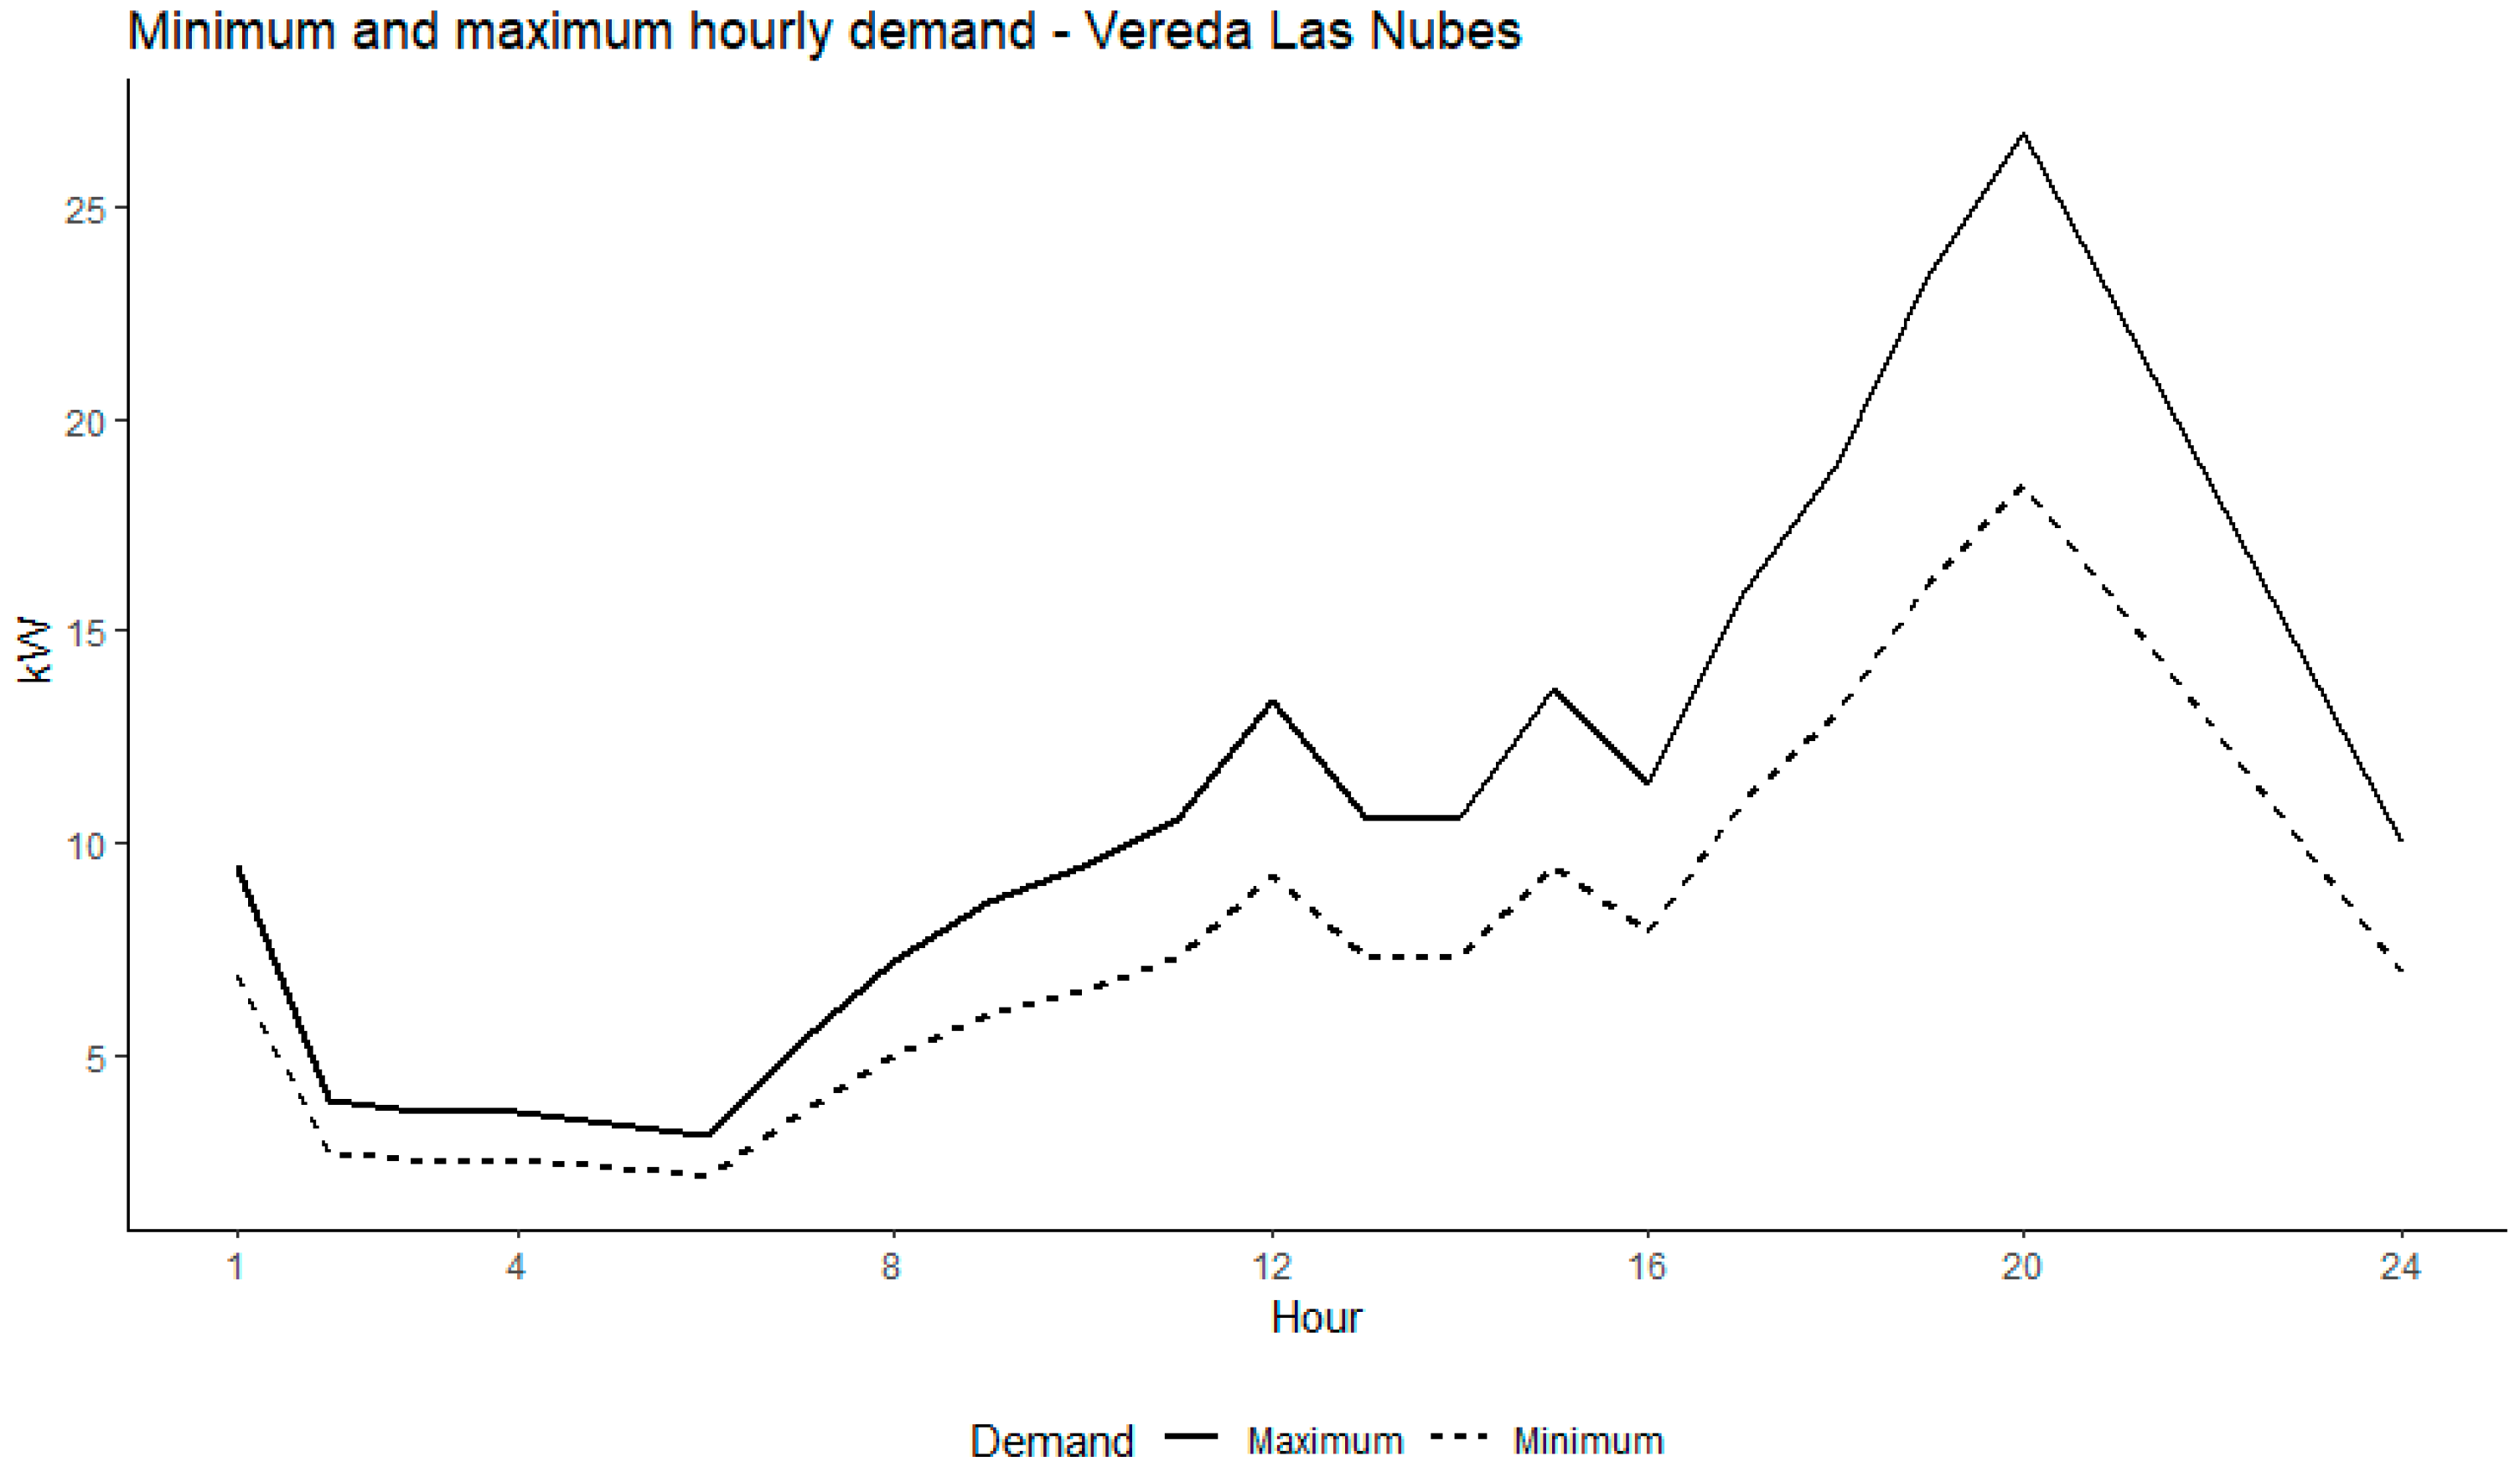
Some houses have appliances because they have diesel generators to supply power, but others do not. The school has a photovoltaic system that supplies electricity for educational activities. For this reason, the load profile of each household was assumed to be the consumption of a family of four with a set of basic household appliances (TV, cell phone, blender, refrigerator, iron, washing machine, computer, fan, and stereo). Figure 2 shows the minimum and maximum values of hourly demand per day of the assumed load profile.
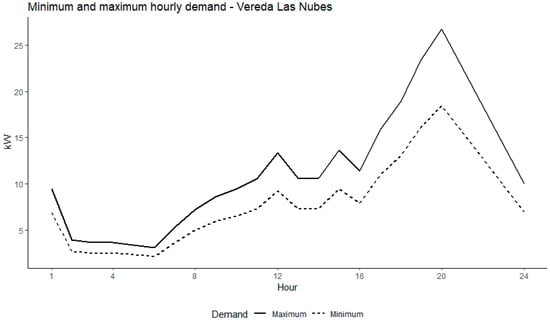
Figure 2.
Load profile “Vereda Las Nubes”.
The biogas energy produced by the pig excreta was used to cover the load profile described in Figure 2. The values used to estimate this energy are shown in Table 3.
Table 3.
Classification of pigs by size (Information collected on site).
The first column of Table 3 shows a size classification of the pigs. The second column, subdivided into seven sections, shows the number of pigs by size in seven of the plots. The third column shows the total number of pigs by size and their sum total. The fourth column shows the average weight in kg per pig size. The fifth and sixth columns show the mean weight and total weight of the excreta, respectively. These values allow the calculation of biogas using Equations (1)–(7).
, , ton/year, ton/year, m3/day, and kWh/year. The capacity of the electricity generating unit GUC with an efficiency of 30% and an annual operating time h was . According to these results, a 5 kW generating unit with a single-phase alternating current output was chosen. Table 4 shows the generating unit characteristics.
Table 4.
Biogas generator characteristics.
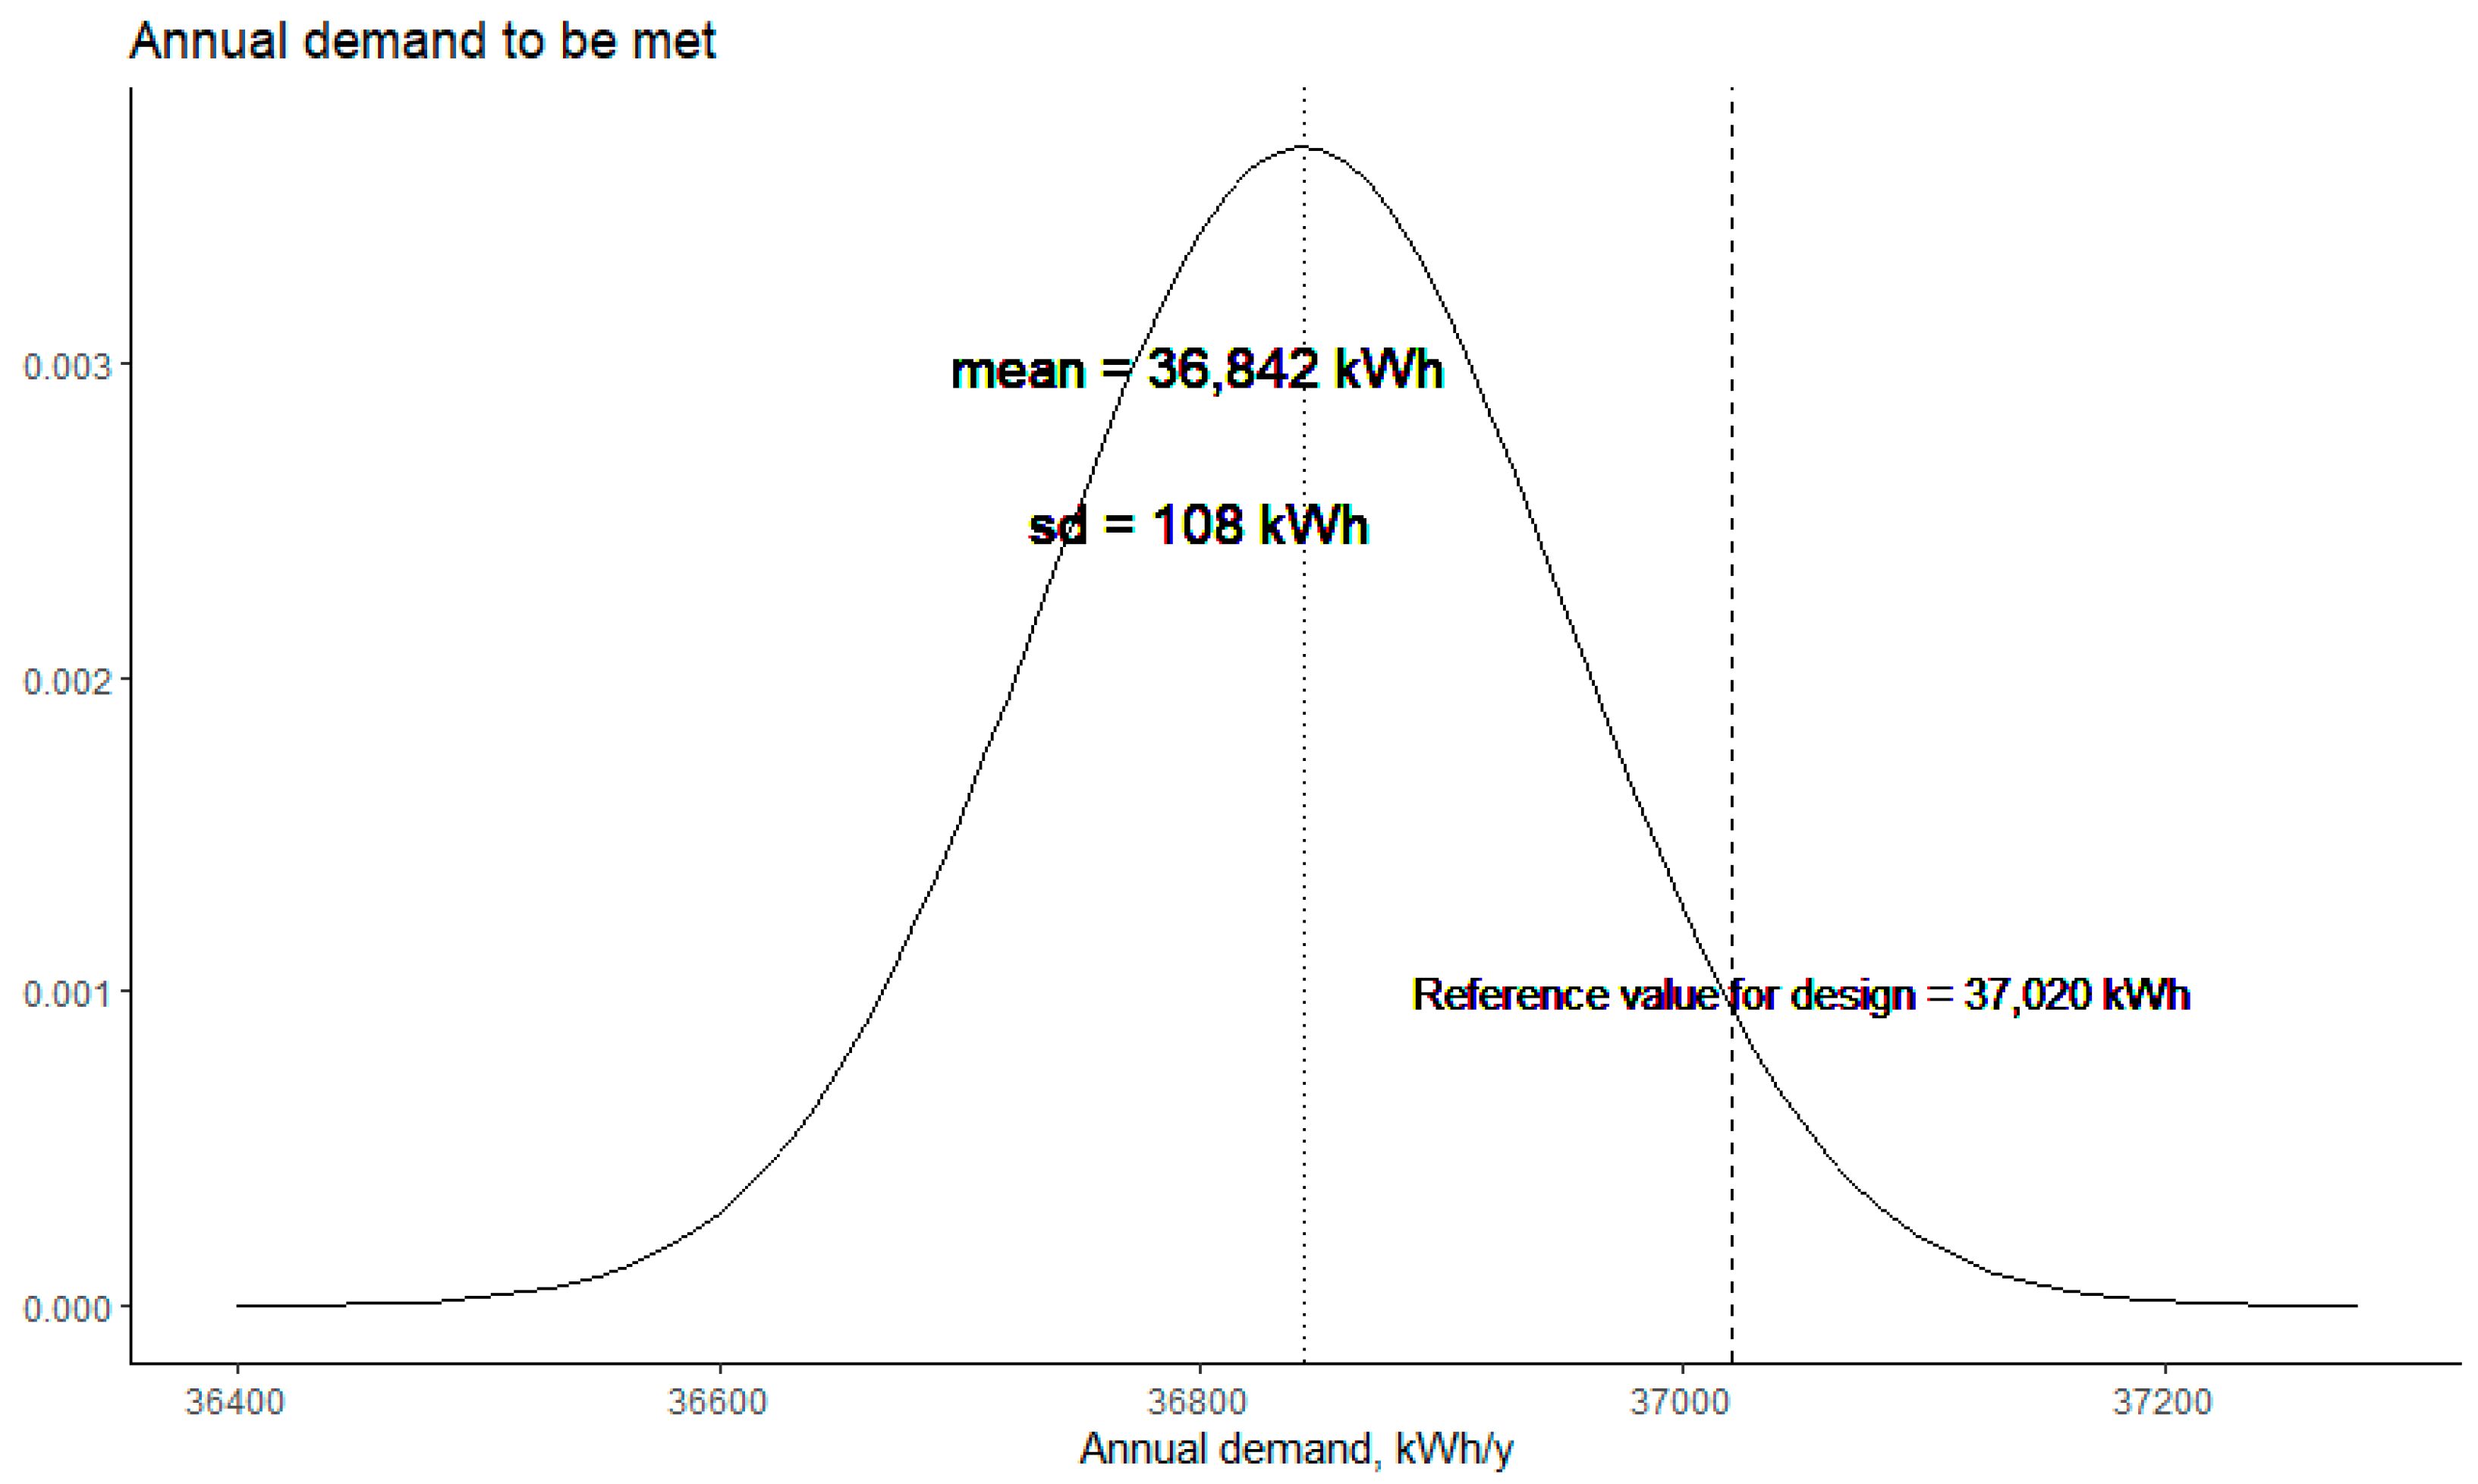
The energy provided by biogas was not enough to cover the demand and therefore we analyzed the annual unmet demand to be met with the other sources available in the area, i.e., solar and wind energy. Figure 3 shows the probability distribution of the remaining annual demand after supplying the energy produced by the biodigester. To size the complementary system, the value of 37,020 kWh was taken as a reference. This implies that 5% of the annual demand may not be covered by the entire hybrid system. The curve of Figure 3 was obtained using simulation.
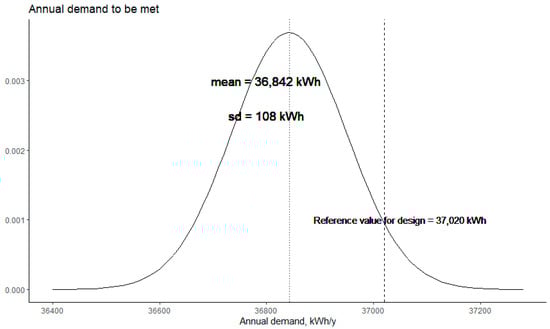
Figure 3.
Remaining demand to be covered using solar panels and wind turbines.
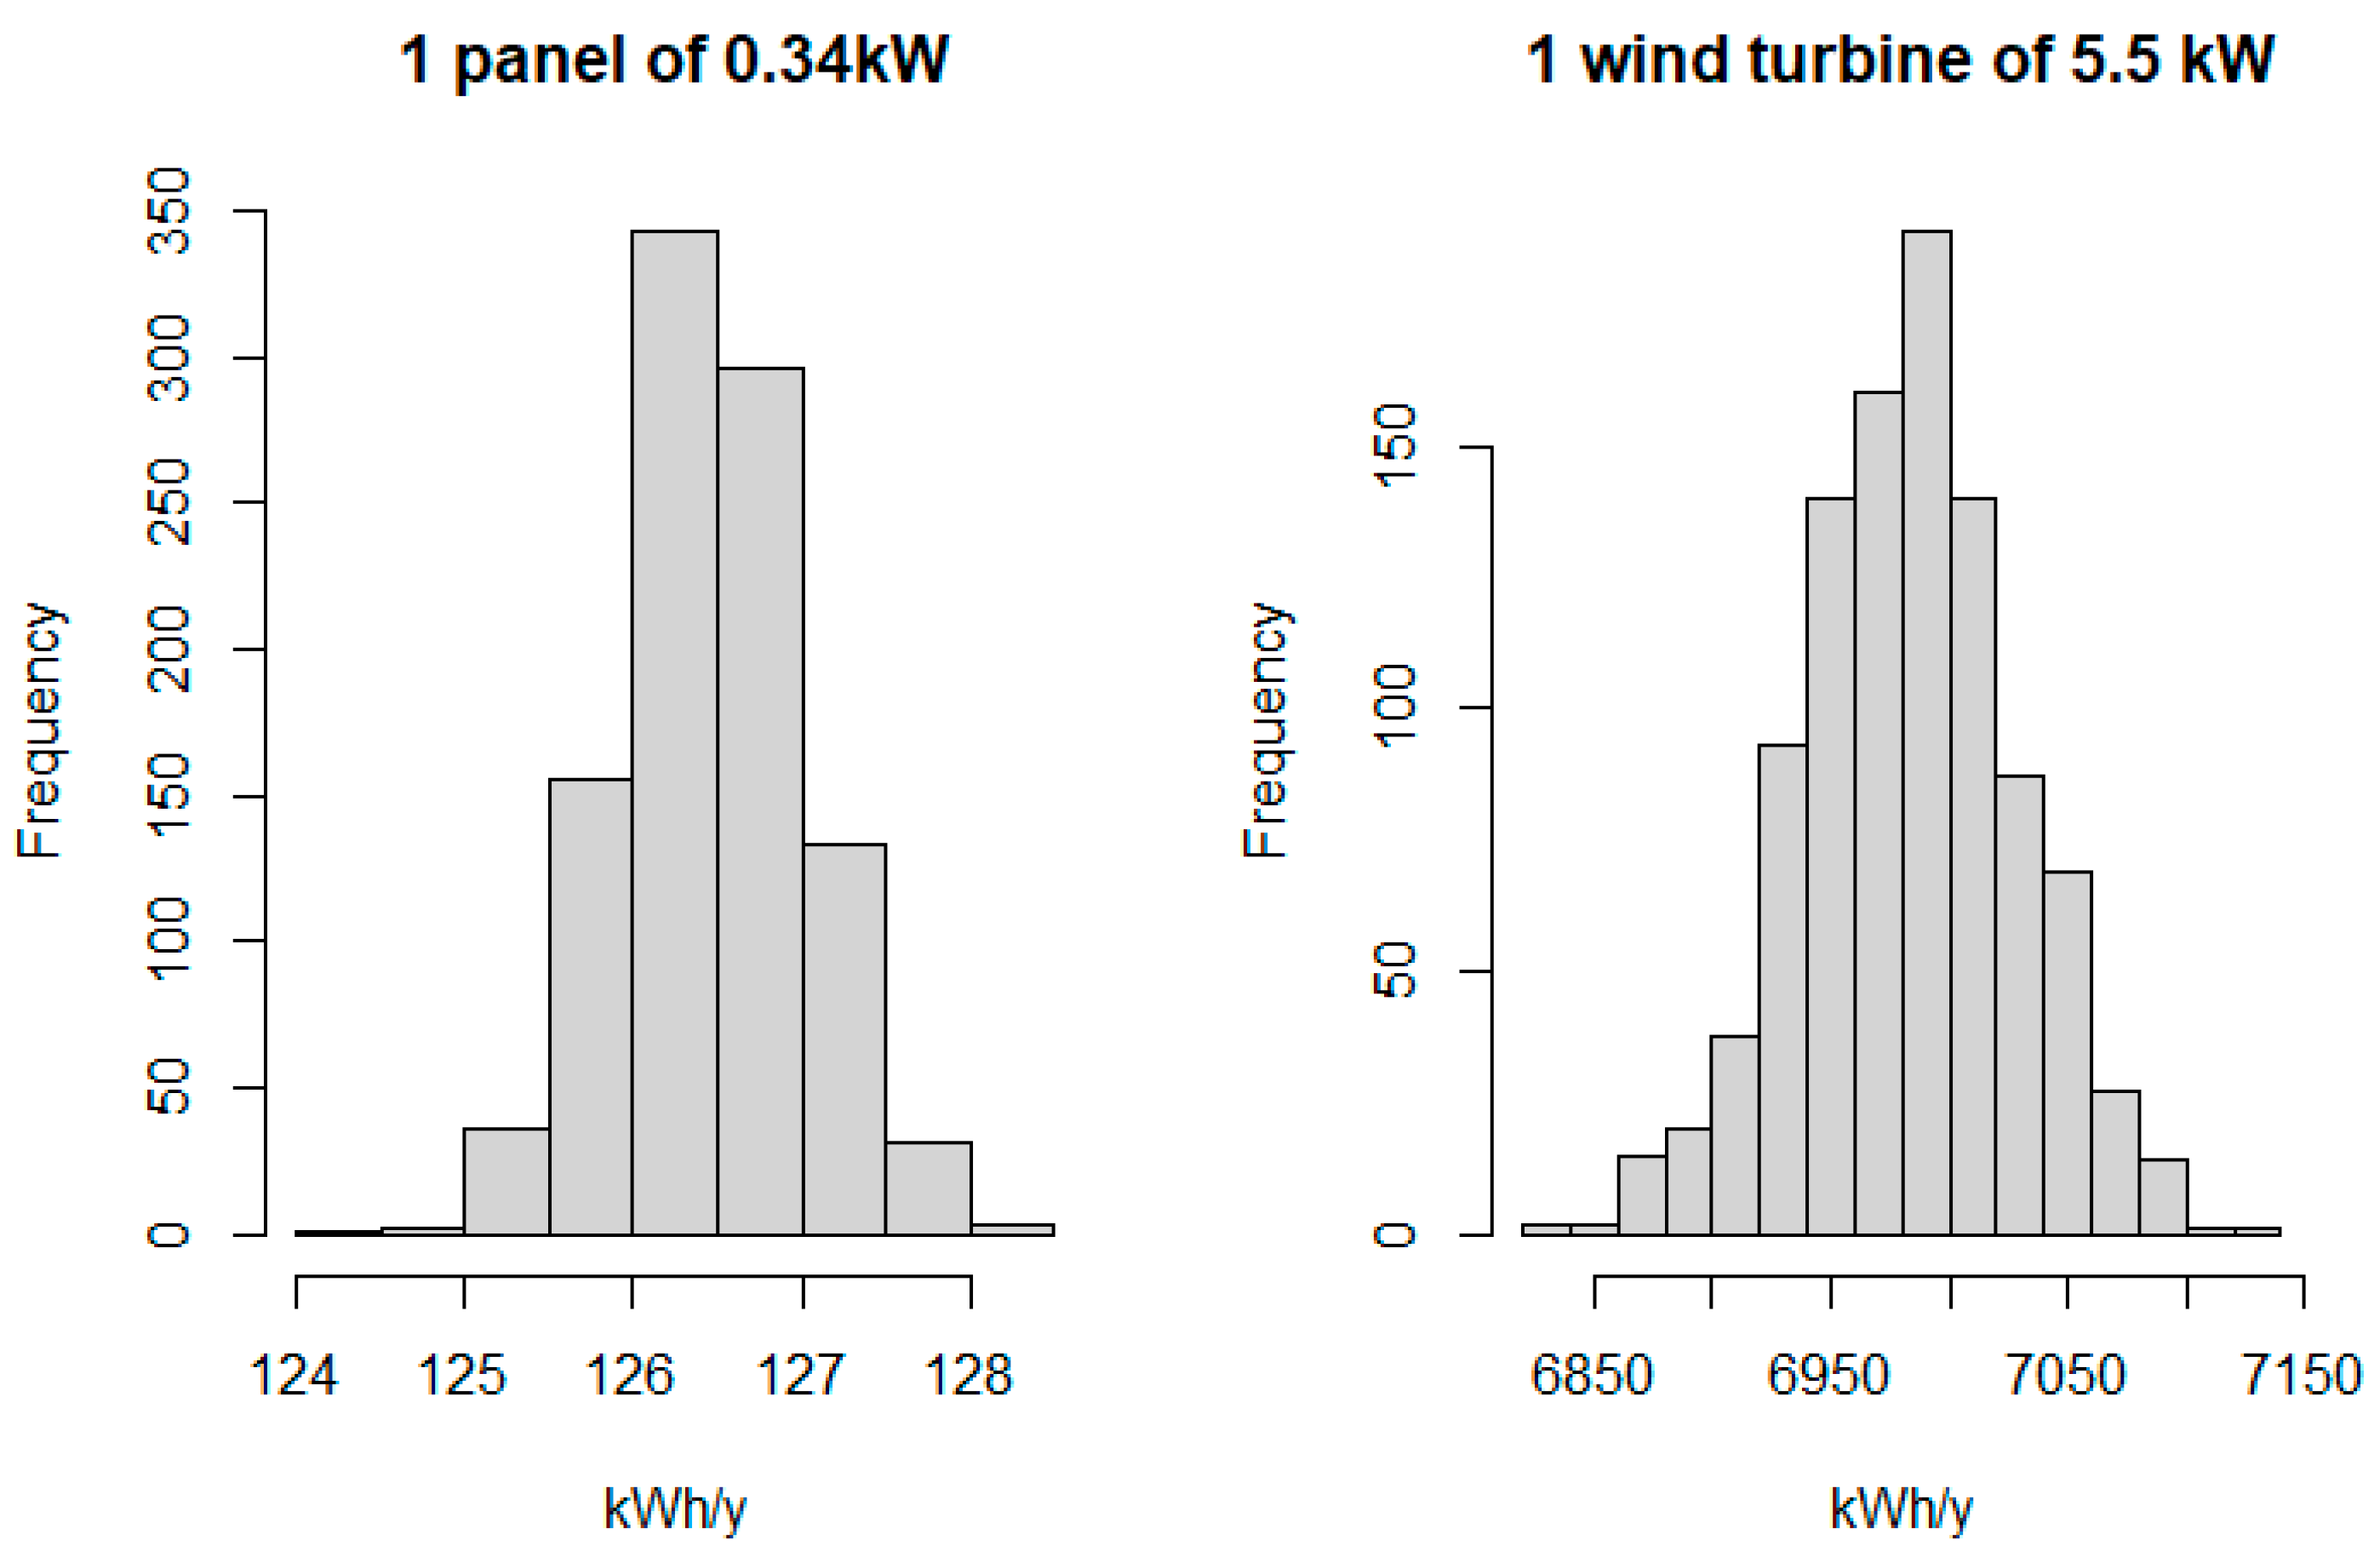
The complementary system consisted of a combination of panels and wind turbines in different quantities to obtain the design capacity shown in Figure 3. To calculate these combinations, it was necessary to determine the energy provided by one panel and one wind turbine. The unit contributions of these technologies are shown in Figure 4.
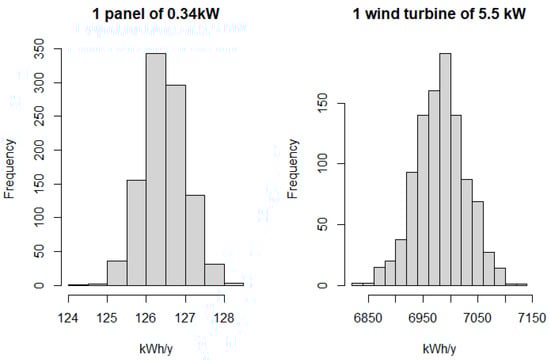
Figure 4.
Distribution of annual electricity produced by one panel and one wind turbine.
Figure 4 shows the annual electricity produced by a single photovoltaic panel (see characteristics in Table 5) and a wind turbine from the TMY data (10°59′58.1″ north latitude 74°51′21.4″ west longitude).
Table 5.
Panel specification https://www.erasolar.com.cn/product/1011589699020197888.html (accessed on 16 August 2023).
Hybrid systems with different combinations of these components were simulated to meet the annual community demand not covered by biomass generation (Figure 3). These combinations are shown in Table 6.
Table 6.
Combinations of 0.34 kW panels and 5.5 kW wind turbines to meet unsatisfied demand.
Each of the hybrid systems defined in Table 6 can cover, together with the biomass generation, the annual energy needs defined in Figure 3. This means that on an hourly basis, they produce energy for self-consumption, but they can also produce surpluses if the energy produced by the system exceeds the hourly demand. Additional energy may be required because the hybrid system does not produce enough to meet demand. However, the annual demand is expected to be met.
The hourly turbine power was estimated by using Equation (9). An Enair (https://www.enair.es/es/aerogeneradores/e70pro, accessed on 16 August 2023) E70Pro with an output power of 5500 W was used. Table 7 shows the specifications.
Table 7.
Wind turbine specifications.
Surpluses occur when the energy produced by the hybrid system exceeds the community’s hourly electricity demand. If the community does not have a storage system or is not connected to the grid, these surpluses are lost, and with them, the opportunity to generate income or save costs; in the case of being connected to the conventional electricity grid, these surpluses are considered exports of electricity to the grid. In some electricity systems, there is the possibility to offset energy imports with surpluses; the net amount may then represent a value to be paid because the energy imports exceed exports or a credit in favor because more energy is sent to the grid than is imported.
Next, the optimal economic performance of HRES is analyzed by considering three cases:
- The community uses an isolated hybrid system, that is, there is no connection to the grid, and it has batteries to store any surplus.
- The community is not connected to the grid and the deficit is covered using a diesel-based generation system.
- Finally, the community is connected to the grid and is allowed to send its surpluses to the grid.
The three cases have common costs: investment, operation and maintenance, and the replacement of the solar, wind, and biomass systems. Case 1 adds the cost of the batteries while Case 2 adds the costs of the diesel generator instead. These costs are in Table 8.
Table 8.
Unit costs.
Case 1. Isolated hybrid system supported by a battery bank to supply the energy deficit.
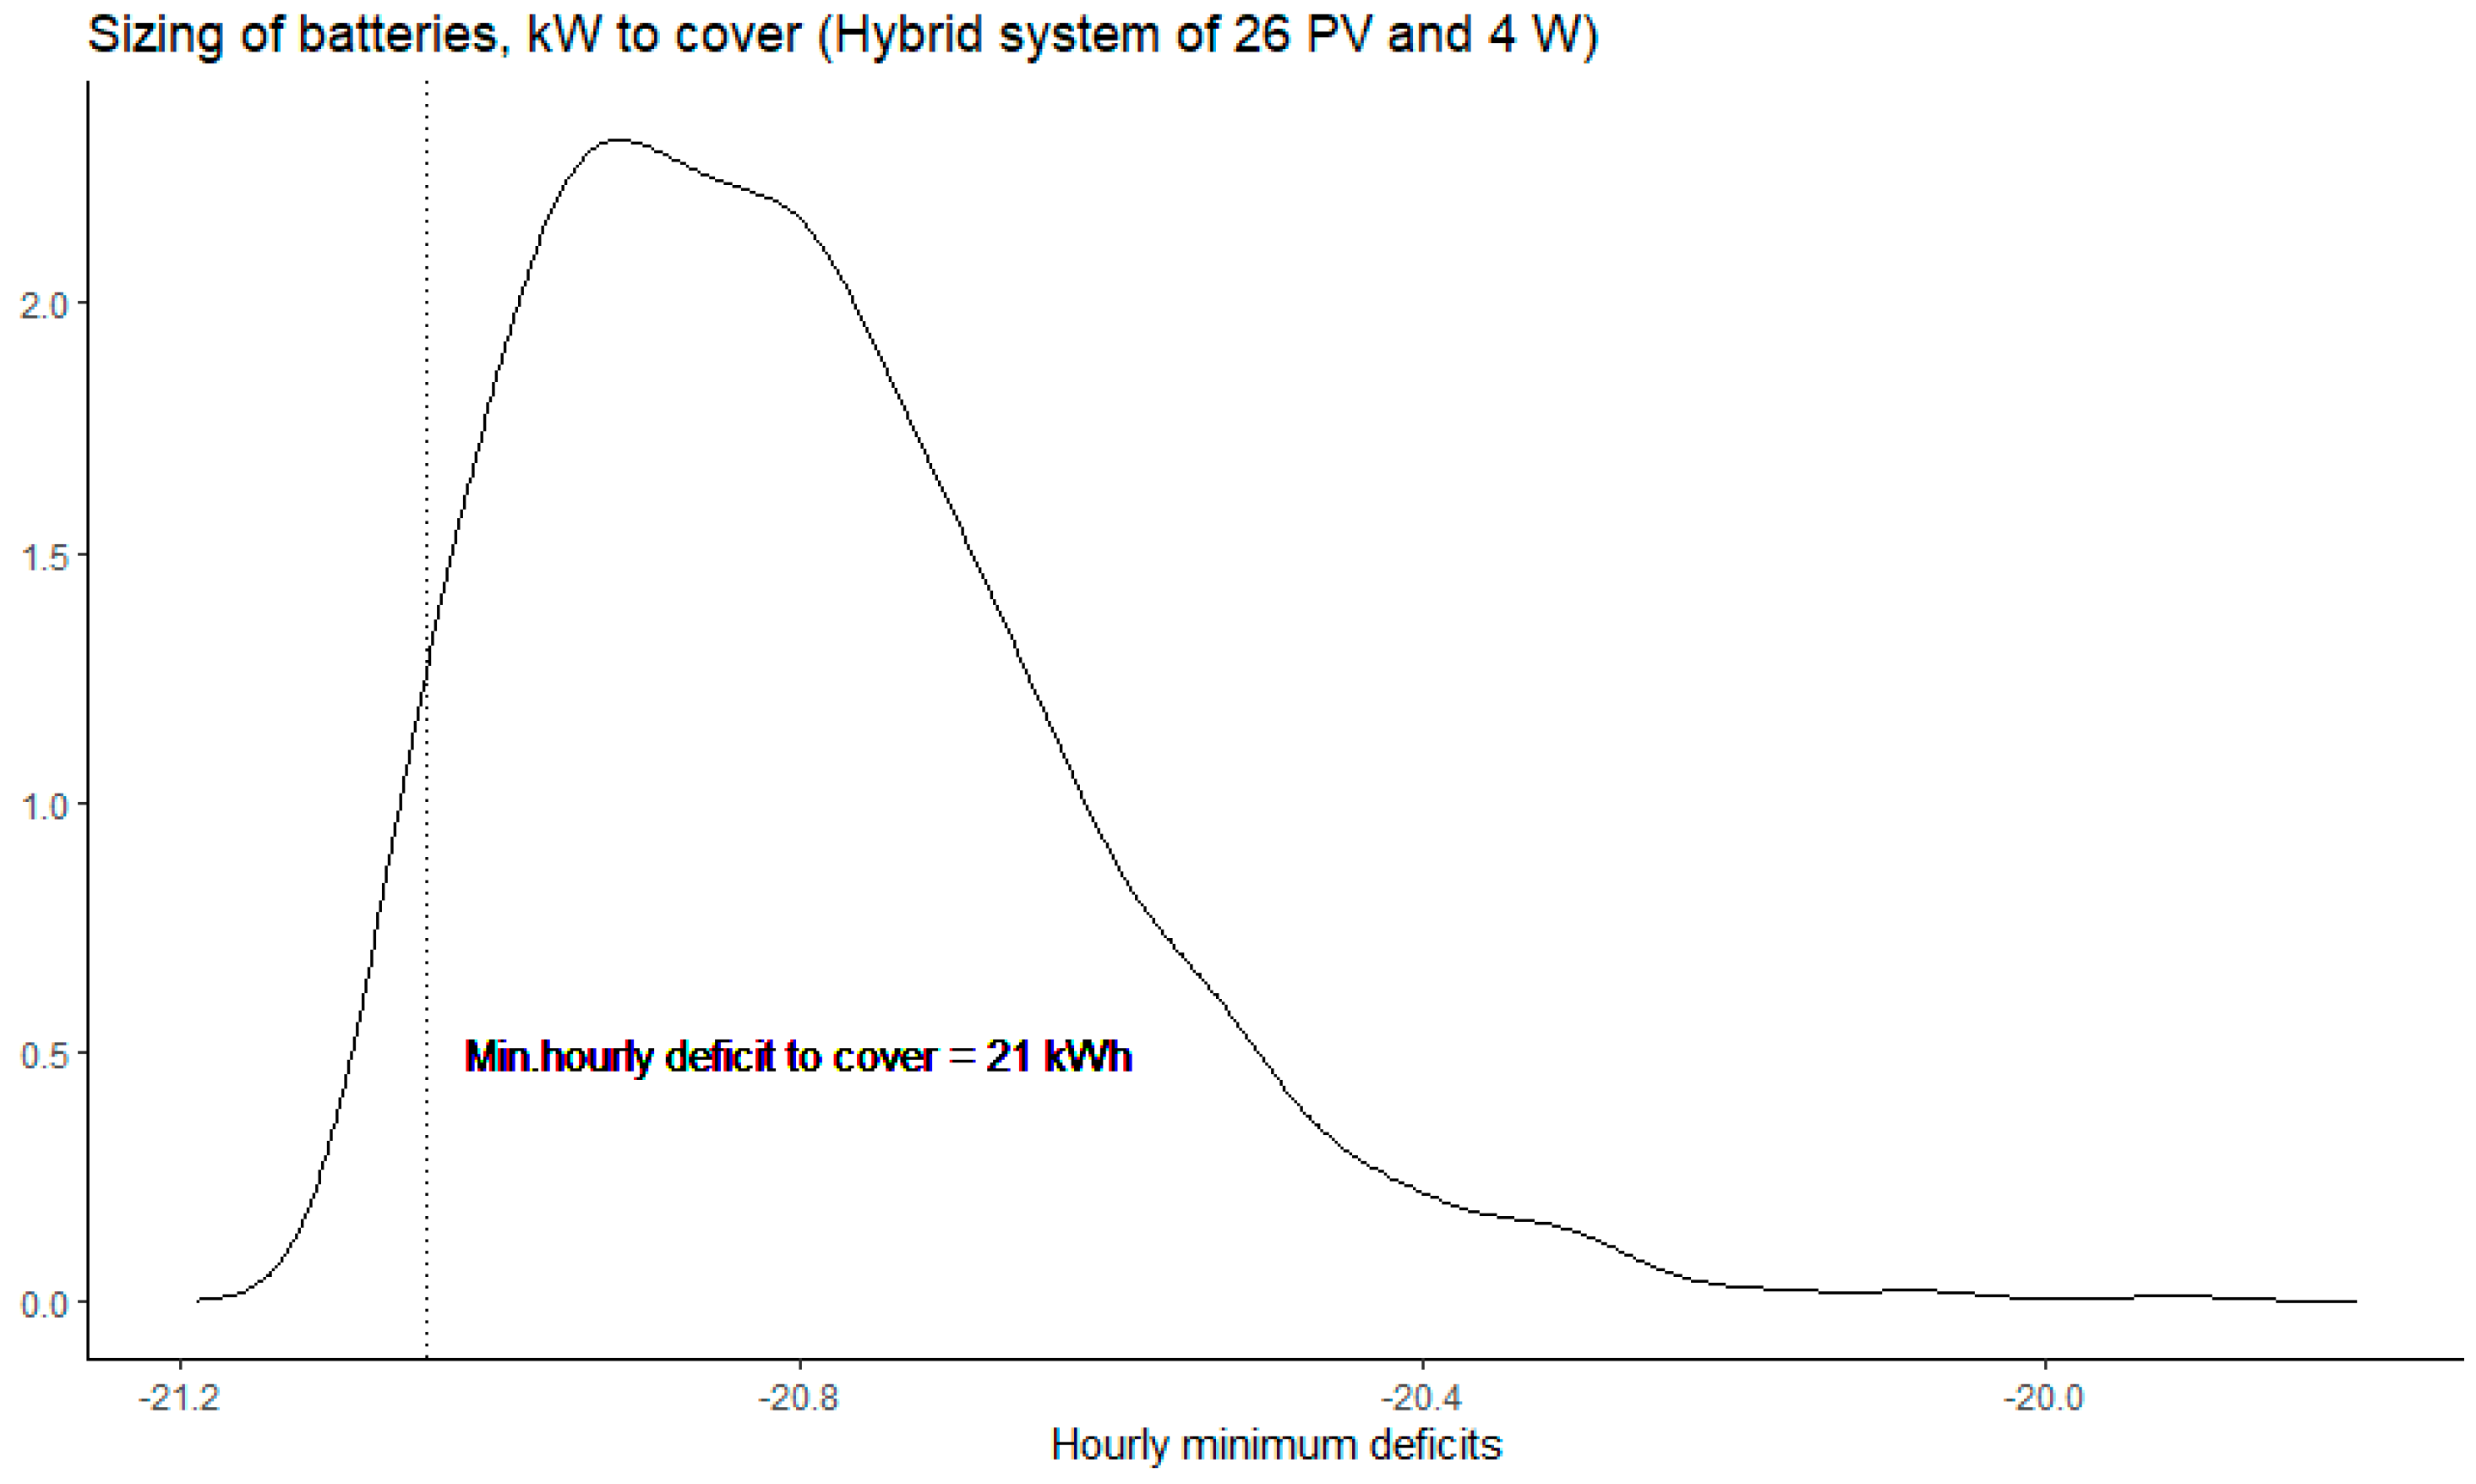
To size the number of batteries required for each combination given in Table 5 of the hybrid system, the monthly hourly wind speed and irradiance were simulated using the corresponding values contained in the TMY data; from these values, the hourly electricity production of the number of panels and wind turbines given by each combination in Table 5 was estimated. These were added to the hourly electricity production of the biomass-based system and the total was subtracted from the simulated hourly electricity demand (Equation (11)); negative values result in hourly deficits, indicating that the demand is greater than the supply, while positive values indicate hourly surpluses. For each month, the minimum of the deficits was identified (Equation (12)), and of these, the minimum per iteration. This procedure made it possible to construct a probability distribution of the hourly minimums for each hybrid system and thus define a battery sizing that at least 95% of the time was capable of supplying the hourly deficit presented. This implies a probability of not covering the hourly demand of a maximum of 5%. Figure 5 shows the distribution of the extreme hourly deficits for a system with 26 panels and 4 turbines, where the value used for sizing is marked. The maximum number of batteries to cover the 21 kW requirement is 11. This value was the same for all the hybrid systems.
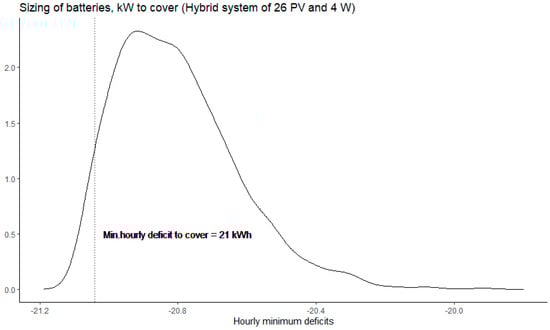
Figure 5.
Curve of minimum hourly deficits for (26.4) system.
The next step was estimating . For each pair , we found all possible battery values such that . For ternaries , we recorded the 1st percentile of the LPSP distribution (99% of the values are greater) and LCOE. Obviously, a greater number of batteries generated a more reliable system. It was found that a hybrid system with 64 panels, no turbine, the biodigester, and 11 batteries produced the lowest LCOE among all the hybrid systems analyzed, being .
Case 2. Isolated hybrid system with a diesel generator to supply the energy deficit.
In this case, a 20 kW diesel generator was selected to operate for 6 h a day, when there was no solar or wind resource. For a year, that would be 2190 h of operation. If the fuel consumption of the generator is 5 L/h, the annual consumption will be 10,950 L. The hybrid system with 64 panels and no turbine (pair (64 − 0) in Table 9) presented the minimum LCOE with a value of $/kWh. Table 9 shows the LCOE values for the panel and turbine combinations considered. All systems overcome the constraint imposed by LPSP.
Table 9.
LCOE values for feasible systems including diesel generation.
Case 3. Grid-connected hybrid system.
In this case, electricity exchanges between the prosumer and the grid were allowed, which were valued according to the prices shown in Table 10 and Equation (25). These average prices were taken from the Colombian market assuming that they were constant throughout the year. This assumption does not affect the overall results obtained.
Table 10.
Prices used to value energy exchanges.
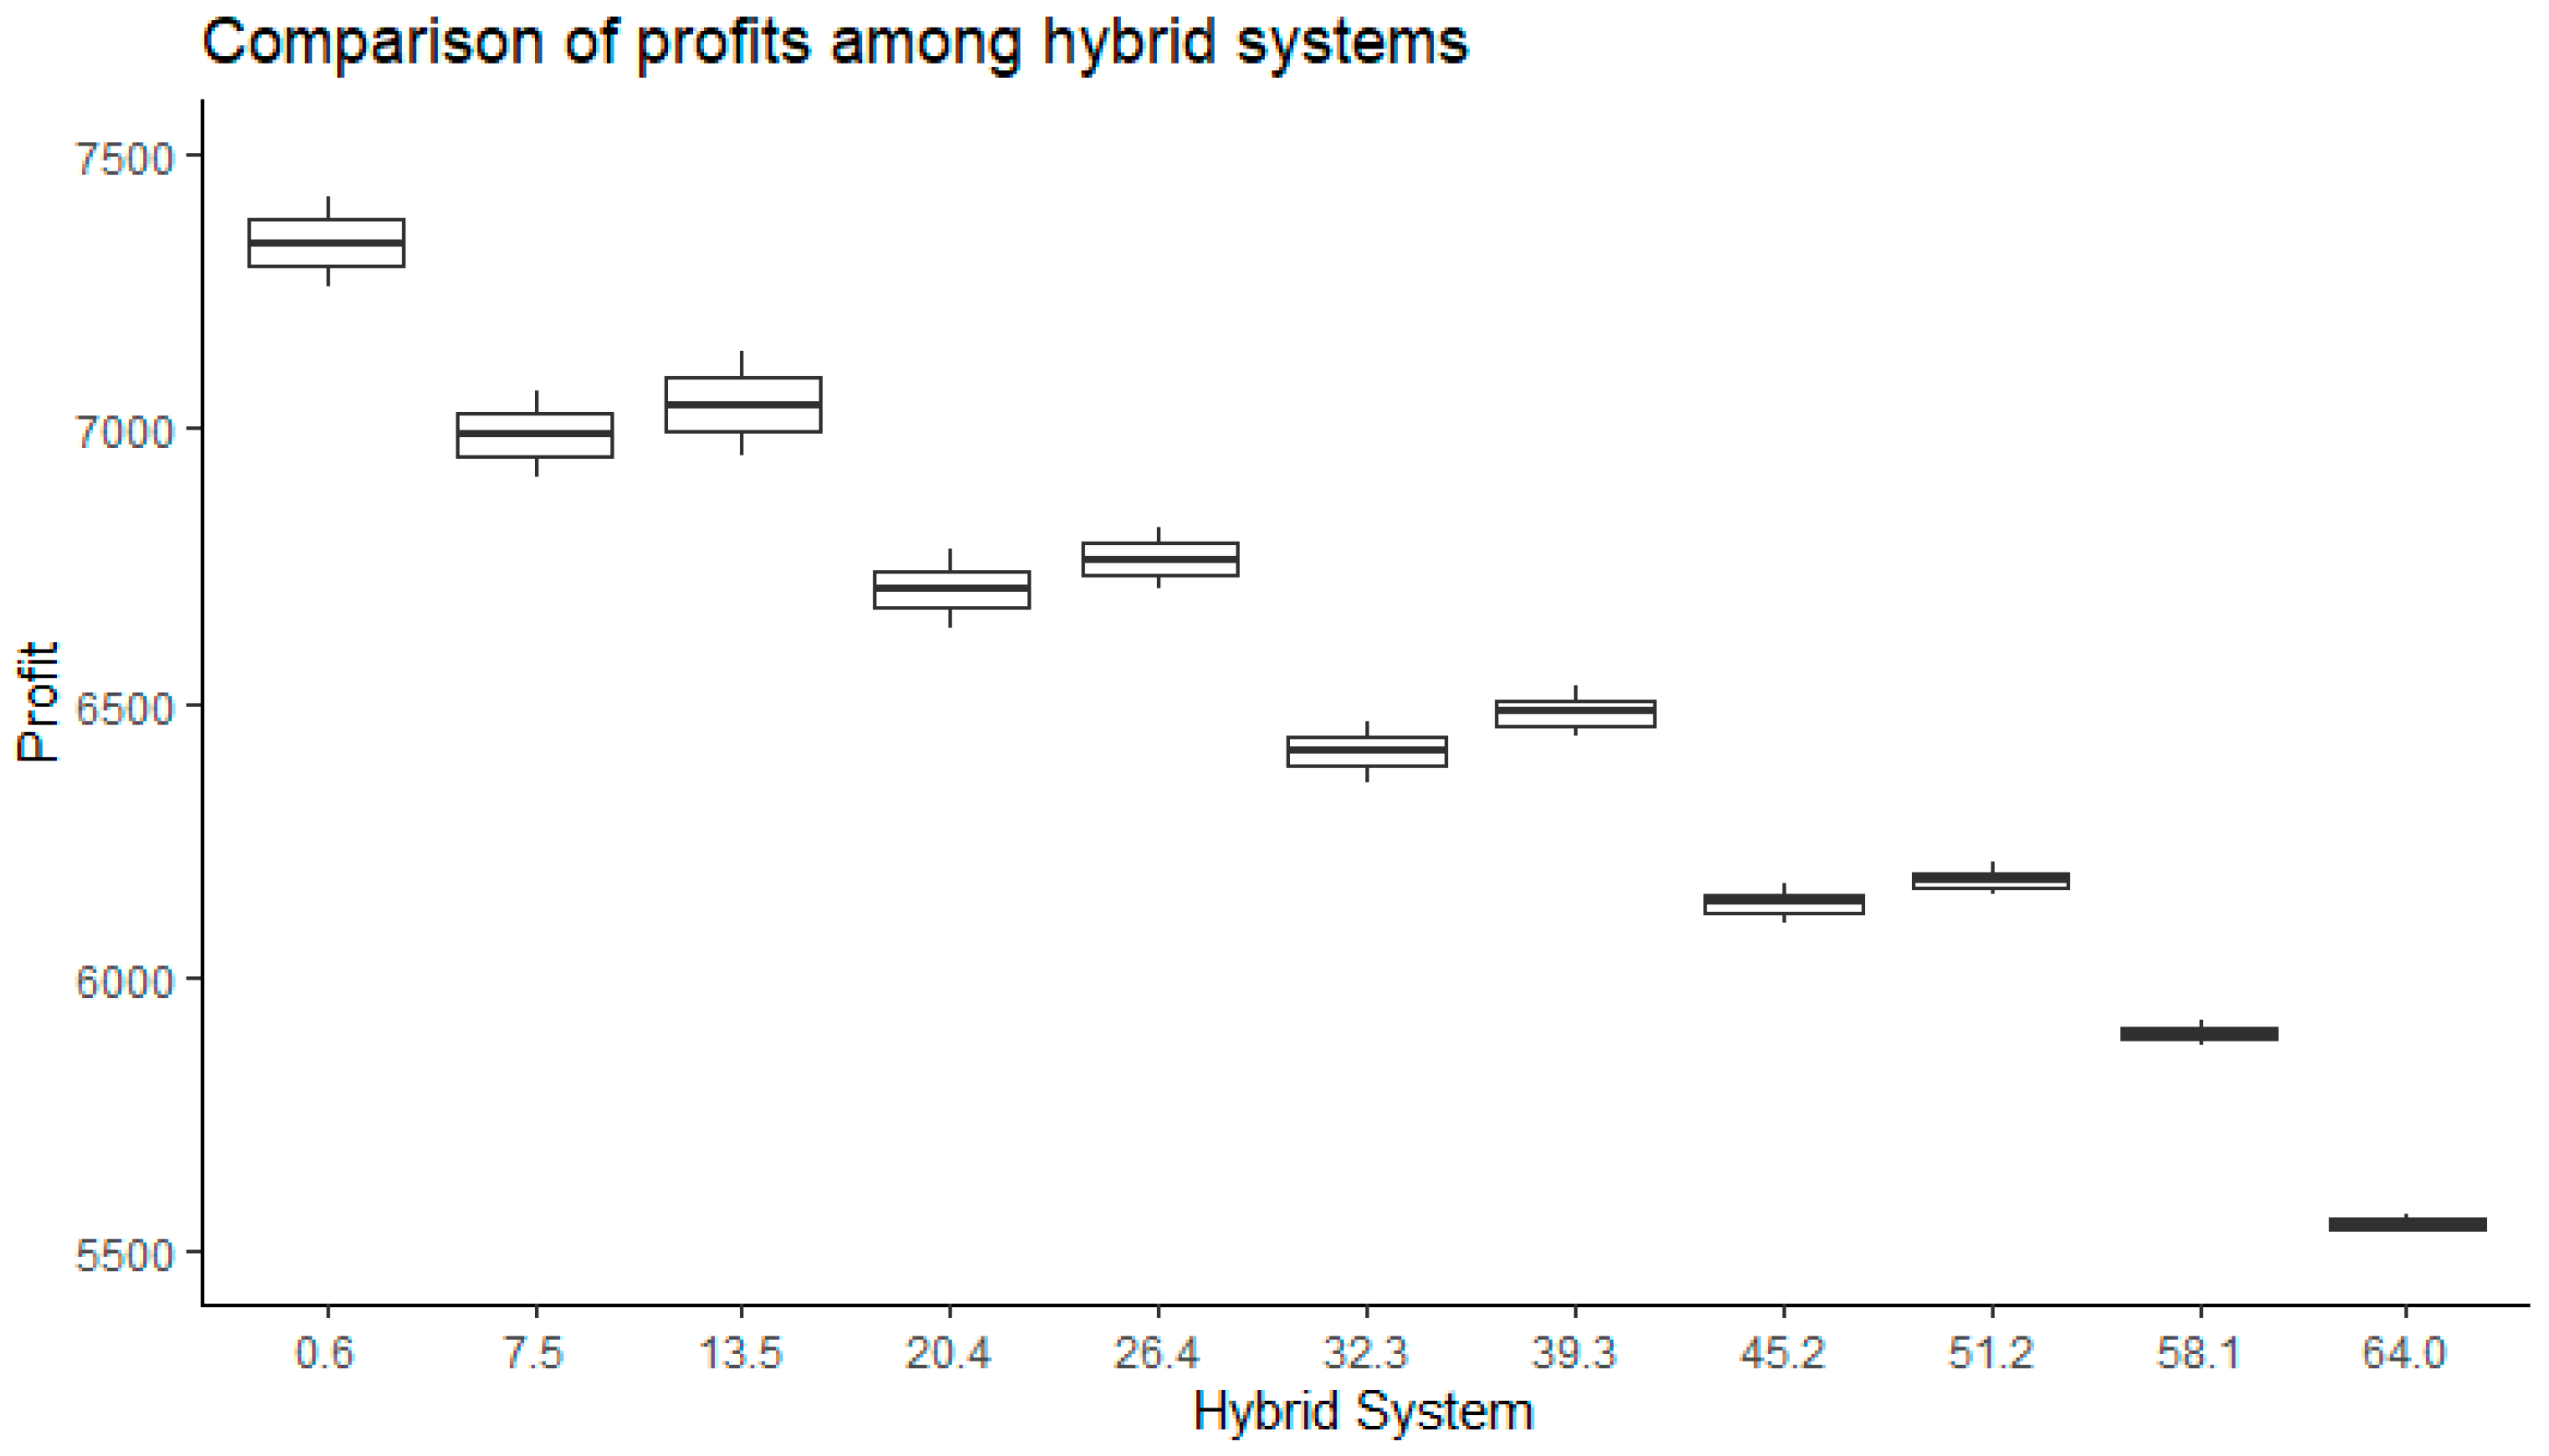
The annual performance indicates that energy exports to the grid were higher than imports, resulting in energy credits (see Figure 6). Figure 6 shows box-and-whisker plots of the profits for each pair of the hybrid system, keeping in mind that these were simulation results. Note that the interquartile range was narrow, indicating that there was little variation between quartiles. The credits favor systems where there are more wind turbines. This is explained because, although all the hybrid systems were sized to supply the same demand (37,020 kWh), when panels are used, there are more energy imports from the grid (which reduced the utility) because the electricity demand (Figure 2) is higher during non-sunny hours (at this location, the sun is available from 6 a.m. to 6 p.m.).
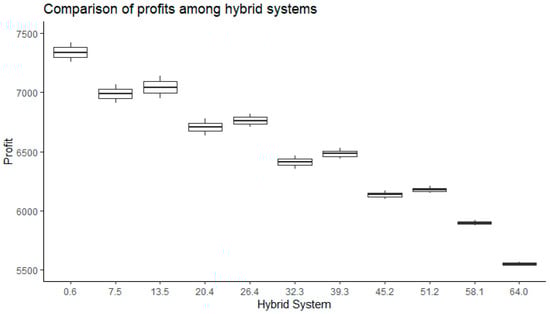
Figure 6.
Comparison of profits produced by hybrid systems. X-axis is .
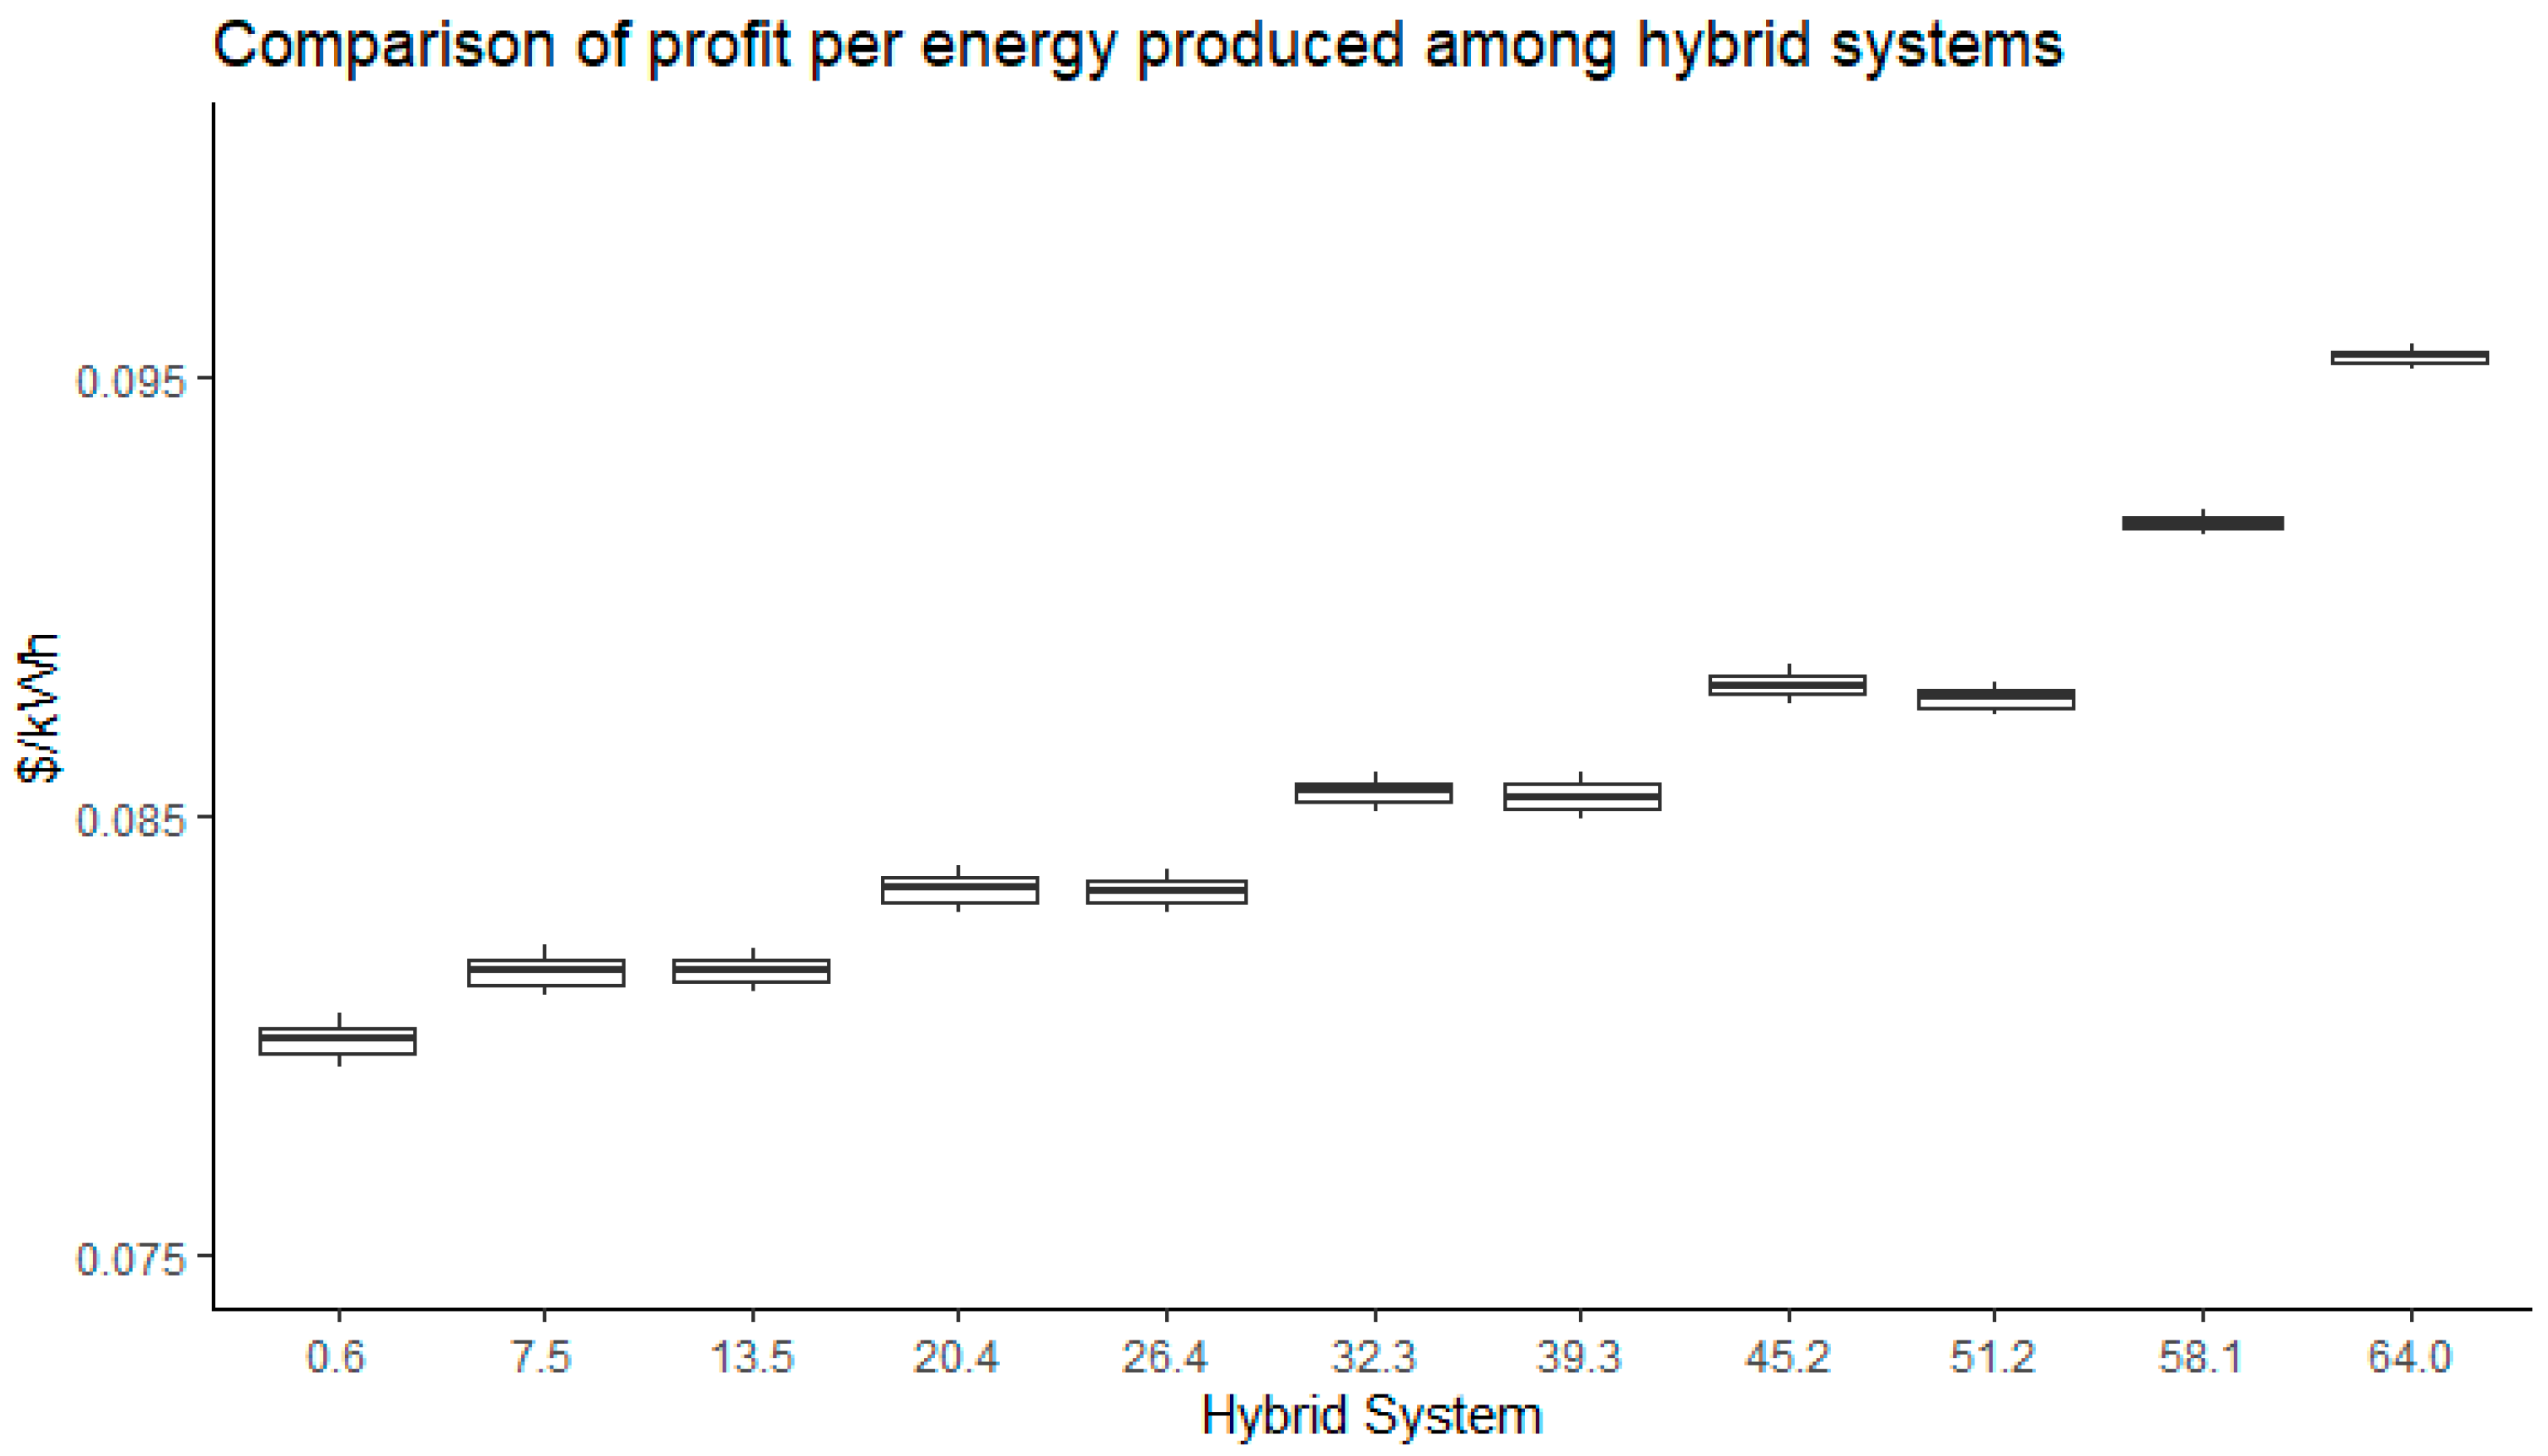
However, when the ratio of profit per energy produced was used, the result favored more the use of solar panels (Figure 7). The systems with a higher share of wind turbines produced more energy than the solar panels (the annual average produced by the system without panels and with six turbines produced 91,870 kWh/year, while the system with 64 panels and no turbines produced an average of 58,970 kWh/year). Note that the indicator practically does not change (narrow interquartile ranges in the box-and-whisker plots) despite being the result of a simulation.
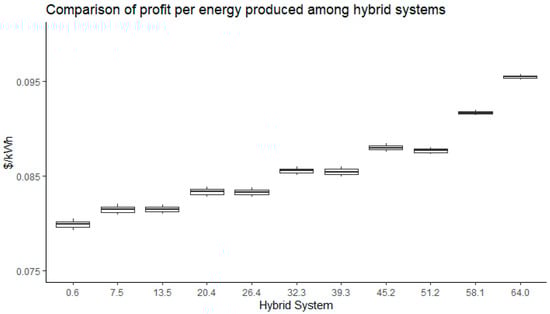
Figure 7.
Comparison of profits per kWh produced by hybrid systems. X-axis is .
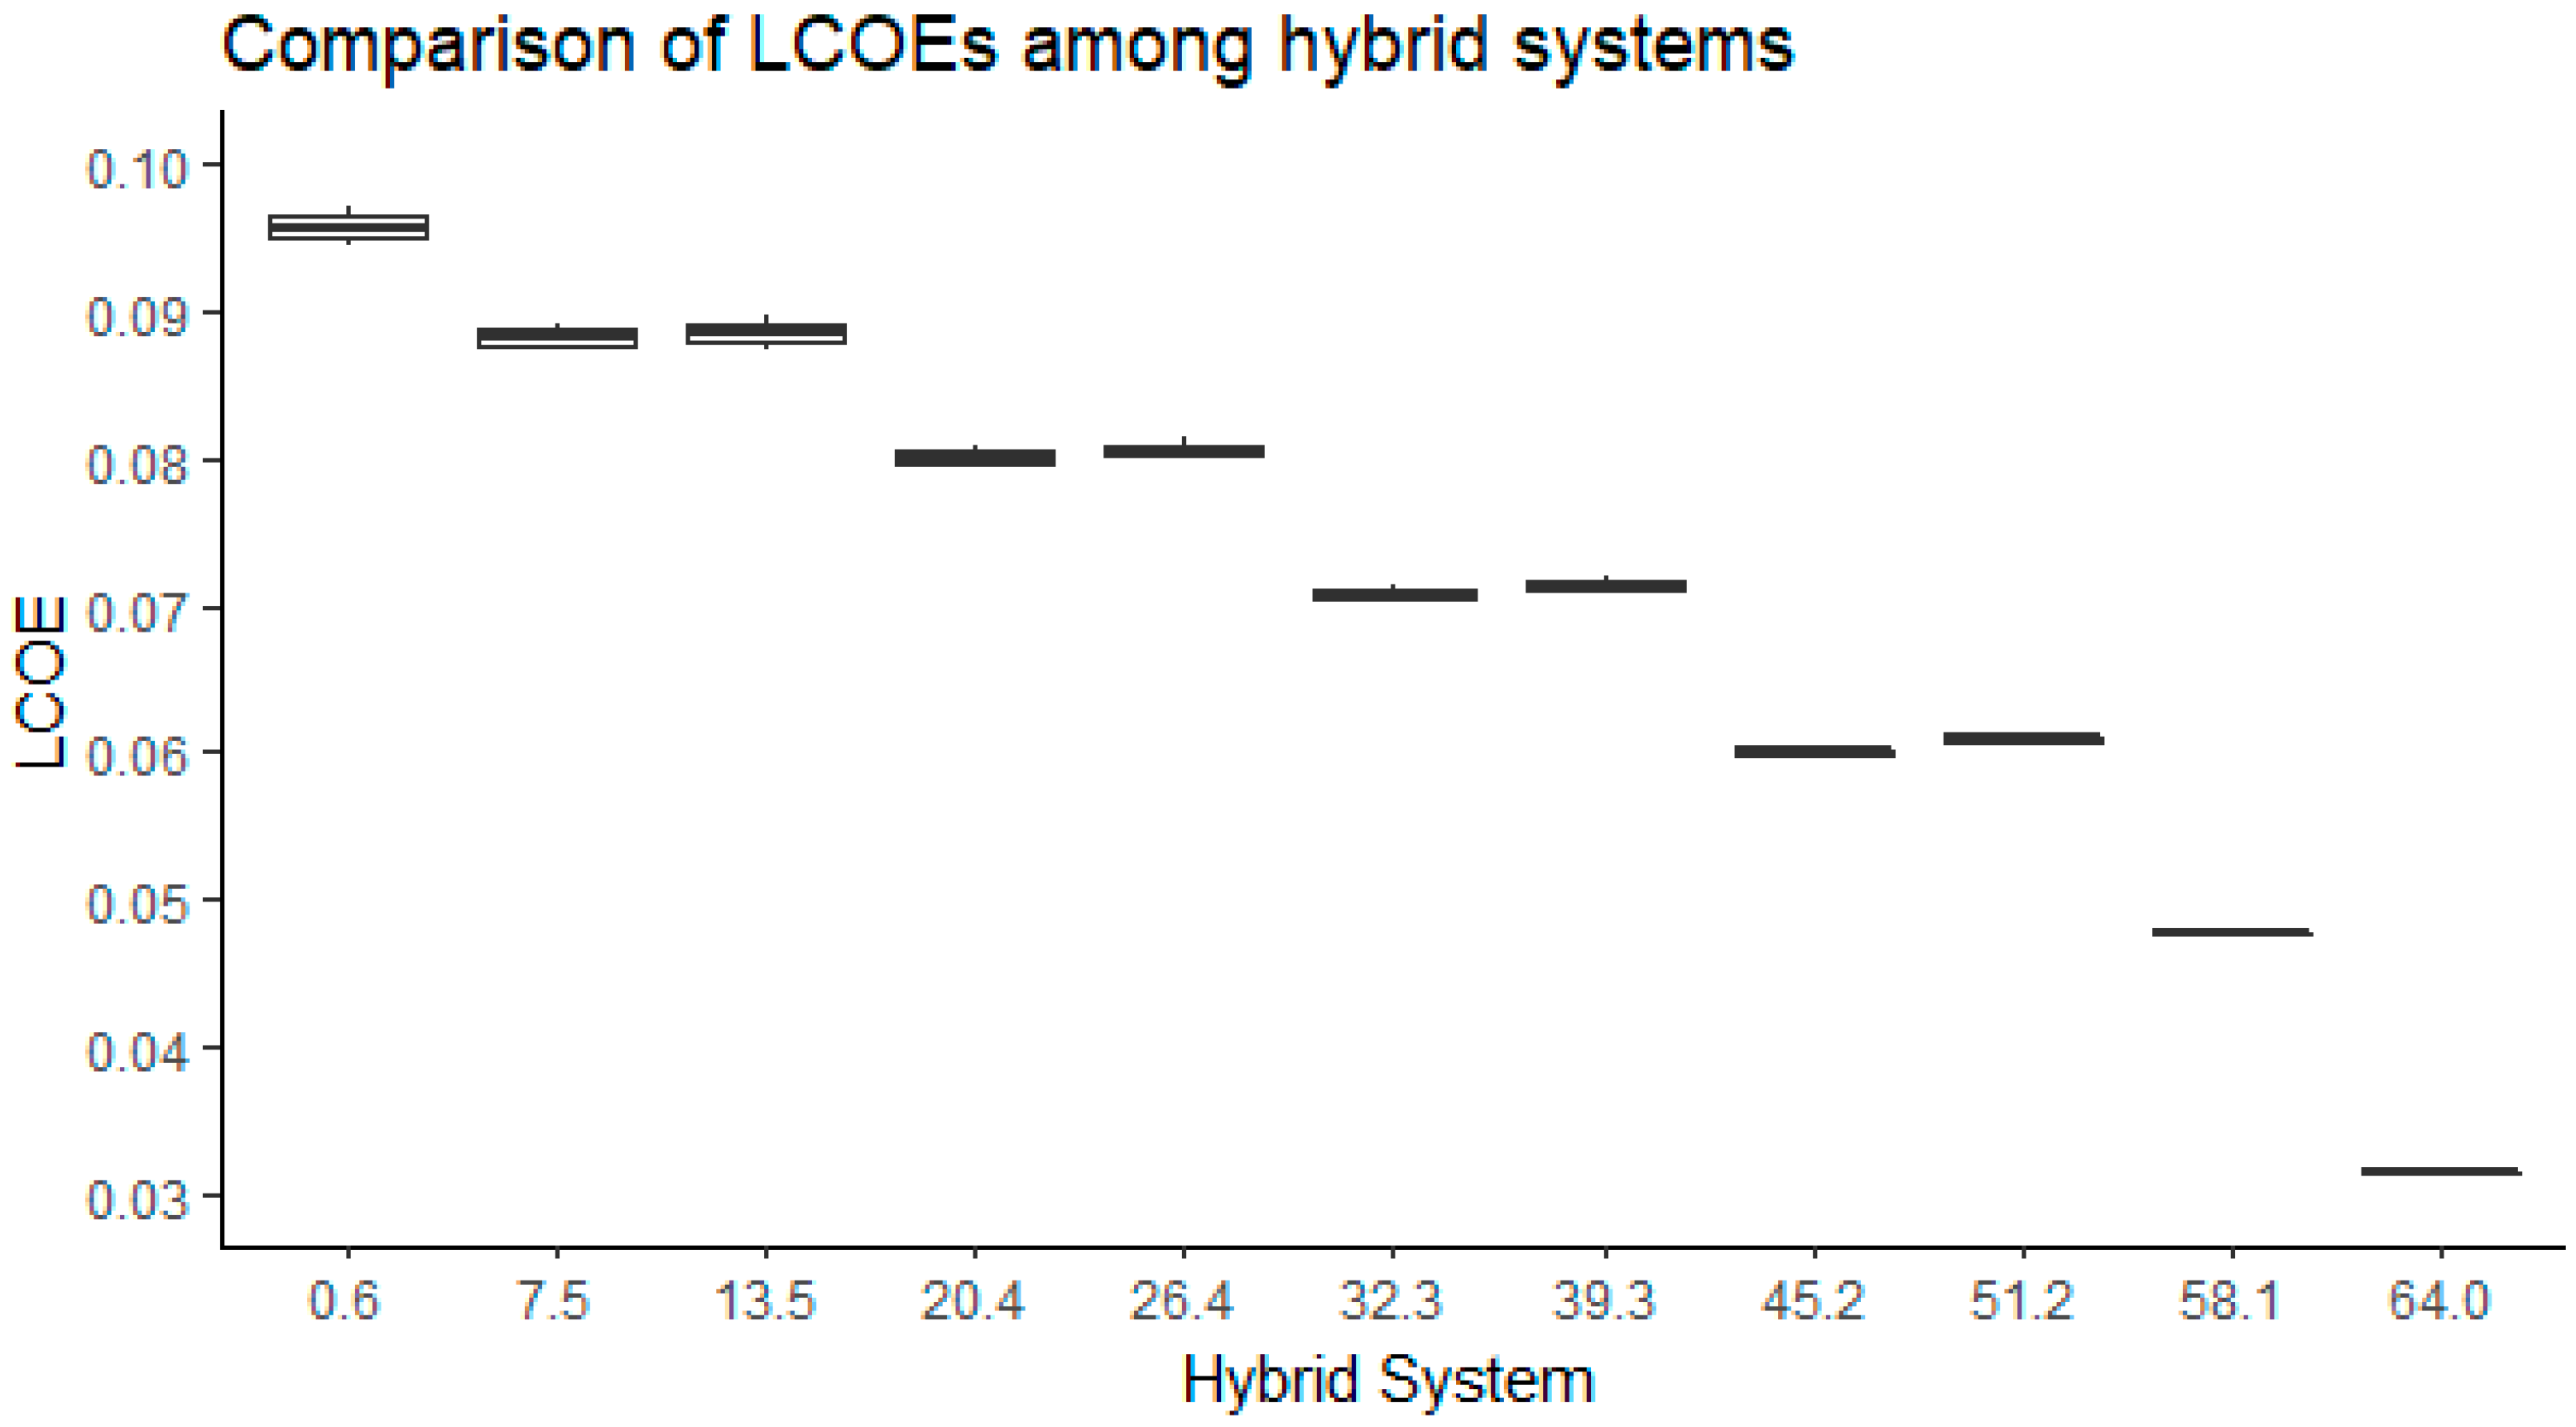
On the other hand, when reviewing the LCOE, as wind turbines were replaced with panels for electricity production, the costs involved were increasingly lower, which favors the economic performance of solar panel systems (Figure 8). The LCOE calculation for the best system was virtually unchanged in the simulations.
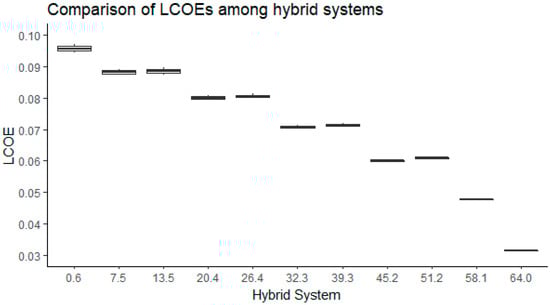
Figure 8.
Comparison of the LCOE of hybrid systems.
All three systems had in common that the lowest LCOE value was obtained using 64 panels and no turbine; this is due to the location of the site, which allows high solar radiation throughout the year, and the fact that winds are strong only during some months of the year. However, the on-grid systems were the best performers. They can produce benefits and have the lowest LCOE.
4. Discussion
There are communities living in remote locations where access to electricity has not been easy because conventional electricity systems that use transmission and distribution networks to transport energy have not been able to reach them. In these cases, the technological development that has enabled the use of renewable energies has played an important role in achieving SDG7. Much of the existing scientific literature has focused on the use of isolated hybrid systems based on renewables that use battery backups or diesel generators to reduce this gap.
However, there are other cases of communities that have not connected to the conventional power grid because of a purchasing power problem, but not because their connection is hindered by physical or geographic barriers.
For these vulnerable communities, renewable energy alone is not the solution due to the high costs involved. This paper demonstrated that the LCOE of on-grid systems is lower than that off-grid systems. The community alone cannot solve this problem, so the government must finance the solution; the self-sustainability of the operation in the long-term increases if conditions and incentives are also provided for self-generation and energy exchanges with the power grid [11], to which the community should be connected if possible. This coincides with the conclusions obtained in other studies [43,44]. Policies can also be implemented to train community members in the operation and maintenance of the systems, thus generating new sources of employment and improving their social, economic, and health conditions, among others.
For future work, the results obtained in this work can be compared with the results that can be obtained using the hybrid methods that combine heuristics, algorithms, and characteristics of the problem that are considered highly effective.
5. Conclusions
This article analyzed how to supply the electricity needs of a vulnerable community without access to electricity in the framework of SDG7. Hybrid systems that integrate renewable sources such as solar and wind with biomass generated by the community’s economic activity were sized. Off-grid hybrid systems supported by batteries or diesel generation were reviewed considering that the community is not connected to the city distribution grid. On-grid systems were also analyzed under the assumption of grid connection. The results indicate that the community’s electricity demand can be supplied using energy from the pig biomass currently available to the community, integrated with solar panels and grid connection. Energy from wind turbines makes supply more expensive. Similarly, working with off-grid systems produce shortfalls that must be covered using backup systems such as batteries or diesel generation, which makes electricity supply more expensive. This conclusion is supported by the levelized cost of energy of the different systems evaluated, which shows that hybrid systems with biomass and solar energy presented the best performance when connected to the grid. Grid connection is important in contexts where regulation allows energy exchanges between prosumers and the grid.
According to these results, to make progress toward achieving SDG7, communities without access to energy should not work with off-grid systems as long as they can be connected to the grid. This implies that governments should support this by creating the regulatory and infrastructure conditions for connection to distribution networks and provide support for the integration of adequate renewable sources, seeking to turn vulnerable communities into prosumers.
Author Contributions
Conceptualization, L.G.; methodology, L.G. and A.H.; software, A.H.; validation, L.G. and A.H.; formal analysis, L.G. and A.H.; investigation, L.G.; resources, L.G.; data curation, A.H.; writing—original draft preparation, L.G.; writing—review and editing, A.H. All authors have read and agreed to the published version of the manuscript.
Funding
This research received no external funding.
Data Availability Statement
Data for a typical meteorological year for the location of interest were downloaded from the NREL website.
Acknowledgments
We thank the community that lives in the village of Las Nubes for their willingness to collaborate. We also like to thank the industrial engineering students, now engineers, who did the field work: Pedro Gutierrez, Elizabeth De la Cruz, Raul Ibañez, Katherin Ibarra, Paola Gutierez, Youssef Marun, Luis Quintero.
Conflicts of Interest
The authors declare no conflict of interest.
Nomenclature
| List of Abbreviations | |
| ACS: annualized cost [$/year] | LCOE: levelized cost of energy [$/kWh] |
| AEFA: artificial electric field algorithm | LPSP: loss of power supply probability |
| BAT: battery | MDVP: movable damped wave algorithm |
| BM: biomass | MHP: micro-hydro power |
| CEQ: carbon emission quantity | MOGA: multi-objective genetic algorithm |
| COE: cost of the energy | NPC: Net present cost |
| DE: differential evolution algorithm | NSGA II: non-dominated sorting genetic algorithm II |
| DG: diesel generator | PHS: pumped-hydro storage |
| DPSP: deficiency of power supply probability | PSO: particle swarm optimization |
| EFF: excess energy fraction | PMBSA: Pareto multi-objective backtrack search algorithm |
| FF: firefly algorithm | SOA: seagull optimization algorithm |
| GA: genetic algorithm | SDG: UN Sustainable Development Goals |
| GUC: capacity of the electricity generating unit | SMA: slime mould algorithm (SMA) |
| GWO: gray wolf algorithm | SPV: solar photovoltaic system |
| HHO: Harris hawks optimization | QRUN: quantum Runge–Kutta |
| HOMER: Hybrid Optimization of Multiple Energy Resources | TC: total cost |
| HS: harmony search | TMY: Typical Meteorological Year |
| HRES: hybrid renewable energy systems | W: wind |
| WOA: whale optimization algorithm | |
| List of Symbols | |
| AFS: annual full solar hours | : hourly energy produced by a hybrid system [kWh] |
| B: amount of biogas [m3/day] | : livestock mass [kg] |
| battery nominal capacity [Ah] | : minimum energy content on biogas [kWh/m3] |
| : total costs associated with biomass [$] | : project lifetime [year] |
| CI: unit investment costs [$] | : numbers of batteries |
| : total investment cost [$] | : numbers of panels |
| : the annual fuel cost [$] | : numbers of wind turbines |
| : total annual operation and maintenance cost [$/year] | : number of pigs |
| : unit annual operation and maintenance costs [$/year] | : numbers of inverters |
| : unit replacement cost [$] | : monthly energy generated from biomass [kWh] |
| : depth of discharge of the batteries [%] | : average weight of pig [kg] |
| : amount of swine manure [ton/year] | : panel unit power [W] |
| : biogas annual energy [kWh/year] | : wind turbine unit power [W] |
| : annual energy production [kWh/year] | : interest rate |
| : unit annual energy of wind turbine [kWh/year] | volatile solids [ton/year] |
| : energy fraction covered by panels | : average animal units |
| GUC: capacity bigas generating unit [kW] | : batteries operating voltage [V] |
| : hourly irradiance [kW/m2] | η: panel efficiency |
| : monthly energy deficit in month [kWh] |
References
- UN. The Sustainable Development Goals Report 2022. Available online: https://unstats.un.org/sdgs/report/2022 (accessed on 13 July 2023).
- UN. End Poverty in All Its Forms Everywhere. Available online: https://unstats.un.org/sdgs/report/2022/Goal-01/ (accessed on 15 July 2023).
- UN. Ensure Access to Affordable, Reliable, Sustainable and Modern Energy for All. Available online: https://unstats.un.org/sdgs/report/2022/Goal-07/ (accessed on 15 July 2023).
- Natividad, L.E.; Benalcazar, P. Hybrid Renewable Energy Systems for Sustainable Rural Development: Perspectives and Challenges in Energy Systems Modeling. Energies 2023, 16, 1328. [Google Scholar] [CrossRef]
- He, J.; Wu, Y.; Wu, J.; Li, S.; Liu, F.; Zhou, J.; Liao, M. Towards cleaner heating production in rural areas: Identifying optimal regional renewable systems with a case in Ningxia, China. Sustain. Cities Soc. 2021, 75, 103288. [Google Scholar] [CrossRef]
- Villavicencio Calzadilla, P.; Mauger, R. The UN’s new sustainable development agenda and renewable energy: The challenge to reach SDG7 while achieving energy justice. J. Energy Nat. Resour. Law 2018, 36, 233–254. [Google Scholar] [CrossRef]
- Kumar, N.M.; Chopra, S.S.; Chand, A.A.; Elavarasan, R.M.; Shafiullah, G. Hybrid Renewable Energy Microgrid for a Residential Community: A Techno-Economic and Environmental Perspective in the Context of the SDG7. Sustainability 2020, 12, 3944. [Google Scholar] [CrossRef]
- Frilingou, N.; Xexakis, G.; Koasidis, K.; Nikas, A.; Campagnolo, L.; Delpiazzo, E.; Chiodi, A.; Gargiulo, M.; McWilliams, B.; Koutsellis, T.; et al. Navigating through an energy crisis: Challenges and progress towards electricity decarbonisation, reliability, and affordability in Italy. Energy Res. Soc. Sci. 2023, 96, 102934. [Google Scholar] [CrossRef]
- Gul, E.; Baldinelli, G.; Bartocci, P.; Shamim, T.; Domenighini, P.; Cotana, F.; Wang, J.; Fantozzi, F.; Bianchi, F. Transition toward net zero emissions—Integration and optimization of renewable energy sources: Solar, hydro, and biomass with the local grid station in central Italy. Renew. Energy 2023, 207, 672–686. [Google Scholar] [CrossRef]
- Mahdavi, M.; Jurado, F.; Ramos, R.A.V.; Awaafo, A. Hybrid biomass, solar and wind electricity generation in rural areas of Fez-Meknes region in Morocco considering water consumption of animals and anaerobic digester. Appl. Energy 2023, 343, 121253. [Google Scholar] [CrossRef]
- Guzman, L.; Henao, A. Are the current incentives sufficient to drive the use of solar PV in the Colombian residential sector?—An analysis from the perspective of the game theory. Energy Strat. Rev. 2022, 40, 100816. [Google Scholar] [CrossRef]
- Amini, S.; Bahramara, S.; Golpîra, H.; Francois, B.; Soares, J. Techno-Economic Analysis of Renewable-Energy-Based Micro-Grids Considering Incentive Policies. Energies 2022, 15, 8285. [Google Scholar] [CrossRef]
- Trinh, V.; Chung, C. Renewable energy for SDG-7 and sustainable electrical production, integration, industrial application, and globalization: Review. Clean. Eng. Technol. 2023, 15, 100657. [Google Scholar] [CrossRef]
- Kamal, M.; Ashraf, I.; Fernandez, E. Optimal sizing of standalone rural microgrid for sustainable electrification with renewable energy resources. Sustain. Cities Soc. 2023, 88, 104298. [Google Scholar] [CrossRef]
- Prakash, S.V.J.; Dhal, P. Cost optimization and optimal sizing of standalone biomass/diesel generator/wind turbine/solar microgrid system. AIMS Energy 2022, 10, 665–694. [Google Scholar] [CrossRef]
- Jahangir, M.H.; Bazdar, E.; Kargarzadeh, A. Techno-economic and environmental assessment of low carbon hybrid renewable electric systems for urban energy planning: Tehran-Iran. City Environ. Interact. 2022, 16, 100085. [Google Scholar] [CrossRef]
- Kharrich, M.; Kamel, S.; Abdel-Akher, M.; Eid, A.; Zawbaa, H.M.; Kim, J. Optimization based on movable damped wave algorithm for design of photovoltaic/ wind/ diesel/ biomass/ battery hybrid energy systems. Energy Rep. 2022, 8, 11478–11491. [Google Scholar] [CrossRef]
- Heydaria, A.; Alborzib, Z.S.; Amini, Y.; Hassanvand, A. Configuration optimization of a renewable hybrid system including biogas generator, photovoltaic panel and wind turbine: Particle swarm optimization and genetic algorithms. Int. J. Mod. Phys. C 2022, 34, 3500699. [Google Scholar] [CrossRef]
- Mahmoud, F.S.; Diab, A.A.Z.; Ali, Z.M.; El-Sayed, A.-H.M.; Alquthami, T.; Ahmed, M.; Ramadan, H.A. Optimal sizing of smart hybrid renewable energy system using different optimization algorithms. Energy Rep. 2022, 8, 4935–4956. [Google Scholar] [CrossRef]
- El-Sattar, H.A.; Kamel, S.; Hassan, M.H.; Jurado, F. Optimal sizing of an off-grid hybrid photovoltaic/biomass gasifier/battery system using a quantum model of Runge Kutta algorithm. Energy Convers. Manag. 2022, 258, 115539. [Google Scholar] [CrossRef]
- El-Sattar, H.A.; Sultan, H.M.; Kamel, S.; Khurshaid, T.; Rahmann, C. Optimal design of stand-alone hybrid PV/wind/biomass/battery energy storage system in Abu-Monqar, Egypt. J. Energy Storage 2021, 44, 103336. [Google Scholar] [CrossRef]
- Gamil, M.M.; Lotfy, M.E.; Hemeida, A.M.; Mandal, P.; Takahashi, H.; Senjyu, T.; Co, L.F.E. Optimal sizing of a residential microgrid in Egypt under deterministic and stochastic conditions with PV/WG/Biomass Energy integration. AIMS Energy 2021, 9, 483–515. [Google Scholar] [CrossRef]
- Patibandla, A.; Kollu, R.; Rayapudi, S.R.; Manyala, R.R. A multi-objective approach for the optimal design of a standalone hybrid renewable energy system. Int. J. Energy Res. 2021, 45, 18121–18148. [Google Scholar] [CrossRef]
- Alturki, F.A.; Awwad, E.M. Sizing and Cost Minimization of Standalone Hybrid WT/PV/Biomass/Pump-Hydro Storage-Based Energy Systems. Energies 2021, 14, 489. [Google Scholar] [CrossRef]
- Suman, G.K.; Guerrero, J.M.; Roy, O.P. Optimisation of solar/wind/bio-generator/diesel/battery based microgrids for rural areas: A PSO-GWO approach. Sustain. Cities Soc. 2021, 67, 102723. [Google Scholar] [CrossRef]
- Jahangir, M.H.; Cheraghi, R. Economic and environmental assessment of solar-wind-biomass hybrid renewable energy system supplying rural settlement load. Sustain. Energy Technol. Assess. 2020, 42, 100895. [Google Scholar] [CrossRef]
- Li, J.; Liu, P.; Li, Z. Optimal design and techno-economic analysis of a solar-wind-biomass off-grid hybrid power system for remote rural electrification: A case study of west China. Energy 2020, 208, 118387. [Google Scholar] [CrossRef]
- Murugaperumal, K.; Srinivasn, S.; Prasad, G.S. Optimum design of hybrid renewable energy system through load forecasting and different operating strategies for rural electrification. Sustain. Energy Technol. Assess. 2019, 37, 100613. [Google Scholar] [CrossRef]
- Alshammari, N.; Asumadu, J. Optimum unit sizing of hybrid renewable energy system utilizing harmony search, Jaya and particle swarm optimization algorithms. Sustain. Cities Soc. 2020, 60, 102255. [Google Scholar] [CrossRef]
- Rehmani, A.M.; Akhter, P. Techno-Economic analysis of hybrid renewable energy systems for rural area energization in Pakistan. In Proceedings of the 2019 3rd International Conference on Energy Conservation and Efficiency (ICECE), Lahore, Pakistan, 23–24 October 2019. [Google Scholar]
- Ahmad, J.; Imran, M.; Khalid, A.; Iqbal, W.; Ashraf, S.R.; Adnan, M.; Ali, S.F.; Khokhar, K.S. Techno economic analysis of a wind-photovoltaic-biomass hybrid renewable energy system for rural electrification: A case study of Kallar Kahar. Energy 2018, 148, 208–234. [Google Scholar] [CrossRef]
- Ali, S.H.; Zuberi, M.J.S.; Tariq, M.A.; Baker, D.; Mohiuddin, A. A study to incorporate renewable energy technologies into the power portfolio of Karachi, Pakistan. Renew. Sustain. Energy Rev. 2015, 47, 14–22. [Google Scholar] [CrossRef]
- Lian, J.; Zhang, Y.; Ma, C.; Yang, Y.; Chaima, E. A review on recent sizing methodologies of hybrid renewable energy systems. Energy Convers. Manag. 2019, 199, 112027. [Google Scholar] [CrossRef]
- Bhatti, H.J.; Danilovic, M. Making the world more sustainable: Enabling localized energy generation and distribution on decentralized smart grid systems. World J. Eng. Technol. 2018, 06, 350–382. [Google Scholar] [CrossRef]
- Kalra, M.; Tyagi, S.; Kumar, V.; Kaur, M.; Mashwani, W.K.; Shah, H.; Shah, K. A Comprehensive Review on Scatter Search: Techniques, Applications, and Challenges. Math. Probl. Eng. 2021, 2021, 5588486. [Google Scholar] [CrossRef]
- Wickham, H.; Bryan, J. readxl: Read Excel Files—R Package Version 1.4.0. 2022. Available online: https://CRAN.R-project.org/package=readxl (accessed on 29 August 2023).
- Wickham, H.; Francois, R.; Henry, L.; Müller, K. dplyr: A Grammar of Data—Manipulation. R Package Version 1.0.8. 2022. Available online: https://CRAN.R-project.org/package=dplyr (accessed on 29 August 2023).
- Gross, J.; Ligges, U. nortest: Tests for Normality. R Package Version 1.0-4. 2015. Available online: https://CRAN.R-project.org/package=nortest (accessed on 29 August 2023).
- Schauberger, P.; Walker, A. openxlsx: Read, Write and Edit xlsx Files. R Package Version 4.2.5.2. 2023. Available online: https://CRAN.R-project.org/package=openxlsx (accessed on 29 August 2023).
- Wickham, H. ggplot2: Elegant Graphics for Data Analysis; Springer: New York, NY, USA, 2016. [Google Scholar]
- Pinedo, R.D.Y.; Pérez, A.A.H.; Ocampo, M.C.E.; Ahumada, D.E.M.; González, V.P.Q. ANÁLISIS DEL PERFIL DE CARGA ELÉCTRICA POR ESTRATO EN LA CIUDAD DE BARRANQUILLA. 2018. Available online: http://hdl.handle.net/10584/8312 (accessed on 29 August 2023).
- Acuña, L.G.; Padilla, R.V.; Mercado, A.S. Measuring reliability of hybrid photovoltaic-wind energy systems: A new indicator. Renew. Energy 2017, 106, 68–77. [Google Scholar] [CrossRef]
- World Bank. State of Electricity Access Report (SEAR) 2017. Available online: https://www.worldbank.org/en/topic/energy/publication/sear (accessed on 16 August 2023).
- Martinot, E.; Chaurey, A.; Lew, D.; Moreira, J.R.; Wamukonya, N. Renewable energy markets in developing countries. Annu. Rev. Energy Environ. 2002, 27, 309–348. [Google Scholar] [CrossRef]
Disclaimer/Publisher’s Note: The statements, opinions and data contained in all publications are solely those of the individual author(s) and contributor(s) and not of MDPI and/or the editor(s). MDPI and/or the editor(s) disclaim responsibility for any injury to people or property resulting from any ideas, methods, instructions or products referred to in the content. |
© 2024 by the authors. Licensee MDPI, Basel, Switzerland. This article is an open access article distributed under the terms and conditions of the Creative Commons Attribution (CC BY) license (https://creativecommons.org/licenses/by/4.0/).