Article

The Novel Approach of Using Electric Vehicles as a Resource to Mitigate the Negative Effects of Power Rationing on Non-Residential Buildings

by
Krzysztof Zagrajek
*,
Mariusz Kłos
,
Desire D. Rasolomampionona
,
Mirosław Lewandowski
and
Karol Pawlak
Institute of Electrical Power Engineering, Warsaw University of Technology, 75 Koszykowa Str., 00-662 Warsaw, Poland
*
Author to whom correspondence should be addressed.
Energies 2024, 17(1), 18; https://doi.org/10.3390/en17010018
Submission received: 27 November 2023 / Revised: 12 December 2023 / Accepted: 18 December 2023 / Published: 19 December 2023
(This article belongs to the Special Issue New Trends in Energy Storage Systems for HEVs and EVs)

Abstract

:
This paper presents the concept of using electric vehicles (EVs) as a countermeasure to deal with the negative effects of power rationing when electricity demands become difficult to meet due to unfavorable electrical system operating conditions. At present, an energy storage is widely used to maintain the stability of electricity supply in facilities whose main source of energy is renewable energy sources (RESs). However, we must not forget that electric vehicles are also electricity storage facilities, but they are not always available due to their mobility. With properly developed strategies, they can be used in electricity management processes, for example, by reducing their consumption during charging using smart charging technology, or by providing electricity from their batteries using vehicle-to-building (V2B) technology. Thus, this article presents a research methodology that treats electric vehicles as a remedy for eliminating power constraints. It consists of five main steps, including two algorithms for deciding how to deploy EVs during power rationing periods. An efficiency factor for eliminating these constraints was also introduced. The results showed that the use of smart charging or V2B technology in EVs can reduce the number of potential hours in which certain power levels are exceeded by up to several tens of percent. This means that in the future, with the significant development of electromobility, such a way of dealing with power constraints could be an alternative to conventional solutions like diesel generators.

1. Introduction

Currently, developed countries, especially European ones, are facing an energy crisis. There are many reasons for this phenomenon. According to the authors of [1], it began in 2021, when economies were experiencing a renaissance after the first lockdowns of the COVID-19 pandemic [2]. This has resulted in a significant increase in prices in electricity markets, as well as in natural gas markets [3,4,5,6]. Countries such as Germany, Austria, Finland, Greece, Poland, and Italy were particularly affected by this situation [4]. This has led to the introduction of legislative procedures to save electrical energy and natural gas for both public entities and households [7]. In most cases, this reduction in energy consumption has a significant impact on the standards of living of the people concerned [8]. The energy consumption issues mentioned above, however, provide a broader picture of the ongoing energy transition. For many years, EU policies have been oriented towards moving away from fossil fuels and imposing increasingly ambitious carbon dioxide (CO2) reduction targets [9,10]. It should be noted that countries such as Germany, Italy, Poland, and the UK [11,12,13,14,15] face a gradual process of phasing out coal- and lignite-fired power plants, and, in the case of Germany, the problem also involves the abandonment of the nuclear power plant program for political reasons [13]. In addition, it should be mentioned that the process of phasing out fossil fuel power plants is associated with a significant increase in capacity from renewable energy sources (RESs) [16]. Unfortunately, these are mostly intermittent sources, which, as a rule, do not enhance the energy security of countries [14,17]. This can have negative consequences in assessing the adequacy of electrical systems [18]. One of the solutions to this problem is the development of electromobility in the energy transition process [19,20]. This latter area has recently become the subject of greater attention. The promotion of electric vehicles (EVs) poses a huge challenge for the transport sector, especially in the process of optimizing travel routes [21,22,23], but also for the energy sector [24,25,26,27]. Unfortunately, it has often been forgotten that the proper development of electromobility must go alongside the simultaneous development of the energy sector [24]. It is necessary to keep in mind the problems of connecting EV charging points [28,29], optimizing charging costs, both from the side of the EV user and the managers of non-residential facilities [30,31], but also optimizing EV charging hours to maximize the use of own low-carbon generation sources [32,33]. The design of EV charging stations, consisting of multiple EV charging points and PV installations, often integrated with battery electric storage systems (BESSs), has become an extremely popular part of research [34]. These are known as “solar carports” [35,36]. Their application can be numerous. They can be established at workplaces, in city parking lots, or in the driveways of single-family homes [36,37]. In addition, through the use of technologies, such as smart charging (SC) or vehicle-to-building (V2B) technologies, the electricity transferred to or from a vehicle can be managed in an economically and technically optimal manner [38,39,40].
As electromobility grows, so does the demand for power and electricity in the national power systems. It should be mentioned at this point that the process of transitioning to a low-carbon energy sector requires, for many countries, the phasing out of conventional power plants. In addition, the increase in RES power generation, without the corresponding development of electricity storage technologies, causes increasing instability in electricity production [41,42]. The aforementioned situation may negatively affect the adequacy of the power system. Thus, the main challenge for transmission system operators (TSOs) is to maintain the capacity in operation in the system at an appropriate level, so as to provide an adequate operating reserve to cover sudden load changes or as a countermeasure in case of failure to generate units [43]. In Poland, for example, this represents 9% of the current power demand [44]. There is an indicator used in power system reliability theory describing the frequency of situations in which the reserve level may not be covered that is called the LOLE (loss of load expectation) [43]. The security standard of electric power systems can also be expressed using this indicator [18]. According to the authors of [18], the most common LOLE value defining the considered standard is 3 h in EU countries. This value is in force in countries such as Poland, Italy, Greece, and Belgium [18,45]. As mentioned, the LOLE parameter is closely related to the adequacy of power systems. A study prepared by the ENSTO-E, the European association for the cooperation of transmission system operators, highlighted that the safety standards for the operation of electricity networks are outdated [46]. These problems are most often associated with the withdrawal of financial support for fossil fuel power plants under capacity mechanisms. According to the authors of [46], practically all of continental Europe will experience overruns of security standards for system operation as early as 2025 if capacity mechanisms are withdrawn. However, it should be noted that according to Regulation 2019/943 of the European Parliament and of the council of 5 June 2019 on the internal market for electricity, from 2025, it will not be possible to provide state aid to generation units with unit CO2 emissions greater than 550 kg CO2/MWh [47]. Thus, the probability of exceeding safety standards is highly likely. The LOLE values reported for EU countries are in the range of 1 h/year to even several hundred h/year [46]. It is also worth noting that member countries also perform electricity system adequacy analyses on their own. 
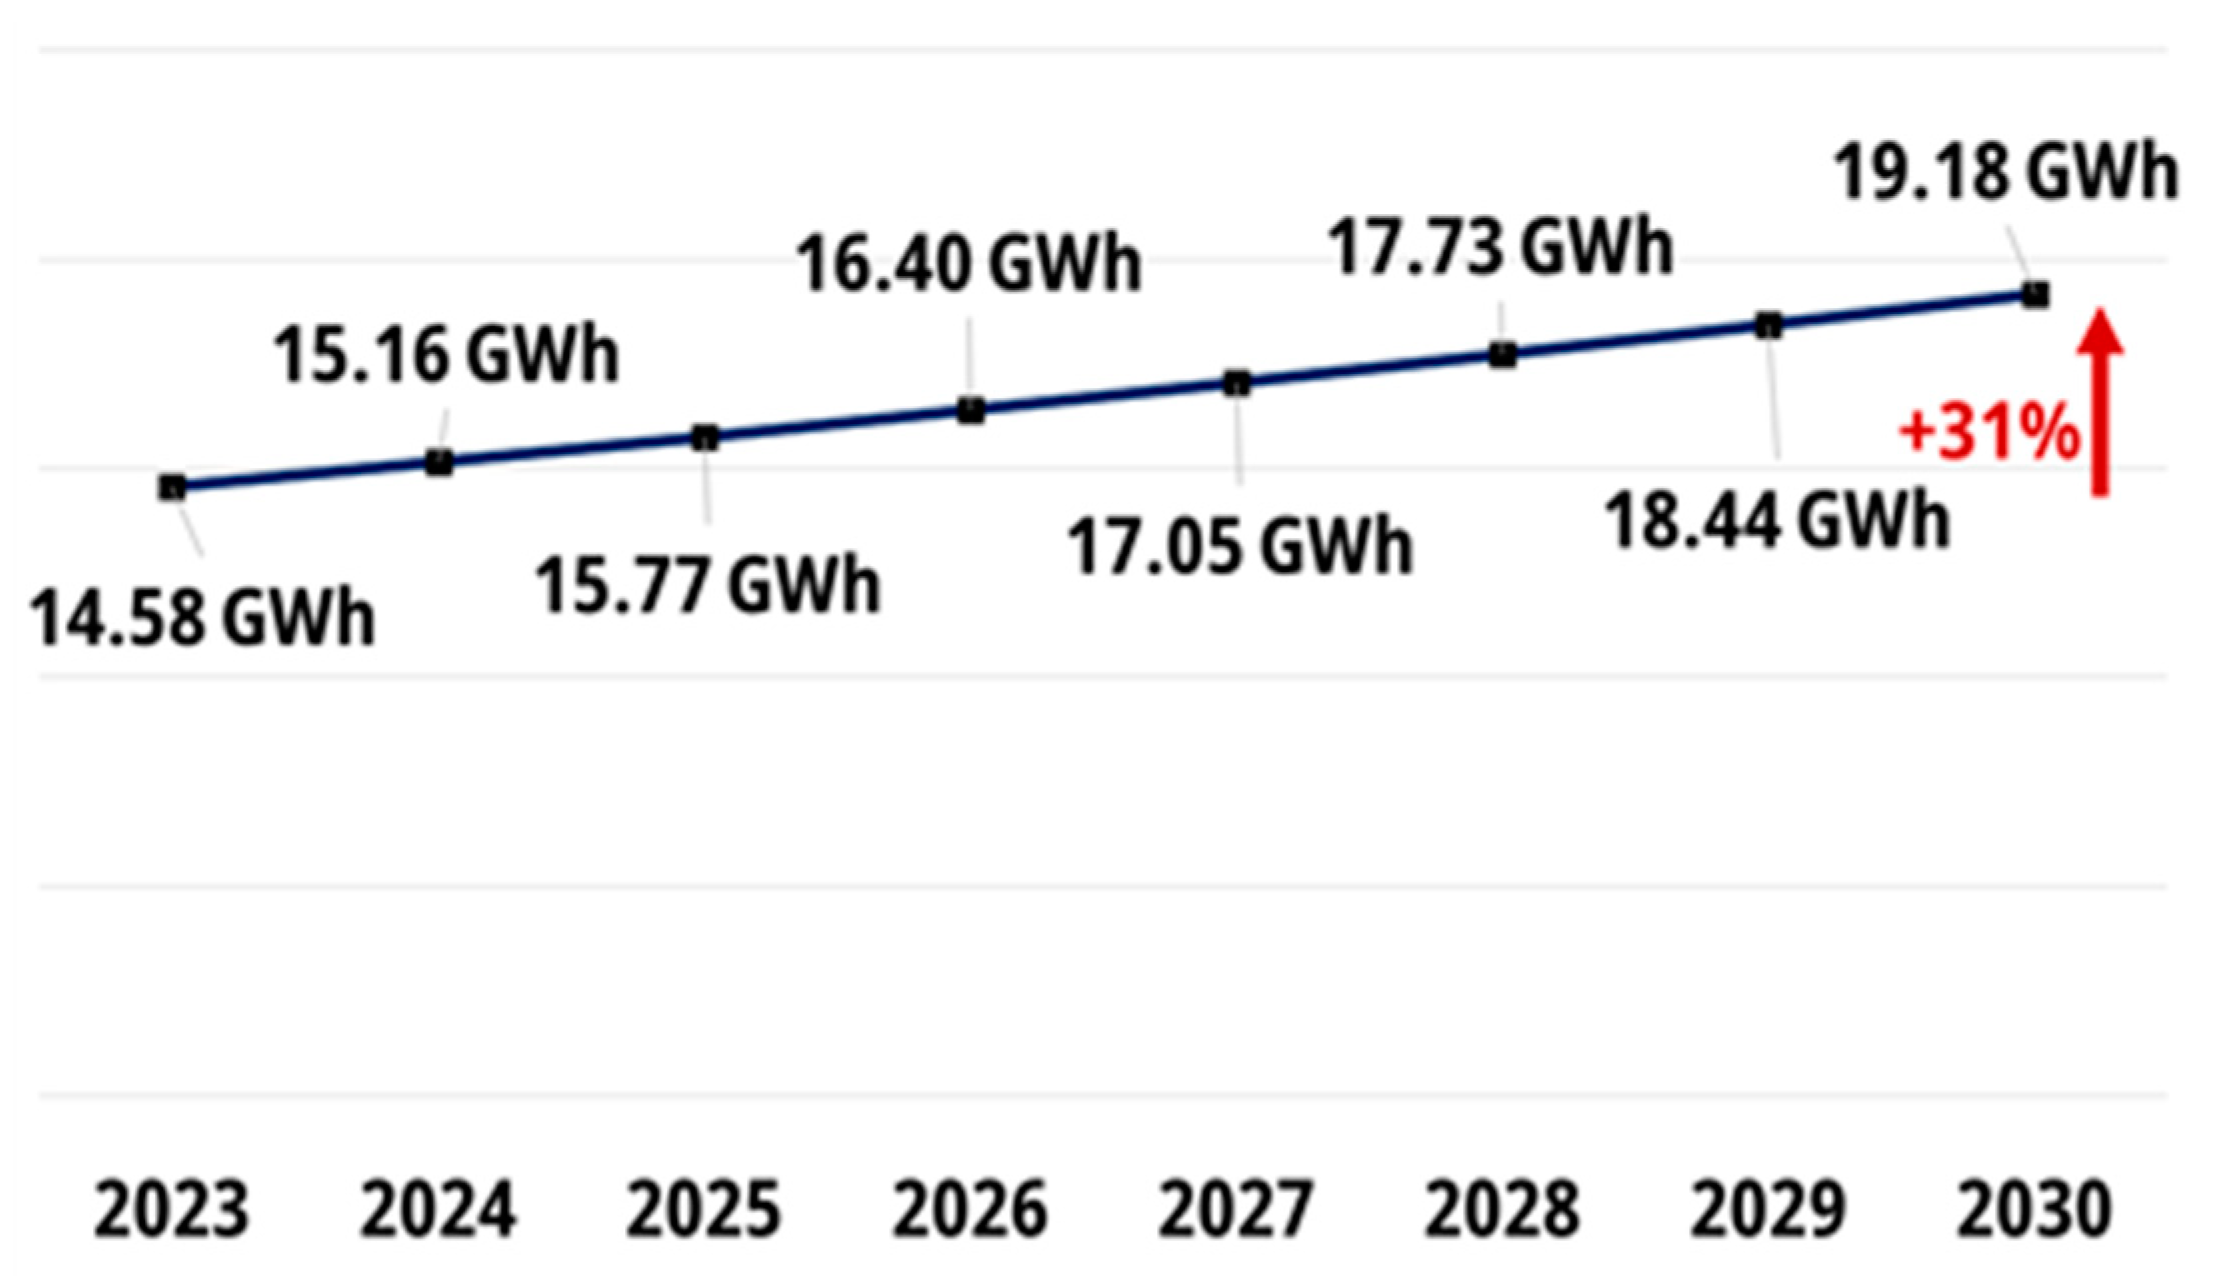
Figure 1 shows the projected values of the LOLE indicator for Poland, according to the data provided by the Polish transmission system operator.
The LOLE curve presented in Figure 1 leads us to the conclusion that there will be a significant increase in this indicator between 2023 and 2030. This means that, according to the forecasts of the Polish TSO, this indicator will be exceeded as early as 2024. This means that a certain category of energy consumers will have to start rationing energy, that is, limiting their consumption during a period of restriction imposed by the transmission operator [49]. Public administration units, but also universities, may be particularly vulnerable to such actions [50]. If this kind of situation would happen to an entity such as a university, whose main activity is research and teaching, in the worst case, it could lead to a reduction in this activity in a drastic way or even a suspension of all essential activities [51]. If we consider that a suspension of teaching activity would only lead to a certain delay in the completion of the program, a delay in the field of scientific research could be the source of enormous financial losses due to fixed deadlines for carrying out research programs financed by the government or private entities. It is therefore necessary to think about the effective future use of EVs in the electricity management process on university campuses because, while being a volatile means of storing electrical energy, they can also represent a significant reserve of electrical energy. Therefore, universities, particularly technical ones, thanks to their human resources, will be the ideal place to promote electromobility and the potential use of EVs as mobile energy storage units. Thus, this article presents the possibilities of using EVs in electricity management activities during power rationing periods. Section 2 provides an overview of EV application solutions in microgrids and presents novelties. Section 3 presents the research methodology for the use of EVs in the energy management process during power rationing periods. 
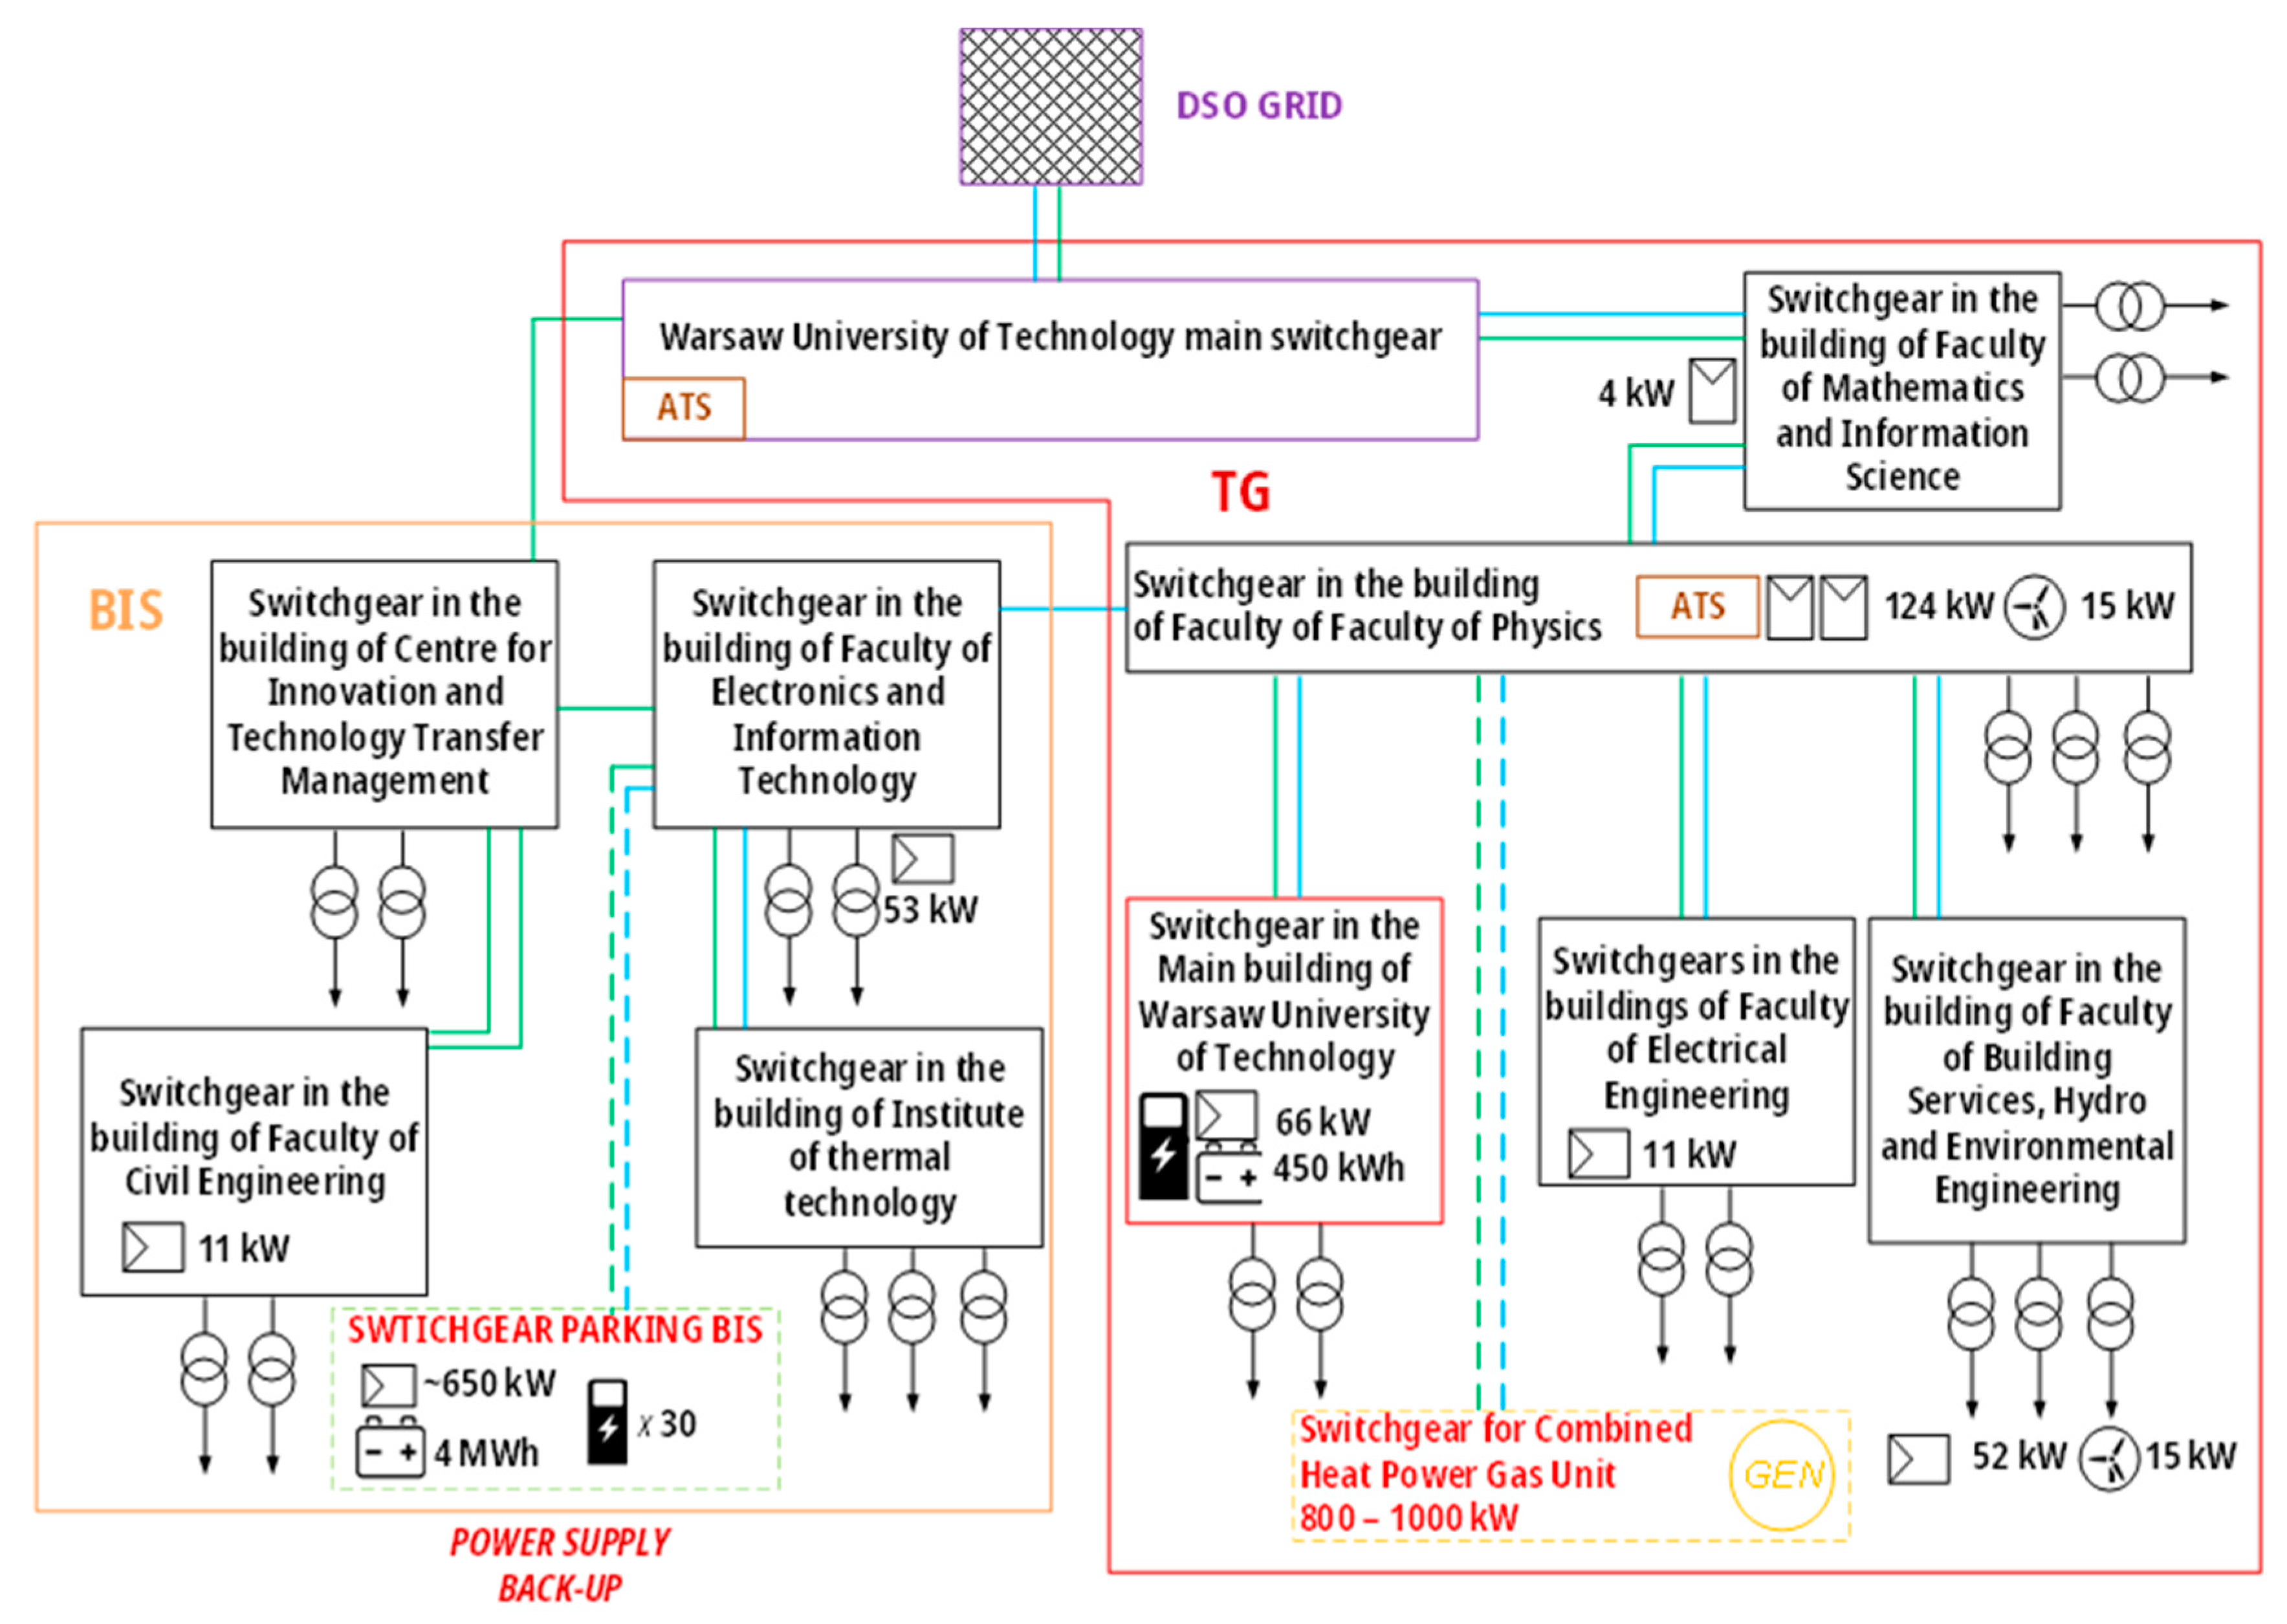
Section 4 presents the assumptions for the case study using the main campus of Warsaw University of Technology, and Section 5 presents the results of the analyses and further discussion.

2. Integration of EVs with Microgrids and Smart Buildings

2.1. State of the Art

Aspects related to the integration of electric vehicles with buildings, for both normal and emergency periods, have often been discussed in the literature. First and foremost, one of the primary concerns is the optimization of EV charging for non-residential buildings [52]. In the study published by the authors of [53], a model was developed that optimized the facility manager’s decisions on the number of charging points and their power, as well as their operation due to economic criteria (energy prices). The articles published by the authors of [32,54,55] present EV charging strategies that take into account the operation of internal energy sources (mainly RESs) and charging costs in office buildings. The paper published by the authors of [55] used a model based on the Monte Carlo method to analyze EV charging profiles, which is particularly important for modeling uncertainties arising from vehicle charging. The literature has also described the aforementioned cases, but for situations where EV charging occurs in so-called carports [56,57]. In these cases, the coordination of EV charging with the operation of PV installations was analyzed. Articles on carports have stated that despite the advantages of reducing emissions and increasing the auto-consumption rate, such installations must remain cost-effective [34,58]. In this research field, the possibility of a RES hybrid system that powered a 3.6 kW charging station was also explored [59]. Another aspect that has been analyzed in the literature was to describe the effective use of EVs in the process of energy management in buildings. This can be carried out through the use of smart charging (SC) technologies [60]. This is a technology that allows for the EV charging load to be adjusted according to the current demand profile and market conditions, so that by using one of the criteria (technical or economic), the process is optimal [61,62]. The paper published by the authors of [63] describes a number of mathematical and programming methods that can be used in modeling smart EV charging. The second technology described in the literature that deals with the efficient use of EVs in the process of energy integration with buildings is vehicle-to-building (V2B) technology. It involves returning electricity from EVs to buildings, most often offices or other commercial buildings [64,65]. The main assumption for using V2B technology is the need to not only reduce electricity consumption but also to reduce power [40]. The publication published by the authors of [66] presents discharge/charge control algorithms to obtain the effect of reducing the power consumed by the building using stochastic computational methods. The publication published by the authors of [67] presents the possibility of using a school bus as an emergency power source for a school. The paper constructed by the authors of [68] employed mixed-integer linear programming (MILP) to manage energy in a building energy management microgrid. It is also worth mentioning that the authors of [68] addressed an important topic related to EV energy yielding—the randomness of the battery parameters of mobile energy storage. The articles published by the authors of [57,69] also addressed these aspects by analyzing a vehicle’s ability to arrive at the point of the V2X/V2B service. Aspects of V2B technology that have been discussed in the literature also address the set of expectations of EV users and building owners [70]. The problems of creating local microgrids using EVs and buildings have also been described [34,39,71]. Additionally, the literature has addressed the problems associated with establishing such microgrids that also operate in islanded mode [37,59,72]. The papers published by the authors of [71,73] present a unique building-to-vehicle-to-building concept, where an electric vehicle is a type of “energy bridge” between two buildings, forming a microgrid. It also discussed the possible savings in energy use by using electric vehicles as a form of mobile energy storage [38]. It should be emphasized that V2B technology has also been reflected in real-life applications, not just theoretical considerations. An analysis of the use of V2B technology in real-world applications should be started with a demonstration project at the Lincoln Lab to test the provision of electric vehicle power for microgrids for the US Department of Defense [74]. Peak-shaving and frequency control solutions were tested. The second project from the US was the one launched by the Massachusetts Department of Energy Resources to use a school bus for power backup in four school districts [75]. However, this project required further testing due to the fact that electric school buses are still an emerging technology. An interesting European solution was the use of V2B technology at the Johan Cruijff Arena in Amsterdam [76]. By using EV discharge technology, the aforementioned stadium gained the possibility of an additional power source, and guests who visit the stadium can generate revenues from the provision of V2B services. Another example of the use of V2G/V2B technology is the M-tech Labo project, which was organized in 2010 by Mitsubishi Electric and the Tokyo Institute of Technology [77]. One of the most recent projects in the area of V2G/V2B technology was an activity that was organized by ABB in Trondheim, Norway [78]. However, it is important to remember that V2B technology is still in the commercial development phase, mainly due to limitations arising from the availability of charging infrastructure (lack of bi-directional charging points), the relatively small number of vehicles compatible with bi-directional energy transfer, and the lack of legislation allowing for easy energy transfer between the vehicle and the grid [79].

2.2. Novelty

Due to the rapid growth in popularity of electric vehicles, it is important to keep in mind that more and more of them will appear in non-residential building locations, i.e., workplaces or university campuses. These vehicles are likely to be charged throughout the user’s presence at the destination [38]. Therefore, it is important to consider how to use them effectively in the process of managing electricity at these facilities. It is worth noting that, from an electricity perspective, electric vehicles are nothing more than mobile energy storage [64]. Considering that selected models of electric vehicles have the function of bi-directional energy transfer, it is possible to take into account their use as an additional source of electricity. The studies published by the authors of [80,81,82] examined the possibility of using electric vehicles as one of the resources for reducing power demand, most often providing peak-shaving services in single-family homes. This type of EV-to-building power transmission service is often described as vehicle to home (V2H), but in principle, it converges with V2B technology. The articles published by the authors of [55,65,83] focused on electricity management in large commercial buildings. However, all of these papers describe the normal operating conditions of electric power systems, i.e., when an EV is used to provide services to power system operators in the form of maintaining power quality parameters or performing demand side management (DSM) services. The use of EVs in commercial buildings integrated with photovoltaic (PV) installations has been modeled under similar operating conditions in [68,84]. It is worth noting that the publication published by the authors of [85] used a facility of the University of Deusto in Spain as the base site for its analysis of the feasibility of V2B technology, but it focused on the potential benefits of having a large parking lot, ergo a relatively large peak-shaving potential. Their analysis, however, was, as in the previous literature items discussed, concerned with the normal operating states of the electric power system. Moreover, electric vehicles do not need to have V2B functionality to actively participate in the balancing process of the end user’s installation. It is usually sufficient that their charging is controlled in such a way so that it is economically or technically optimal. In particular, the latter criterion may be of interest in situations where there are restrictions on consumers’ electricity consumption—so-called power supply tiers. However, the literature has most often discussed the use of electric vehicles in the process of efficient energy management during the normal operation of the power system, mainly using smart charging when the appropriate economic impulse has been received [31,39,86]. However, these authors decided to fill the knowledge gap by considering both smart charging technology and bi-directional power transfer from the vehicle to the building (V2B technology) to reduce the negative effects of the possibility of power rationing periods, i.e., when the power system is operating under certain constraints that were set by the power system operators. Efficiency factors were analyzed in detail in order to eliminate the constraints associated with the energy consumption of electric vehicles when this consumption occurs on a university campus. University campuses are characterized by a large amount of space, which includes, among other things, parking lots for private and company cars, and potential space on rooftops for own energy sources, such as PV installations [85,87]. In the case of technical universities, due to the need for a reliable power supply for laboratories and other services, it can also be assumed that adapting the power supply to modern solutions will be more rapid and easier. Considering these facts, this article aimed to develop a research methodology for managing the appearance of power constraints based on the assumption that a unit has an electric vehicle charging and discharging infrastructure with integrated local power generation sources. The potential for using such a high-reliability electric power service was evaluated, taking into account the scenarios adopted for the development of energy infrastructure on university campuses, as described by the authors of [51]. When no power overruns are identified, electric vehicles are used for economic optimization, maximizing the self-consumption factor, but this aspect will not be described in detail. The main contributions of this article compared to the articles published so far are as follows:
  • Presentation of a concept (idea) in which EVs serve as a countermeasure to reduce the negative effects of power rationing periods;
  • Application of a new method of analyzing the power and energy demands of a non-residential building to assess the usefulness of EVs as a form of mobile energy storage during power rationing periods;
  • Development of a mathematical model and setting up procedures that will allow for the future management of electricity in non-residential buildings using EVs during power rationing periods;
  • Implementation of a new efficiency factor to eliminate power constraints using electric vehicles;
  • Identifying the problem of a potential suspension of the core business of universities during power rationing periods and the necessity to invest in bi-directional EV charging points as part of the development of university campuses by synergizing the development areas of such facilities with sustainability and energy security.

3. Methodology

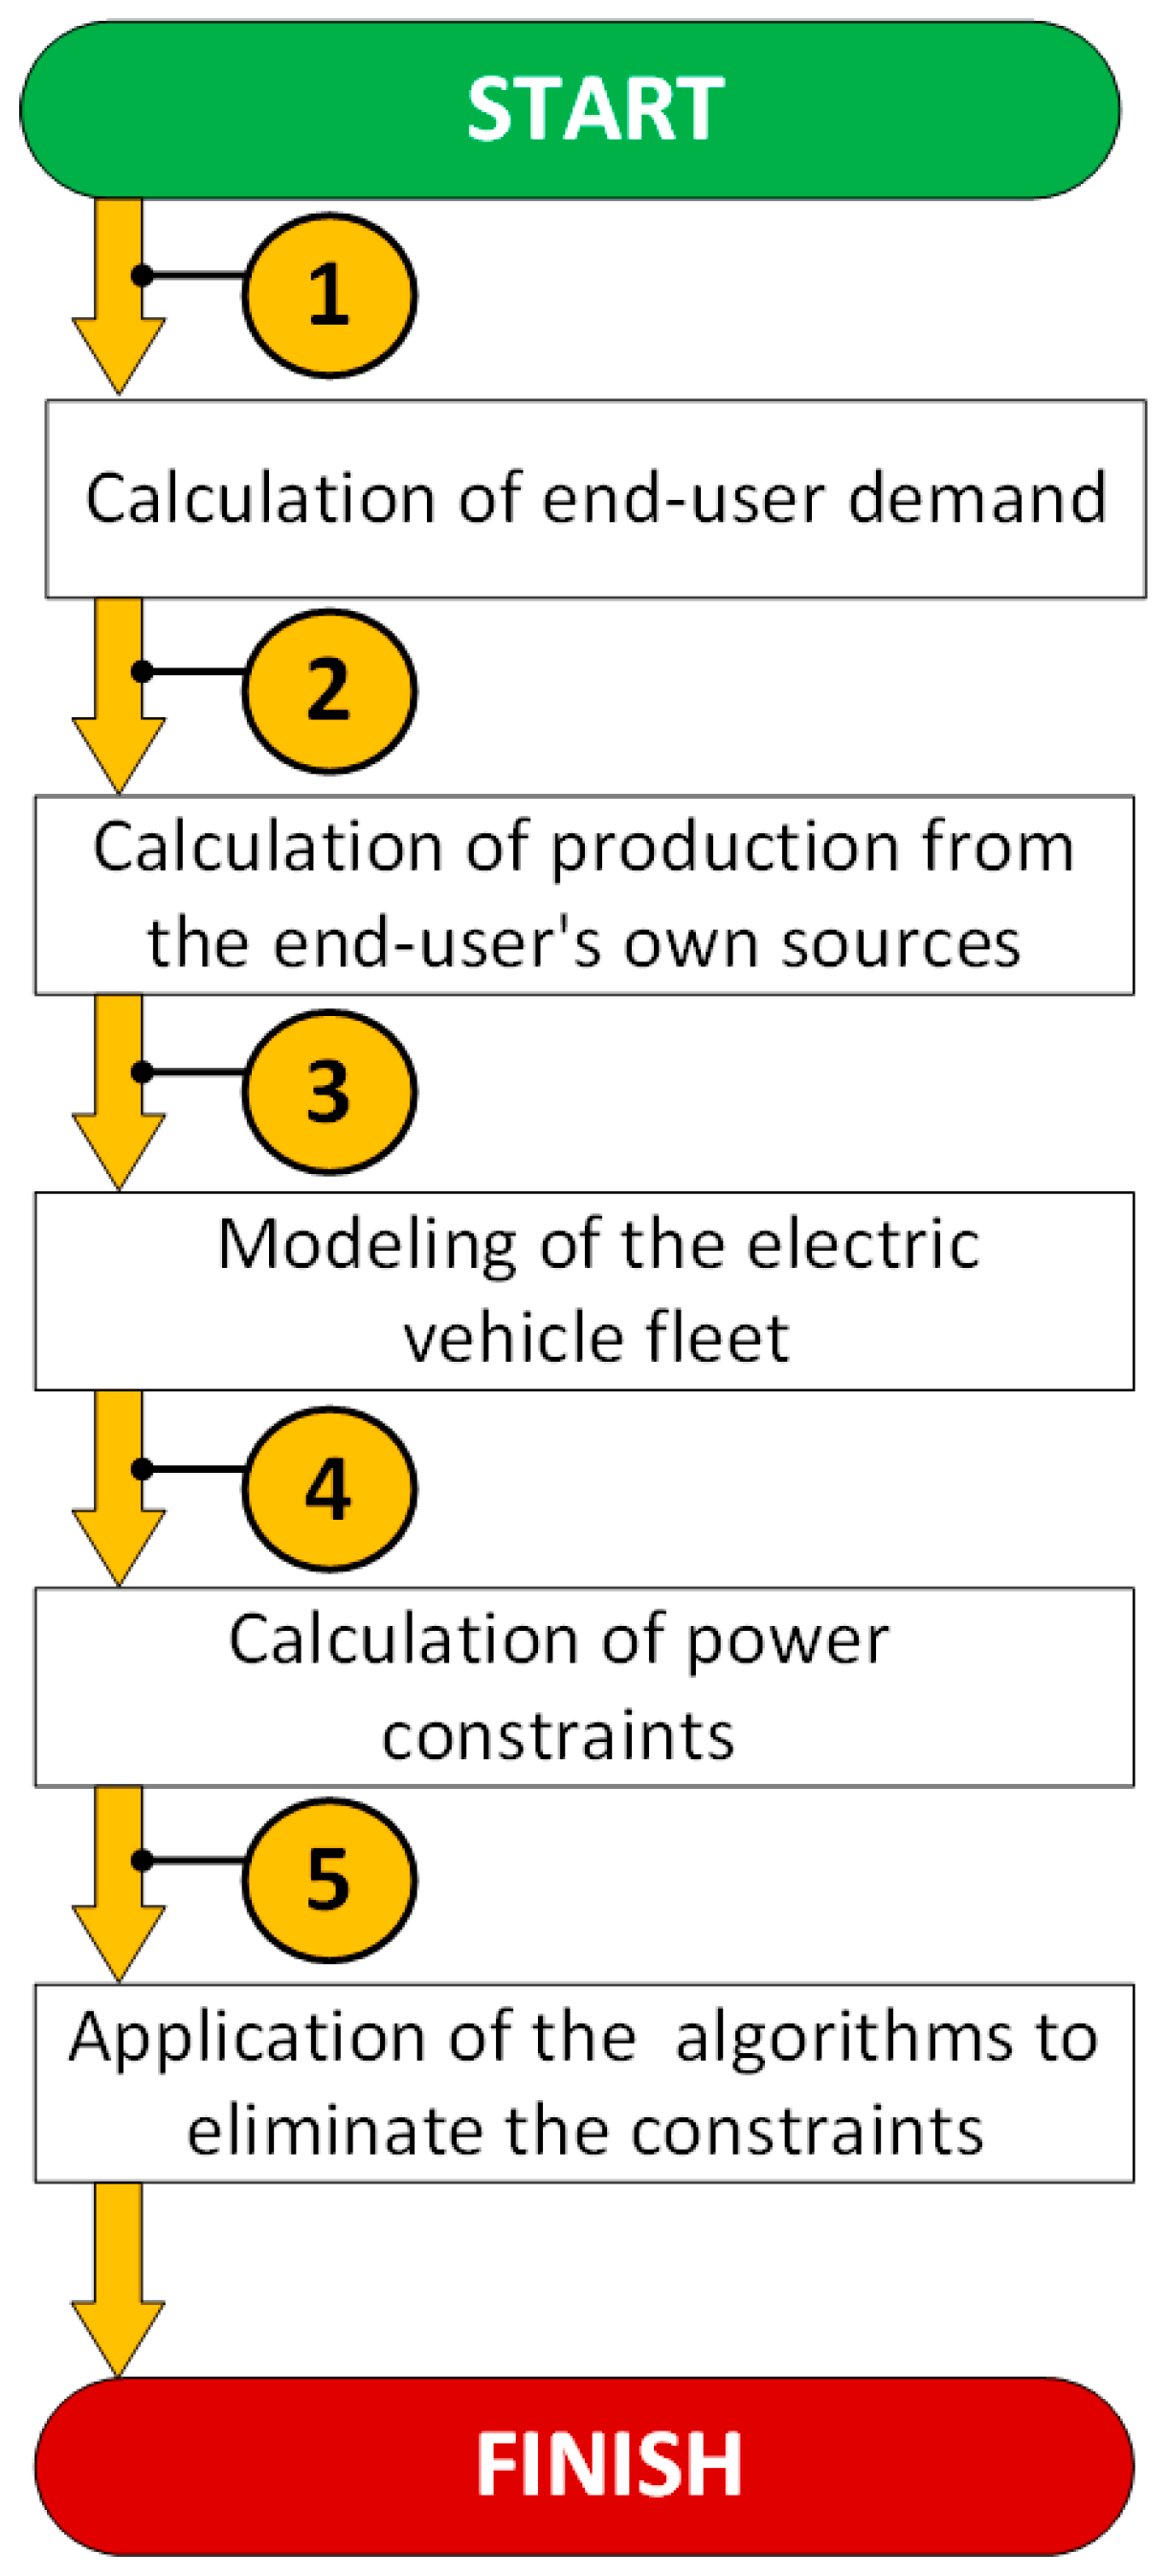
First of all, it should be mentioned that the methodology described in this chapter concerns research that is currently in the proof-of-concept phase. This means that the solution presented below is a mathematical model of an internal service that can be introduced by the owner or possibly the end user of the facility. In general, the methodology presented in this article is applicable to all non-residential buildings, including critical infrastructure. It aims to highlight that electric vehicles with the application of smart charging or V2B technologies can actively participate in the process of balancing the end user’s demand during power rationing periods. This methodology is divided into 5 main parts: calculation of end-user demand, calculation of production from the end user’s own sources, modeling of the electric vehicle fleet, calculation of power constraints, and application of the authors’ algorithms to eliminate the aforementioned constraints. Figure 2 shows a basic block diagram of the proposed methodology.
All analyses related to the introduction of power rationing and their potential mitigation by means of distributed generation resources, including electricity storage, should begin with an assessment of the power and energy demands of the facility under study. Thus, for each hour of the day of the year, it is possible to determine a certain level of power demand over 1 h of the studied facility, P t D E M , and consequently its energy consumption at a given hour (t), E t , y p l D E M , in the year for which we have historical electricity consumption data, ypl. Throughout the article, the following equation should be used when defining electricity (consumed or given away):
E t = P t · 1   h
Since energy security analyses should be performed in the long term (taking into account the duration of the investment process or the electricity management strategy for a given subject), it is necessary to take into account correction factors indicating the trend of an increase or decrease in electricity demand. The research presented in this article is a follow up to the work carried out in [51], so it was assumed that for the target year of investment, yf, the power demand at a given hour, t, can be determined:
P t , y f D E M = ( P t , y p l D E M · k t D E M ) y f y p l
where P t , y f D E M —the power demand of the studied facility at hour t in year yf, expressed in kW, and k t D E M —a correction coefficient indicating the trend towards an increase or decrease in the electricity demand of the studied facility.
By analogy, based on Equation (1), it is possible to calculate the demand for electricity of the studied facility at hour t in year yf E t , y f D E M .
In the paper published by the authors of [51], the k t D E M coefficient was determined for each hour based on historical data from selected years for which the facility manager had energy consumption data for each hour of the day. In the present study, it was decided that the value of this coefficient should be one for all hours of the day and would be equal to the average value of the calculated k t D E M coefficients, i.e., k t D E M ¯ . Equation (2) thus takes the form:
P t , y f D E M = ( P t , y p l D E M · k t D E M ¯ ) ( y f y p l )
Thus, the facility’s electricity demand, E t , y f D E M , based on Equation (1), also depends on the average value of the coefficient k t D E M ¯ . Based on the work of [51], a method for calculating the capacity at the studied facility, at each hour of year t, was also determined:
T E C H i = { t e c h 1 ,   t e c h 2 , , t e c h T C }
t T     P t , G R G E N = i = 1 T C P t , i G E N
where TECHi—the set of distributed generation technologies planned for operation at the analyzed facility; i—the element of the set TECHi; and P t , G R G E N —generated capacity of distributed generation technologies at the analyzed facility, expressed in kW.
Therefore, it is possible to calculate the volume of electricity planned to be produced in hour t from distributed generation sources, E t , G R G E N , based on Equation (1). Thus, Equations (3) and (5) describe the operating points of the facility’s electric power equipment (consumption and generation) at each hour, t, of year yf. In addition, the operation of electric vehicle supply equipment (EVSE) must be modeled. The purpose of this article was to see whether EVs can help minimize the negative effects of introducing power rationing periods. At first glance, it seems that electric vehicles during the operating hours of the analyzed facility will not be able to help; in fact, they make the situation worse, as they are an additional energy load. However, through the use of smart charging (SC) or dynamic load management (DLM) [27,88] and vehicle-to-building (V2B) technologies, it is possible, through appropriate electricity management, to achieve a positive effect in the form of shifting the load to off-peak hours, intelligently shutting down the charging point when there are periods with a restriction in electricity consumption, or even generation operation of EVs for the benefit of the facility under study (for the EVs allowing for such an operation). Thus, two types of charging points were modeled at the studied facility: those enabling EV charging with smart charging technology (the number of charging points is equal to n C S S M C ), and those allowing for EVs to be discharged within the framework of V2B technology (the number of V2B charging points is equal to n C S V 2 B ). For the purposes of this work, it was assumed that V2B charging points are only used for discharging and must be available at other times. Vehicle charging is only possible using them as a reserve, e.g., when the facility under study would need to increase its demand as part of providing flexibility services on an emergency basis. This meant that when modeling the power and energy demands of the charging points, they were not taken into account, since the use of V2B technology is one of the facility administrator’s countermeasures. It was also assumed that the EVSE operates at a constant power for 1 h. Therefore:
P t , E V S E D E M = k E V S E , t · P N S M C · n C S S M C
where P N S M C —power drawn from the charging point with smart charging technology applied, expressed in kW; k E V S E , t —the factor that determines the level of power consumed by a given charging point; and P t , E V S E D E M —power drawn from all charging points in the facility, expressed in kW.
It should be noted that EV charging stations can operate with multiple operating points at a given hour (t). Thus, the coefficient k E V S E , t can be mathematically written as a j-element vector of operating points:
k E V S E , t = [ k E V S E , t , 1 k E V S E , t , 2 k E V S E , t , j ]
Knowing that the EVSE operates at a constant power for 1 h, the electricity demand of the charging points, E t , E V S E D E M , can be determined based on Equation (1).
Thus, the power operating point of the facility under study can be determined as follows:
P t , y f F A C = P t , y f D E M P t , G R G E N + P t , E V S E D E M
E t , y f F A C = E t , y f D E M E t , G R G E N + E t , E V S E D E M
where P t , y f F A C —the power balance of the facility under study at hour t of year yf, taking into account the demand for electricity, the generation of electricity from their own sources, and the operation of the charging station, expressed in kW; and E t , y f F A C —the electricity balance of the facility under study at hour t of year yf, taking into account the demand for electricity, the generation of electricity from their own sources, and the operation of the charging station, expressed in kWh.
A crucial element of the presented methodology is the validation by the manager of the facility under study of restrictions on electricity consumption and supply (power rationing) to end users. It has been assumed that each country or energy area has its own measures and methods for implementing such restrictions. For example, in Poland, there are so-called power supply tiers that determine the values of power consumption, depending on the operating state of the national power system. Thus, we let P 1 h L I M determine the value of hourly power that can be consumed by a given end user. By applying a simplification, the power consumed in a given hour (t) will also be equal to the energy consumed by the consumer in that hour ( E 1   h L I M ). More extensively, the methodology for determining the value of power supply tiers for Poland will be presented in Section 4, when discussing the case study. Thus, for each hour of year t, it was necessary to verify that the limits set by the relevant power system operators are followed, i.e., the below condition must be met:
t T   P t , y f F A C P 1   h L I M
It should be mentioned, however, that the process of imposing constraints on power consumption for the end user is dynamic and may only apply to selected days or even hours. The foundation in the presented approach of solving this problem was to calculate the aforementioned values for the energy balance of the facility in the long term and simultaneously analyze them in the short term (n − 1 day). This means that the value P 1   h L I M should be verified on an ongoing basis and input by the relevant technical services into the facility’s energy management system (EMS).
The methodology presented in this article was therefore based on the possibility of using EVs in the process of balancing and improving the energy security of the installations. However, it should be emphasized that the approach of using EVs to mitigate the negative effects of power rationing presented in this article is only a certain proposition of the idea of using EVs, and it has not yet been tested on a real infrastructure using both adequate real equipment and a communication infrastructure using the protocols used to manage communication between charging stations and other actors that make up the EMS. Thus, if the condition presented in Equation (10) is met, then it is possible for the load examined to consume electricity up to the subscribed power, including the use of charging stations for electric vehicles. However, we must not forget that it is up to the manager of such an installation to try to optimize their economic efficiency. This involves, among other things, using, in terms of electric vehicle charging, advanced DLM tools to shift charging to off-peak hours if this possibility exists. One of the important effects of the employment of DLM is the more pronounced fluctuation of energy prices on the day-ahead-type stock market for electric energy. We are not going to dwell too much on this subject, as it is outside the scope of the research presented in this article; hence, the rest of this article will not develop this aspect. From the point of view of this article, an interesting case was the situation in which condition (10) was not satisfied for certain periods of time of the year. Two countermeasures were defined, which use EVs in the process of dealing with electricity supply constraints:
  • Smart charging;
  • Energy transmission from an electric vehicle to a building, using V2B technology.
However, we must first define the technological and legislative basis for the use of electric vehicles and charging stations. Currently, the formal and legal situation of EVs is quite complicated. There is not yet a clear legal framework regarding the introduction of V2X technology (including V2B) in most energy markets [89]; it has been assumed that the electric vehicles that will participate in the transmission of energy to the end user in question belong to that end user (e.g., service vehicles). We also assumed that in the coming years of development of electromobility, legal acts will be adapted in such a way that the provision of V2X services will be facilitated [90]. So, the start point of the consideration is that they must be registered in a dedicated ICT system, and with the help of communication modules, their parameters can be defined at any time. In this article, a similar method of describing EVs using a vector was used as in the work published by the authors of [90]. However, due to the fact that EVs are to belong to the fleet of the manager of the facility under study, the vector describing the n-th electric vehicle (uEVn) was simplified:
u E V n = [ I D n S O C t , n S O C f , n C n F N n t n S ]
where I D n —identification number of the n-th electric vehicle; S O C t , n —the state of charge of the n-th vehicle’s battery at the time of connection and the start of transmission of electricity from or to the electric vehicle, expressed in %; S O C f , n —the state of charge of the n-th vehicle’s battery at the end of the process of transferring electricity from or to the electric vehicle, expressed in %; C n —nominal capacity of the battery of the n-th electric vehicle, expressed in kWh; F N n   —functionality of the n-th EV, defined as a charging-only vehicle (value equal to 1) or charging and discharging vehicles (value equal to 2); and t n S —expected dwell time of the n-th EV at discharging or at the charging site, in hours.
Based on the input data for the n-th EV, it was possible to determine the available electrical energy that the EV will consume during the charging process or yield during the discharging process:
u E V n   i f   F N n = 1     F N n = 2     E C H , n = ( S O C f , n S O C t , n ) · C n η CH
u E V n   i f     F N n = 2   E D I S , n = ( S O C t , n S O C f , n ) · C n · η D I S
whereby the following conditions must be met:
i n   c h a r g i n g   p r o c e s s :   S O C f , n S O C M A X , n
i n   d i c h a r g i n g   p r o c e s s :   S O C f , n S O C 0 , n
where E C H , n —electricity consumed by the n-th EV during the charging process, in kWh; E D I S , n —electricity yield via the n-th EV during the discharging process, in kWh; η CH —efficiency of the EV charging process, expressed in %; η DIS —efficiency of the EV discharging process, expressed in %; S O C M A X , n —the maximal state of charge of the n-th vehicle’s battery, expressed in %; and S O C 0 , n —the minimal state of charge of the n-th vehicle’s battery, constrained by the technical limitations, expressed in %.
It is also important to note that the level of S O C t , n , when a decision is made to discharge an EV, will also depend on the distance the EV is from the discharge service point:
S O C t , n = { C n · ( S O C a c t , n u s E V , n · d n C n ) ,       : d n > 0     S O C a c t ,                                                           : d n = 0
where S O C a c t , n —the state of charge of the n-th vehicle’s battery, at the time of the decision of whether to provide the V2X service, expressed in %; u s E V , n —average electricity consumption of the n-th electric vehicle, expressed in kWh/km; and d n —the distance between the n-th electric vehicle and the point where the discharging service is provided, expressed in km.
It should be noted that if a given EV or set of EVs does not have the functionality to supply electrical energy from the battery to the grid/consumer, which is notably due to the absence of the CHAdeMO or CCS 3.0 charging standard, then the installation manager can only apply the first countermeasure, namely smart charging. Although this is a drawback of the proposed approach, a significant increase in the number of EVs with the CCS 3.0 standard in the EU is expected, as it is to be a unified standard for vehicles operating in member states. EVs for which charging power is reduced using smart charging technology were assumed to be a separate set of EVs operated by the facility manager. This means that the total set of EVs, N u E V , can be described using a matrix [90]:
N u E V = [ I D 1   S O C t , 1 S O C f , 1 C 1 F N 1 t 1 S I D 2 S O C t , 2 S O C f , 2 C 2 F N 2 t 2 S I D n S O C t , n S O C f , n C n F N n t n S ]
It is now necessary to divide the set N u E V into two subsets, defining vehicles that only perform charging operations (i.e., those whose parameter F N n = 1 ) and those that can be charged and discharged ( F N n = 2 ):
N u E V = N u E V F 1   N u E V F 2
N u E V F 1 = [ I D k   S O C t , k S O C f , k C k 1 t k S I D k + 1 S O C t , k + 1 S O C f , k + 1 C k + 1 1 t k + 1 S I D k + l S O C t , k + l S O C f , k + l C k + l 1 t k + l S ]
N u E V F 2 = [ I D m   S O C t , m S O C f , m C m 2 t m S I D m + 1 S O C t , m + 1 S O C f , m + 1 C m + 1 2 t m + 1 S I D m + o S O C t , m + o S O C f , m + o C m + o 2 t m + o S ]
where k—the subsequent EV charging at the studied facility; and m—the subsequent EV charging or discharging at the studied facility.
Thus, given the number of rows of the set N u E V :
n = l + o
and:
N o u E V F 1 = | N u E V F 1 |
N o u E V F 2 = | N u E V F 2 |
N o u E V T O T = N o u E V F 1 + N o u E V F 2 = | N u E V |
where N o u E V T O T —the total number of EVs in the set N u E V ; N o u E V F 1 —the number of EVs in the set N u E V F 1 ; and N o u E V F 2 —number of EVs in the set N u E V F 2 .
Having the basic information on electric vehicles, it is necessary to define the value of the exceedances for each day of the year, or more precisely, for each hour, assuming that the power consumed during a given hour (t) is constant and equal to the value of the electricity consumed:
t T     P O V E R , t = P t , y f F A C P 1   h L I M
Further consideration was given to the hours (t) in which the value calculated in Equation (25) was greater than 0. Next, it was necessary to check whether there was a non-zero value of P t , y f F A C   for the parameter P t ,   E V S E D E M   in the hour of the occurrence of overruns, i.e., for the record P O V E R , t . In such a situation, the electric vehicles were said to be in the studied facility and charged. Thus, for these hours of the year (narrowing down to a certain period), it can be said that smart charging technology should be applied. It should also be remembered that the application of smart charging technology according to the assumptions of this methodology can only be applied to the EVs whose describing parameter F N n = 1 . It was also assumed that each vehicle analyzed within the set has its own charging point. Thus:
N o u E V F 1 = n C S S M C
The use of smart charging technology implies the simplest regulation of the charging power factor k E V S E , t . More advanced models can employ tracking controllers that adjust to the shape of the facility’s power demand profile. Nevertheless, for the purposes of this methodology, stepwise regulation of the level of charging point power demand was used. We let k E V S E , t R E D determine the charging reduction factor. By analogy with the k E V S E , t factor, a j-element vector was created to describe the k E V S E , t R E D factor. Thus:
k E V S E , t R E D = [ k E V S E , t , 1 R E D k E V S E , t , 2 R E D k E V S E , t , j R E D ]
As a result, it was possible to calculate the level of constraint after the application of smart charging technology, P O V E R , t S C , according to Equation (6):
t T   w h e n   P t ,   E V S E D E M > 0 t T   j > 0     P O V E R , t S C = ( P t , y f F A C P N S M C · n C S S M C · k E V S E , t , j R E D ) P 1 h L I M
knowing that:
k E V S E , t R E D = 1   k E V S E , t
thus:
E O V E R , t S C = P O V E R , t S C · 1   h
The parameter P O V E R , t S C may take two values. If the constraint in power consumption is completely reduced (the difference referred to in Equation (34) will be less than or equal to 0) by applying smart charging technology, the parameter P O V E R , t S C will take values of 0, i.e., the constraint will be removed. Otherwise, it will continue to exist and will be equal to the aforementioned difference. Thus:
P O V E R , t S C = { 0 ,   i f   (   P t , y f F A C P N S M C · n C S S M C · k E V S E , t R E D ) P 1 h L I M 0   e l s e   P O V E R , t S C
The aforementioned actions can be written using the following Algorithm 1:
Algorithm 1. Procedure of using smart charging technology in eliminating power constraints
(1)
START: Calculate the forecast for electricity and power demand and generation for each hour of the year t.
(2)
Input into the energy management system data on the maximum power consumed by the end user in hour t P 1 h L I M . Assume multi-variant scenarios of power system operation.
(3)
Compare the values of the energy balance of the facility, P t , y f F A C , and the maximum that can be consumed by the end user, P 1 h L I M , without use of energy from EVs.
(4)
CHECK: Are there power overruns at hour t due to the potential occurrence of unfavorable conditions in the power system ( P O V E R , t 0 ) ?
YES: Potential countermeasures have to be applied to reduce the power consumed in a given hour. Save the overrun values. Proceed to analysis in day n − 1—step (5).
NO: Finish the assessment of the problem of overruns of contracted consumed power.
(5)
Run the procedure of the potential use of EVs to mitigate the negative effects of power constraints. Calculate the available power and energy from the EVs. Update the forecast of demand and generation for each hour (t).
(6)
Analyze the set of EVs in the end user’s fleet (target is all EVs, including private ones) and operate them within a dedicated ICT system, which allows us to monitor the parameters of EVs,
(7)
Compare the values of the energy balance of the facility, P t , y f F A C , and the maximum that can be consumed by the end user, P 1 h L I M , including the use of EV battery capacity.
(8)
CHECK: Are there power overruns at hour t due to the occurrence of unfavorable conditions in the power system (signal from TSO) or the normal operations of the power system, while using distributed generation resources and a set of end-user EVs ( P O V E R , t 0 ) ?
YES: Apply countermeasures to reduce the power consumed in a given hour. Save the overrun values.
NO: Finish the assessment of the problem of overruns of contracted consumed power.
(9)
CHECK: At hours when P O V E R , t 0 , are the EVs being connected, i.e., P t ,   E V S E D E M > 0 ?
YES: Use smart charging (SC) and V2B technology to reduce the power consumed by the object. Go to step (10).
NO: Finish the algorithm. Apply countermeasures in the form of diesel generators or stationary energy storage facilities.
(10)
Read EV data from the local ICT system and see which are connected to the SC and V2B charging points—analysis of sets N u E V F 1 and N u E V F 2 .
(11)
Determine EV charging power.
(12)
Set the degree of reduction according to the coefficient k E V S E , t R E D .
(13)
Calculate the EV charging reduction power in SC technology, and then calculate the new overrun value, P O V E R , t S C .
IF:  P O V E R , t S C 0 , THEN: Take the value of this constraint equal to 0. The constraint has been eliminated.
ELSE: Take the value of the constraint P O V E R , t S C , and then go to step (14).
(14)
Repeat steps (12) and (13) until the reduction possibilities are fully depleted, i.e., the entire j-element set of k E V S E , t R E D coefficients has been used.
(15)
CHECK: If there are further overruns of P O V E R , t S C after step (14):
YES: Define the values of these overruns and proceed to solve the problem with V2B (Algorithm 2).
NO: Finish. Overruns have been eliminated. There is no need to use V2B technology.
After analyzing Algorithm 1, there may be a reason to use V2B technology. As mentioned earlier, it has been assumed that the EVs described using the N u E V F 2 set can be used for sharing their battery capacity for the benefit of removing the power rationing constraints for the end user under analysis. Based on Equations (13) and (20), it was possible to calculate, for each EV belonging to the N u E V F 2 set, the amount of electricity that can be sent from the battery to the end user under V2B technology. Thus, the result of this operation was a vector:
E D I S , m = [ E D I S , 1 E D I S , 2 E D I S , o ]
The total volume of electricity available from the o-th number of EVs is equal to:
E D I S T O T = m = 1 o E D I S , m
Then, it is necessary to divide the hours t into 24 h periods corresponding to one day. One should assign the P O V E R , t S C constraint values to the respective hours (t) of the year, and therefore also to the days. Then, the values of P O V E R , t S C should be ranked, along with the respective hours of the day from smallest to largest. The aim of employing this measure was to identify the hours in which electric vehicles using V2B could reduce as many overruns as possible. The conditions for verifying the proper use of V2B technology were to model whether the EVs are or will be on the site during the selected time interval for the elimination of the selected constraints, whether the total discharge power is greater than the overrun power, P O V E R , t S C , and whether it is not greater than the technical capacity to transmit power from the EV to the consumer, also taking into account the number of EV discharge points. If the total discharge power, P D I S , t , is less than the overrun power, P O V E R , t S C , it is necessary to take the maximum value of the P D I S , t value equal to the ratio of the total energy stored in the EV and the unit of time (1 h). After checking which constraints have been removed and for which hours, it was necessary to calculate new constraint values— P O V E R , t S C + V 2 B . Thus, the value of P D I S , t   can take the following forms, depending on whether the aforementioned conditions are met:
P D I S , t = P O V E R , t S C ,     i f   E D I S T O T 1   h   n C S V 2 B · P N V 2 B a n d   E D I S T O T 1   h   P O V E R , t S C   n C S V 2 B · P N V 2 B ,     i f     E D I S T O T 1   h > n C S V 2 B · P N V 2 B E D I S T O T 1   h ,     i f   E D I S T O T 1   h   n C S V 2 B · P N V 2 B a n d   E D I S T O T 1   h < P O V E R , t S C
Lastly, it remained to check whether the power rationing constraints were retained:
P O V E R , t S C + V 2 B = { 0 ,   i f   (   P O V E R , t S C P D I S , t ) P 1 h L I M 0   e l s e   P O V E R , t S C + V 2 B
E O V E R , t S C + V 2 B = P D I S , t · 1   h
If not all the constraints have been removed, i.e., if there are still positive values after analyzing the individual times (t) using Equation (35), further countermeasures should be used; therefore, other energy sources, such as fixed electricity storage installations, gas engines, or even diesel generators should be employed. The measures derived from EV discharging should be carried out until there is available energy in the EV, i.e., E D I S T O T > 0 . For the aforementioned measures, the procedure for using V2B technology in the elimination of power consumption constraints is as follows:
Algorithm 2. Procedure of using V2B technology in eliminating power constraints
(1)
START: Define the hours (t) for which power overruns occur after applying smart charging technology and provide the values of these limits, P O V E R , t S C .
(2)
CHECK: Is/will every n-th EV used for V2B technology be on the site for hours t with further constraints P O V E R , t S C ?
YES: Specify their S O C t , n . Go to step (3).
NO: Calculate/estimate their distance to the discharging point and calculate S O C t , n . Go to step (3).
(3)
Using the parameters specified in the N u E V F 2 set, calculate the available usable electrical energy found in the EV batteries. Specify the vector E D I S , m and its total volume, E D I S T O T .
(4)
For a given time period, rank the P O V E R , t S C constraints as follows: min → max
(5)
Calculate the power overruns after applying V2B technology, P O V E R , t S C + V 2 B .
IF:  P O V E R , t S C + V 2 B 0 , THEN: Take the value of this constraint equal to 0. The constraint has been eliminated. Go to step (6).
ELSE: Take the value of this constraint P O V E R , t S C + V 2 B , and then go to step (6).
(6)
Subtract the volume of electricity resulting from the use of V2B technology, E O V E R , t S C + V 2 B , from the volume, E D I S T O T .
(7)
CHECK: Is the difference from step (6) positive: E D I S T O T E O V E R , t S C + V 2 B > 0 ?
YES: Go to step (8).
NO: Not all the constraints have been removed. Go to step (9).
(8)
CHECK: If there are further overruns?
YES: Repeat steps (5)–(7).
NO: Finish the algorithm—all constraints have been removed with SC and V2B technologies.
(9)
Define the overrun volumes and hours for which the EVs failed to remove the constraints. Apply other countermeasures and finish the algorithm.
At this stage, we know to what extent the use of electric vehicles contributed towards eliminating the constraints during the period of energy rationing; therefore, it was possible to calculate the efficiency ratio of V2B and SC technologies for a given end user as follows:
k e f f E V = n t E V n t T O T A L · 100 %
where k e f f E V —the efficiency ratio for eliminating the constraints during the power rationing periods with the use of EVs, expressed in %; n t E V —the number of hours (t) in which the EVs eliminate the power consumption constraints; and n t T O T A L —the number of hours (t) in which power consumption constraints occurred.
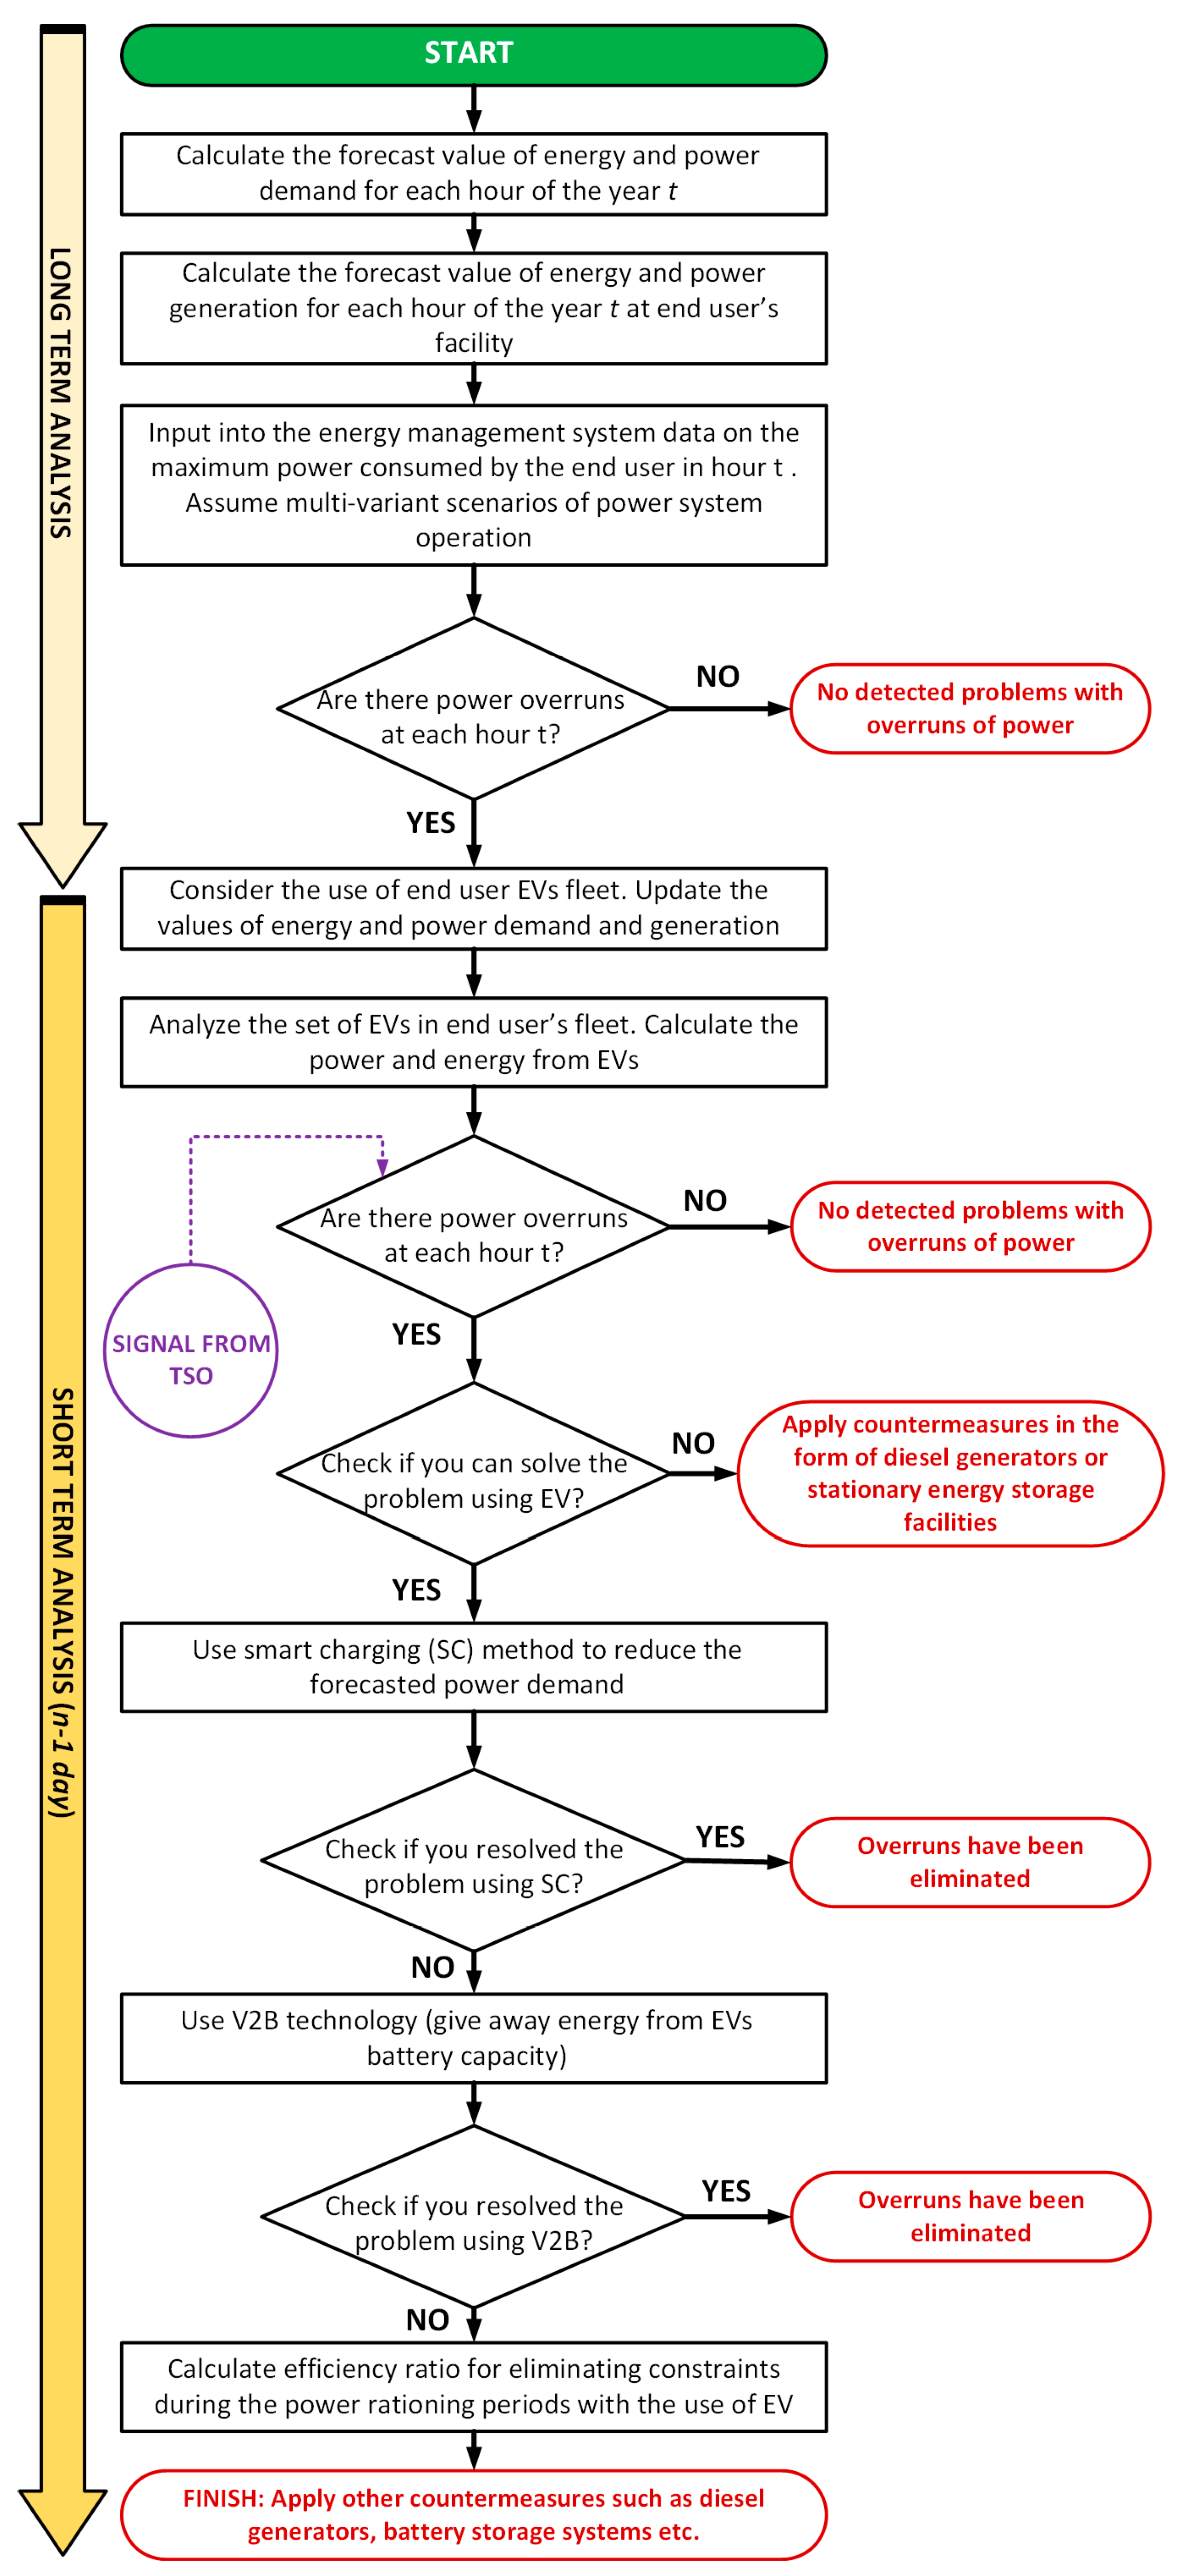
Figure 3 shows a detailed block diagram of the proposed methodology for eliminating power demand constraints using EVs.

4. Case Study

4.1. Power Infrastructure

To validate the methodology described in Section 3, a case study was performed for the main campus of the Warsaw University of Technology (WUT). This article presents a continuation of the considerations started in [51]. The aforementioned article described the process of the detailed analysis of the power and energy demands of the WUT’s main campus and proposed 5 concepts for the development of campus energization based on low-carbon power generation and energy storage technologies. Based on [51], it can be concluded that the best concepts for the energization of the WUT’s main campus were the investments in hybrid RES installations, working alongside with diesel generators to ensure energy security (Concept 2), and ultimately full modernization of the campus power infrastructure (Concept 4), including:
  • Electricity generation through high-efficiency, gas-fired cogeneration and hybrid RES installations;
  • Installation of battery electricity storage facilities, as a means of protecting the facility (instead of diesel generators);
  • Establishment of carports, featuring shelters with PV installations, AC charging stations with smart charging, and DC charging stations with V2X technology;
  • Use of demand-side response (DSR) technology.
Figure 4 shows a satellite image of the WUT’s main campus area, divided into two parts (the TG zone and the BIS zone). Figure 5, however, presents a schematic diagram of the power supply to facilities on the WUT’s main campus, taking into account the planned infrastructure modernization according to Concept 4 (dashed lines, as well as all PV sources). Table 1 therefore summarizes the basic electrical data for the various distributed generation technologies planned to be installed on the WUT main campus under Concept 4 [51].
It was also necessary to estimate the forecast demand for electricity at 1-h intervals from 2023 to 2030. The method presented in [51] was also used for this purpose, but a certain modification was adopted, as mentioned in Equation (3). Figure 6 shows a graph of the annual electricity demand forecast for the WUT’s main campus. It should be noted that it was necessary to analyze every hour of the day during this study.
Based on these analyses, 24 h in the summer season (summer day—☼) and 24 h in the winter season (winter day—Energies 17 00018 i001) were selected. Daily baseline profiles were developed for the years 2023, 2027, and 2030. Table 2 shows the volumes of electricity consumed in consecutive hours of the day for the aforementioned profiles, and also the operating profiles of the generation technologies, which were previously defined in Table 1.
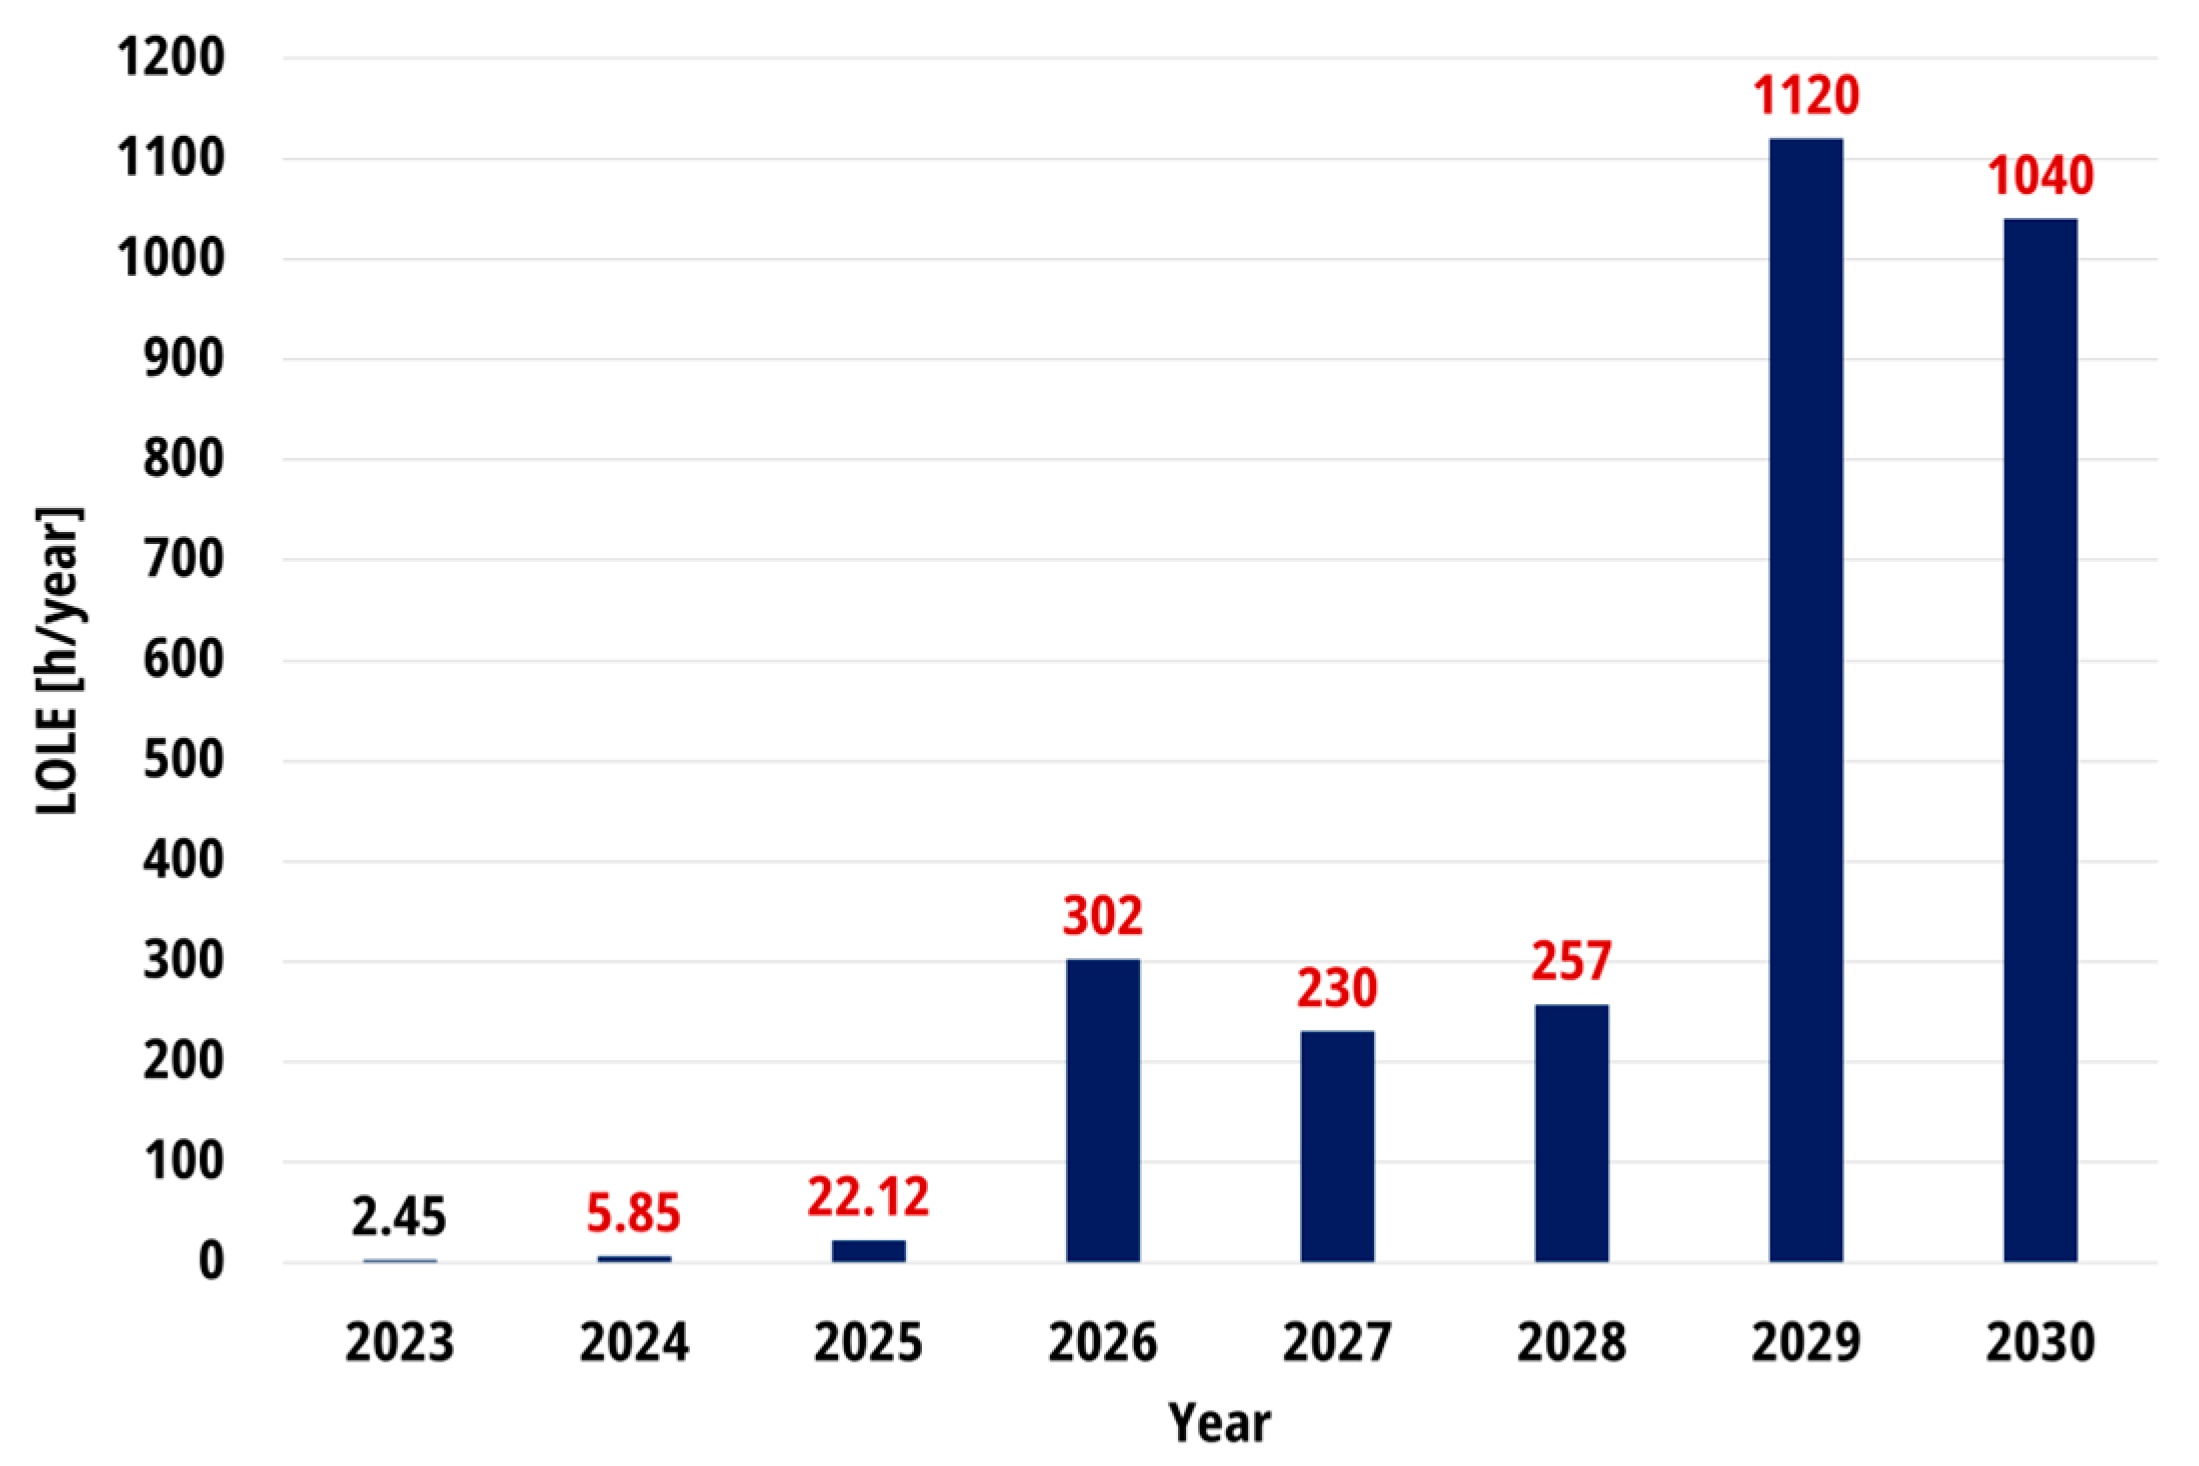
4.2. Modeling Constraints on the Consumption and Supply of Electricity to the End User

As previously mentioned, the crucial value against which the volume of demand for smart charging or V2B services will be determined is the amount of the power rationing constraint, P 1 h L I M . In the analysis of the case study for the WUT’s main campus, the method for determining the power rationing constraints that are in force in Poland, the so-called “power supply tiers”, should be taken into account. The basis for power rationing constraint analyses is the values of contracted power and minimum and maximum hourly power demand in each mn-th month of the year. The methodology for determining the aforementioned values was set out in Regulation of the Council of Governments of November 8, 2021 on detailed rules and procedures for introducing restrictions on the sale of solid fuels and on the supply and consumption of electricity or heat [91]. We let P 1 h ,   m n m i n denote the minimum level of power demand in the mn-th month of the year. For real-world analyses, the n − 1 year was considered relative to the year under study, while for the case study, P t ,   y f D E M should be taken as this value. Similarly, P 1 h ,   m n m a x represents the maximum level of power demand in the mn-th month of the year.
According to the methodology adopted by the authors of [91], the values of P 1 h ,   m n m a x and P 1 h ,   m n m i n should be determined for each mn-th month of the year; then, the 3 worst records of each (the largest and the smallest, respectively) should be discarded, and the average value should be calculated from the remaining 9 records. We let P 1 h , m n m a x ¯ denote the average value of the maximum power demands of the 9 mn-th months, and P 1 h , m n m i n ¯ denote the average value of the minimum power demands of the 9 mn-th months.
Next, the “power supply tiers”, which reflect the energy demand levels up to which a customer can consume energy from the grid system, need to be defined. In Poland, there are “power supply tiers” ranging from 11 to 20 [91]. Table 3 shows the power value for each “power supply tier”. It is also worth noting that the aforementioned methodology applies to all consumers with a contracted power above 300 kW, excluding facilities or a separate part of facilities belonging to the following: critical infrastructure, the military, transportation related, television and radio broadcasting, electricity and heat generation infrastructure, and environmental protection infrastructure.
Based on the schematic diagram shown in Figure 3, the WUT’s main campus has 2 points of common coupling (PCC) to the power grid. With this being the case, this zone is still treated as a single installation unit with a total contracted power according to the regulations [91]. On each PCC, the contracted power is 2300 kW; so, for further analyses, the total contracted power level should be taken as 4600 kW. Thus, the WUT’s campus meets the criteria for the necessity of power constraints in subsequent “power supply tiers”, as described by the authors of [91], but excludes the part of the facility supplying the own needs of the sources described in the selected power infrastructure development concepts [51]. Table 4 shows the values of power constraints for the years 2023, 2027, and 2030, adopting the methodology for calculating power demand that has been described in Section 3 of this article.
Based on Table 4 and the analysis of the daily power demand profiles from 2019 to 2022 for the WUT’s main campus, it can be concluded that, according to the forecasts for 2023–2030, the power consumption in the 20th power supply tier is approximately equal to 50% of the ordinary value of the contracted power, i.e., that in the 11th power supply tier. Such a situation can occur when the conditions are most unfavorable, i.e., during university working hours. This is a huge challenge for the university authorities, who must ensure the continuity of operation of the primary business units, while saving as much electricity as possible.

4.3. EV Modeling

A key factor in the analyzed methodology for coping with limitations in electricity consumption and supply in Poland is the modeling of the number of electric vehicles, whose energy potential will be one of the remedies proposed to the WUT authorities for potential energy supply problems that could occur in the future. Figure 5 shows a power supply diagram of the main PW campus, where 30 electric vehicle charging points are marked. It was assumed that these 30 points will be located in the so-called BIS parking lot. From the point of view of this analysis, the interesting part is the “BIS”. This is where 30 charging points are planned to be located, integrated with parking shelters that will contain photovoltaic installations. The number of 30 points represents about 10% of all parking spaces in the BIS parking lot. The 30 charging stations considered were divided into 2 categories:
(1)
22 kW AC charging points with smart charging functionality (21 units);
(2)
DC charging points with a V2B functionality level of 50 kW (9 units).
Apart from the 30 charging stations listed above, a 50 kW electric vehicle charging station is also being considered. This station is currently located in the “TG” zone of the WUT’s main campus and will only be used for smart charging purposes. Several analytical simplifications were considered in order to facilitate the interpretation of the results. The mobility of electric vehicles, as well as the variability of their SOC, were not modeled, which means that in practice, it was assumed that they will always be connected to AC charging stations on weekdays between 8:00 a.m. and 4:00 p.m. and will perform a charging service at full power for 8 h. It was also assumed that smart charging with reduction levels determined using the coefficient k E V S E , t will be implemented. This article assumed 5 levels of this coefficient; hence, the vector described in Equation (7) has 5 rows, as defined by the authors:
k E V S E , t = [ 0 0.25 0.5 0.75 1 ]
whereby the normal operating condition is defined via k E V S E , t = 1 .
Table 5 shows the degree of power demand reduction from charging stations, matching the values of k E V S E , t described in Equations (7) and (27).
It should be clarified that for the simplifications listed above, it was not necessary to model a set of vehicles, N u E V F 1 , since it was assumed that due to the rotation of charged EVs, the AC charging points located at the BIS parking lot and the EV charging point located at the “TG” zone of the WUT’s main campus will be continuously used for 8 h.
The modeling of electric vehicles and the operation of 9 V2B charging points was found to be slightly different. It was assumed that there is 1 electric vehicle per V2B charging point. Thus, a set of vehicles, N u E V F 2 , was determined by randomizing the parameters. The set of vehicles is presented in Equation (43), assuming the following constraints:
S O C t , m 0.45 ; 0.95
S O C f , m 0.2 ; 0.5
C m 60   kWh ; 90   kWh
t m S = 8   h
N u E V F 2 = [ I D m   S O C t , m S O C f , m C m   [ k W h ] F N m t m S   [ h ] 1 0.89 0.31 82 2 8 2 0.55 0.45 76 2 8 3 0.88 0.42 89 2 8 4 0.7 0.34 69 2 8 5 0.84 0.25 81 2 8 6 0.55 0.26 77 2 8 7 0.47 0.35 87 2 8 8 0.84 0.44 88 2 8 9 0.91 0.2 90 2 8 ]
Based on Equation (13), it is possible to calculate the amount of electrical energy that one electric vehicle is capable of providing from its battery. Thus, based on Equation (33), the volume of that energy can be calculated for 9 vehicles:
E D I S T O T = m = 1 9 E D I S , m = 270   kWh
It should be noted that the set of EVs providing V2B services will be concerned with a one-time use of the service. The assumption of this article was to test whether a certain set of EVs can handle the elimination of constraints in multiple power rationing scenarios at the WUT’s main campus. Thus, the defined set of parameters must be treated as fixed and homogeneous, and, therefore, the different operating conditions of the electrical infrastructure of the WUT’s campus described in Section 4.1 and Section 4.2 will be imposed on it.

4.4. Selected Scenarios of the Operation of the Electrical Power Infrastructure of the WUT’s Campus

As previously mentioned, this study analyzed the values of power supply constraints for the years 2023–2030, as outlined by the authors of [51]. Thus, it was necessary to analyze the constraints for the demand profiles selected in Section 4.1 for the years 2023, 2027, and 2030. By performing detailed analyses of the values in Table 4, it was determined that it was critical to focus on the 12th and 20th power supply tiers, as well as one of the power supply tiers that is within this range—the 16th tier in this research. Based on Equation (25), the overrun values that must be eliminated using the EVs were defined. They are presented in Table 6, Table 7 and Table 8.
Based on Table 6, Table 7 and Table 8, it can be noted that in the case of the occurrence of the 12th power supply tier, there is practically no overruns in contracted power consumption, which means that there are also no constraints to be eliminated. The exception was at 11 a.m. in the winter profile of 2030. The situation became more complicated at the 16th and 20th power supply tiers. In these cases, there were almost always overruns of the contracted power and thus constraints to be eliminated using EVs. It should also be noted that the hours for which they occurred matched the EV charging hours, which indicates that the use of smart charging technologies will be appropriate. It should also be remembered that when the power drawn is constant for 1 h, as mentioned in Equation (30), it will be equal to the volume of electricity drawn from the power system.

5. Results and Discussion of Using the Electric Vehicles in the Power Constraint Elimination Process

5.1. Smart Charging Technology

As mentioned in Section 4.4, the simulations of smart charging technology usage were performed for two demand profiles (summer/winter) in 2023, 2027, and 2030, and for three selected power supply tiers (12th, 16th, and 20th). The use of the reduced power values indicated in Table 5 has shown that the energy consumption constraints would be eliminated in subsequent iterations of the smart charging technology operation. Figure 7, Figure 8 and Figure 9 show the total number of removed power constraints using smart charging technology in the 12th, 16th, and 20th power supply tiers for the WUT’s main campus. It should be noted that for each year, these are the aggregated results for two profiles (winter and summer). This means that the total number of records analyzed for each year was equal to 48. The aforementioned figures also indicate the total number of recorded overruns of contracted power (i.e., constraints to be eliminated), as well as the remaining number of overruns (constraints to be eliminated) after the application of smart charging technology.
In the case of the 12th power supply tier, there was only one restriction to be eliminated (Table 6). It was also found that this constraint was removed through the use of smart charging technology, in which the reduction in charging power was 25%. Thus, there was no indication that V2B technology should be used in the next phase of this study.
In the case of the 16th power supply tier, there were eight constraints to be eliminated in 2023—all for the winter profile. This equivalated to 17% of the total records. Reducing the EV charging power by 25% had no effect for this case. Only increasing the reduction in EV charging power to 50% resulted in the elimination of one constraint (9 a.m.). The study therefore continued, and only by reducing the charging power by 100% were further constraints eliminated between 10 a.m. and 2 p.m., excluding 11 a.m. For 2027, a total of eight overruns were found—all also for the winter day. The use of smart charging technology allowed for the elimination of one constraint (overrun)—a 50% reduction in power for the 9 a.m. hour. The remaining constraints were left unresolved, despite the application of a 100% EV charging power reduction. For 2030, a total of eleven overruns (constraints to be eliminated) were detected—three for the summer profile and eight for the winter profile, and this equivalated to 23% of the total record. Overruns for the summer day were eliminated (during the hours of 1 p.m.–3 p.m.) by applying a 25% reduction in EV charging power. For the winter profile in 2030, only a 75% reduction in EV charging power eliminated one limitation by 9 a.m. The remaining contracted power overruns (restrictions to be eliminated) were maintained and required the use of V2B technology.
There were 20 constraints to be eliminated using EVs for the 20th power supply tier for 2023. This equivalated to 42% of the total records. Eleven of these were related to the winter profile, while nine of them applied to the summer profile. The use of smart charging technology only had an effect with a 50% reduction in EV charging power. Overruns at 8 a.m. and 4 p.m. on a summer day were then eliminated. In subsequent steps of a 75% reduction, the constraints at 9 a.m. and 11 a.m. on a summer day were eliminated. A 100% reduction in charging power in 2023 succeeded in eliminating overruns at 10 a.m. and 12 p.m., as well as at 8 a.m. on a winter day. For 2027, 21 constraints were detected to be eliminated (overruns of contracted power). This equivalated to 44% of the total records. Nine of these were for the summer day, while twelve were for the winter profile. For that year, EV charging power reduction was only effective when a 75% reduction was applied. It was then possible to remove the constraint for the hours of 8 a.m. and 4 p.m. on a summer day. For the winter day, the application of smart charging technology did not have the expected result—the need for V2B technology. For 2030, 21 restrictions were also recorded, and as for 2027, 9 of them were for the summer day and 12 were for the winter day. The only overrun (constraint) that was resolved was for a summer day at 8 a.m. For the remaining cases, V2B technology was needed.
Table 9 and Table 10 show the hours and values of the power constraints for which V2B technology will be required in 2023, 2027, and 2030 for the 16th and 20th power supply tiers. It should be added that the red color indicates the hours in which constraints were not eliminated, and the green color indicates the hours in which constraints were completely eliminated using SC technology.

5.2. V2B Technology

Table 9 and Table 10 show the daily values of contracted power overruns for the summer and winter days in 2023, 2027, and 2030 in the case of the 16th and 20th power supply tier events. As mentioned in Section 3, the analysis of the use of V2B technology, in case there will be a need to use it, begins by assessing the volume of electricity that can be obtained from the selected EVs. In Section 4, it was calculated to be equal to 270 kWh using Equation (44). Thus, the constraints to be eliminated shown in Table 9 and Table 10 were ranked for each case from smallest to largest, according to the methodology described in Section 3 (Algorithm 2). Assuming that the indicated overruns are expressed as average hourly power, this means that they are equal to electricity consumption. Discharge power was therefore assumed, according to Equation (34), equal to:
P D I S , t = P O V E R , t S C
The use of V2B technology in practice to eliminate overruns (constraints) of contracted power is shown in Table 11 and Table 12. It should be added that the red color indicates the hours in which constraints were not eliminated, the green color indicates the hours in which constraints were completely eliminated using V2B technology, the blue color indicates those constraints that were partially eliminated, and the purple color indicates the hours and values of constraints that could be eliminated completely or partially; however, for this realization, it would be required that EVs belonging to the N u E V F 2 set remain longer in the parking stands than initially assumed (base time: 8 a.m.–4 p.m.) as a result of ranking those values according to the methodology presented in Algorithm 2.
Based on Table 11, it can be concluded that in the case of the 16th power supply tier, due to the use of V2B technology as a complement to smart charging technology, all overruns (constraints) on the winter day for 2023 can be eliminated. In addition, the number of constraints for the winter day in 2027 was reduced by 29%, and for 1 out of 7 h the constraints were partially eliminated, reducing the value from 0.12 MW to 0.01 MW. For 2030, one restriction was completely removed, and one was partially removed (reducing the value from 0.23 MW to 0.15 MW). This means that it is possible to calculate the efficiency ratio of eliminating contracted power overruns during power rationing periods for the 16th power supply tier, according to Equation (37):
k e f f E V ( 16 t h   P S T ) = 16 27 · 100 % = 59.25 %
Based on Table 12, it can be concluded that in the case of a 20th power supply tier, the use of V2B technology allows for the elimination of all constraints on a summer day in 2023. On the winter day of 2023, the overrun (constraint) of contracted power at 9 a.m. can be partially reduced. On the other hand, as a result of ranking the constraints, according to the methodology adopted in Algorithm 2, it is also possible to remove the 6 p.m. constraint, but then the vehicles would have to remain connected to the V2B bi-directional charging points until the end of that hour. Interestingly, between 10 a.m. and 5 p.m., vehicles would not be used. For the winter day in 2027, the 1 a.m. constraint was eliminated, but the 6 p.m. overrun could have also been partially eliminated; however, the conditions mentioned previously must be taken into account. In the summer day of 2027, three overruns were eliminated and one overrun would be partially eliminated. In 2030, only for the summer demand profile was it possible to eliminate the overruns (constraint) at 9 a.m. and 4 p.m. The constraints were partially eliminated at 11 a.m. on a summer day and 8 a.m. on a winter day. As for the case of the 16th power supply tier, the efficiency ratio of eliminating contracted power overruns during power rationing periods was calculated for the 20th power supply tier, according to Equation (37):
k e f f E V ( 20 t h   P S T ) = 19 62 · 100 % = 30.65 %
Comparing the results of the ratios, it can be concluded that the declaration of a higher power supply tier will result in a significant reduction in the effectiveness of the ability to eliminate constraints/overruns of contracted power with EVs (from 59% to 30%). It should be noted that for the remaining hours, during which the discharge of electric vehicles or the reduction in charging power could not be applied, it was necessary to provide other countermeasures to maintain the normal operation of the university. Otherwise, if such countermeasures are not taken, it would be necessary to shut down additional electrical loads. From the university’s point of view, this could lead to a huge disruption in carrying out daily tasks related to research and the teaching process, or even to their cessation in extreme cases. Unfortunately, this ultimate disruption in the form of stopping classes and suspending research activities comes at a huge cost.

5.3. Other Aspects to Be Discussed

Eliminating power constraints with electric vehicles also involves aspects other than strictly technical ones. The first is the economic aspect. It should be borne in mind that EVs under normal operating conditions of the electric power system will most likely be charged using the end user’s electric power system or discharged if the owner of such a vehicle agrees, and there are appropriate economic reasons. As a general rule, EVs should be discharged at times of peak power demand in such a way as to reduce the cost of purchasing electricity from the grid (the customer’s tariff price will be the benchmark) or, if the customer had its own power generation infrastructure, to maximize the profit from electricity sales [38,92]. This could also be a reason for further research in this area to develop forecasting tools that take into account the sale of electricity in the day-ahead market on power exchanges [93,94]. However, in the emergency mode of operation of the power system, the most important thing is to ensure the continuous supply of electricity and, at the same time, to avoid the cost resulting from its non-delivery. In the theory of power system reliability and energy security, this cost has been described using the VoLL (value of lost load) [43]. As part of further research, the authors of this article will attempt to assess the cost of not supplying electricity to individual organizational units of the university. It should be mentioned that currently this cost is calculated for many industries, such as specific industries, services, public administration, and households, but no information was found on the cost of not supplying energy for the education/research university sector. A survey of WUT departments is currently being conducted to estimate such costs. It should also be taken into account that failing to reduce power to the assigned power supply tier also incurs fines. Under the current laws in Poland, the national energy market regulator can impose a penalty of up to 15% of a given company’s revenue in the previous fiscal year [95]. It is also worth mentioning that EV discharging should also involve economic incentives in the form of covering the cost of excessive EV battery degradation [96]. The second aspect to be addressed in the operation of EVs and their potential use in the process of eliminating power constraints is the environmental issue. It seems reasonable that in order to fully assess whether the use of EVs in such a process is beneficial, an analysis of unit emissions into the atmosphere should be conducted [97]. To the best of the authors’ knowledge, no such study has been found at this point, which may be a reason to launch further research in this area. When analyzing the method of supplying electricity to the end user’s installation, the authors suggest that, for such analyses, the CO2 emission rate resulting from the prior charging of such an EV in terms of the battery capacity that will be made available for the elimination of power constraints should be compared with the CO2 emission rate allocated to other methods of supplying electricity (e.g., by means of a diesel generator) in terms of this volume. Such a study will make it possible to fully assess the usefulness and validity of using EVs in power constraint elimination processes.
The present study is also limited to the use of a fleet of EVs potentially owned by an end user. As mentioned in this article, this was due to the fact that currently electricity markets are not adapted to the sale of electricity from EVs [98]. This will undoubtedly be a huge challenge for national energy market regulators to properly and legally account for such customers. Nevertheless, it is to be expected that such a problem will need to be resolved in the near future. Once private vehicles could legally provide battery discharging services (V2X services), the necessity of providing the appropriate tools to search for electric vehicles and providing the service should be taken into account [90]. It is likely that this will be a significant logistical challenge, though, at least by having to take travel profiles into account [99].

6. Conclusions

This article presents detailed and in-depth research findings on the possibility of using electric vehicles to mitigate the negative effects of power rationing periods. It shows an idea or an approach that can be used by the facilities managers to provide another branch of internal energy services for maintaining the core business during the unfavorable operating conditions of the power system. It should be noted that the methodology developed does not only apply to universities. It can be successfully applied to all companies that will have EV fleets. If the appropriate legal situation arises, such solutions could also be used, for example, in shopping malls using private EVs (obviously as a paid service). Through the use of smart charging and V2B technologies, it was possible to try to eliminate contracted power overruns (power consumption constraints) in successive power supply tiers. It should be borne in mind that the development of electromobility will be the backbone of the energy transition in the years to come; hence, facility managers should be able to effectively use EVs. On the other hand, in countries that base their energy mix on coal- or oil-fired power plants, these units will be gradually phased out in the years to come, which may result in the relevant power system operators not having the required operating reserve to maintain grid operations. In such situations, and in cases of unfavorable power system operating conditions, operators can order end users to reduce their power. Through the use of EVs, it is precisely possible to reduce the negative effects, i.e., to suspend the current economic activity of the end user. Universities are a special case. In the literature, there are widespread studies on the assessment of the effects of non-delivery of electricity to industrial consumers or households; however, analyses concerning universities are practically non-existent. Given that university scientific personnel are among the leaders in developing cutting-edge technologies, implementing an EV efficiency program would be ideal. The conducted research has shown that it is possible to use EVs owned by university employees and EVs that are dedicated company vehicles for such purposes. In addition, combining them with other investments in distributed generation allows for the establishment of low-carbon countermeasures to address periods of power rationing. The results indicated that with the use of the proposed methodology, almost 60% of the constraints could be eliminated using distributed generation and EVs. To sum up, the following items were accomplished as part of the conducted research:
  • The authors’ concept (idea) of using EVs in the elimination of power constraints was developed by means of a research methodology;
  • Application of the new method of analyzing the power and energy demands of a non-residential building to assess the usefulness of EVs as a form of mobile energy storage during power rationing periods;
  • Developing a mathematical model of the EV discharging service to the end user to eliminate power constraints;
  • The novel efficiency factor to eliminate power constraints using electric vehicles has been developed.
Further research should be carried out to implement a demonstrator of the solution designed in this research, which will be integrated using real applications of energy management systems, taking into account existing standards and protocols, as well as the evaluation of the cost of not supplying consumers with electricity, with a particular focus on the university sector. As mentioned in Section 5.3, further studies should also assess environmental aspects. This will allow for evaluating the full-scale viability of using EVs as a countermeasure in the process of eliminating power constraints. In addition, the possibilities of designing special vehicles that will only provide emergency services through the use of additional BESSs built into them, or with the use of other electricity storage techniques, should be considered.

Author Contributions

Conceptualization, K.Z. and M.K.; methodology, K.Z.; software, K.Z.; validation, M.K., M.L. and D.D.R.; formal analysis, K.P.; investigation, K.Z.; resources, K.Z.; data curation, M.K.; writing—original draft preparation, K.Z.; writing—review and editing, M.L. and D.D.R.; visualization, K.Z. and M.K.; supervision, D.D.R. and K.P.; project administration, K.Z.; funding acquisition, K.Z. All authors have read and agreed to the published version of the manuscript.

Funding

This work was performed under a grant from the Scientific Council of the Warsaw University of Technology Discipline of Automation, Electronics, Electrical Engineering, and Space Technologies, in accordance with agreement no. 504/04768/1041/43.022216.

Data Availability Statement

Data are contained within the article.

Acknowledgments

The authors would like to thank the WUT Chancellor Jolanta Ewartowska and the WUT Deputy Chancellor for Technical Affairs Wojciech Starczyński for their help in completing the grant.

Conflicts of Interest

The authors declare no conflict of interest.

Main Variables

C n Nominal capacity of the battery of n-th electric vehicle, in kWh
k E V S E , t The factor that determines the level of power consumed by a given charging point in hour t
k t D E M A correction coefficient indicating the trend towards an increase or decrease in the electricity demand of the studied facility
N u E V The total set of electric vehicles
P 1 h L I M The value of hourly power that can be consumed by a given end user, in kW
P O V E R , t Power overruns in each hour of the year t, in kW
P t ,   E V S E D E M Power drawn from all charging points in the facility, in kW
P t ,   G R G E N Generated capacity of distributed generation technologies at the analyzed facility, in kW
P t F A C The power balance of the facility under study, at hour t, in kW
P t D E M One-h power demand of the studied facility, in kW
S O C n The state of charge of the n-th vehicle’s battery
T E C H i The set of distributed generation technologies planned for operation at the analyzed facility
t Hour of the year
u E V n Vector describing the parameters of the n-th electric vehicle
y f Target year of investment in the distributed generation technologies or charging points
y p l Year for which we have historical electricity consumption data

Abbreviations

BESSBattery storage system
DLMDynamic load management
DSRDemand-side response
EMSEnergy management system
EVElectric vehicle
EVSEElectric vehicle supply equipment
ICTInformation and communication technologies
LOLELoss of load expectation
PVPhotovoltaic installation
RESRenewable energy source
SCSmart charging
SOCState of charge
TSOTransmission system operator
V2BVehicle to building
V2GVehicle to grid
V2HVehicle to home
V2XVehicle to everything

References

  1. Kola-Bezka, M. One Size Fits All? Prospects for Developing a Common Strategy Supporting European Union Households in Times of Energy Crisis. Energy Rep. 2023, 10, 319–332. [Google Scholar] [CrossRef]
  2. Zakeri, B.; Paulavets, K.; Barreto-Gomez, L.; Echeverri, L.G.; Pachauri, S.; Boza-Kiss, B.; Zimm, C.; Rogelj, J.; Creutzig, F.; Ürge-Vorsatz, D.; et al. Pandemic, War, and Global Energy Transitions. Energies 2022, 15, 6114. [Google Scholar] [CrossRef]
  3. Simshauser, P. The 2022 Energy Crisis: Fuel Poverty and the Impact of Policy Interventions in Australia’s National Electricity Market. Energy Econ. 2023, 121, 106660. [Google Scholar] [CrossRef]
  4. Parag, Y.; Fawcett, T.; Hampton, S.; Eyre, N. Energy Saving in a Hurry: A Research Agenda and Guidelines to Study European Responses to the 2022–2023 Energy Crisis. Energy Res. Soc. Sci. 2023, 97, 102999. [Google Scholar] [CrossRef]
  5. Hutter, C.; Weber, E. Russia–Ukraine War: A Note on Short-Run Production and Labour Market Effects of the Energy Crisis. Energy Policy 2023, 183. [Google Scholar] [CrossRef]
  6. Fabra, N. Reforming European Electricity Markets: Lessons from the Energy Crisis. Energy Econ. 2023, 126, 106963. [Google Scholar] [CrossRef]
  7. The Council of The European Union. Council Regulation (EU) 2022/1369 of 5 August 2022 on Coordinated Demand-Reduction Measures for Gas; The Council of The European Union: Brussels, Belgium, 2022.
  8. Corbos, R.A.; Bunea, O.I.; Jiroveanu, D.C. The Effects of the Energy Crisis on the Energy-Saving Behavior of Young People. Energy Strategy Rev. 2023, 49, 101184. [Google Scholar] [CrossRef]
  9. Arndt, C. Climate Change vs. Energy Security? The Conditional Support for Energy Sources among Western Europeans. Energy Policy 2023, 174, 113471. [Google Scholar] [CrossRef]
  10. Mišík, M. The EU Needs to Improve Its External Energy Security. Energy Policy 2022, 165, 112930. [Google Scholar] [CrossRef]
  11. Hauenstein, C.; Braunger, I.; Krumm, A.; Oei, P.Y. Overcoming Political Stalemates: The German Stakeholder Commission on Phasing out Coal. Energy Res. Soc. Sci. 2023, 103, 103203. [Google Scholar] [CrossRef]
  12. Walk, P.; Stognief, N. From Coal Phase-out to Net Zero: Driving Factors of UK Climate Policy. Environ. Sci. Policy 2022, 138, 76–84. [Google Scholar] [CrossRef]
  13. Selje, T. Comparing the German Exit of Nuclear and Coal: Assessing Historical Pathways and Energy Phase-out Dimensions. Energy Res. Soc. Sci. 2022, 94, 102883. [Google Scholar] [CrossRef]
  14. Bigerna, S.; Ceccacci, F.; Micheli, S.; Polinori, P. Between Saying and Doing for Ensuring Energy Resources Supply: The Case of Italy in Time of Crisis. Resour. Policy 2023, 85, 103782. [Google Scholar] [CrossRef]
  15. Sokołowski, J.; Frankowski, J.; Mazurkiewicz, J.; Lewandowski, P. Hard Coal Phase-out and the Labour Market Transition Pathways: The Case of Poland. Environ. Innov. Soc. Transit. 2022, 43, 80–98. [Google Scholar] [CrossRef]
  16. Paska, J.; Surma, T.; Terlikowski, P.; Zagrajek, K. Electricity Generation from Renewable Energy Sources in Poland as a Part of Commitment to the Polish and EU Energy Policy. Energies 2020, 13, 4261. [Google Scholar] [CrossRef]
  17. Nosko, A.; Mišík, M. Each One for Themselves: Exploring the Energy Security Paradox of the European Union. Energy Res. Soc. Sci. 2023, 99, 103074. [Google Scholar] [CrossRef]
  18. ACER. Security of EU Electricity Supply in 2021; ACER: Ljubljana, Slovenia, 2022. [Google Scholar]
  19. Siskos, P.; Capros, P.; De Vita, A. CO2 and Energy Efficiency Car Standards in the EU in the Context of a Decarbonisation Strategy: A Model-Based Policy Assessment. Energy Policy 2015, 84, 22–34. [Google Scholar] [CrossRef]
  20. Hedegaard, K.; Ravn, H.; Juul, N.; Meibom, P. Effects of Electric Vehicles on Power Systems in Northern Europe. Energy 2012, 48, 356–368. [Google Scholar] [CrossRef]
  21. Amiri, A.; Zolfagharinia, H.; Amin, S.H. A Robust Multi-Objective Routing Problem for Heavy-Duty Electric Trucks with Uncertain Energy Consumption. Comput. Ind. Eng. 2023, 178, 109108. [Google Scholar] [CrossRef]
  22. Bac, U.; Erdem, M. Optimization of Electric Vehicle Recharge Schedule and Routing Problem with Time Windows and Partial Recharge: A Comparative Study for an Urban Logistics Fleet. Sustain. Cities Soc. 2021, 70, 102883. [Google Scholar] [CrossRef]
  23. Ahn, H.; Wang, Z.; Shen, H.; Zhou, X.; Wang, J. A Two-Stage Genetic Algorithm for Battery Sizing and Route Optimization of Medium-Duty Electric Delivery Fleets. IFAC-PapersOnLine 2022, 55, 50–55. [Google Scholar] [CrossRef]
  24. Kłos, M.; Marchel, P.; Paska, J.; Bielas, R.; Błȩdzińska, M.; Michalski, L.; Wróblewski, K.; Zagrajek, K. Forecast and Impact of Electromobility Development on the Polish Electric Power System. In Proceedings of the E3S Web of Conferences, Podlesice, Poland, 18–20 December 2019; Volume 84. [Google Scholar]
  25. Zagrajek, K.; Sosnowski, Ł.; Biczel, P.; Wróblewski, K. Operation of Electrical Vehicles Fast Charging Stations in Warsaw—Case Study of InnogyGO! Collecting Point. Prz. Elektrotechniczny 2020, 96, 22–27. [Google Scholar] [CrossRef]
  26. Golla, N.K.; Sudabattula, S.K. Impact of Plug-in Electric Vehicles on Grid Integration with Distributed Energy Resources: A Comprehensive Review on Methodology of Power Interaction and Scheduling. Mater. Today Proc. 2021. [Google Scholar] [CrossRef]
  27. Gilleran, M.; Bonnema, E.; Woods, J.; Mishra, P.; Doebber, I.; Hunter, C.; Mitchell, M.; Mann, M. Impact of Electric Vehicle Charging on the Power Demand of Retail Buildings. Adv. Appl. Energy 2021, 4, 100062. [Google Scholar] [CrossRef]
  28. Manríquez, F.; Sauma, E.; Aguado, J.; de la Torre, S.; Contreras, J. The Impact of Electric Vehicle Charging Schemes in Power System Expansion Planning. Appl. Energy 2020, 262, 114527. [Google Scholar] [CrossRef]
  29. Kłos, M.; Zagrajek, K.; Biczel, P.; Sosnowski, Ł. Issues Related to the Connection to the Distribution Network of Electric Bus Charging Stations. Prz. Elektrotechniczny 2019, 95, 177–181. [Google Scholar] [CrossRef]
  30. Lemeski, A.T.; Ebrahimi, R.; Zakariazadeh, A. Optimal Decentralized Coordinated Operation of Electric Vehicle Aggregators Enabling Vehicle to Grid Option Using Distributed Algorithm. J. Energy Storage 2022, 54, 105213. [Google Scholar] [CrossRef]
  31. Alonso, M.; Amaris, H.; Germain, J.G.; Galan, J.M. Optimal Charging Scheduling of Electric Vehicles in Smart Grids by Heuristic Algorithms. Energies 2014, 7, 2449–2475. [Google Scholar] [CrossRef]
  32. Tulpule, P.J.; Marano, V.; Yurkovich, S.; Rizzoni, G. Economic and Environmental Impacts of a PV Powered Workplace Parking Garage Charging Station. Appl. Energy 2013, 108, 323–332. [Google Scholar] [CrossRef]
  33. Thomas, D.; Deblecker, O.; Ioakimidis, C.S. Optimal Operation of an Energy Management System for a Grid-Connected Smart Building Considering Photovoltaics’ Uncertainty and Stochastic Electric Vehicles’ Driving Schedule. Appl. Energy 2018, 210, 1188–1206. [Google Scholar] [CrossRef]
  34. Nunes, P.; Figueiredo, R.; Brito, M.C. The Use of Parking Lots to Solar-Charge Electric Vehicles. Renew. Sustain. Energy Rev. 2016, 66, 679–693. [Google Scholar] [CrossRef]
  35. Istok, R.; Kadar, P.; Reizer, L. Solar Carport with Energy Storage Capabilities. In Proceedings of the 2021 IEEE 4th International Conference and Workshop Óbuda on Electrical and Power Engineering (CANDO-EPE), Budapest, Hungary, 17–18 November 2021; pp. 89–94. [Google Scholar] [CrossRef]
  36. Khoso, A.A.; Baloch, M.H.; Raza, A.; Ali, I.; Shaikh, M.Z. The Development of Solar Powered Carport Canopies for the Charging Infrastructure of Electric Vehicles. In Proceedings of the 2022 International Conference on Emerging Technologies in Electronics, Computing and Communication (ICETECC), Jamshoro, Pakistan, 7–9 December 2022; pp. 1–6. [Google Scholar] [CrossRef]
  37. Ghotge, R.; van Wijk, A.; Lukszo, Z. Off-Grid Solar Charging of Electric Vehicles at Long-Term Parking Locations. Energy 2021, 227, 120356. [Google Scholar] [CrossRef]
  38. Aparicio, M.J.; Grijalva, S. Economic Assessment of V2B and V2G for an Office Building. In Proceedings of the 2020 52nd North American Power Symposium (NAPS), Tempe, AZ, USA, 11–13 April 2021. [Google Scholar] [CrossRef]
  39. Ahsan, S.M.; Khan, H.A.; Hassan, N.U. Optimized Power Dispatch for Smart Building(s) and Electric Vehicles with V2X Operation. Energy Rep. 2022, 8, 10849–10867. [Google Scholar] [CrossRef]
  40. Pearre, N.S.; Ribberink, H. Review of Research on V2X Technologies, Strategies, and Operations. Renew. Sustain. Energy Rev. 2019, 105, 61–70. [Google Scholar] [CrossRef]
  41. Raczkowski, R.; Robak, S. System Magazynowania Energii Elektrycznej Jako Środek Poprawy Elastyczności Systemu Elektroenergetycznego z Dużym Udziałem Generacji OZE. Przegląd Elektrotechniczny 2021, 1, 3–10. [Google Scholar] [CrossRef]
  42. Koh, L.H.; Yong, G.Z.; Peng, W.; Tseng, K.J. Impact of Energy Storage and Variability of PV on Power System Reliability. Energy Procedia 2013, 33, 302–310. [Google Scholar] [CrossRef]
  43. Paska, J.; Marchel, P. Bezpieczeństwo Elektroenergetyczne i Niezawodność Zasilania Energią Elektryczną; Oficyna Wydawnicza Politechniki Warszawskiej: Warszawa, Poland, 2021; ISBN 978-83-8156-181-5. [Google Scholar]
  44. Polskie Sieci Elektroenergetyczne Balancing the Power System. Available online: https://www.pse.pl/jak-funkcjonuje-krajowy-system-elektroenergetyczny/bilansowanie-systemu (accessed on 9 October 2023). (In Polish).
  45. The Regulation of the Minister of Energy of 18th July 2018 on the Execution, Settling and Demonstrating the Capacity Obligation and Concluding Transactions on the Secondary Market. 2018. Available online: https://isap.sejm.gov.pl/isap.nsf/DocDetails.xsp?id=WDU20180001455 (accessed on 17 December 2023)(In Polish).
  46. ENTSO-E European Network of Transmission System Operators for Electricity European Resource Adequacy Assessment. 2021. Available online: https://www.entsoe.eu/outlooks/eraa/2021/ (accessed on 17 December 2023).
  47. The European Parliament; The Council of the European Union. Regulation (EU) 2019/943 of the European Parliament and of the Council of 5 June 2019 on the Internal Market for Electricity; The Council of The European Union: Brussels, Belgium, 2019; Volume 62, pp. 54–191.
  48. Polskie Sieci Elektroenergetyczne Development Plan for Covering Future Electricity Demand from 2023 to 2032; Konstancin—Jeziorna. 2022. Available online: https://www.pse.pl/documents/20182/291785a3-7832-4cb6-a5ae-971d29024b82 (accessed on 17 December 2023). (In Polish).
  49. Wolf, A.; Wenzel, L. Welfare Implications of Power Rationing: An Application to Germany. Energy 2015, 84, 53–62. [Google Scholar] [CrossRef]
  50. Chedid, R.; Sawwas, A.; Fares, D. Optimal Design of a University Campus Micro-Grid Operating under Unreliable Grid Considering PV and Battery Storage. Energy 2020, 200, 117510. [Google Scholar] [CrossRef]
  51. Zagrajek, K.; Kłos, M.; Rasolomampionona, D.D.; Lewandowski, M.; Pawlak, K.; Baran, Ł.; Barcz, T.; Kołaczyński, P.; Suchecki, W. Investing in Distributed Generation Technologies at Polish University Campuses during the Energy Transition Era. Energies 2023, 16, 4575. [Google Scholar] [CrossRef]
  52. Nazari, S.; Borrelli, F.; Stefanopoulou, A. Electric Vehicles for Smart Buildings: A Survey on Applications, Energy Management Methods, and Battery Degradation. Proc. IEEE 2021, 109, 1128–1144. [Google Scholar] [CrossRef]
  53. Li, S.; Xie, F.; Huang, Y.; Lin, Z.; Liu, C. Optimizing Workplace Charging Facility Deployment and Smart Charging Strategies. Transp. Res. Part D Transp. Environ. 2020, 87, 102481. [Google Scholar] [CrossRef]
  54. Van Der Meer, D.; Mouli, G.R.C.; Mouli, G.M.E.; Elizondo, L.R.; Bauer, P. Energy Management System with PV Power Forecast to Optimally Charge EVs at the Workplace. IEEE Trans. Ind. Inform. 2018, 14, 311–320. [Google Scholar] [CrossRef]
  55. Ding, Y.; Zhu, Y.; Wang, Q.; Tian, Z.; Yan, R.; Yan, Z.; Xia, X. A Comprehensive Scheduling Model for Electric Vehicles in Office Buildings Considering the Uncertainty of Charging Load. Int. J. Electr. Power Energy Syst. 2023, 151, 109154. [Google Scholar] [CrossRef]
  56. Buresh, K.M.; Apperley, M.D.; Booysen, M.J. Three Shades of Green: Perspectives on at-Work Charging of Electric Vehicles Using Photovoltaic Carports. Energy Sustain. Dev. 2020, 57, 132–140. [Google Scholar] [CrossRef]
  57. George-Williams, H.; Wade, N.; Carpenter, R.N. A Probabilistic Framework for the Techno-Economic Assessment of Smart Energy Hubs for Electric Vehicle Charging. Renew. Sustain. Energy Rev. 2022, 162, 112386. [Google Scholar] [CrossRef]
  58. Jaganath, M.M.; Ray, S.; Choudhury, N.B.D. Eco-Friendly Microgrid Carport Charging Station for Electric Vehicles (EVs). e-Prime Adv. Electr. Eng. Electron. Energy 2023, 5, 100196. [Google Scholar] [CrossRef]
  59. Wilson, J.O.N.; Lie, T.T. Off-Grid EV Charging Stations to Reduce the Impact of Charging Demand on the Electricity Grid. In Proceedings of the 2022 7th IEEE Workshop on the Electronic Grid (eGRID), Auckland, New Zealand, 29 November–2 December 2022; pp. 1–5. [Google Scholar] [CrossRef]
  60. Kubli, M. EV Drivers’ Willingness to Accept Smart Charging: Measuring Preferences of Potential Adopters. Transp. Res. Part D Transp. Environ. 2022, 109, 103396. [Google Scholar] [CrossRef]
  61. Unterluggauer, T.; Hipolito, F.; Rich, J.; Marinelli, M.; Andersen, P.B. Impact of Cost-Based Smart Electric Vehicle Charging on Urban Low Voltage Power Distribution Networks. Sustain. Energy Grids Networks 2023, 35, 101085. [Google Scholar] [CrossRef]
  62. Huang, P.; Tu, R.; Zhang, X.; Han, M.; Sun, Y.; Hussain, S.A.; Zhang, L. Investigation of Electric Vehicle Smart Charging Characteristics on the Power Regulation Performance in Solar Powered Building Communities and Battery Degradation in Sweden. J. Energy Storage 2022, 56, 105907. [Google Scholar] [CrossRef]
  63. Fachrizal, R.; Shepero, M.; van der Meer, D.; Munkhammar, J.; Widén, J. Smart Charging of Electric Vehicles Considering Photovoltaic Power Production and Electricity Consumption: A Review. eTransportation 2020, 4, 100056. [Google Scholar] [CrossRef]
  64. Thompson, A.W.; Perez, Y. Vehicle-to-Everything (V2X) Energy Services, Value Streams, and Regulatory Policy Implications. Energy Policy 2020, 137, 111136. [Google Scholar] [CrossRef]
  65. Pang, C.; Dutta, P.; Kezunovic, M. BEVs/PHEVs as Dispersed Energy Storage for V2B Uses in the Smart Grid. IEEE Trans. Smart Grid 2012, 3, 473–482. [Google Scholar] [CrossRef]
  66. Gough, R.; Dickerson, C.; Rowley, P.; Walsh, C. Vehicle-to-Grid Feasibility: A Techno-Economic Analysis of EV-Based Energy Storage. Appl. Energy 2017, 192, 12–23. [Google Scholar] [CrossRef]
  67. Noel, L.; McCormack, R. A Cost Benefit Analysis of a V2G-Capable Electric School Bus Compared to a Traditional Diesel School Bus. Appl. Energy 2014, 126, 246–255. [Google Scholar] [CrossRef]
  68. He, Z.; Khazaei, J.; Freihaut, J.D. Optimal Integration of Vehicle to Building (V2B) and Building to Vehicle (B2V) Technologies for Commercial Buildings. Sustain. Energy Grids Networks 2022, 32, 100921. [Google Scholar] [CrossRef]
  69. Zagrajek, K. A Survey Data Approach for Determining the Probability Values of Vehicle-to-Grid Service Provision. Energies 2021, 14, 7270. [Google Scholar] [CrossRef]
  70. Chai, Y.T.; Che, H.S.; Tan, C.K.; Tan, W.N.; Yip, S.C.; Gan, M.T. A Two-Stage Optimization Method for Vehicle to Grid Coordination Considering Building and Electric Vehicle User Expectations. Int. J. Electr. Power Energy Syst. 2023, 148, 108984. [Google Scholar] [CrossRef]
  71. Buonomano, A. Building to Vehicle to Building Concept: A Comprehensive Parametric and Sensitivity Analysis for Decision Making Aims. Appl. Energy 2020, 261, 114077. [Google Scholar] [CrossRef]
  72. Tostado-Véliz, M.; León-Japa, R.S.; Jurado, F. Optimal Electrification of Off-Grid Smart Homes Considering Flexible Demand and Vehicle-to-Home Capabilities. Appl. Energy 2021, 298, 117184. [Google Scholar] [CrossRef]
  73. Barone, G.; Buonomano, A.; Calise, F.; Forzano, C.; Palombo, A. Building to Vehicle to Building Concept toward a Novel Zero Energy Paradigm: Modelling and Case Studies. Renew. Sustain. Energy Rev. 2019, 101, 625–648. [Google Scholar] [CrossRef]
  74. Millner, A.; Smith, C.; Limpaecher, E.; Ayers, G.; Valentine, S.; Paradiso, R.; Dydek, V.E.; Ross, W. Plug in Electric Vehicles and the Grid. In Proceedings of the 2014 IEEE NewNEB DC Utility Power Conference and Exhibition (NewNEB), Ronkonkoma, NY, USA, 27–28 October 2014; pp. 2–7. [Google Scholar] [CrossRef]
  75. Deb, S.; Ammar, E.A.A.; AlRajhi, H.; Alsaidan, I.; Shariff, S.M. V2G Pilot Projects: Review and Lessons Learnt. In Developing Charging Infrastructure and Technologies for Electric Vehicles; IGI Global: Hershey, PA, USA, 2021; pp. 252–267. [Google Scholar]
  76. Warmerdam, J.; Hoogt, J.v.d.; Kotter, R. Final Report—Johan Cruijff ArenA Operational Pilot; Interreg, North Sea Region: Viborg, Denmark, 2020. [Google Scholar]
  77. V2G Hub M-Tech Labo Project. Available online: https://www.v2g-hub.com/projects/m-tech-labo (accessed on 12 December 2023).
  78. ABB. ABB in Ground-Breaking Pilot with Electric Vehicles (EV) as Power Banks in Trondheim. Available online: https://new.abb.com/news/detail/88086/abb-in-ground-breaking-pilot-with-electric-vehicles-ev-as-power-banks-in-trondheim (accessed on 12 December 2023).
  79. Kester, J.; Noel, L.; Zarazua de Rubens, G.; Sovacool, B.K. Promoting Vehicle to Grid (V2G) in the Nordic Region: Expert Advice on Policy Mechanisms for Accelerated Diffusion. Energy Policy 2018, 116, 422–432. [Google Scholar] [CrossRef]
  80. Saberbari, E.; Saboori, H.; Saboori, S. Utilizing PHEVs for Peak-Shaving, Loss Reduction and Voltage Profile Improvement via V2b Mode. In Proceedings of the 2014 19th Conference on Electrical Power Distribution Networks (EPDC), Tehran, Iran, 6–7 May 2014; pp. 59–65. [Google Scholar] [CrossRef]
  81. Hinov, N.; Dimitrov, V.; Vacheva, G. Model for Vehicle to Home System with Additional Energy Storage for Households. Electronics 2021, 10, 1085. [Google Scholar] [CrossRef]
  82. Zafar, B.; Ben Slama, S.A. PV-EV Integrated Home Energy Management Using Vehicle-to-Home (V2H) Technology and Household Occupant Behaviors. Energy Strategy Rev. 2022, 44, 101001. [Google Scholar] [CrossRef]
  83. Zhou, Y.; Cao, S. Energy Flexibility Investigation of Advanced Grid-Responsive Energy Control Strategies with the Static Battery and Electric Vehicles: A Case Study of a High-Rise Office Building in Hong Kong. Energy Convers. Manag. 2019, 199, 111888. [Google Scholar] [CrossRef]
  84. Buonomano, A.; Calise, F.; Cappiello, F.L.; Palombo, A.; Vicidomini, M. Dynamic Analysis of the Integration of Electric Vehicles in Efficient Buildings Fed by Renewables. Appl. Energy 2019, 245, 31–50. [Google Scholar] [CrossRef]
  85. Ioakimidis, C.S.; Thomas, D.; Rycerski, P.; Genikomsakis, K.N. Peak Shaving and Valley Filling of Power Consumption Profile in Non-Residential Buildings Using an Electric Vehicle Parking Lot. Energy 2018, 148, 148–158. [Google Scholar] [CrossRef]
  86. Alinejad, M.; Rezaei, O.; Kazemi, A.; Bagheri, S. An Optimal Management for Charging and Discharging of Electric Vehicles in an Intelligent Parking Lot Considering Vehicle Owner’s Random Behaviors. J. Energy Storage 2021, 35, 102245. [Google Scholar] [CrossRef]
  87. Donateo, T.; Congedo, P.M.; Malvoni, M.; Ingrosso, F.; Laforgia, D.; Ciancarelli, F. An Integrated Tool to Monitor Renewable Energy Flows and Optimize the Recharge of a Fleet of Plug-in Electric Vehicles in the Campus of the University of Salento: Preliminary Results. IFAC Proc. Vol. 2014, 19, 7861–7866. [Google Scholar] [CrossRef]
  88. Zhou, Y.; Cao, S.; Hensen, J.L.M.; Lund, P.D. Energy Integration and Interaction between Buildings and Vehicles: A State-of-the-Art Review. Renew. Sustain. Energy Rev. 2019, 114, 109337. [Google Scholar] [CrossRef]
  89. Noel, L.; de Rubens, G.Z.; Kester, J.; Sovacool, B.K. Vehicle-to-Grid a Sociotechnical Transition beyond Electric Mobility; Palgrave Macmillan: Londono, UK, 2019; ISBN 978-3-030-04864-8. [Google Scholar]
  90. Zagrajek, K.; Paska, J.; Sosnowski, Ł.; Gobosz, K.; Wróblewski, K. Framework for the Introduction of Vehicle-to-Grid Technology into the Polish Electricity Market. Energies 2021, 14, 3673. [Google Scholar] [CrossRef]
  91. Regulation of the Council of Governments of November 8, 2021 on Detailed Rules and Procedures for Introducing Restrictions on the Sale of Solid Fuels and on the Supply and Consumption of Electricity or Heat. 2021. Available online: https://isap.sejm.gov.pl/isap.nsf/DocDetails.xsp?id=WDU20210002209 (accessed on 17 December 2023).
  92. Richardson, D.B. Encouraging Vehicle-to-Grid (V2G) Participation through Premium Tariff Rates. J. Power Sources 2013, 243, 219–224. [Google Scholar] [CrossRef]
  93. Zheng, Y.; Yu, H.; Shao, Z.; Jian, L. Day-Ahead Bidding Strategy for Electric Vehicle Aggregator Enabling Multiple Agent Modes in Uncertain Electricity Markets. Appl. Energy 2020, 280, 115977. [Google Scholar] [CrossRef]
  94. Giordano, F.; Arrigo, F.; Diaz-Londono, C.; Spertino, F.; Ruiz, F. Forecast-Based V2G Aggregation Model for Day-Ahead and Real-Time Operations. In Proceedings of the 2020 IEEE Power & Energy Society Innovative Smart Grid Technologies Conference (ISGT), Washington, DC, USA, 17–20 February 2020. [Google Scholar]
  95. Polskie Sieci Elektroenergetyczne Power Supply Tiers in Poland. Available online: https://www.pse.pl/jak-funkcjonuje-krajowy-system-elektroenergetyczny/stopnie-zasilania (accessed on 12 December 2023). (In Polish).
  96. Wang, D.; Coignard, J.; Zeng, T.; Zhang, C.; Saxena, S. Quantifying Electric Vehicle Battery Degradation from Driving vs. Vehicle-to-Grid Services. J. Power Sources 2016, 332, 193–203. [Google Scholar] [CrossRef]
  97. Mehlig, D.; ApSimon, H.; Staffell, I. Emissions from Charging Electric Vehicles in the UK. Transp. Res. Part D Transp. Environ. 2022, 110, 103430. [Google Scholar] [CrossRef]
  98. Sovacool, B.K.; Kester, J.; Noel, L.; Zarazua de Rubens, G. Actors, Business Models, and Innovation Activity Systems for Vehicle-to-Grid (V2G) Technology: A Comprehensive Review. Renew. Sustain. Energy Rev. 2020, 131, 109963. [Google Scholar] [CrossRef]
  99. Pareschi, G.; Küng, L.; Georges, G.; Boulouchos, K. Are Travel Surveys a Good Basis for EV Models? Validation of Simulated Charging Profiles against Empirical Data. Appl. Energy 2020, 275, 115318. [Google Scholar] [CrossRef]
Figure 1. Values of the LOLE indicator for 2023–2030 based on the data from the Polish transmission system operator [48].
Energies 17 00018 g001
Figure 2. General block diagram of the proposed methodology.
Energies 17 00018 g002
Figure 3. Block diagram of the proposed approach of using EVs as a countermeasure during power supply constraints.
Energies 17 00018 g003
Figure 4. Satellite image of the WUT’s main campus.
Energies 17 00018 g004
Figure 5. Schematic diagram of the power supply system at the Warsaw University of Technology’s main campus, including the plans for refurbishment with regard to Concept 4 presented in [51].
Energies 17 00018 g005
Figure 6. Forecast of annual electricity demand at the WUT’s main campus from 2023 to 2030.
Energies 17 00018 g006
Figure 7. Number of constraints eliminated through the use of smart charging technology during the 12th power supply tier for the WUT’s main campus.
Energies 17 00018 g007
Figure 8. Number of constraints eliminated through the use of smart charging technology during the 16th power supply tier for the WUT’s main campus.
Energies 17 00018 g008
Figure 9. Number of constraints eliminated through the use of smart charging technology during the 20th power supply tier for the WUT’s main campus.
Energies 17 00018 g009
Table 1. Electrical data of the power sources that have been planned to be installed at the WUT’s main campus under Concept 4 [51].
Distributed Generation TechnologyCapacity (kW)Estimated Yearly Generation of Electricity (MWh)
Rooftop PV power plant320334.364
Parking shelter (carport) PV power plant650730.029
Micro wind turbines3071.582
Gas power plant8006240.000
Table 2. Daily demand and distributed generation electricity production profiles of the WUT’s main campus without the EVSE.
HourDemand 2023 (MWh)Demand 2027 (MWh)Demand 2030 (MWh)Generation Rooftop PV (kWh)Generation Parking Shelter PV (kWh)Generation Wind Turbines (kWh)Generation Gas Turbine (kWh)
Energies 17 00018 i001Energies 17 00018 i001Energies 17 00018 i001Energies 17 00018 i001Energies 17 00018 i001Energies 17 00018 i001☼/Energies 17 00018 i001
11.581.421.851.662.081.870.000.000.000.000.003.57800
21.571.401.841.642.071.840.000.000.000.000.007.24800
31.571.391.831.632.061.830.000.000.000.000.592.32800
41.561.371.831.612.061.810.001.670.003.654.614.43800
51.561.401.831.632.051.840.009.380.0020.471.692.19800
61.611.511.881.772.121.990.0018.040.0039.382.493.52800
71.801.702.111.982.372.230.0053.720.00117.302.856.10800
82.001.992.342.322.642.610.0057.530.00125.618.605.53800
92.412.192.822.563.182.8815.3480.8433.49176.5020.125.82800
102.702.373.162.773.553.1219.62124.8642.83272.607.051.41800
112.892.503.382.933.803.3029.70209.3364.85457.056.332.25800
122.922.543.412.983.843.3599.76179.66217.82392.252.2615.73800
132.942.593.443.033.873.4188.16163.66192.49357.312.4519.79800
142.942.583.443.013.873.3995.73160.96209.01351.433.986.97800
152.842.433.322.843.733.1937.4494.9181.73207.211.6022.46800
162.712.203.172.583.562.905.00135.8410.92296.570.0013.21800
172.482.012.912.353.272.650.0071.660.00156.457.567.33800
182.221.842.602.152.922.420.0023.320.0050.913.196.58800
191.981.672.321.962.612.200.0010.640.0023.230.0016.82800
201.801.572.111.842.372.070.002.660.005.810.616.64800
211.681.531.961.792.212.010.000.000.000.000.000.70800
221.601.451.871.702.111.910.000.000.000.000.910.00800
231.521.431.781.682.001.890.000.000.000.000.000.00800
241.511.421.771.661.991.870.000.000.000.005.440.00800
Table 3. Maximal power values for polish end users in each power supply tier based on [91].
Power Supply TierMaximal Power to Be Drawn from the Grid (kW)
11 P C O N —contracted power (with DSO)
12 P 1 h , m n m a x ¯
13 ÷ 19 ( P 1 h , m n m a x ¯ , P 1 h , m n m i n ¯ ) ; each tier is reduced by P 1 h , m n m a x ¯ P 1 h , m n m i n ¯ 8
20 P 1 h , m n m i n ¯
Table 4. Maximal power values for the WUT’s main campus in each power supply tier in 2023, 2027, and 2030.
Power Supply TierMaximal Power in 2023 (kW)Maximal Power in 2027 (kW)Maximal Power in 2030 (kW)
114600.004600.004600.00
122574.163011.413387.42
132413.722823.723176.30
142253.282636.022965.17
152092.842448.332754.04
161932.402260.642542.91
171771.972072.952331.79
181611.531885.262120.66
191451.091697.571909.53
201290.651509.871698.40
Table 5. Relationship between the coefficient k E V S E , t and the reduction power of EV charging stations.
k E V S E , t The Rate of Reduction in the Power Demand of Charging Stations, k E V S E , t , j R E D (%)
0 100 %
0.2575%
0.550%
0.7525%
10%
Table 6. Overruns of contracted power at the WUT’s main campus in the 12th power supply tier in 2023, 2027, and 2030.
Hour12th Power Supply Tier Overruns 2023 (MW)12th Power Supply Tier Overruns 2027 (MW)12th Power Supply Tier Overruns 2030 (MW)
Energies 17 00018 i001Energies 17 00018 i001Energies 17 00018 i001
10.000.000.000.000.000.00
20.000.000.000.000.000.00
30.000.000.000.000.000.00
40.000.000.000.000.000.00
50.000.000.000.000.000.00
60.000.000.000.000.000.00
70.000.000.000.000.000.00
80.000.000.000.000.000.00
90.000.000.000.000.000.00
100.000.000.000.000.000.00
110.000.000.000.000.020.00
120.000.000.000.000.000.00
130.000.000.000.000.000.00
140.000.000.000.000.000.00
150.000.000.000.000.000.00
160.000.000.000.000.000.00
170.000.000.000.000.000.00
180.000.000.000.000.000.00
190.000.000.000.000.000.00
200.000.000.000.000.000.00
210.000.000.000.000.000.00
220.000.000.000.000.000.00
230.000.000.000.000.000.00
240.000.000.000.000.000.00
Table 7. Overruns of contracted power at the WUT’s main campus in the 16th power supply tier in 2023, 2027, and 2030.
Hour16th Power Supply Tier Overruns 2023 (MW)16th Power Supply Tier Overruns 2027 (MW)16th Power Supply Tier Overruns 2030 (MW)
Energies 17 00018 i001Energies 17 00018 i001Energies 17 00018 i001
10.000.000.000.000.000.00
20.000.000.000.000.000.00
30.000.000.000.000.000.00
40.000.000.000.000.000.00
50.000.000.000.000.000.00
60.000.000.000.000.000.00
70.000.000.000.000.000.00
80.000.000.000.000.000.00
90.120.000.210.000.280.00
100.410.000.540.000.650.00
110.570.000.730.000.870.00
120.380.000.550.000.690.00
130.440.000.610.000.760.04
140.410.000.580.000.730.04
150.500.000.650.000.780.04
160.470.000.600.000.710.00
170.000.000.000.000.000.00
180.000.000.000.000.000.00
190.000.000.000.000.000.00
200.000.000.000.000.000.00
210.000.000.000.000.000.00
220.000.000.000.000.000.00
230.000.000.000.000.000.00
240.000.000.000.000.000.00
Table 8. Overruns of contracted power at the WUT’s main campus in the 20th power supply tier in 2023, 2027, and 2030.
Hour20th Power Supply Tier Overruns 2023 (MW)20th Power Supply Tier Overruns 2027 (MW)20th Power Supply Tier Overruns 2030 (MW)
Energies 17 00018 i001Energies 17 00018 i001Energies 17 00018 i001
10.000.000.000.000.000.00
20.000.000.000.000.000.00
30.000.000.000.000.000.00
40.000.000.000.000.000.00
50.000.000.000.000.000.00
60.000.000.000.000.000.00
70.000.000.000.000.000.00
80.420.220.540.340.640.44
90.770.350.960.501.120.63
101.050.391.290.571.490.73
111.210.261.480.461.710.64
121.020.381.300.591.530.77
131.080.471.360.691.600.89
141.050.481.330.701.570.88
151.140.521.400.721.630.88
161.110.181.350.331.560.47
170.390.000.590.000.760.00
180.130.000.280.000.420.00
190.000.000.010.000.110.00
200.000.000.000.000.000.00
210.000.000.000.000.000.00
220.000.000.000.000.000.00
230.000.000.000.000.000.00
240.000.000.000.000.000.00
Table 9. Overruns of contracted power at the WUT’s main campus in the 16th power supply tier in 2023, 2027, and 2030 after using smart charging technology.
Hour16th Power Supply Tier Overruns 2023 (MW)16th Power Supply Tier Overruns 2027 (MW)16th Power Supply Tier Overruns 2030 (MW)
Energies 17 00018 i001Energies 17 00018 i001Energies 17 00018 i001
1000000
2000000
3000000
4000000
5000000
6000000
7000000
8000000
9000000
10000.0800.190
110.1000.2700.410
12000.0800.230
13000.1500.290
14000.1200.260
150.0300.1900.320
160.0100.1400.250
17000000
18000000
19000000
20000000
21000000
22000000
23000000
24000000
Table 10. Overruns of contracted power at the WUT’s main campus in the 20th power supply tier in 2023, 2027, and 2030 after using smart charging technology.
Hour20th Power Supply Tier Overruns 2023 (MW)20th Power Supply Tier Overruns 2027 (MW)20th Power Supply Tier Overruns 2030 (MW)
Energies 17 00018 i001Energies 17 00018 i001Energies 17 00018 i001
1000000
2000000
3000000
4000000
5000000
6000000
7000000
8000.0800.180
90.3000.490.040.660.17
100.5900.830.111.030.27
110.7501.020.0011.250.18
120.5600.830.131.070.31
130.620.010.900.231.140.42
140.590.020.870.231.110.42
150.680.060.940.251.160.42
160.6500.8901.100.004
170.3900.5900.760
180.1300.2800.420
19000.0100.110
20000000
21000000
22000000
23000000
24000000
Table 11. Overruns of contracted power at the WUT’s main campus in the 16th power supply tier in 2023, 2027, and 2030 after using the smart charging and V2B technologies.
Hour16th Power Supply Tier Overruns 2023 (MW)16th Power Supply Tier Overruns 2027 (MW)16th Power Supply Tier Overruns 2030 (MW)
Energies 17 00018 i001Energies 17 00018 i001Energies 17 00018 i001
1000000
2000000
3000000
4000000
5000000
6000000
7000000
8000000
9000000
10000000
11000.2700.410
1200000.150
13000.1500.290
14000.0100.260
15000.1900.320
16000.1400.250
17000000
18000000
19000000
20000000
21000000
22000000
23000000
24000000
Table 12. Overruns of contracted power at the WUT’s main campus in the 20th power supply tier in 2023, 2027, and 2030 after using the smart charging and V2B technologies.
Hour20th Power Supply Tier Overruns 2023 (MW)20th Power Supply Tier Overruns 2027 (MW)20th Power Supply Tier Overruns 2030 (MW)
Energies 17 00018 i001Energies 17 00018 i001Energies 17 00018 i001
1000000
2000000
3000000
4000000
5000000
6000000
7000000
800000.020
90.1600.4900.660
100.5900.8301.030.27
110.7501.0201.250.08
120.5600.830.011.070.31
130.6200.900.231.140.42
140.5900.870.231.110.42
150.6800.940.251.160.42
160.6500.8901.100
170.39*00.5900.760
18000.1000.420
19000000
20000000
21000000
22000000
23000000
24000000
Disclaimer/Publisher’s Note: The statements, opinions and data contained in all publications are solely those of the individual author(s) and contributor(s) and not of MDPI and/or the editor(s). MDPI and/or the editor(s) disclaim responsibility for any injury to people or property resulting from any ideas, methods, instructions or products referred to in the content.

