1. Introduction
International programs for the development of the coal industry define the purpose of and the tasks and measures involved in state policy regarding the coal industry, with this being one of the most important industries which is being targeted for substitution in the current world climate [
1]. The coal industry, having been significantly explored and coal reserves forecast, has all possibilities for the effective extraction and use of coal in order to ensure a stable provision of coal products for domestic needs and the development of export supplies [
2]. BelAZ dump trucks, as the transport in the working area of a quarry, are most exposed to the forces of pressure on the electric motors and electrical equipment, further complicating with the depth of mining conditions.
Complete traction electric motors for heavy-duty quarry machines (dump trucks, tipper trucks) began to be developed in connection with the development of open-pit mining, which requires moving significant volumes of rock mass (tens and hundreds of millions of cubic meters per year). Recently, in diagnostics for the electromechanical and electrical equipment in electric motors, methods based on the analysis of the spectrum of vibration of direct current electric machines have been applied. The system must be adapted to the diagnosed equipment and have an optimal set of software and hardware features to effectively solve the main task—trouble-free operation of the monitored object. DC traction motors are used in both trucks and passenger electric vehicles (BMW). Since they started to be produced relatively recently, long-term statistics on their failures are not presented. In general, DC machines are more commonly used as motors because they have the following advantages: high starting torque; the ability to widely adjust speed; easy to reverse; have almost linear adjustment characteristics; and are economical. Induction motors are not moisture resistant and are prone to short circuits in the lead parts of the frontal windings. TEMs are still used as exciters for synchronous generators in CHP plants.
At present, in various traction electric motor (TEM) applications, there are methods for forecasting reliability indicators, which differ by the set of problems and solutions included and the peculiarities of the mathematical apparatus applied. Thus, we can conclude that the production and long-term trouble-free operation of electric machines largely depend on the quality of the assembly units and parts used in TEM and their reliability in operation. Access to the main technological and electrical equipment is difficult during the operation of the dump truck for safety reasons, due to their design and operational features. The vibrodiagnostic measurement of defects in electric motors, which lead to a discrete vibration spectrum, is carried out mainly by the recognition of the frequency and spectrum of the vibrations in the components [
3], which are caused by defects and appear at strictly defined frequencies. In addition, the signal levels of the side frequencies often exceed the signal of the carrier frequency [
4,
5,
6]. Specialized built-in control algorithms are implemented in the system to assess the current state of the brush commutator assembly (BCA) and rolling bearings. At present, the main method used in TEM diagnostics is a preliminary assessment of the technical condition of its assembly as a result of auditory and visual perception. Independent control and measuring modules allow for the input, analysis and processing of signals and the display of calculated values, and are also responsible for notifying when permissible levels are exceeded in one or several controlled parameters. Noise, vibration and temperature increases appear in defective or excessively worn out TEM units, which are used to judge the presence of a defect [
7].
All motors operate on the principle of switching magnet forces to rotate the shaft. A DC motor uses direct current supplied to the commutator through friction brushes, switching the supplied current to the windings with alternating polarity, similar to AC, but instead uses a rectangular positive and negative voltage signal. This creates an alternating electromagnet that interacts with the permanent magnets on the rotor, constantly attracting and then repelling to provide rotational motion. AC motors are also used in heavy-duty quarry dump trucks, but to control the speed of an AC motor, a direct contactor on the line would not be sufficient [
8]. Variable frequency must be used, and this is an expensive solution for high horsepower models. A variable frequency drive (VFD) will change the frequency of the supplied AC current to change the speed of the motor. If the speed is reduced too much, the motor can overheat as the cooling fan is usually directly connected to the output shaft. One of the main advantages of a DC motor is its high performance at low speeds. They can certainly operate at high speeds as well. But, if the load and speed must be adjusted quickly at all times, or if a higher torque is required at low speeds (perhaps requiring a long time to accelerate), a DC motor would be preferable. The torque characteristics at low speeds make DC motors ideal for moving heavy loads at relatively low speeds, with large masses that require a tremendous amount of force to accelerate. All of these qualities make the DC motor the preferred traction motor for use in heavy-duty dump trucks [
9]. With the application of effective diagnostic solutions and reliability improvement, the DC traction motor remains a stable technical solution, and with the implementation of timely diagnostics, it is possible to extend the period of its operation.
The stability of complex technical systems is determined by the ability to maintain its performance both in any abnormal situations and during a long period of operation while complying with the necessary routine actions during maintenance and repairs. A modern traction motor consists of many subsystems and the stability of its operation depends on the reliability of functioning of all the elements that make up this system. The main subsystem in the DC traction motor is the brush–commutator unit, the reliability of which directly affects the stability of the entire electric motor.
Vibration diagnostic techniques have been used quite successfully to investigate defects and predict the life of AC motors. We have presented a diagnosis model for TEM. The novelty of this work lies in the development of a mathematical model for the frequency of the vibrations in the brush–commutator unit and the bearings of the DC traction motor, which would make it possible to estimate parameters such as the time of wear and failure-free operation of the brush, and determine the optimal mileage of the dump truck by the amount of brush wear, the probability of the failure-free operation of the brushes, the degree of defects developed in the unit, the residual life of the brushes compared to the permissible ultimate wear and the rate of wear on the brushes depending on the time of operation. According to the results of the model it is possible to form a conclusion about the serviceability of the brush according to its actual technical condition.
The motivation behind this work is that its results in increasing the efficiency of planning and carrying out repairs on demand, taking into account the state of the resources in the units used in the operation of traction motors of dump trucks. This contributes to a reduction in material and labor costs, the creation of a database on the processes of wear and tear and the prediction of the state of the nodes in the traction motors in dump trucks by the amount of time until failure after repair. Costs from emergency failures are reduced due to the early detection of defects and the ability to control the development of failures. At the same time, all units and brushes on traction motor wear to the minimum residual life without reducing the performance characteristics of traction motors, thus utilizing the full extent of their serviceability.
For the realization of this model, as a result of the analysis of data on the operation of traction motors in BelAZ dump trucks, it is necessary to identify the percentage of failures associated with brush wear. To determine the frequency-spectral range of the brush–commutator unit of the dump truck it is necessary to increase the reliability of diagnostic evaluations, which is achieved by controlling the actual operating modes and the diagnostic parameters (vibration, wear height, runout, clamping force) characterizing the process of degradation in the actual technical condition of the BCA unit, as well as to develop a method of vibration control for the BCA units. In turn, for this purpose, it is necessary to create an effective and convenient method of diagnosing and monitoring the vibrations in the brush–commutator units in DC traction motors, as well as to synthesize an arsenal of new methods for use in electric motor diagnostics. At the same time, the accuracy of diagnostics will increase, the possibility of remote diagnostics will be realized, the procedure of diagnostics will be simplified (not requiring the disconnection of the electric motor) and the possibility of full automation of the process of diagnostics will be provided.
2. Materials and Methods
Data on the dump truck BELAZ 75306′s operation depend on the trip number. The BELAZ mining dump trucks which have a payload capacity of 180 t and 280 t are equipped with two electric traction motors: ED-132 and EDP-800, made by LLC Sibelectroprivod (Novosibirsk city), or DK-724, made by CJSC PTFK ZTEO (Naberezhnye Chelny city). DK-724 motors are used and installed in the crankcases of the unified drive axles on dump trucks according to the design scheme that is traditional for serial domestic dump trucks. A dump truck fleet of 100 inventory units in the coal-mining city of Kemerovo was used in the experiment. Exceeding the dump truck’s allowable load, which leads to increased inrush currents and power circuit current in traction mode, requires applying more intensive braking on descents. The large inrush current flowing through the stationary collector can cause blistering on the lamellas. This allows the control room to operate without sparking and leads to accelerated wear on the brushes and the collector and, as a result, to the premature dismantling of the TEM for collector flushing.
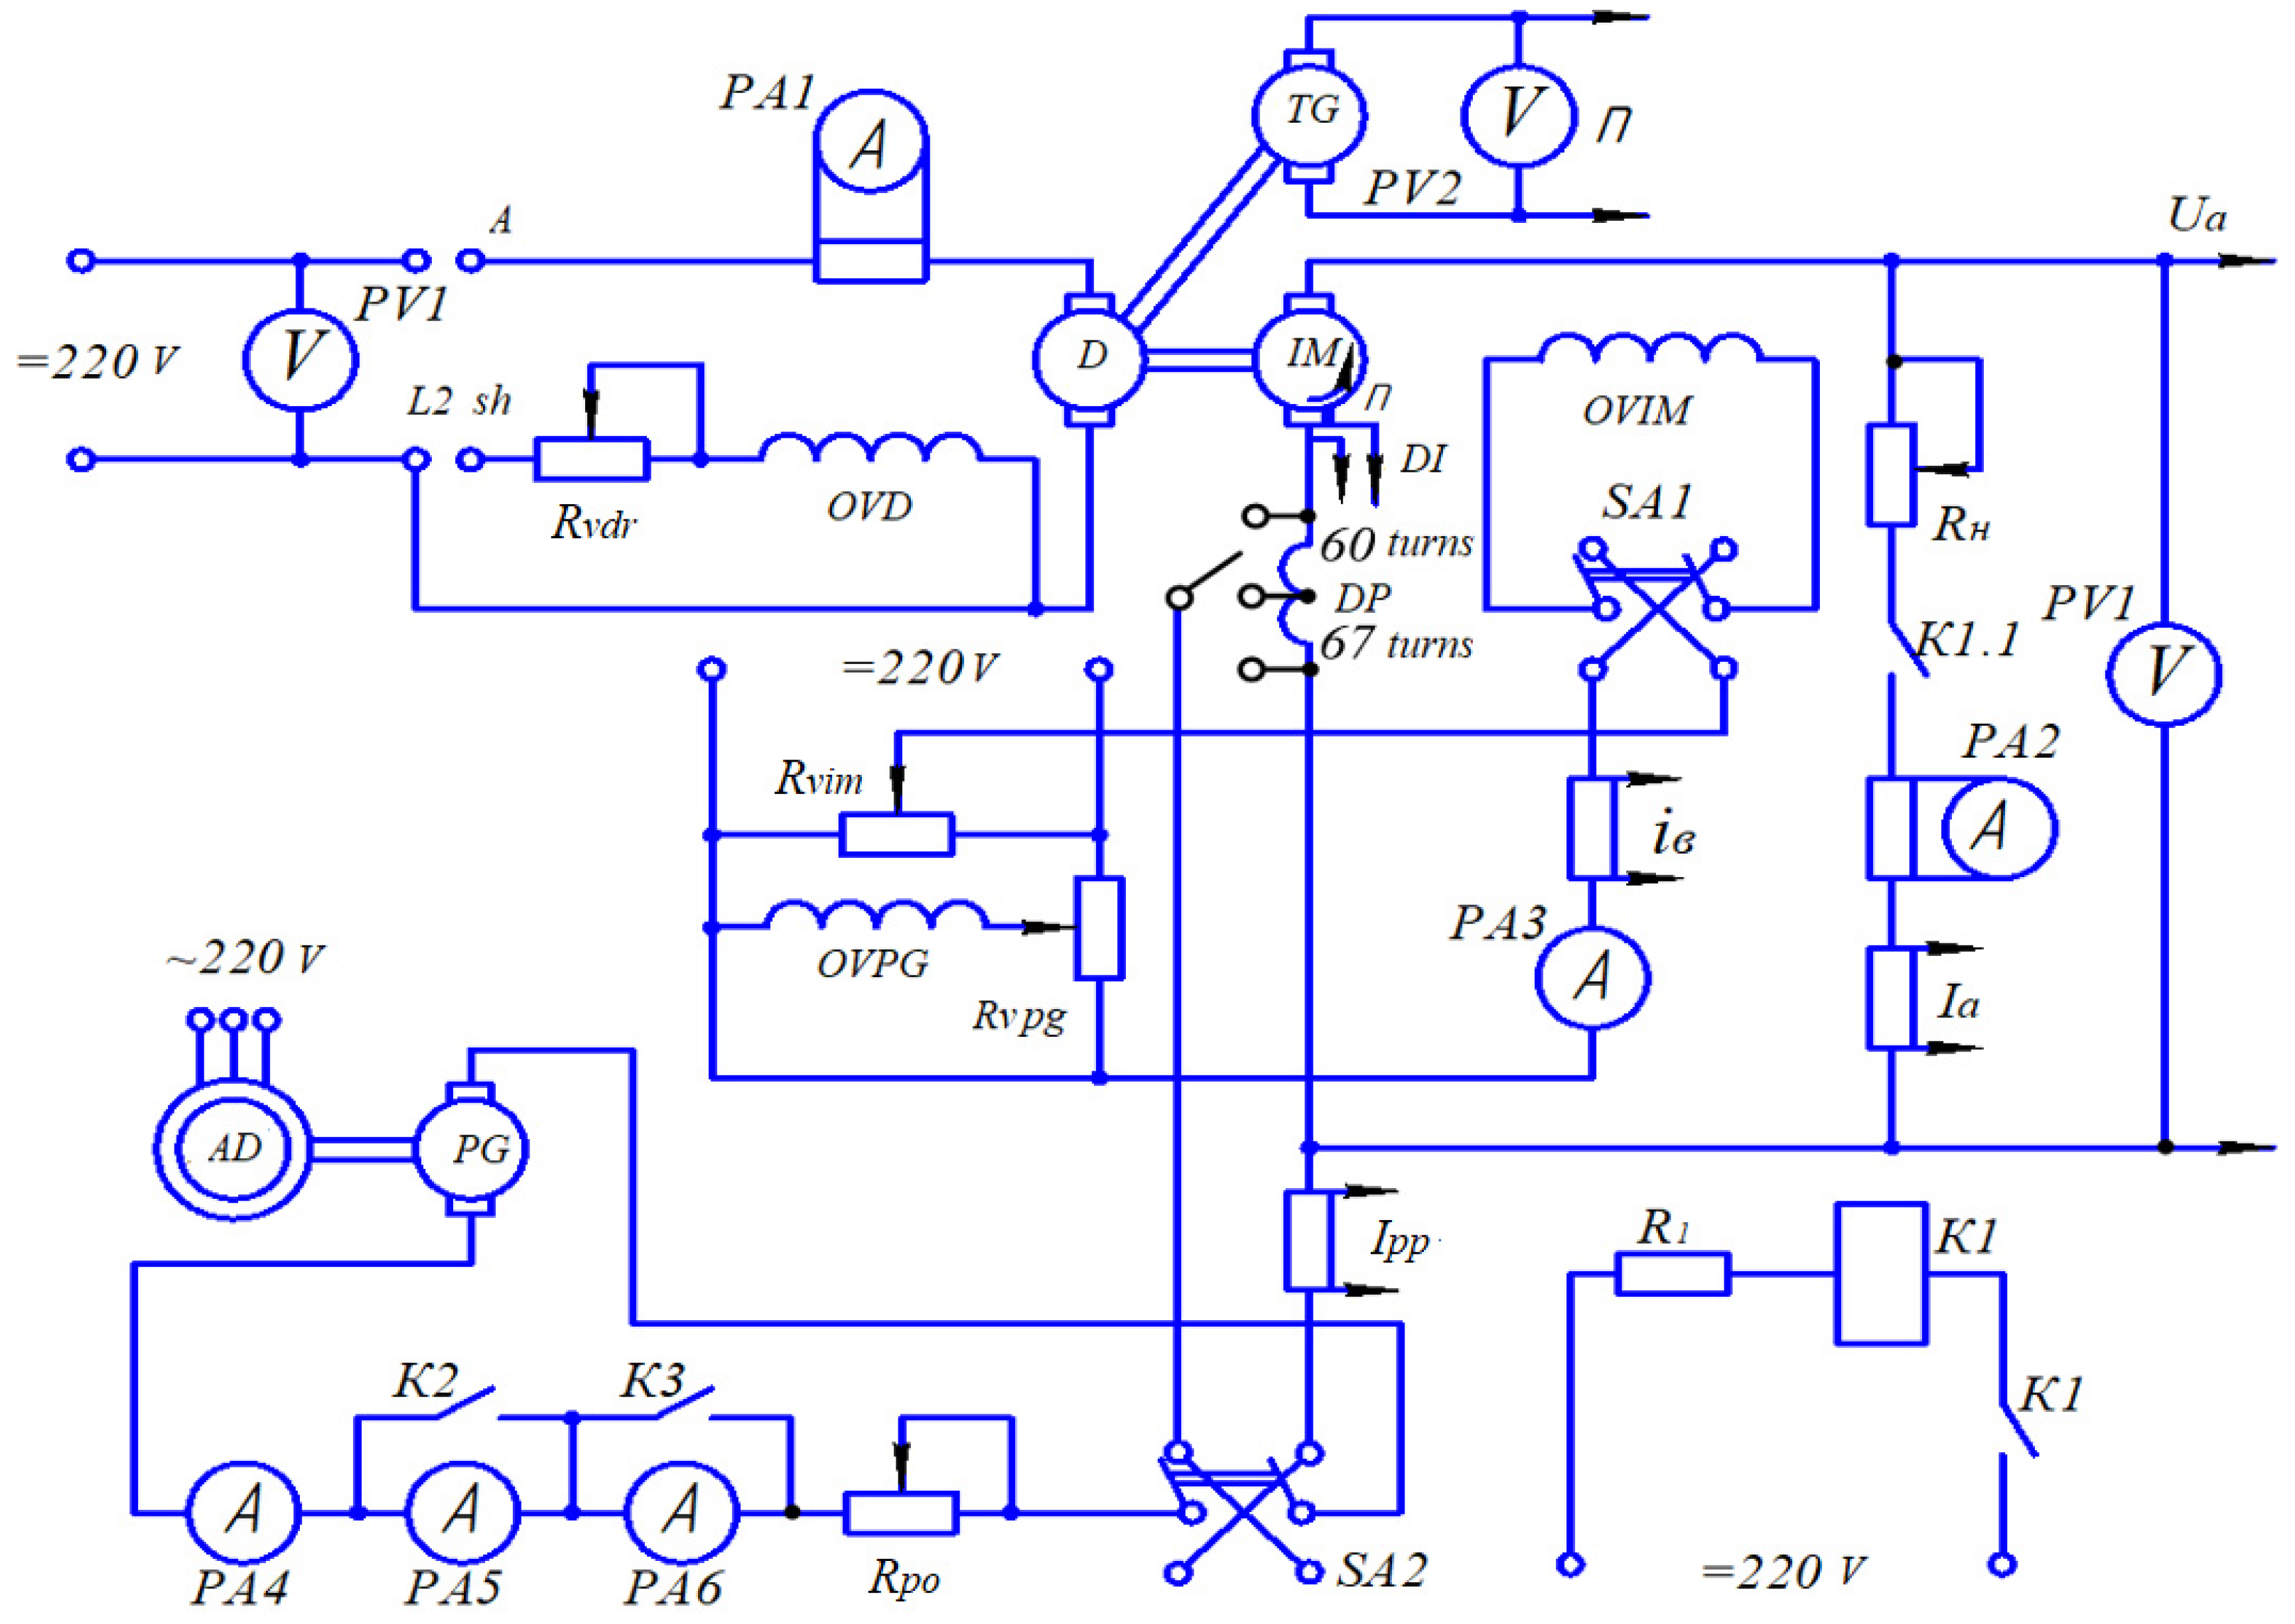
The commutation properties of brushes are evaluated by the width and position of the spark-free zones in the operating range of loads and speeds, as well as by the speed characteristics of motors taken from the determination of the commutation class.
The following measurements were foreseen: voltage drop across the brushes, armature current, auxiliary pole make-up current, speed, current density at fixed values of the number of turns of auxiliary poles and armature speed.
The electrical scheme (
Figure 1) of connections provides uniform current distribution between all samples in the test set. The instrumentation used in the tests has an accuracy class of no less than 1.5, and the accuracy of the values of circumferential velocity, normal pressure and other mechanical parameters set in the process of testing during the collector tests is within ±5% of the values determined by their specifications.
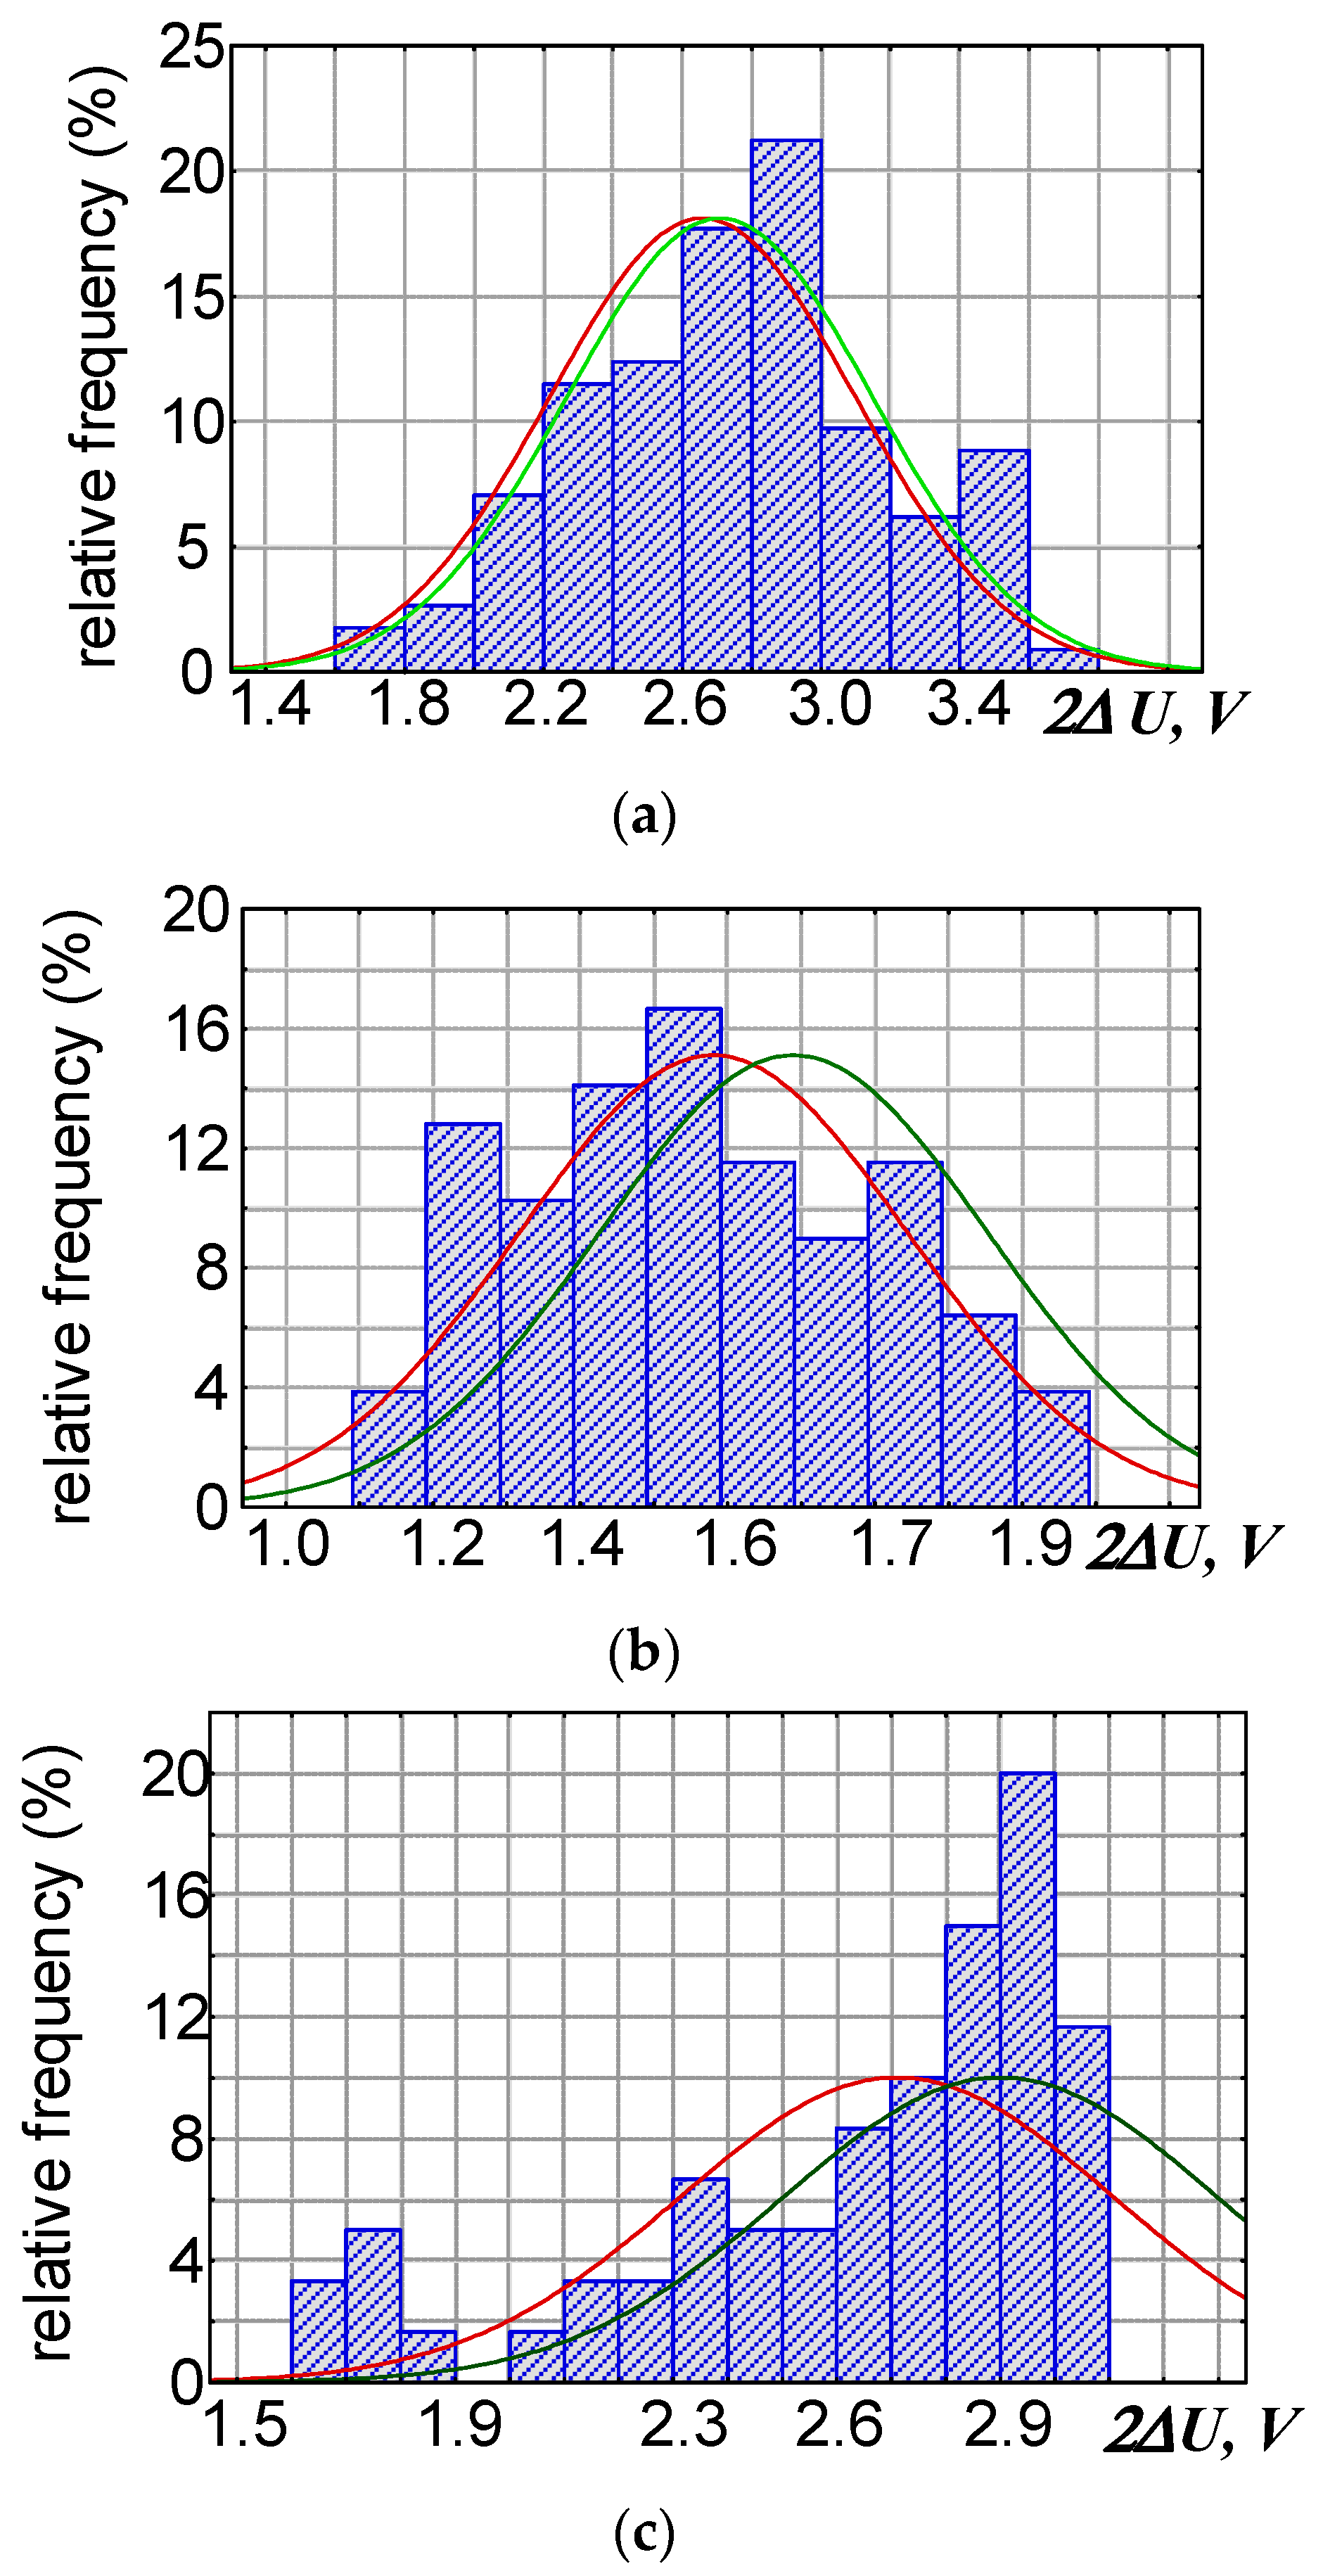
Figure 2 shows the probability density plots for the voltage drop probability distribution 2
∆U on a pair of brushes obtained after statistical processing using the program Staistica 6.0.
Thus, after processing the obtained statistical data, it was found that the increase in the total voltage drop across the pair of composite brushes does not exceed the limits of the total voltage drop of the standard brush, according to the specifications.
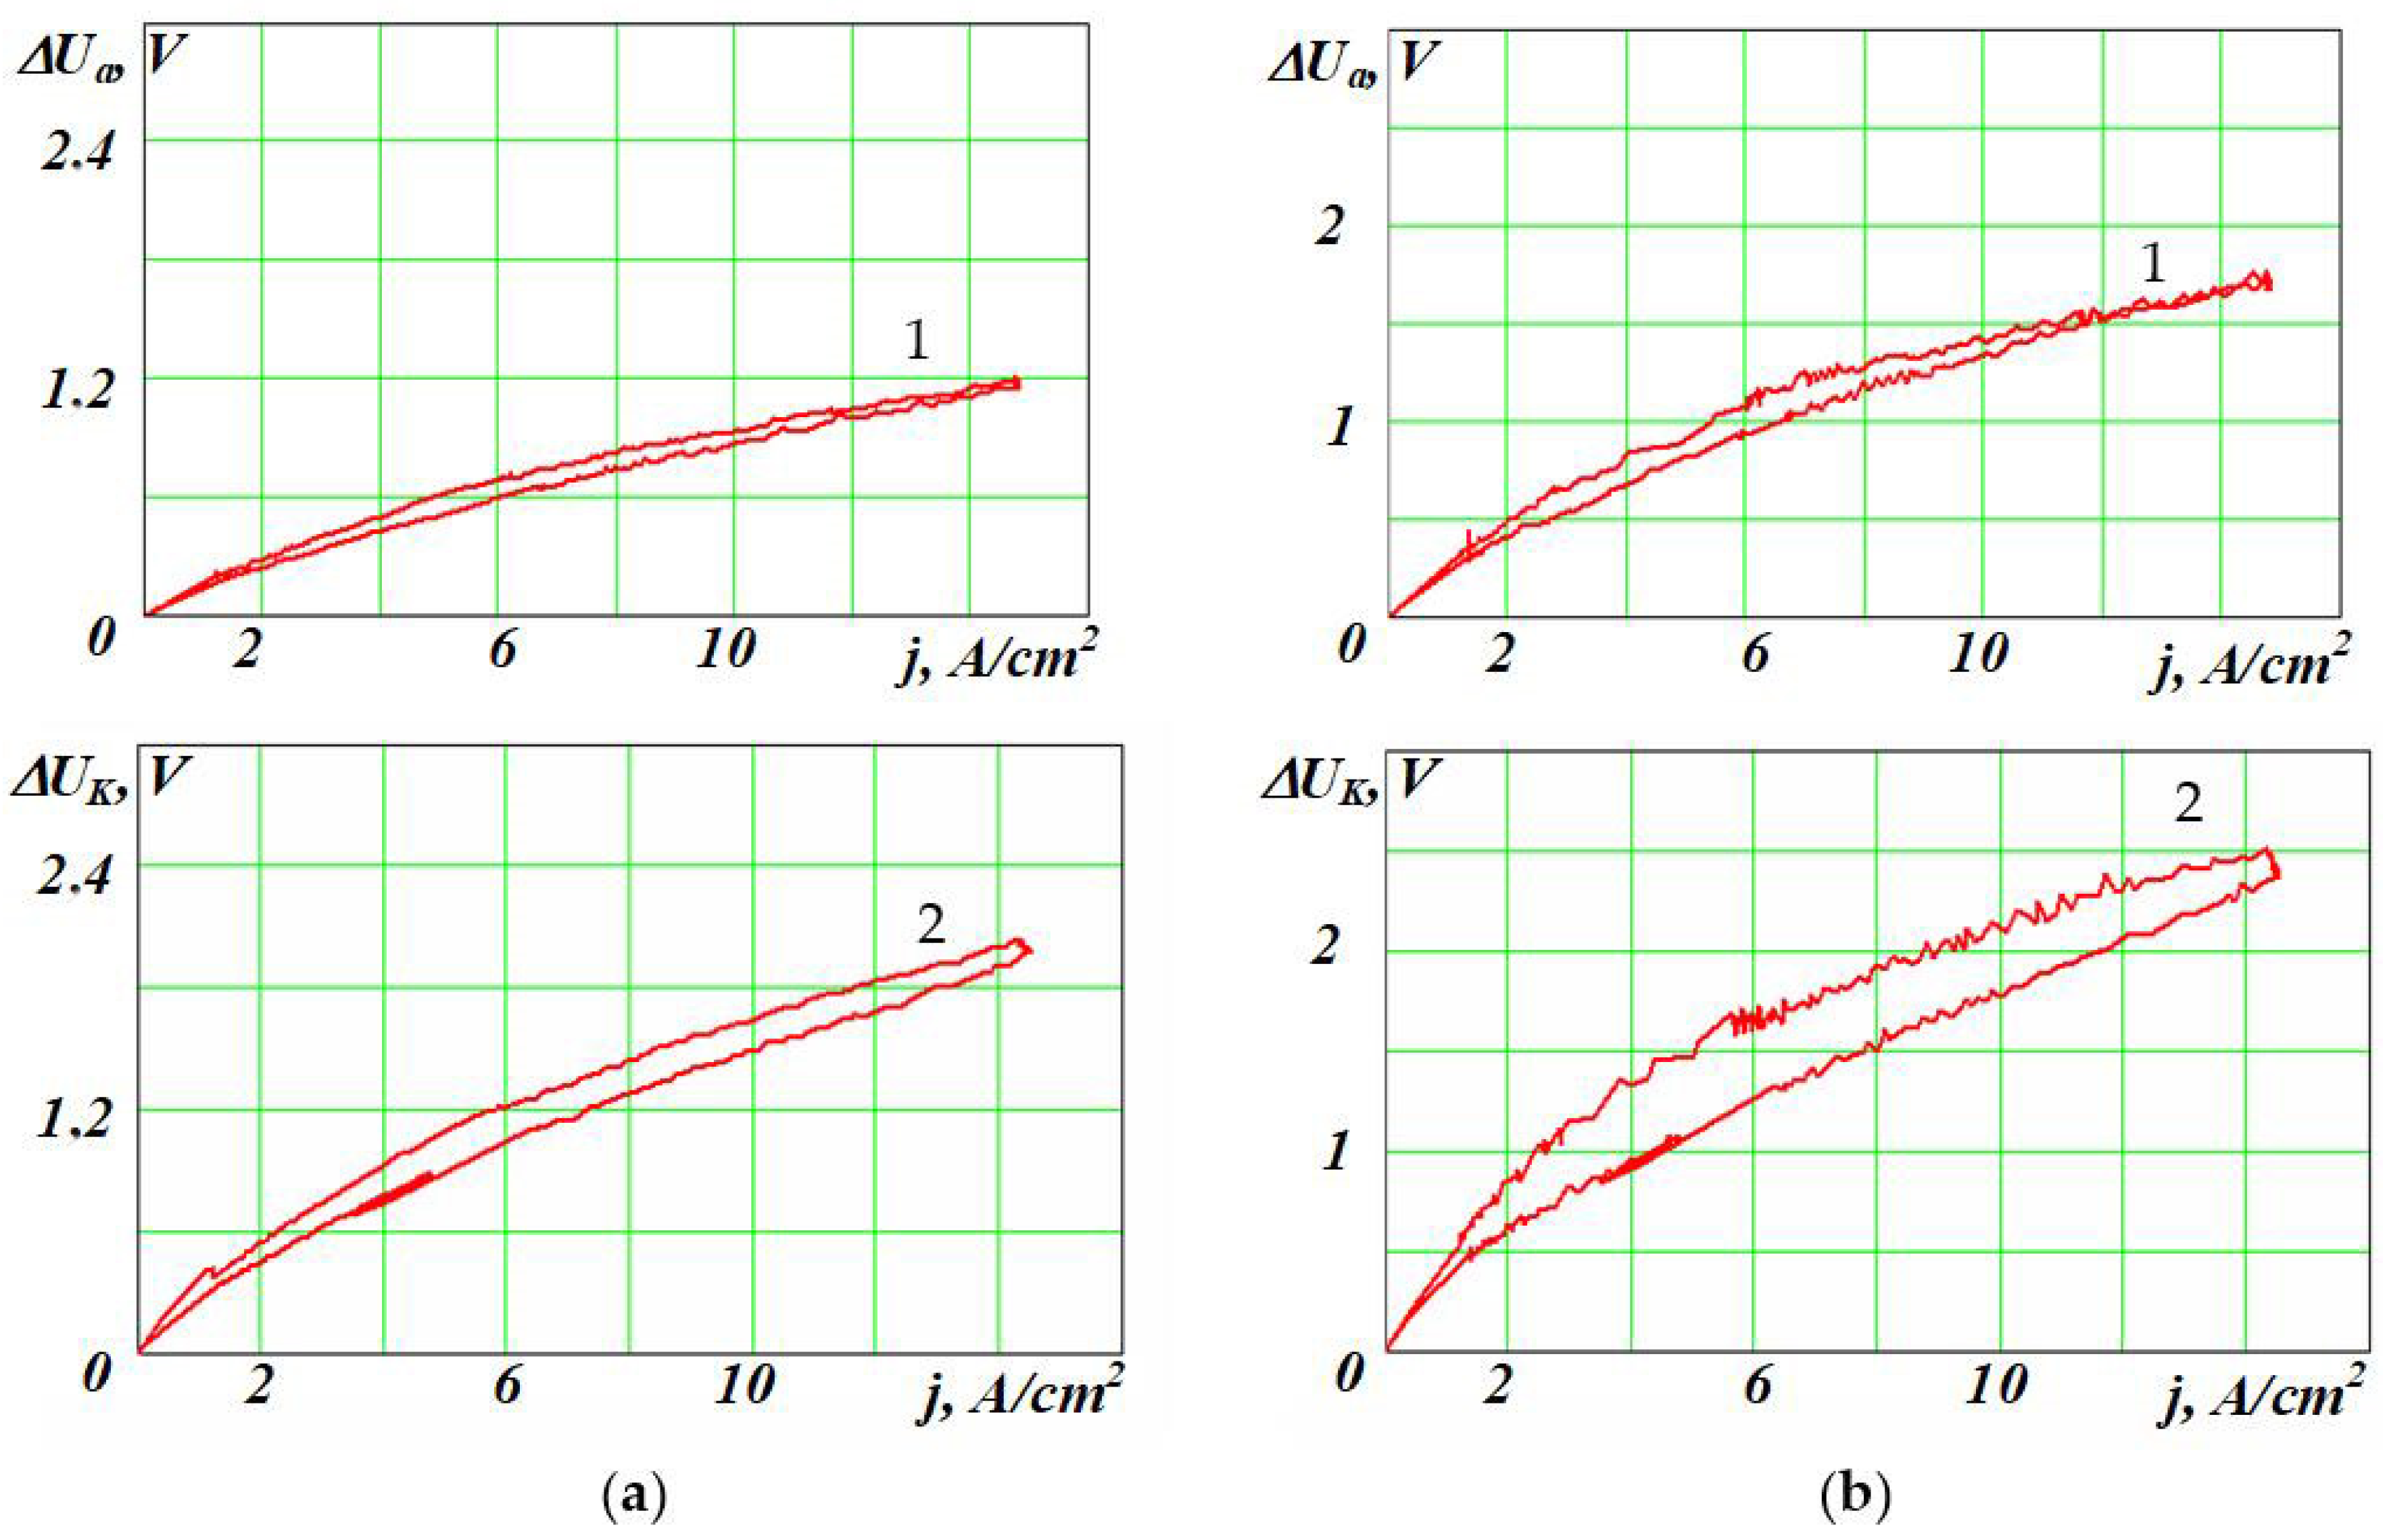
The method allows us to investigate the following characteristics of standard and split brushes: (a) sparkless operation zones; (b) volt-ampere characteristics (
Figure 3).
Figure 3 shows the brush volt-ampere characteristics (VACs) obtained during the experiment. The graphs show two branches: the upper is an ascending branch, which is obtained by increasing the armature current at a fixed value of the number of turns of additional poles, and the lower is a descending branch when the armature current decreases. Fixed values of armature speed
n =
const were also set, respectively, equal to 500, 1000 and 1500 min
−1.
The VAC of EG61A type brushes obtained during the experiment is similar to the characteristics of electrographitized brushes. The divergence of branches of the BAC characteristics is explained by different properties of the contact layer “brush-collector”, the state of polishing, temperature, etc.
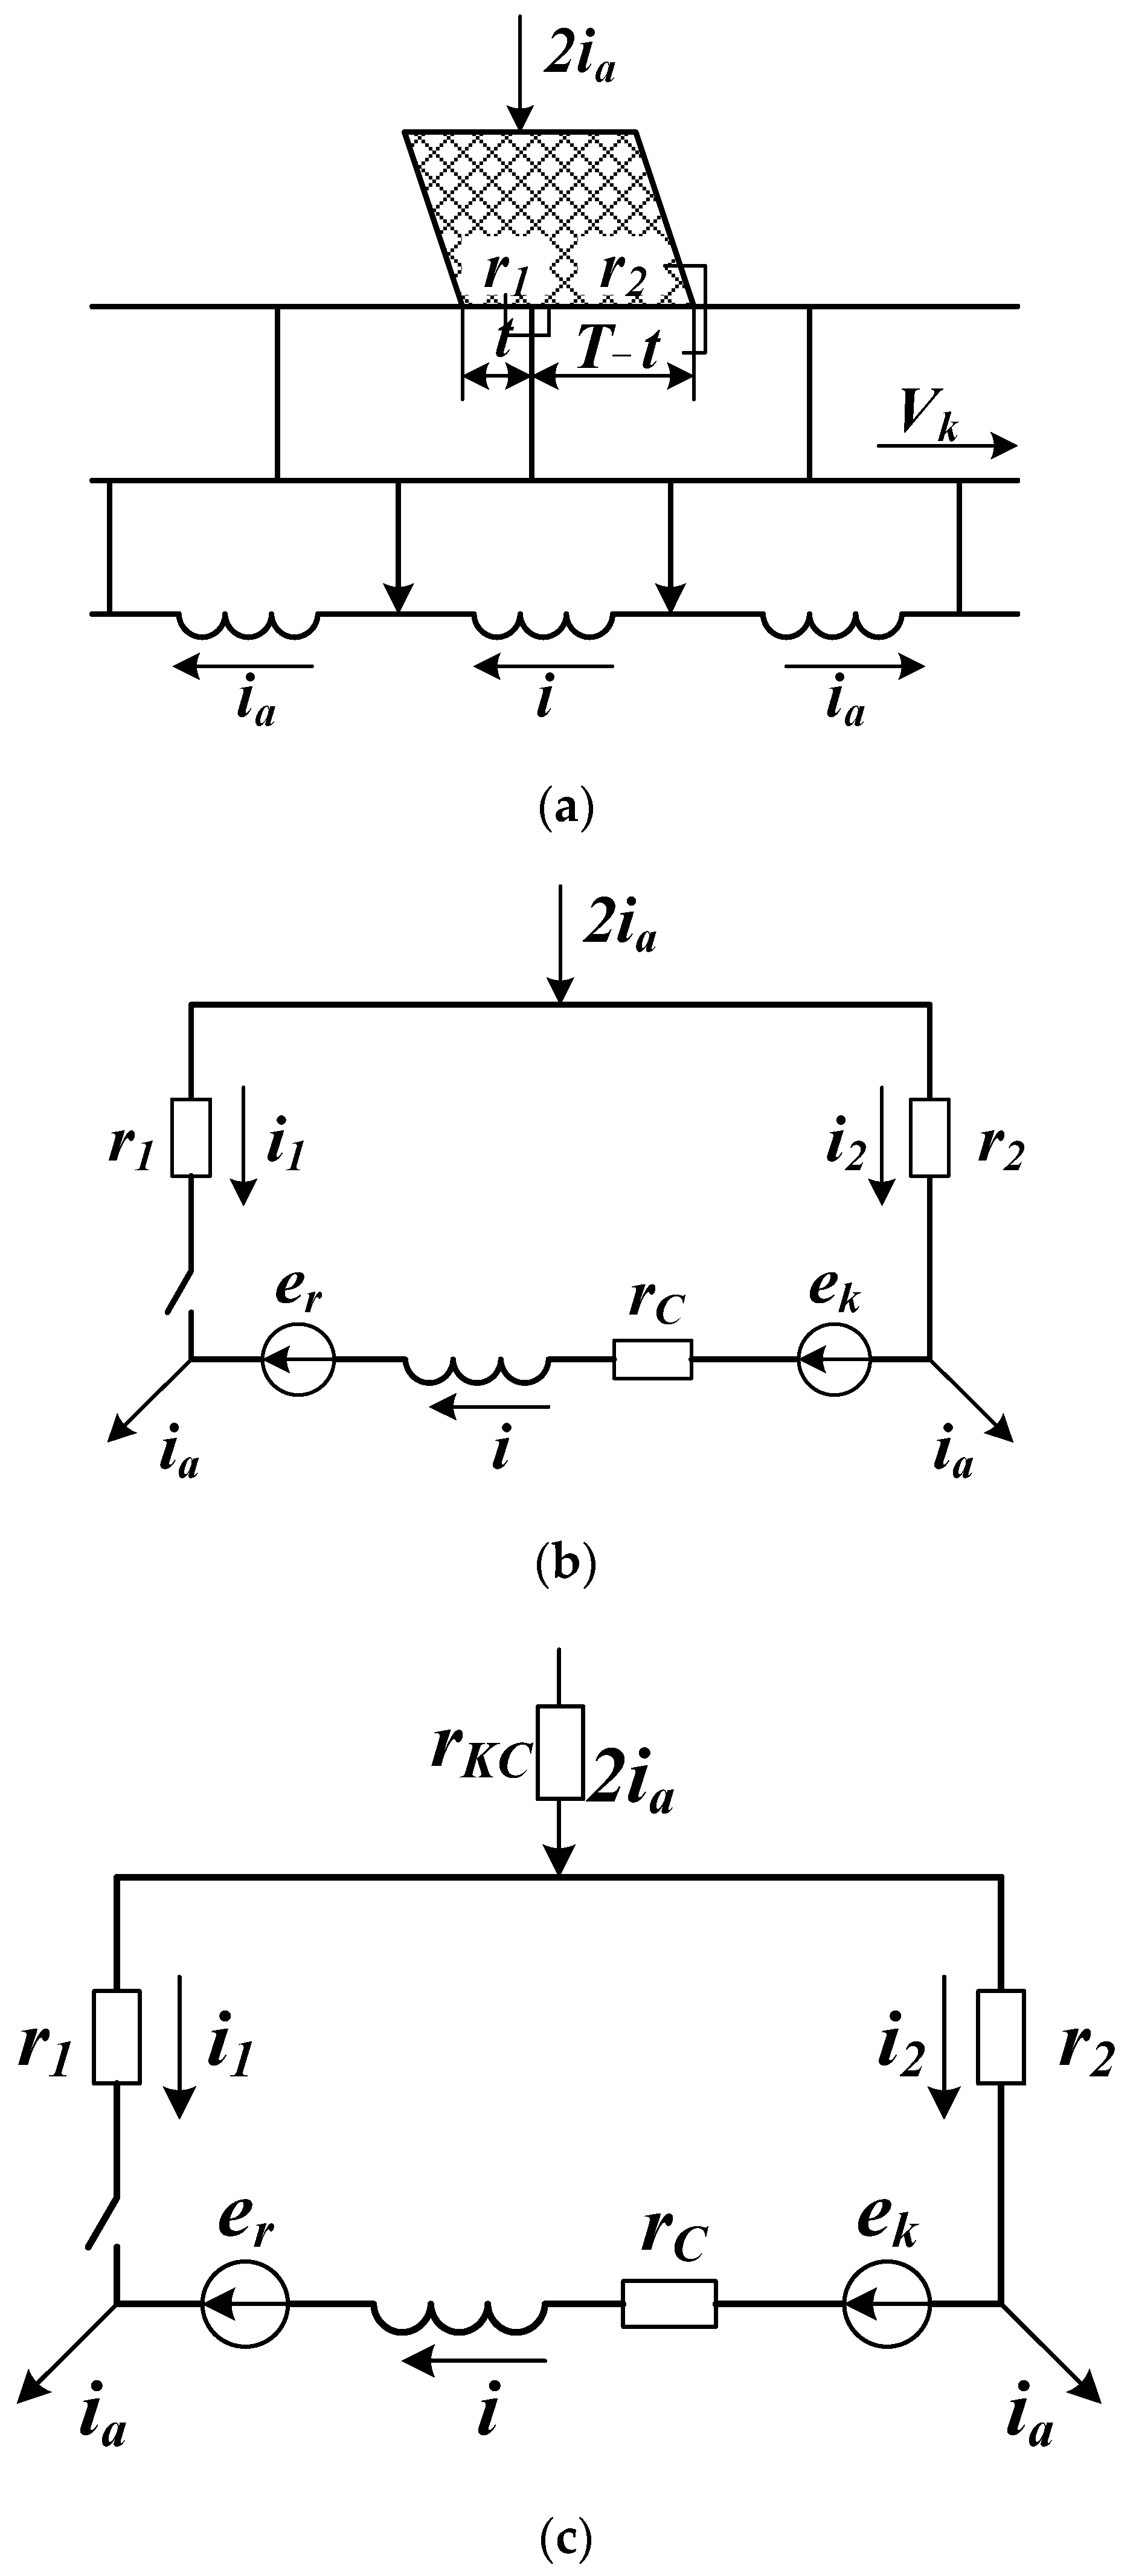
The schematic of the commutated circuit (a) and the corresponding substitution diagrams (b,c) for standard and split brushes are shown in
Figure 4. In the classical theory of commutation, the characteristic of he brush contact
rbr =
const is assumed, and the resistances of the running-in and running-out edges of the brush change inversely proportional to the contact area and are equal, respectively.
In order to solve the differential equations for the switching process, it is necessary to consider all factors that may affect the accuracy of the calculations.
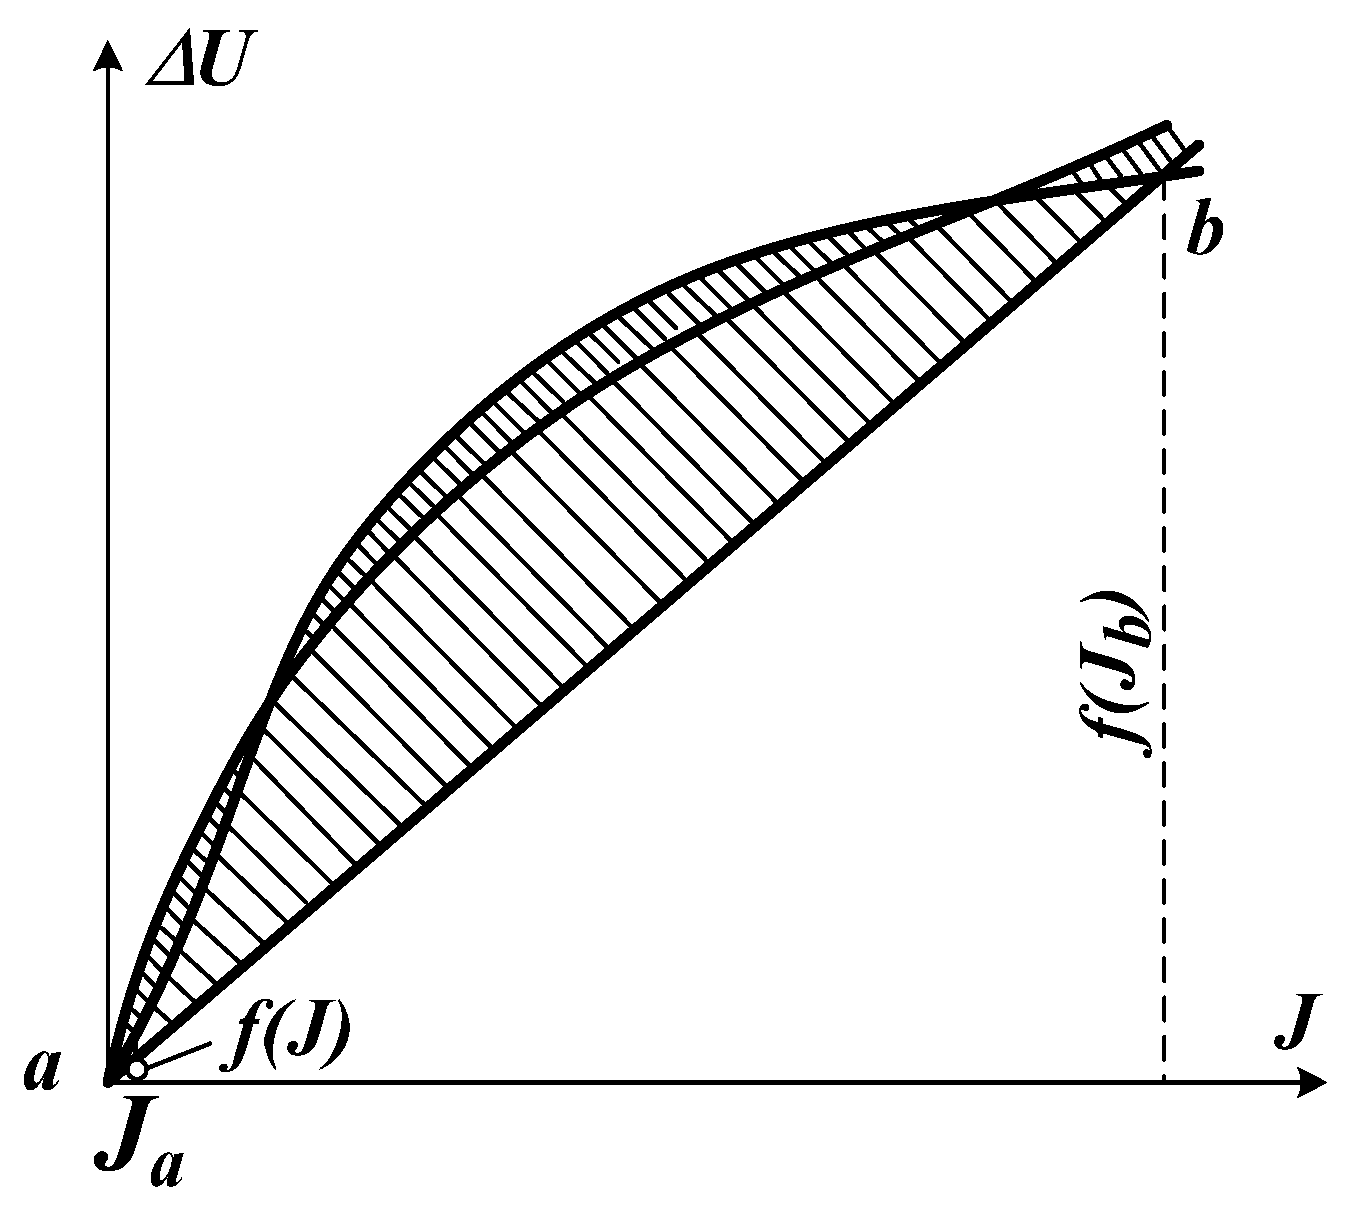
A number of researchers offer different ways of approximating VAC. The error was estimated by the coefficient of goodness of fit
kd. For this purpose, the error area was determined beforehand (
Figure 5).
where
f1(J) is the experimentally obtained volt-ampere characteristic;
f2(J) is its approximation under consideration.
The points
a and
b (
Figure 5) define the operating section of the characteristic at current densities occurring in practice.
At rough approximation with a straight line
ab, the error area will be
Hence the coefficient of goodness of fit is defined as
An analysis of the obtained results allowed us to conclude that, of all the considered methods of approximation, the SAC is most accurately described by the functions
where
A1 and
B1 are constant coefficients.
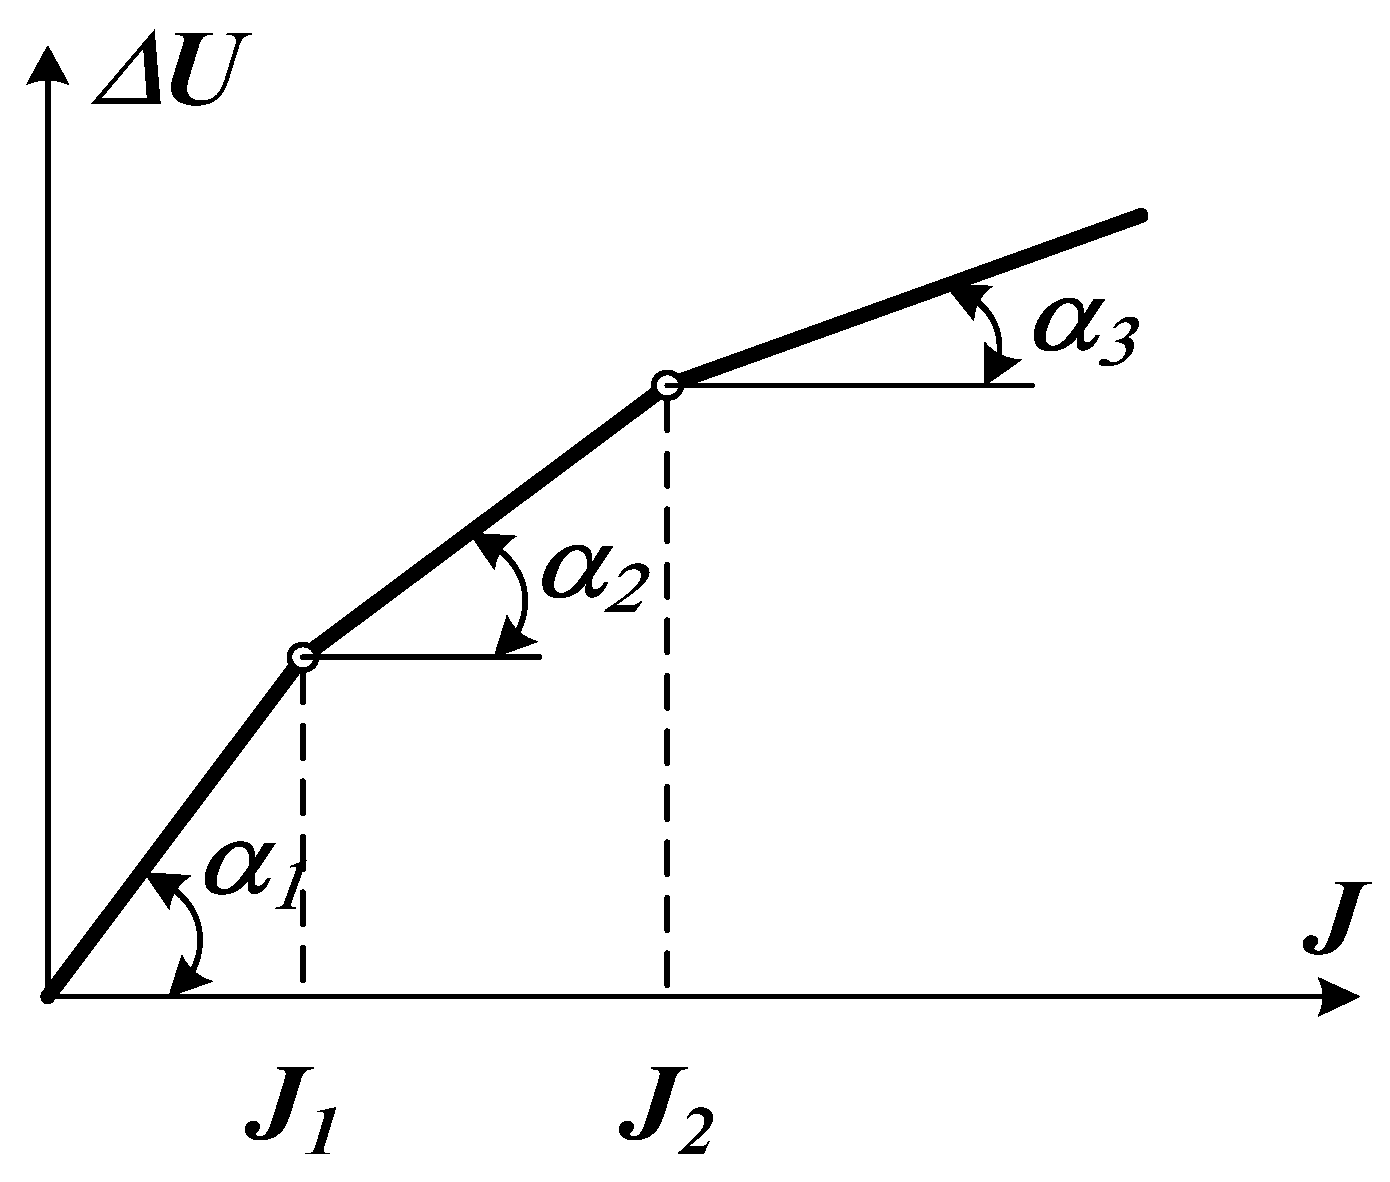
In [
9], a piecewise linear function is presented which is depicted in
Figure 6, where the parameters
a1,
a2,
a3, as well as
J1 and
J2, can be varied within almost any limits. Practice has shown that, with appropriate selection of these parameters, a characteristic like the one depicted in
Figure 6, can be much closer to the real characteristic than the characteristic of the type
.
The following functions are currently used to approximate the VAC of a brush
where
j is the current density;
A,
B and
C are coefficients, which are selected according to the type of VAC.
These equations allow us, by selecting the coefficients, to describe quite accurately any VAC with any rises in the region of small current densities and slopes in the nominal regions.
In this paper, in order to improve the accuracy of calculating switching processes, we propose to improve the approximation method and use several functions for different values of current density. For this purpose, it is necessary to divide the range of current density variation into sections according to certain criteria, and within each section, to choose the approximating curve more accurately.
To determine the value of the actual residual life, it was proposed to use vibration diagnostics to determine the life of the actual brush rather than the average statistical one. The design of the ED 131 and ED 131A for 120 t dump trucks assumes that they are installed directly in the hub of the motor-wheel according to the design scheme used in foreign dump trucks, such as in the USA and Japan [
10]. Since the all-wheel drive chassis on a BelAZ-7550 truck contains two driving axles and, accordingly, four TEMs M1-M4, the windings of the traction generator G1 are loaded on two identical sequential circuits, containing TEM M l, M2 front- and M3, M4 rear-driving axles.
Figure 7 shows a schematic diagram for the implementation of the vibration monitoring system on the brush–commutator units in DC motors, with the help of which the proposed method can be implemented. Wide-scale implementation of this system was preceded by many years of research and development aimed at improving the reliability of dump trucks’ operation and the reliability of diagnostics, and expanding the list of monitored parameters in full compliance with the existing requirements of the mining industry [
11,
12]. Most types of damage can be identified on the basis of their characteristic frequency components [
13,
14].
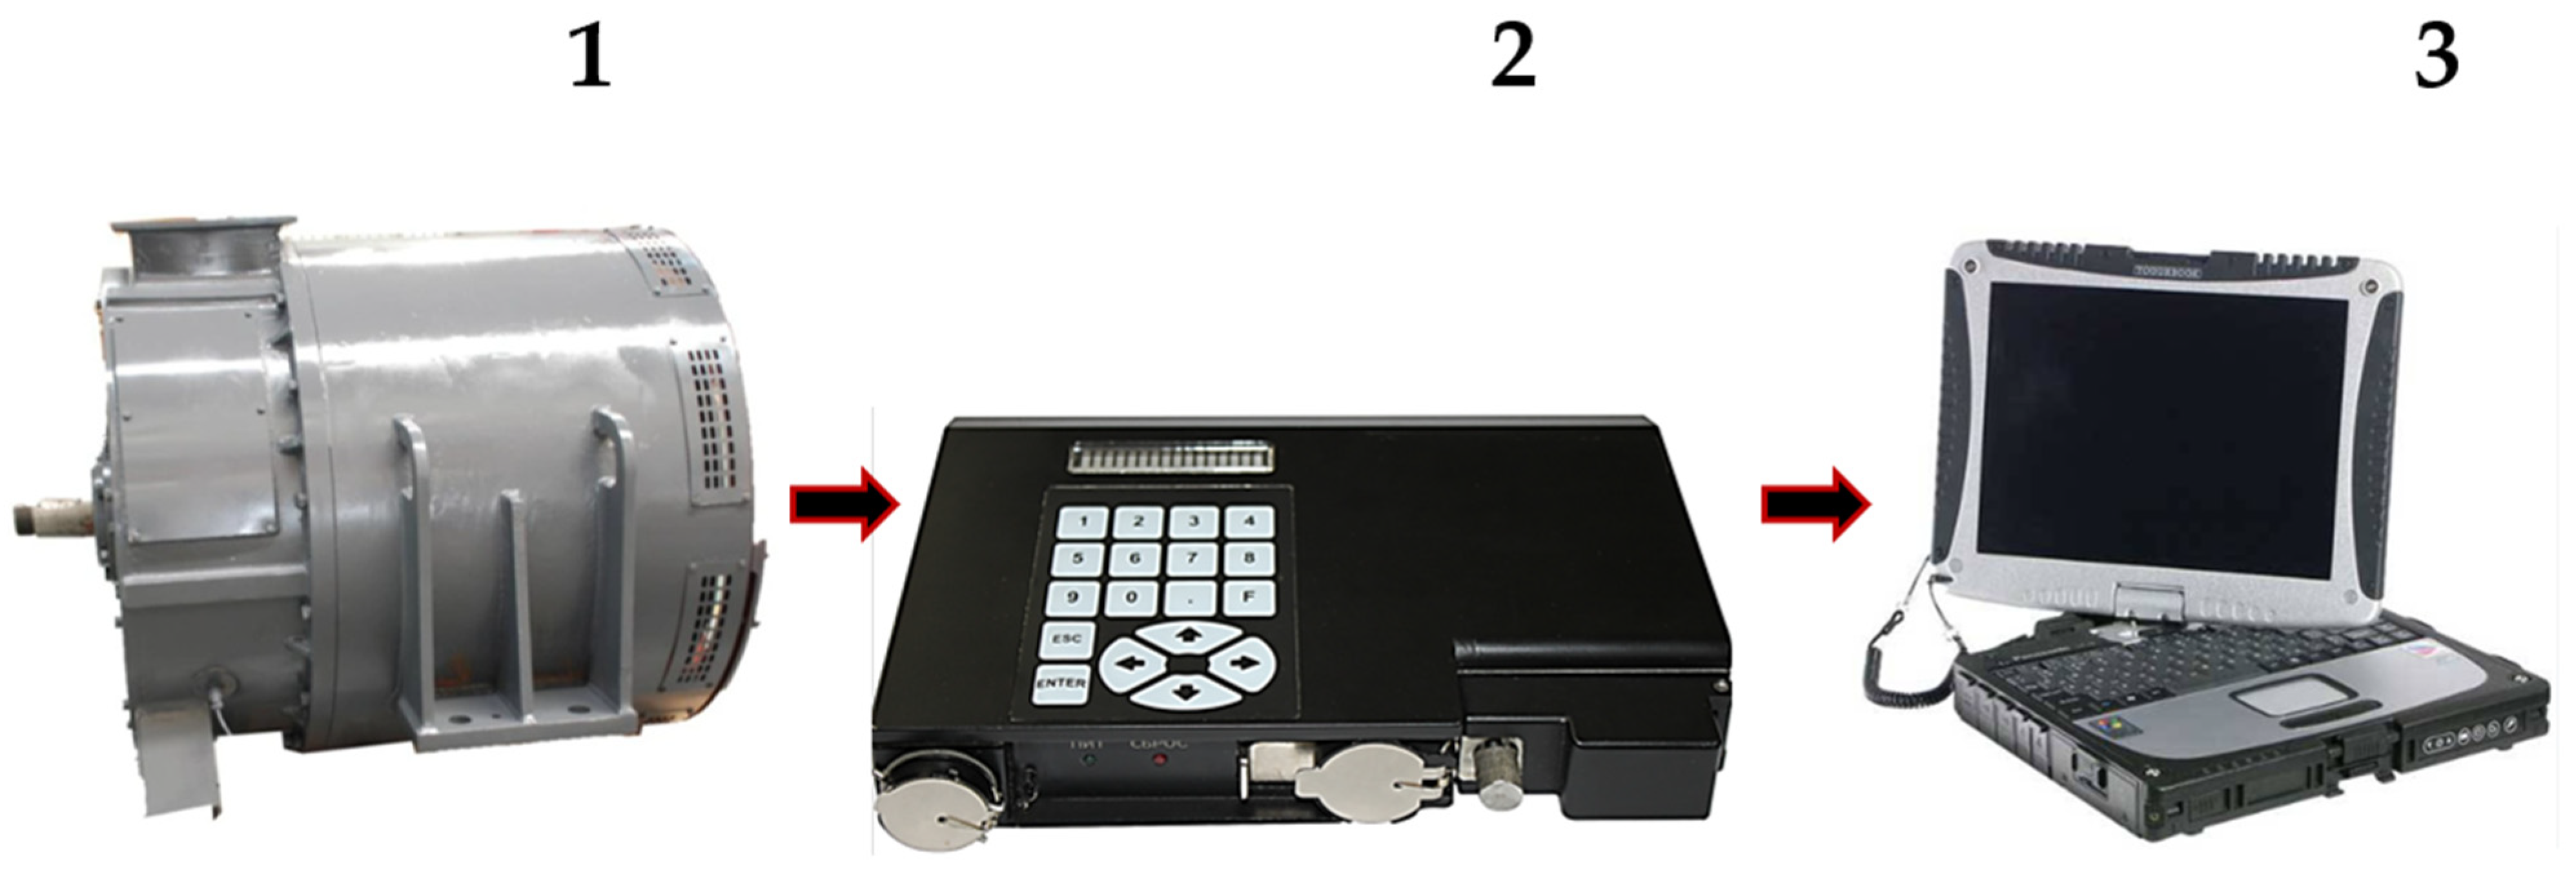
The vibrodiagnostic monitoring method [
10,
11] is based on vibration measurement with piezoelectrodes or lasers to measure the vibrations in the electric motor. Industrial accelerometers are attached to the place of measurement for a few minutes. Then, the received signals are converted from analog to digital form with the help of an analog-to-digital converter, and then the vibration spectra are formed with the help of a computer, then the spectral analysis is performed and a conclusion on the presence of defects is made. The cost of implementing this monitoring pays off with a dual-function sensor that can measure TEM vibration and bearing signals. We used specially designed sensors for measuring ultra-low frequencies, allowing vibration monitoring at frequencies from 0.5 Hz with the ability to work in coal mining conditions. All necessary functions for viewing and for an in-depth analysis of the vibration and parametric data for the selected time interval, such as single, group, parametric and band trends, spectra and cascades of spectra, acceleration/deceleration of the truck and others, are implemented in the program [
12].
Figure 8 shows the block-functional monitoring scheme.
Diagnosis and prediction of the technical condition of the brush–commutator unit and DC motor bearings is made by measuring the vibration parameters with a vibrometer [
15], which contains a vibration sensor (laser and piezo element). The array of the entered data should set the conditions of the normal mode of operation of the electric motor [
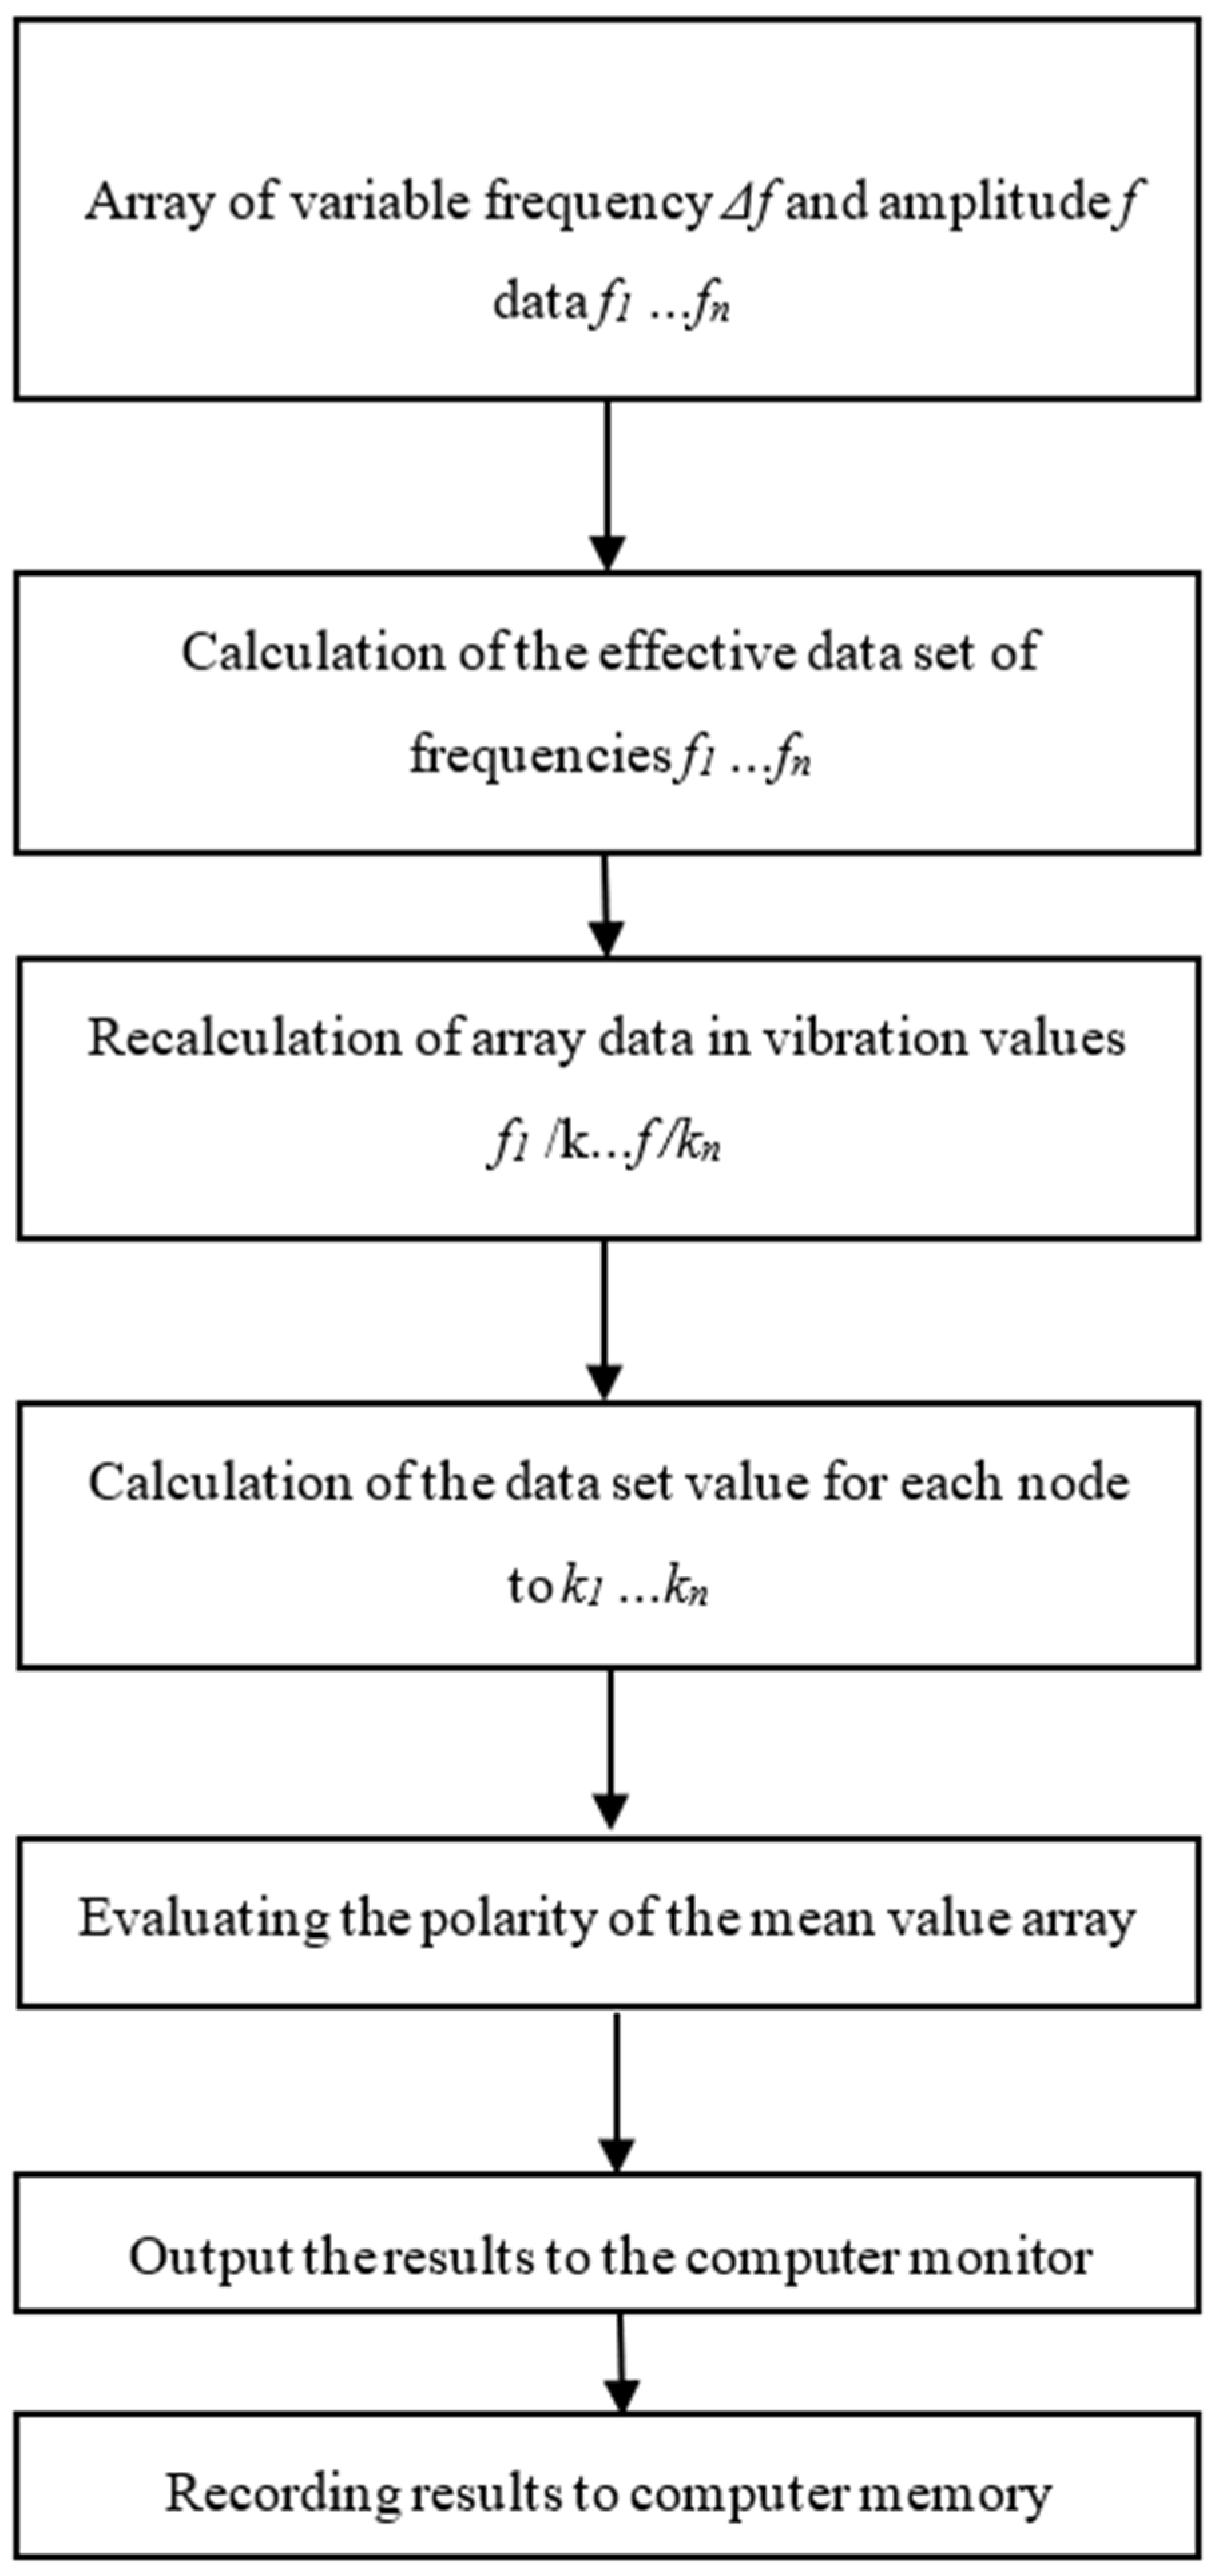
16]. We developed an electronic device equipped with a vibration process spectrum calculator and a block of setup data, containing values for rotation frequency, vibration acceleration amplitudes in the spectrum of the measured vibration process with calculated values of frequency
Δf, and subsequent analysis of the measurement data obtained was carried out. A data array for the variable frequency
Δf and amplitude
f1…
fn of each node of the electric motor were collected, on the basis of which the calculation for each node
k1…
kn and
frequency f1…
fn, and subsequent processing of diagnostic information
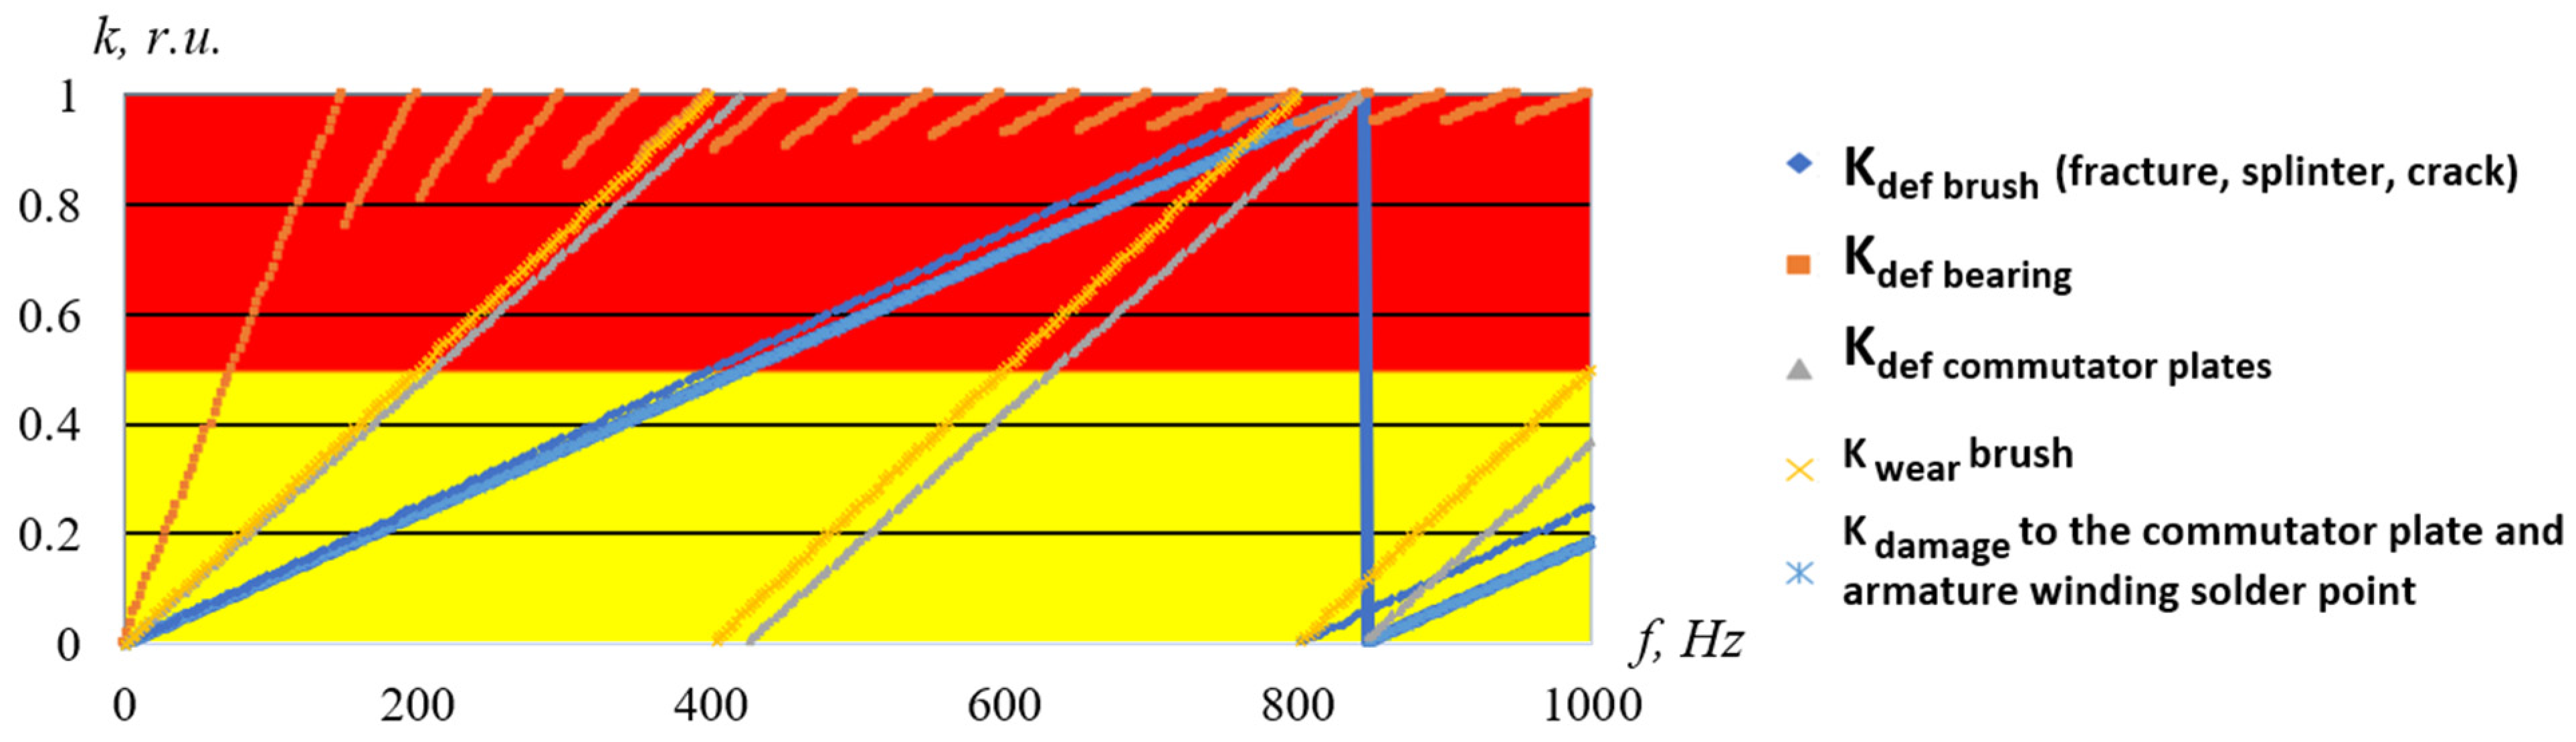
f/k1n/k, was carried out. Then the obtained signal is digitally displayed on the PC screen. The first block is the operator’s window, which displays a mimic diagram of the controlled components of the truck TEM with an indication of the current values of the measured parameters, provided by color status signaling (“yellow”-”red”) (
Figure 9). In
Figure 9 the yellow zone means the zone of acceptable operability of TEM nodes; the red zone means the emergency mode of equipment operation.
The lines in
Figure 9 refer to the results of the defect detection program. If they are drawn at k = 0.5…1, it is a manifestation of the defect (red zone), at k = 0.5 and more we observe the birth of the defect, at k closer to 1 we observe the failure of the traction motor unit, according to the given legend.
The main information necessary for TEM diagnostics comes from tests and experiments, during which failures and presence of defects in the nodes were registered [
17]. The output parameters of
vibrodiagnostics in the electric motor are the numerical values of the vibration frequency of the nodes, which determine its condition and ability to perform the specified functions, i.e., the characteristics by which the quality of the product is determined. If necessary, the client part of the program can be supplemented by the expert module of the automated diagnostics and a prediction of the remaining life in the switchgear, which is adjusted individually, taking into account the design and operational features of the controlled electric motor of a dump truck [
18]. In many industries, especially in the mining industry, electric motors can be used 24 h a day, seven days a week. The presence of the main signs of defects in DC motors can also be confirmed by calculation, knowing the frequencies of the vibration components (
Table 1).
The main source of vibration in the electric motor is closely related to its design and control [
19]. When the vibration frequency increases, the vibration acceleration does not have time to decrease before the next pulse, and the residual value of the previous acceleration is added to the incoming one or subtracted again, depending on whether they coincide in the direction or not [
20,
21]. Therefore, at high vibration frequencies
fc ≥ 25 Hz the periodic nature of the frequency is distorted.
Vibrations in the electric tipper drive motor can come from various parts of the drive and its motor design. Only one accelerometer and one economical cable per bearing are needed to perform the measurement [
22].
Table 1 presents the main diagnostic parameters for the calculated determination of defects occurring in the TEM.
Table 2 introduces the input parameters of the main motor units [
23], which will be used within the calculation part of the diagnostics (
Figure 9).
The mathematical model proposed by the authors for diagnostics and condition monitoring for BCA consists of the calculated frequency criteria given below (1)–(6), which allow for the plotting of a vibration spectrum diagram by dividing it by the frequencies of the defects developing in all of the rotating units in the TEM motor (bearings, commutator, armature). Traditional collection of static data can periodically give an idea of the measurements, but cannot capture dynamic changes in shock loads on the structure, motor vibration or changes in ambient noise [
24]. Using the shock pulse method technology to assess the condition of the rotating bearing element on Belaz [
25], we can measure high-frequency vibration signals, indicating the degree of damage caused to the bearing and the BCA long before the failure of these units, which allows repair work to be planned in advance [
26].
After receiving a warning signal, the measurement signals must be analyzed via a direct connection to the sensor by instrumentation for a more detailed vibration (spectrum) analysis [
27]. The frequency of vibrations can be calculated when the TEM is switched on, at which switching overvoltages occur,
(Hz):
where
f1 is the switching overvoltage vibration frequency;
0.7 is the coefficient reducing the vibration frequency to the initial frequency of occurrence of faults in the rotating elements of the TEM (commutator, armature, bearings);
is the calculated frequency of vibration when the TEM is switched on.
Monitoring is performed without introducing any extraneous components into the motor that may cause additional interference in the vibration reading, and each range of the vibration spectrum is responsible for its own frequency, indicating the occurrence of a defect of one or another component:
where
f2 is the frequency of defects on the brushes;
fsup is the frequency of the mains supply;
kbr is the number of brushes;
k1 = 1…n are coefficients of the defect development stage;
ƒ is the characteristic frequency;
kd is the number of defects on the brushes.
where
f3 is the frequency of bearing element damage;
kbear is the number of bearings;
ksd is the coefficient of the stage of development of the bearing defect.
where
f4 is the frequency of damage (breakage) on the manifold;
K is the number of commutator plates;
2p is the number of pole pairs;
kmd is the coefficient of the stage of development of the manifold defect.
where
f5 is the frequency at the commutator runout;
fc is the characteristic frequency at the commutator.
where
f6 is the frequency of the presence of the limit wear of the brushes;
ƒanch is the speed of the armature;
k2 = 2 is the number of commutator plate soldering points to the armature winding;
kbrc is the number of brushes in the cage.
3. Results
For the successful diagnosis of various electromagnetic problems in electric motors and generators an analysis of vibration signal spectra is necessary [
28]. The authors have determined the basic frequencies which lead to failures in the TEM units. Due to the frequencies of rotation obtained for the main electric motor elements (motor armature, bearings, commutator) it is possible to analyze and “filter” the vibration signal spectrum, thereby determining the peak amplitudes of these elements’ vibrations, corresponding to the moments of impact in the places where the defects occurred. Based on the data entered into the program, an investigation into the nature of TEM defects and the degree of development can be carried out, which also allows for the identification of the incipient defects [
29].
Preferably, measurements and their analysis should be carried out with a given periodicity to create a database of measurements and to compare these results with amplitude values at characteristic frequencies with the signal value at zero hertz, by which the development of damage is controlled over time and the remaining life of the equipment can be predicted [
30].
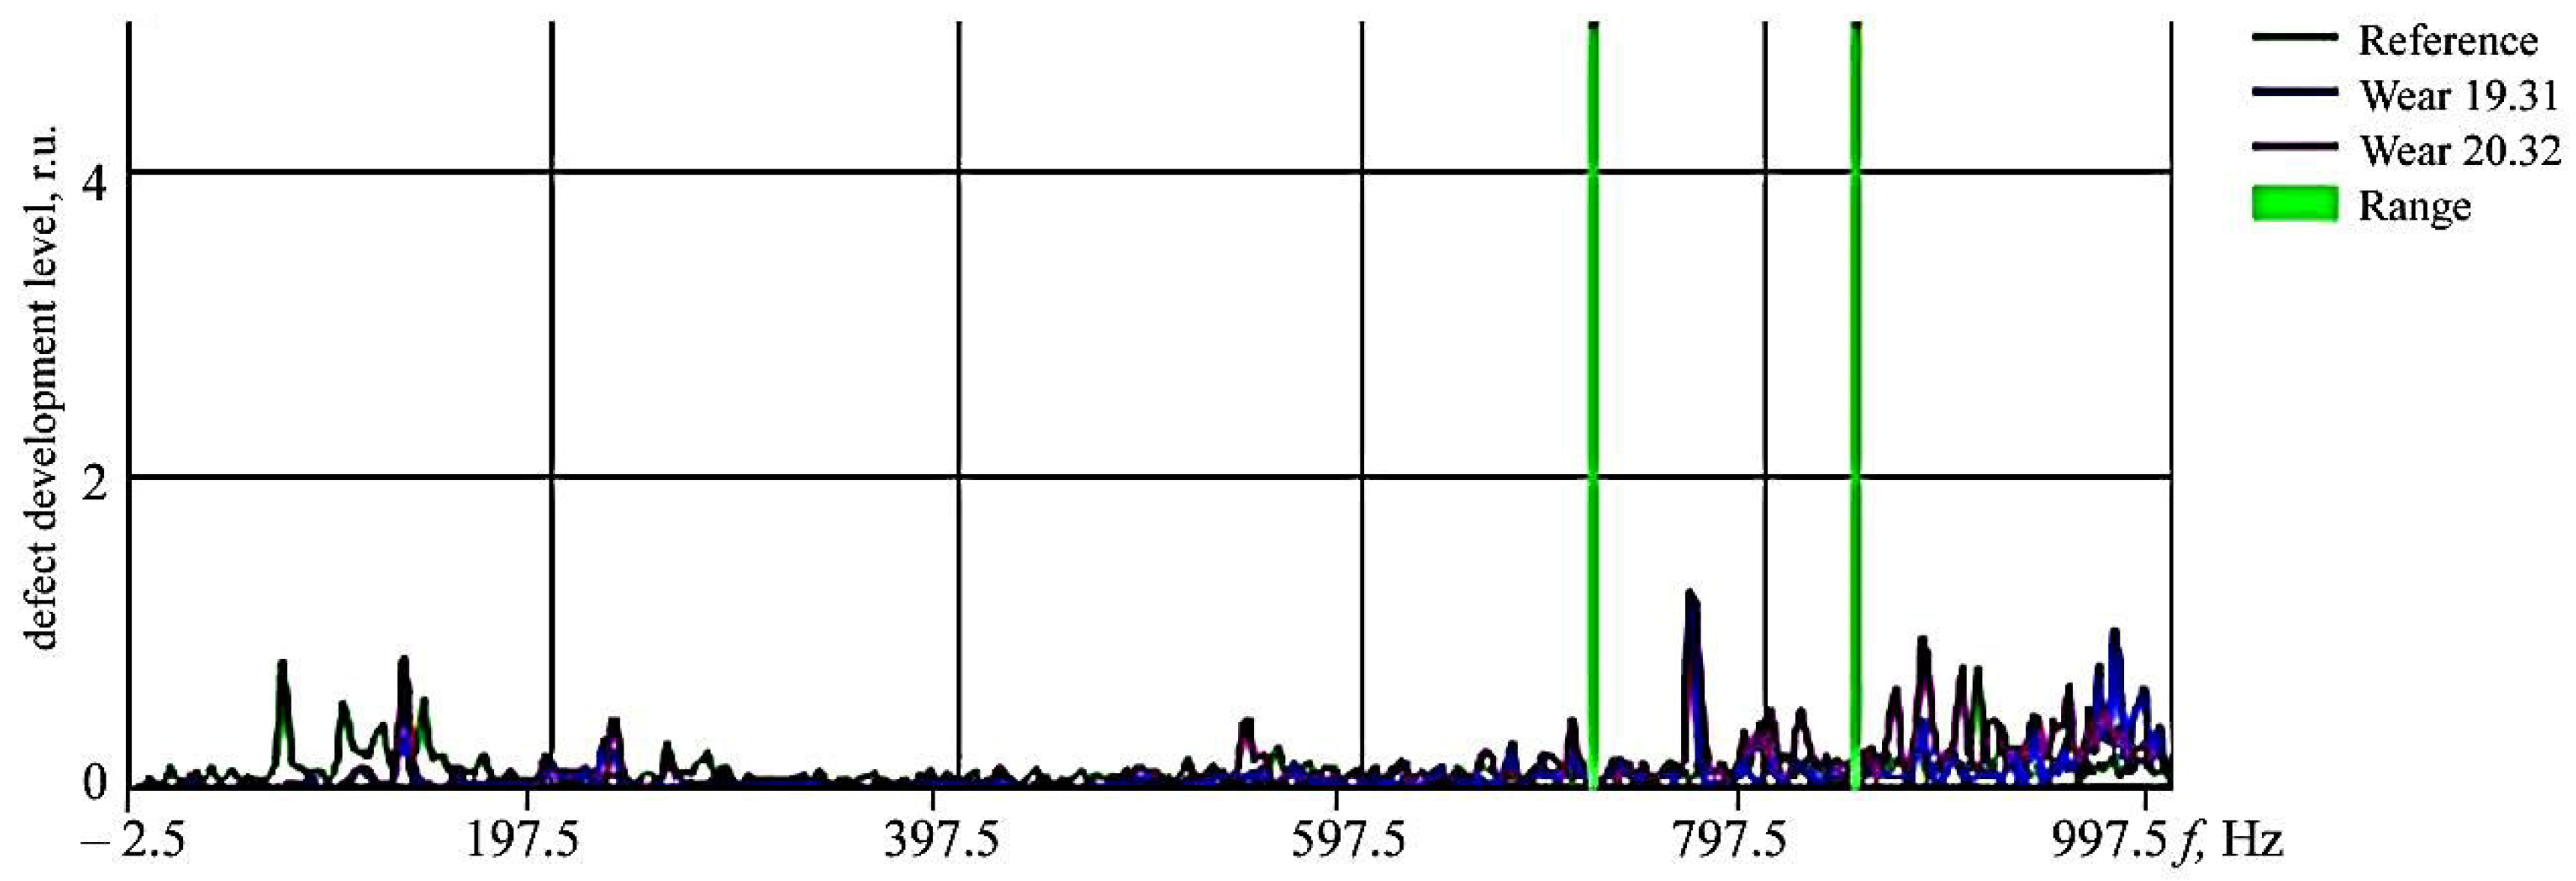
Figure 9 shows the frequency response of the vibration spectrum of the new serviceable electric motor in the frequency range from 0 to 1 kHz. This spectrum is further used as a reference spectrum. Vibrations in the electric machine, not caused by mechanical problems, have double the frequency of the mains frequency, i.e., equal to 100 Hz (the first burst of vibration is shown in
Figure 10). With the detection of surges, a conclusion about the discrepancy between the spectrum and the ideal one can be made; the characteristic frequencies responsible for concrete faults are allocated for in the analysis, and the character and degree of fault development is revealed by comparing the values of amplitudes with the ideal value, thus a conclusion about the technical condition of the electric motor can be made [
31]. If the difference indicated between the amplitudes is less than a given value, a conclusion about the presence of the fault corresponding to a given characteristic frequency can be made [
32]. According to the invention of a method for monitoring the vibration of the brush–commutator units in DC motors proposed by the authors [
33], to implement the method, a standard analyzer sensor attached to the motor body can be used to obtain a spectrum [
34,
35]. The spectrum is the analyzed signals which are realized through the superposition of real and reference spectra by comparing which defects are detected and predicting their development (
Figure 10). An indication of the presence of a defect is usually an increase in the amplitudes of electromagnetic harmonics above a certain level, which is the threshold of the normal state of the tipper equipment [
36]. The main cause of the appearance of excessively high vibrations is identified by determining the frequency of the peaks on the vibration FFT-spectrum of the device [
37].
In general, the presented method is based on a spectral analysis—a procedure for recording signals of the electric motor to determine the presence of electrical and mechanical faults [
38]. Harmonics in the vibration spectrum, corresponding to different types of faults, are different from each other. Therefore, the detection of characteristic harmonics in the spectrum allows for the unambiguous identification of electrical and mechanical faults in the electric motor [
39,
40,
41,
42].
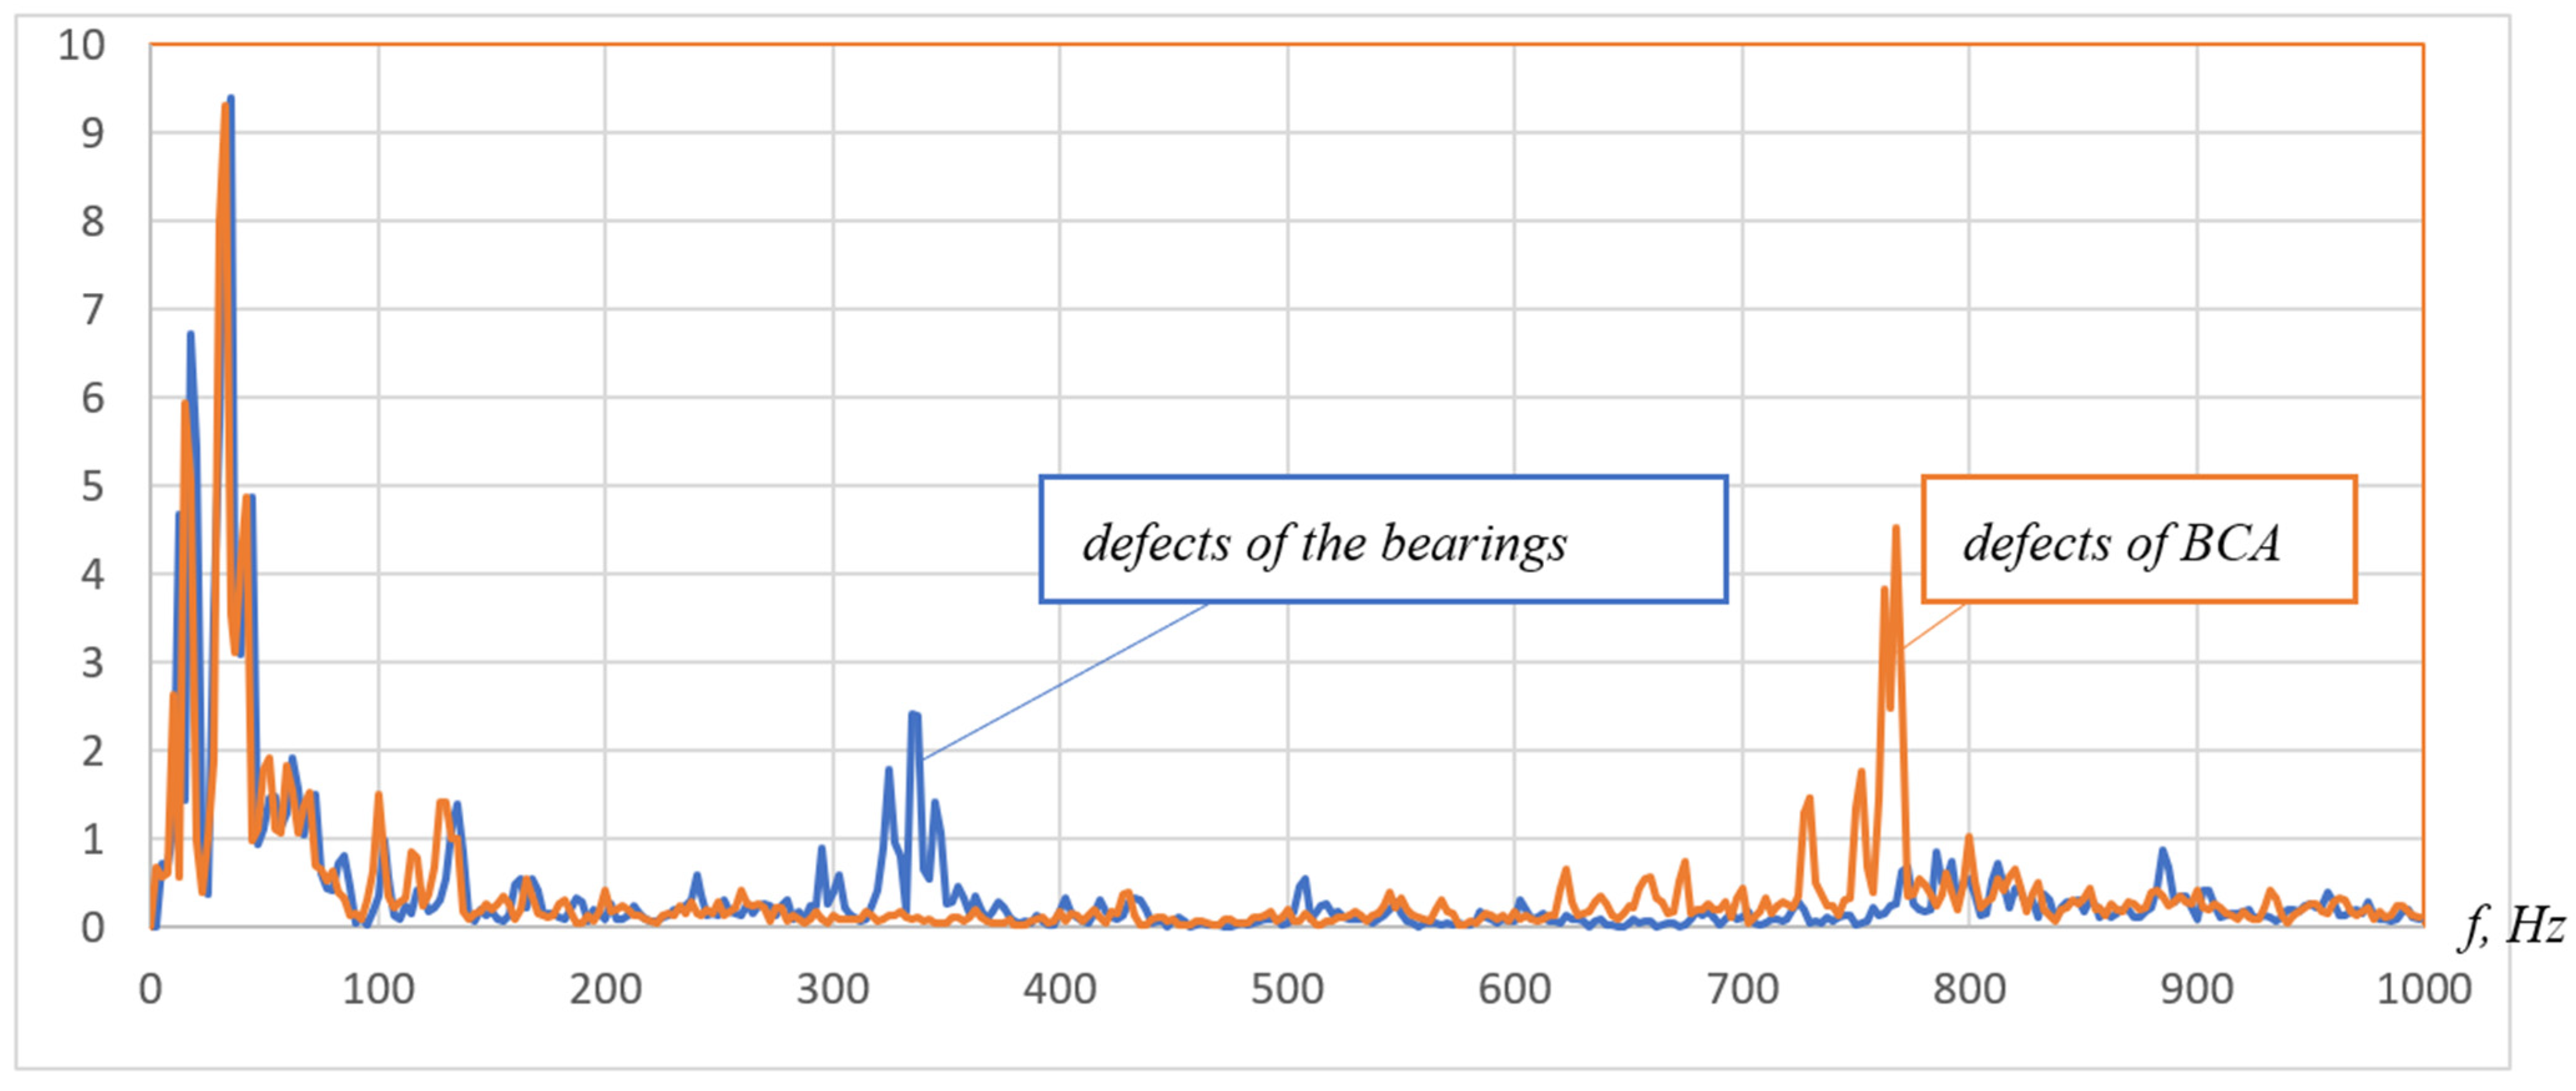
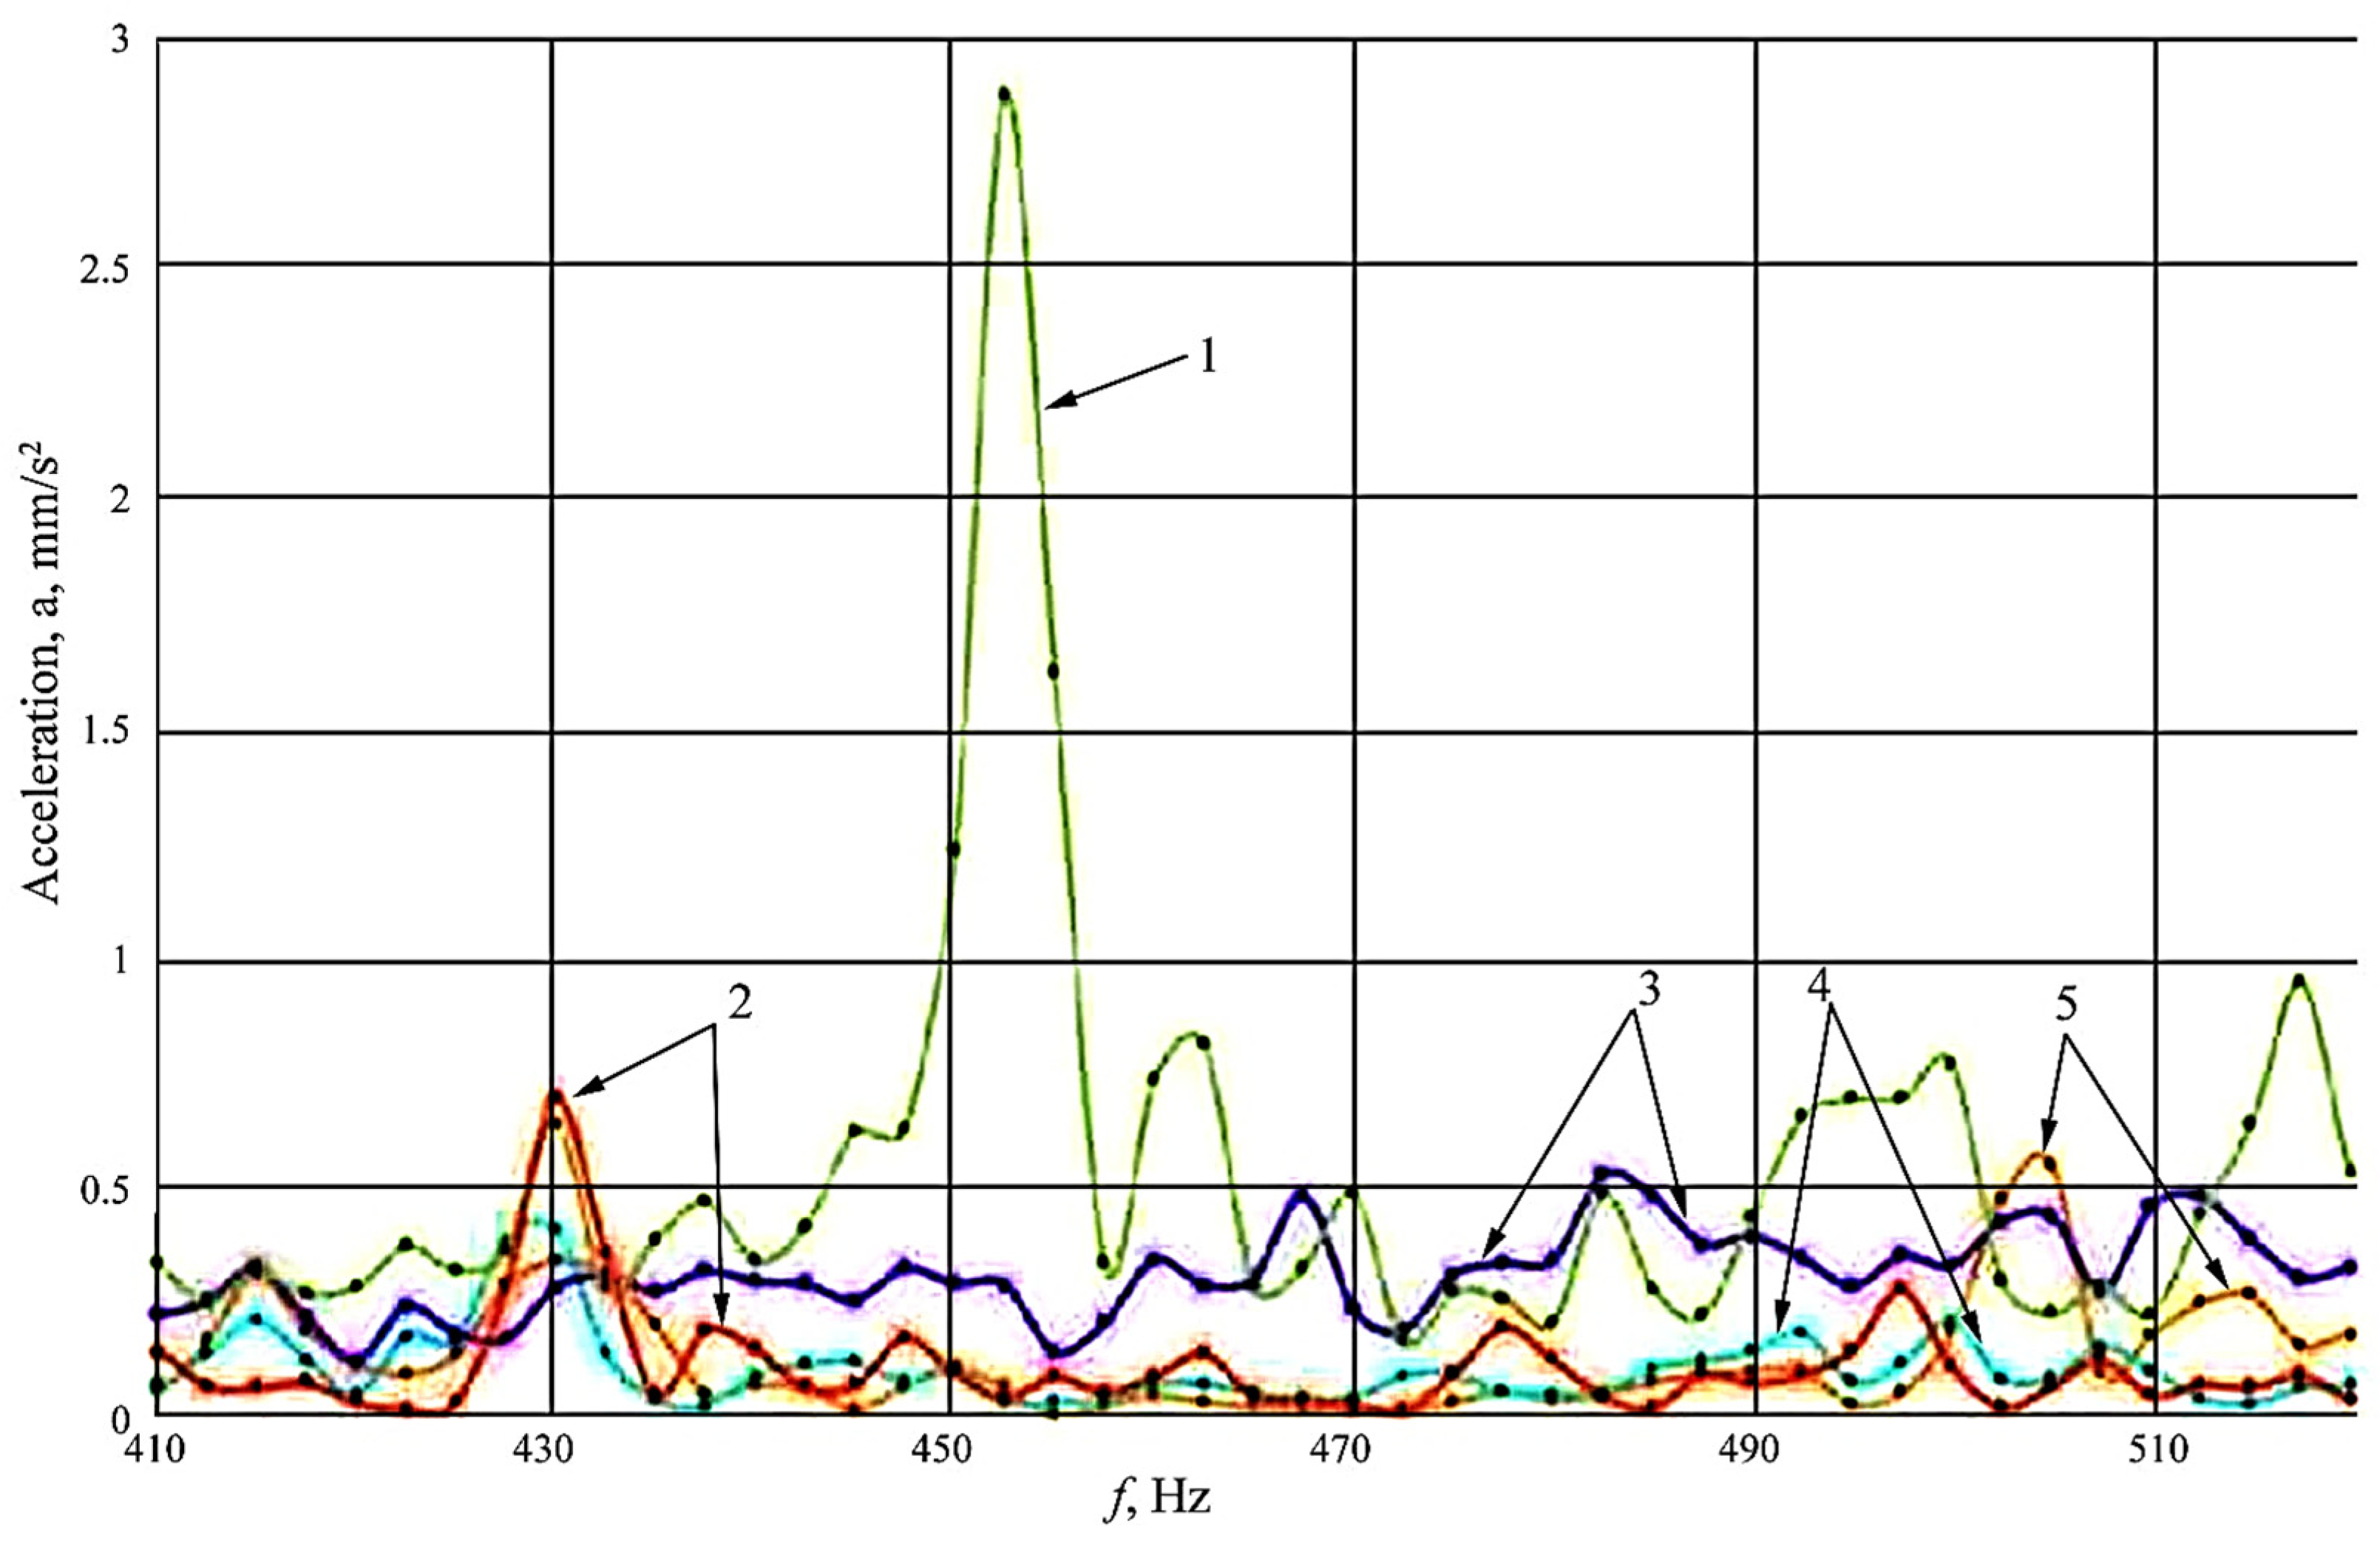
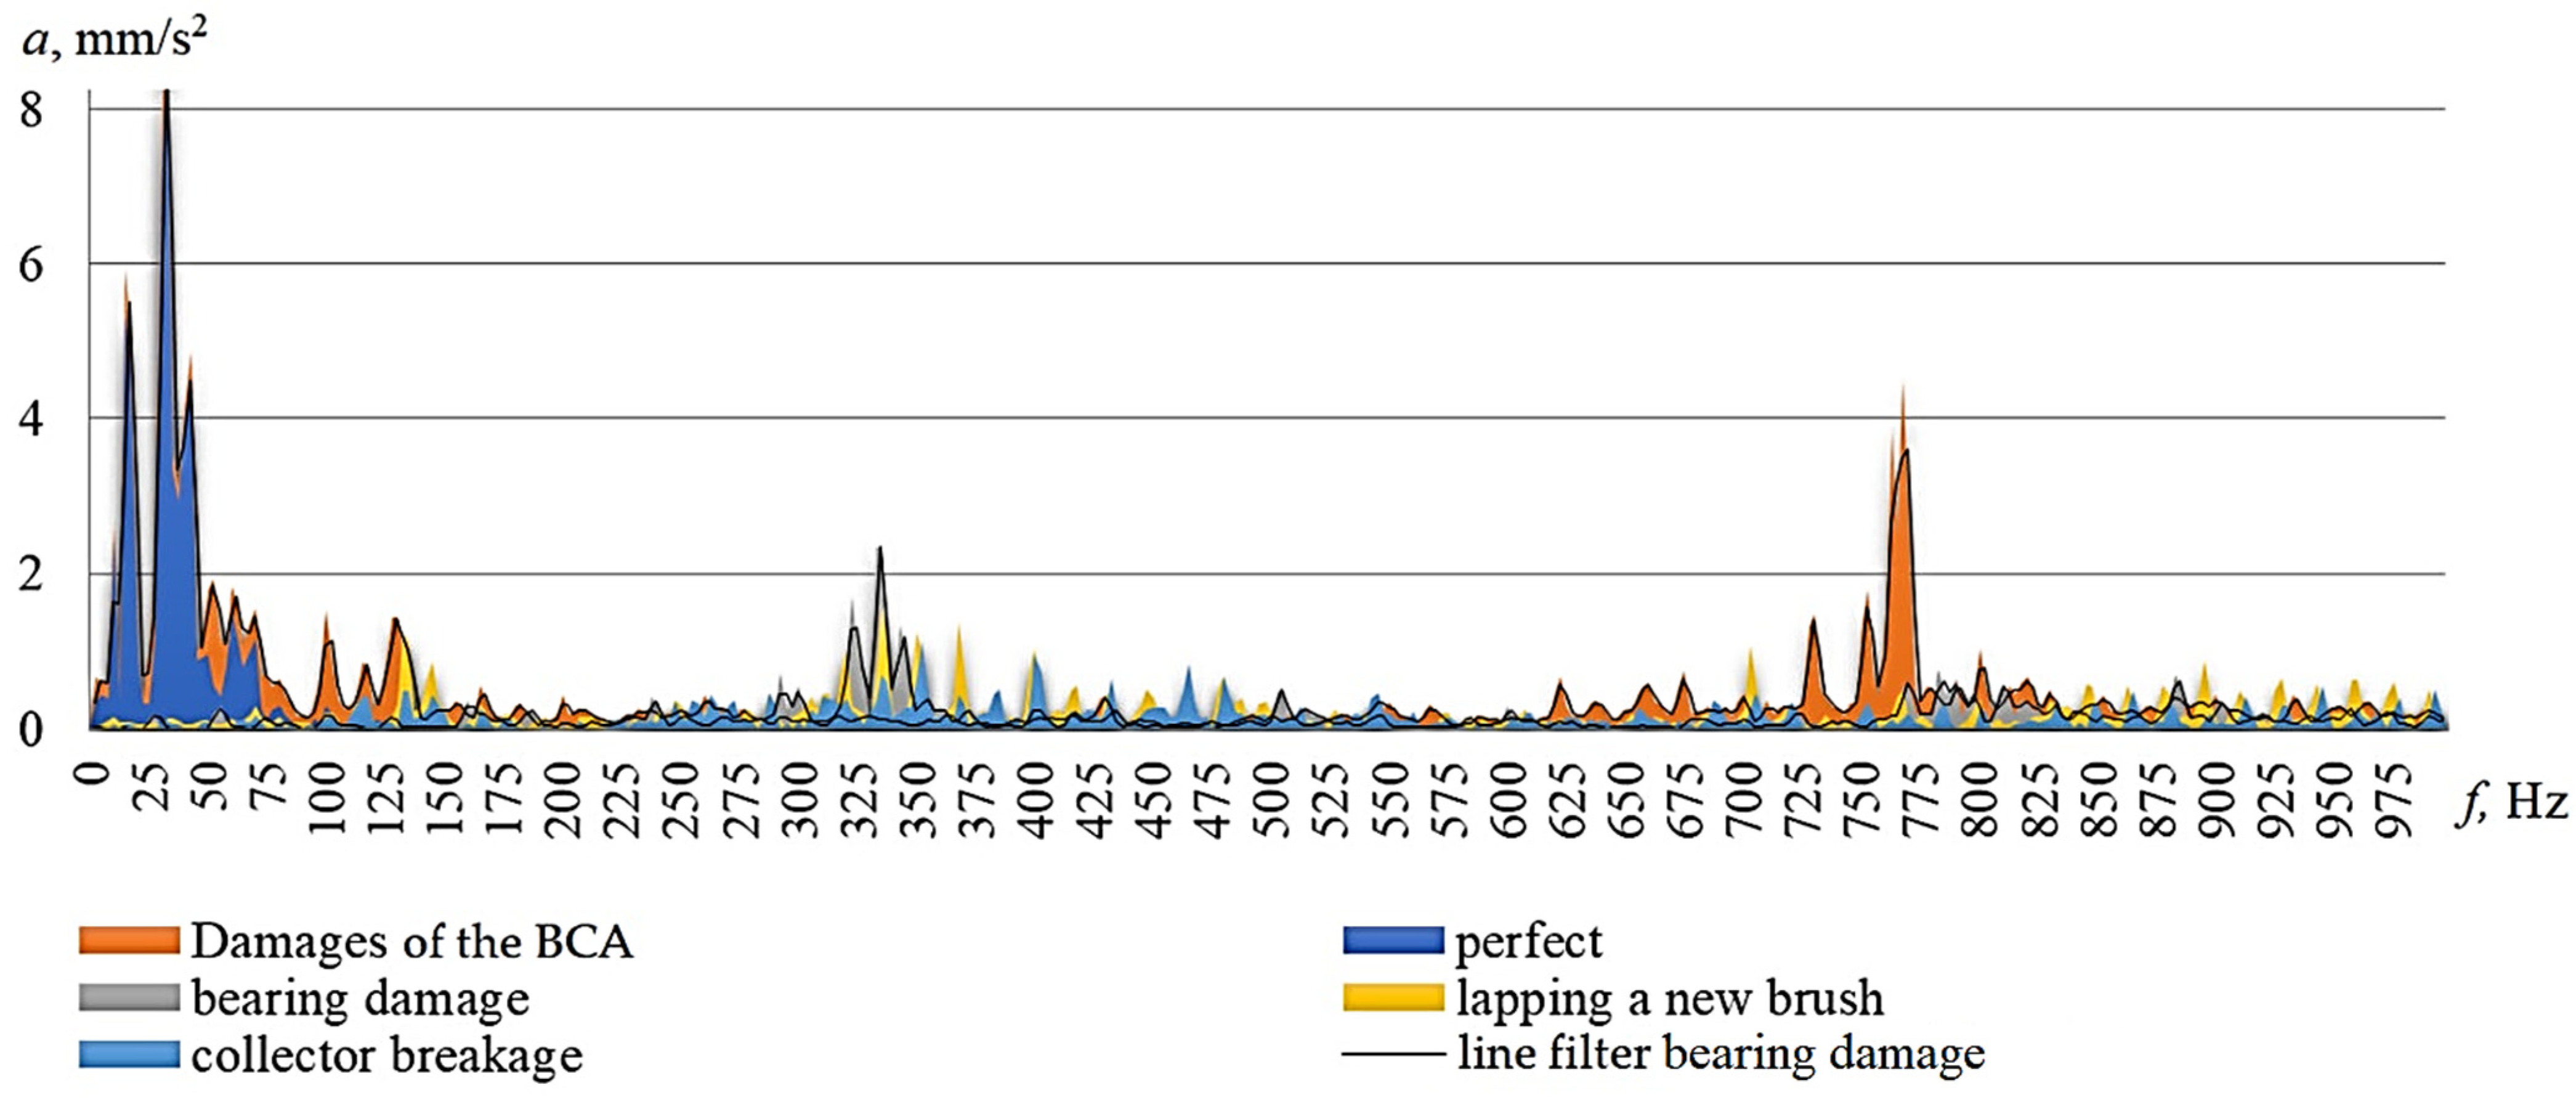
Figure 11 shows the frequency response in the vibration spectrum of the electric motor in the presence of defects in the brush–commutator unit and in the bearings. With significant defects in the steel, a second (200 Hz) harmonic in electromagnetic frequency
Fem, and even a third (300 Hz), can appear.
For the purpose of diagnostics, the received signal is converted from analog to digital form (
Figure 12). For example,
Figure 13 shows the spectrum of the vibration signal registered on the electric motor bearing, which has a nominal speed of the anchor, equal to n
0 = 1480 rpm.
In all cases, monitoring and spectral analysis of the running DC motor is performed. If it is not possible to continuously monitor the parameters (vibration and brush wear) of the technical condition of the DC motor [
43] using the proposed complex, simplified methods can be used, in which the prediction is carried out using one parameter of the technical condition:
for the BCA operating under static loading and general uniform load, the calculation is carried out by reducing the brush height;
for the BCA, for which the amount of information accumulated on the functional parameters is sufficient to extrapolate values for the subsequent period of operation, the calculation is carried out by changing these parameters to the limit values.
Each range in the vibration spectrum is responsible for the occurrence of a defect in one or another unit. As a result of the development of the vibrodiagnostics technique, the authors of the article created a program for evaluating the service life of the BCA.
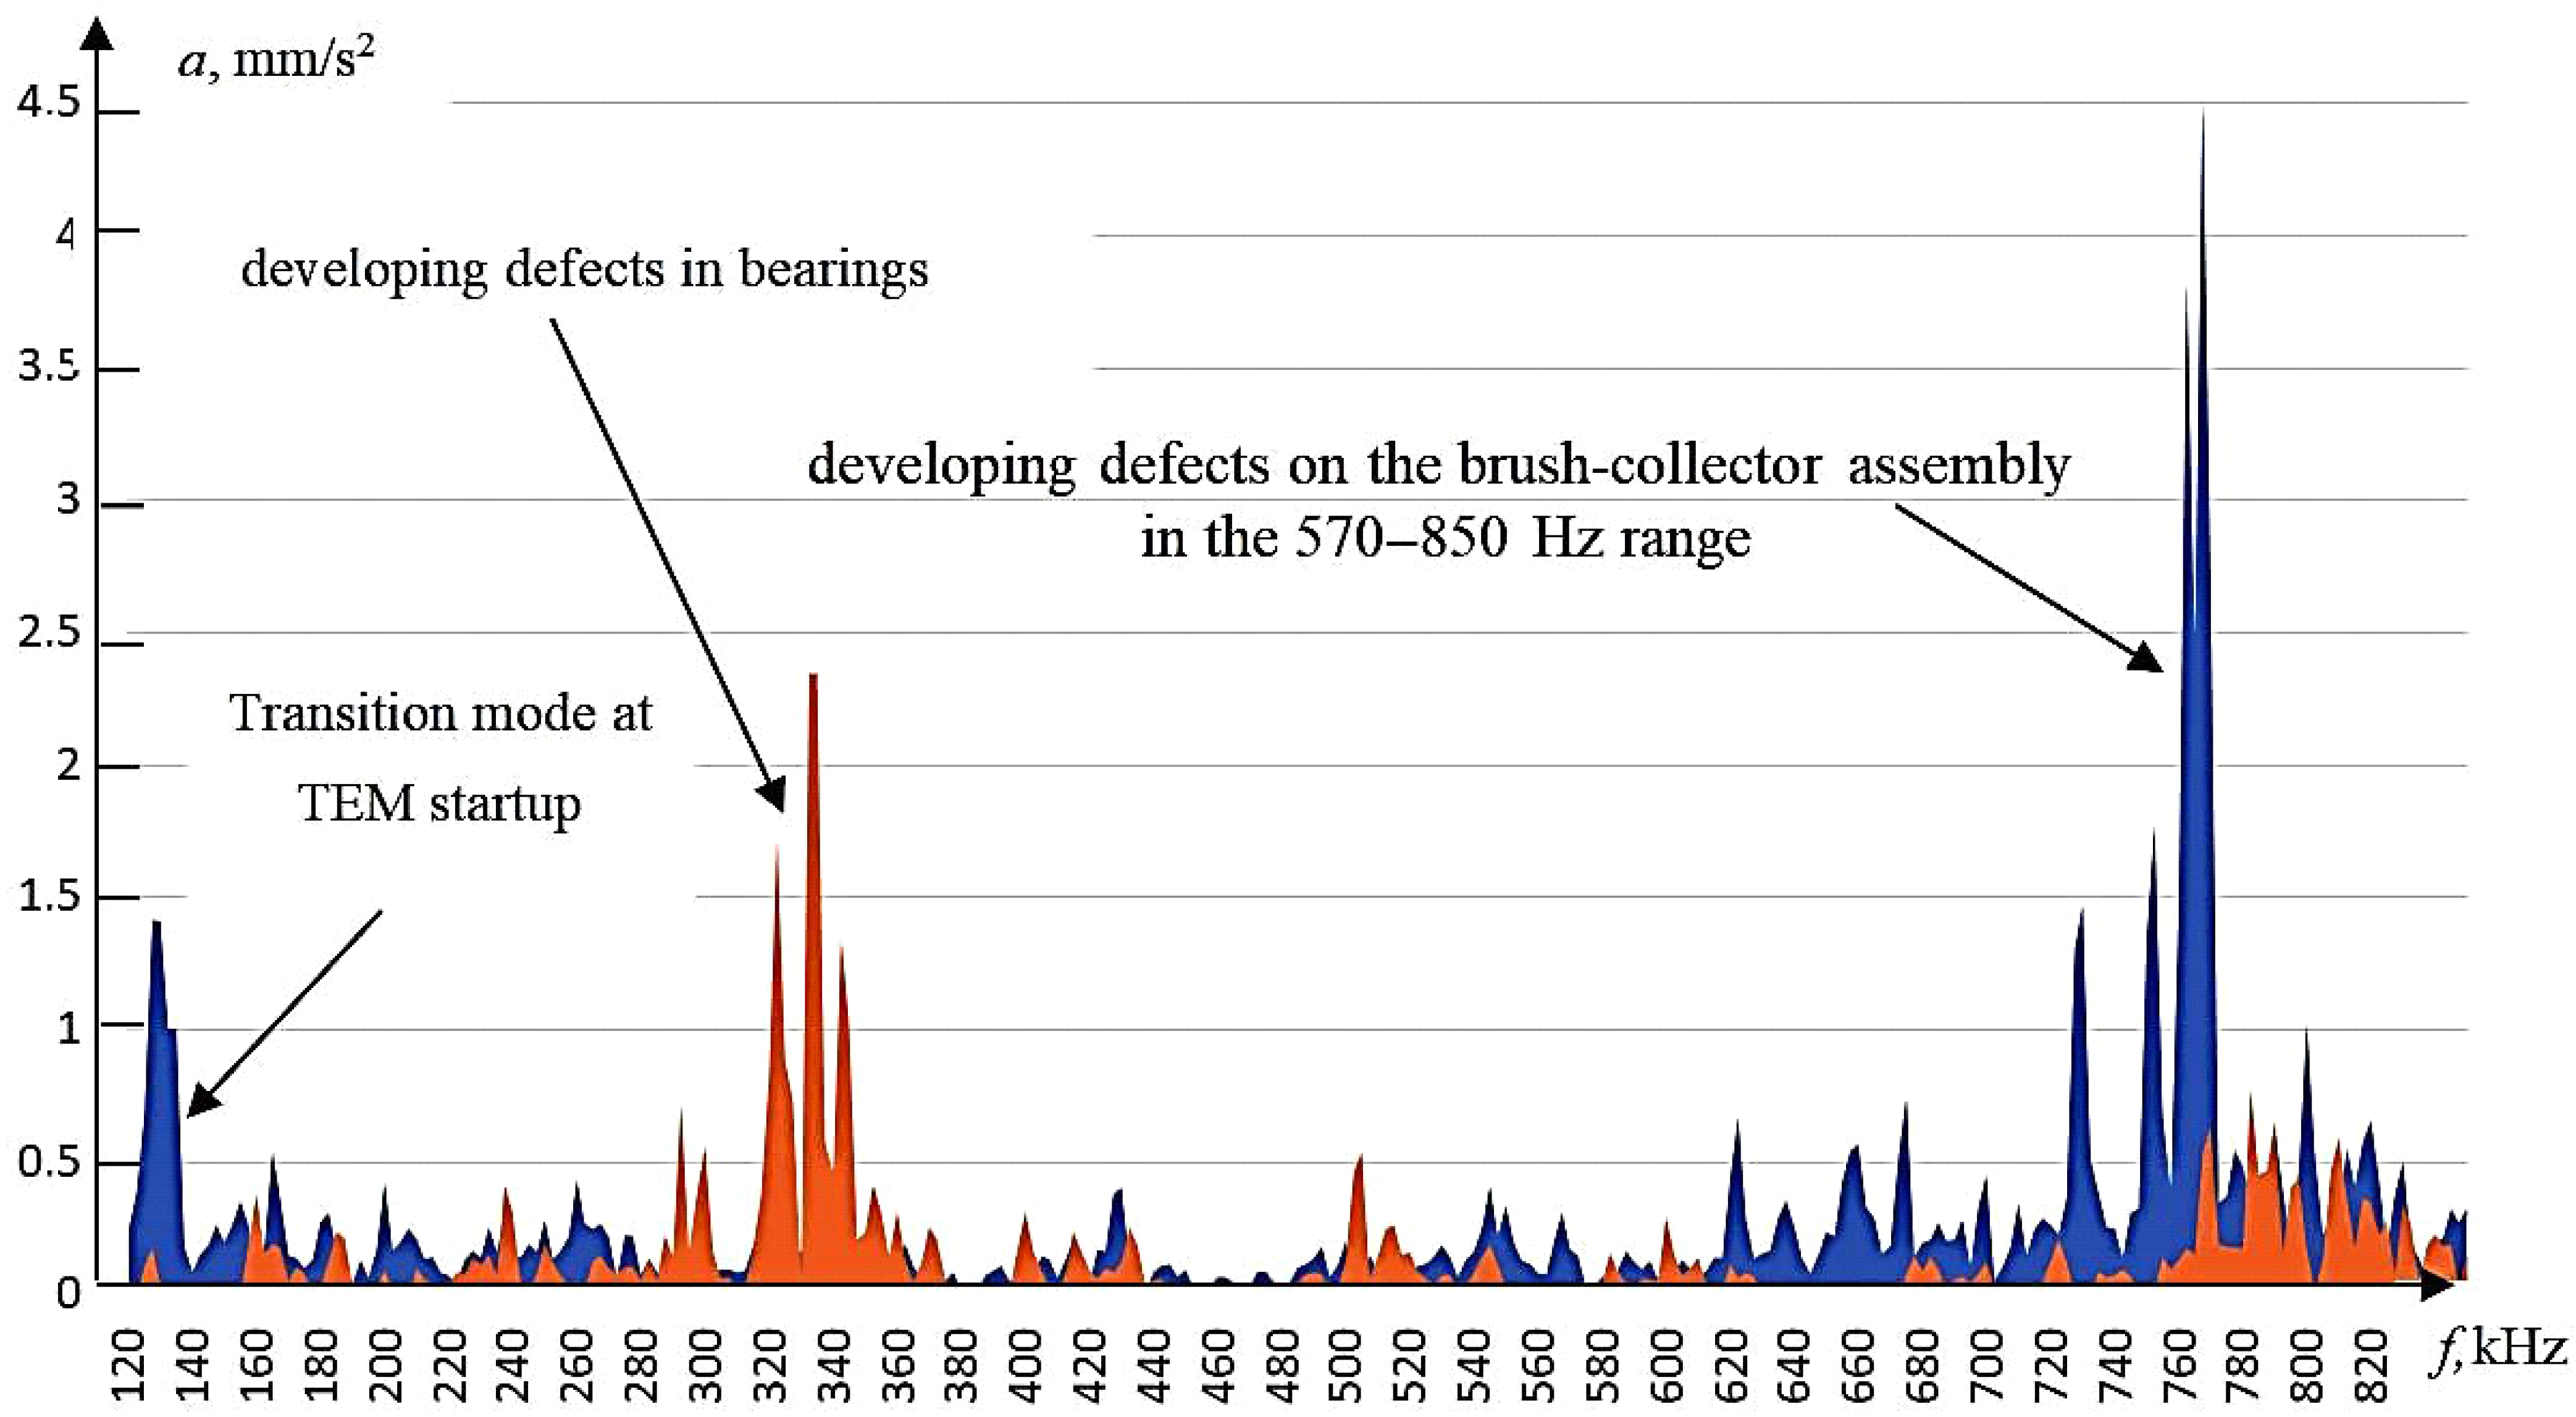
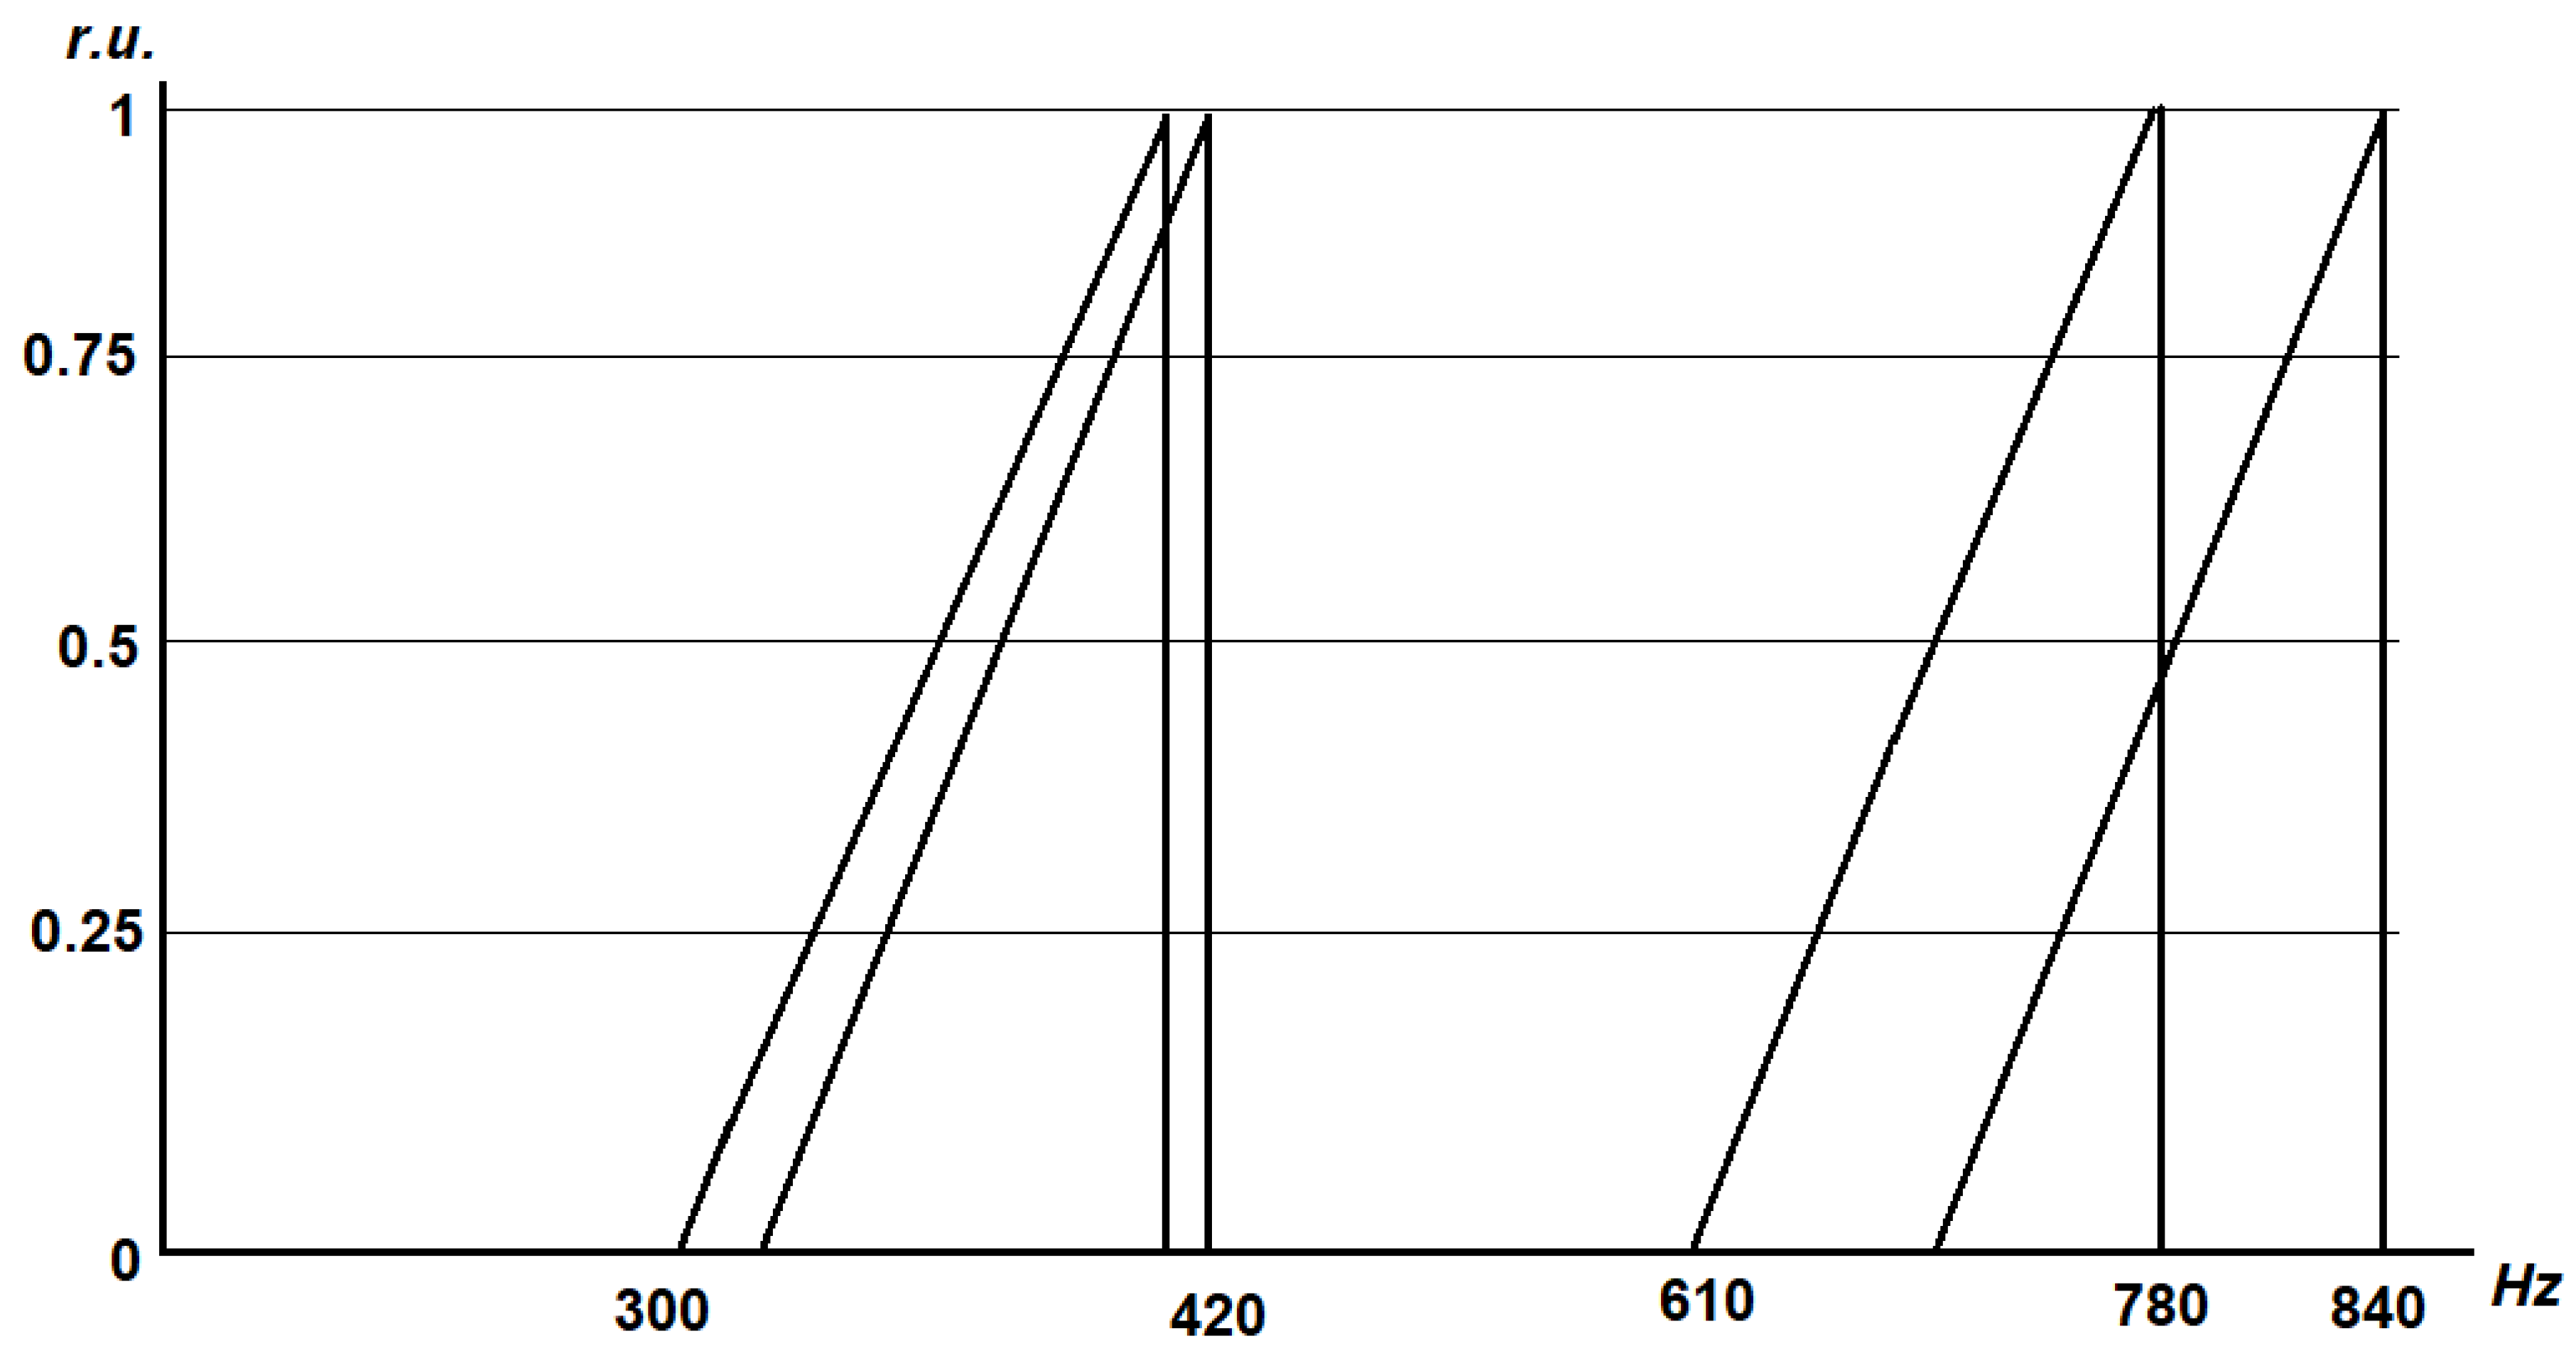
Table 3 shows a diagram of the change in the area of the vibration spectrum of TEM nodes depending on the Spearman criterion and the correlation coefficient. At the same time, the overall picture of the TEM vibration spectrum with the selected range of BCA diagnostics is shown in
Figure 14.
The program monitors the operation and evaluates the state of the TEM according to the input parameters of the TEM (
Table 2,
Figure 15), the calculations made for each node and the corresponding measured vibration spectra (
Figure 16).
The program contains a set of procedures that implement algorithms for detecting faults of the brush–commutator unit and the degree of wear of the brushes.
The following tasks are solved with the help of the program:
Obtaining a set of vibration spectra from the vibration meter over the network;
Accumulation of reference vibration spectra;
Identifying the frequencies characteristic of different types of faults;
Determination of characteristic faults in the electric motor units;
Visualization of vibration spectra with a comparison of the benchmarks and results from the fault detection algorithms with an indication of characteristic frequencies.
4. Discussion
The program contains a large database of accumulated vibration spectra from different motors with different degrees of wear on the brushes, with the possibility to compare the obtained spectra and identify typical faults in real time.
The novelty of this work lies in the development of a mathematical model for determining and predicting the reliability of the brush–commutator unit and bearings in the DC traction motor, which will allow us to estimate parameters such as the time of wear and failure-free operation of brushes, the determination of the optimal mileage of the dump truck by the amount of brush wear, the probability of the failure-free operation of the brushes, the residual life of the brushes to the permissible wear limit, the rate of wear of the brushes depending on the time of operation. According to the results of the model it is possible to form a conclusion about the brush serviceability according to its actual technical condition.
The application of the developed program allows us to implement a way of monitoring the vibration of brush–commutator nodes in DC motors. Based on the analysis of the electric motor diagnostics program operation, the characteristic frequencies of vibrations unique to certain defects can be determined [
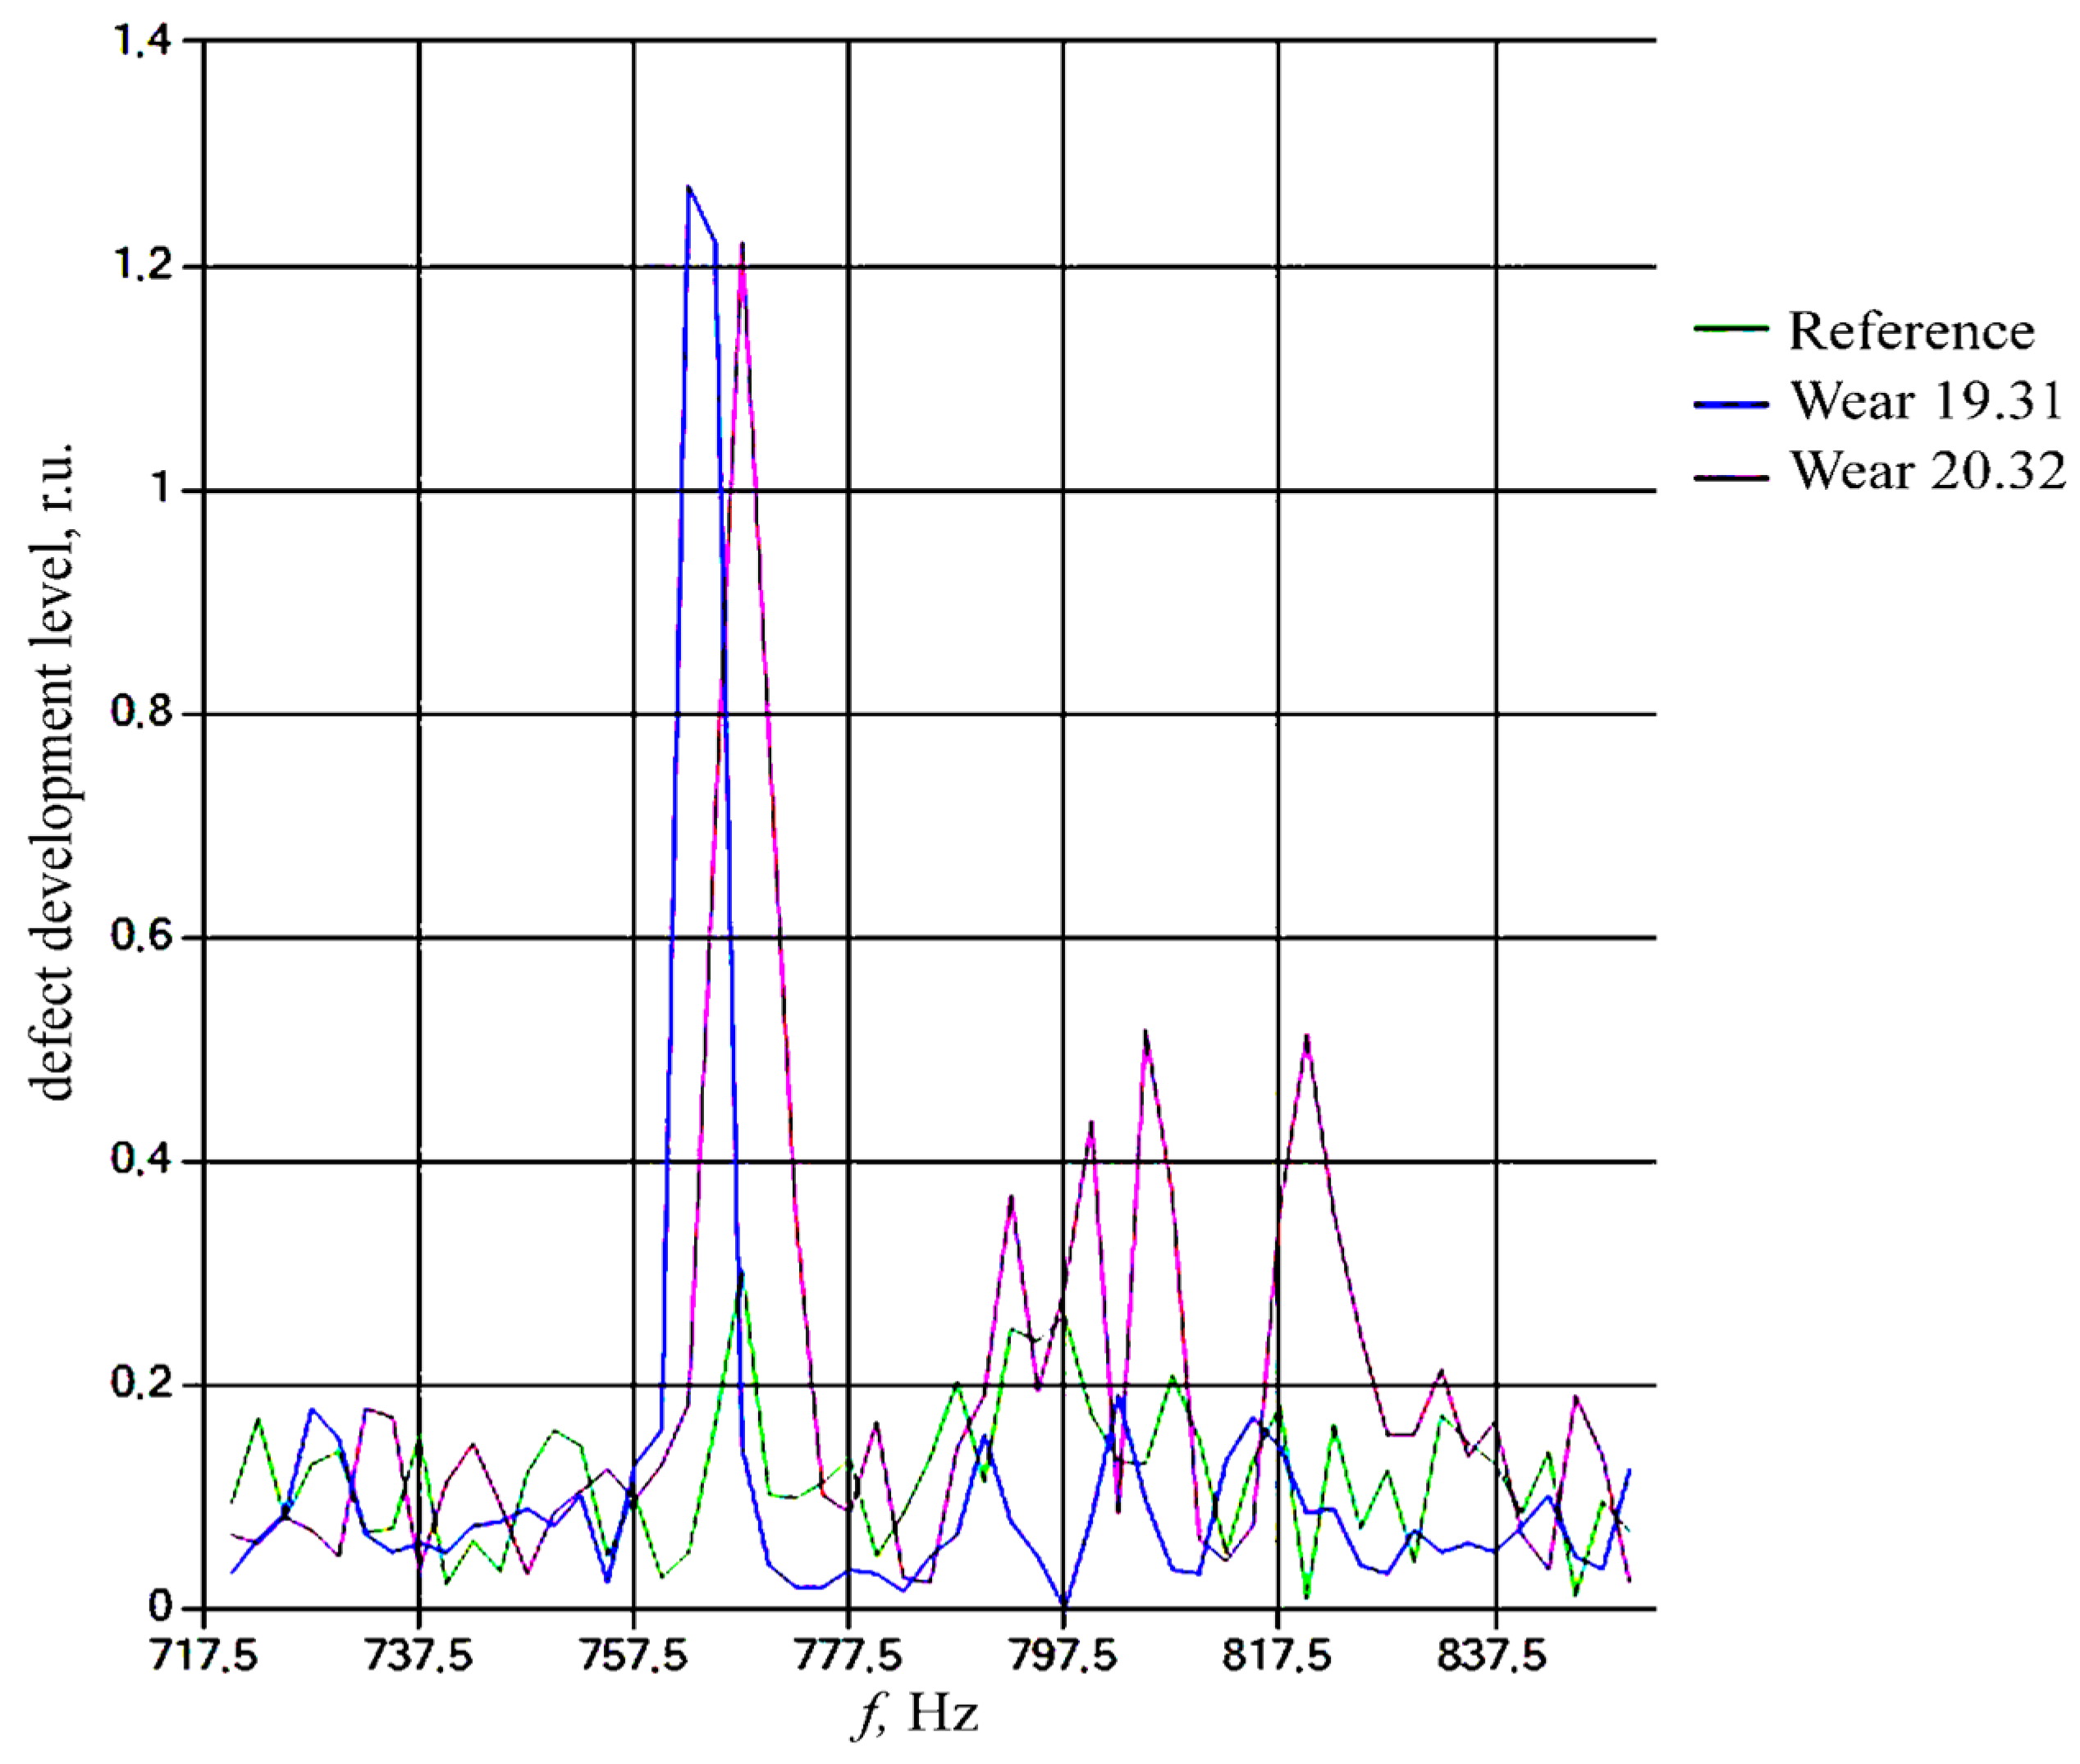
12]. The frequency of runout due to irregularities in the commutator side lies in a wide range from 750 to 850 Hz, from 150 to 500 Hz (developing defects in bearings) and from 200 to 450 Hz (developing defects in the stator and on p [
13,
14].
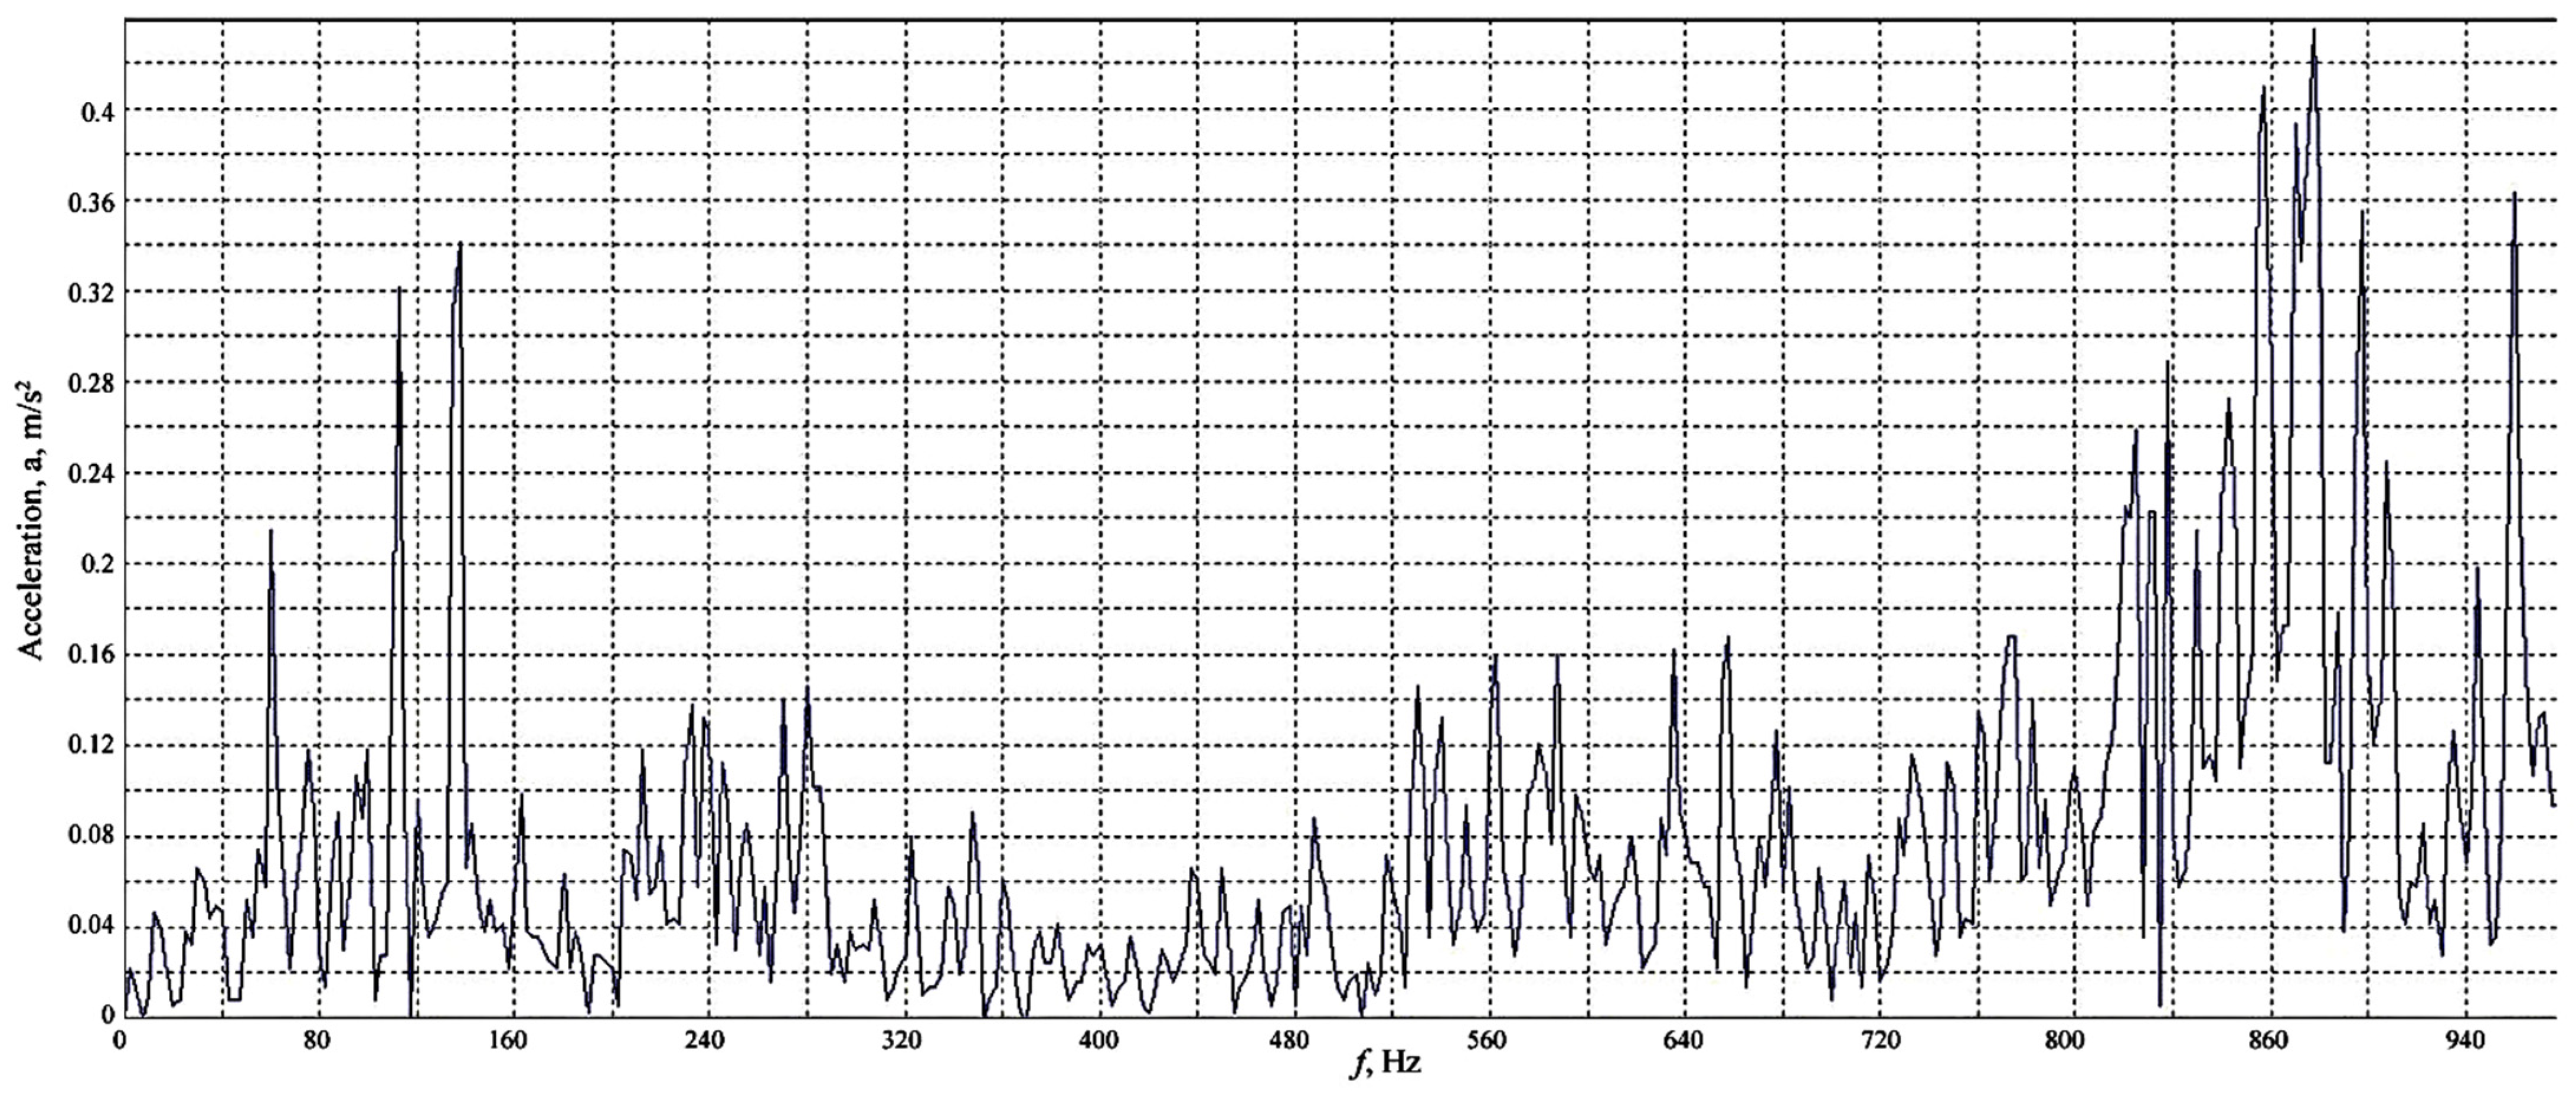
Figure 17 shows the complex frequency characteristic of the electric motor vibration spectrum; the character of failure is revealed by comparing the values of amplitudes [
15].
Output parameters after the implementation of this monitoring system are accuracy of TEM functioning; diagnostic characteristics are improved twofold; kinematic characteristics (due to the modernization of the brush clamping unit, which gives uniform pressure over the entire brush plane); economic performance increased by 30%; residual life of BCA is increased by 28–30%.
This monitoring continuously monitors the most important parameters of the operating condition of the equipment on BelAZ, and immediately gives warning whenever the measurement results exceed the permissible values [
16,
17]. It is an ideal system for monitoring the special characteristics of electric motor vibration signals [
18,
19,
43,
44,
45,
46]. It helps to predict the condition of electric equipment and the electric motor, to plan repair works, to prolong periods of equipment operation between repairs [
20,
21] and to exclude cases of emergency equipment shutdowns [
22]. Thus, it is possible not only to effectively manage the current technological and production processes [
47], but also to switch from scheduled to preventive maintenance [
47].
We obtained a mathematical model of frequency vibration of the brush–commutator unit and bearings in the DC traction motor, which would allow us to estimate parameters such as the time of wear and failure-free operation of the brush, the determination of the optimal mileage of the dump truck by the amount of brush wear, the probability of failure-free operation of the brushes, the degree of development of defects in the unit, the residual life of brushes compared to the ultimate permissible wear, the rate of wear on the brushes depending on the time of operation [
48,
49,
50]. According to the results of the model it is possible to form a conclusion about the serviceability of the brush according to its actual technical condition [
51].
To implement this model, as a result of analyzing the data on the operation of traction motors of BelAZ dump trucks, the percentage of failures associated with brush wear was determined. The frequency-spectral range of the brush–commutator unit of the dump truck is determined. It is necessary to increase the reliability of diagnostic assessments, which is achieved by controlling the actual modes of operation and control of diagnostic parameters (vibration, wear height, runout, clamping force), characterizing the process of degradation of the actual technical condition of the BCA unit, as well as to develop a method to control the vibrations in BCA units.
Thus, an effective and convenient method of diagnostics and vibration monitoring for brush–commutator units in DC traction motors was created, as well as an arsenal of new methods of electric motor diagnostics being synthesized. Thus, the accuracy of diagnostics is increased, the possibility of remote diagnostics is provided, the procedure of diagnostics is simplified (not requiring disconnection of the electric motor) and the possibility of the full automation of the process of diagnostics is provided.
Vibration diagnostics, as well as other methods of technical diagnostics, solves the problems of troubleshooting and assessing the technical condition of the object under study. When the motor is running, the commutator and bearing rotate together with its shaft, and analyzed signals are taken from them. In the process of analysis, these signals are converted into an amplitude-frequency spectrum of harmonic components, which reflects the contribution of each harmonic to the measured state.
During the operation of the motor, the motor housing vibrates due to the rotation of the shaft and the operation of components located on the motor housing. These vibrations cause the armature and poles of the motor to vibrate, and for this reason, affect the character of the generated voltage, which contains a constant component if a DC voltage generator is used, or a fundamental harmonic if an AC voltage generator is used, and additional components of two kinds. The first are determined by vibrations in the absence of defects and appear in the reference spectrum after processing. The second are caused by the appearance and development of defects, and the resulting vibrations are reflected in the real spectrum. Defects arise in the form of system failures leading to the occurrence of detonation, shifts of resonance frequencies of motor vibration associated with violations and failures in fastening elements, the appearance of microcracks and the destruction of the housing, fan blades, bearings, etc. These defects are associated with the appearance of additional harmonics in the analyzed spectrum with frequencies both below and above the frequency of the main harmonic. All these additional harmonics introduce changes in the spectrum obtained after measurement and conversion of the analyzed voltage. It differs from the reference spectrum that occurs in the absence of defects. In the presence of previously obtained information about possible changes in the spectrum, in the case of the occurrence of a particular defect of the motor or its units, the spectrum of a specific defect is obtained. Further detection of such defects is simplified. After estimating the rate of change in the corresponding harmonic component, the task of detecting and predicting the development of a particular defect is solved with the determination of the time to possible failure of the motor or its units.
Vibrodiagnostics of machine defects leading to a discrete vibration spectrum are carried out mainly by means of frequency recognition of vibration components of the spectrum caused by defects and appearing at strictly defined frequencies.
This method is based on spectral analysis: the procedure of recording electric motor signals to determine the presence of electrical and mechanical faults on the brush commutator unit and on the bearings.
If it is possible to continuously monitor the parameters (vibration and brush wear) of the technical condition of BCA with the help of the complex method, simplified methods can be used, in which the prediction is carried out on the basis of one parameter of the technical condition:
- -
for BCAs operating under conditions of static loading and general uniform loading, the calculation is carried out on the basis of brush height reduction (
Figure 14);
- -
for BCA, for which the volume of information accumulated on the functional parameters is sufficient for the extrapolation of values for the subsequent period of operation, the calculation is carried out on change of these parameters to the limit values (
Figure 15);
- -
for bearings operating under conditions of constant rotation, the calculation is performed on the presence of defects and their development (
Figure 9).
A distinctive feature of vibrations in rotating elements and parts of the electric motor is that the largest amplitudes are observed in the transverse direction, and the vibration signal is transmitted through the housing parts well.
Thus, by installing the sensor on the body of the unit, it is possible to obtain initial information about the vibration state of the parameters of each bearing and the parameters of the BCA. However, it should be considered that the vibration signal is significantly attenuated when it is transmitted through a large number of interfaces between parts, especially housing parts.
During TEM operation, vibrations are generated in the bearings over a wide frequency range. The occurrence of vibrations in bearings is due to their design features. The constituent elements (shaft, armature, BCA and bearings), which perform complex kinematic motion with different angular velocities, result in a spectrum of vibrations ranging from low to high frequencies. Inaccuracies in the bearing parts created during manufacturing also contribute to vibrations. These include the difference between the outer and inner rings, non-roundness and roughness of the rolling elements and ring races, errors caused by assembly defects, including misalignment of outer and inner rings, and unbalanced rotating shafts (
Figure 11).
The vibration signal carries a lot of information about the condition of both the electric motor and its components (bearings, BCA, armature and shaft;
Figure 17), but in its initial form, the vibration signal does not allow to determine the degree of defect development. To obtain a more complete picture of the TEM condition, various methods and means of vibration signal analysis and transformation are used.
Thanks to the diagnostics, including vibrodiagnostics, proposed in the article, timely detected defects and pre-prepared spare parts can reduce significant losses of working time and contribute to reducing the downtime of the electric motor in repair due to the replacement of faulty assemblies and parts.
Diagnostics takes into account the full range and diversity of possible modes of operation, the presence of defects, failures, operating conditions of the electric motor and their static characteristics. The detected defects are categorized as acceptable or unacceptable and a decision is made on the possibility of further operation, i.e., the need to repair the TEM or take it out of service.
Program tests have the greatest effect:
The volume of accumulated data allows the application of statistical methods of evaluation of output parameters;
They include forecasting of possible changes of output parameters in time using all types of available information;
In the process of operation apply diagnostic methods to assess the causes affecting the output parameters;
Optimize the output parameters of the units that determine their technical characteristics.
Output parameters in electric motor vibrodiagnostics are numerical indicators of technical characteristics of nodes, determining its condition and its ability to perform the specified functions, i.e., characteristics that determine the quality of the product. Output parameters after implementation of this monitoring system are:
- -
accuracy of TEM functioning;
- -
diagnostic characteristics are improved twofold (
Table 3);
- -
kinematic characteristics (due to the modernization of the brush clamping unit, which gives uniform pressure over the entire brush plane);
- -
economic performance is increased by 30%;
- -
residual life of BCA is increased by 28–30%.
In the process of operation, the elements of the brush–commutator unit in the motor and its other components can be subjected to extreme (beyond design) impacts, as a result of which a number of their elements will be damaged. Under these conditions, the performance of BCAs will be determined by their ability to perform their prescribed functions. Systems that are more resilient will collapse gradually, while retaining limited serviceability. This allows protective measures to be taken (repair, replacement of damaged elements, transition to a safe operating mode, emergency shutdown of the system, etc.), thereby reducing the consequences of an accident mainly to the primary damage from damage to the system elements. Systems with low stability are destroyed abruptly and catastrophically, which is accompanied by significant secondary and cascading damages that are disproportionate to the initiating effects. Thus, thanks to the proposed diagnostic model, we obtain a system with a large level of stability, which allows us to minimize random failures of BCA elements during the long period of TEM operation.
Thus, an effective and convenient method of diagnosing and monitoring the vibration of brush–commutator units in DC motors has been created, and also the arsenal of methods of diagnostics of electric motors has been expanded. Thus, the accuracy of diagnostics is increased, the possibility of remote diagnostics (at a distance from the electric motor) is provided, the procedure of diagnostics is simplified (does not require disconnection of the electric motor) and the possibility of full automation of the process of diagnostics is provided. Diagnostic capabilities for determining the presence of electrical and mechanical damage of the electric motor have also been extended.


 ,
, 


