1. Introduction
Governments are encouraging automotive manufacturers to develop electric vehicles (EVs) due to environmental concerns and future scarcity of fuel. High torque, accurate control, short acceleration times and high cruising speeds are requirements for electric vehicles that are directly tied to the characteristics of their electric motors. The proper design of the electric machines for EV applications should have the characteristics of high performance, high efficiency, low-cost, high-power density, extended flux weakening range, ease of manufacturing, and high reliability [
1,
2,
3,
4,
5].
The interior permanent magnet (IPM) machine and the induction machine (IM) are the most advantageous topologies for EV traction motors. The IM has several advantages, including low cost, high reliability, easy controllability, and well-developed manufacturing technology. However, because of rotor copper losses, it has poor efficiency and low power factor at low speeds [
2]. The IPM is more efficient and has a higher power density than the IM. However, its complex control method, increased cost, sensitive supply chain, and vulnerability to irreversible demagnetization (ID) are some of the challenges with widespread adoption of the IPM [
3,
6].
Both machines therefore have their own advantages and disadvantages. Previous studies reveal that delivering similar performance requires a larger IM with higher current ratings. Despite this, the technology is well established in the automotive industry (e.g., Tesla 60S, Audi e-tron) as a PM-free motor and could still represent an attractive and feasible solution for future EVs. The use of rare earth PMs can give significant concerns for electric machine manufacturers in terms of cost, diversity of supply chain, cost volatility and long-term sustainability. Alternative materials used in electrical machines have a different impact level on the environment. To evaluate and compare their impact, an investigation study has been carried out in Sweden that includes an impact assessment (characterization and weighting) method for assigning a monetary value to emissions and the use of natural resource. The results of the study impact assessment method are ‘damage costs’ for emissions and the use of natural resources expressed as ELU (Environmental Load Units). ELU 1 corresponds to EUR 1 environmental damage cost. The ELU of goods is evaluated considering the ISO standards for life cycle assessment (LSA) (ISO 14044 [
7] and ISO 14008 [
8]), which is on the monetary valuation of environmental impacts. The details of ELU for used material in electrical machines is illustrated in
Table 1 [
9,
10].
Regarding ELU, the highest negative impact on the environment is associated with rare earth material (REM), due to its very energy intensive mining and environmentally damaging manufacturing processes. The processing of rare earth elements into high-purity rare-earth oxides requires significant experience in mineral processing [
11]. Therefore, it is interesting to investigate alternative, potentially more sustainable electric machines.
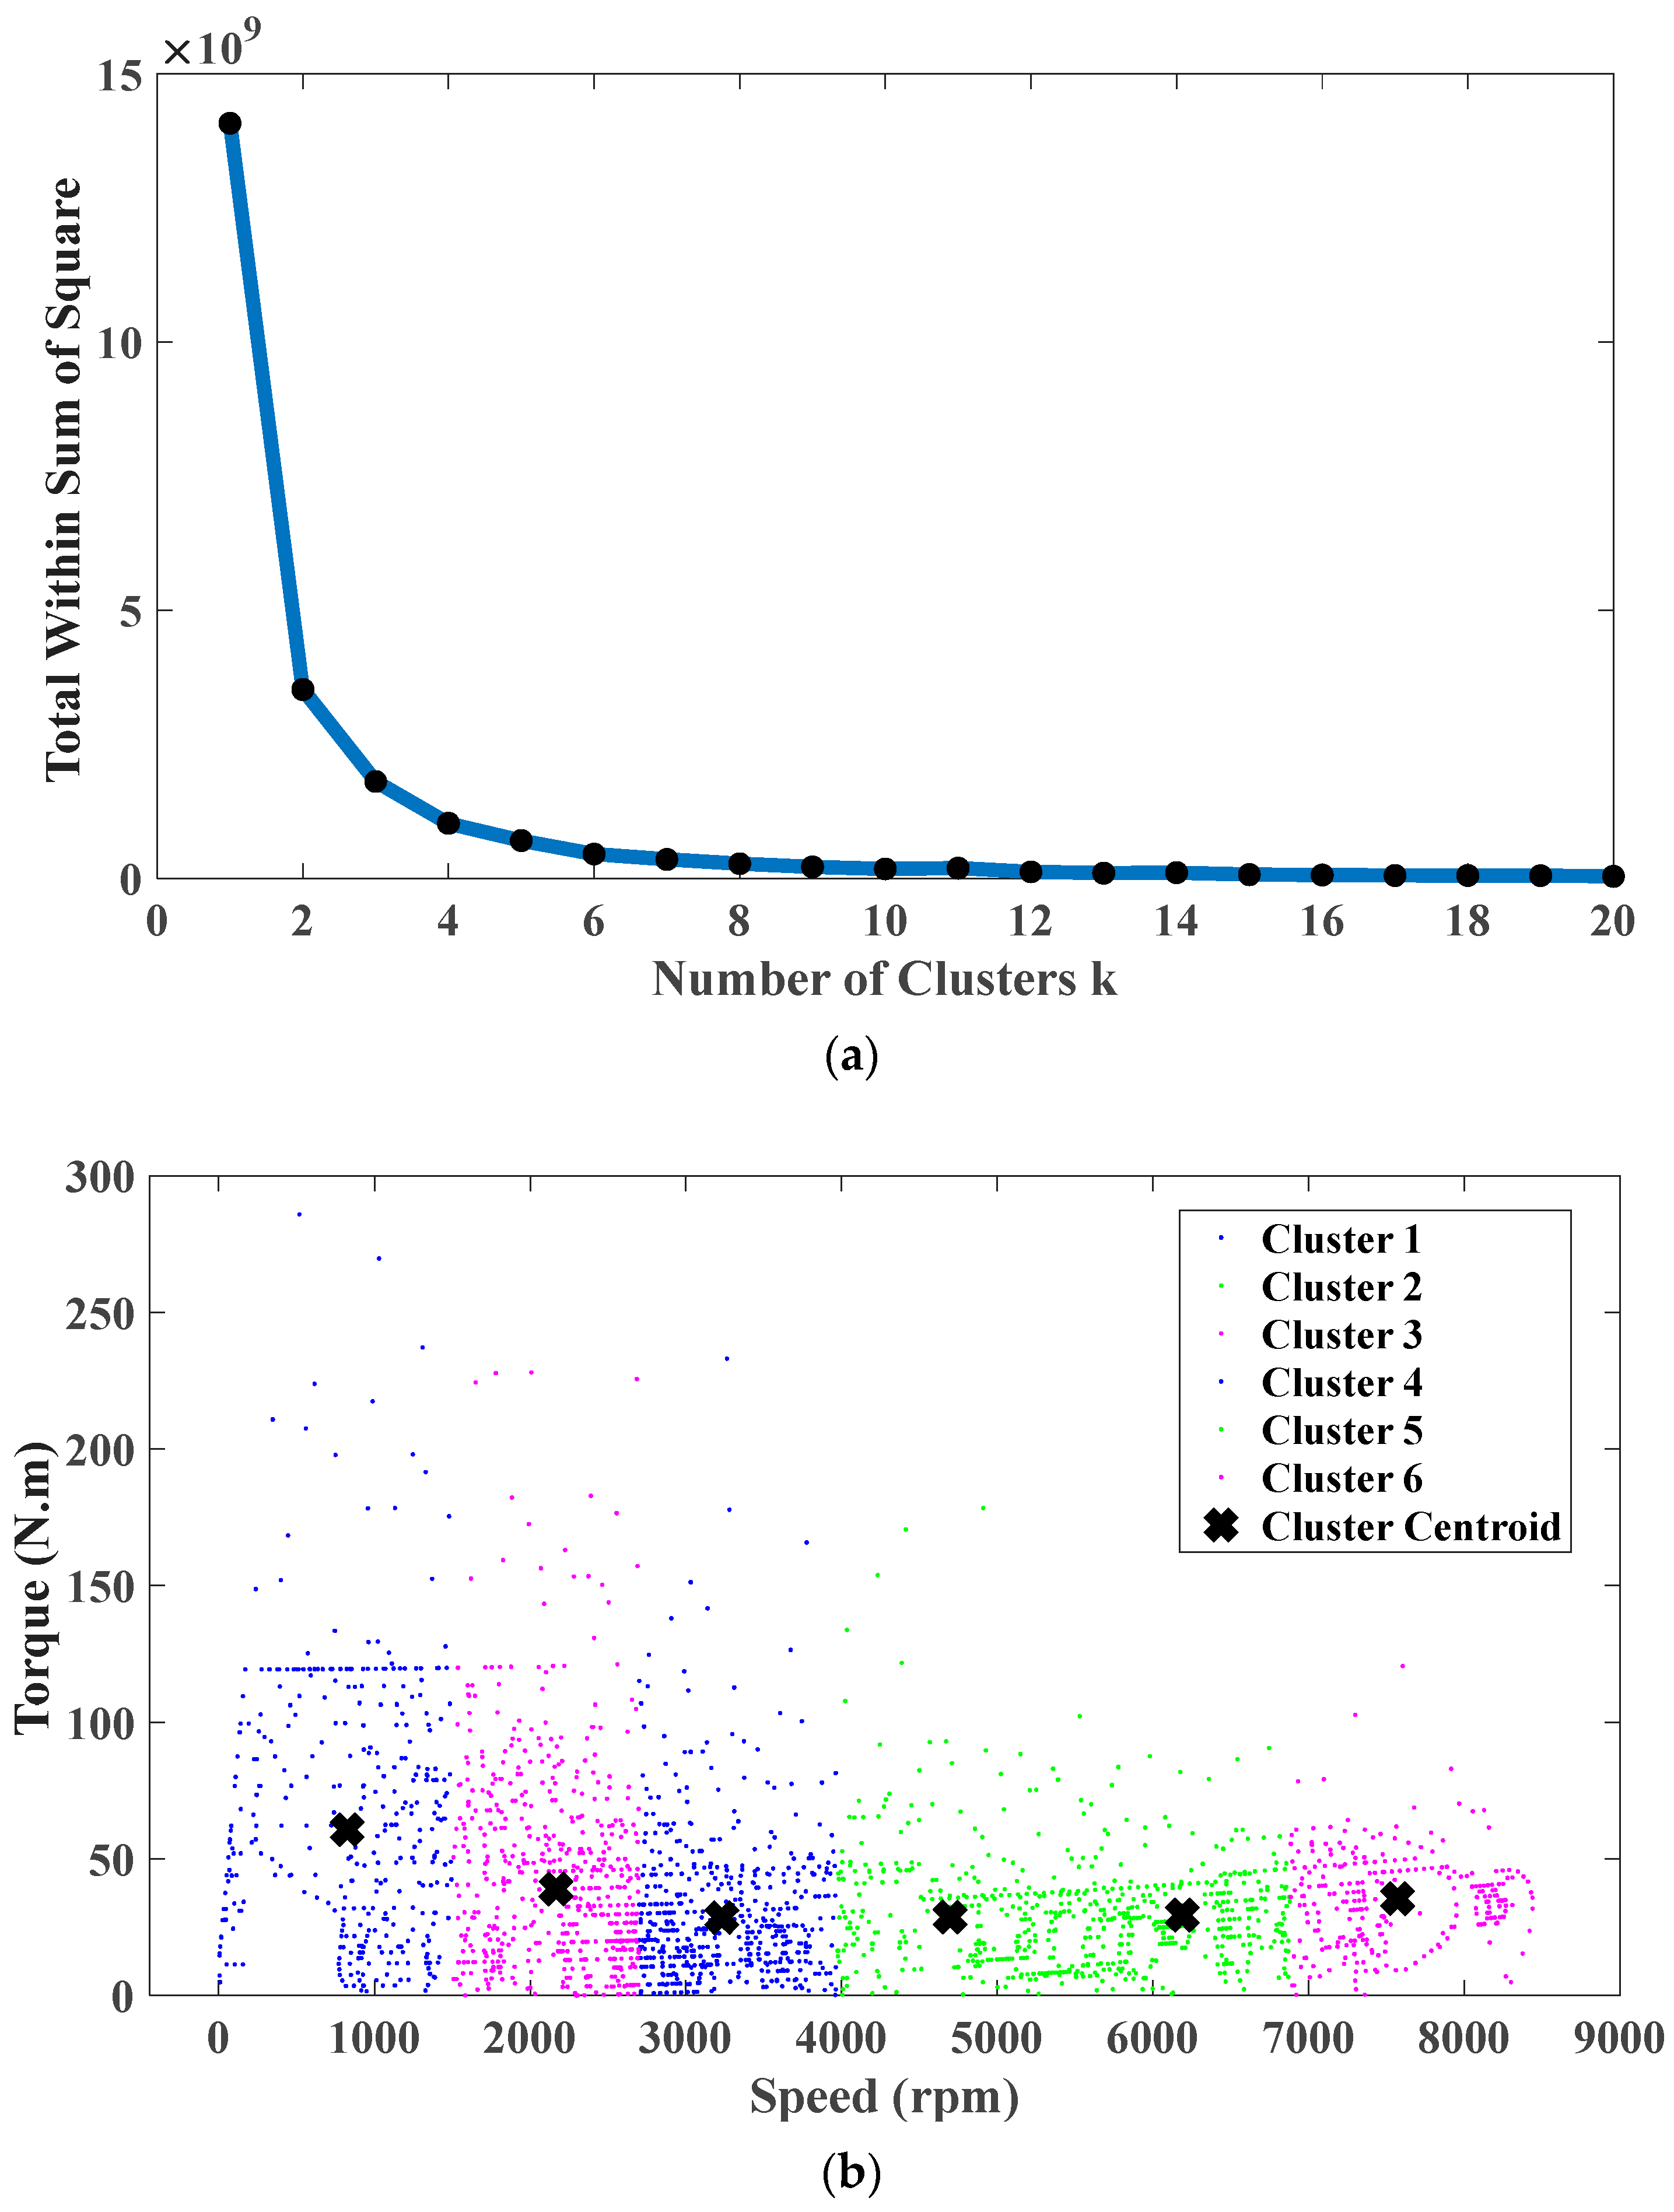
One of the important aspects of sustainable design is increasing efficiency, thereby reducing the environmental impact during the operational lifetime. The proper design of electrical machines for EV applications must consider its working conditions, which can differ from that of other industrial applications. In conventional industrial applications, the electric motor can be designed to efficiently operate at one or two operating points. In EVs, however, the machine needs to operate at a wide range of speed–torque points. Therefore, for this application, the driving cycle should be considered in the design and optimization process. To increase the vehicle range and increase the efficiency of the vehicle, it is necessary to extend the region with the highest efficiency and locate the most efficient region where more operating points are located [
12]. The number of operating points over the driving cycles can be several thousand. Performing the conventional FE-based optimization approaches can easily result in enormous computational time. Therefore, it is necessary to use some methods to reduce the number of operating points or use the developed analytical models to reduce the optimization time. Regarding reducing the number of operating points, approaches like Energy Center of Gravity [
13], Geometric Center of Gravity [
14,
15], and k-means [
10,
16,
17,
18] clustering are utilized to convert the total working points of the machine to several representing points. In the second approach, the researcher used the analytical models instead of FE, as the computational time is significantly lower, and it is possible to consider all the operating points in the optimization procedure. The utilized analytical models for this purpose are the adaptive network-based fuzzy interface system model [
19], reluctance circuit model [
20], sub-domain analytical model [
21], and meta-model-based approach [
22].
Regarding the optimal selection of stator slot rotor bar (SSRB) combination, various articles for other industry applications can be found. The investigations have covered different combinations of SSRB from the point of view of noise [
23], vibration, crawling, steady-state performance [
24,
25], rotor bar current waveform [
26], etc.
Regarding the optimum shape design of stator slot and rotor bar of the IM, Ref. [
27] examines the pulsating torque of an induction machine from the standpoint of designing appropriate stator slot and rotor bar dimensions. Ref. [
28] presents the design principles of an induction motor used in a hybrid EV, considering the effects of starting, operating performance, and harmonics. In [
29], a parametric study was conducted to examine the effect of stator and rotor slot dimensions on various performance parameters, and an evolutionary algorithm was used for IM design optimization.
Regarding the design of IM for EV application, in [
30], an optimization procedure has been introduced that can consider the overload capability of the IM over the driving cycle. The overload has been investigated by checking the hotspot temperature of the winding. In [
31], a 200 kW 370 N.m IM has been designed for an EV with the target of enhancing the performance for mass production. To achieve this goal, suitable materials and manufacturing processes like rotor die-casting, hairpin stator winding, and a specific cooling system have been investigated. In [
32], a low-cost totally enclosed fan IM with an aluminum-cage rotor IM has been designed for city battery EVs. In the optimization process, to accurately size the thermos-electromagnetic parts of the IM, the FE model and thermal model are coupled.
The contribution of this paper is presenting a systematic approach for the design optimization of IM over a driving cycle, considering different SSRB combinations. In the presented process, a series of empirical and mathematical relationships will be systematically applied to reduce the number of possible SSRB combinations. Then, the admissible optimal combinations will be investigated and compared over driving cycle using FE simulation. Finally, for the best three SSRB combinations the design optimization over driving cycle is presented.
The remainder of this article is organized as follows. In
Section 2, the proposed design optimization algorithm is introduced and possible SSRB combinations are obtained. In
Section 3, the initial design of the possible SSRB combinations is carried out and their performances are compared over the driving cycle. In
Section 4, the design optimization of the best three SSRB combinations is carried out over the driving cycle using representing points calculated using the k-means clustering algorithm. Finally, a comprehensive performance evaluation of optimized IMs is carried out in
Section 5, followed by the conclusion in
Section 6.
2. The Proposed Design Procedure
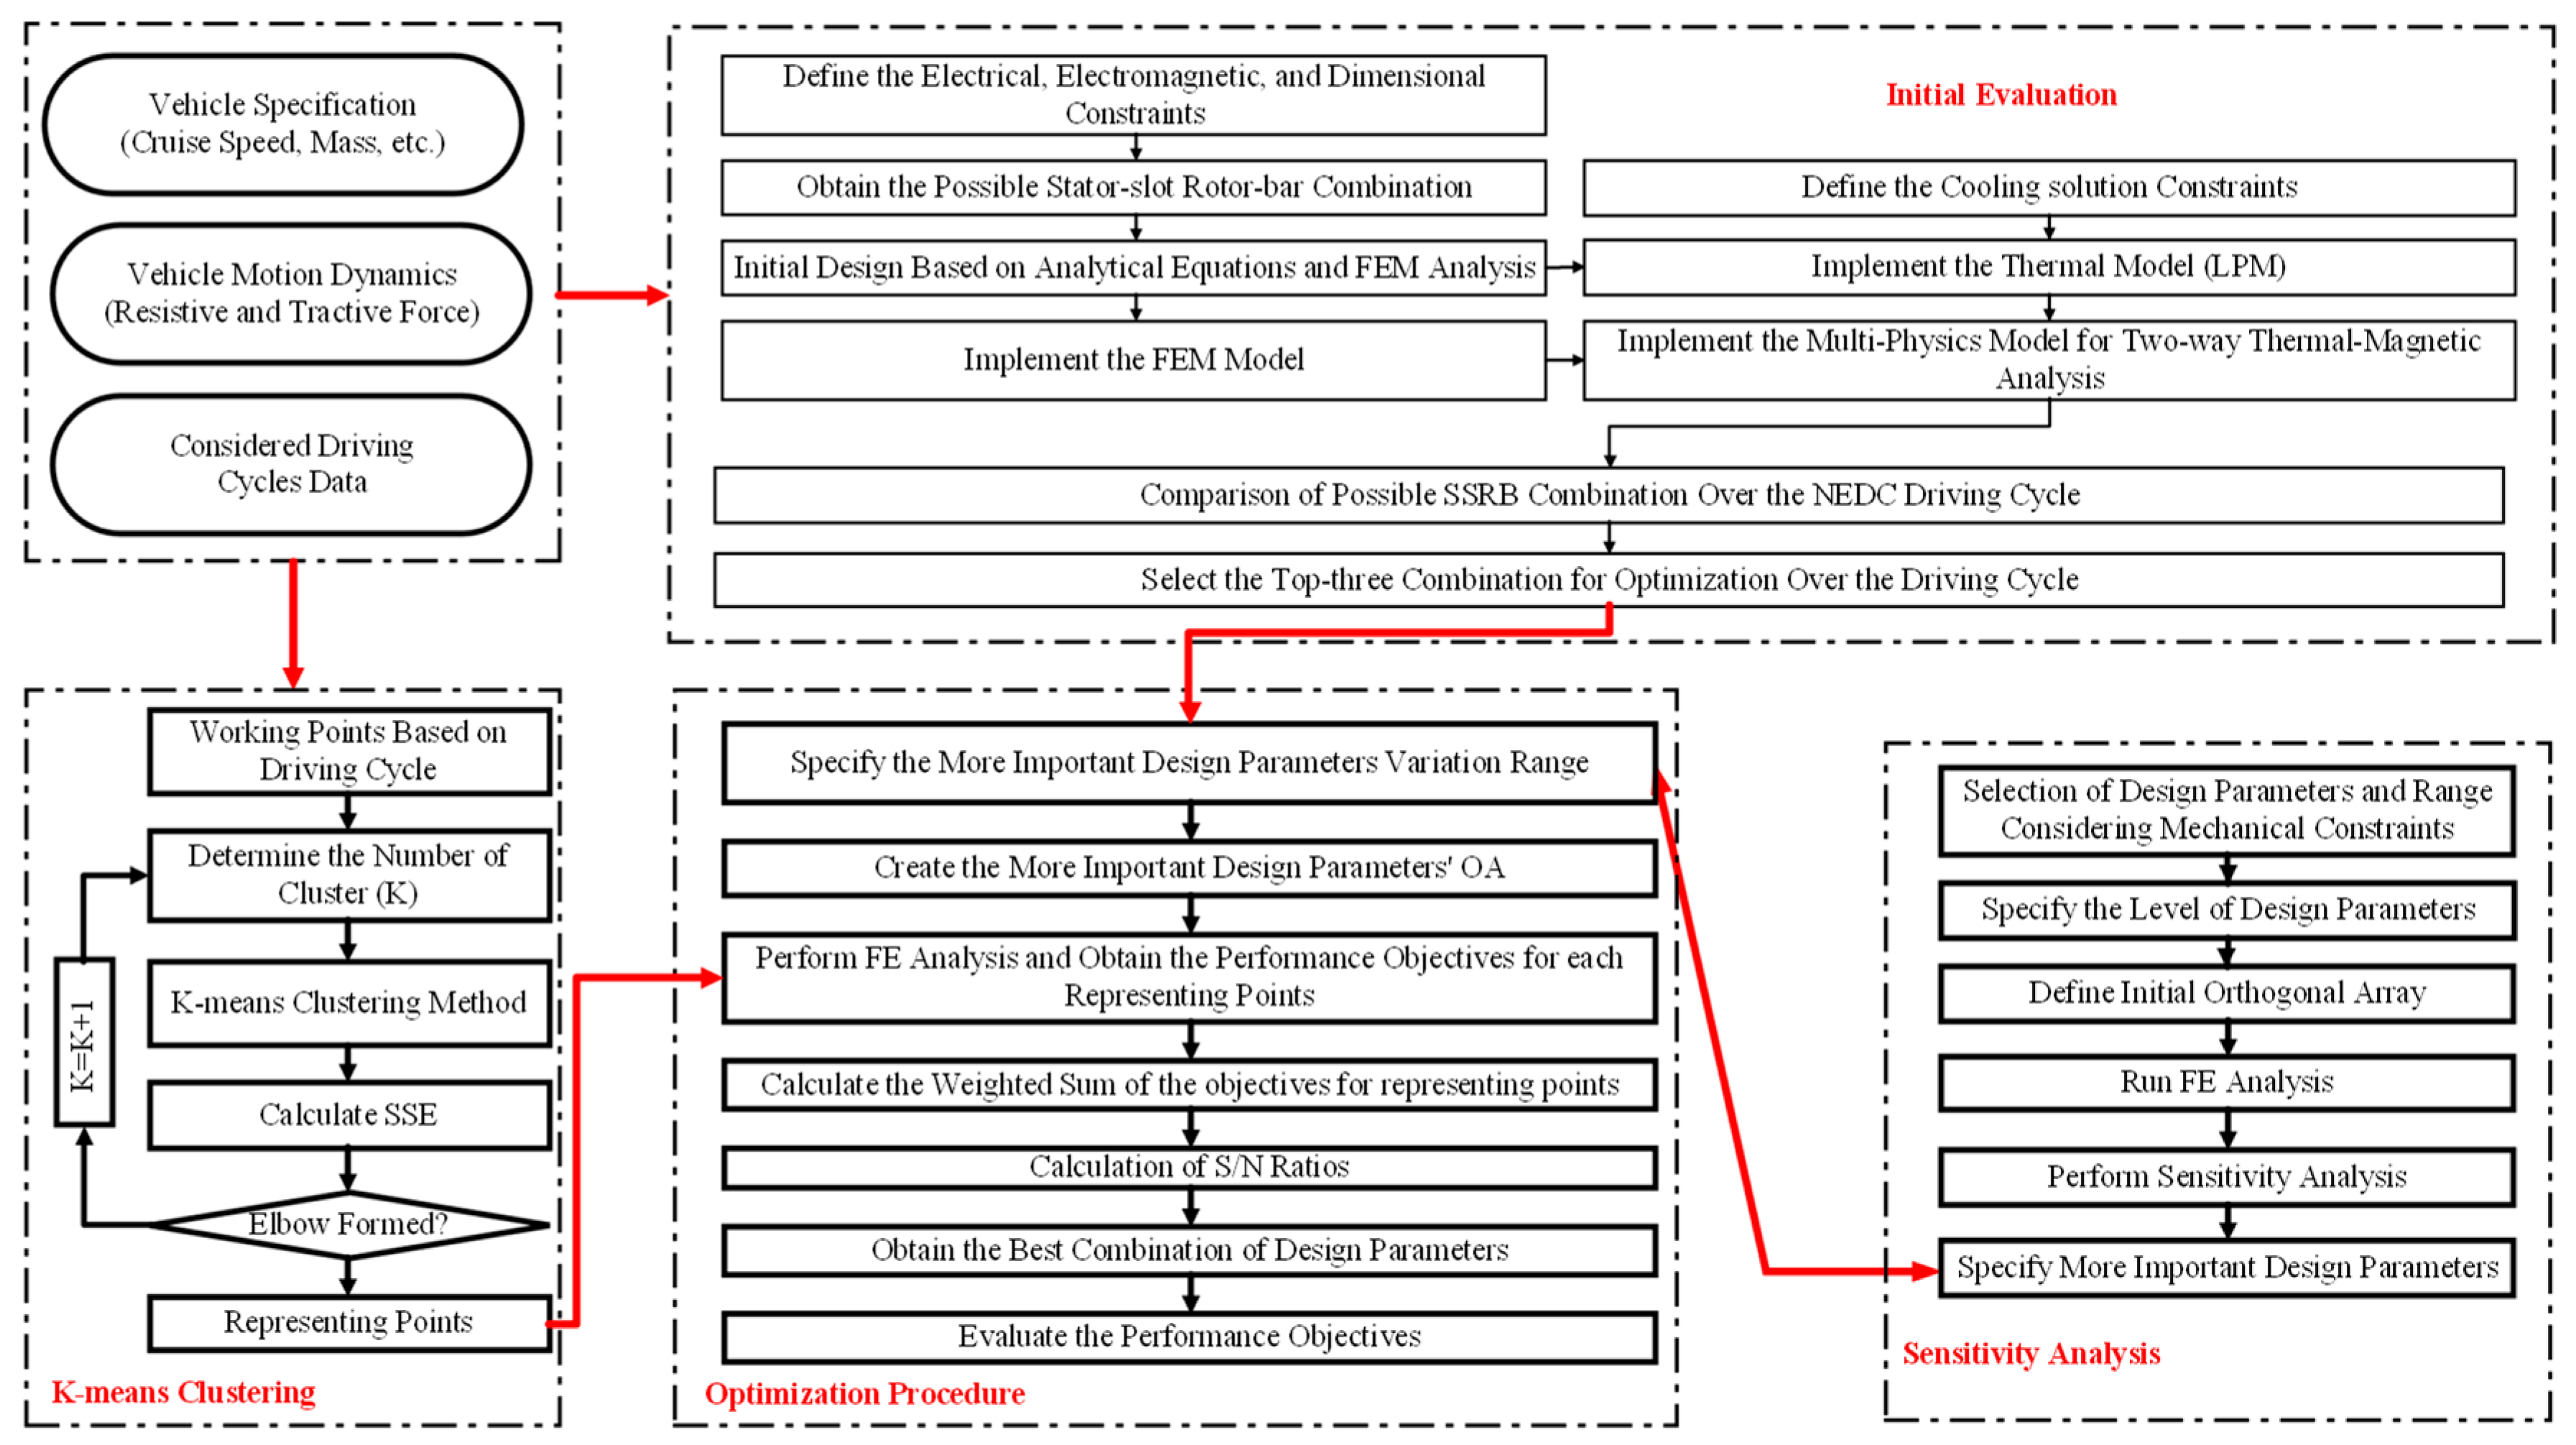
The proposed design optimization algorithm is shown in
Figure 1. The details of the proposed design optimization procedure are outlined below.
2.1. Conceptual Design
The required envelope curve of the traction motor for EV applications should be derived based on the driving cycles, vehicle features, and dynamic equations of the vehicle. The features and expectations of the considered vehicle are presented in
Table 2.
The dynamic behavior of the vehicle is modelled by two forces namely tractive force and resistive force. The tractive force is generated by the electric machine and acts on the wheel through the transmission system. The resistive force comprises three terms of tire rolling resistance, aerodynamic drag, and uphill resistance. According to [
33], Equation (1) can be used to calculate the power required by the traction motor, discussed in detail in [
33]. The overall process is to calculate the required power for drag and acceleration assuming ideal conditions. The first term in Equation (1) corresponds to the required power to accelerate the vehicle from zero speed to the base speed of
in
seconds at the slope of 0%. The second and third terms correspond to the required power for drag of the vehicle at the slope of 0%.
where
is the base speed of the motor,
is the efficiency of the transmission system, and
V is the vehicle speed. The mass correction factor (
can be calculated using Equation (2). This parameter is applied to consider the rotating inertial moment of the wheels (
) and power plant (
). In Equation (2), for passenger cars, the values of the
and
approximately are 0.04 and 0.0025, respectively [
33].
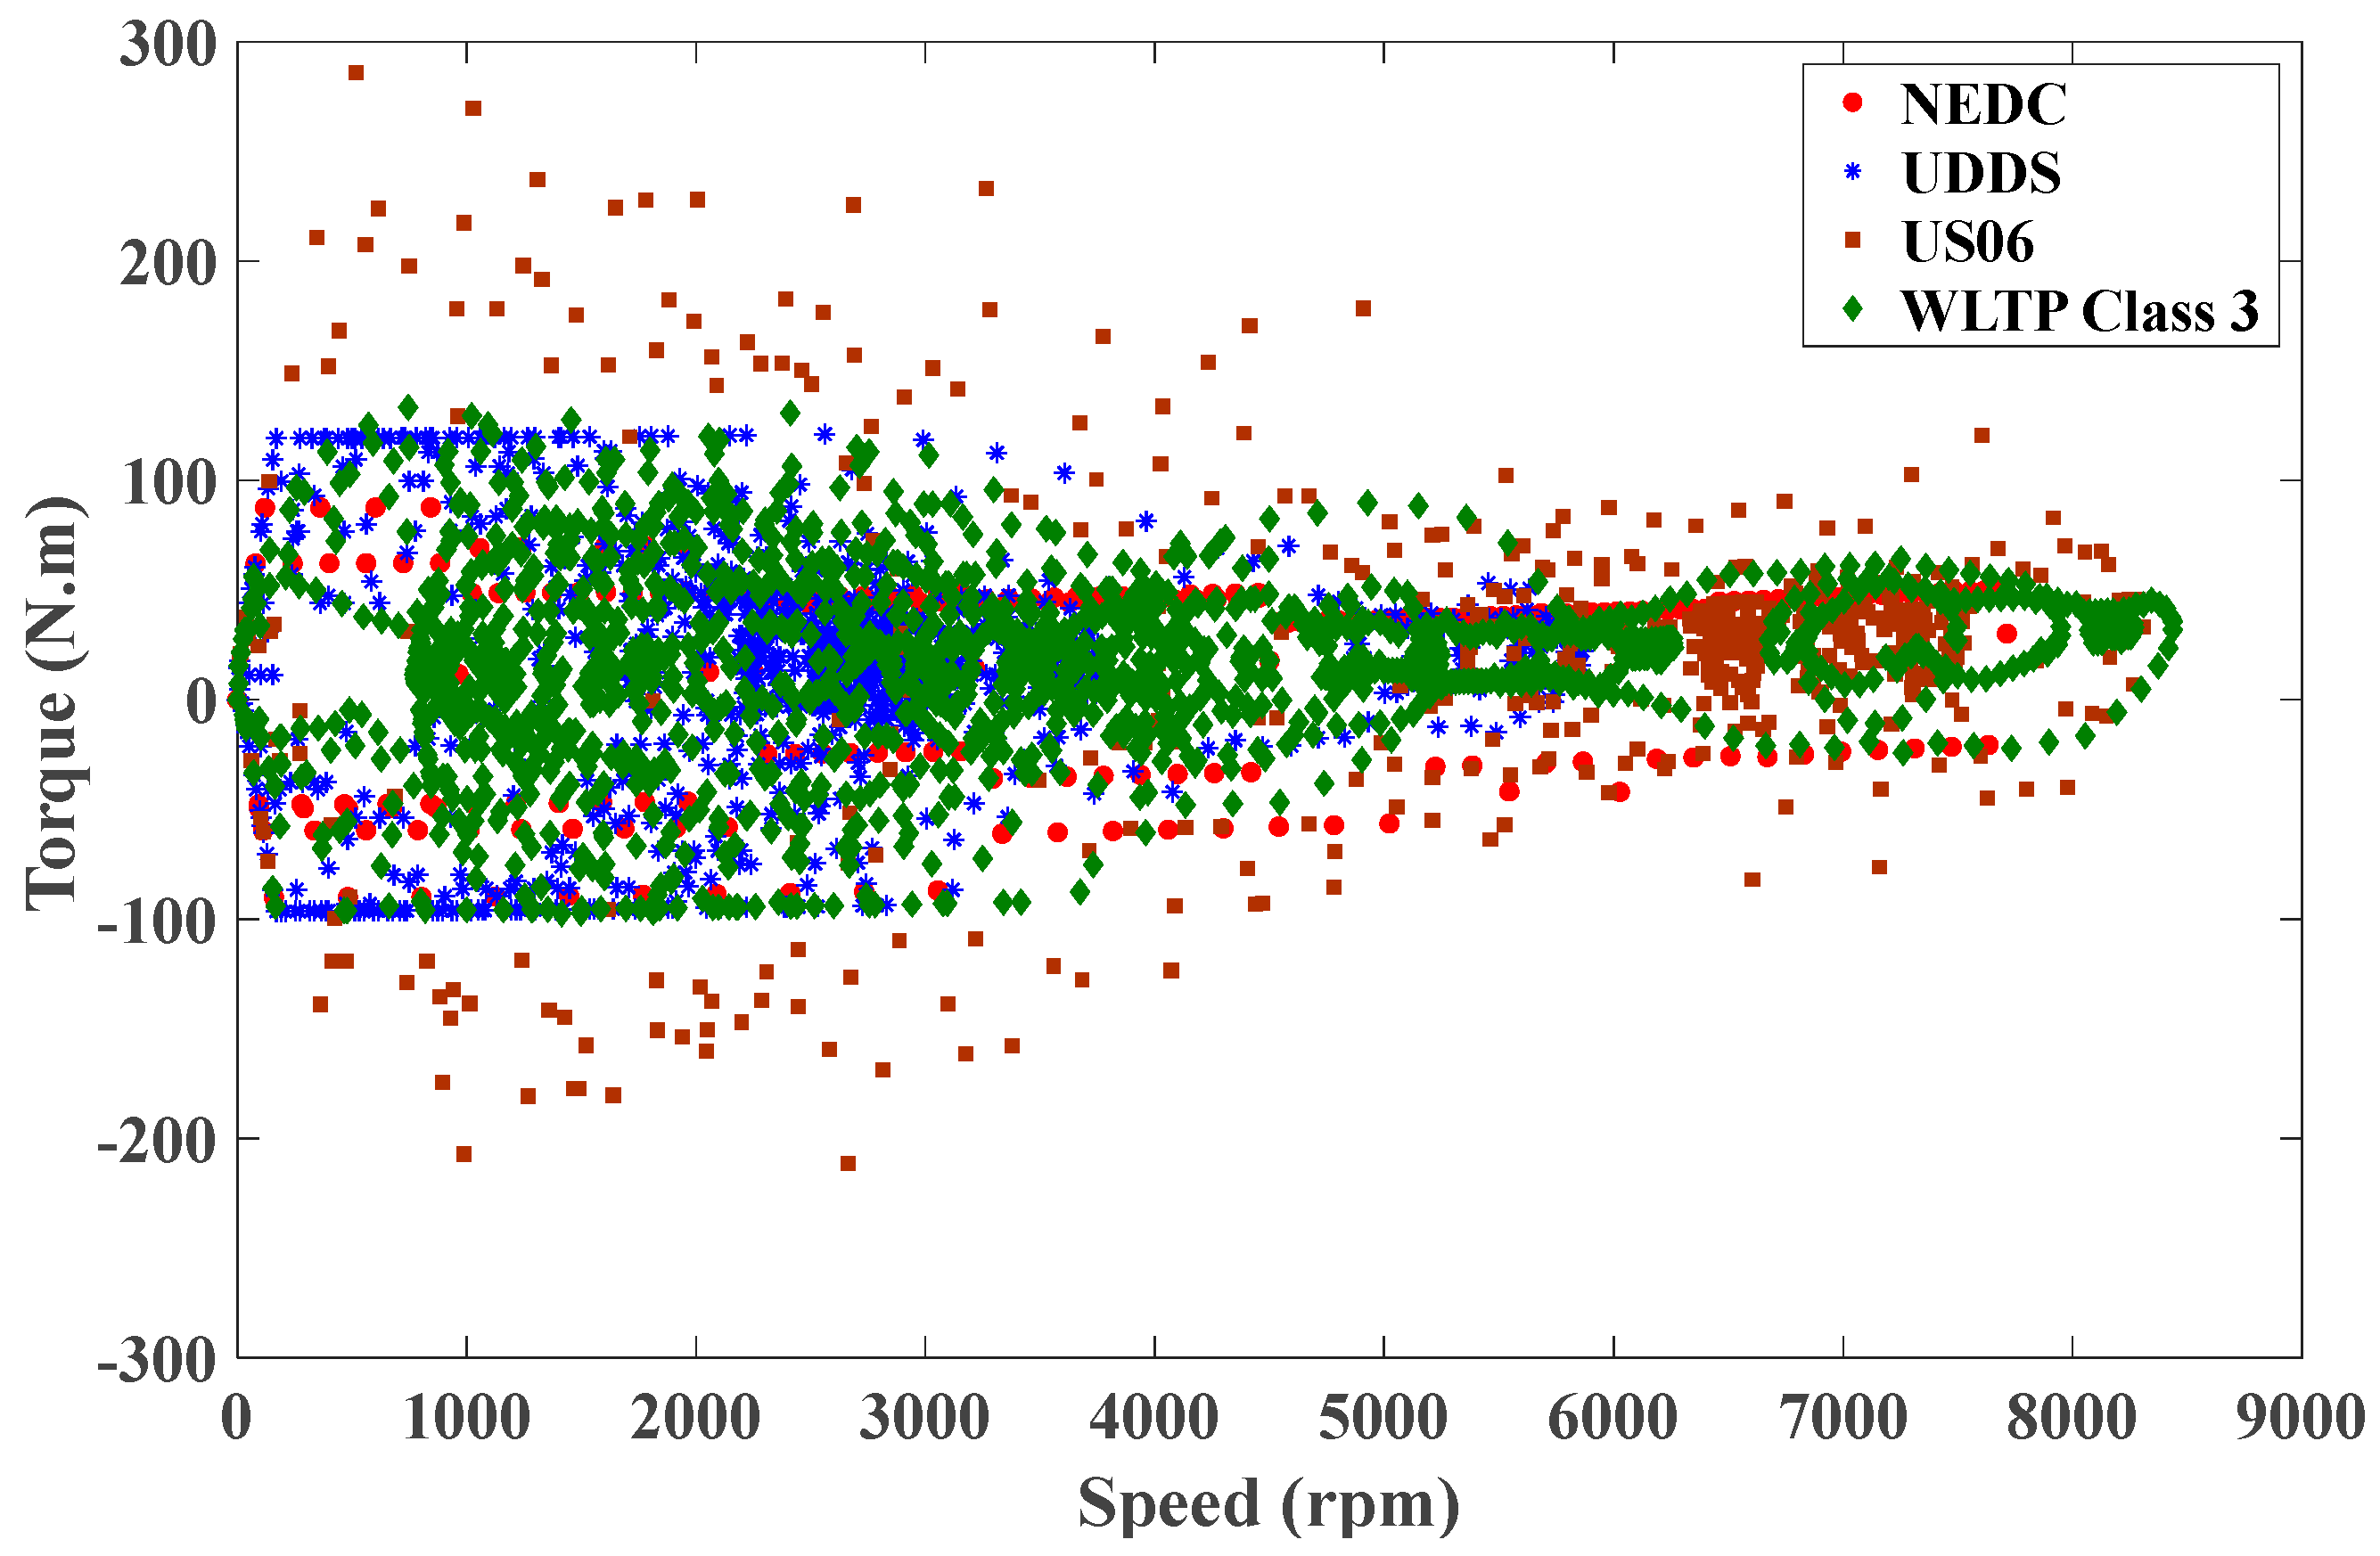
In order to extract the motoring and generating working points of the required electric machine under four driving cycles of US06, EUDC, NEDC, and WLTP, the vehicle dynamic equations are applied, and the resultant working points are illustrated in
Figure 2. Based on Equation (1) and the required working points, the parameter of
and required power of the electric machine will be determined. In this study, the parameters of
and
were determined to be 3800 rpm and 120 kW, respectively. In addition, to reach the top speed of 140 km/h, the maximum speed of the electric machine is set at 9000 rpm. Therefore, the required electric machine should be delivering a maximum torque of 300 N.m. until the speed of 3800 rpm is reached and, after that, working on the constant power mode until the speed of 9000 rpm is reached.
2.2. System Level Design Requirements
Considering the system level design of traction motors, there are some constraints regarding available space in the vehicle, the cooling system and inverter/battery constraints on current and voltage. The design constraints considered in this study are as shown in
Table 3.
2.3. Stator and Rotor Core Material
For an informed selection of electrical steel, it is necessary to consider the working frequency and required power density. The working frequency of the motor relates to the pole number and the required maximum rotating speed. In this study, the maximum speed is 9000 rpm, and the pole number is selected as 4. Therefore, the maximum working frequency is 300 Hz, and for this working frequency, the material of M350-35A is selected.
2.4. Squirrel Cage Material and Manufacturing Consideration
Induction squirrel cages can be made from aluminum or copper. Aluminum is low cost and has lower environmental costs and a lower mass density (direct effect on increasing torque density). It is easier to recycle electrical machines with aluminum coils compared to copper coils because aluminum can be recycled with steel, while recycling copper from steel is a polluting process. On the other hand, the low electrical conductivity of aluminum compared to copper may reduce its volume efficiency and increase the size of the windings and, thus, the mass of the motor. Therefore, in this study, copper is selected as the rotor cage material.
Copper cage IMs can be produced in two ways: brazing or die cast. The melting temperature of copper is above that of aluminum (1085 °C vs. 660 °C). Therefore, the use of the diecast process for copper cage IM requires very resistant and high-cost molds, which will lead to a significant increase in production costs. In addition, the above-mentioned molds will also be damaged after a period and will need to be replaced. Hence, it is more economical and conventional to use brazing. If the brazing process is selected, after welding the rotor bars to the end cage, it is necessary to stabilize the position of the rotor bars in the rotor slot by pounding. Therefore, the rotor slot must be an open slot type.
2.5. Electromagnetic Aspects
To minimize unbalanced magnetic forces in the radial direction, an even number of rotor bars is preferable to an odd number.
To ensure the absence of torque and current ripple associated with rotor slot harmonics, for an m-phase motor with p-pole pairs, the number of rotor bars (
) for any positive integer (
z) shall be dividing
or
as Equation (3) [
34]. The range of changes in the number of rotor bars is as shown using Equation (4), where
is the number of stator slots,
m is the number of phases,
p is the pair of poles, and
q is the number of slots per phase per pole.
The number of rotor bars should not be equal to the number of stator slots.
To prevent the creation of synchronous spikes, the difference between the stator slots and rotor bars should not be equal to 2
p, 4
p and 10
p [
35].
To limit the synchronous torques when the motor is at stall, the difference between the number of stator slots and rotor bars should not be equal to 6
p or any multiple of 6
p [
36].
To prevent noise and vibration, the difference between the number of stator slots and rotor bars should not be equal to 1, 2, 2
p + 1 and 2
p + 2 [
37].
A higher winding factor leads to a higher overload capability of the IM. The winding factor is the ratio of electromotive force produced by a stator with a short-pitch, distributed, or skewed winding, with a stator having full-pitch, concentrated, and non-skewed windings. The winding factor increases with an increase in the number of stator slots. Therefore, it is possible to eliminate the designs with winding factor less than 0.95. To calculate the winding factor, it is necessary to calculate the winding distribution coefficient (
) and winding pitch coefficient (
) using Equation (5).
where α is the angle between two adjacent slots in degree,
n is the number of slots per pole, and γ is the step shortness factor.
2.6. Manufacturing Aspects
There are a series of mechanical and dimensional limitations in the manufacturing process of IMs that limit the number of viable SSRB combinations: the minimum thickness of the stator teeth, the rotor bar width, and the rotor teeth width. The limit of 3 mm, based on previous experience, is considered the limit for these parameters and results in more reduction in possible SSRB combinations.
Applying the above-mentioned filters, the remaining viable SSRB combinations are mentioned in
Table 4.
3. Initial Design
By applying the mentioned filters, the number of available combinations has been greatly reduced. Now, to obtain the best possible combination, it is necessary to design 12 machines with the indicated SSRB combinations and compare their performance over an entire driving cycle. For initial designs, the conventional analytical design procedure is utilized and then the initial design is modified using finite element modelling (FEM).
For EV traction motors, the specific electrical and magnetic loading can assume water-cooling. The outer diameter and axial length of the machine are constrained by available space and overall mass restriction. Therefore, 12 IMs with a maximum power of 120 kW at 3800 rpm are analytically designed with the same outer stator diameter and axial length.
3.1. Cooling Solution and Thermal Analysis Model
To accurately extract the traction capability curve of the current traction motor, it is necessary to perform multi-physics electromagnetic–thermal analysis. Power density is limited by two factors: the maximum current density in the coils and the maximum flux density. While the maximum flux density is related to the magnetic properties of the material, the maximum allowable current of the windings is limited by the cooling system and insulation class. Therefore, the cooling system plays an important role and is a decisive factor in reducing the temperature or from another point of view; it allows an increase in the maximum current density at a constant winding temperature. Therefore, accurate and appropriate analysis of temperature distribution in different parts of the electric machine is important.
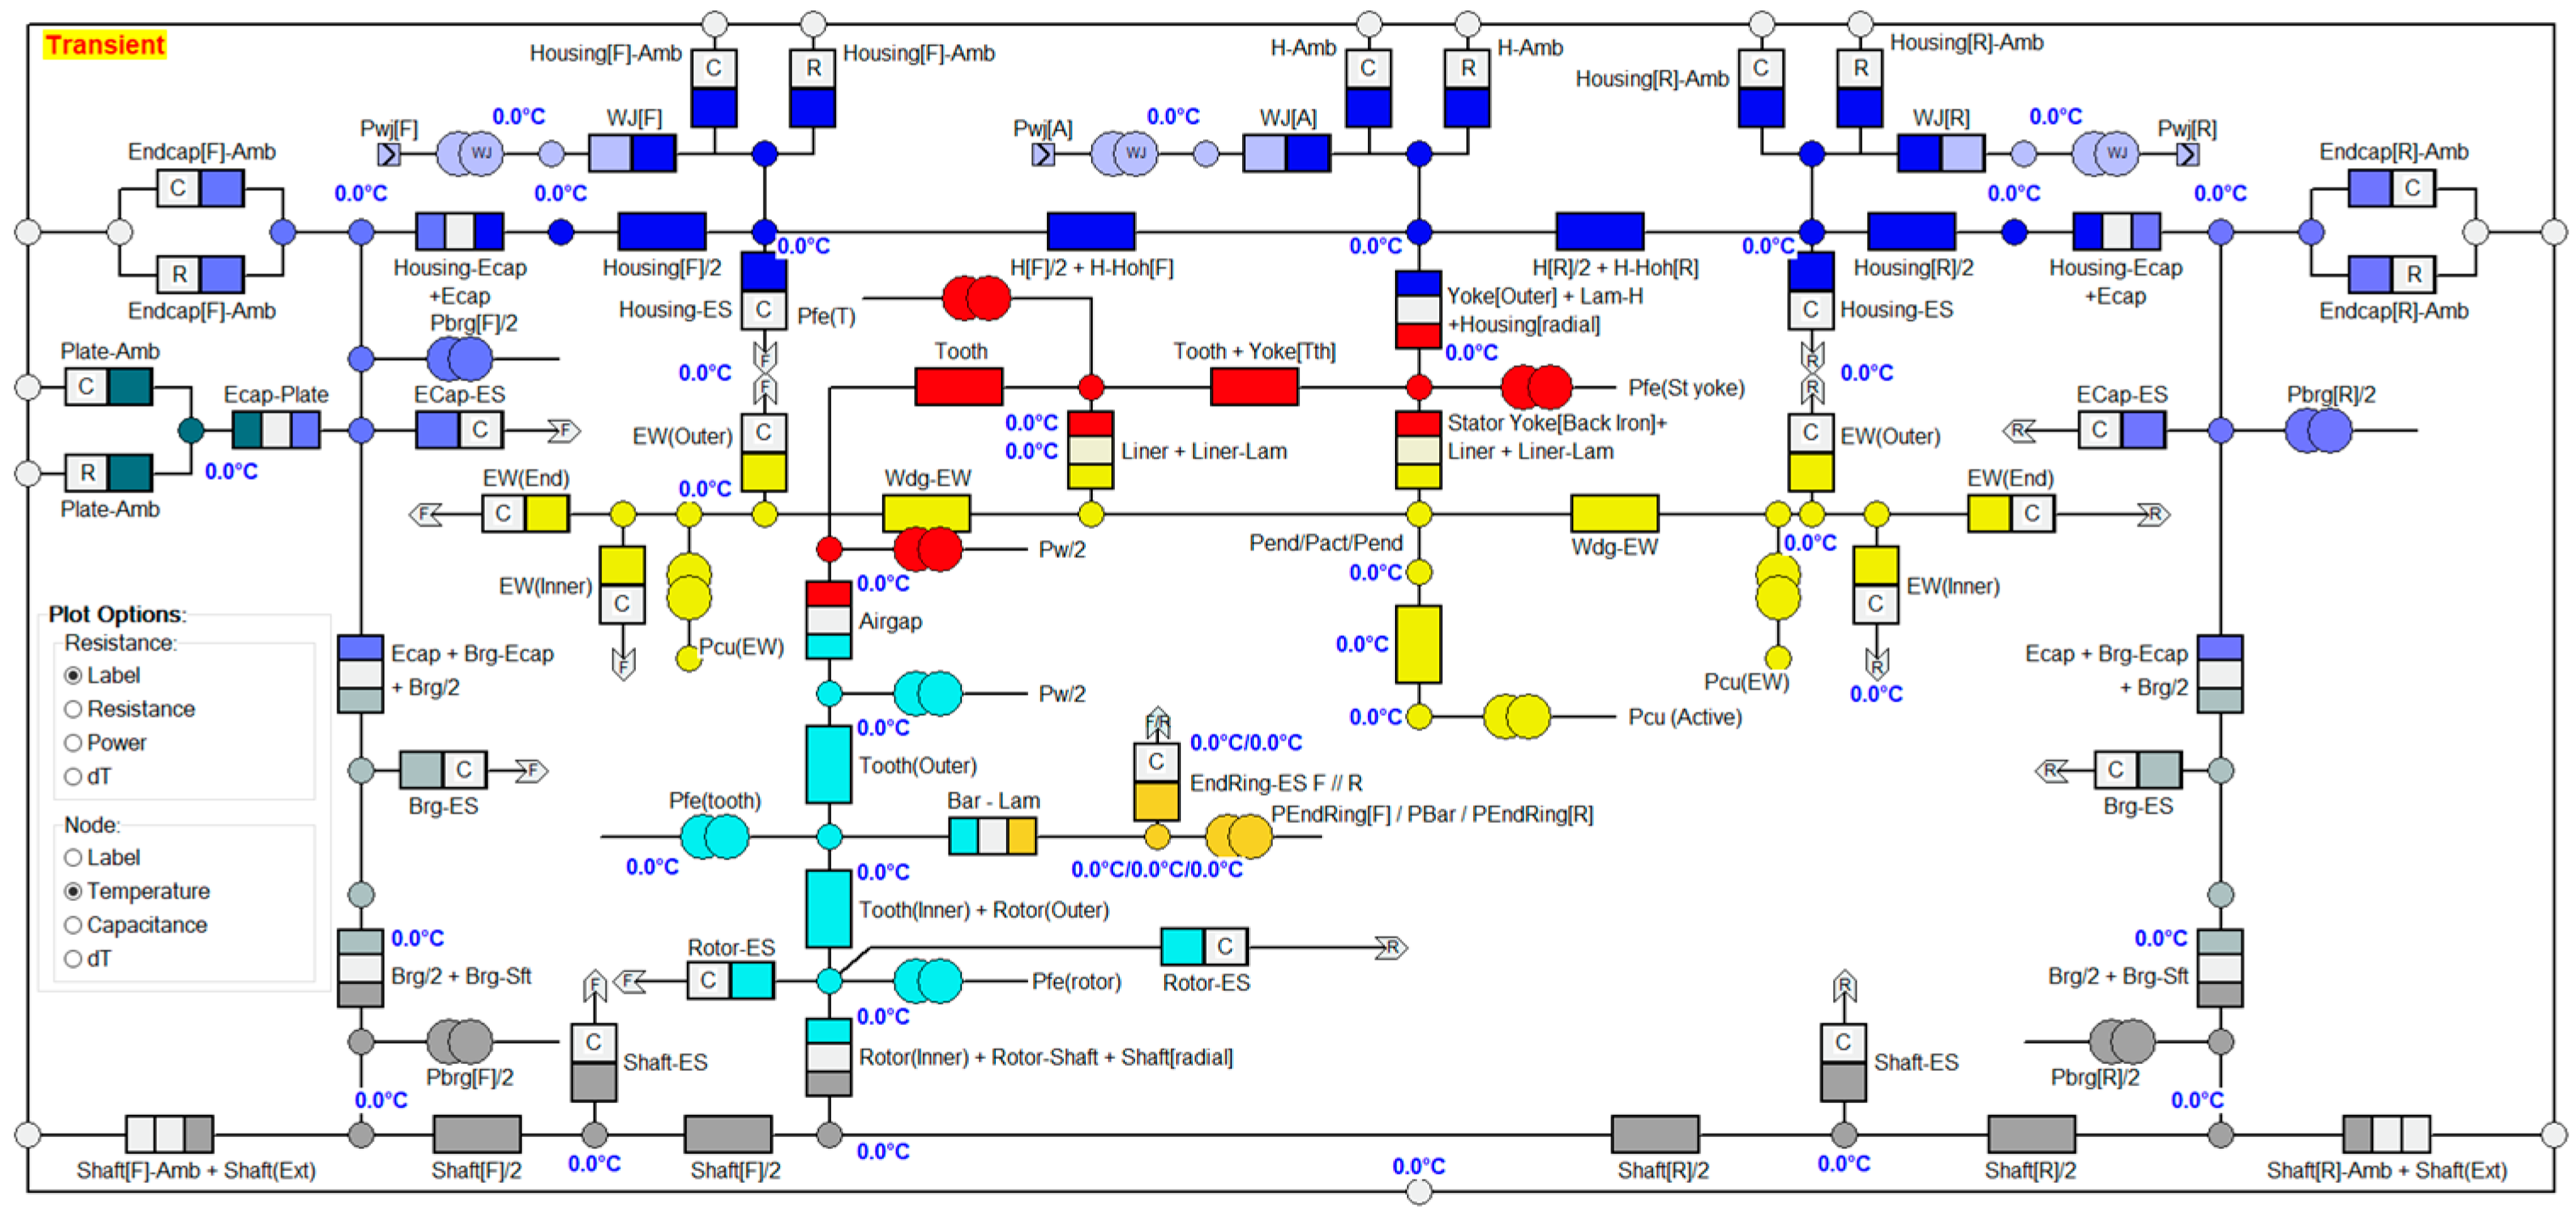
Like electromagnetic analysis, thermal analysis can be divided into two main categories of analytical and numerical methods. The advantages of analytical methods are less complexity and acceptable accuracy, especially in the initial design step. In this paper, the analytical model of lumped parameter model (LPM) is considered for thermal analysis. In the LPM, the electric motor parts modelled as a heat storage source and heat source (losses of the electric motor). These sources then connected to each other through the geometry dependent thermal resistances, which depended on the geometry of the motor and material characteristics [
38,
39]. The details of the considered LPM model of water-cooled IM are shown in
Figure 3.
3.2. Driving Cycle Performance Evaluation
The performance of the designed motor has been compared in the NEDC driving cycle in terms of three performance indexes: consumed energy, average winding temperature and average input current. The reason for choosing these three parameters are as follows.
3.2.1. Consumed Energy ()
One of the important parameters in examining the performance of an EV is the amount of consumed energy per 100 km, expressed as kWh/100 km. To calculate the consumed energy, it is necessary to accurately calculate the losses and efficiency of the IM over the driving cycle. Analytical methods for measuring core losses and copper losses do not have proper accuracy, so it is necessary to use the FEM method to calculate losses. Accurate prediction of core loss is carried out using Equation (6).
where
,
and
are coefficients of hysteresis, eddy current and additional losses, respectively.
is the electric frequency and
is the amplitude of the magnetic flux density.
In relation to the losses of the stator winding, in addition to DC losses of the winding, the skin and proximity effects must be considered. In the AC excitation, the high-frequency current tends to flow through the surface of the conducting material and consequently the effective cross-sectional area of the conducting material will reduce. This phenomenon, known as the skin effect, results in a higher resistance and consequently higher copper losses. Additionally, when an alternating current (AC) flows through a conductor, it creates an associated alternating magnetic field around it. The alternating magnetic field induces eddy currents in adjacent conductors, altering the overall distribution of current flowing through them. This phenomenon is known as the proximity effect. The proximity effect can significantly increase the AC resistance of adjacent conductors. Therefore, the overall copper losses of the motor are calculated using Equation (7).
Consumed energy over the NEDC driving cycle can be calculated using Equation (8). It should be noted that in the performance comparison, the mechanical losses are not considered as they will not vary for different SSRB combinations.
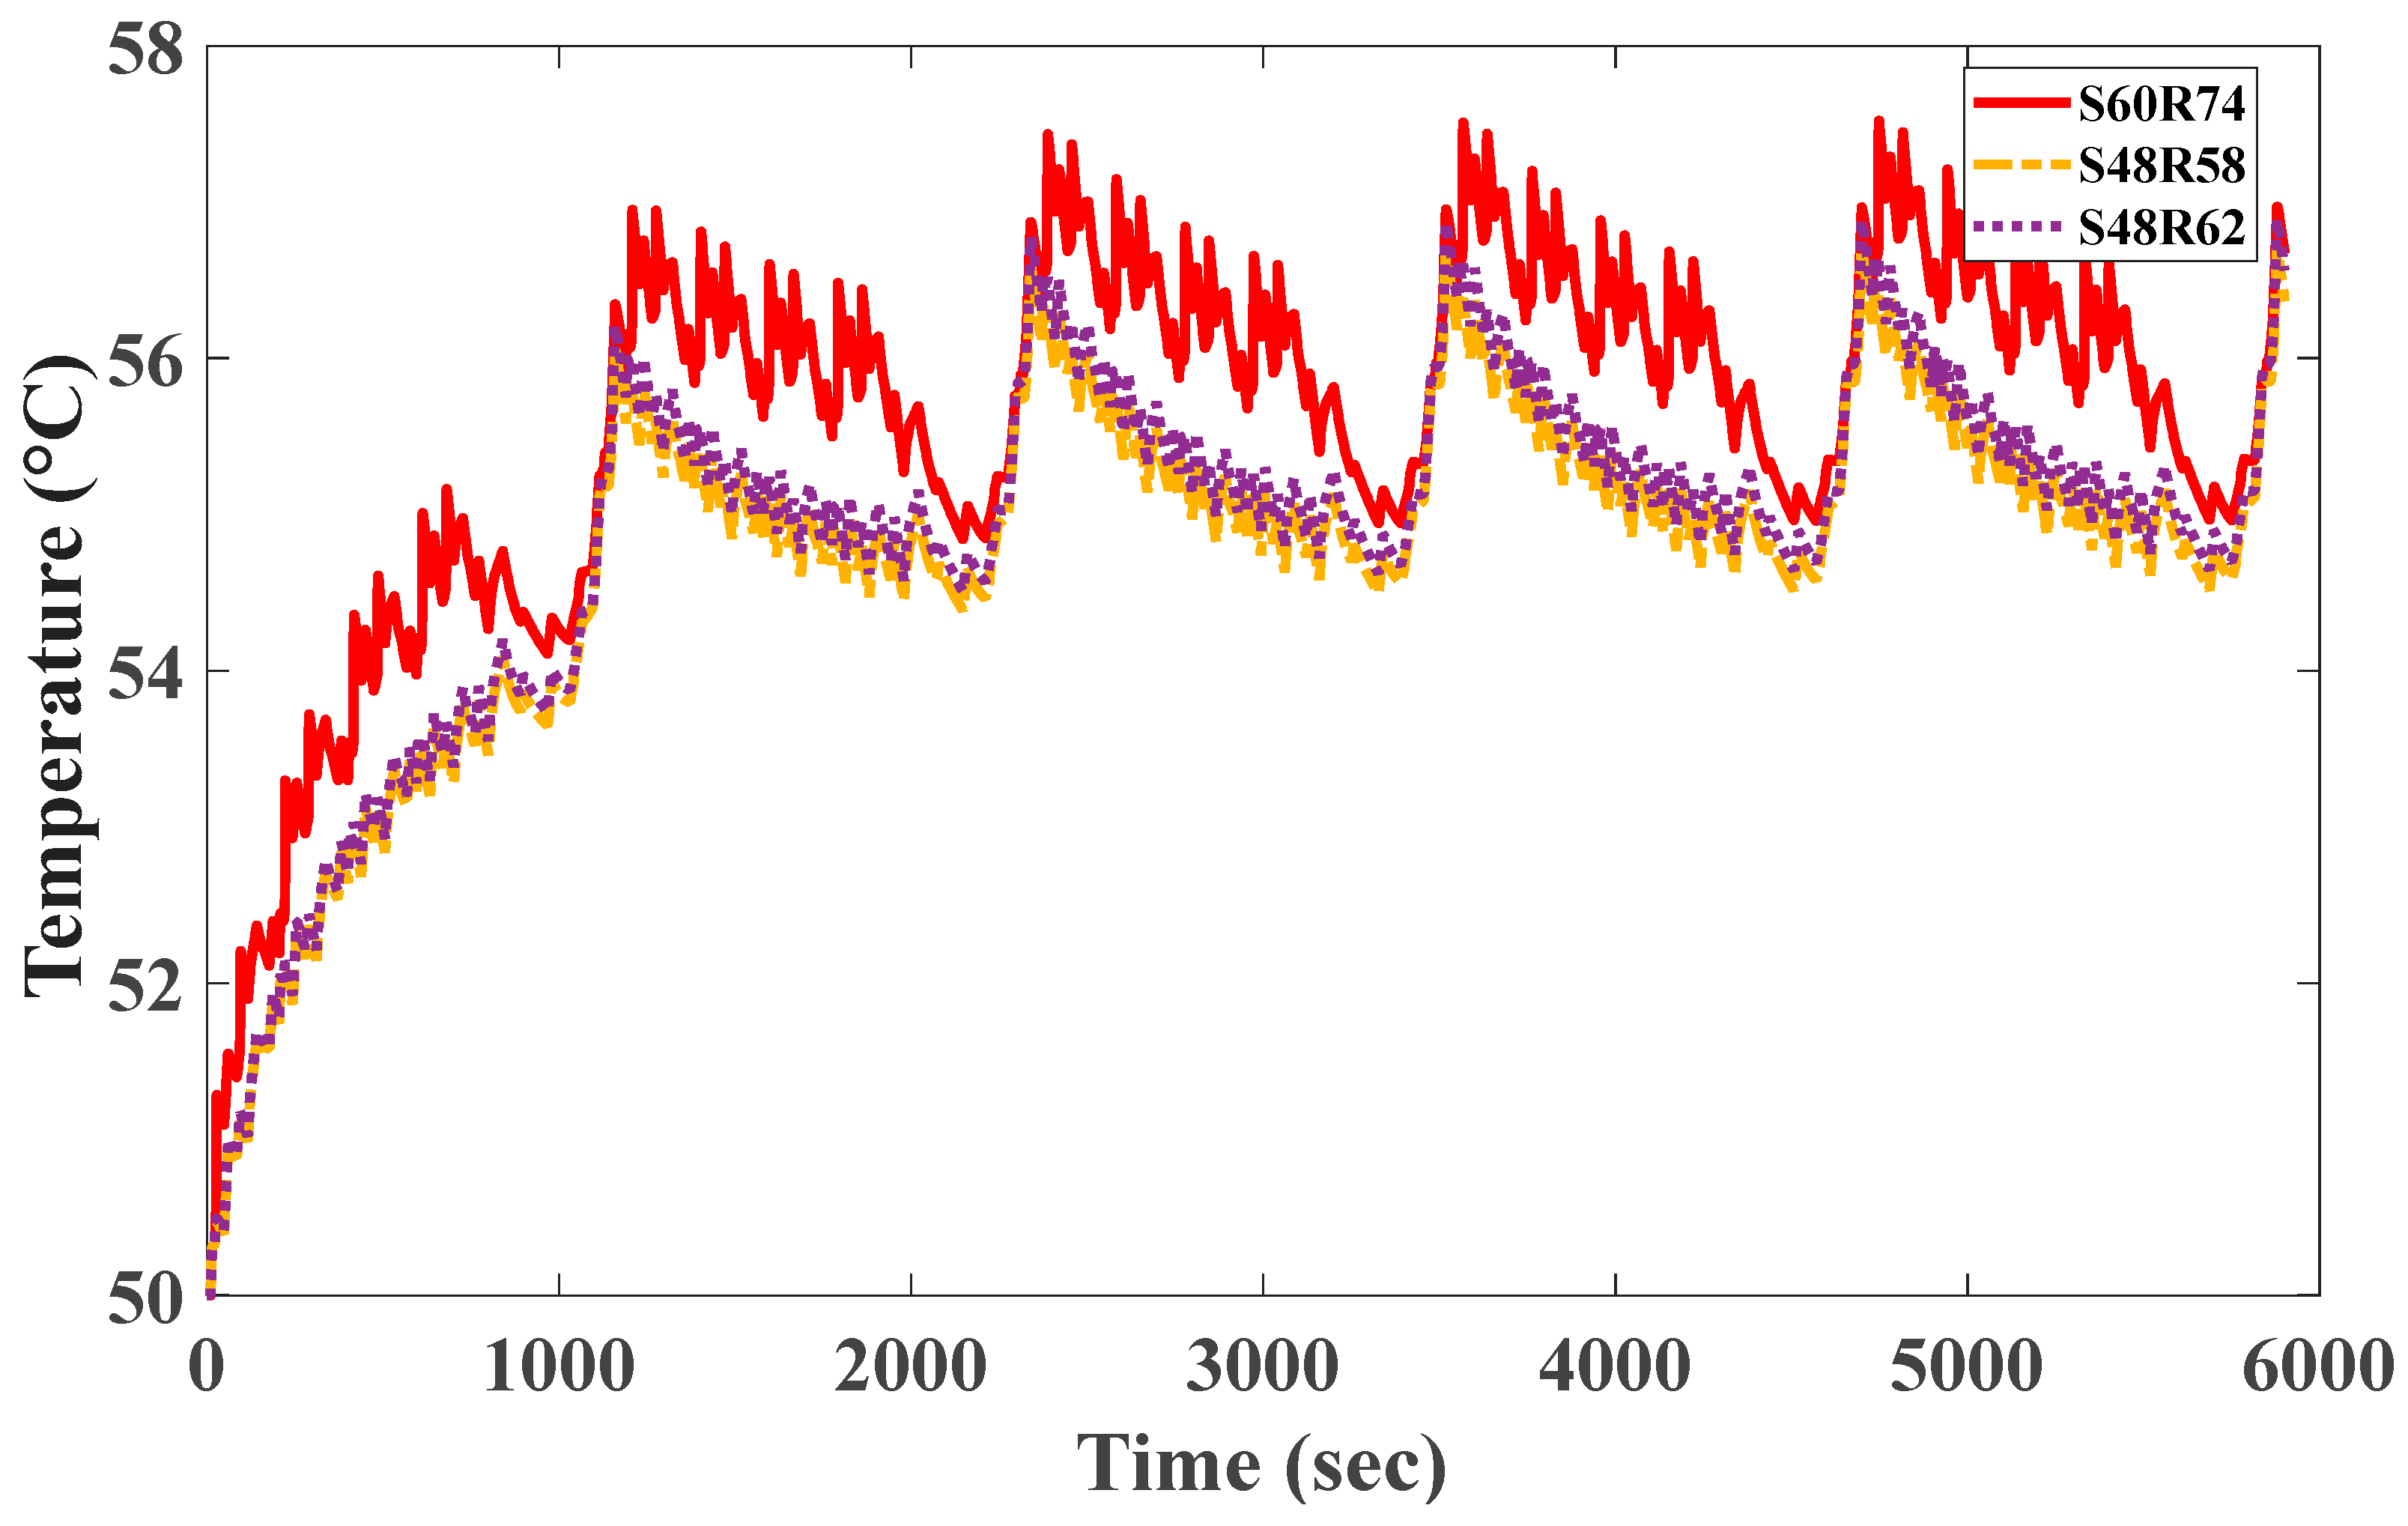
3.2.2. The Average Temperature of the Coils ()
A lower working winding temperature will give a higher expected lifetime of the insulation and consequently improve the electric motor life cycle. Increasing the working temperature also leads to an increase in the winding resistance and consequently lower efficiency. Therefore, it is better to have a lower average working temperature. To accurately calculate the average working temperature of the winding, the coupled electromagnetic–thermal analysis is carried out for 10 continuous NEDC driving cycles.
3.2.3. Average Input Current (
The lifetime of lithium batteries used in EV applications directly corresponds to the discharge current, with a lower discharge current giving a longer lifetime. Therefore, this parameter is considered as the third performance index. Average input current also takes account of the operating power factor, therefore ensuring the influence of SSRB combination on power factor is included in the objective function.
To obtain the optimal combinations, the weighted sum approach is utilized as Equation (9). In Equation (9), the values of
,
and
are equal to 0.6, 0.2, and 0.2, respectively. It should be noted that the values of Equation (9) are normalized using Equation (10).
The normalized values of the objective functions (
) are presented in
Table 5. These data are used to calculate the overall objective functions of
F(
x). The combination with the lowest
F(
x) means a lower consumed energy, lower input current, and lower working temperature and is considered as the optimum design. Therefore, based on
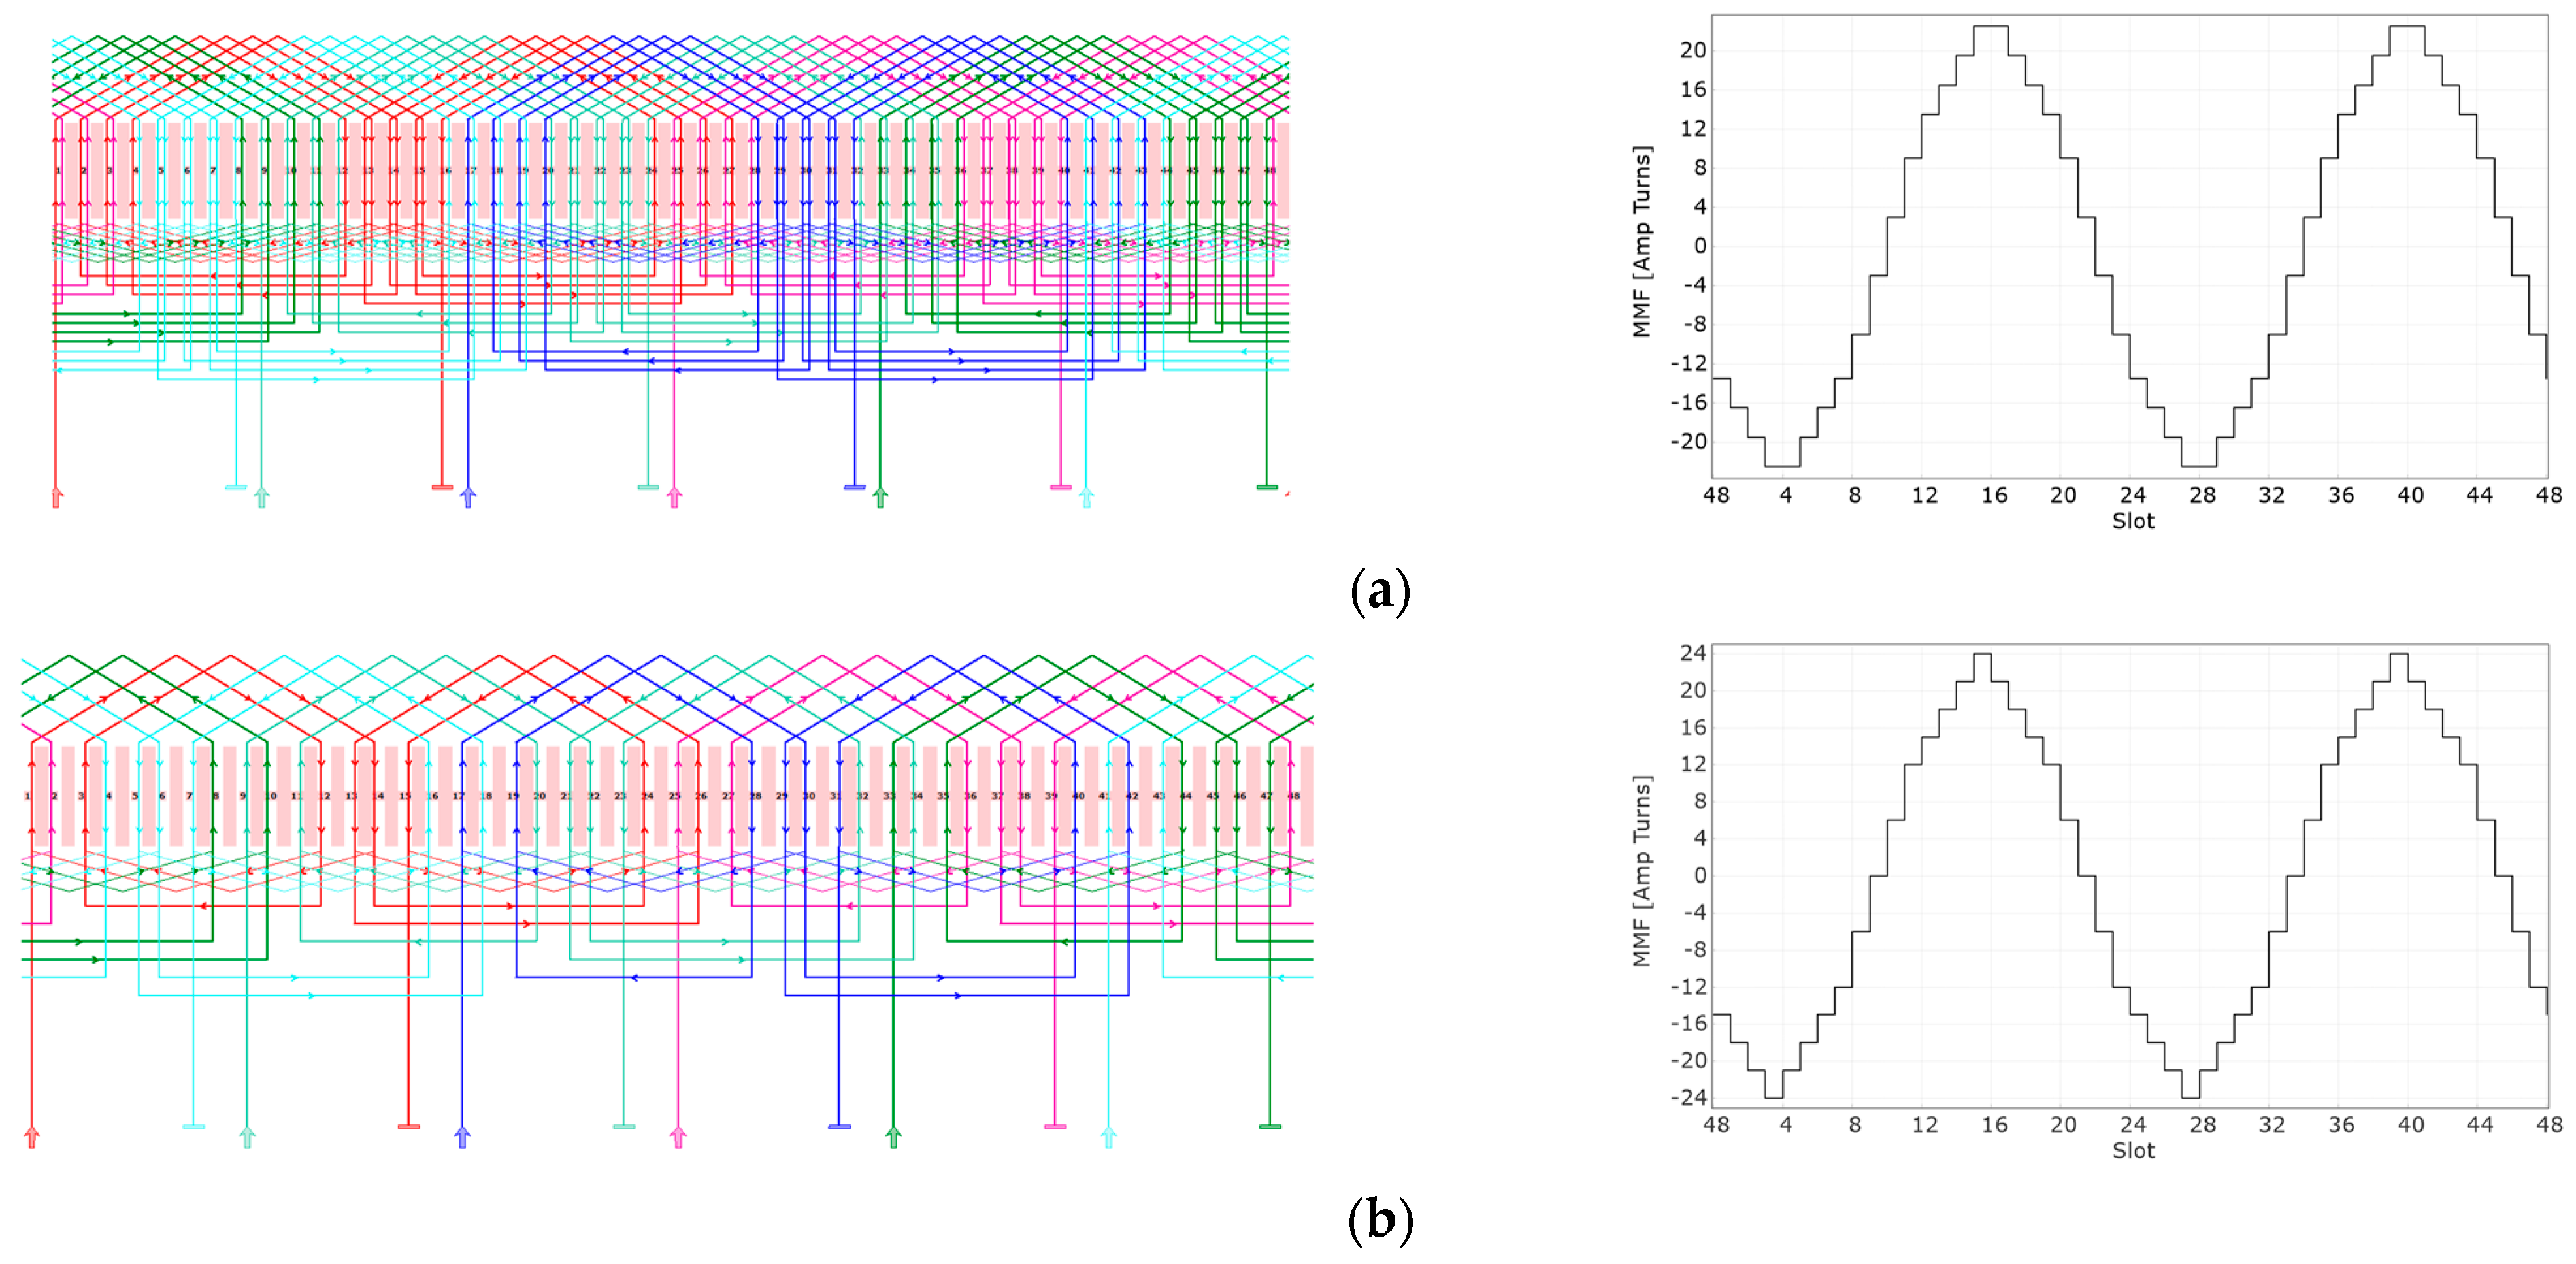
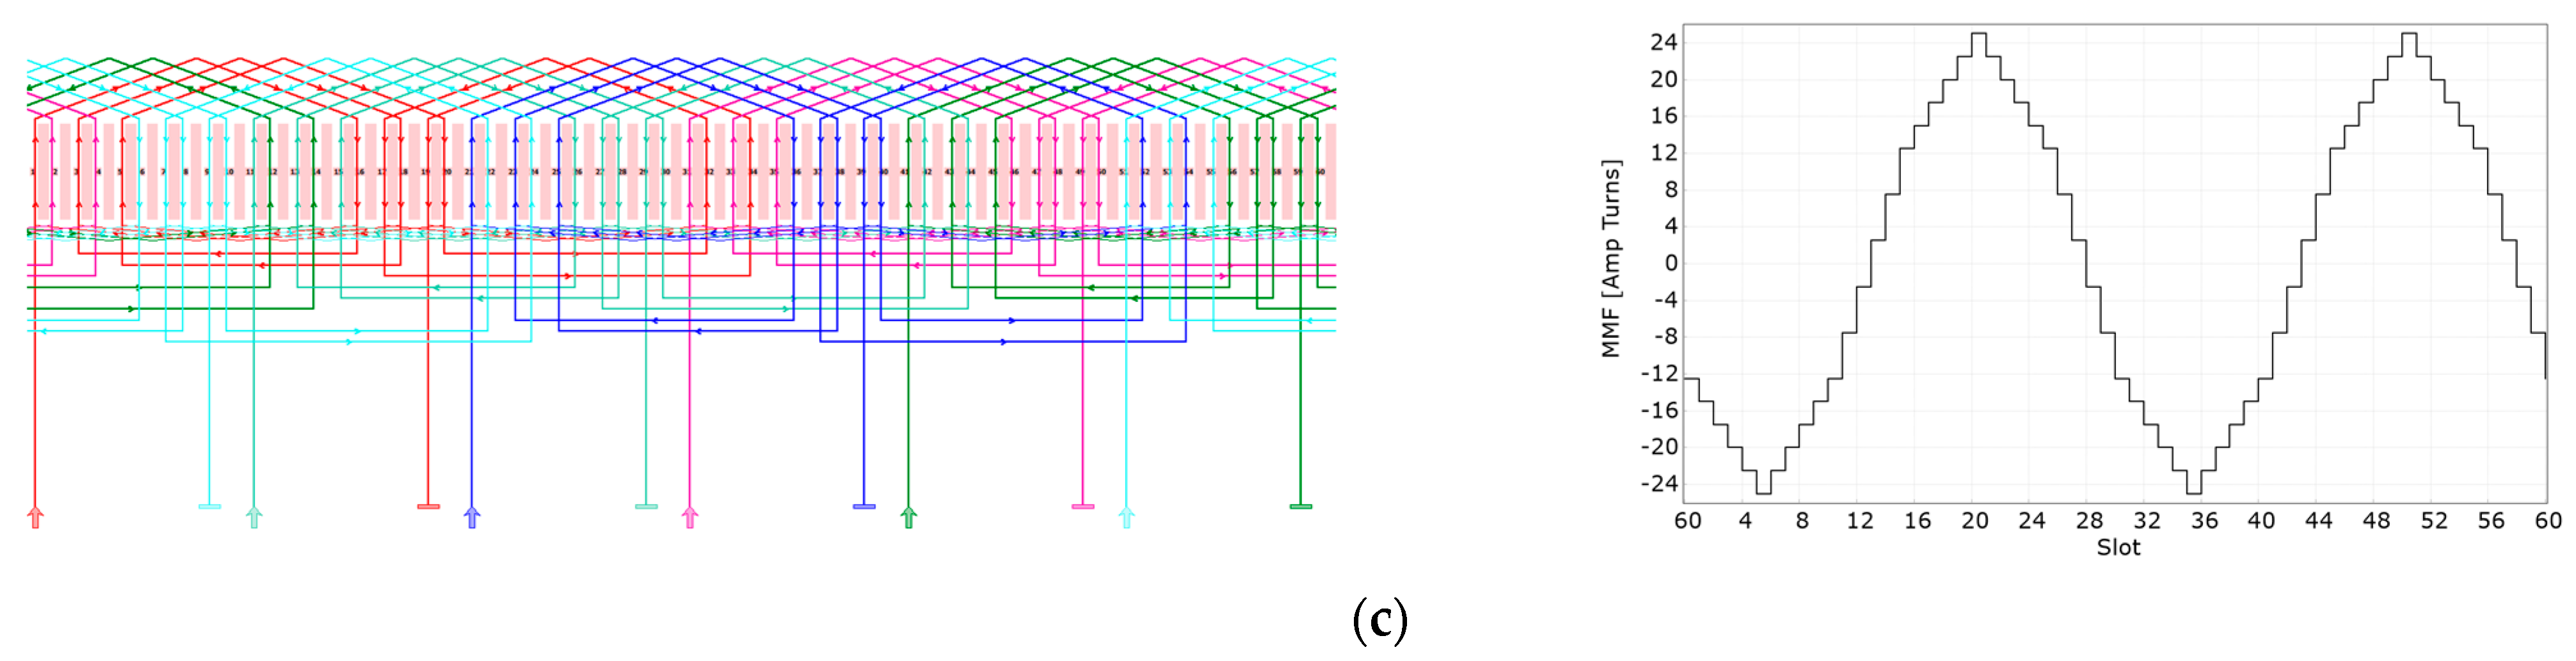
Table 5, the best three combinations of S48R58, S48R62 and S60R74 are selected as optimum combinations and will be considered for optimization over the driving cycle and further studies. The winding configuration of these SSRB combinations are presented in
Appendix A. The average working temperature of these optimum combinations over five driving cycles of NEDC is illustrated in
Figure 4.
5. Evaluation
The performance of the optimum designs is compared in terms of robustness against manufacturing tolerances, magnetic flux density distribution, mechanical stress analysis, nominal envelope curve, and efficiency map to select the best SSRB combinations.
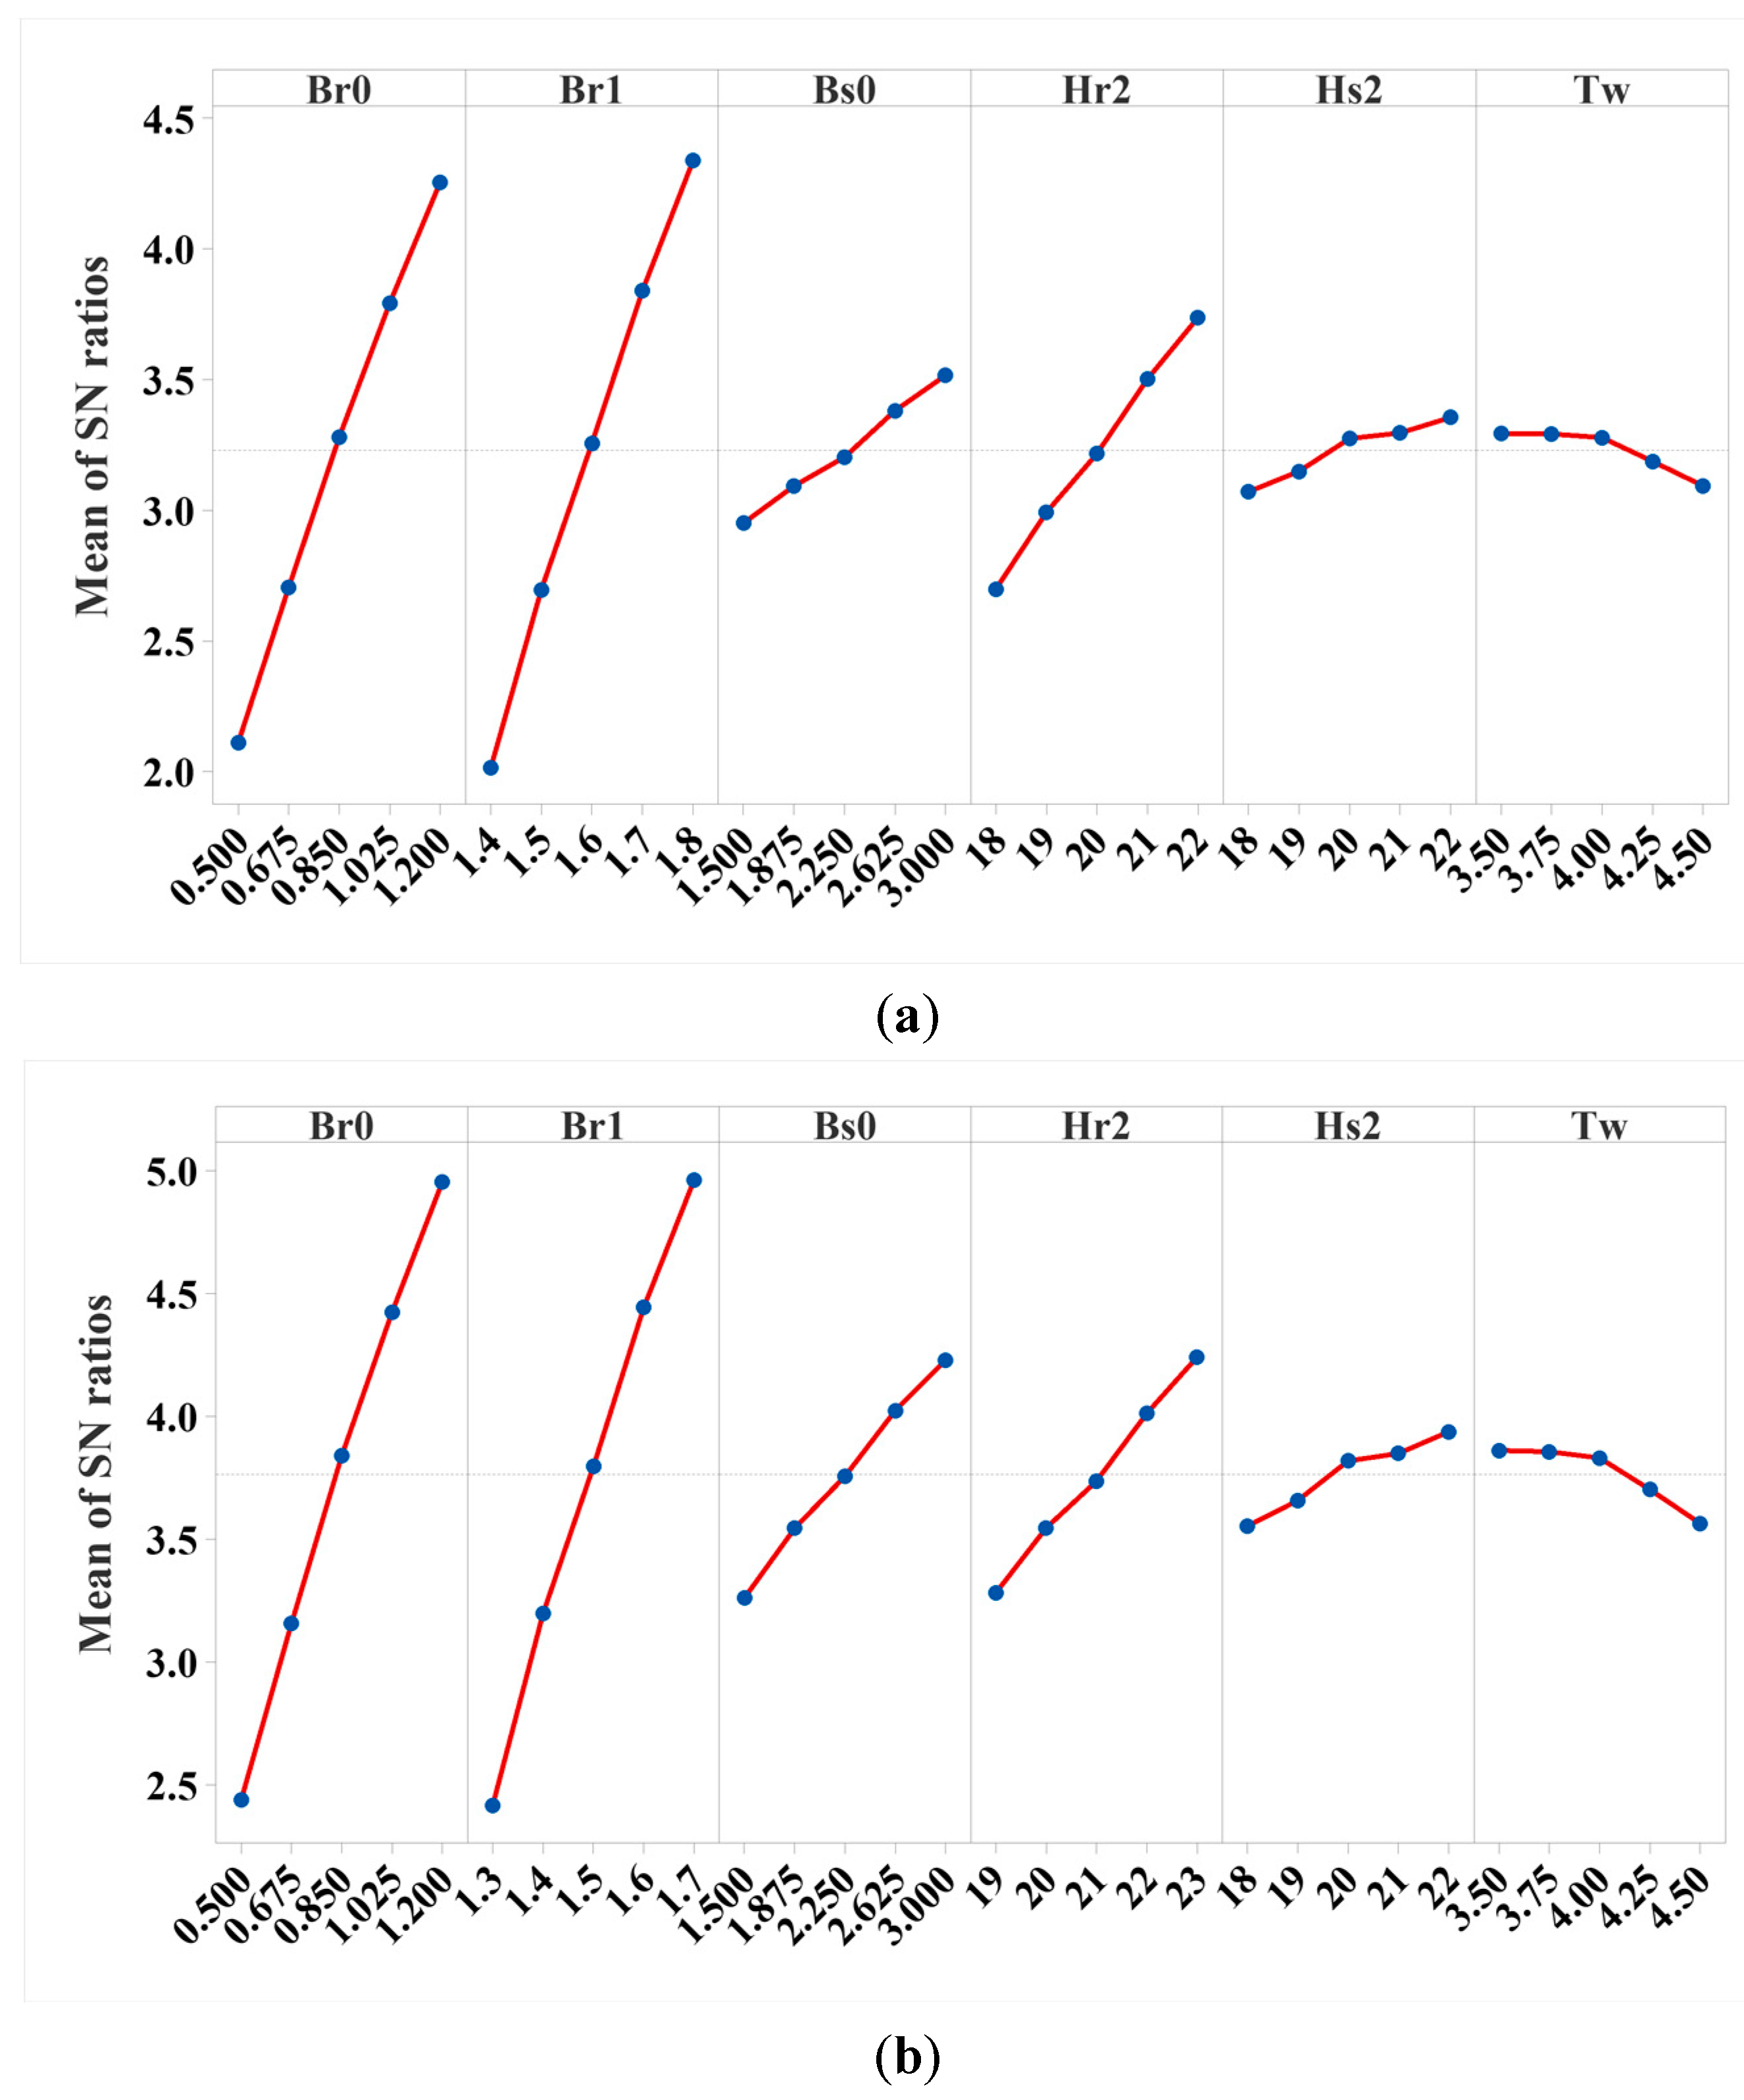
5.1. Robustness against Manufacturing Tolerances and Noise Factors
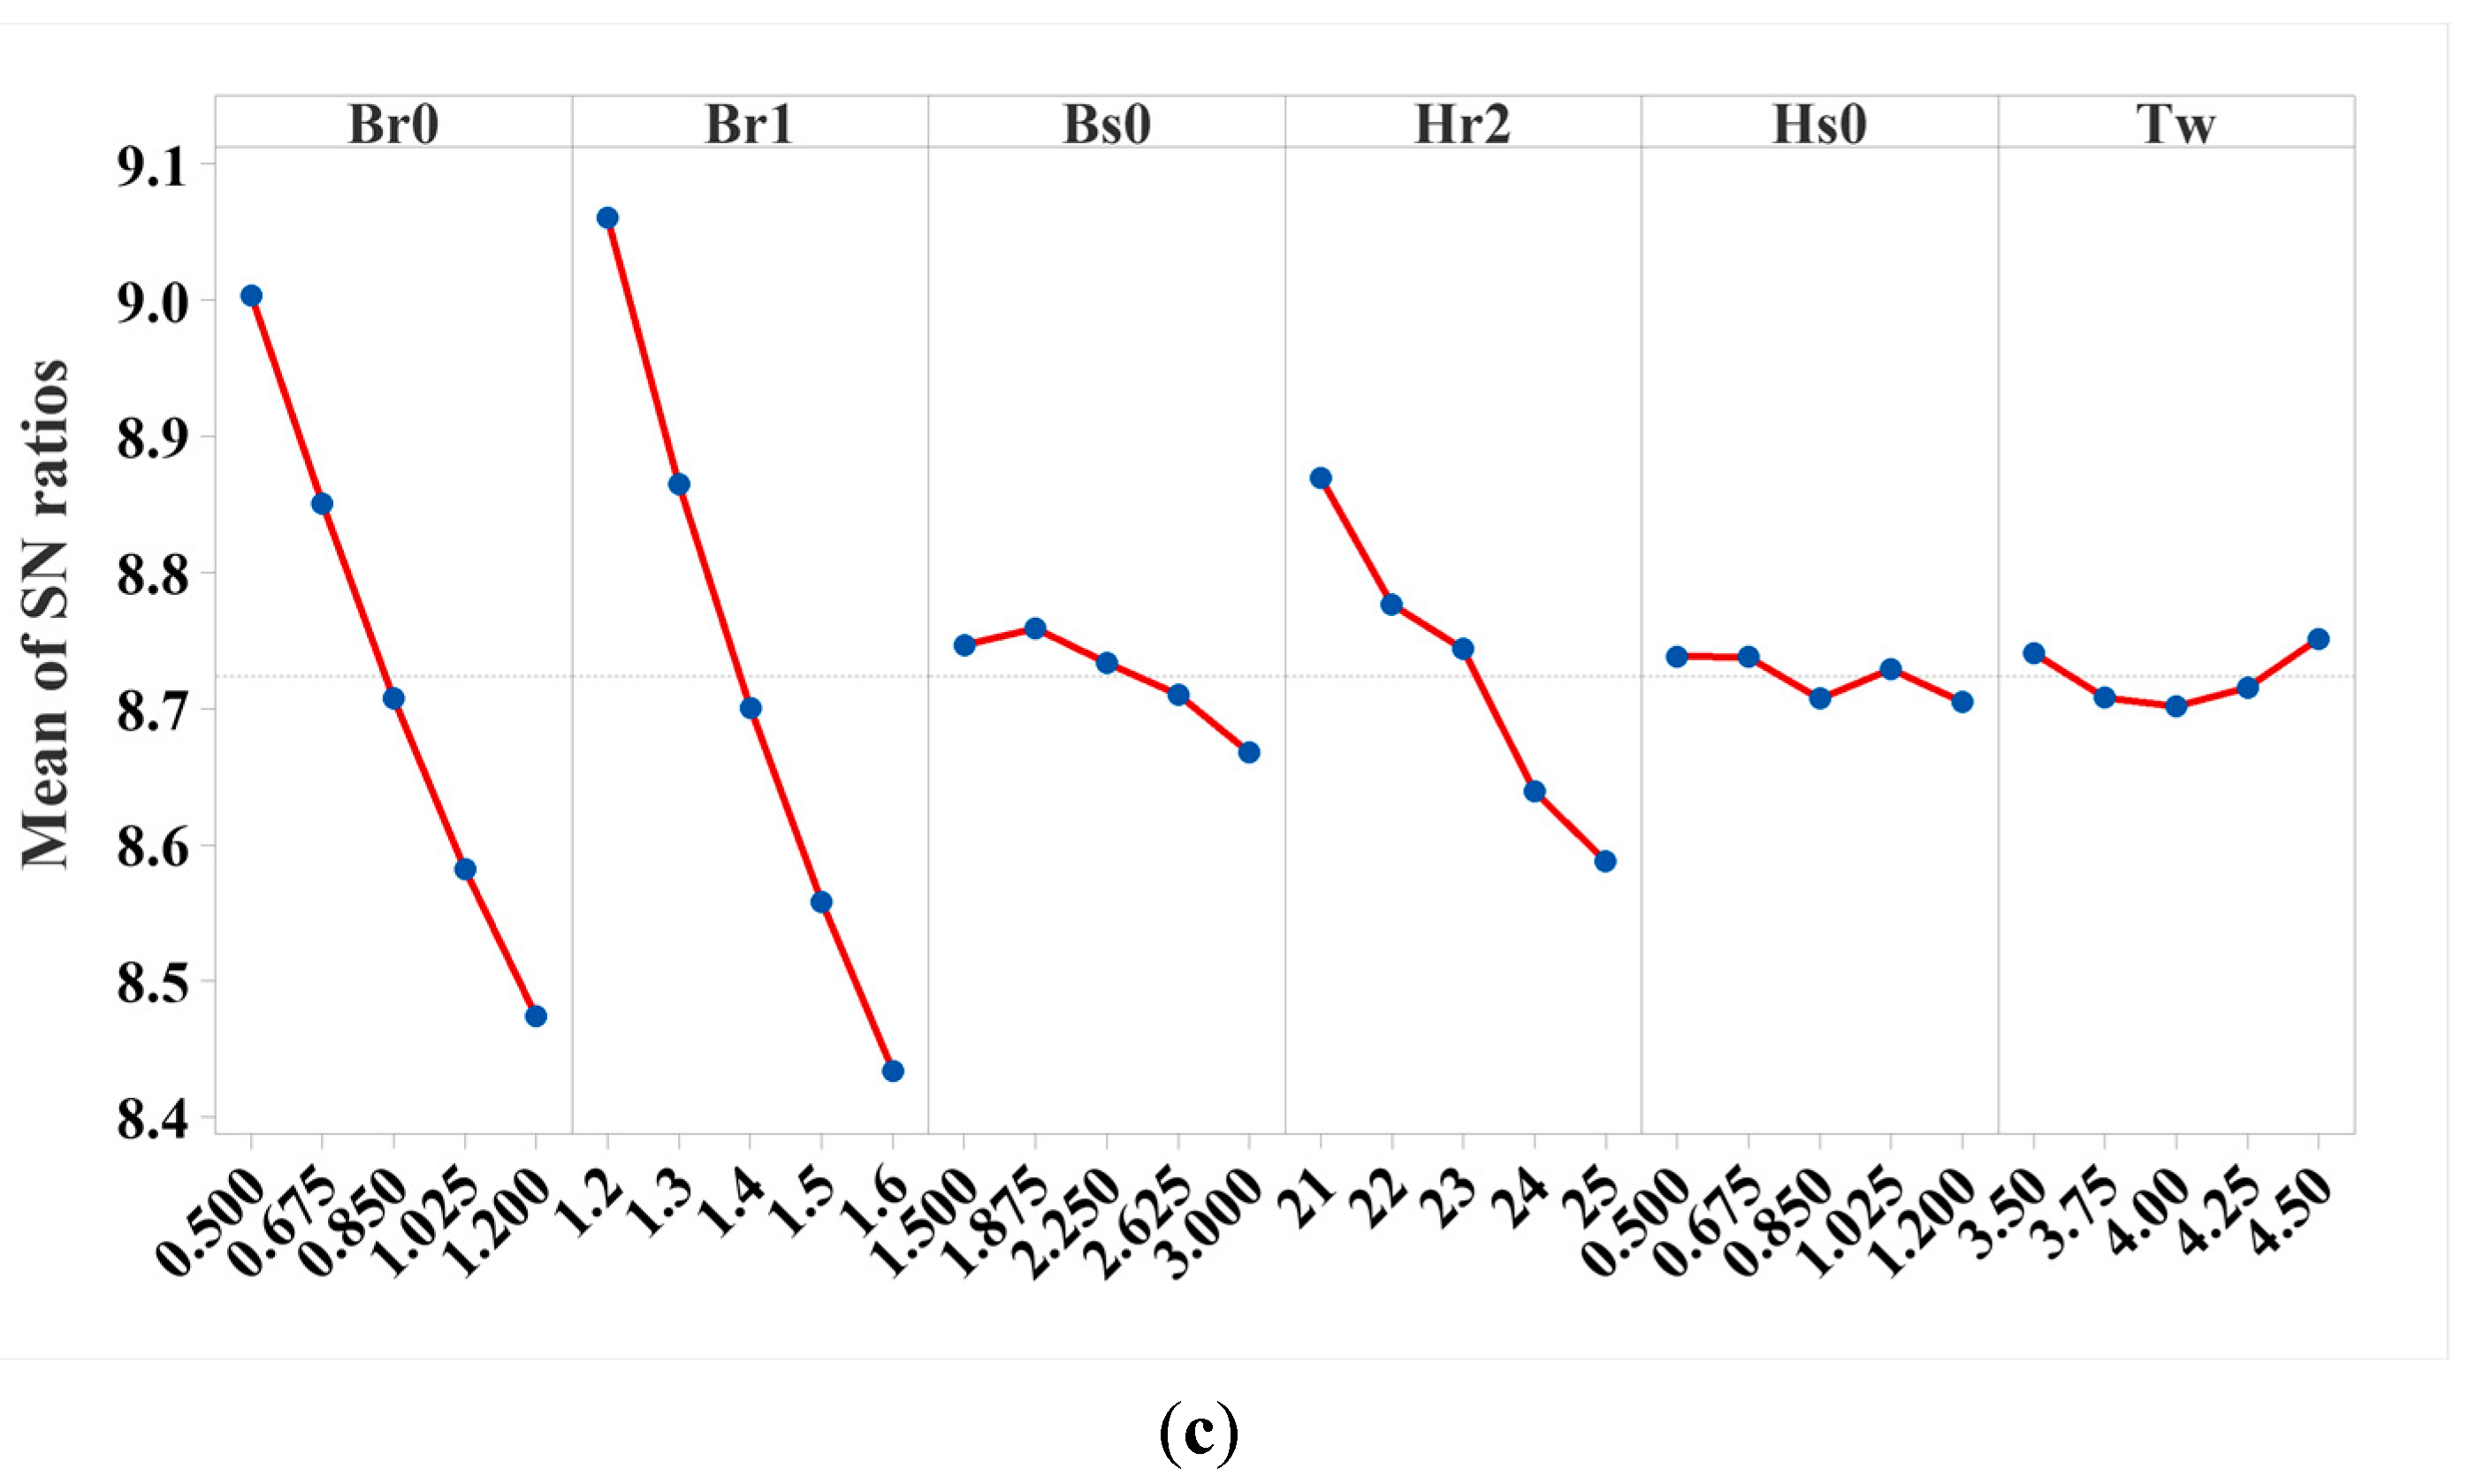
According to the results shown in
Figure 6, for all three combinations, the values of S/N ratio are positive, indicating that the effect of manufacturing tolerances on the objective is less. A higher S/N ratio indicates a high tolerability against manufacturing tolerances. Therefore, the S60R74 are more tolerant to manufacturing tolerances and unwanted noise factors followed by S48R62 and S48R58, respectively.
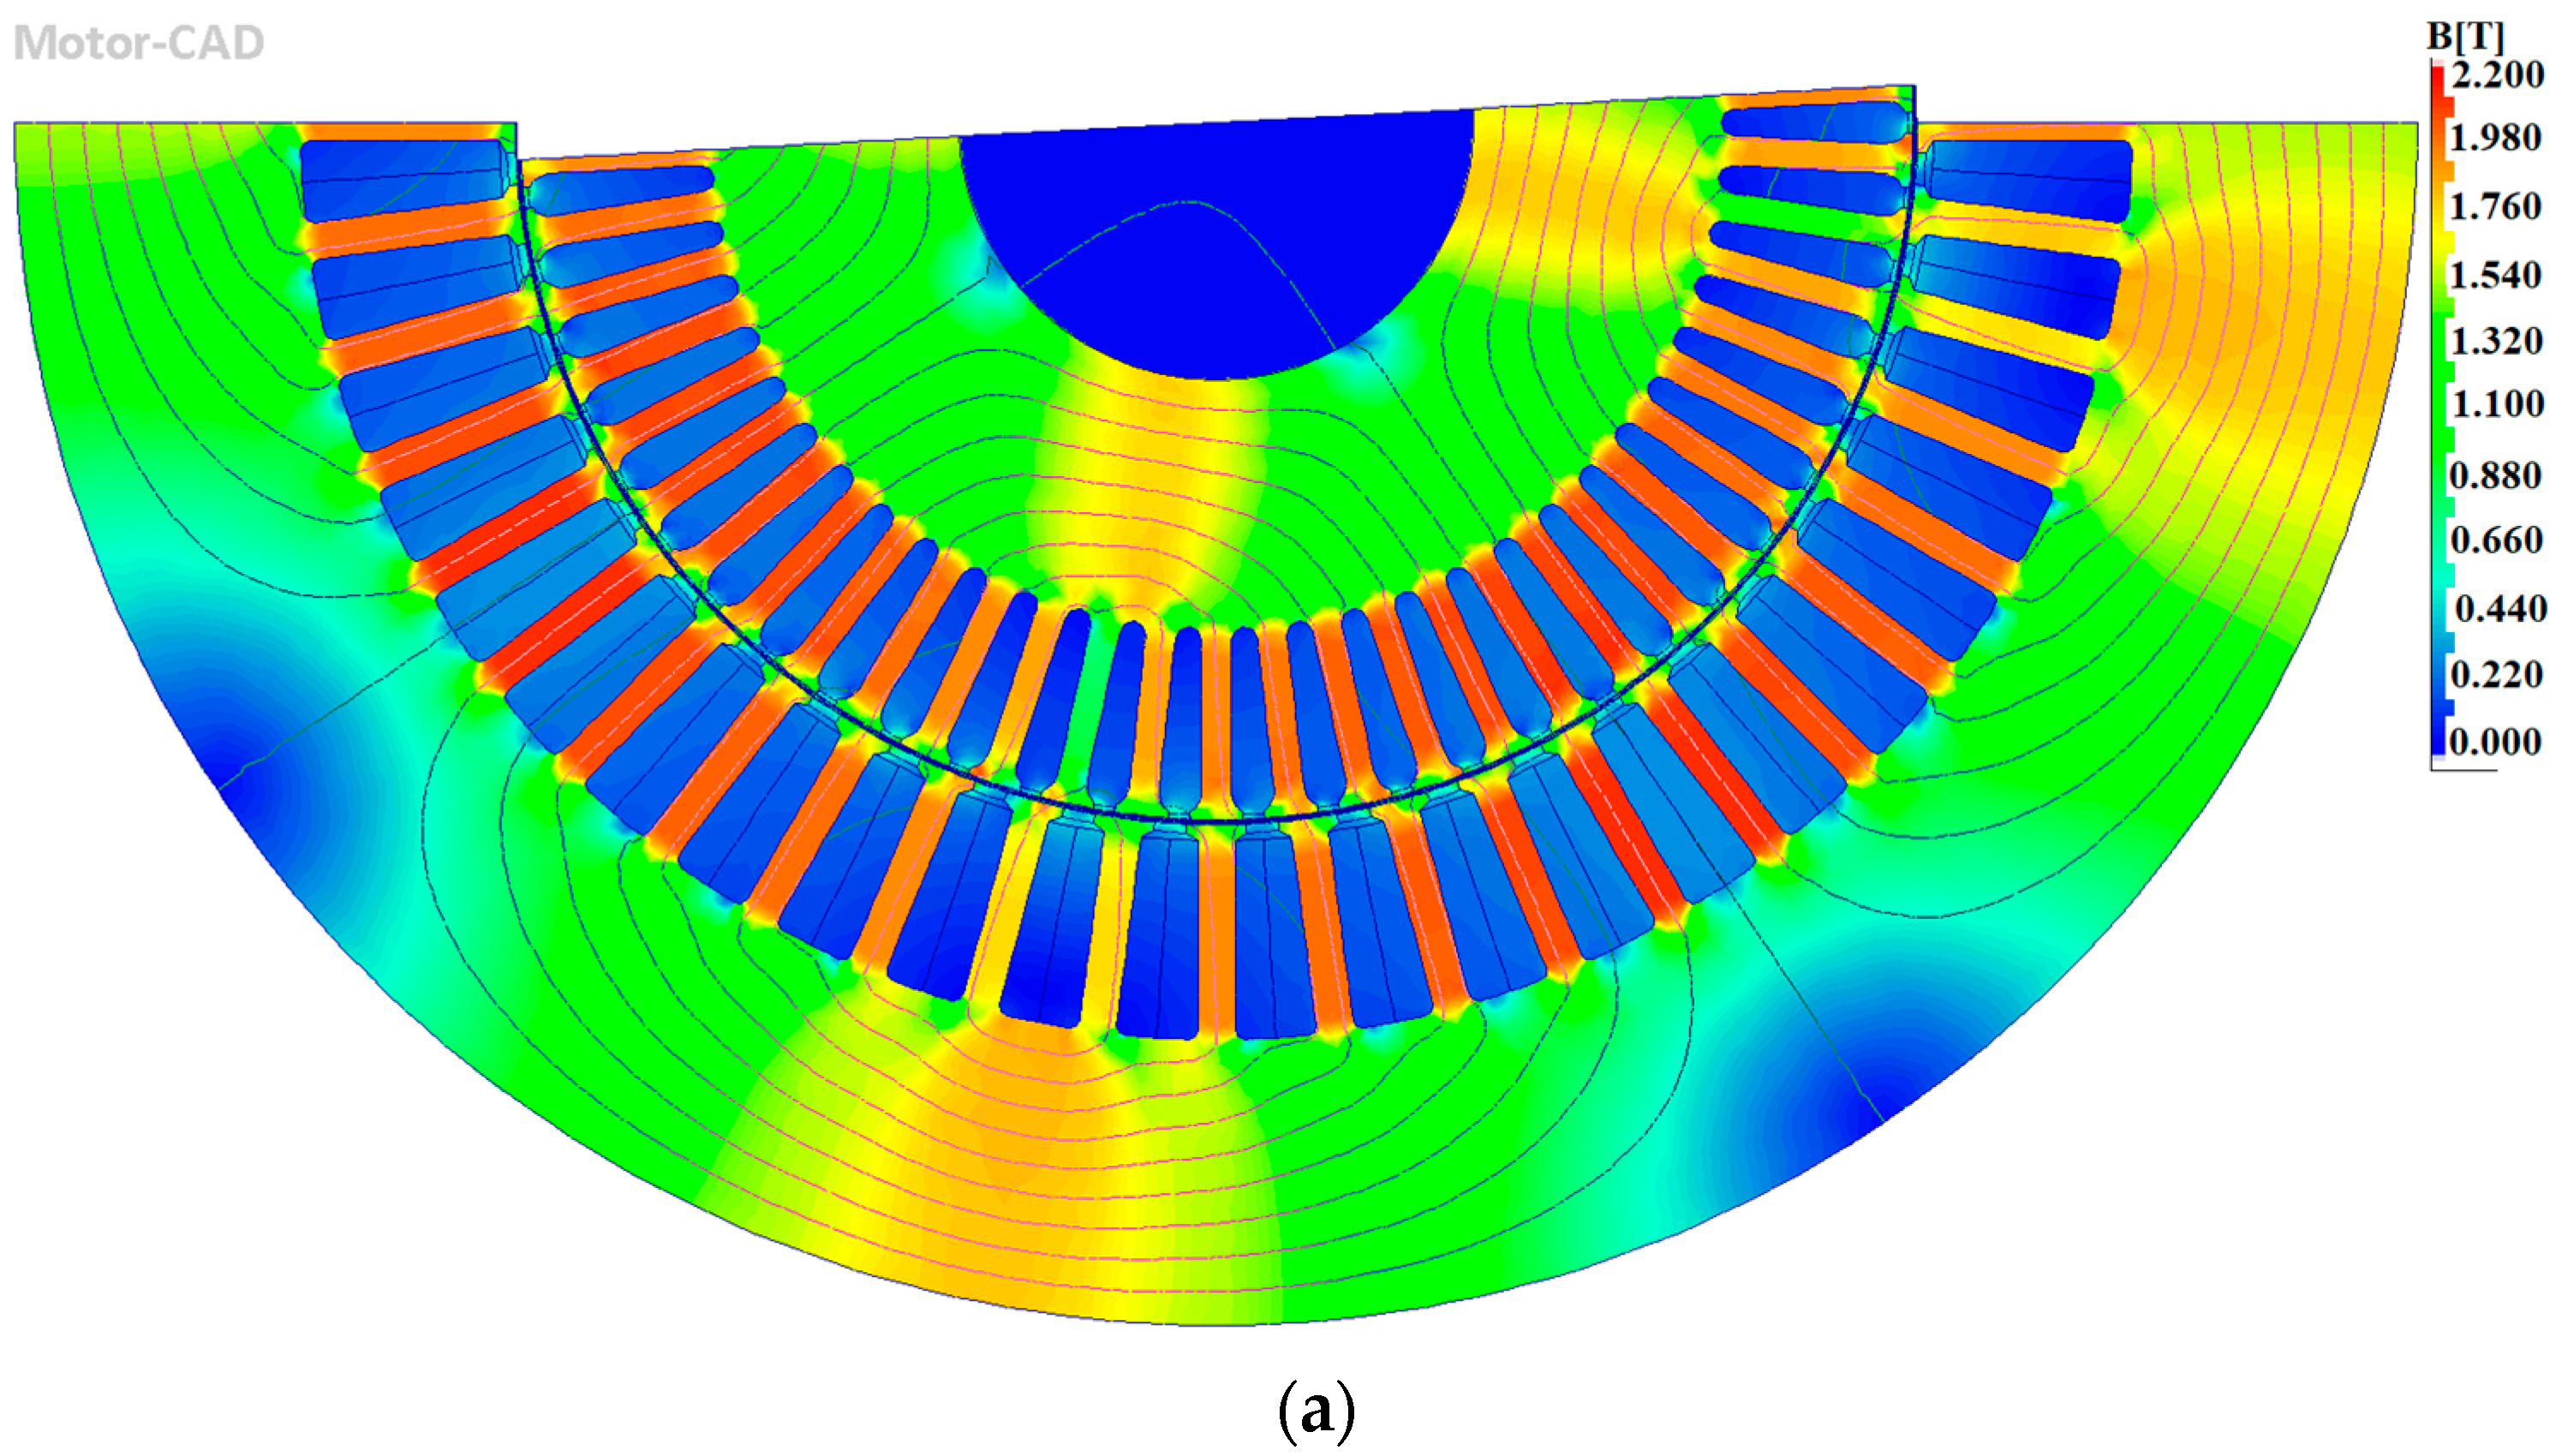
5.2. Magnetic Flux Density Distribution
The magnetic flux density distribution of the optimum designs is illustrated in
Figure 7. The considered working point is 120 kW at 3800 rpm and DC voltage of 400 V. According to the obtained results, it is obvious that the stator and rotor tooth of the S48R58 combination is more saturated compared to S48R62 and S60R74 combinations. Between S48R62 and S60R74, the latter has slightly better characteristics.
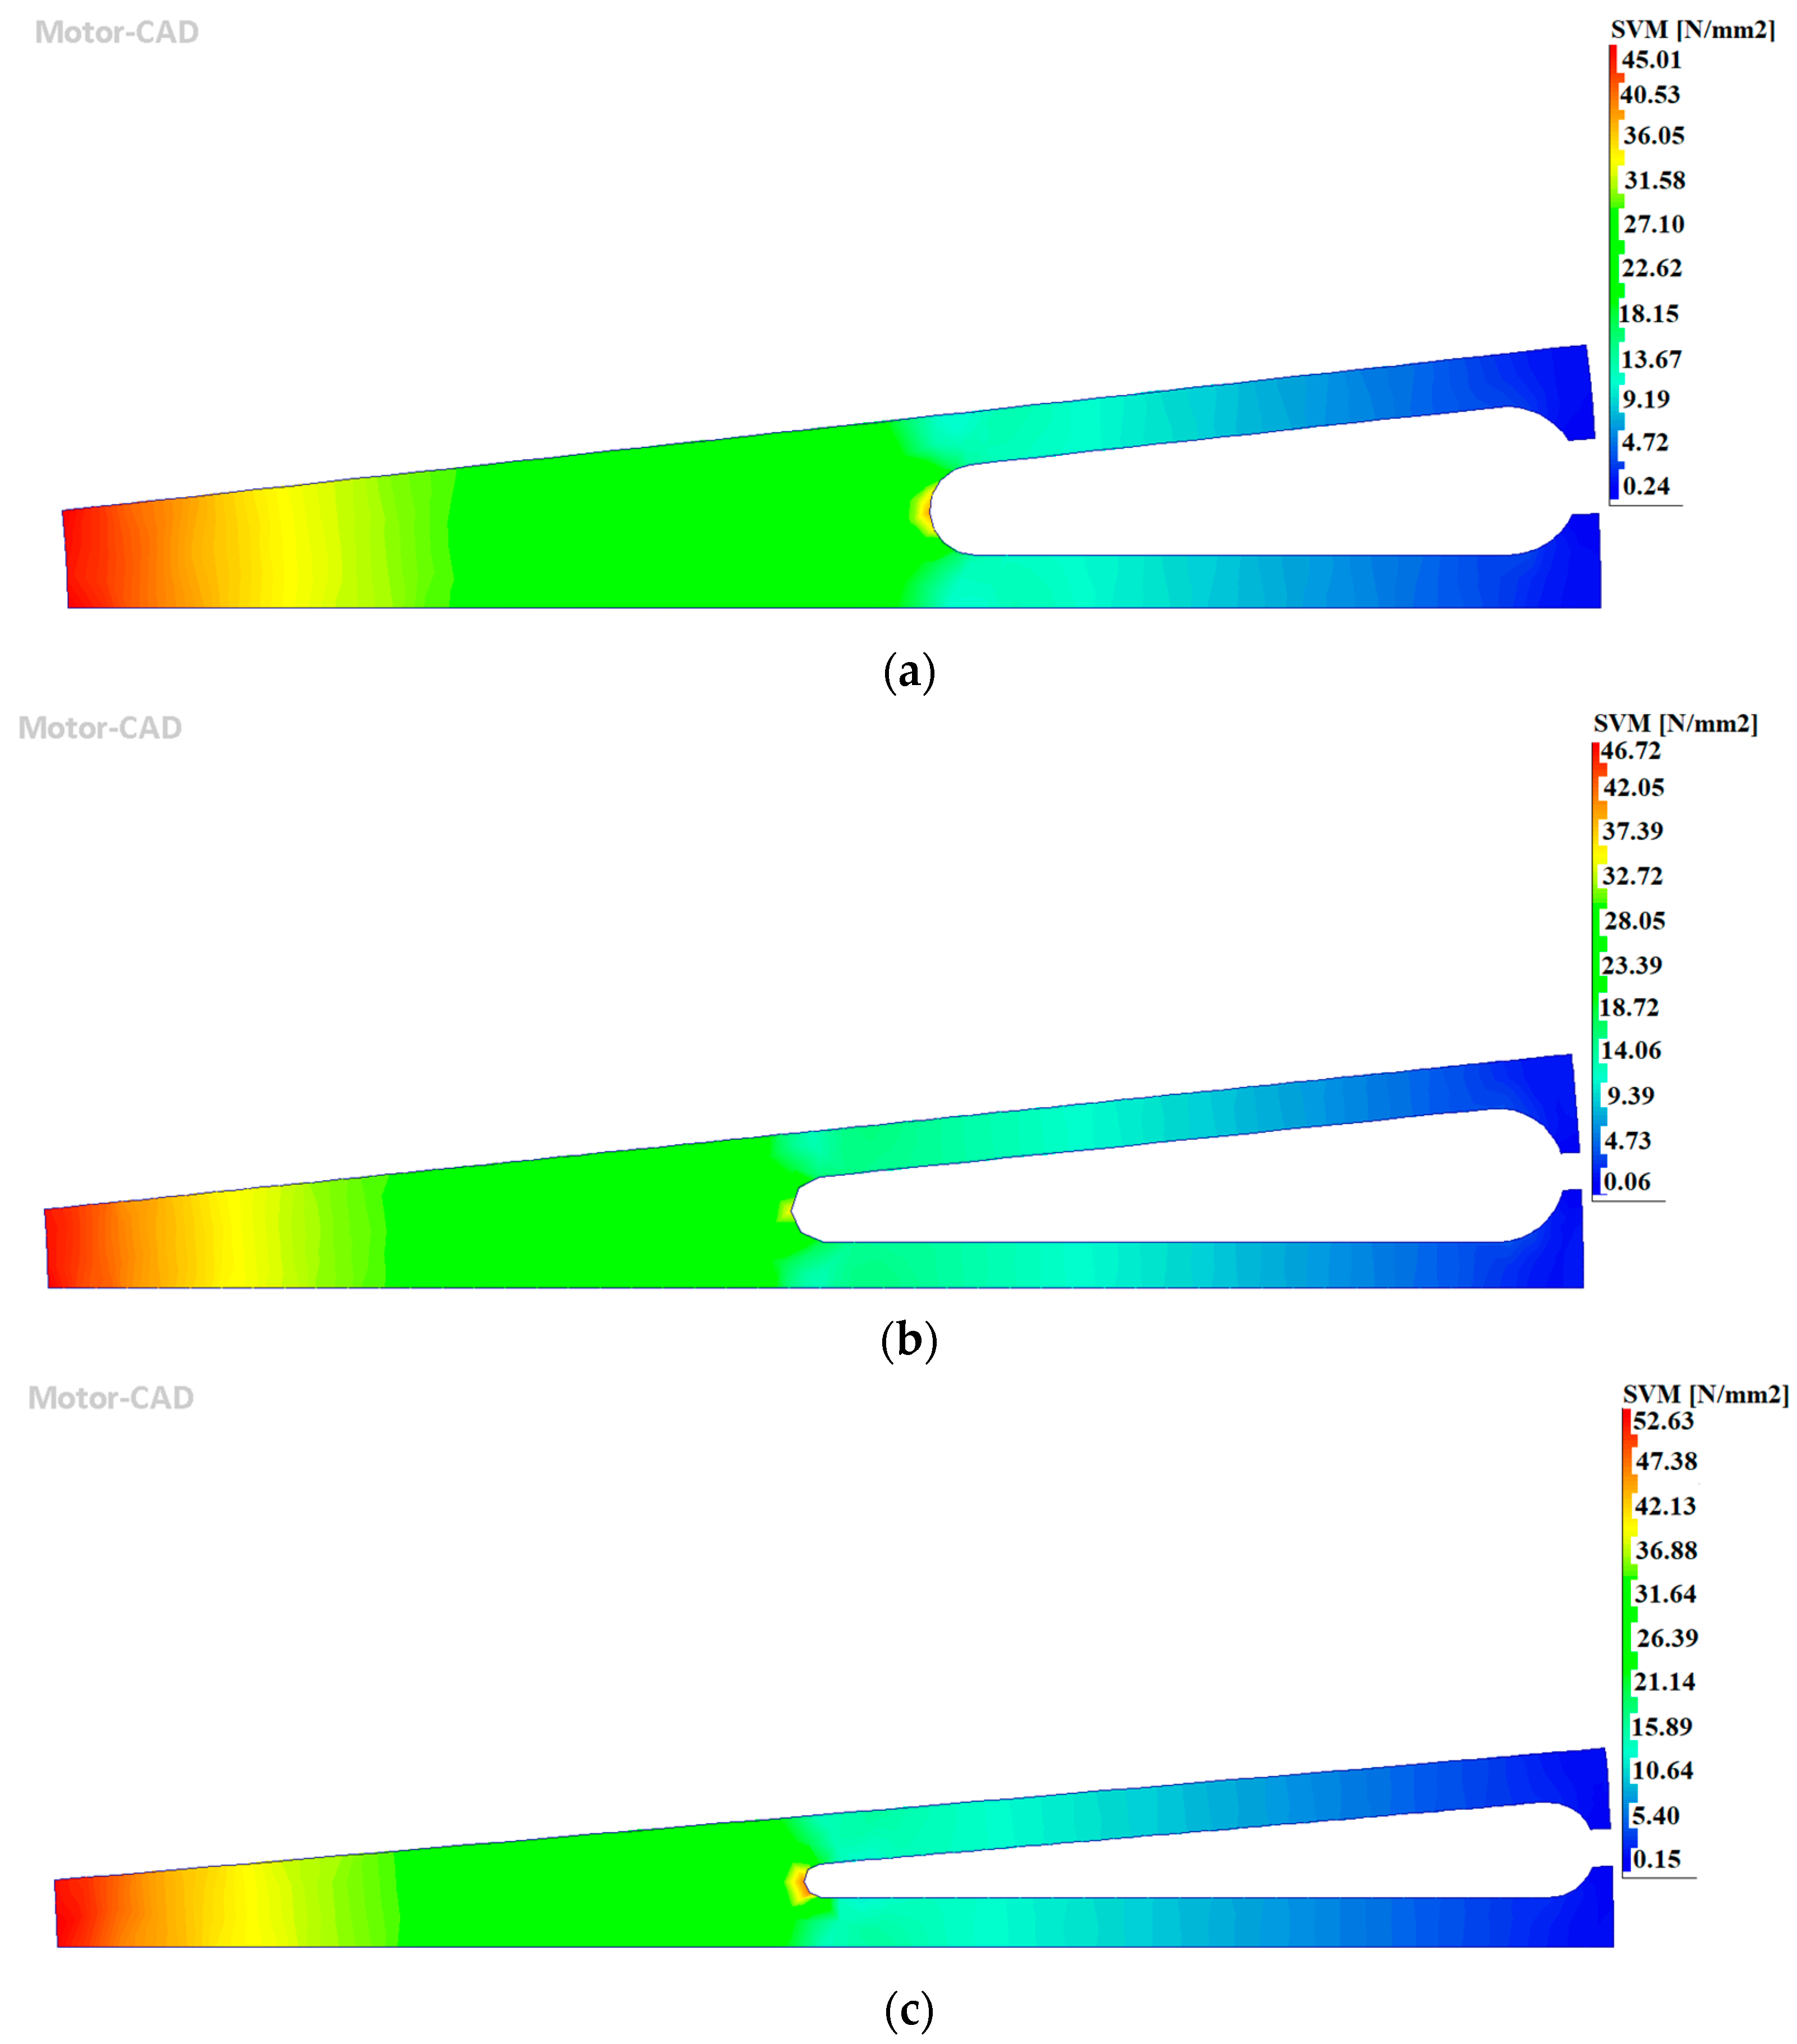
5.3. Mechanical Stress Analysis
The steady-state performance of the designed IMs is investigated using static structural FE. For this purpose, the Von Mises stress (VMS) due to centrifugal force is used to evaluate the mechanical tolerability. It should be noted that there are some additional loads that are caused by vibration, thermal expansion, rotor dynamic, and electromagnetic forces. But since they have little impact on the overall applied stress, they are disregarded. In the static structural FE analysis, there is some degree of uncertainty, and it is recommended that a factor of safety (FoS) should be considered. Due to the severe loading condition and harsh environment of the EV applications, this parameter is considered as 2. The maximum working speed of this traction motor is 9000 rpm but, according to the standard, traction motors should function correctly at 20% higher speed. Therefore, the mechanical analysis is carried out at 10,800 rpm. The yield strength of M250-35A is 455 N/mm
2. With an FoS of 2, the limitation of applied VMS is 227.5 N/mm
2. As shown in
Figure 8, the obtained results indicate that all three designs have a proper condition and there is no risk of mechanical failure. However, the S48R58 and S48R62 combinations have a slightly better performance.
5.4. Nominal Envelope Curve Considering Thermal Aspects
In EVs, generally, a temperature sensor is installed at the hotspot point of the winding to protect the motor against overheating. The considered temperature value for this point is based on the designer’s opinion and expected lifetime or overhaul time of the traction motor. Therefore, based on capabilities of the utilized traction motor, it is possible to consider a lower temperature for the hotspot limit.
To evaluate the envelope curves of the optimum designs, two-way electromagnetic thermal analysis with consideration of limited hotspot temperature is carried out. It should be noted that in multi-physics analysis the following parameters are considered.
The winding’s hotspot temperature is 155 °C (the considered insulation class of the winding is class H with a corresponding temperature of 180 °C; however, due to ignoring some parameters like drive harmonics, etc., the lower temperature threshold is considered);
The switching type is sine/triangle with third harmonic injection;
The corresponding DC link voltage to the selected switching method is 400 V;
The maximum current limit is 475 A.
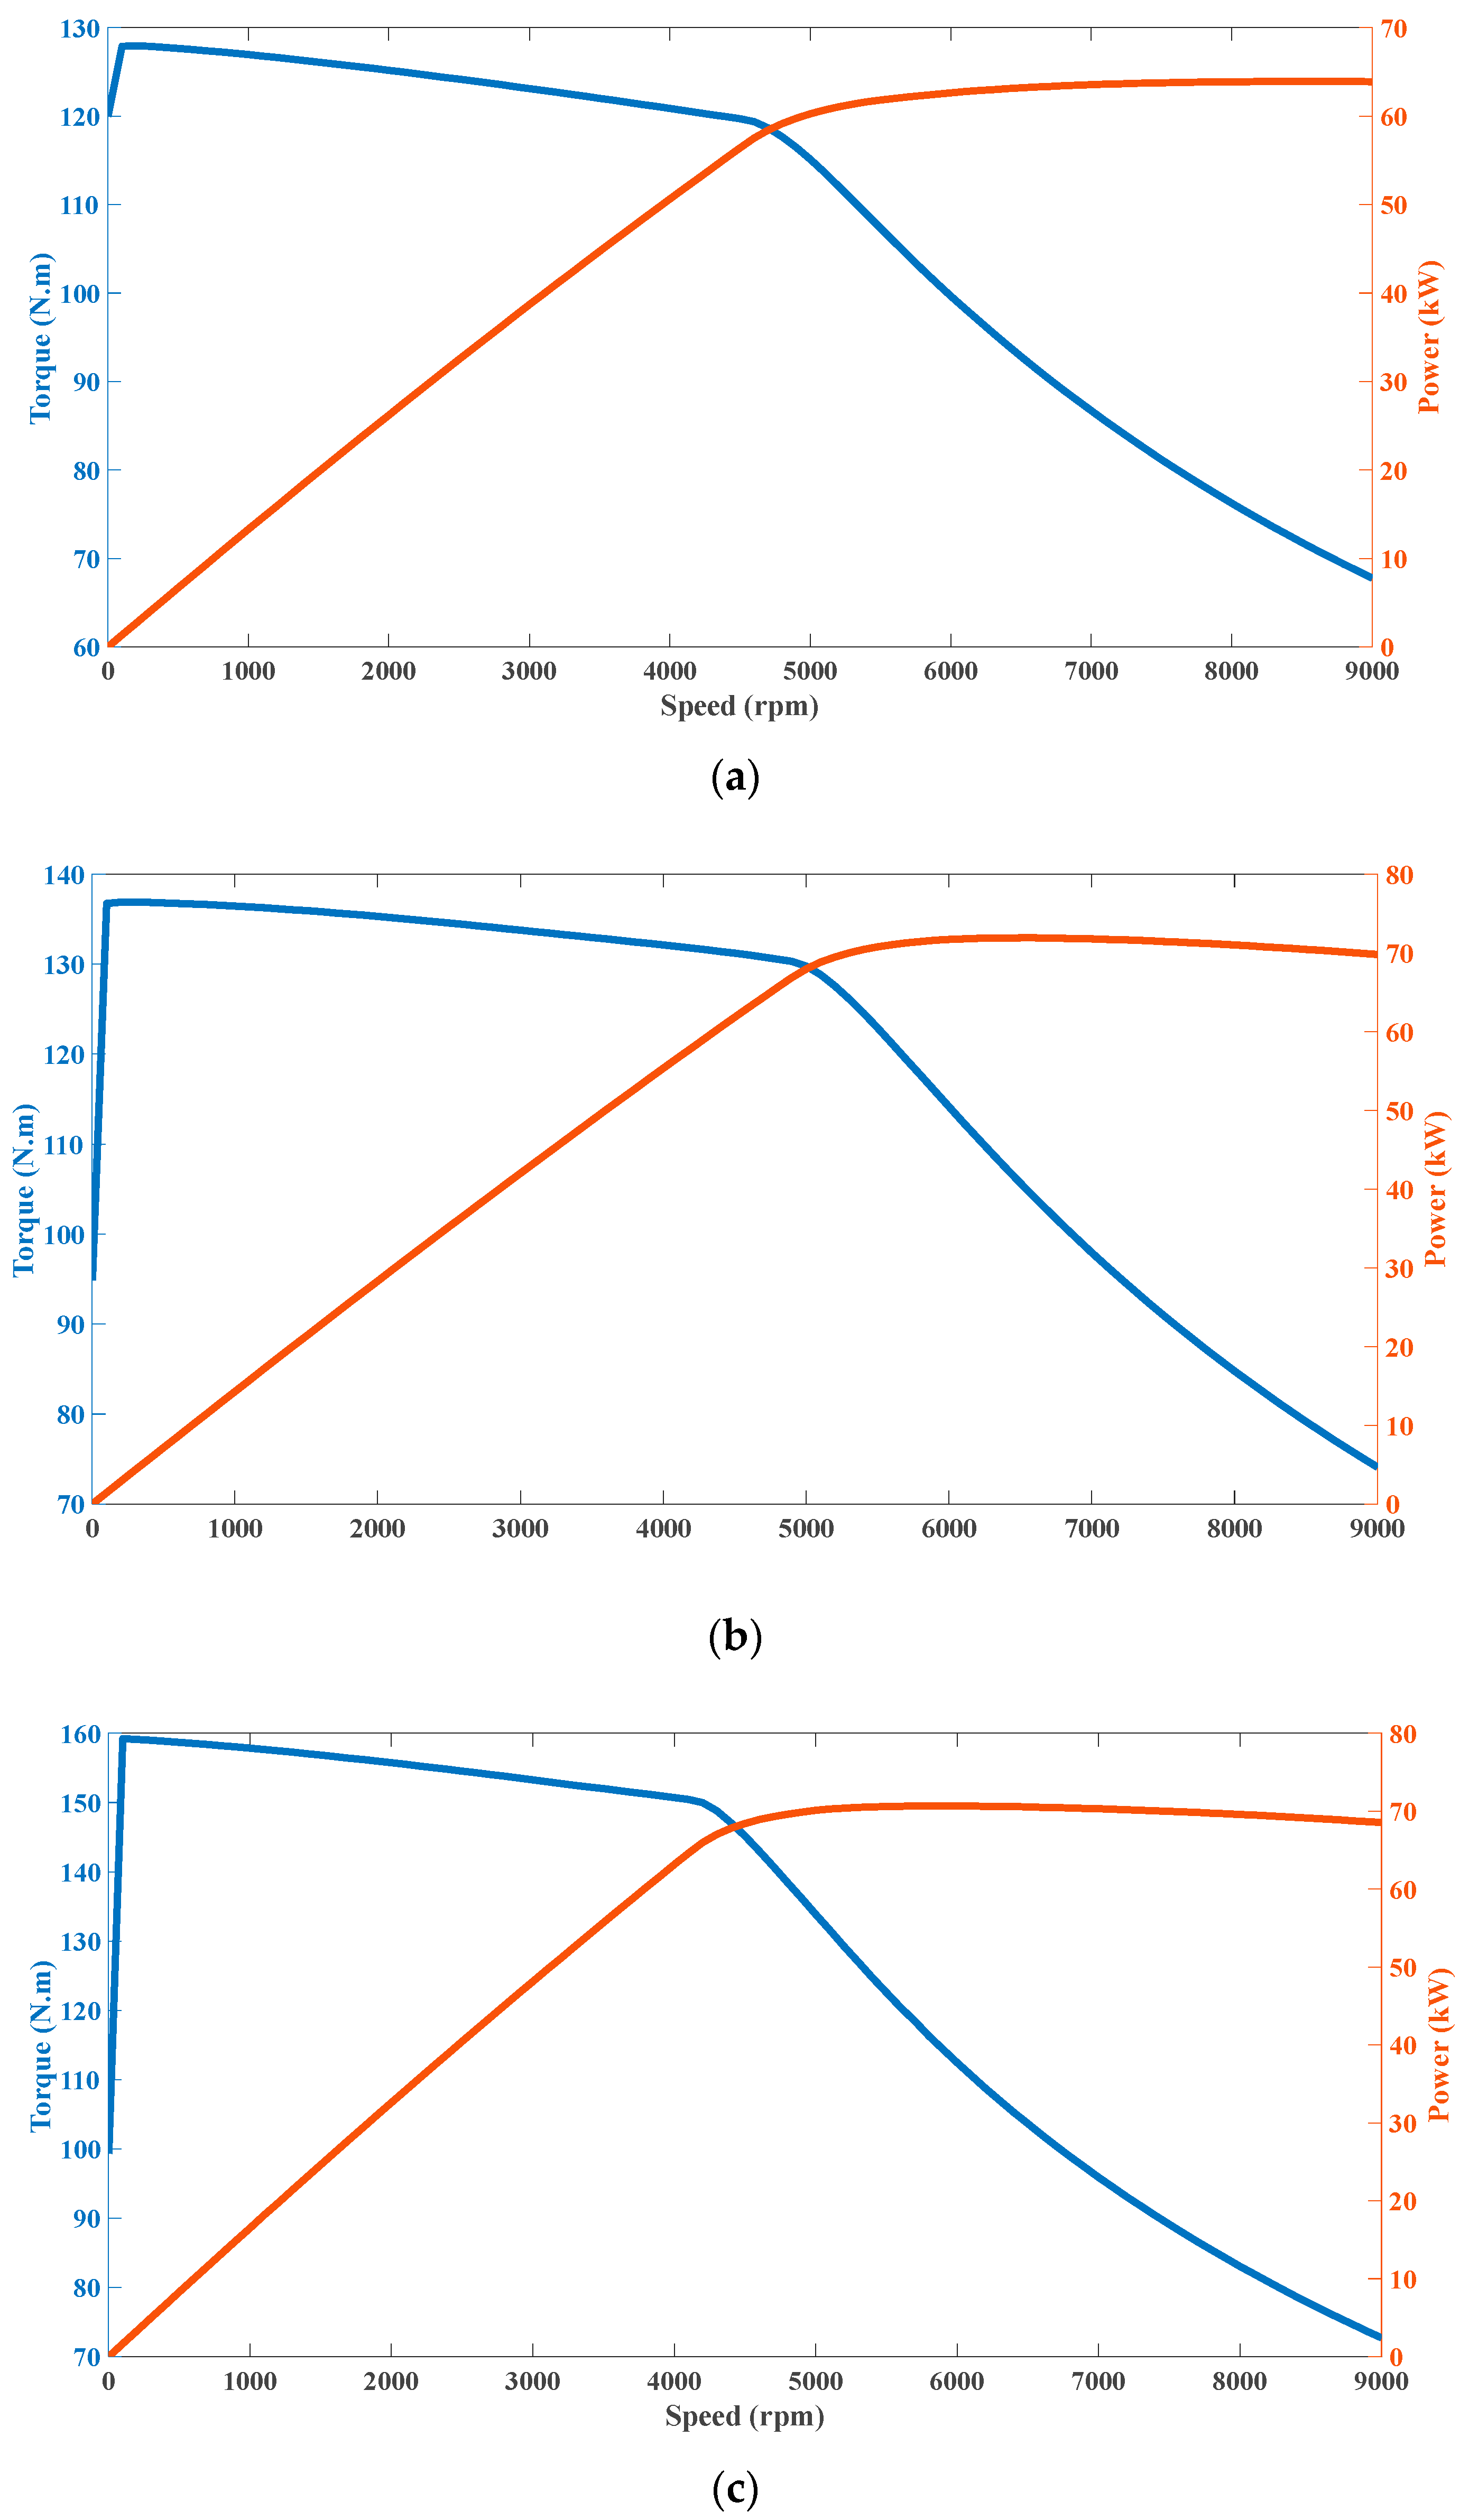
The obtained results of
Figure 9 indicate that for speeds lower than the base speed of 3800 rpm (base speed), the S60R74 combination can deliver higher torque followed by S48R62 and S48R58 combinations.
For speeds higher than 3800 rpm, the nominal power of the S48R62 and S60R74 combinations is about 70 kW, while this value for S48R48 parameters is about 64 kW. The S48R62 combination can effectively deliver 70 kW until 9000 rpm, whereas the nominal power of S60R74 combination is slightly reduced at higher speed. In other words, the S48R62 combinations have a wider constant power speed region.
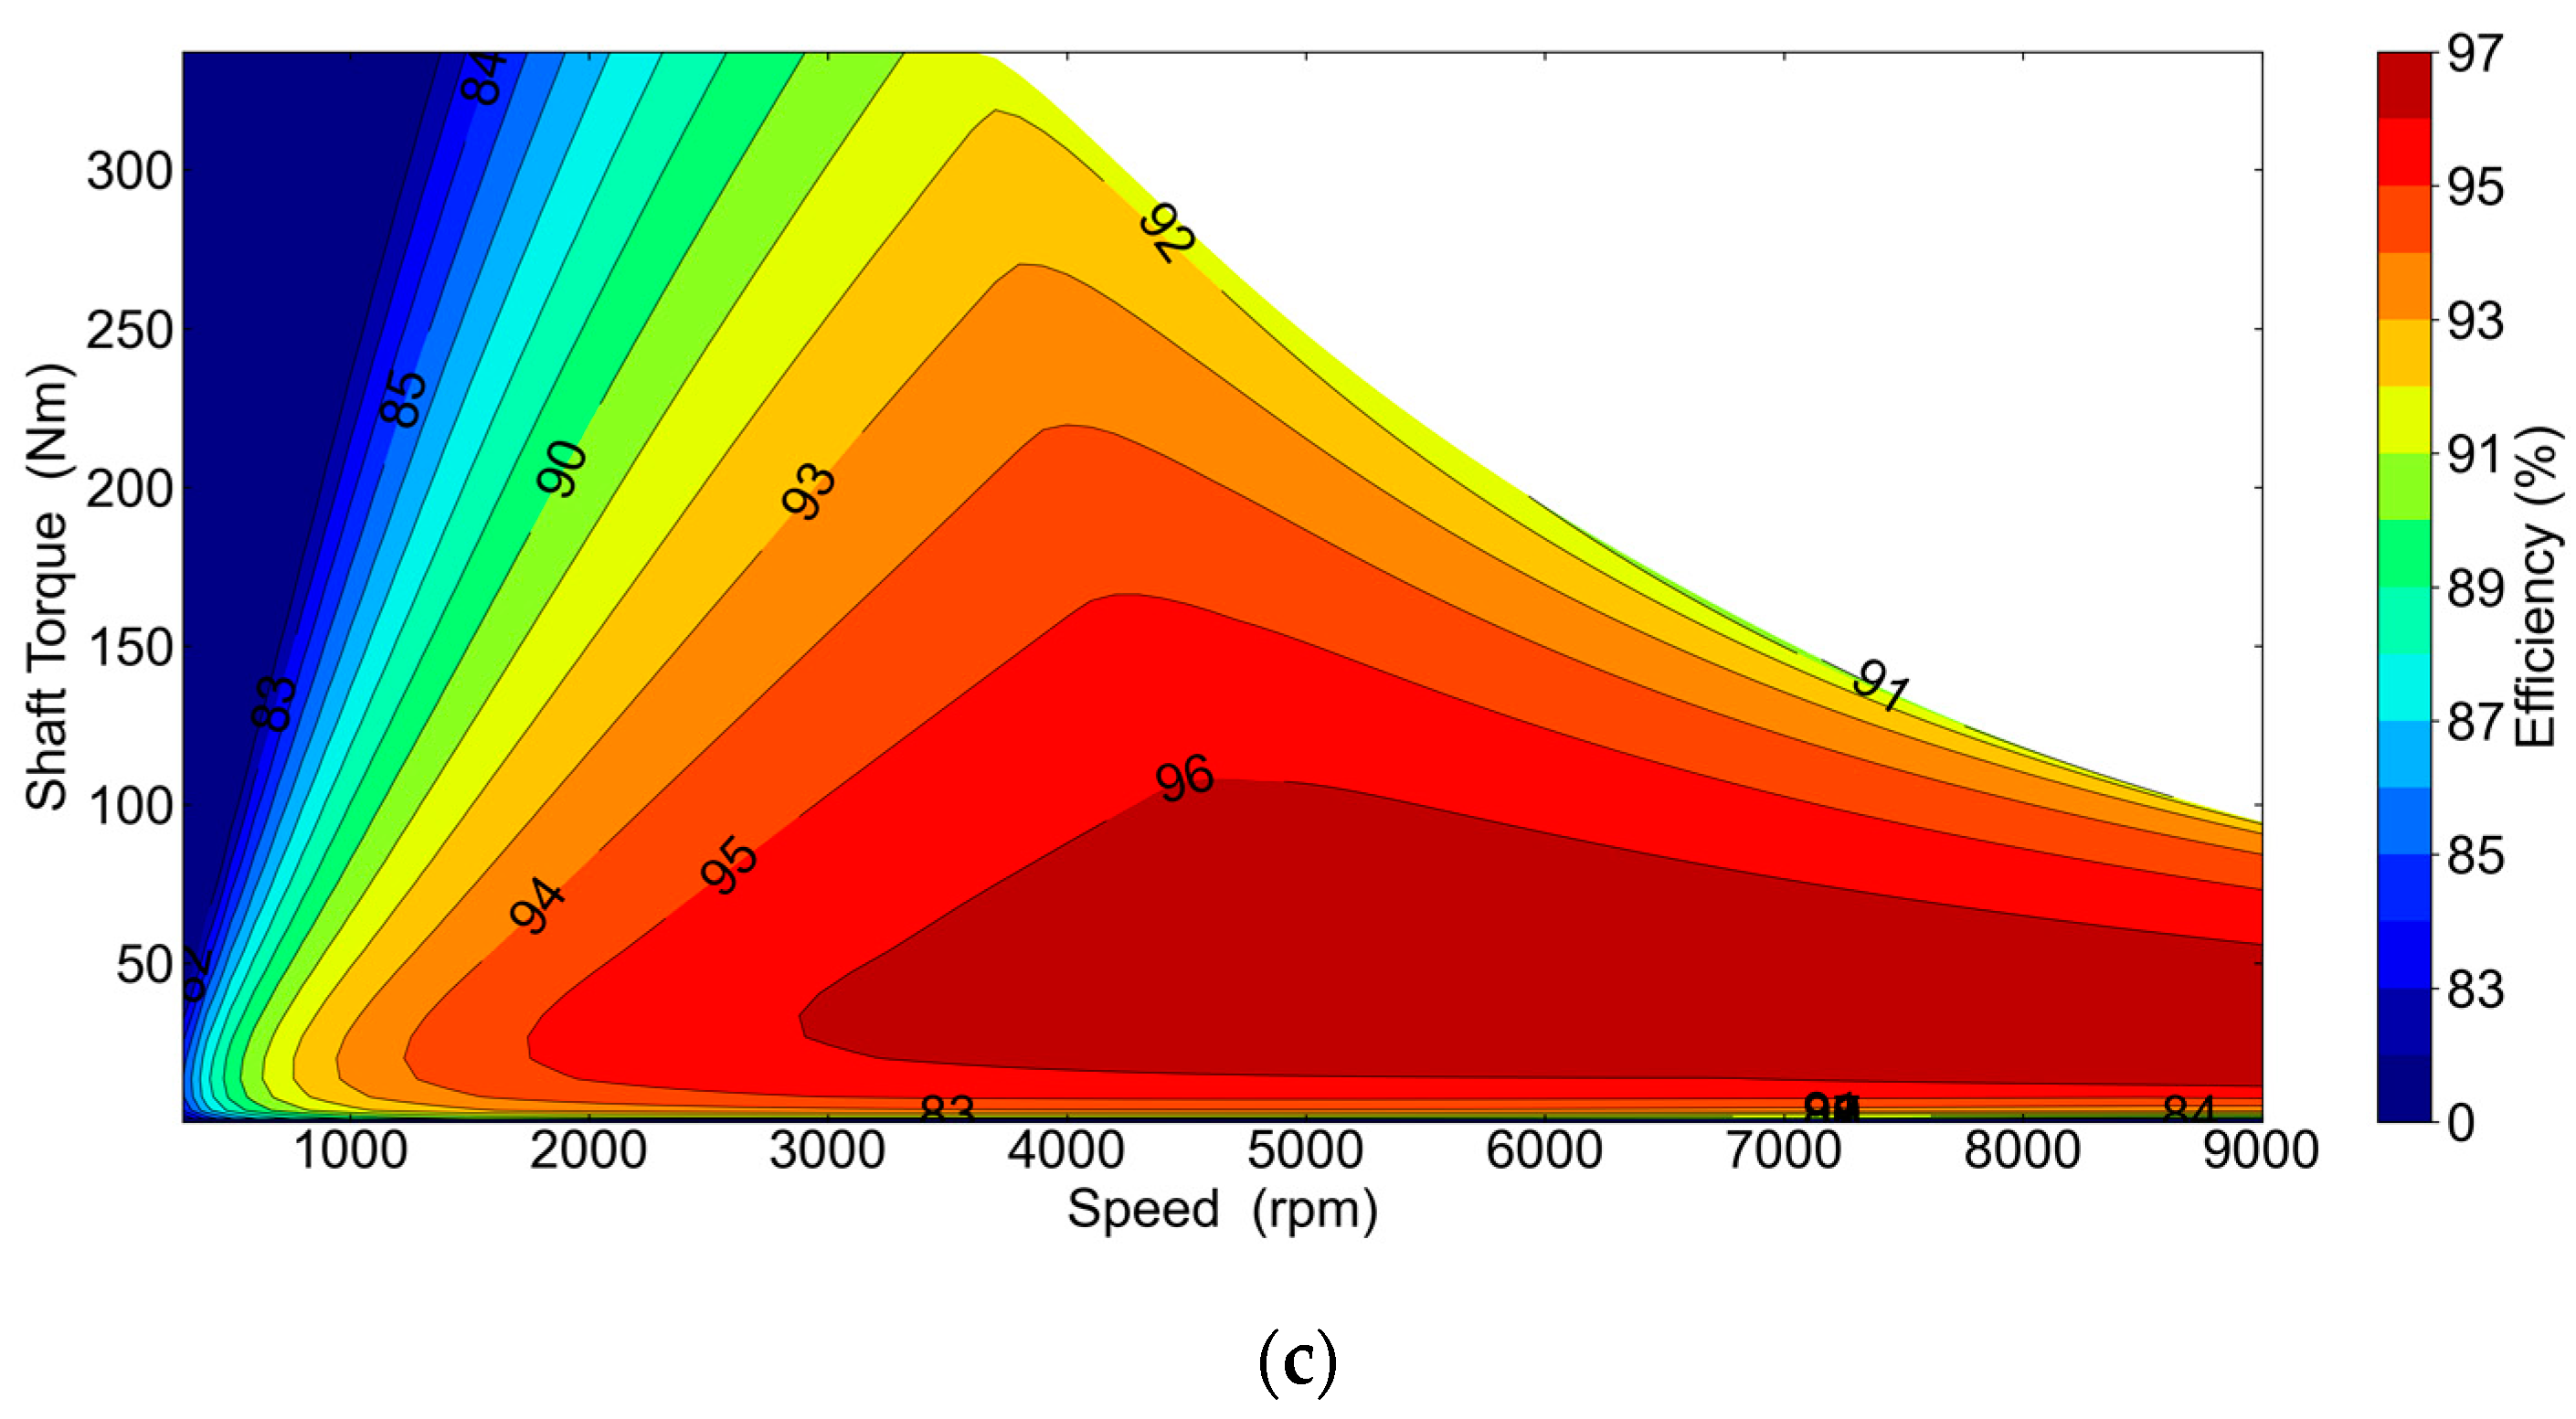
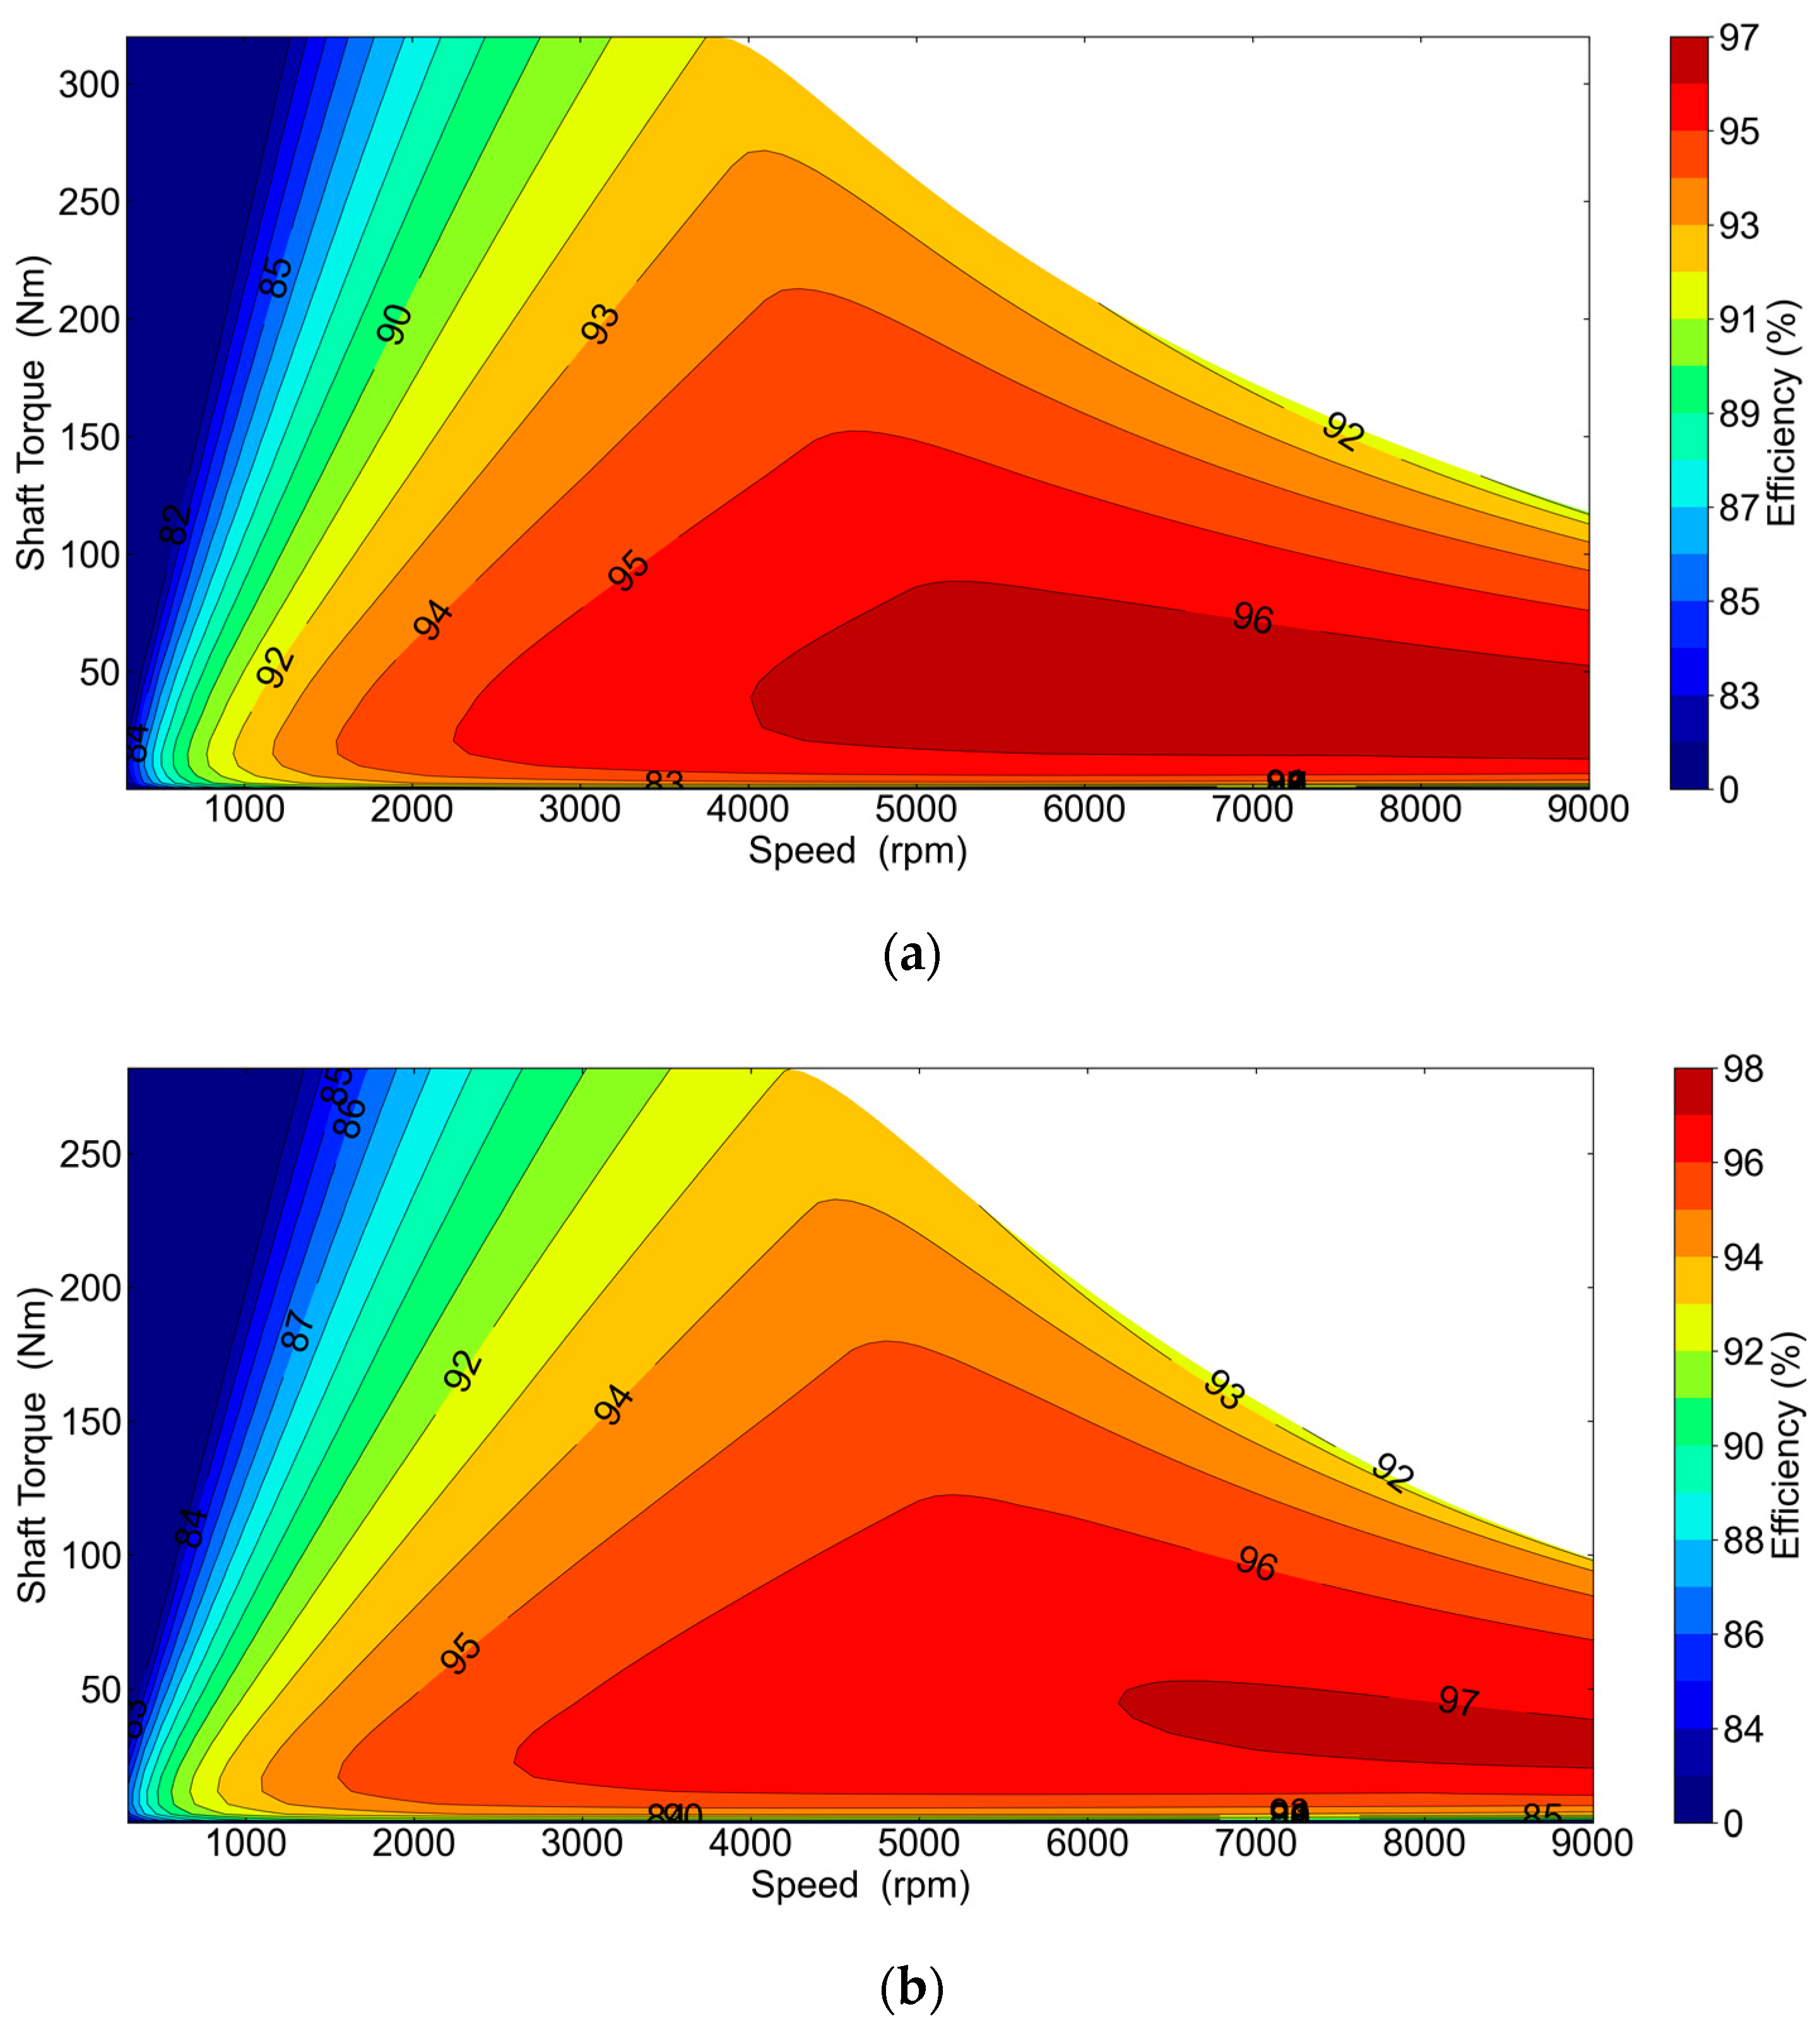
5.5. Efficiency Map
The efficiency maps of the optimum designs are illustrated in
Figure 10. In the calculation process, the maximum current is set to 475A, and the DC link voltage is 400 V with a maximum modulation index of 1. It is obvious that the S48R48 and S60R74 can properly deliver the required torque of 300 N.m, whereas for S48R62 combination, the maximum torque is limited to 270 N.m. The wider high-efficiency region results in better performance in the driving cycle and implies an improved vehicle range. The S48R62 has a region with maximum efficiency of 97%, while for the other two, it is limited to 96%. For regions with an efficiency over 96%, the S48R62 and S60R74 have wider higher efficiency regions compared to S48R58. For example, in the S48R58 design the optimum region starts from a speed of around 4000 rpm and the torque is lower than 90 N.m. For S48R62 and S60R74, it starts from 3000 rpm and its torque value is higher than 100 N.m.
The S48R62 combination could not provide the transient requirements, and its maximum torque is below 300 N.m. Therefore, despite its superior performance over the driving cycle, the improved efficiency and nominal torque envelope, it is not selected as an optimum design. Between S48R58 and S60R74, the latter one has a wider high efficiency region and has better performance. Therefore, the S60R74 combination is selected as the optimum design.
6. Conclusions
In this paper, a sequential Taguchi method for design optimization of IM by considering driving cycle performance was introduced. The case study was a 120 kW water-cooled copper cage IM.
In the proposed systematic design, the number of possible and applicable SSRB combinations is reduced. First, based on a series of empirical and mathematical relationships, the available options are specified. Then, the remaining optimum SSRB combinations are optimized over the four driving cycles of NEDC, US06, WLTP Class 3, and EUDC using representative points calculated using K-means clustering. The proposed design optimization procedure requires a minimum number of FEM results and effectively reduced the required time for optimization. By comparison of different SSRB combinations, it was found that the S60R74 had a superior performance compared to other designs and was selected as an optimum design. The proposed method requires the minimum number of FEM samples and can efficiently optimize the IM over driving cycles.
It was found that the S48R62, which had the highest efficiency region (over 97%), could not deliver the required torque envelope. It is therefore shown that the K-means clustering method is not completely robust for the design of electric machines for electric vehicle traction motors. The method focuses on regions with high-density working points, and it is necessary to add the envelope curve and transient operation mode to existing clustering or representative point calculation methods for robust analysis.


