Article

MPPT Strategy of Waterborne Bifacial Photovoltaic Power Generation System Based on Economic Model Predictive Control

1
College of New Energy and Power Engineering, Lanzhou Jiaotong University, Lanzhou 730070, China
2
College of Electrical and Mechanical Engineering, Lanzhou Jiaotong University, Lanzhou 730070, China
3
College of Automation and Electrical Engineering, Lanzhou Jiaotong University, Lanzhou 730050, China
*
Author to whom correspondence should be addressed.
Energies 2024, 17(1), 152; https://doi.org/10.3390/en17010152
Submission received: 28 November 2023 / Revised: 12 December 2023 / Accepted: 25 December 2023 / Published: 27 December 2023
(This article belongs to the Section A2: Solar Energy and Photovoltaic Systems)

Abstract

:
At present, the new energy industry represented by photovoltaics has become the main force to realize the optimization of China’s energy structure and the goal of “double carbon”; with the absence of land resources, the waterborne bifacial photovoltaic has ushered in a new opportunity. Therefore, in order to address the problem that the maximum power point tracking (MPPT) of photovoltaics (PV) could not take into account, the dynamic economic performance in the control process, an economic model predictive control (EMPC), is proposed in this work to realize the MPPT of the waterborne bifacial PV power generation system. Firstly, the model of the bifacial PV module is constructed by combining the ray-tracing irradiance model and considering the effect of water surface albedo on the irradiance absorbed by the module. Secondly, the EMPC controller is designed based on the state-space model of the system to maximize the power generation as the economic performance index, and to solve the optimal input variables time by time to achieve a rolling optimization with the operational requirements of the system itself as the constraints. Thirdly, the MATLAB/Simulink (R2022a) simulation experimental results verify that the EMPC strategy could be utilized to achieve MPPT of the waterborne bifacial PV power generation system, according to the changes of environment. Finally, it is also demonstrated that the bifacial PV power generation system that employed the EMPC strategy outperformed the traditional MPPT algorithm, with respect to both output power tracking velocity and accuracy, and the power generation could be improved by about 6% to 14.5%, which significantly enhances the system’s dynamic process economics.

1. Introduction

With increasing global energy demands [1], solar energy has become the most inexhaustible and ecologically beneficial renewable energy source today. It has drawn wide attention in industrial fields, such as desalination power [2] and generation [3]. According to the Ministry of Global Renewable Energy forecast, from 2020 to 2030, the global demand for waterborne photovoltaics (PV) are expected to grow at an average annual rate of 22%, and the installed capacity of waterborne PV will be more than 30 GW in 2030. Hencec waterborne PV has been hailed as a new energy source, “accelerating the transition of the solar energy−driven future of the most effective leverage”. Solar energy can be converted into electricity through both sides of the bifacial PV module to generate additional energy, making the bifacial PV module leap forward as the PV industry’s new favorite [4,5]. Based on data, bifacial photovoltaic modules comprised approximately 45% of the total photovoltaic module in the third round of the “Photovoltaic Leader” project, as per the statistics [6].
The increased performance ratio, reduced operational expenses, and expanded usability of bifacial PV panels have garnered significant interest among scholars both nationally and internationally [6,7,8]. Appelbaum et al. [9] deliberated on the computation of yearly occurrence radiation for a PV facility comprised of bifacial PV modules organized in numerous rows with two arrangements. Gu W et al. [10,11] developed an integrated optical−electrical−thermal model of a bifacial PV module, where the overall irradiance of the tilted front and rear surfaces is obtained through an optical model, and the corresponding power output is obtained through an electrical model. Mouhib et al. [12] described the current status of bifacial PV, introduced bifacial PV and its differences from conventional mono−facial PV, and identified different parameters characterizing bifacial performance. Current works on the bifacial PV generation system primarily focus on their generation principles, internal structures, and other related aspects, but they tend to neglect the modeling methodology for bifacial PV modules and the maximum power point tracking (MPPT) technique employed in bifacial PV generation systems. The maximum peak of the bifacial PV system could be influenced by external factors such as diurnal fluctuations, alterations in cloud cover, and variations in weather conditions. Ensuring an efficient and effective MPPT is crucial to enhance the power conversion efficacy of the PV generation system [13,14]. Currently, studies on MPPT, both in the domestic and international domains, can be broadly categorized into the following groups. Firstly, there are conventional MPPT algorithms, such as the perturbation observation (P&O) algorithm [15] and the incremental onductance (INC) algorithm [16,17], which are widely adopted. Abdel-Salam et al. [15] proposed the P&O algorithm that adds the change of PV outlet current as the third tracking index in the flow chart, which effectively increases the tracking efficiency of the traditional P&O algorithm’s tracking efficiency. Nevertheless, the conventional MPPT technique encounters challenges in precisely monitoring the maximum power point (MPP) amidst abrupt variations in environmental conditions. The other single category consists of intelligent algorithms, such as Particle Swarm Optimization (PSO) [18,19,20,21]. Koad R.B et al. [18] proposed the use of the PSO algorithm to solve the problems of traditional MPPT algorithms, which are easy to fall into local optimum and slow convergence. However, the convergence of intelligent algorithms is difficult to determine, and if the parameters are not selected properly, it will lead to system operating point oscillation. In addition, bionic meta−heuristic algorithms have also received wide attention [22,23]. Moghassemi Ali et al. [22] proposed to implement MPPT for partially shaded PV systems based on the whale optimization algorithm and differential evolutionary algorithm, and studied the performance evaluation of MPPT. Although it has a significant improvement in tracking accuracy, the bionic meta-heuristic algorithm leads to a significant reduction in tracking accuracy speed due to the huge computational cost [24,25]. In addition, the modern optimization algorithms exhibit greater advantages in the application of MPPT. Eltamaly [26] proposed the musical chairs algorithm for the case of highly dynamic changes in shading conditions, which could significantly reduce the convergence time and failure rate, and improve the efficiency and stability of the PV system.
The model predictive control (MPC) strategy has been used in PV applications due to its ability to handle process variable constraints as well as optimize performance metrics [27,28,29]. Sajadian et al. [30] proposed a concept based on the combination of MPC and pole search optimization for tracking the maximum power point, with a simple control structure and a fast dynamic response. Metry M et al. [31] applied the MPC principle to remove the usual current sensors needed for unconventional MPPTs in order to achieve a faster response and reduced power ripple in a steady state. Nonetheless, external disturbances result in alterations to the reference value, thereby rendering the conventional MPC oblivious to the system’s economic efficiency while undertaking real−time tracking. To solve this problem, economic model predictive control (EMPC) has attracted attention because it can consider the control and optimization problem of MPPT from a new perspective [32,33,34,35,36,37]. EMPC reflects the process economy directly or indirectly as the objective function and adjusts the optimal operation strategy in real time to improve the dynamic economy of the system while satisfying the operation constraints [38,39,40,41,42].
In this paper, focusing on the bifacial PV power generation system, this work proposed an economic model predictive control-based MPPT strategy. This strategy aims to achieve real-time optimization of the system’s operating point by continuously monitoring the current economic performance index, while ensuring compliance with operation constraints. Shown in Figure 1 is the tracking principle schematic of the MPP of the bifacial PV generation system. The innovations of this paper are: (1) By examining the phenomenon of light reflection and refraction on the water surface, this work developed an irradiance model for a bifacial PV module based on its solar operation mode and employed the bifacial coefficients to establish the module’s electrical characteristics. (2) The EMPC controller was designed based on the state−space model and combined with the equipment operation constraints of the bifacial photovoltaic power generation system. An economic objective function was established to solve the system, with the maximization of power generation as the economic performance index. (3) We analyzed and compared the control effects of EMPC and traditional MPPT, and verified that the algorithm can coordinate multivariable control actions according to internal and external operating conditions and improve the dynamic economy of the system.
The paper is organized as follows: a mathematical model of the waterborne bifacial PV power generation system, as well as an irradiance model, are developed in Section 2. In Section 3, the proposed EMPC strategy and the flow of controller design are derived. In Section 4, a MATLAB (R2022a) simulation of the proposed EMPC strategy is performed, and the classical MPPT strategy and EMPC strategy are compared to verify the effectiveness and practicality of the EMPC strategy. In addition, in this section, the superiority of bifacial PV modules compared to mono-facial PV modules is comparatively analyzed. Finally, Section 5 provides the conclusion.

2. Modeling of Waterborne Bifacial PV Generation System

2.1. Mathematical Modeling of Waterborne Bifacial PV

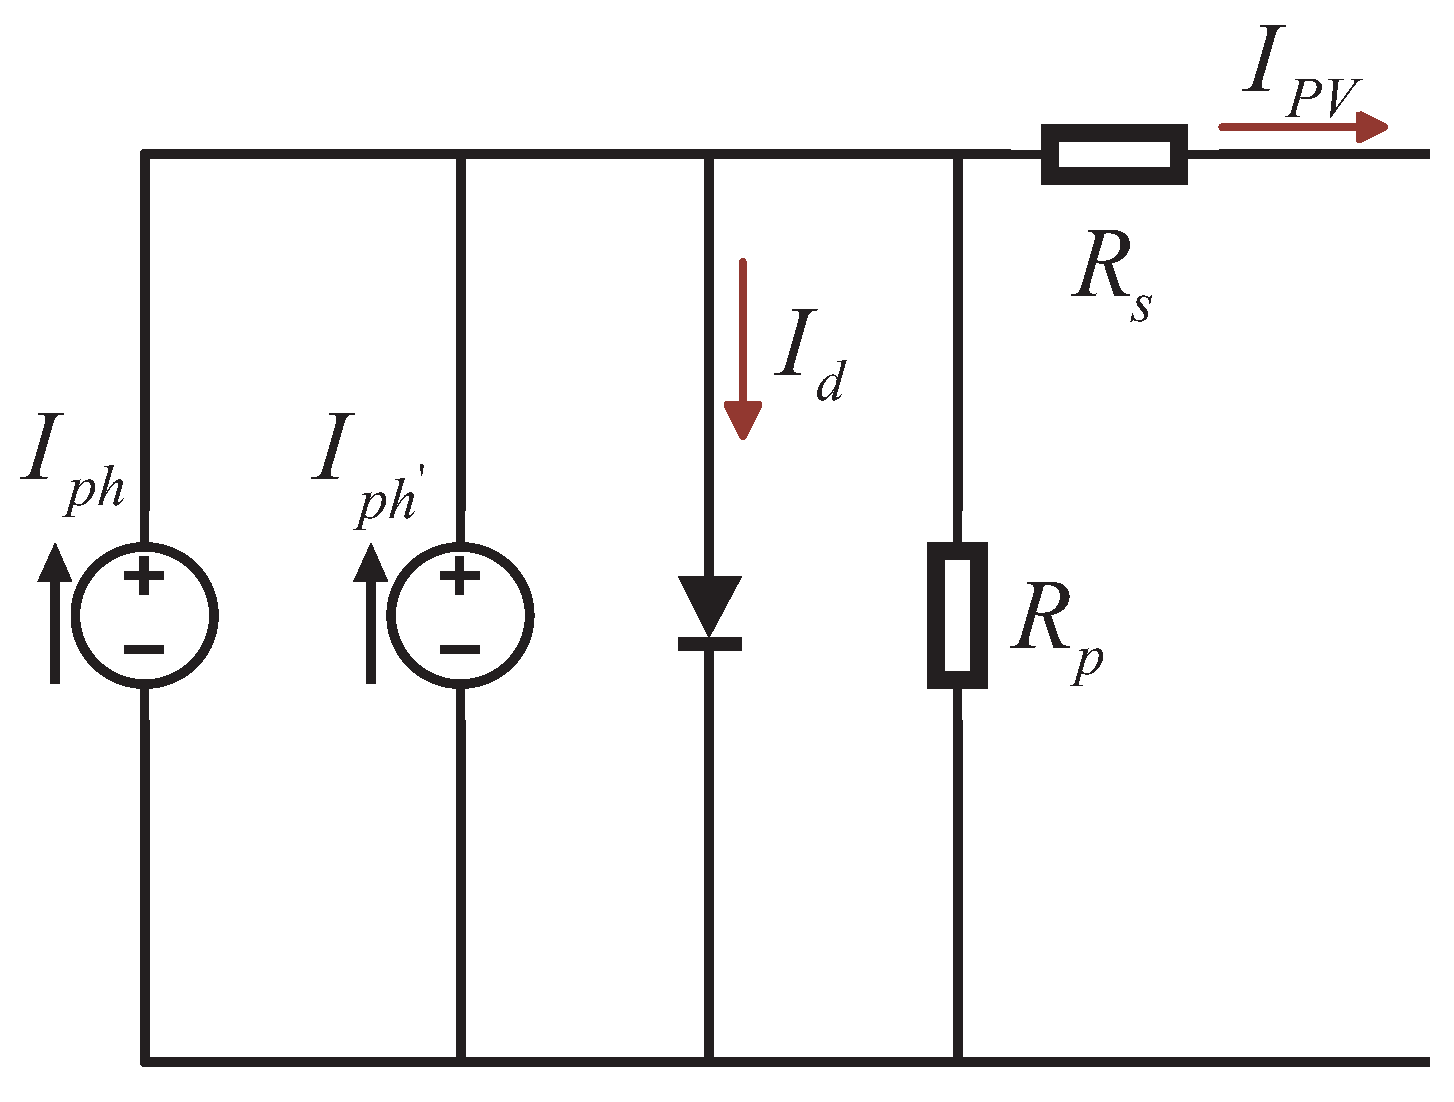
The waterborne bifacial PV power generation system consists of numerous components, such as the array made up of bifacial PV cells utilized for power generation, the controller for regulating and controlling power, DC−DC converter, inverter, and the other electrical connections [3]. In order to facilitate the calculation, the bifacial PV module could be treated as a regular mono-facial PV module. Figure 2 illustrates the equivalent circuit model of the PV cell.
With the change of external environmental factors, the short-circuit current  I s c  and open-circuit voltage  U o c  of the bifacial PV module are [7]:
I s c = I s c G 1000 1 + σ 1 Δ T
U o c = U o c 1 σ 3 Δ T ln 1 + σ 2 Δ G ,
where,  I s c U o c  are the short-circuit current and open-circuit voltage under standard test conditions, respectively.  σ 1  = 0.0025/°C,  σ 2  = 0.5 m 2 /W,  σ 3  = 0.00288/°C.
In the presence of temperature T and irradiance G variations, the output current  I m p p  and voltage  U m p p  at maximum power are:
I m m p = I m m p G 1000 1 + σ 1 Δ T
U m m p = U m m p 1 σ 3 Δ T ln 1 + σ 2 Δ G .
Based on Equations (1)–(4), the mathematical modeling of the bifacial PV array when applied to the engineering can be obtained as follows:
I = I s c 1 ζ 1 exp U ζ 2 U o c 1 ,
where:
ζ 1 = 1 I m m p I s c exp U m m p ζ 2 U o c .
ζ 2 = U m m p U o c 1 ln 1 I m m p I s c 1

2.2. Water Surface Albedo

Light is refracted and reflected at the surface of the water, alternating the transmission of radiant energy [43]. If polarization is neglected, the direct albedo of still water is given by Fresnel’s law as (8):
R θ s = 1 2 sin 2 θ s θ d sin 2 θ s + θ d + tan 2 θ s θ d tan 2 θ s + θ d ,
where:  θ s  is the angle of light incidence,  θ d  is the angle of light refraction.
The water surface moves in a wavy pattern due to the wind. Equation (9) provides the total amount of light reflected by the water surface, taking into account the wind speed.
γ f θ a , β a , θ v , β v = 1 C s γ v θ a , β a , θ v , β v + C s ρ f π ,
where:  C s  is the droplet coverage;  γ v θ a , β a , θ v , β v  is the bi-directional albedo of a droplet-free water body considering wind speed;  β a  is the azimuth of the incident plane;  θ v  is the observation angle of the sensor;  β v  is the azimuth of the observation plane.
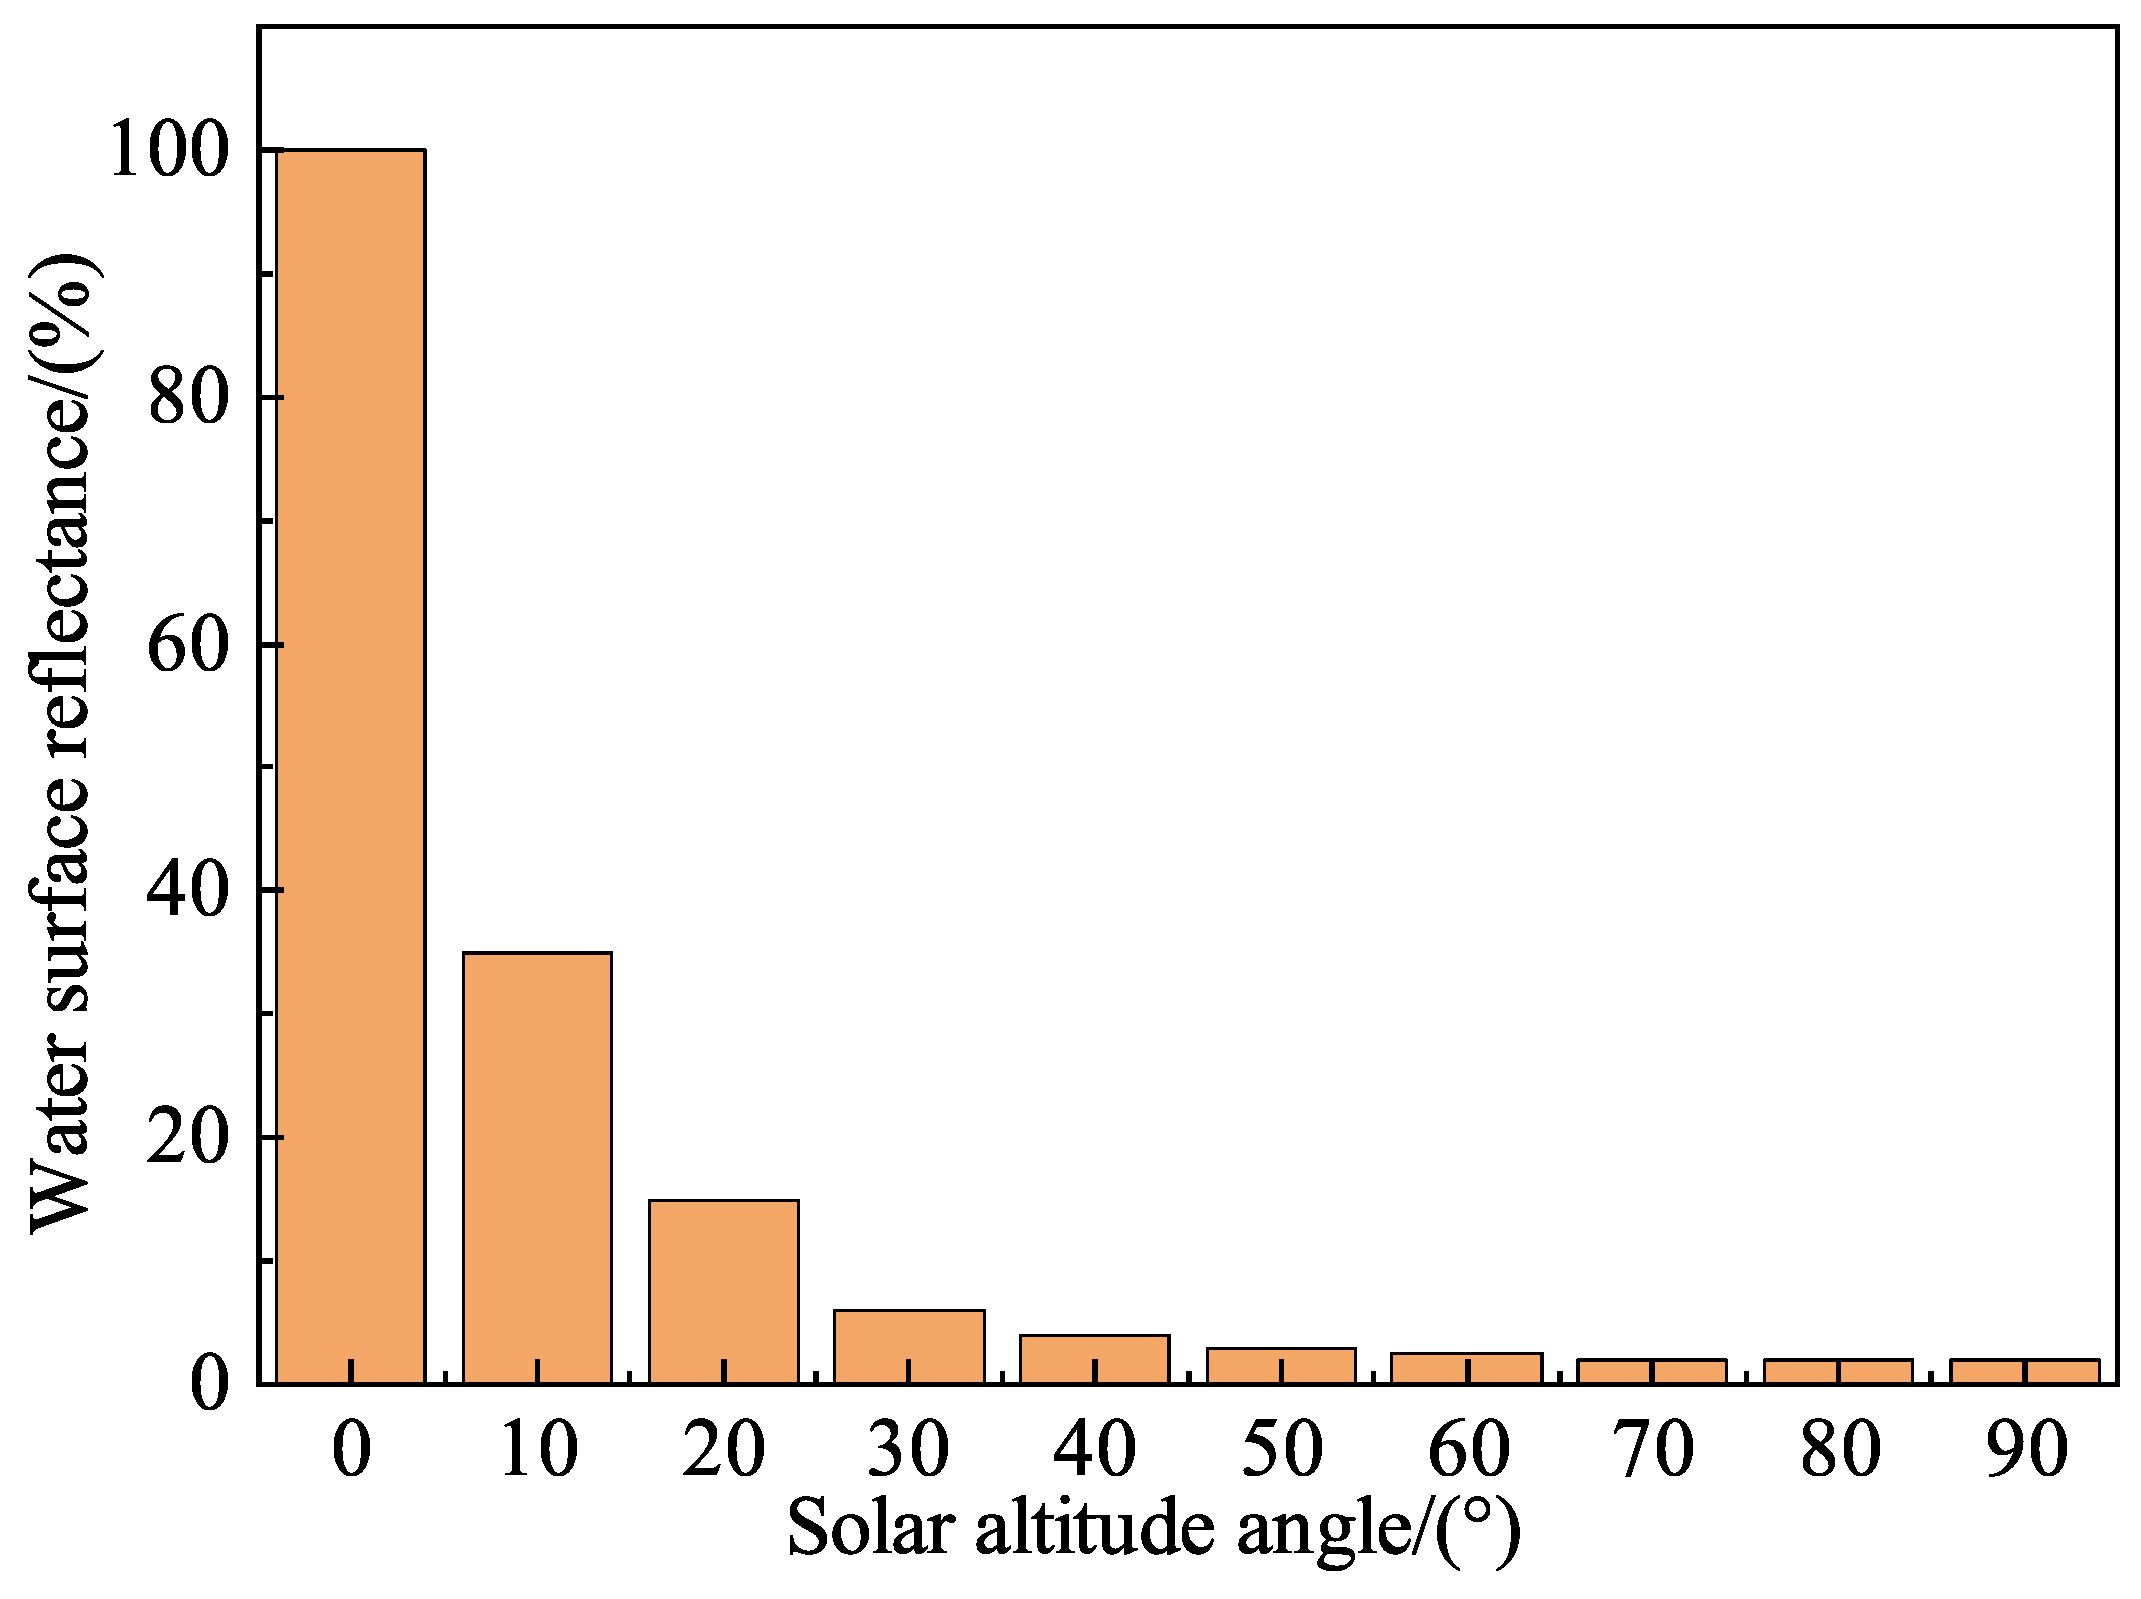
The albedo of sunlight on the water surface is closely related to the solar altitude angle, and as the solar altitude angle changes, the albedo changes accordingly [43]. Figure 3 illustrates the relationship between the solar altitude angle and the water surface albedo of the law.
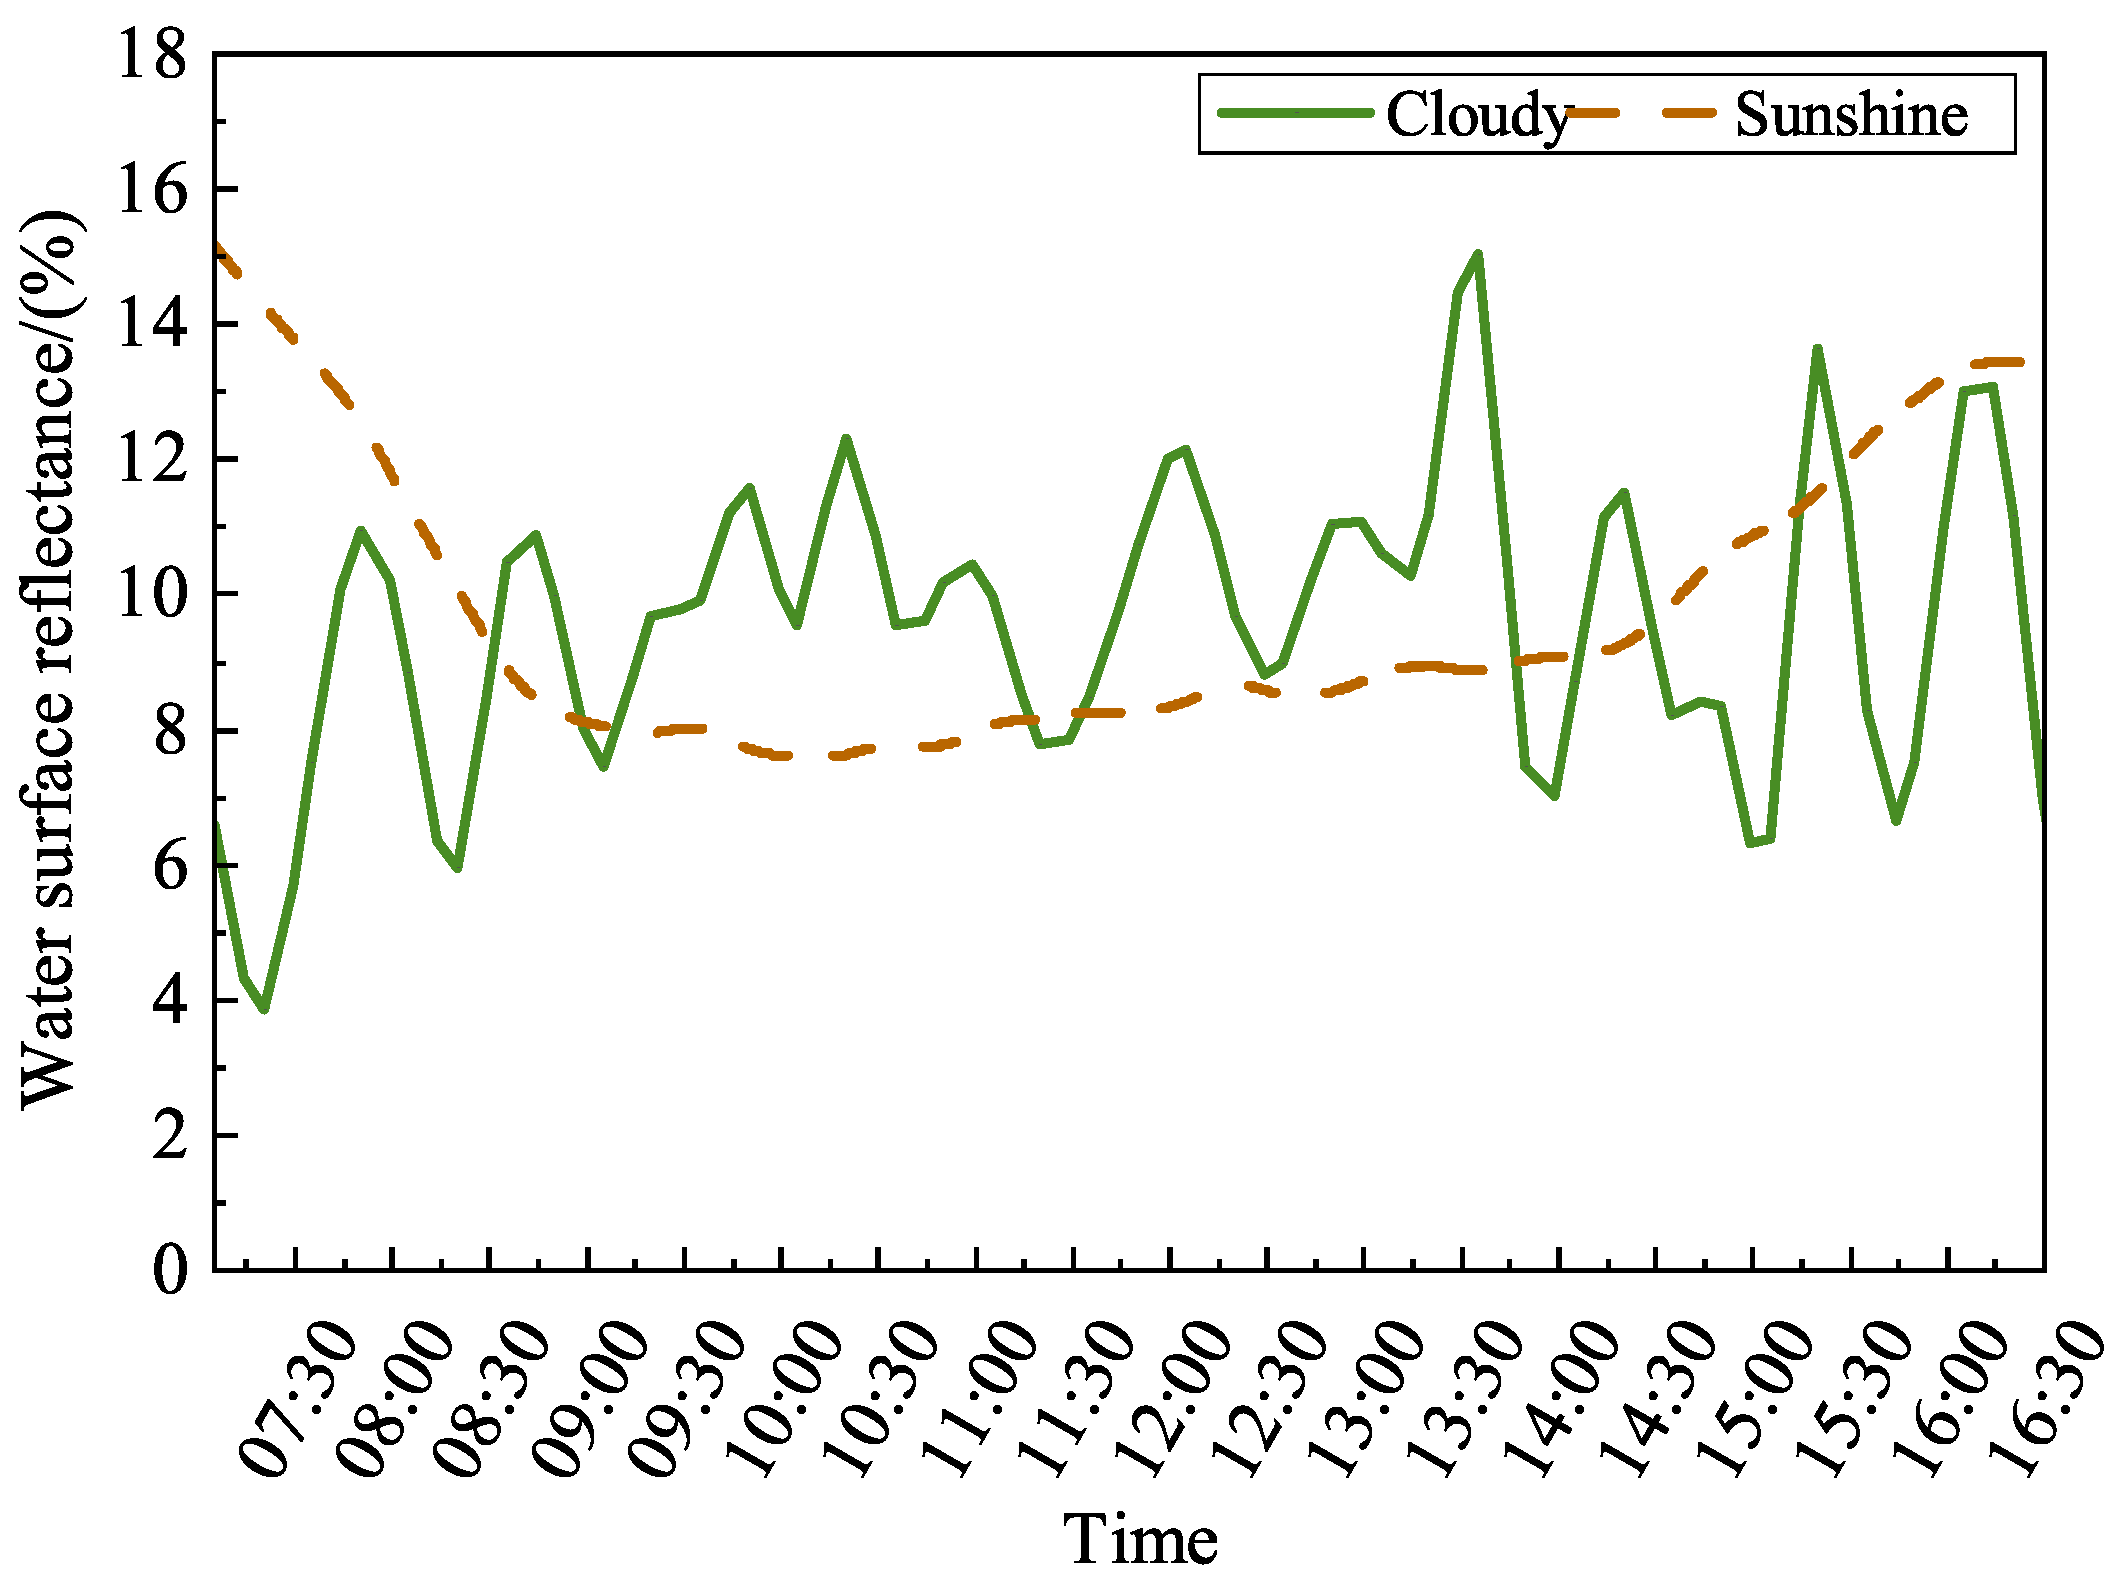
The weather has a significant effect on the water surface albedo, and the overall trend of “high in the morning and evening, low in the middle of the day” is shown in sunny days, which is due to the fact that the water surface receives reflected light mainly from the direct sun. On rainy days, the water surface albedo is higher than that on sunny days, with an average of 8% to 10% [43], as shown in Figure 4, which shows the water surface albedo curves on rainy and sunny days.

2.3. Irradiance Modeling of Waterborne Bifacial PV

Inclusive of direct radiation, sky−diffuse radiation, and water suface−reflected radiation, the total solar irradiance measured on both sides of the bifacial PV encompasses multiple components [44,45]. This water suface-reflected radiation consists of direct and sky−diffused radiation that reaches the water suface. Figure 5 shows the schematic of irradiance reception of the waterborne bifacial PV module.
The front side irradiance of the bifacial PV module is (10):
G F = G F , d + G F , s + G F , r .
Combined with the laws of solar operation, assuming that the diffused irradiance as well as the reflected irradiance are isotropic in character, the direct irradiance, diffused irradiance, as well as the reflected irradiance are calculated according to (11)–(13):
G F , d = B cos θ a sin δ
G F , s = D cos 1 + cos γ 2
G F , r = ρ Q cos 1 cos γ 2 ,
where, B, D, Q are the total irradiance, the direct irradiance, and the scattered irradiance in the horizontal surface, respectively,  Q = B + D ρ  is the water surface albedo;  δ  is the solar altitude angle;  θ a  is any moment of the sun’s incidence angle of direct light;  γ  is the module tilt angle ( 0 ° 45 ° ).
Assuming that the bifacial PV module array spacing is sufficient, the front row has no shading on the back row, and the shadow area is ignored, the backside irradiance of the bifacial PV module is (14):
G B = G B , d + G B , s + G B , r G B , s + G B , r .
It is assumed that the negligible effect of direct irradiance on the generation of electricity by the PV module and that the diffuse and reflected irradiance from the back side of the bifacial PV module are isotropic, calculated as follows (15)–(16):
G B , s = ρ Q cos 1 cos γ 2
G B , r = D 1 + cos γ 2 .
The effective irradiance  G E f f  is (17):
G E f f = G F + G B × B i F i ,
where the bifacial coefficient  B i F i  is defined as (18):
B i F i = I s c B I s c F .

3. Designing of the Controller for EMPC

3.1. The Principles of EMPC

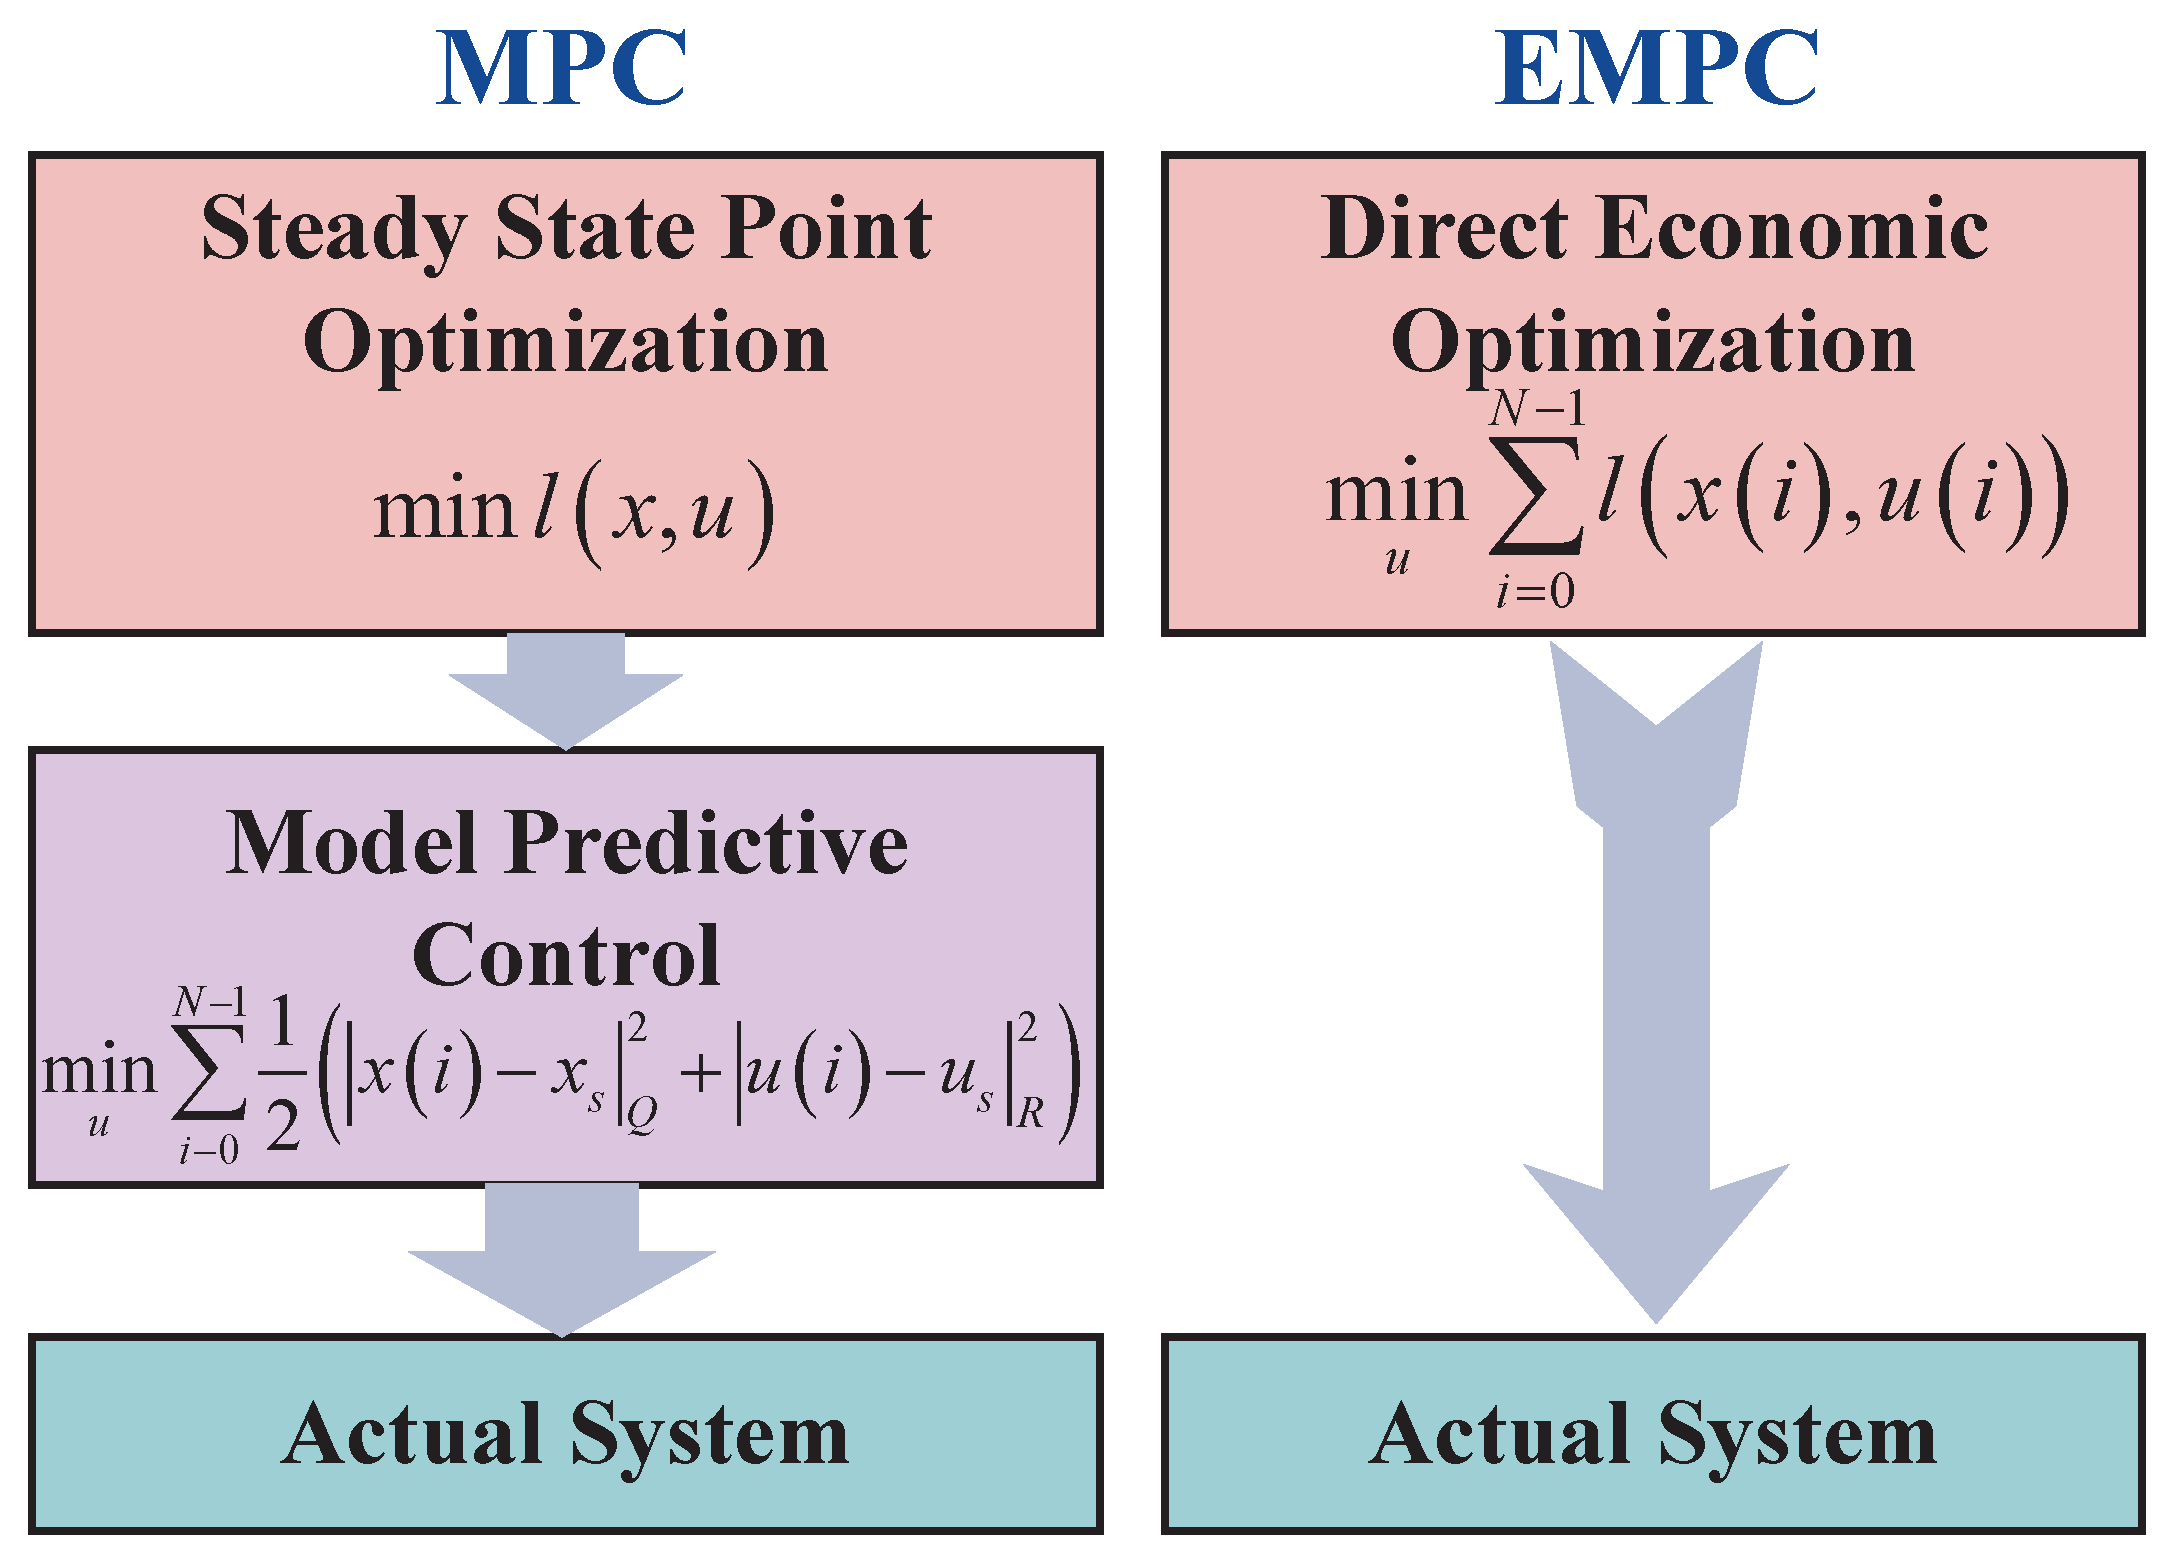
MPC usually acts as a set point tracking at the lower level, and its tracked steady state point is optimized by the upper level based on the economic indicators of the system. However, this hierarchical control strategy makes the control process delayed, and it cannot guarantee the economic efficiency and system constraints during the transient process [29]. Thus, an EMPC algorithm is proposed, which can combine the economic optimization of the system and the process control in order to realize the real−time optimization and control of the system, and improve the control performance and economic efficiency of the system. The difference between EMPC and MPC is shown in Figure 6.
In EMPC, the finite time domain objective function performance is achieved by designing the terminal constraint set, terminal cost function, and local controller. The discrete nonlinear system is defined as (19):
x k + 1 = f d x k , u k ,
where:  x X R n u U R m , n, m are the dimensions of the system state and input, respectively.
Combined with the economic indicators of the system, the objective function of the system is set as (20) after considering the economy of the system control process:
Φ x k , u k = t = k k + N 1 l x t k , u t k ,
where: N is the control time domain,  x k = x k k , x k + 1 k , , x k + N 1 k  is the system future moment state trajectory,  u k = u k k , u k + 1 k , , u k + N 1 k  is the input trajectory.
Therefore, synthesizing the operating states of the system, the optimization problem for the discrete nonlinear system (19) with terminal equation constraints for the EMPC at time is given in the following (21) and (22):
V N x k = min u k Φ x k , u k
s . t . x k + 1 k = A e q x k k + B e q u k k x k k = x k x t k , u t k R , t Z k : k + N 1 x k + N k = x
where:  x k + N k = x  is the terminal equation constraint used to drive the system to converge to the optimal steady state at the end of the prediction time domain  x .
Based on the above EMPC optimization problem, the optimal control sequence of the system is solved as follows in (23):
u ˜ k = u ˜ k k , u ˜ k + 1 k , , u ˜ k + N 1 k .
At each moment, the first control variable  u ˜ k k  of the solved optimal control sequence is selected to act on the control object, and  u ˜ k k  is expressed as the state feedback control law of the system. Then, the EMPC closed−loop system with terminal equation constraints can be expressed as (24):
x t + 1 k = f d x t k , u ˜ t k .

3.2. State-Space Modeling

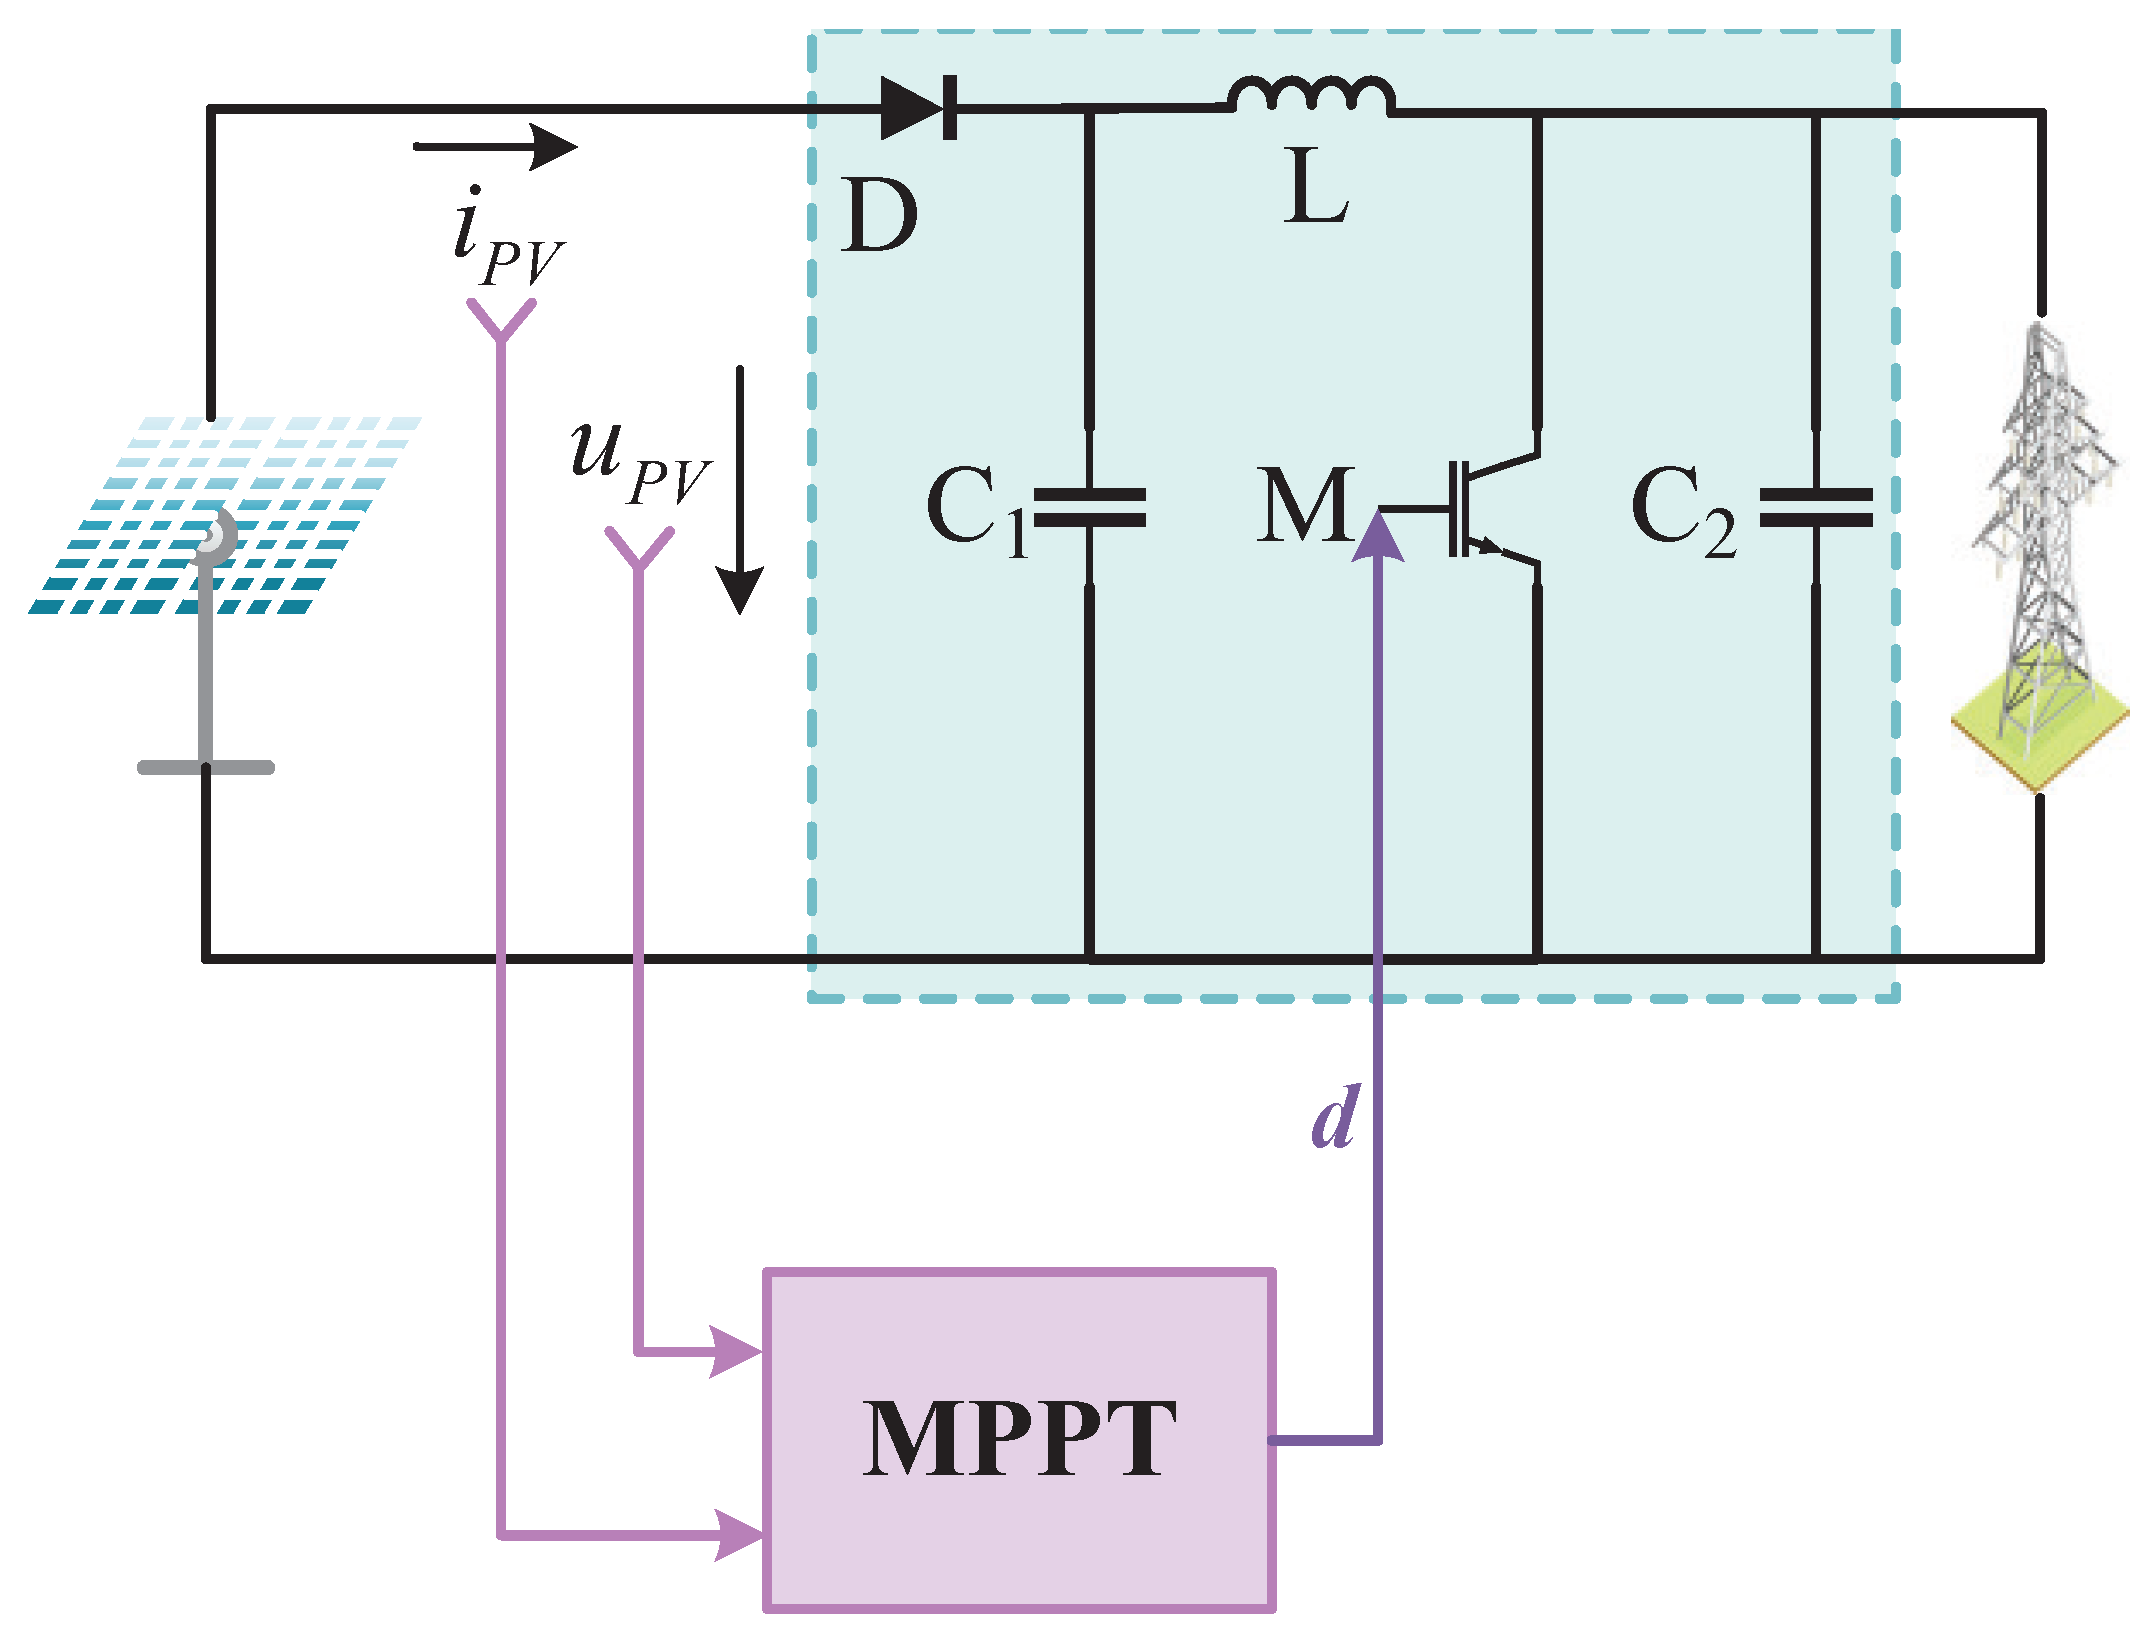
In the waterborne bifacial PV generation system, the PV array’s output features will vary with the external ambient temperature and the irradiance. In addition, the load receives maximum power when the impedance of the external load matches the internal impedance of the power supply, resulting in the achievement of maximum power output. As a result, a DC/DC converter is linked to the bifacial PV array’s output, achieving MPPT by modifying the converter’s duty cycle and thereby the converter’s external impedance, as depicted in Figure 7.
The waterborne bifacial photovoltaic power generation system studied in this paper uses a Boost converter to realize the MPPT function, and the dynamic mathematical model of the Boost circuit is shown in (25).
d i P V d t = S L u C 2 + 1 L u P V d u C 2 d t = S C 2 i P V 1 C 2 R u C 2 ,
where: S is the switching state of switch T,  S = 0  means switch M is off,  S = 1  means switch M is on.
Define the state vectors and the output vector:  x t = i P V t , u C 2 t T y t = u C 2 t .
Let  u t = u P V t ; then, the state−space equation of the waterborne bifacial PV system is (26):
X ˙ t = Ax t + B u t y t = C x 2 t ,
where:  x t = x 1 t x 2 t = i P V t u C 2 t X ˙ = d i P V d t d u C 2 d t A = 0 S L S C 1 C R B = 1 L 0 T C = 0 1 .
To simplify the model, it is assumed that the switching tube of the boost circuit operates for a time of  T s , and the boost converter operates in a continuous current state. The discretization is obtained by using the Forward Euler method (27):
i P V k + 1 u C 2 k + 1 = 1 S T s L S T s C 2 1 T s C 2 R T i P V k u C 2 k + T s L 0 u P V k .
Therefore, the output power of the waterborne bifacial PV system can be expressed as (28):
P k = x 1 k u k = i P V k u P V k .

3.3. Objective Functions and Constraints

In traditional MPC, the MPPT depends on the optimal reference value, although bifacial PV modules are different from mono-facial PV modules in that it is difficult to ensure that both sides of the PV cells reach the optimal reference value at the same time, which makes it difficult to ensure the maximum output power of the bifacial PV generation system. Hence, this work proposed that the objective of the EMPC controller is to optimize the power output of the waterborne bifacial PV power system to the greatest extent attainable, with an aim to maximize the economic advantages, thereby compensating for the drawbacks of the conventional MPC. The power generation from the bifacial photovoltaic system is directly optimized as an objective function, and its economic performance function is expressed as (29):
Φ x k , u k = t = k k + N 1 P x t k , u t k + F s ε p , ε i , ε u ,
where: k represents the current discrete moment, N represents the control time domain, and t represents the predicted future moment based on the current moment,  t Z k : k + N 1 .
Due to the safety requirements of the waterborne bifacial PV system during the control process, a series of constraints must be satisfied during the control process of the EMPC as follows (30)–(32):
0 P t P max + ε p
0 i P V i P V , max + ε i Δ i P V Δ i P V , max
0 u P V u P V , max + ε u Δ u P V Δ u P V , max ,
where:  P max  is the maximum power of the waterborne bifacial PV system,  i P V , max u P V , max  are the current and voltage at the maximum power point, respectively, and  ε p , ε i , ε u  is a slack variable used to ensure the feasibility of the EMPC optimization problem as well as to eliminate the steady state bias,  ε p 0 , ε i 0 , ε u 0 .

3.4. The Design of Controller

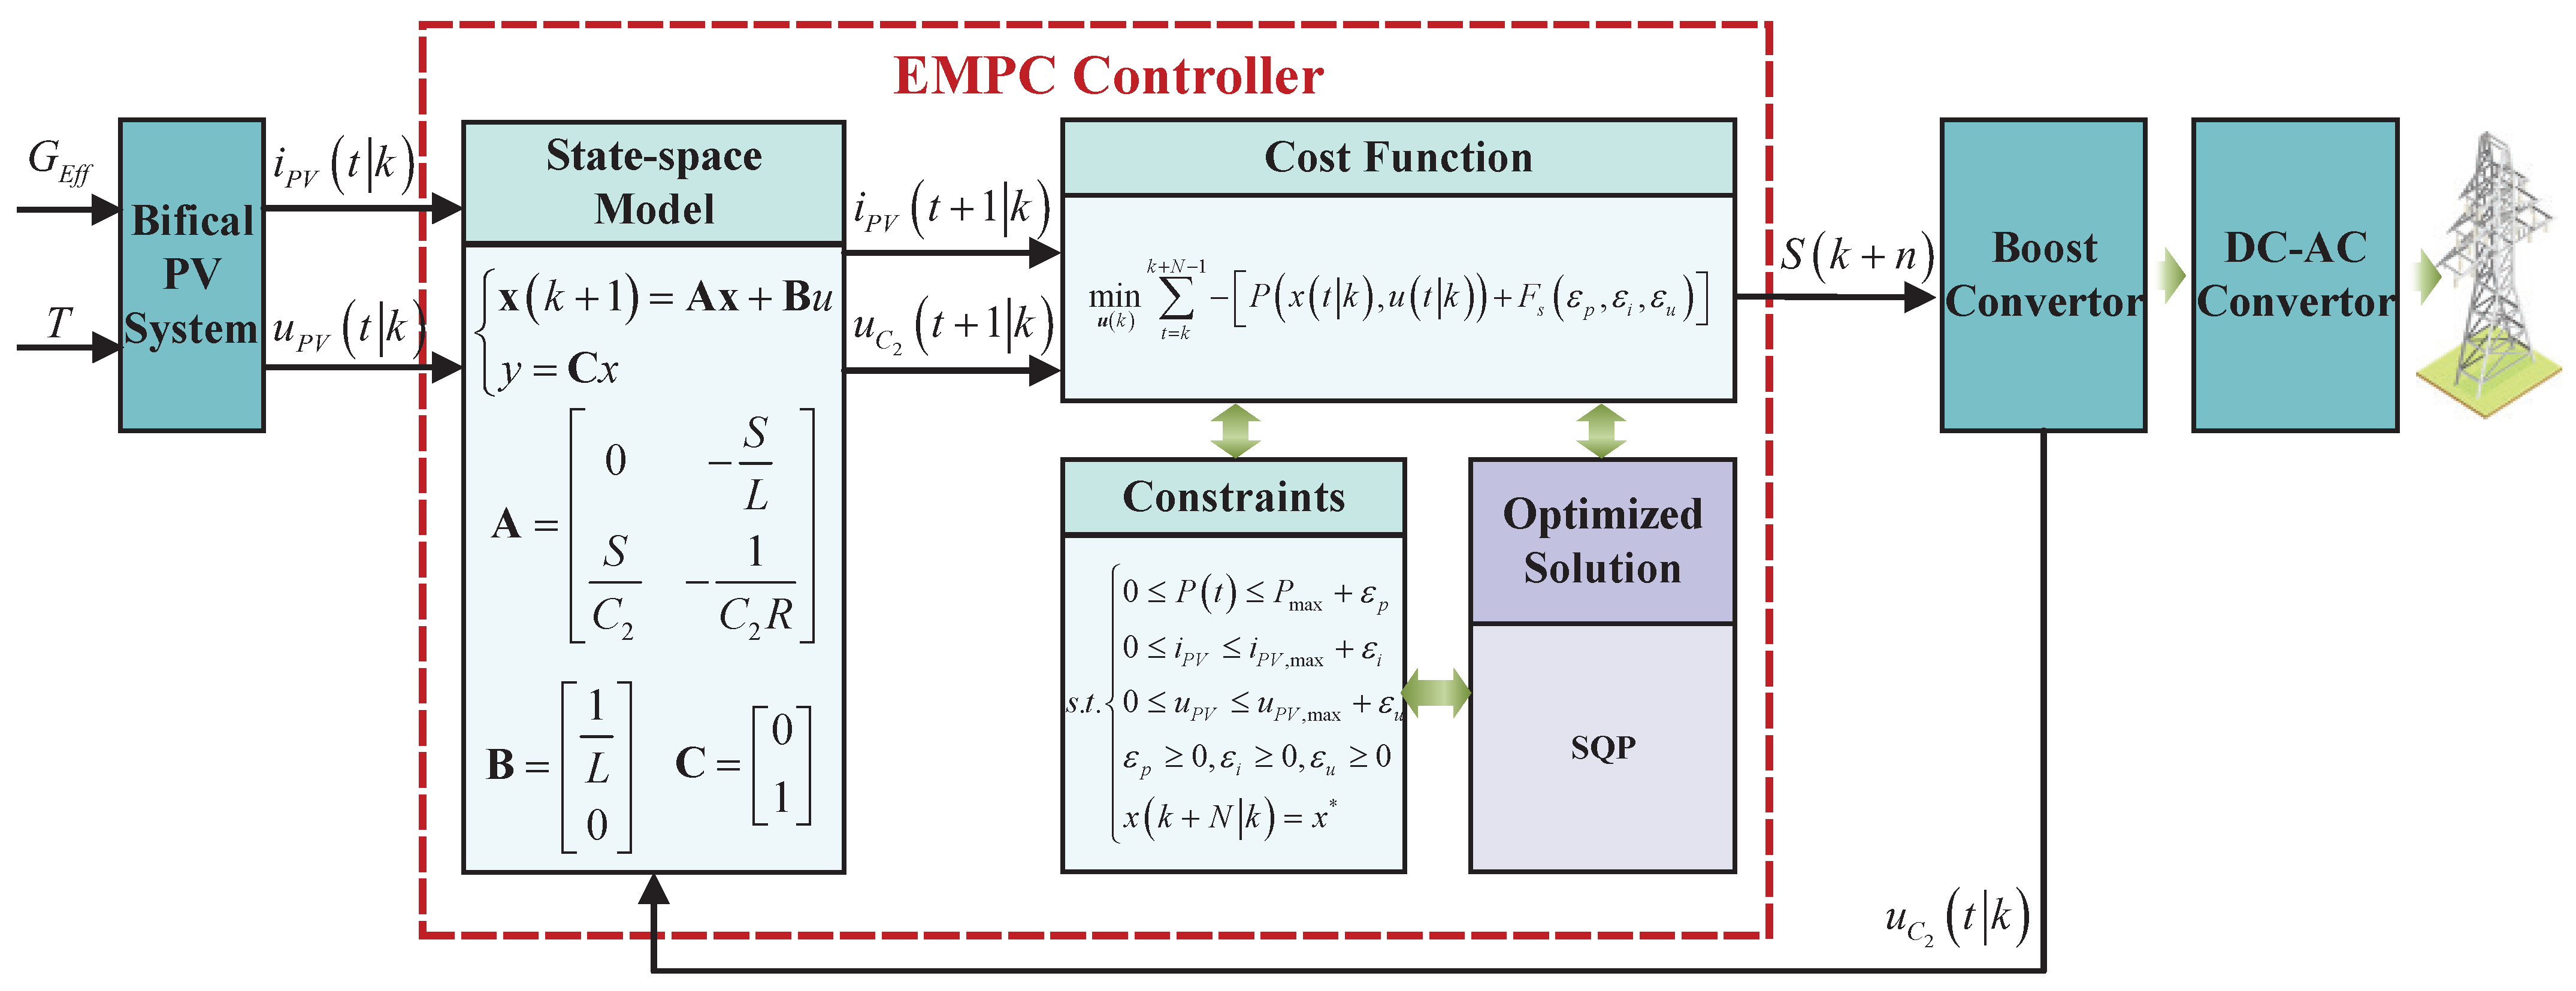
The configuration of the EMPC algorithm, which is proposed in this work to achieve MPPT, is displayed in Figure 8. Firstly, the obtained output voltage samples  u P V t k , output current samples  i P V t k , and converter terminal voltage  u C 2 t k  of the waterborne bifacial PV are directly used as inputs to the EMPC controller, and the mathematical model of the discrete−time system equations described in (27) are taken as the object of study, so as to obtain the optimal control sequence, determine the operating state of the switching tubes  S k + n , and control the switching tubes’ on/off and adjust the duty ratio to realize the MPPT through the minimization of the economic objective function.
Considering the output constraints to be satisfied by the system itself as well as the state constraints (30)–(32), the optimal control problem can be obtained by minimizing the objective function (29) as follows (33):
min Φ = t = k k + N 1 P x t k , u t k + F s ε p , ε i , ε u s . t . x t + 1 k = A e q x t k + B e q u t k x k k = x k x t k , u t k R , t Z k : k + N 1 x k + N k = x ,
where:  A e q = 1 S T s L S T s C 2 1 T s C 2 R B e q = T s L 0 F s ε p , ε i , ε u  is the penalty term of the constrained slack variable, indicating the degree of violation of its corresponding constraints, so that the predictive control optimization problem can be easier to obtain a feasible solution to improve the performance of the closed-loop, defining the slack variable penalty term as the following quadratic form (34) [38]:
F s ε p , ε i , ε u = r s ε p 2 + ε i 2 + ε u 2 .
The optimization problem (33) could be solved by the sequential quadratic programming method by employing the Sequential Quadratic Programming (SQP) solver in MATLAB (R2022a) after which the first variable of the optimal control sequence at each moment is applied to the system, and the computation is then looped back and forth to achieve rolling optimization.

3.5. Algorithmic Flow

The steps of the algorithm for EMPC are as follows:
Step1: At the current moment k, initialize the control sequence of the system according to (24), measure the current irradiance of the system, as well as the state of the system  x k ;
Step2: Solve the optimization problem (33) according to the state and constraints of the system, and obtain the current optimal control trajectory according to (23);
Step3: Input the first control quantity  u ˜ k  into the actuator of the maximum power controller of the bifacial PV generation system according to the first control quantity  u ˜ k k  of the optimal control sequence 3;
Step4: Go to the next sampling moment and restart the measurement and calculation. The algorithm flow of this paper using EMPC is shown in Figure 9.

4. Simulation Verification

4.1. Parameter Settings

The waterborne bifacial photovoltaic system is established on the MATLAB/Simulink (R2022a) platform. The designed EMPC strategy is simulated and compared with the conventional MPPT strategy in order to validate the effectiveness of the EMPC strategy method designed in this paper. Furthermore, a simulation comparison of bifacial and mono−facial PV modules under different conditions is carried out to verify the power generation advantage of the bifacial PV module. The 23rd of July in a coastal city is selected as a typical day for the study, the controller defines the sampling period as  T S  = 1 µs, and the controller optimizes the time domain length as N = 20 s. The rest of the controller parameters are shown in Table 1.

4.2. Comparison of Mono−Facial PV and Bifacial PV Outputs under a Typical Day

The power generation of PV modules is greatly affected by climatic conditions. Therefore, in this section, the effect of changes in irradiance and ambient temperature before and after on the power generation of PV modules is simulated and verified, and a comparison is made between mono−facial PV modules and bifacial PV modules.
From Figure 10, it is clear that the change in irradiance has a greater effect on the bifacial gain when the ambient temperature as well as the irradiance changes. As shown in Figure 10a, when irradiance G = 200 W/m 2 , the bifacial gain is about 81%, and when irradiance G = 1000 W/m 2 , the bifacial gain decreases to 15.2%.
As can be seen from Figure 10b, when the irradiance of the backside increases, the bifacial gain shows a continuous upward trend, but the output power of the mono−facial PV module almost does not change with the change of irradiance, which is due to the fact that the backside of the bifacial PV module can also absorb the irradiance. As can be seen from Figure 10c, when the ambient temperature increases, the power generation of both mono-facial and bifacial PV modules shows a decreasing trend, but the bifacial PV gain is almost maintained at 15% to 17%, with an insignificant increase. Henceforth, the electric power generated by bifacial PV panels surpasses that of mono−facial PV panels, particularly during gloomy or overcast climatic circumstances.

4.3. Comparison of MPPT Results under Irradiance Variation

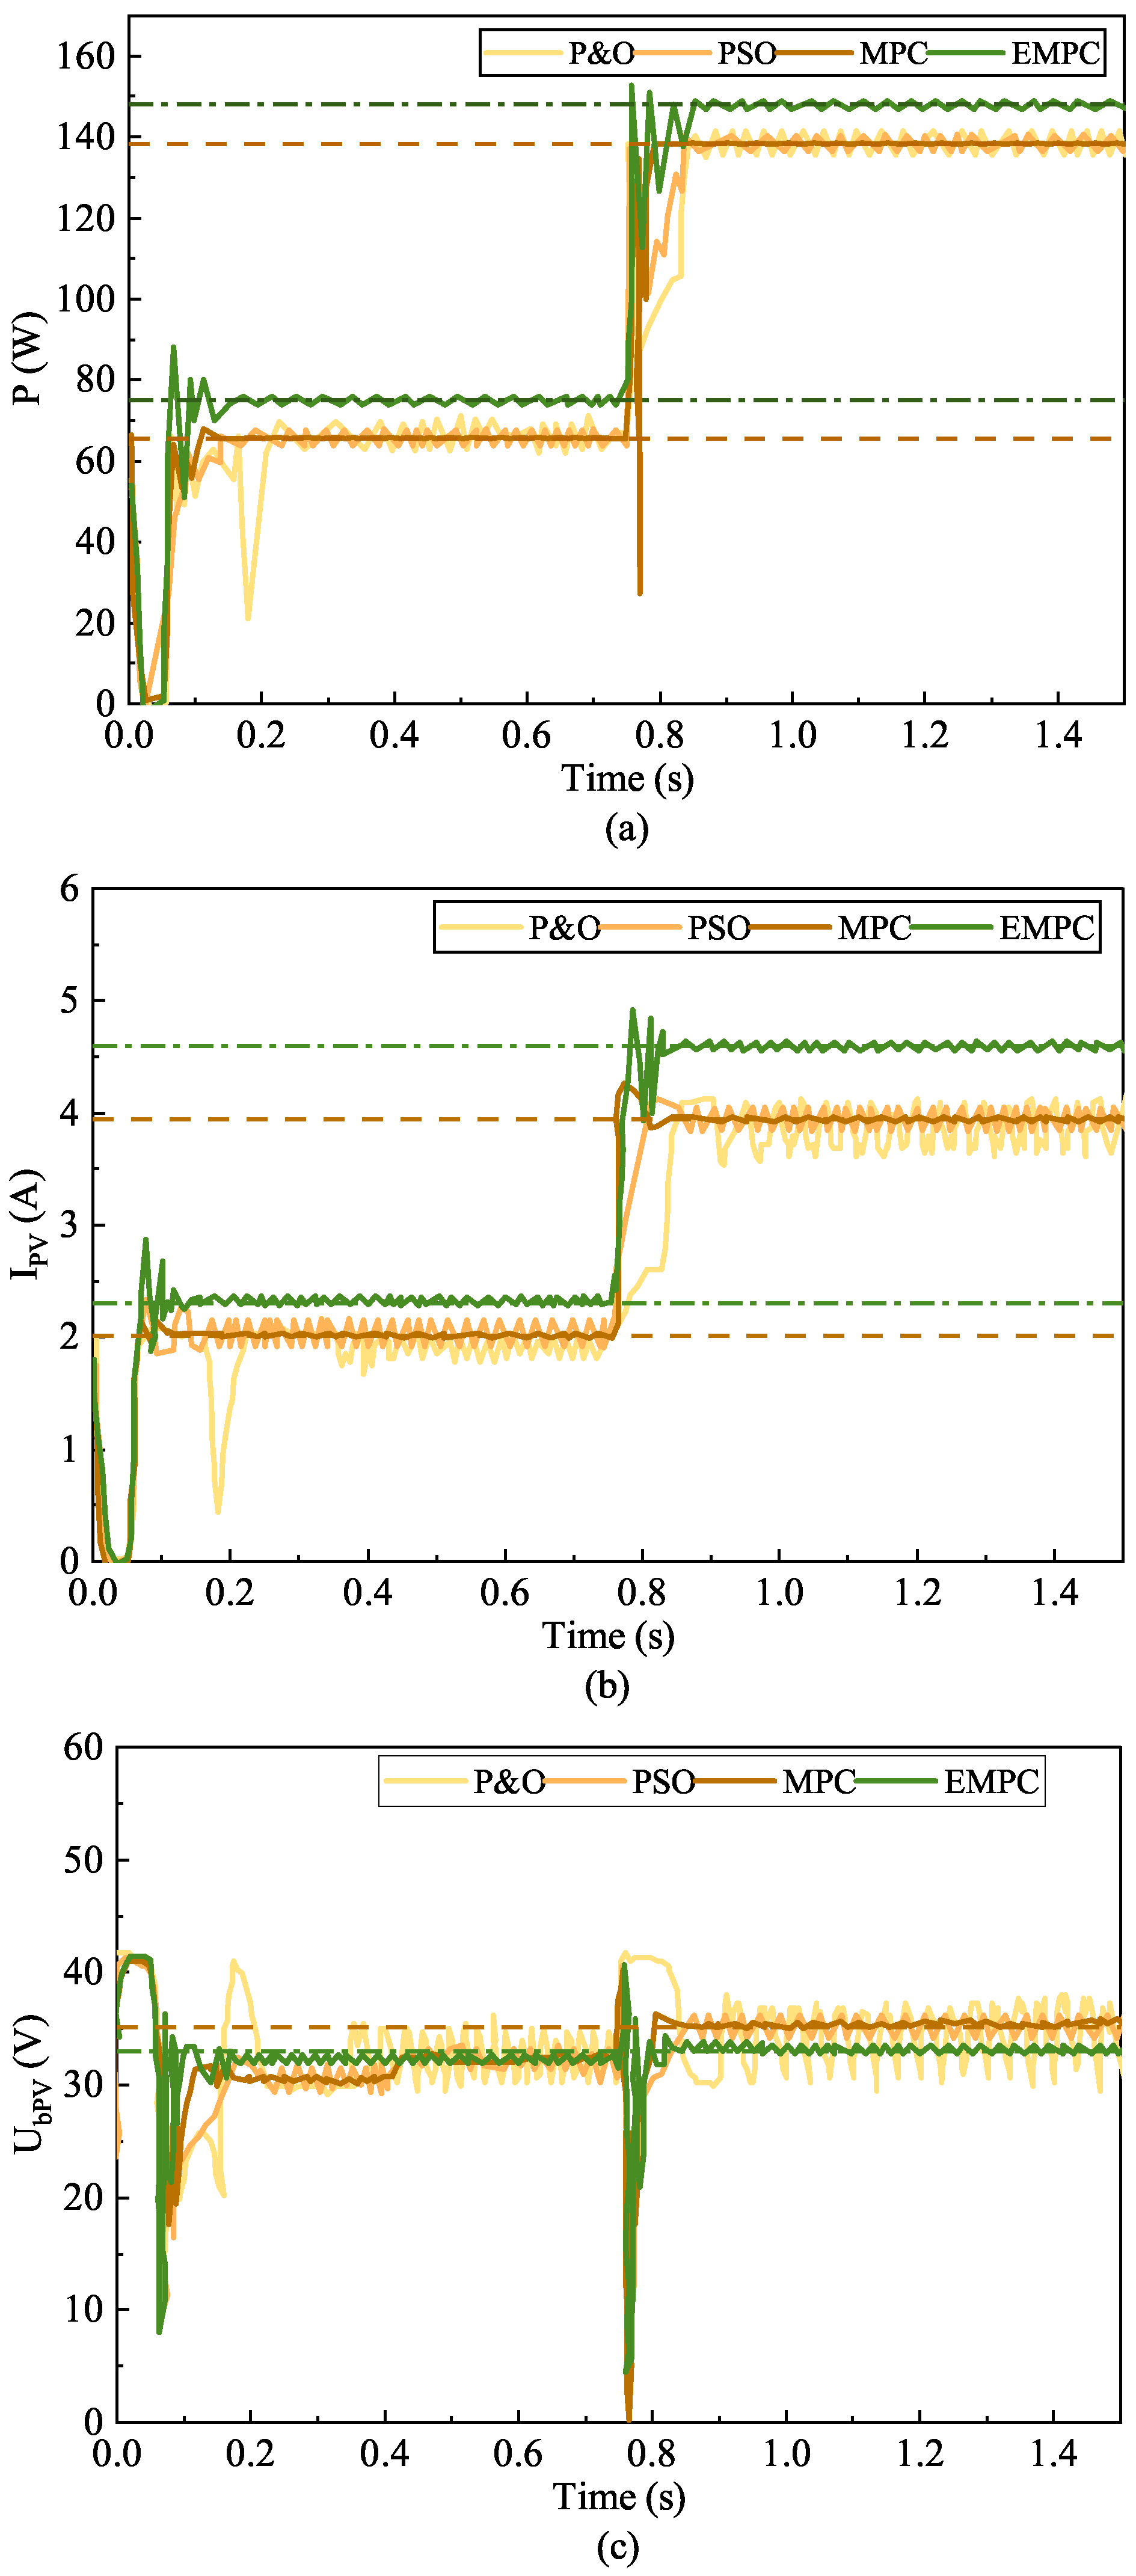
This section simulates the bifacial PV export voltage, current, and power comparison waveforms as shown in Figure 11 when the solar irradiance is stepped from the initial G = 500 W/m 2  to G = 1000 W/m 2  at the moment of time t = 0.75 s under the condition that the ambient temperature is kept at 25 °C.
Shown in Table 2 and Table 3 are the tracking averages of EMPC, MPC, PSO, and P&O strategies in the case of the irradiance step and the root mean squared error (RMSE) values, which measure the root mean square difference between the predicted value and the true value. The RMSE value of the RMSE expression is (35):
R M S E = 1 n i = 1 n y i y ^ i 2 .
From the Table 2 and Table 3, it can be seen that when the irradiance is G = 500 W/m 2 , the EMPC improves 14.05% compared to the MPC, and when the irradiance is  G = 1000  W/m 2 , the power generation tracked by the EMPC improves 6.89%, which shows that the EMPC tracks the maximum power better in the waterborne bifacial PV power generation system. In addition, from the RMSE at the maximum output power  P max , voltage  U m p p , and current  I m p p , it can be seen that compared with the traditional MPC, the EMPC tracking accuracy is higher, and the performance advantage is obvious.
As can be seen in Figure 11, the system state  x 1  and controller input u are within the constraints. When the irradiance increases, the output power of the bifacial PV increases with the irradiance, and the outlet current of the bifacial PV also increases, but the outlet voltage is less affected by the irradiance change. When the irradiance undergoes a step in t = 0.75 s, the MPC tracking strategy has the shortest tracking response time, and the EMPC shows large oscillations in the local range. However, the tracked maximum power point fits well with the actual maximum power point, while the remaining three tracking algorithms show large errors.

4.4. Comparison of MPPT Results under Temperature Variation

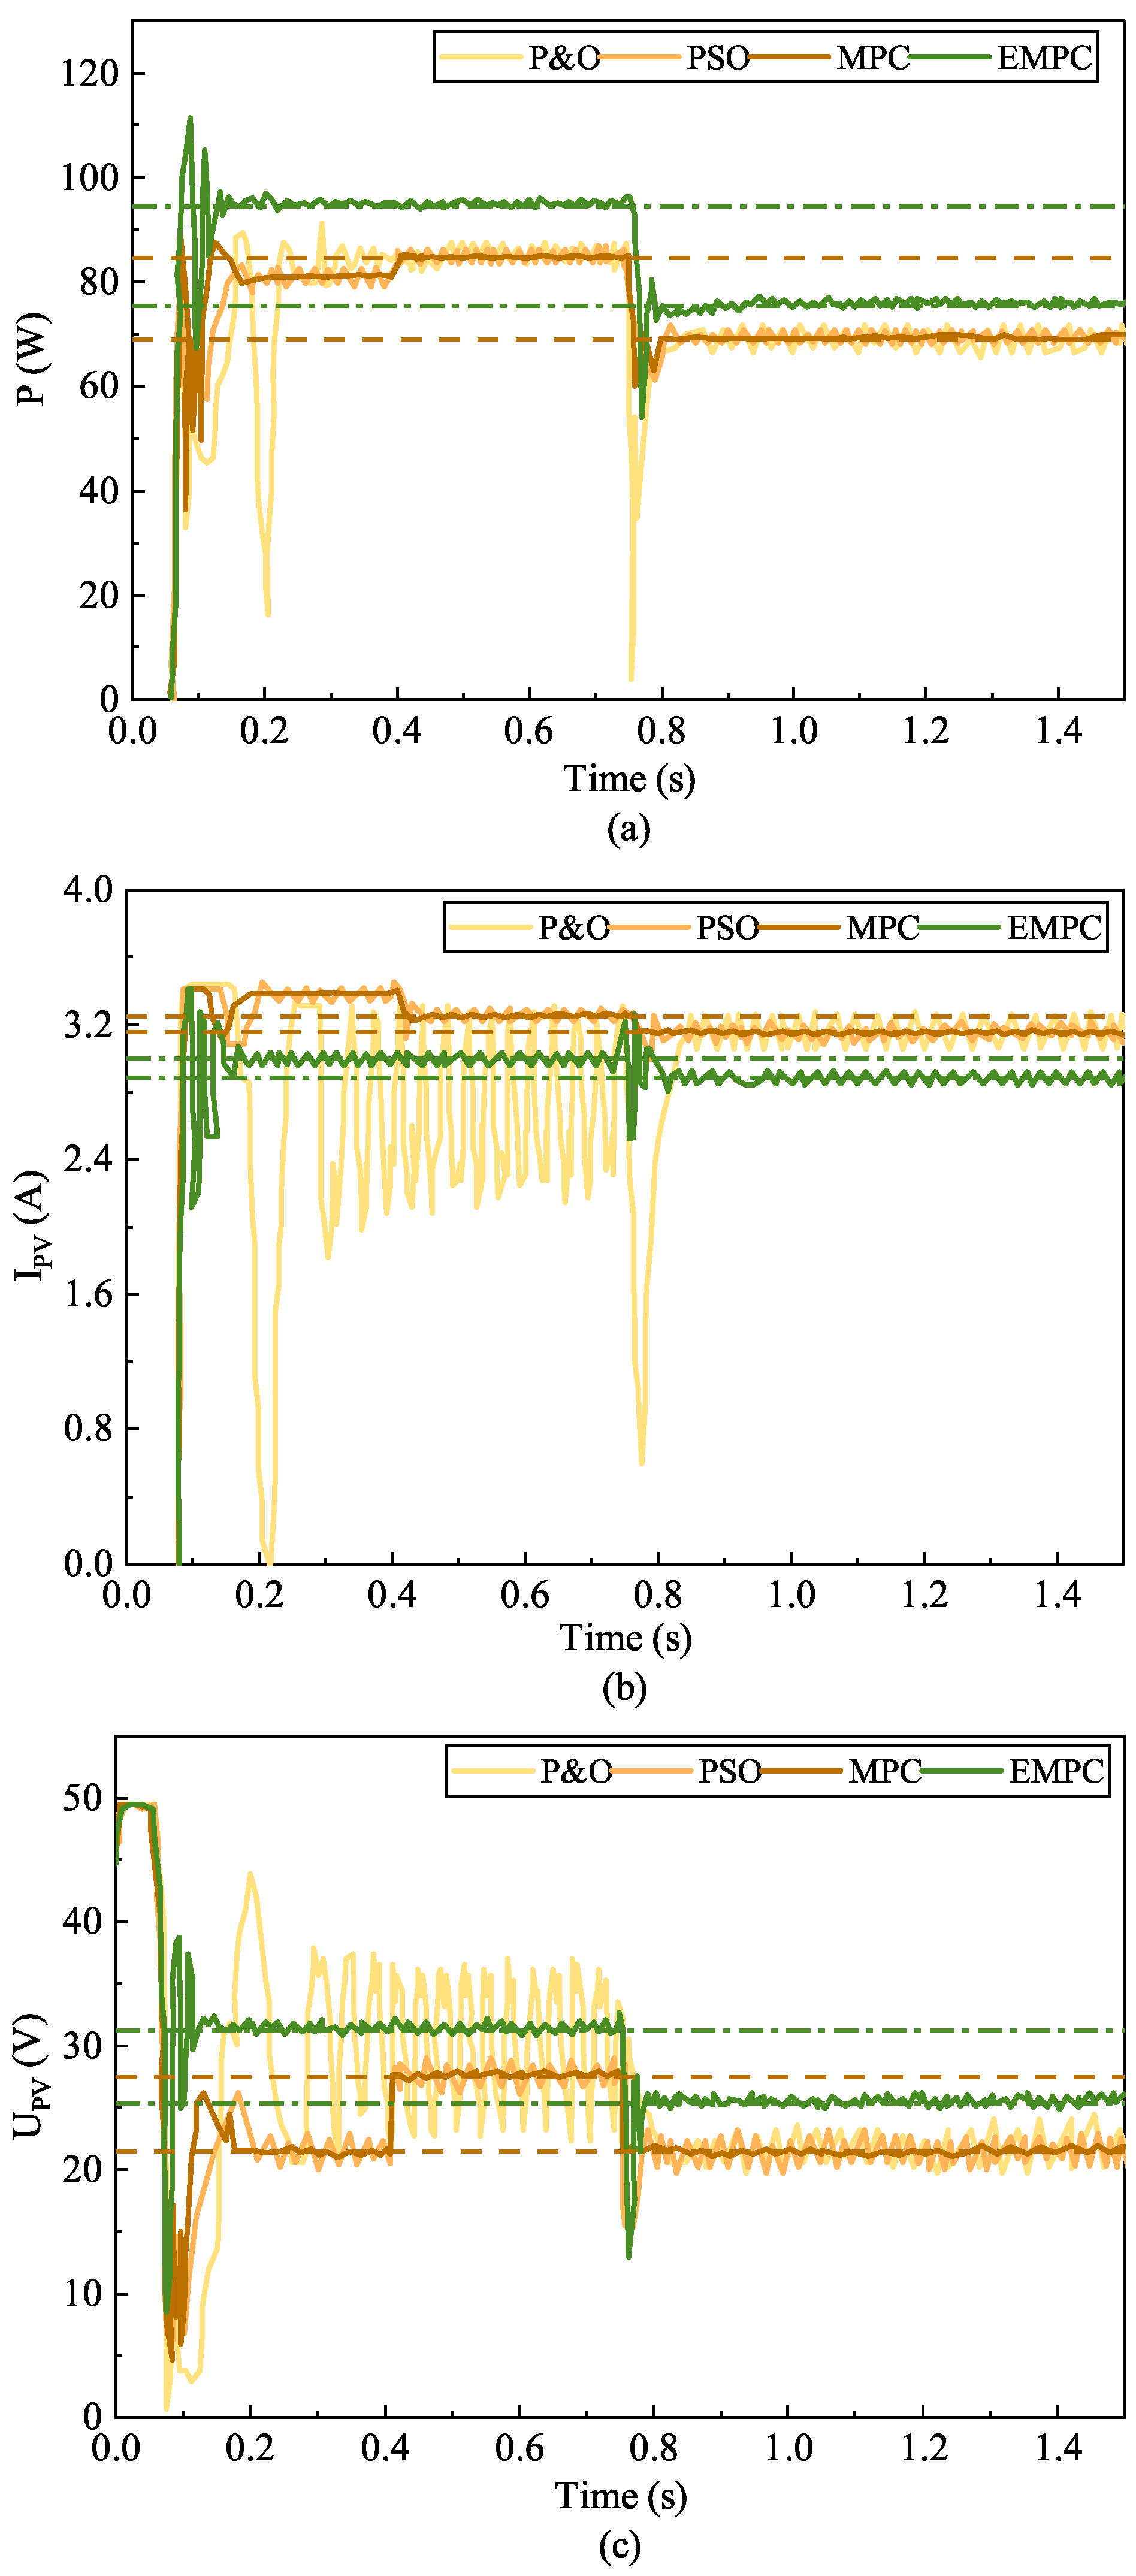
In this section, the temperature step is simulated to compare the performance of the proposed EMPC algorithm with the traditional MPC algorithm. Keeping the solar irradiance G = 600 W/m 2  constant and the ambient temperature as a step from 25 °C to 50 °C at time t = 0.75 s, the voltage, current, and power comparison waveforms of the bifacial PV outlet are shown in Figure 12.
Shown in Table 4 and Table 5 are the tracking average values as well as the RMSE values of EMPC, MPC, PSO, and P&O in the case of a temperature step. From the table, it can be seen that the EMPC improves the power generation by 14.16% compared to the MPC when the temperature is 25 °C. The EMPC tracking improves the power generation by 9.22% when the temperature is 50 °C. In addition, it can also be seen from the RMSE of the maximum output power  P max  as well as the voltage  U m p p  and current  I m p p  at the maximum power that the tracking accuracy of EMPC is also significantly improved when compared to the conventional tracking algorithms when the temperature varies.
As can be seen in Figure 12, the system state  x 1  and controller inputs u are within the constraints under a temperature variation. When the ambient temperature increases instantaneously, the export voltage, current, and power of the bifacial PV module decrease with the increase of temperature, and the tracking response time of the MPC is the shortest. The total output power of the EMPC remains the largest in the whole transient process, although there are large oscillations from the original steady state condition to the new steady state condition, as shown by the economic objective function, which is the result of direct optimal control by the EMPC controller of the economic performance indexes in the predicted time domain. This is the result of the EMPC controller’s direct optimization control of the economic performance index in the predicted time domain. The traditional P&O method causes the output current and voltage of the bifacial PV module to fluctuate greatly, and it takes a period of relatively large fluctuations to reach a steady state.

4.5. Discussion and Analysis

From the analysis of the above simulation results, we can discuss as follows:
(1) From Figure 11 and Figure 12, it could be observed that the system state and controller inputs satisfy constraints (30)–(32), but the tracking effect of EMPC has a larger fluctuation than that of MPC, which is because the objective function of traditional MPC is to track the reference value. The EMPC aims to obtain a greater economic benefit in real time, which makes the changes in the system-state variables and the input variables present a greater magnitude of change.
(2) Under stabilized external environmental conditions, such as when the irradiance G = 500 W/m 2 , the temperature is 25 °C, both EMPC and MPC algorithms are able to make the output voltage, current, and power of the solar cell quickly restored to a stable output after a short period of fluctuation.
(3) Under a changing external environment, like the irradiance jumps from the G = 500 W/m 2  step to G = 1000 W/m 2 , and the temperature jumps from the 25 °C step to 50 °C, the EMPC controller is always able to drive the system to reach the new steady-state condition when the maximum power is reached. The tracked output power is always kept at the maximum compared to the remaining three tracking algorithms. The front and rear surfaces of the bifacial photovoltaic modules are not guaranteed to reach the maximum power point at the same time. The EMPC strategy has the economic objective of capturing the maximum power generation in the system so that the maximum output power of the bifacial PV power system can always be kept at the maximum.
The proposed EMPC approach for MPPT in this work exhibits a significant benefit in the face of varying external environmental factors affecting the waterborne bifacial PV generation system.

5. Conclusions

In order to improve the power generation of waterborne bifacial PV modules, the MPPT strategy based on an EMPC is proposed. Through simulation in the MATLAB/Simulink platform, at first, the verified efficiency output features of a bifacial PV are established. Subsequently, the comparative analysis is conducted on the tracking effect of the EMPC approach, considering various influencing factors. The ensuing deductions are as follows:
(1) The EMPC controller is able to make the system reach the steady-state operating condition at maximum power under the constraints satisfied. At the same time, by comparing with mono−facial PV modules in different environmental conditions, it can be found that the power generation of the bifacial PV generation system is improved by about 15% to 30%, which makes the application of EMPC in a waterborne bifacial PV power plant more superior and more valuable.
(2) Compared with the traditional MPPT algorithm, EMPC tracks the largest output power in the whole control process with higher accuracy, and the power generation can be improved by about 6–14.5%.
(3) EMPC can effectively adapt to changes in the external environment, and can quickly adjust the control action according to the irradiance received by the bifacial PV modules and changes in the external ambient temperature, so as to achieve the economic performance of the MPPT.
Therefore, EMPC has practical significance and value in the MPPT of a waterborne bifacial PV power generation system, which can significantly improve the energy utilization and reduce the operating cost. However, because EMPC can lead to a certain degree of fluctuation in the solution process, the next step will be to improve the stability of the EMPC control process, consider the effect of wind speed on the water surface albedo, and further improve the MPPT of the waterborne bifacial PV power generation system and power generation system’s MPPT effect.

Author Contributions

Conceptualization, M.T.; data curation, J.L.; formal analysis, J.L., X.G. and B.A.; funding acquisition, M.T.; investigation, J.L., J.Q., X.G., Y.Z. and W.W.; methodology, M.T., J.L. and J.Q.; project administration, M.T.; resources, M.T., B.A. and W.W.; software, J.L.; supervision, M.T. and J.Q.; validation, J.Q. and Y.Z.; visualization, J.L. and J.Q.; writing and original draft preparation, M.T. and J.L.; writingand review and editing, M.T. and J.Q. All authors have read and agreed to the published version of the manuscript.

Funding

This research was funded by the National Natural Science Foundation of China (grant numbers 62363022, 61663021, 71763025, and 61861025); Natural Science Foundation of Gansu Province (grant number 23JRRA886); Gansu Provincial Department of Education: Industrial Support Plan Project (grant number 2023CYZC-35).

Data Availability Statement

Data are contained within the article.

Conflicts of Interest

This manuscript has not been published or presented elsewhere in part or in its entirety and is not under consideration by any other journal. We have read and understood your journal’s policies, and we believe that neither the manuscript nor the study violates any of these. The authors declare no conflicts of interest.

Abbreviations

The following abbreviations are used in this manuscript:
PVphotovoltaic
MPPTmaximum power point tracking
EMPCeconomic model predictive control
MPCmodel predictive control
P&Operturbation observation algorithm
INCincremental conductance algorithm
PSOparticle swarm optimization

References

  1. Poongavanam, P.; Chand, A.A.; Tai, V.B.; Gupta, Y.M.; Kuppusamy, M.; Dhanraj, J.A.; Velmurugan, K.; Rajagopal, R.; Ramachandran, T.; Prasad, K.A.; et al. Annual Thermal Management of the Photovoltaic Module to Enhance Electrical Power and Efficiency Using Heat Batteries. Energies 2023, 16, 4049. [Google Scholar] [CrossRef]
  2. Chaitanya, B.; Akhter, Z.M.; Ramachandran, T.; Al-Marzouqi, A.H.; Omar, F.K. Trends in Solar Powered Water Desalination Using Hydrogels: A Short Review. In Proceedings of the 2023 Advances in Science and Engineering Technology International Conferences (ASET), Dubai, United Arab Emirates, 20–23 February 2023. [Google Scholar]
  3. Ramachandran, T.; Mourad, A.I.; Hamed, F. A Review on Solar Energy Utilization and Projects: Development in and around the UAE. Energies 2022, 15, 3754. [Google Scholar]
  4. Ali, A.; Almutairi, K.; Malik, M.Z.; Irshad, K.; Tirth, V.; Algarni, S.; Zahir, M.H.; Islam, S.; Shafiullah, M.; Shukla, N.K. Review of online and soft computing maximum power point tracking techniques under non-uniform solar irradiation conditions. Energies 2020, 13, 3256. [Google Scholar] [CrossRef]
  5. Ghenai, C.; Ahmad, F.F.; Rejeb, O.; Hamid, A.-K. Sensitivity analysis of design parameters and power gain correlations of bifacial solar PV system using response surface methodology. Sol. Energy 2021, 223, 44–53. [Google Scholar] [CrossRef]
  6. Wang, Z. Photovoltaic ‘Leader’ Program: A new attempt for policy support. Energy 2015, 8, 56–58. [Google Scholar] [CrossRef]
  7. Yan, Z. Research on Bifacial Photovoltaic Modeling and Fault Signal Transmission Strategy. Master’s Thesis, China University of Mining and Technology, Beijing, China, 2022. [Google Scholar]
  8. Hasan, A.; Dincer, I. A new performance assessment methodology of bifacial photovoltaic solar panels for offshore applications. Energy Convers. Manag. 2020, 220, 112972. [Google Scholar] [CrossRef]
  9. Appelbaum, J. Bifacial photovoltaic panels field. Renew. Energy 2016, 85, 338–343. [Google Scholar] [CrossRef]
  10. Gu, W.; Ma, T.; Li, M.; Lu, S.; Zhang, Y. A coupled optical-electrical-thermal model of the bifacial photovoltaic module. Appl. Energy 2020, 258, 114075. [Google Scholar] [CrossRef]
  11. Tina, G.M.; Scavo, F.B.; Merlo, L.; Bizzarri, F. Comparative analysis of monofacial and bifacial photovoltaic modules for floating power plants. Appl. Energy 2021, 281, 116084. [Google Scholar] [CrossRef]
  12. Elmehdi, M.; Micheli, L.; Almonacid, F.M.; Fernández, E.F. Overview of the fundamentals and applications of bifacial photovoltaic technology: Agrivoltaics and aquavoltaics. Energies 2022, 15, 8777. [Google Scholar]
  13. Wang, S.; Wilkie, O.; Lam, J.; Steeman, R.; Zhang, W.; Khoo, K.S.; Siong, S.C.; Rostan, H. Bifacial photovoltaic systems energy yield modelling. Energy Procedia 2015, 77, 428–433. [Google Scholar] [CrossRef]
  14. Li, L.; Yang, T.; Yuan, Y.; Cai, Z. Maximum power point tracking algorithm for photovoltaic power generation system based on improved finite set model predictive control. Power Syst. Prot. Control 2021, 49, 28–37. [Google Scholar]
  15. Mazen, A.-S.; Mohamed Th, E.-M.; Mahmoud, E.-G. An efficient tracking of MPP in PV systems using a newly-formulated P&O-MPPT method under varying irradiation levels. J. Electr. Eng. Technol. 2021, 15, 501–513. [Google Scholar]
  16. Sheng, S.; Chen, Y. Maximum power point tracking strategy of variable step size incremental conductance method based on power prediction. Power Syst. Prot. Control 2017, 45, 42–48. [Google Scholar]
  17. Chen, J.; Zhang, W.; Li, X. Photovoltaic MPPT control based on improved conductance increment method. Smart Power 2021, 49, 47–55. [Google Scholar]
  18. Koad, R.B.; Zobaa, A.F.; El-Shahat, A. A novel MPPT algorithm based on particle swarm optimization for photovoltaic systems. IEEE Trans. Sustain. Energy 2016, 8, 468–476. [Google Scholar] [CrossRef]
  19. Li, H.; Yang, D.; Su, W.; Lü, J.; Yu, X. An overall distribution particle swarm optimization MPPT algorithm for photovoltaic system under partial shading. IEEE Trans. Ind. Electron. 2018, 66, 265–275. [Google Scholar] [CrossRef]
  20. Sundareswaran, K.; Palani, S. Application of a combined particle swarm optimization and perturb and observe method for MPPT in PV systems under partial shading conditions. Renew. Energy 2015, 75, 308–317. [Google Scholar] [CrossRef]
  21. Shi, P.; Du, Y.; Liu, S.; Cui, L. Analysis of photovoltaic maximum power point tracking strategy based on improved particle swarm optimization. Electron. Technol. 2023, 52, 78–80. [Google Scholar]
  22. Ali, M.; Shayan, E.; Padmanaban, S.; Mitolo, M.; Holm-Nielsen, J.B. Two fast metaheuristic-based MPPT techniques for partially shaded photovoltaic system. Int. J. Electr. Power Energy Syst. 2022, 137, 107567. [Google Scholar]
  23. Shang, L.; Li, F. Photovoltaic maximum power point tracking based on adaptive cuckoo search and disturbance observation. Power Syst. Prot. Control 2022, 50, 99–107. [Google Scholar]
  24. Wu, L.; Zhang, X.; Liu, Q.; Fan, C. MPPT control algorithm for photovoltaic power generation based on multi-universe optimization algorithm. J. Sol. Energy 2023, 44, 204–211. [Google Scholar]
  25. Wang, R.; Gao, H.; Zhang, X. Photovoltaic MPPT algorithm based on GA-GRU neural network. J. Sol. Energy 2023, 44, 212–219. [Google Scholar]
  26. Eltamaly, A.M. A novel musical chairs algorithm applied for MPPT of PV systems. Renew. Sustain. Energy Rev. 2021, 146, 111135. [Google Scholar] [CrossRef]
  27. Shang, L.; Guo, H.; Zhu, W. An improved MPPT control strategy based on incremental conductance algorithm. Prot. Control. Mod. Power Syst. 2020, 5, 14. [Google Scholar] [CrossRef]
  28. Lashab, A.; Sera, D.; Guerrero, J.M. A dual-discrete model predictive control-based MPPT for PV systems. IEEE Trans. Power Electron. 2019, 34, 9686–9697. [Google Scholar] [CrossRef]
  29. Cui, J.; Liu, X.; Chai, T. Approximate scenario-based economic model predictive control with application to wind energy conversion system. IEEE Trans. Ind. Inform. 2022, 19, 5821–5829. [Google Scholar] [CrossRef]
  30. Sajadian, S.; Ahmadi, R.; Zargarzadeh, H. Extremum seeking-based model predictive MPPT for grid-tied Z-source inverter for photovoltaic systems. IEEE J. Emerg. Sel. Top. Power Electron. 2018, 7, 216–227. [Google Scholar] [CrossRef]
  31. Metry, M.; Shadmand, M.B.; Balog, R.S.; Abu-Rub, H. MPPT of photovoltaic systems using sensorless current-based model predictive control. IEEE Trans. Ind. Appl. 2016, 53, 1157–1167. [Google Scholar] [CrossRef]
  32. Wang, Q.; He, D.; Ping, H. Constrained nonlinear systems input to state stable economic model predictive control. Control Decis. 2022, 37, 1137–1144. [Google Scholar]
  33. Rodríguez, D.I.H.; Myrzik, J.M.A. Economic model predictive control for optimal operation of home microgrid with photovoltaic-combined heat and power storage systems. IFAC-Pap. OnLine 2017, 50, 10027–10032. [Google Scholar] [CrossRef]
  34. Köhler, P.N.; Müller, M.A.; Allgöwer, F. Approximate dissipativity of cost-Interconnected systems in distributed economic MPC. IEEE Trans. Autom. Control 2022, 68, 2170–2182. [Google Scholar] [CrossRef]
  35. Li, T.; Liu, H.; Wang, H.; Yao, Y. Hierarchical predictive control-based economic energy management for fuel cell hybrid construction vehicles. Energy 2020, 198, 117327. [Google Scholar] [CrossRef]
  36. Liu, X.; Cui, J. Fuzzy economic model predictive control for thermal power plant. IET Control Theory Appl. 2019, 13, 1113–1120. [Google Scholar] [CrossRef]
  37. Yang, Y.; Zou, Y.; Li, S. Economic model predictive control of enhanced operation performance for industrial hierarchical systems. IEEE Trans. Ind. Electron. 2021, 69, 6080–6089. [Google Scholar] [CrossRef]
  38. Jia, Y.; Meng, K.; Dong, L.; Liu, T.; Sun, C.; Dong, Z.Y. Economic model predictive control of a point absorber wave energy converter. IEEE Trans. Sustain. Energy 2020, 12, 578–586. [Google Scholar] [CrossRef]
  39. Albalawi, F.; Durand, H.; Christofides, P.D. Distributed economic model predictive control with Safeness-Index based constraints for nonlinear systems. Syst. Control Lett. 2017, 110, 21–28. [Google Scholar] [CrossRef]
  40. Kong, X.; Ma, L.; Liu, X.; Abdelbaky, M.A.; Wu, Q. Wind turbine control using nonlinear economic model predictive control over all operating regions. Energies 2020, 13, 184. [Google Scholar] [CrossRef]
  41. Angeli, D.; Casavola, A.; Tedesco, F. Theoretical advances on economic model predictive control with time-varying costs. Annu. Rev. Control 2016, 41, 218–224. [Google Scholar] [CrossRef]
  42. Worku, M.Y.; Hassan, M.; Hassan, M.; Shafiullah, M.; Elkadeem, M.R.; Hossain, M.I.; Abido, M.A. A comprehensive review of recent maximum power point tracking techniques for photovoltaic systems under partial shading. Sustainability 2023, 15, 11132. [Google Scholar] [CrossRef]
  43. Lu, W.; Tian, J. Water surface reflection characteristics and power generation of bifacial PV modules. IOP Conf. Ser. Earth Environ. Sci. 2020, 601, 012047. [Google Scholar] [CrossRef]
  44. Zhang, Z.; Wang, L.; Qin, Z.; Zhan, Z.; Wang, L.; Qin, Z.; Wu, M.; Xu, C.; Quan, P. Theoretical and experimental research on the factors affecting the power generation performance of bifacial photovoltaic modules. J. Sol. Energy 2022, 43, 171. [Google Scholar]
  45. Liao, D.; Huang, Z.; Fang, X. Study on irradiance model of bifacial PV modules. J. Sol. Energy 2021, 42, 471. [Google Scholar]
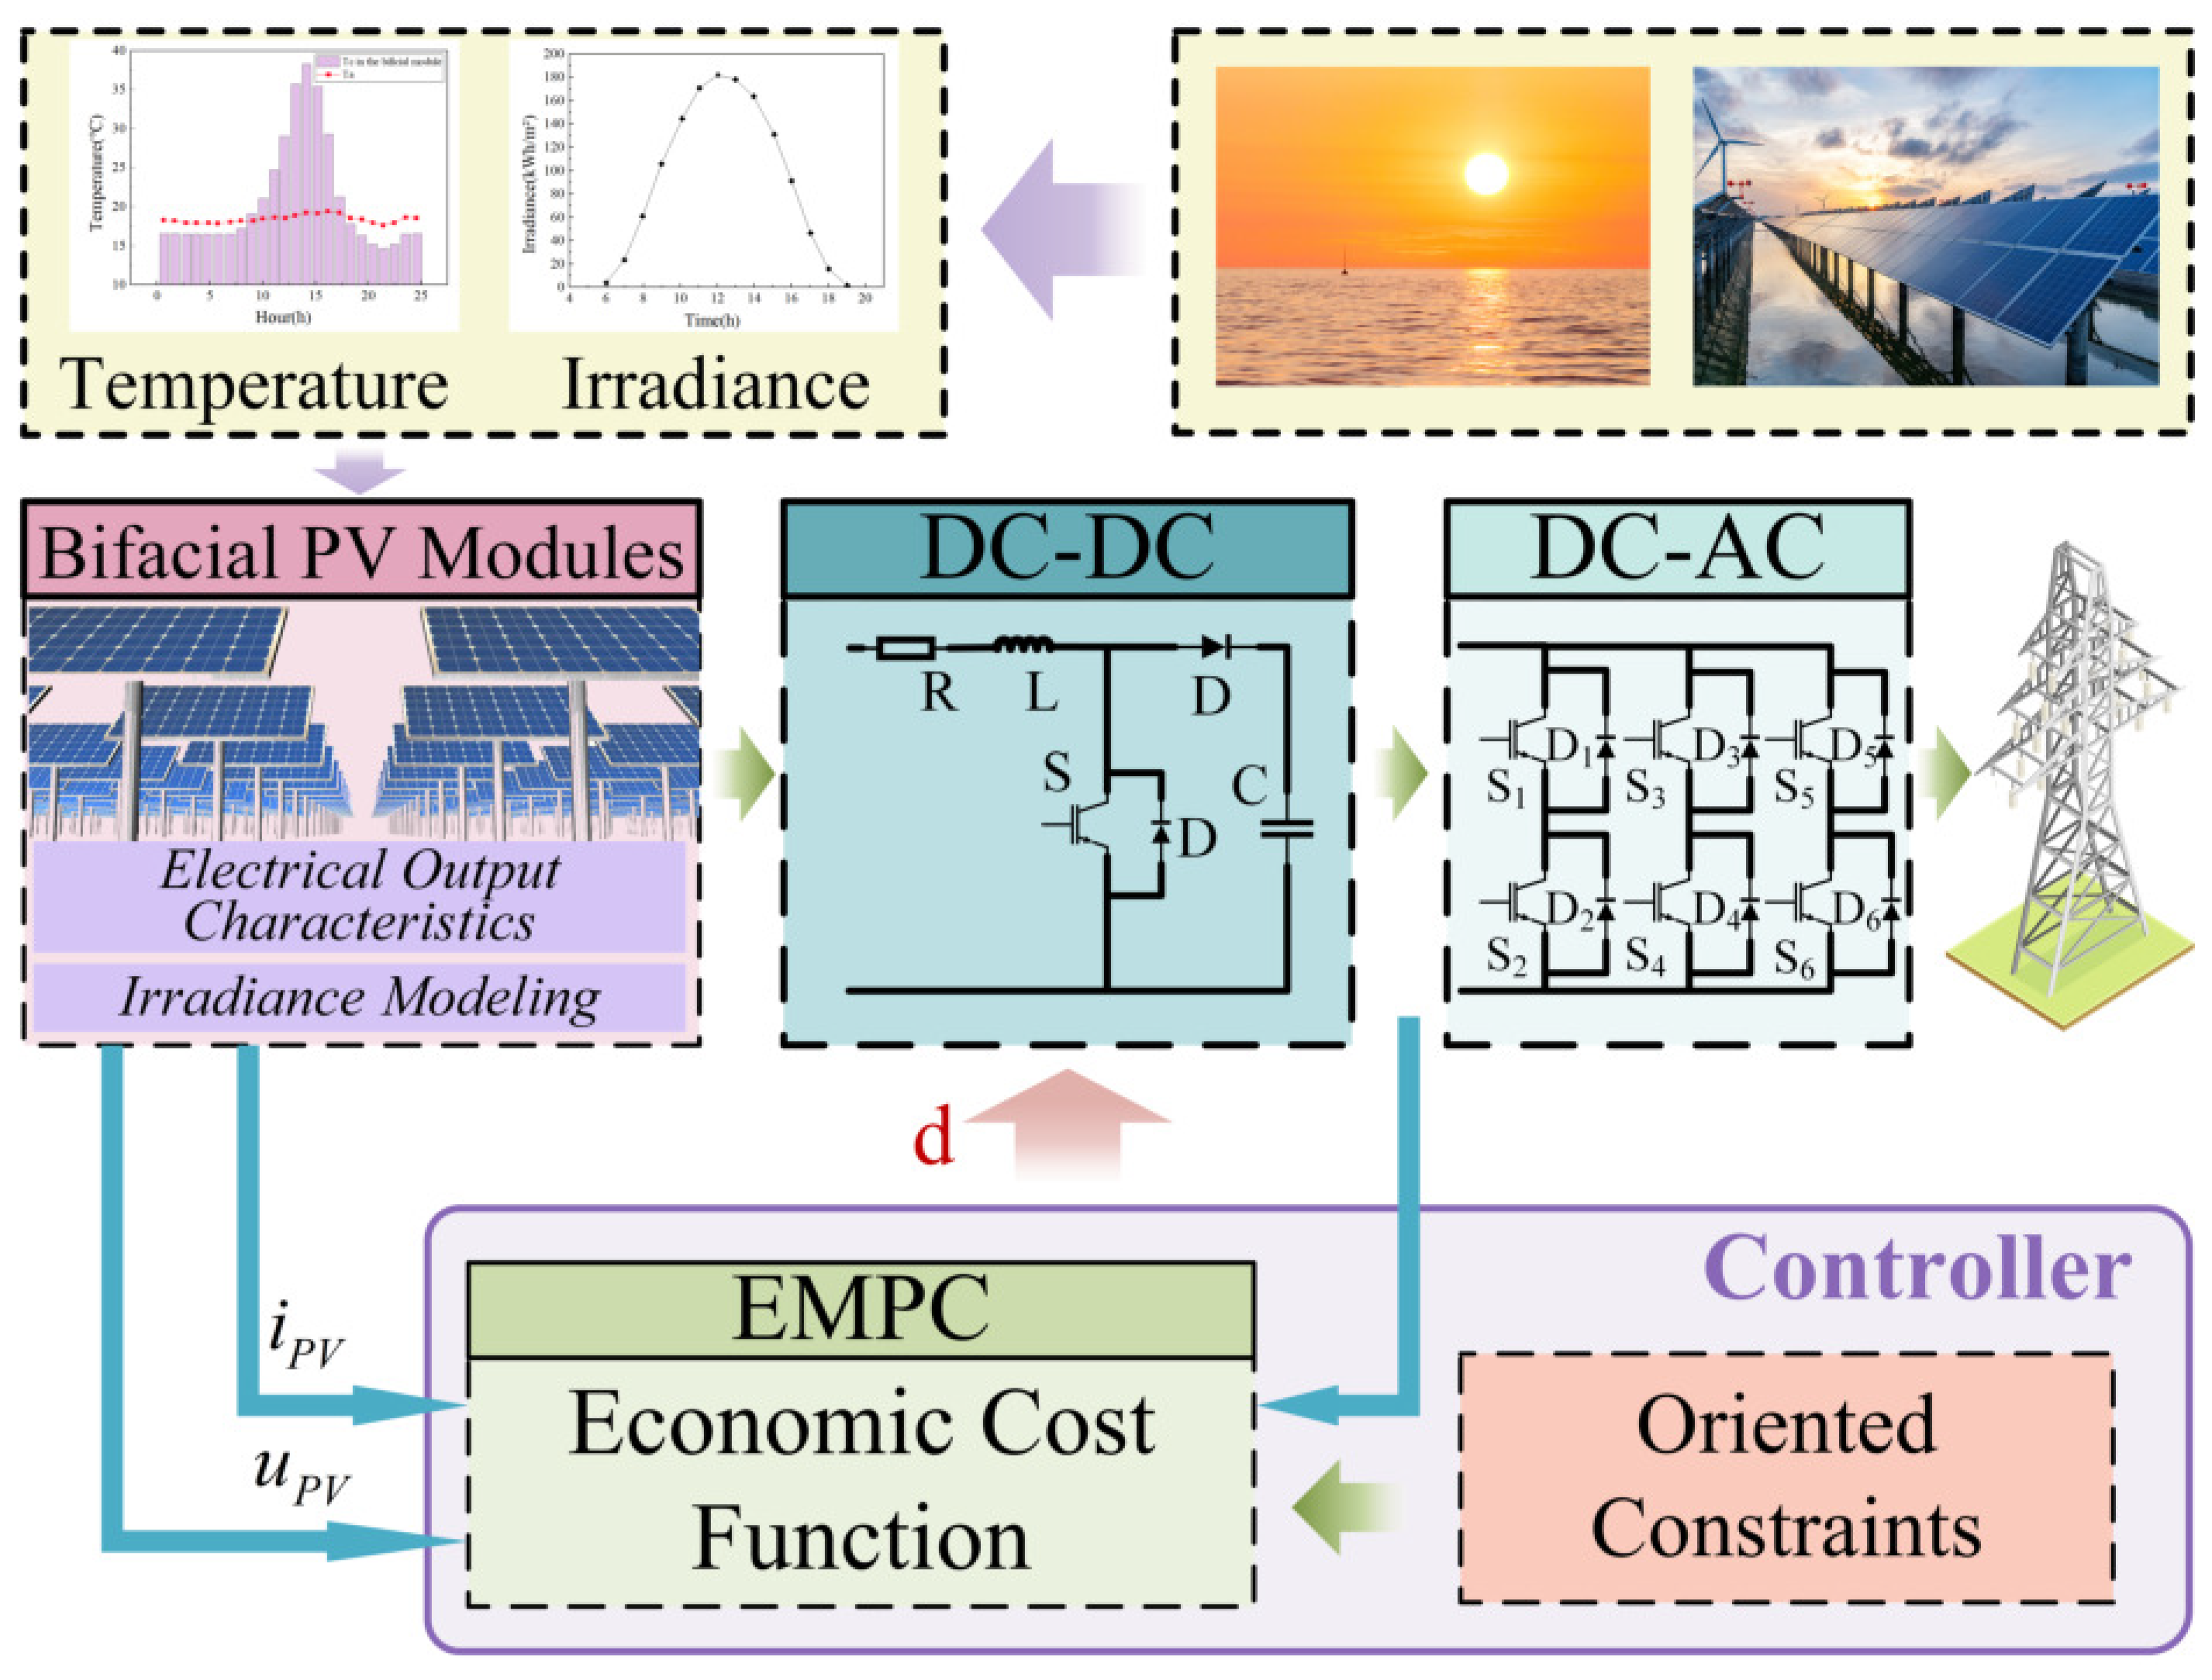
Figure 1. The schematic diagram of the bifacial photovoltaics (PV)generation system.
Energies 17 00152 g001
Figure 2. The equivalent circuit model of the PV cell.
Energies 17 00152 g002
Figure 3. The relationship between the the solar altitude angle and the water surface albedo.
Energies 17 00152 g003
Figure 4. The water surface albedo curves for rainy and sunny days.
Energies 17 00152 g004
Figure 5. Schematic of the irradiance reception of the waterborne bifacial PV module.
Energies 17 00152 g005
Figure 6. Diagram of the difference between EMPC and MPC.
Energies 17 00152 g006
Figure 7. Schematic illustration of maximum power point tracking (MPPT) for the waterborne bifacial PV generation system.
Energies 17 00152 g007
Figure 8. The diagram of the economic model predictive control (EMPC) structure.
Energies 17 00152 g008
Figure 9. The flow chart of the EMPC algorithm.
Energies 17 00152 g009
Figure 10. Factors impacting the power generation performance of photovoltaic modules: (a) front irradiance, (b) rear irradiance, (c) ambient temperature.
Energies 17 00152 g010
Figure 11. Dynamic response waveforms of waterborne bifacial PV under varying solar irradiance: (a) output power, (b) output current, (c) output voltage.
Energies 17 00152 g011
Figure 12. Dynamic response waveforms of waterborne bifacial PV under varying ambient temperature: (a) output power, (b) output current, (c) output voltage.
Energies 17 00152 g012
Table 1. Simulation parameters.
ParametersValue
Bifacial photovoltaics (PV) terminal capacitance  C a / μ F 100
Bifacial PV end inductance  L / mH 20
Boost circuit resistance  r L / Ω 20
Boost circuit capacitance  C b / μ F 100
Open-circuit voltage  U o c / V 37.5
Short-circuit current  I s c / A 4.95
Bifacial coefficient  F F / % 79.43
r s 1 × 10 8
Switching frequencies  / KHz 20
Water surface albedo  ρ / % 7
Table 2. Error analysis of multiple tracking algorithms for an ambient temperature of 25 °C and irradiance of G = 500 W/m 2 .
ParametersReference ValuePerturbation Observation (P&O)Particle Swarm Optimization (PSO)Model Predictive Control (MPC)Economic Model Predictive Control (EMPC)
P max / V 75.02666.62366.03965.70274.934
RMSE8.9149.6099.3672.036
U m p p / V 31.56332.25833.48233.44732.253
RMSE0.7552.3952.0220.141
I m p p / A 2.3771.9911.9792.0112.323
RMSE0.4420.4150.4110.075
Table 3. Error analysis of multiple tracking algorithms for an ambient temperature of 25 °C and irradiance of G = 1000 W/m 2 .
ParametersReference ValueP&OPSOMPCEMPC
P max / V 148.252138.249137.573138.447147.985
RMSE10.85611.0239.8452.194
U m p p / V 31.73235.35034.80435.80132.18
RMSE3.6293.3754.1400.469
I m p p / A 4.6723.8623.9313.9404.598
RMSE0.8320.7470.7330.106
Table 4. Error analysis of multiple tracking algorithms for irradiance G = 600 W/m 2  and an ambient temperature of 25 °C.
ParametersReference ValueP&OPSOMPCEMPC
P max / V 96.78584.59883.51483.53695.068
RMSE12.42113.47013.3611.834
U m p p / V 31.75430.22325.36424.92531.497
RMSE4.8777.0877.5090.521
I m p p / A 3.0482.5333.2863.3092.995
RMSE0.8080.2560.2690.066
Table 5. Error analysis of multiple tracking algorithms for irradiance G = 600 W/m 2  and an ambient temperature of 50 °C.
ParametersReference ValueP&OPSOMPCEMPC
P max / V 76.65869.02669.49769.38175.781
RMSE7.9507.2587.2831.202
U m p p / V 25.71721.70721.42621.48725.551
RMSE4.2964.4484.2390.430
I m p p / A 2.9803.1573.1543.1522.883
RMSE0.2030.1790.1730.105
Disclaimer/Publisher’s Note: The statements, opinions and data contained in all publications are solely those of the individual author(s) and contributor(s) and not of MDPI and/or the editor(s). MDPI and/or the editor(s) disclaim responsibility for any injury to people or property resulting from any ideas, methods, instructions or products referred to in the content.