Article

Ammonia Airship Cooling: An Option for Renewable Cooling in the Tropics

by
Julian David Hunt
1,2,*,
Behnam Zakeri
2,
Andreas Nascimento
3,
Fei Guo
2,
Marcos Aurélio Vasconcelos de Freitas
4,
Cristiano Vitorino Silva
5 and
Bas van Ruijven
2
1
Climate and Livability Initiative, King Abdullah University of Science and Technology, Thuwal 23955-6900, Saudi Arabia
2
International Institute for Applied Systems Analysis, A-2361 Laxenburg, Austria
3
Energy Group, Mechanical Engineering Institute, Federal University of Itajuba, Itajubá 37500-903, Brazil
4
Energy Planning Program, Federal University of Rio de Janeiro, Rio de Janeiro 21941-901, Brazil
5
Department of Engineering and Computer Science, Regional Integrated University of Upper Uruguay and Missions, Erechim 99700-000, Brazil
*
Author to whom correspondence should be addressed.
Energies 2024, 17(1), 111; https://doi.org/10.3390/en17010111
Submission received: 27 October 2023 / Revised: 3 December 2023 / Accepted: 21 December 2023 / Published: 24 December 2023
(This article belongs to the Section L: Energy Sources)

Abstract

:
The world is warming, and the demand for cooling is increasing. Developing a future green hydrogen economy will also increase the demand for cooling for hydrogen liquefaction. This increase in cooling demand will happen mainly in tropical and developing countries due to their increase in population, improvements in quality of life, and the export of their renewable potential with liquid hydrogen. To solve this increase in demand for cooling, this paper proposes the use of ammonia airship cooling (AAC). AAC extracts cold from the tropopause (−80 °C) with airships and ammonia refrigeration cycles. The liquid ammonia is then transported back to the surface to provide low temperature cooling services (−33 °C). This cooling service is particularly interesting for lowering the electricity consumption in hydrogen liquefaction plants. If all the technological challenges mentioned in the paper are addressed, it is estimated that the cost of cooling with the technology is 8.25 USD/MWht and that AAC could reduce the electricity demand for hydrogen liquefaction by 30%. AAC is an innovative renewable cooling technology that has the potential to complement other renewable energy sources in a sustainable future.

1. Introduction

There is a global shift towards transforming the energy sector to reduce CO2 emissions and combat climate change [1]. The primary focus is expanding the adoption of renewable energy sources [2], enhancing energy efficiency [3,4], electrifying transportation [5] and heating systems [6,7], and implementing energy storage solutions [8]. A crucial sustainable option in this transition is the development of the hydrogen economy, which plays a significant role in decarbonizing transportation, heating, and energy storage [9]. Recent events such as the COVID epidemic and the crisis in Ukraine have sparked increased interest among European and Western countries to invest in hydrogen as a viable alternative to fossil fuels [10]. By diversifying future energy providers, hydrogen also addresses geopolitical concerns [11]. Moreover, hydrogen offers the advantage of being a flexible power source that can utilize existing natural gas infrastructure, making it an appealing replacement for natural gas [12].
Due to hydrogen’s low volumetric energy density, it is necessary to liquefy it for long-distance transportation. However, the liquefaction process consumes a significant amount of energy. Existing hydrogen liquefaction reactors typically require around 13 kWh of power per kilogram of hydrogen, which accounts for approximately 30% of the energy content in hydrogen gas [13]. The theoretical minimum energy requirement for hydrogen liquefaction (from 298 K to 20 K at 1 bar) is 3.7 kWh of electricity per kilogram of hydrogen, corresponding to 9.3% of the energy content in hydrogen [13]. Exciting developments in magnetic refrigeration techniques can reduce energy consumption to 6 kWh of electricity per kilogram of hydrogen, achieving Carnot cycle efficiencies of 50% [14]. One possible design for a magnetic refrigeration system for hydrogen liquefaction is the active magnetic regenerator (AMR) system. This system typically utilizes a packed bed of particles cycling through a series of magnetic fields to generate the cooling effect. The AMR system has demonstrated impressive cooling power and efficiency, making it a promising method for hydrogen liquefaction [15]. Significant gains in efficiency can also be achieved through scaling up the liquefaction process. For instance, increasing the hydrogen liquefaction capacity from 100 to 1000 tons per day can reduce liquefaction costs from 2 to 1 USD/kg of hydrogen [13].
The use of hydrogen in airships and balloons has historically been associated with risks, as demonstrated by the Hindenburg disaster in 1937 [16]. This catastrophic event played a significant role in the discontinuation of hydrogen airships [17]. The majority of recorded incidents involving hydrogen airships, around 90%, have been related to fire, often resulting in fatalities [18]. While helium could be an alternative gas for buoyancy, its high cost limits its viability, particularly when compared to the cheaper and more abundant hydrogen [19,20,21]. Additionally, helium is predominantly produced as a by-product of the oil and gas industry. As the industry is being phased out, the availability of helium is expected to decline further, making it an even scarcer resource [22,23]. A few airships used a thin, airtight aluminum metal envelope instead of the usual plastic fabric envelope and were named metal-clad airships [24,25]. For example, the ZMC-2 flew 752 flights in 1929 and was scrapped in 1941 [26]. They were discontinued due to their fragility. The system proposed in this paper could be considered a hybrid fabric envelope with hydrogen, and the ammonia tubes can be regarded as a metal-clad airship filled with ammonia.
Ammonia has been widely used as a refrigerant gas and has been proposed for district cooling [27]. However, this paper is the first to propose a new method that uses airships and ammonia refrigeration cycles to extract cold from the tropopause, where temperatures can reach as low as −88 °C at 0.1 bar. The liquid ammonia is then transported to the surface and utilized to provide cooling services at low temperatures, reaching as low as −33 °C. This cooling service significantly reduces the electricity consumption of hydrogen liquefaction plants. This is the first time in the literature that harnessing the cold temperatures of the tropopause is proposed. This paper is divided into five sections. The methods used in this paper are presented in Section 2. The results are presented in Section 3. The outcomes of this investigation are discussed in Section 4. The paper is concluded in Section 5.

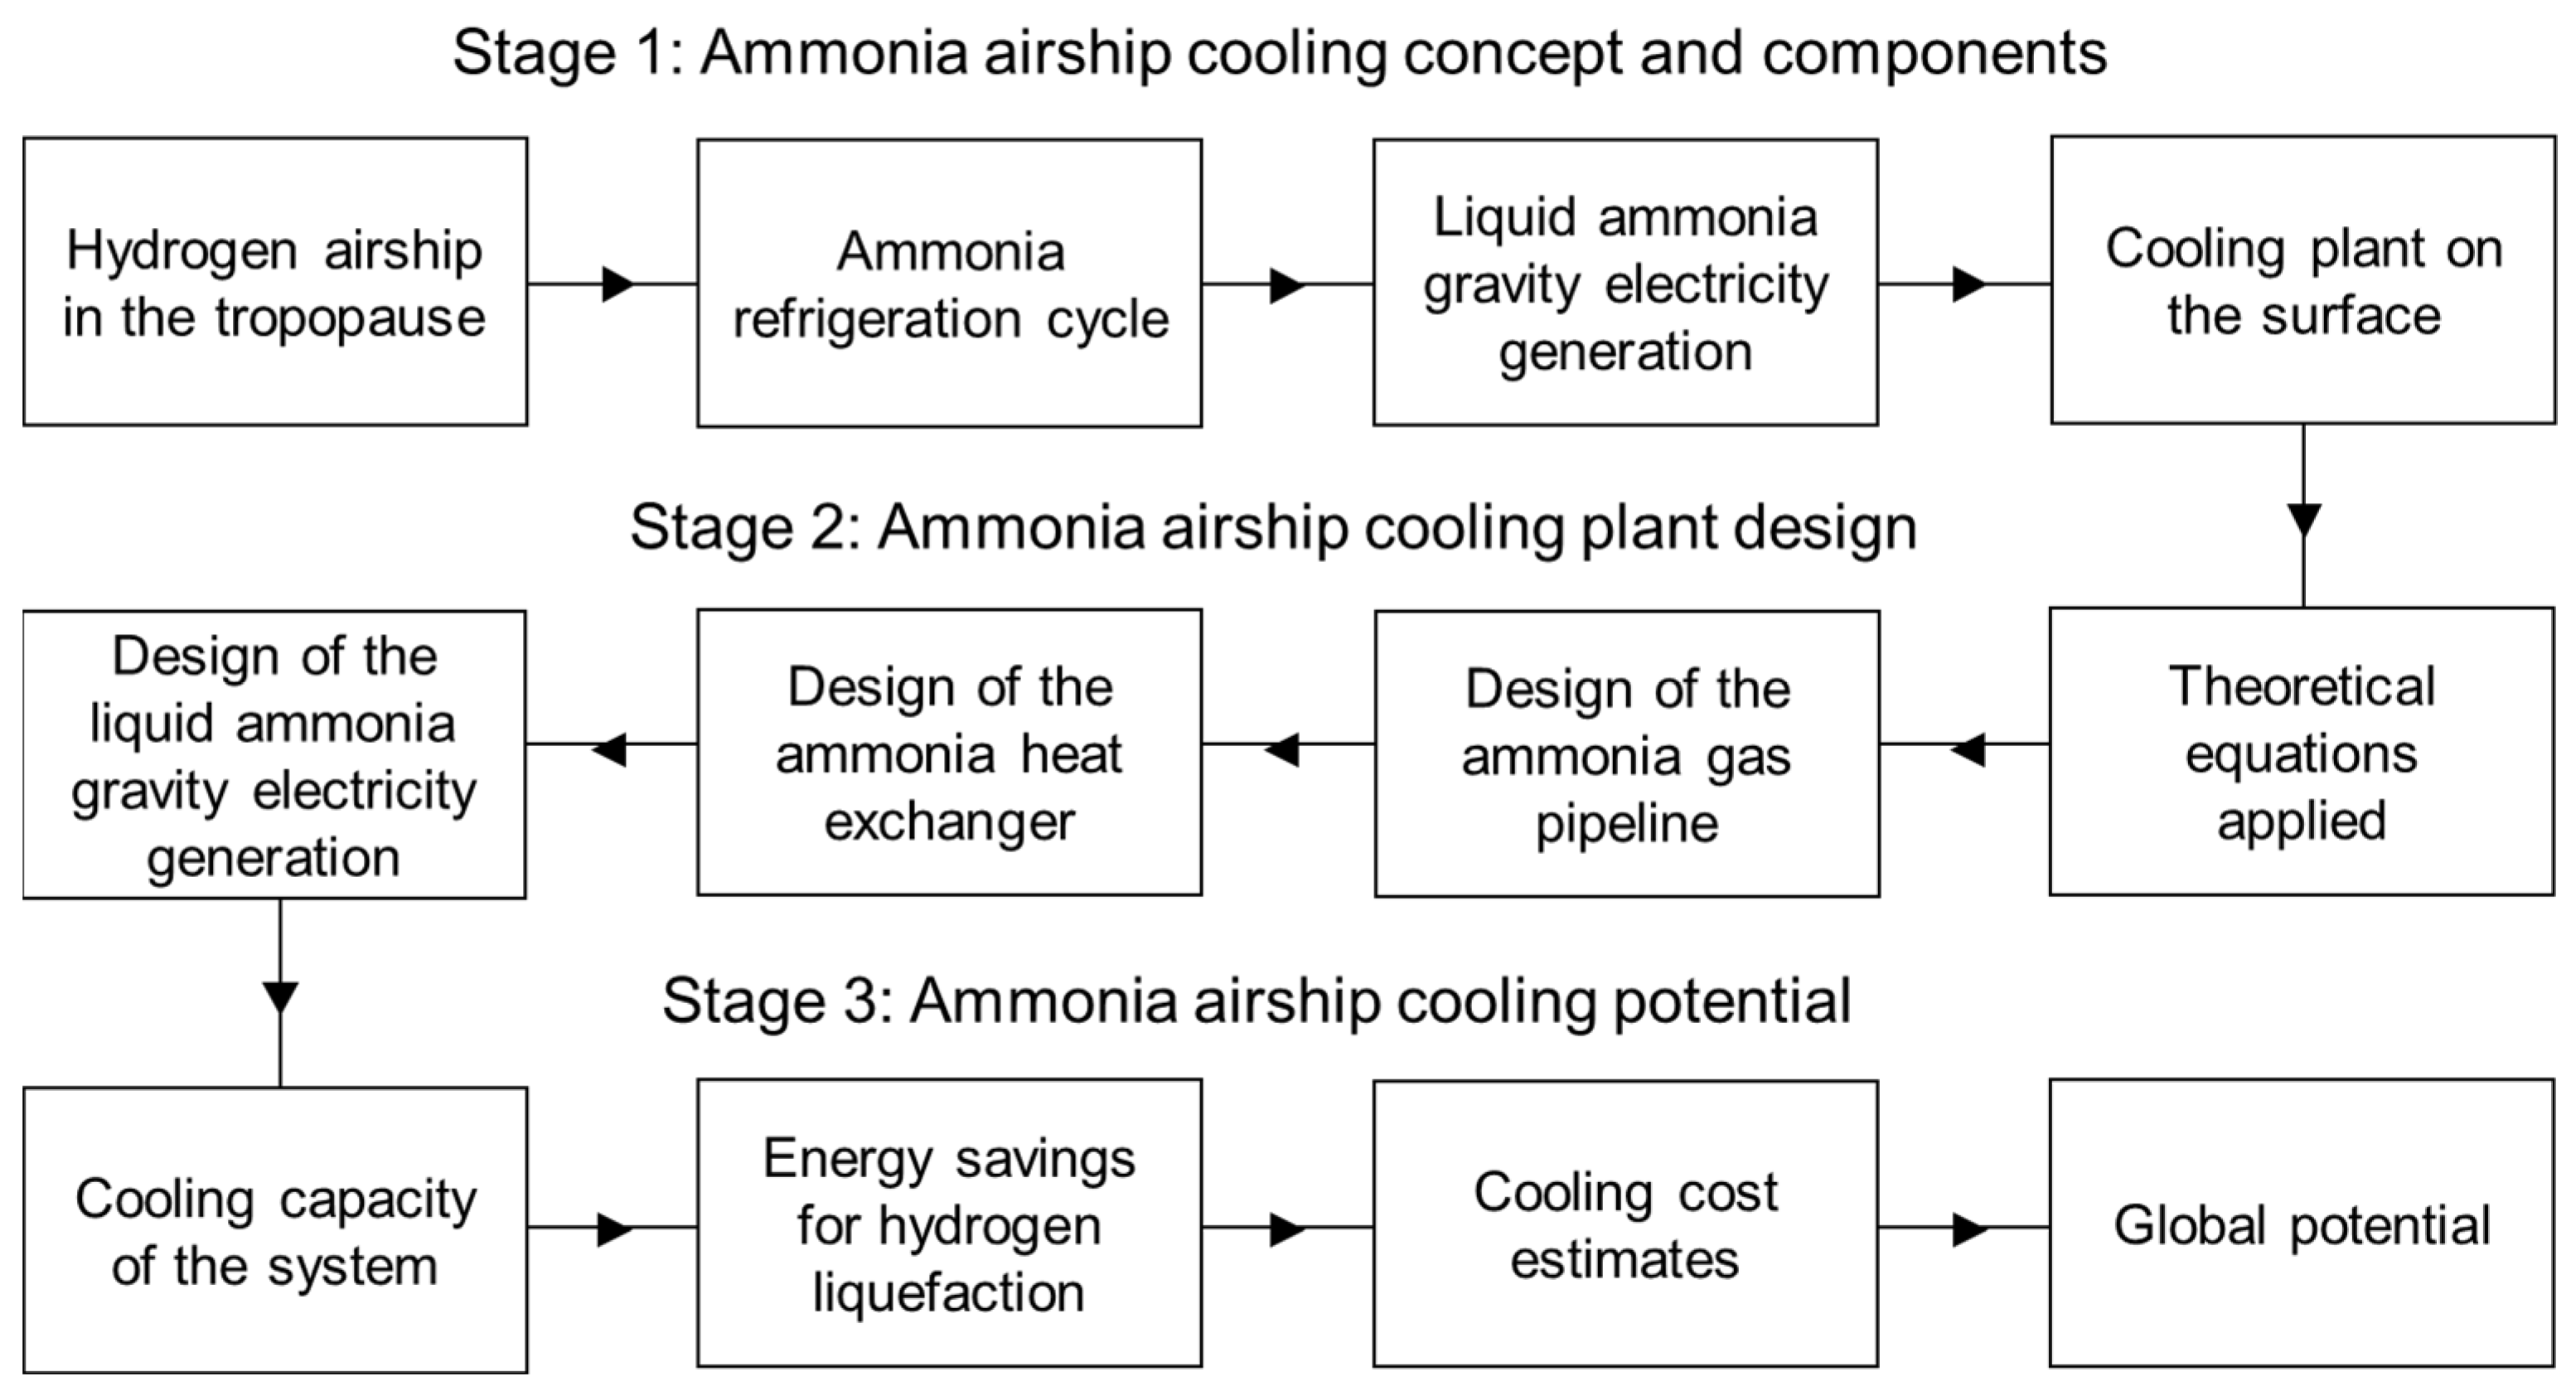
2. Materials and Methods

Figure 1 presents the methodological framework applied in the paper. It is divided into three stages. Stage 1 consists of the AAC concept and components. It presents the hydrogen airship in the tropopause, the ammonia refrigeration cycle, the liquid ammonia gravity electricity generation, and the cooling plant on the surface. Stage 2 consists of the design of the AAC plant. It presents the theoretical equations applied in the paper, the design of the ammonia gas pipeline, the ammonia heat exchanger in the tropopause, and the liquid ammonia gravity electricity generation. Stage 3 consists of estimating the potential for AAC plants. It calculates the cooling capacity, the energy savings in hydrogen liquefaction processes, and the cooling costs of a AAC plant, and estimates the global potential for the technology.

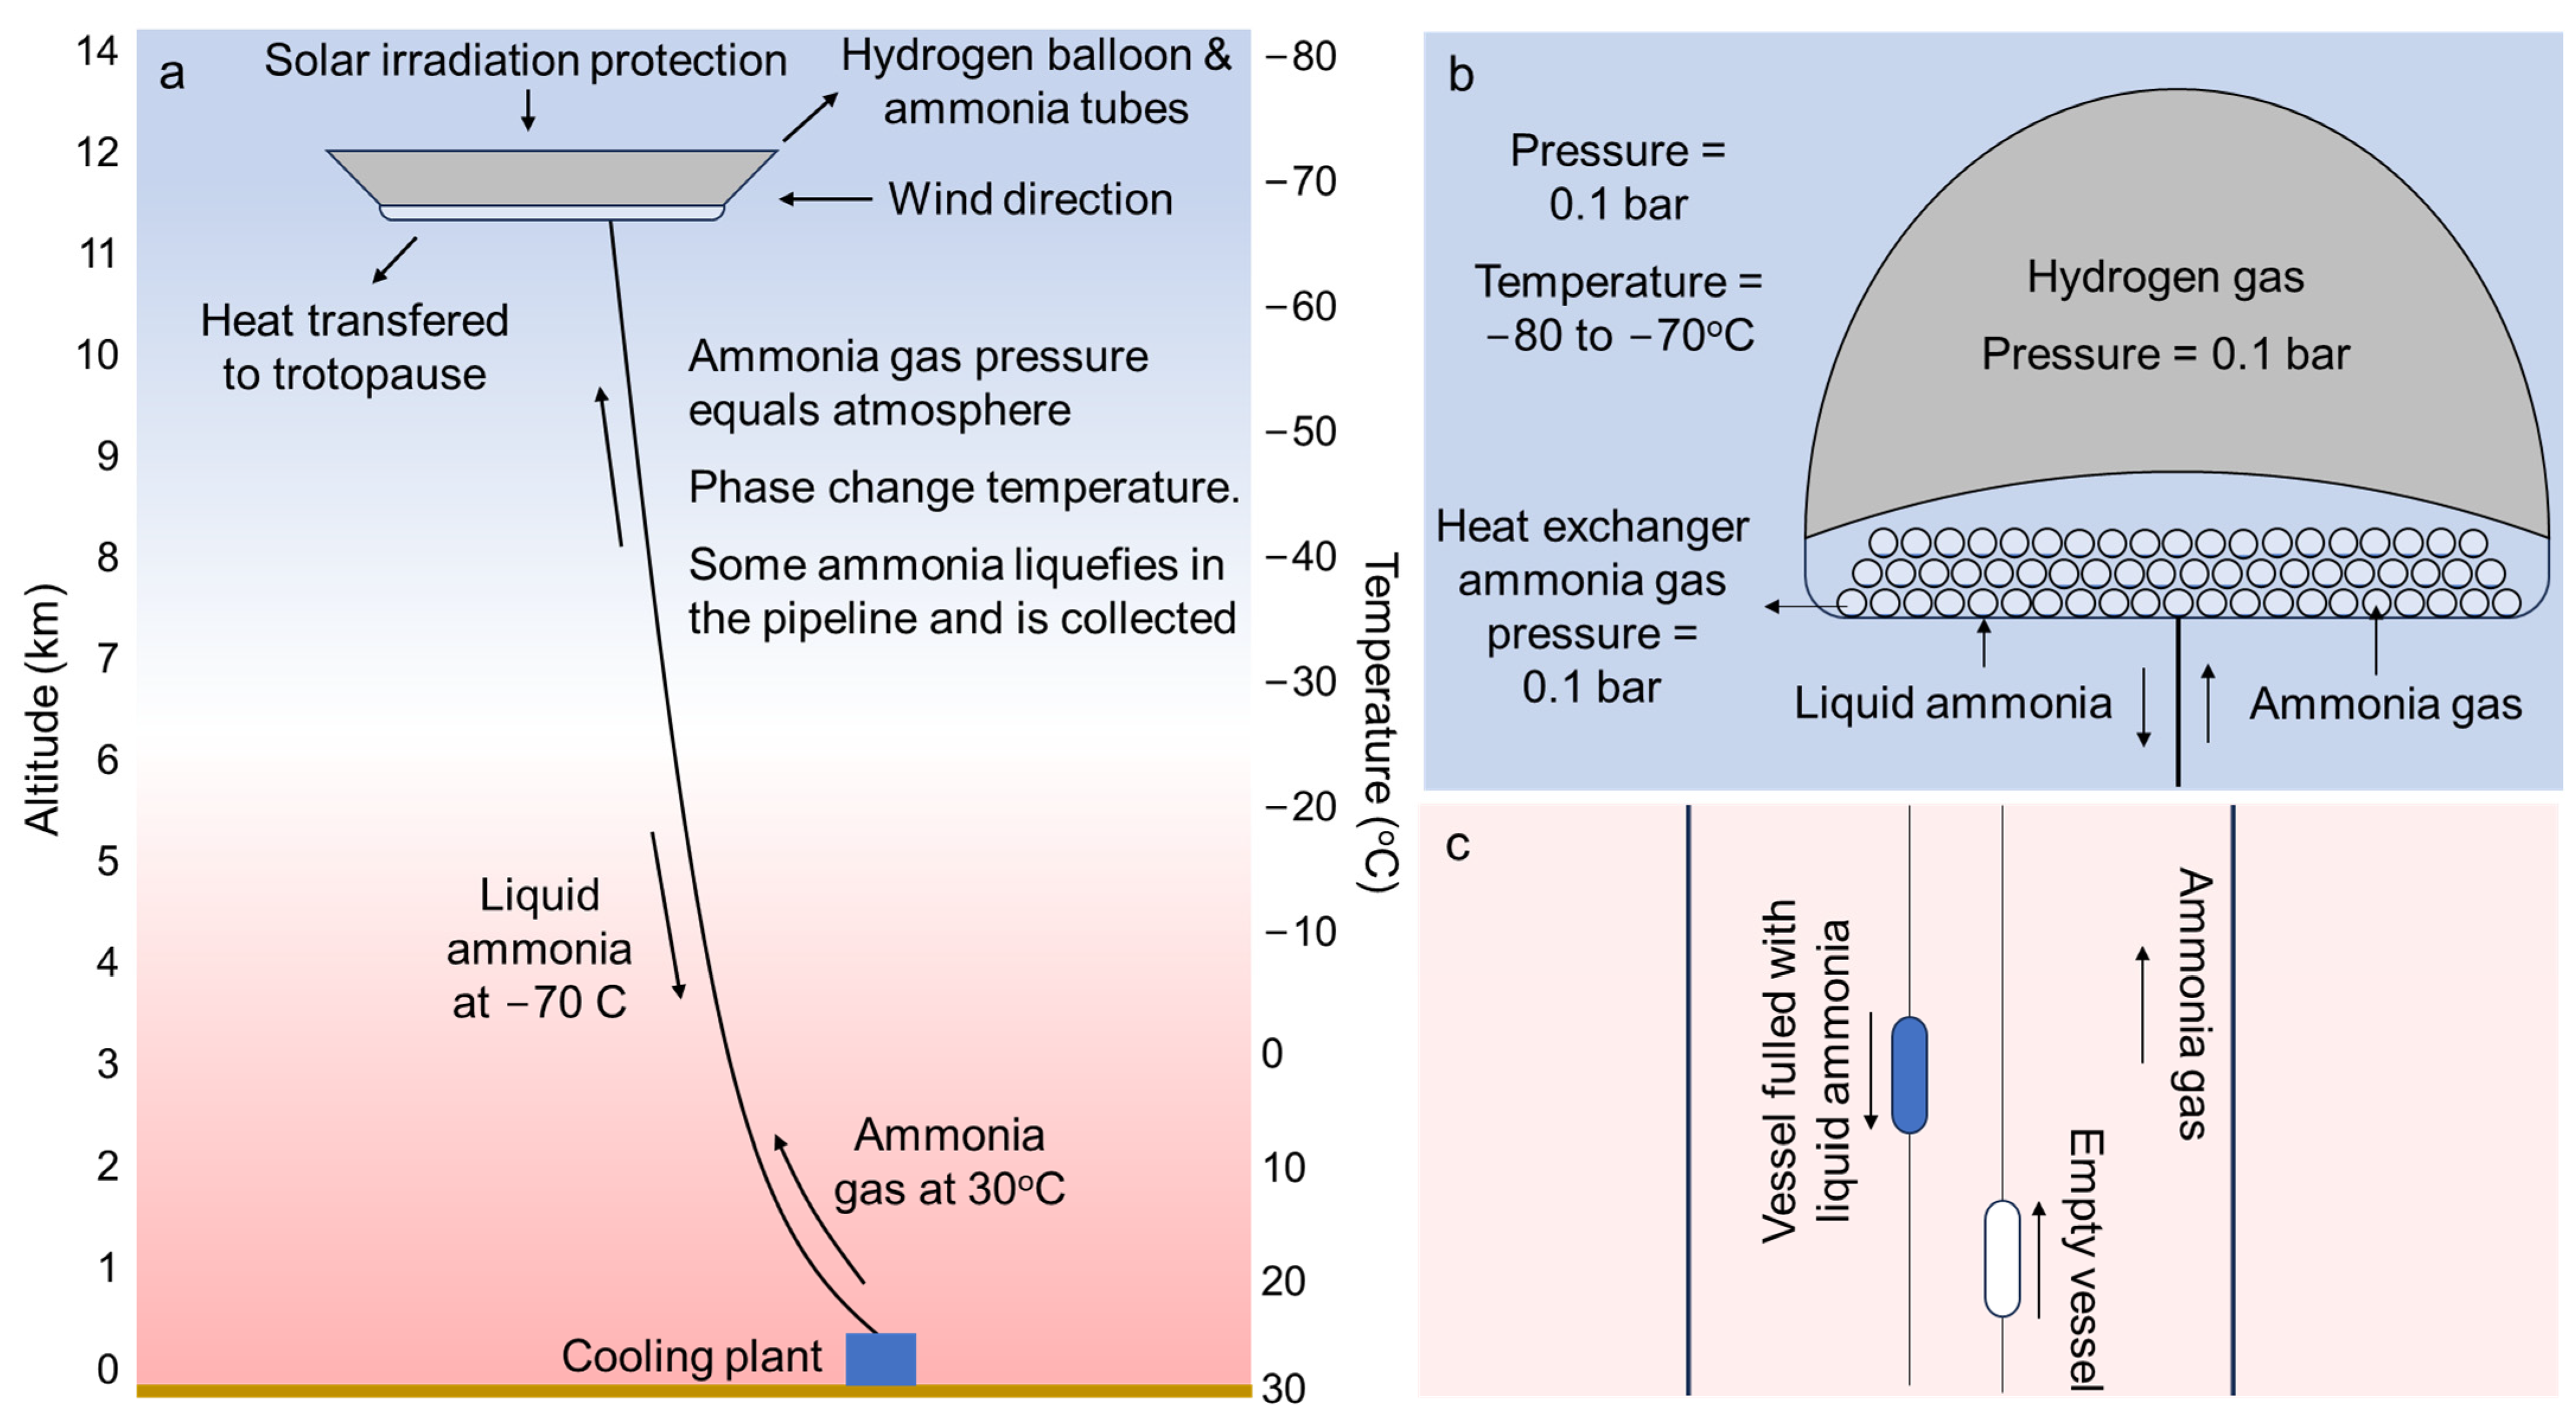
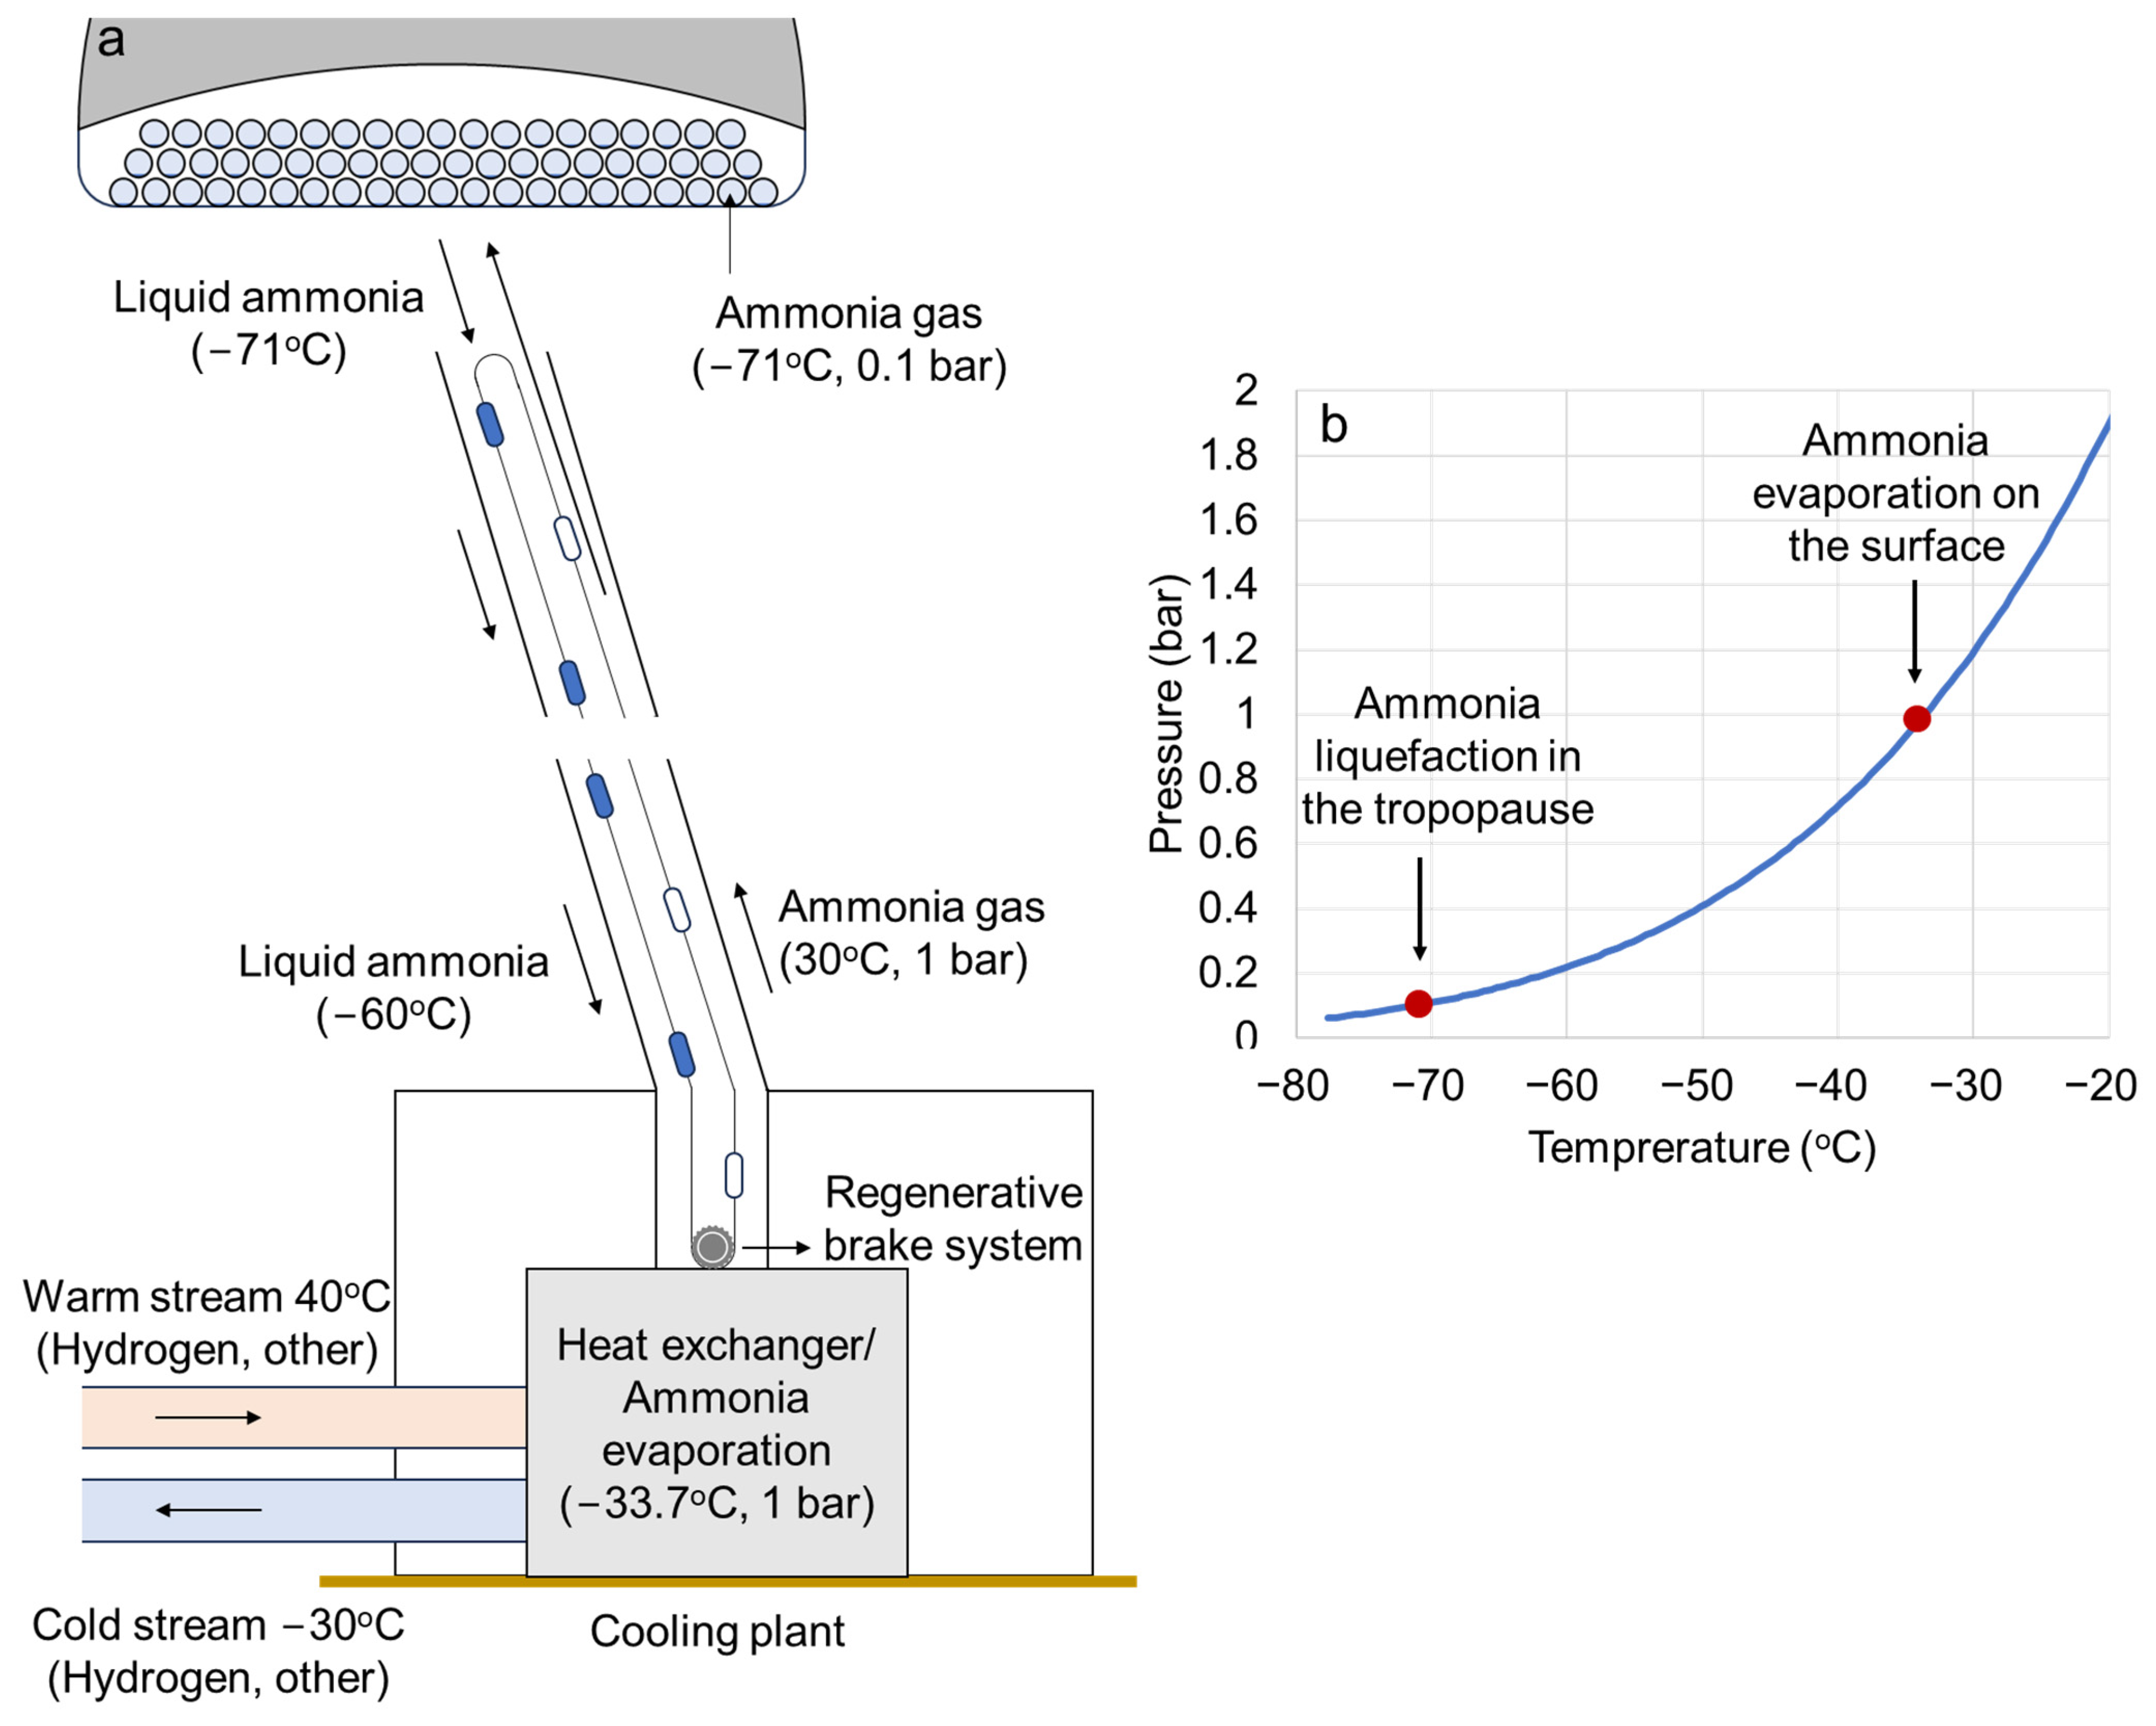
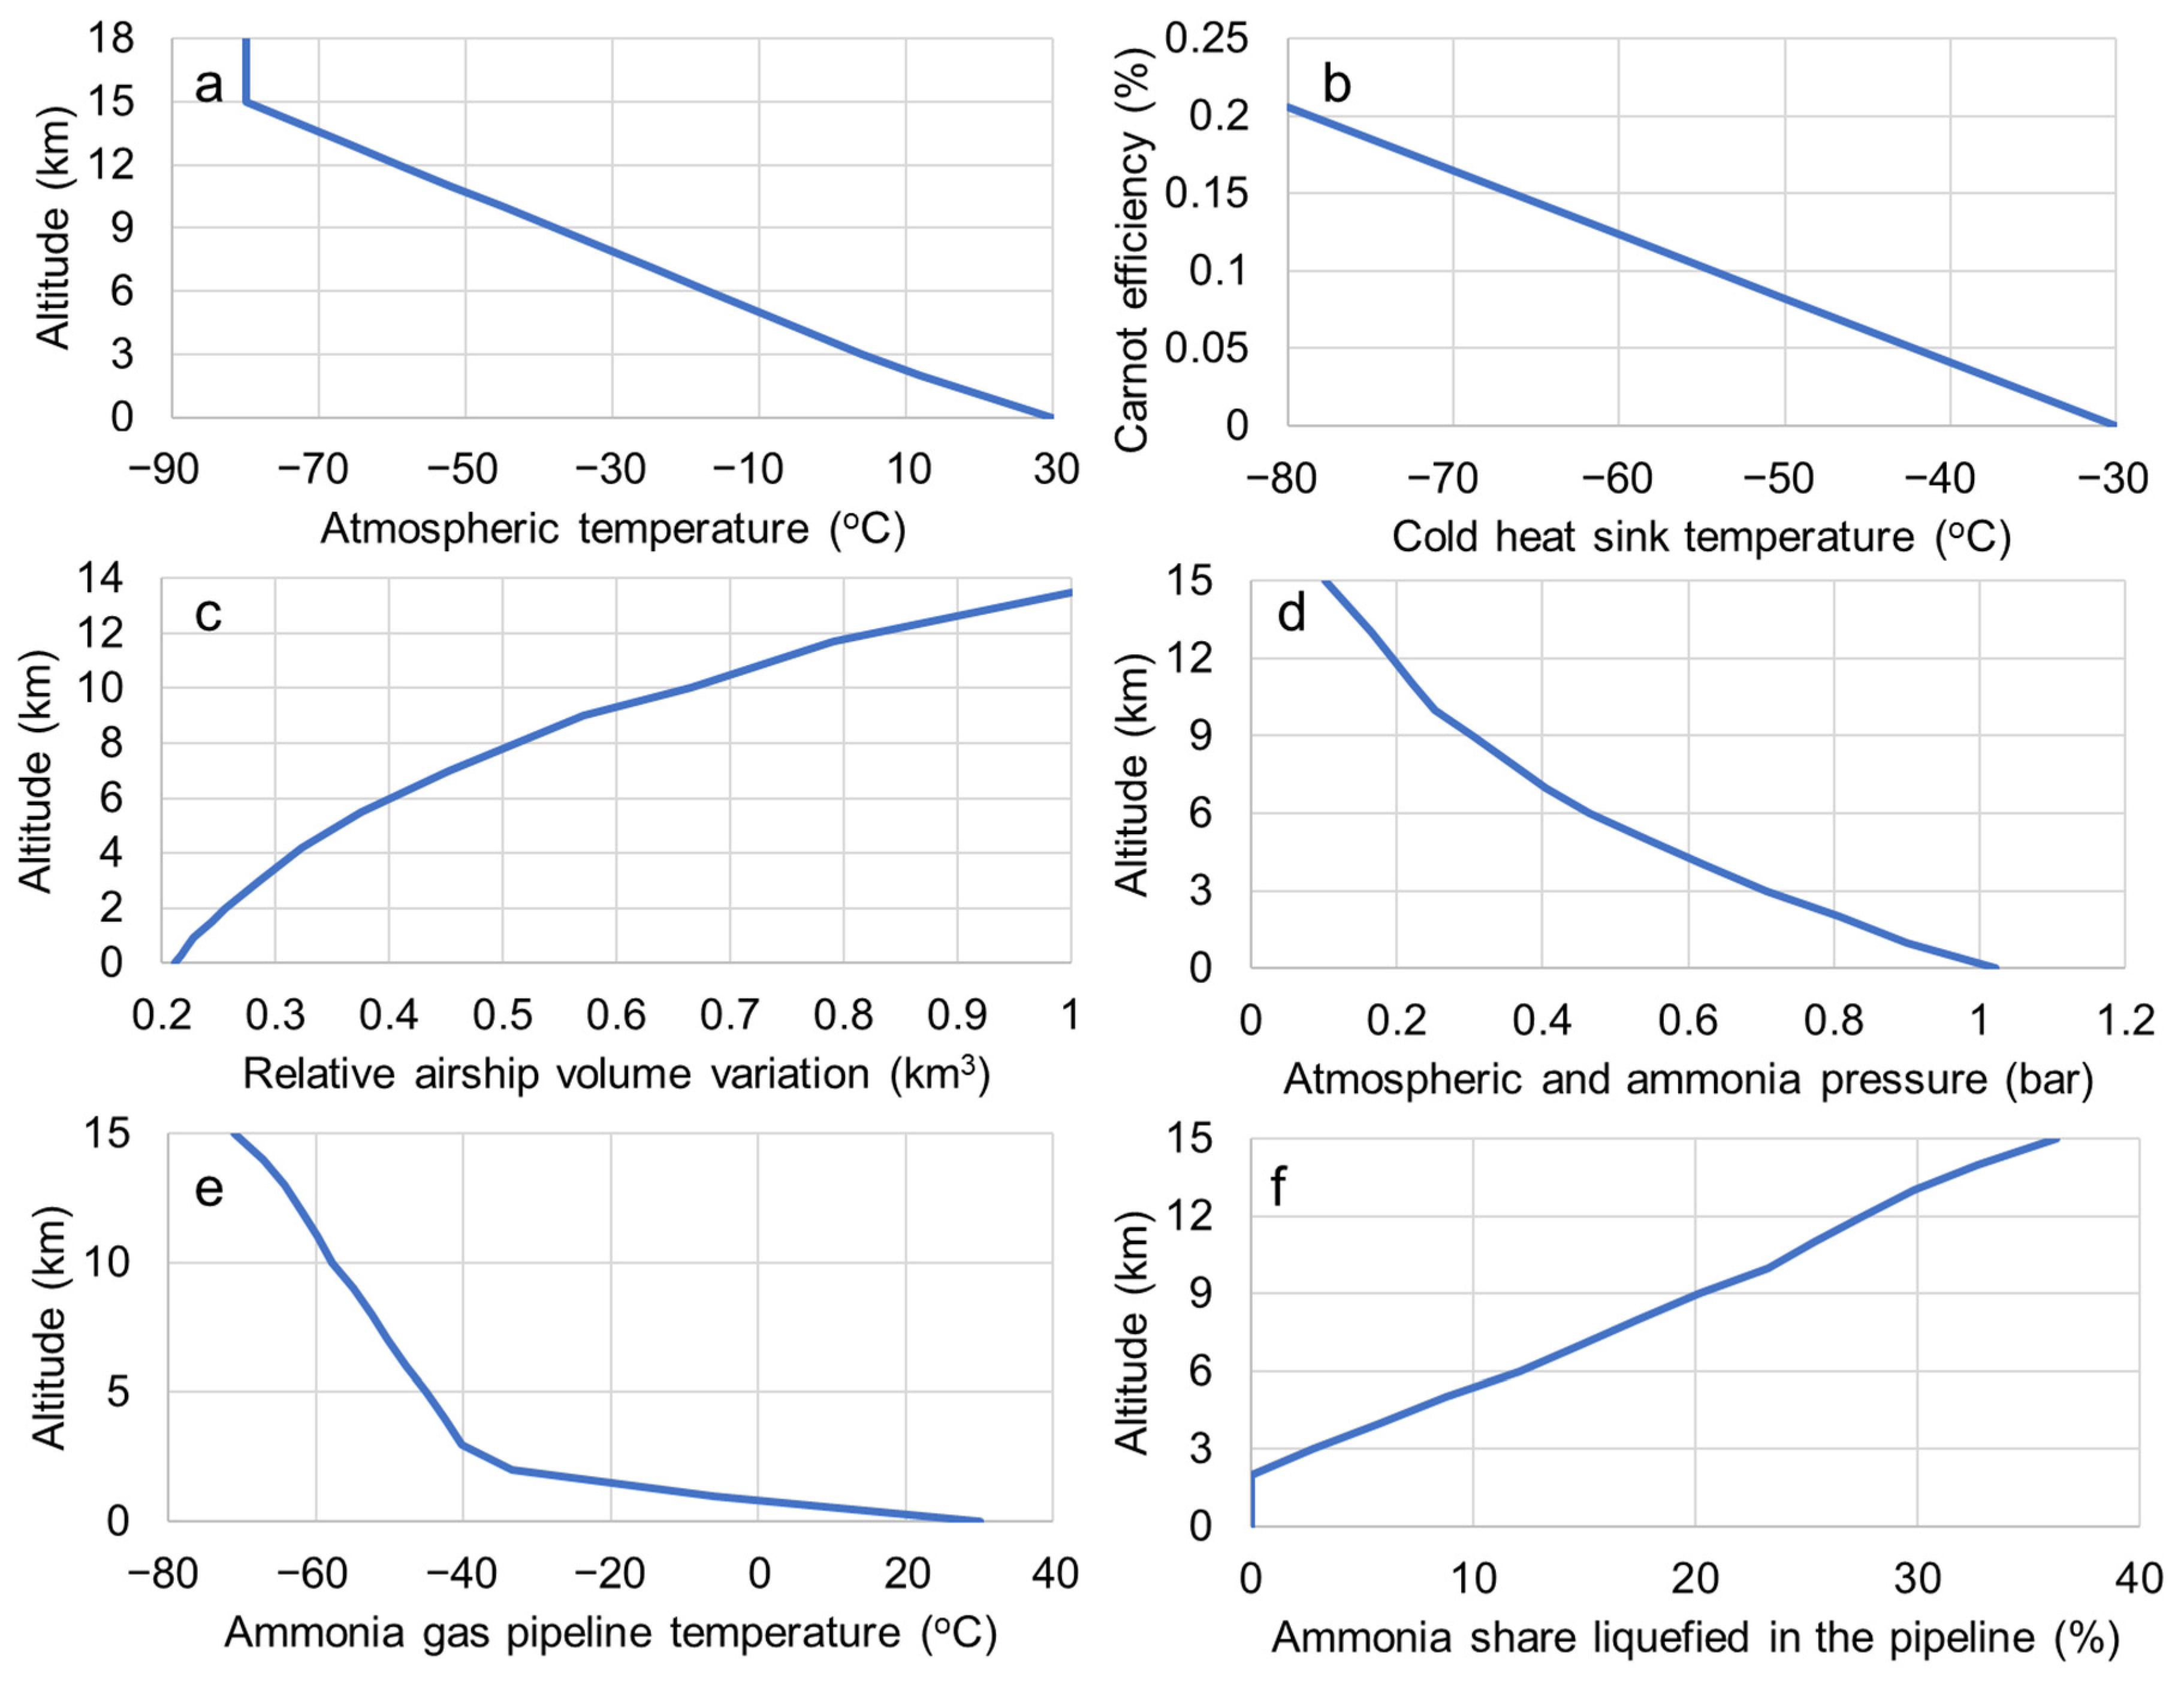
Ammonia Airship Cooling—AAC

Figure 2 presents the proposed full-scale ammonia airship cooling (AAC) process. It involves raising an airship with hydrogen carrying aluminum tubes filled with ammonia. The hydrogen and the ammonia gases provide buoyancy to maintain the airship floating in the tropopause. The airship must be at around 12 to 15 km altitude in the tropopause, where ambient temperature varies between −70 and −80 °C (Figure 2a). At this height, pressure, and temperature, the aluminum tubes lose heat to the tropopause, and part of the ammonia inside the tubes liquefies (Figure 2b). The liquefaction of ammonia reduces the pressure in the tubes, which sucks more ammonia gas from the surface. The hydrogen airship provides a barrier to solar irradiation, preventing the heating of the ammonia tubes. It also funnels the wind to exchange more heat with the ammonia tubes. The liquid ammonia on the bottom of the tubes is loaded into a vessel attached to a cable transportation system that transports the vessels filled with ammonia to the surface, generating electricity (Figure 2c). At the same time, empty vessels move from the surface back to the airship. Liquid ammonia is used to provide cooling services on the surface.
Figure 3a describes the connection between the airship and the pipe and cable system. Figure 3b presents the temperature and pressure required to liquefy ammonia in the tropopause. The pressure of the ammonia regasification must be high enough for the ammonia gas to return to the ammonia airship in the tropopause, and to reduce the diameter of the ammonia gas pipeline. The pressure must be higher than the atmospheric pressure to avoid the pipeline collapsing, and the refrigeration temperature should be the lowest possible to optimize cooling systems. Thus, a pressure of 1.02 bar and a corresponding ammonia evaporation temperature of −33.7 °C were selected (Figure 3a). This allows cooling down of hydrogen or another stream to −27 °C on the surface. The ammonia gas should then be heated as much as possible to return to the airship at higher speeds (Figure 3c). An interesting process that could apply ammonia airship cooling is hydrogen liquefaction, which demands a lot of energy to cool down hydrogen to 20 K. Table 1 summarizes of components of the AAC plant and their main roles in the system.
Equation (1) presents a simplified equation to estimate the heat exchange between the ammonia gas inside the ammonia aluminum tubes in the airship and the atmospheric air. In the equation, E is the thermal energy transferred to the tropopause (in W), U is the overall heat transfer coefficient, estimated to be 34 W/m2·K, A is the superficial area of the heat exchanger (in m2), T i n , N H 3 and T o u t , N H 3 are the phase change temperature of ammonia inside the pipeline at ground level and tropopause (in K), respectively, T i n , a i r is the air temperature at ground level and T o u t , a i r is the air temperature in the tropopause (in K), respectively. Radiation heat transfer consideration is not included in the estimation due to the low temperatures. Thus, T s = surface 71 K—phase change ammonia. Tout = Tin + 3. In Equation (1), which derives from the first law of thermodynamics, H i n and H o u t are the enthalpies of ammonia at ground level, at the entrance to the pipeline, and in the tropopause, at the airship level (in J/kg), and m ˙ is the ammonia mass flow rate (in kg/s).
E = m ˙ . H o u t H i n = U . A . T s T o u t , a i r T s T i n , a i r l n T s T o u t , a i r T s T i n , a i r
Equation (2) calculates the overall heat transfer coefficient of the ammonia aluminum tubes in the airship. In the equation, h o is the mean convection heat transfer coefficient for air at the tropopause, assuming an air speed of 15 m/s and 40 W/m2·K [29], r i and r o are, respectively, the pipeline inner and outer radius, assuming that the diameter is 10 m and the thickness is 3 mm, r i = r o , making the thermal resistance of the wall negligible. We decided on a 10 m diameter tube because the pressure inside and outside the tube are the same, and ammonia has a density around 41% smaller than air. Thus, the heat exchanger itself will contribute to the airship’s buoyancy. k is the thermal conductivity of the aluminum pipeline, assumed to be 237 W/m2·K [30], h i is the mean convection heat transfer coefficient for ammonia inside the aluminum pipeline, assumed to be 200 W/m2·K [31], and L is the length of the heat exchanger horizontal tubes in the airship.
1 U = 1 h i 2 . π . r i . L + l n r o r i 2 . π . k . L + 1 h o 2 . π . r o . L
Equation (3) presents Bernoulli’s equation applied to estimate the pressure drop along the vertical pipeline that transports ammonia gas from the cooling plant to the airship in the tropopause [32]. This equation is applied assuming that the pressure inside the vertical pipeline is always the same as the outside atmospheric pressure. This allows the vertical pipeline to be very light. The velocity of the ammonia and the diameter of the pipeline will vary with altitude according to the available pressure drop to maintain the same pressure in the pipeline the as the ambient pressure. In the equation, s and t are the conditions of the ammonia gas in the surface (ground level) and the ammonia pressure in the aluminum tubes in the airship, respectively. The equations are performed in steps of 1000 m. P is the pressure (in Pa), Z is the elevation (in m), ρ (in kg/m3) and V (in m/s) are, respectively, the density and the velocity of the ammonia gas, g is the acceleration of gravity assumed to be 9.81 m/s2, and Δ P is the pressure loss in the gas pipeline (in Pa).
Δ P = s = 0 t Z s + P s ρ s + V s 2 2 g Z t P t ρ t V t 2 2 g
To calculate the pressure drop in the ammonia gas pipeline, the Darcy-Weisbach equation (Equation (4)) can be used [33]. In the equation, f is the Darcy friction factor, d i is the pipeline’s inner diameter (in m). Thus,
Δ P = f L V 2 ρ 2 d i
The friction factor depends on the Reynolds number, which is presented in Equation (5) [34]. In this equation, R e is the Reynolds number, μ is the dynamic viscosity of ammonia.
R e = ρ V d i μ
For turbulent flow in a rough pipeline, the Colebrook Equation (6) can be used to estimate the friction factor [35]. In the equation, ε is the roughness of the ammonia pipeline. Future work will include further details on the refrigeration cycle, including a pressure vs. enthalpy state diagram.
f = 1 2 l o g 10 ε 3.7 d i + 2.51 R e f 2
Equation (7) calculates the electricity generated by lowering the liquid ammonia from the tropopause to the surface. In the equation, G is the gravitational electricity generated in the system (in W), m is the mass flow of liquid ammonia lowered from the tropopause (in kg/s), g is the gravitational acceleration, H is the altitude difference between the tropopause and the surface (in m), H = Z t Z s , and e is the efficiency of the electricity generation system, assumed to be 70%. The efficiency is low because the storage vessels have to move up and down. Thus,
G = m · g · H · e
Equation (8) provides an estimation of the energy savings in hydrogen liquefaction. C represents the electricity required to liquefy H2 (in kJ/kg) from a start temperature, T s , to a final temperature, T f . E T denotes the change in enthalpy (in kJ/kg) of H2 at temperature T (in K). T s corresponds to the starting temperature of the refrigeration process (in K), while T f represents the concluding temperature. The coefficient of performance (COP) of the refrigeration system is determined using T C and T H [36]. T C refers to the temperature of the cold heat source, typically the temperature in the evaporator, while T H represents the temperature of the hot heat source. The refrigeration system’s efficiency, denoted as e , assumes a mechanical refrigeration process and is assumed to be 38% of the Carnot efficiency [37].
C = T s T f E T T C ( T H T C ) e

3. Results

In designing the airship cooling system, we set the airship at the tropopause (15 km altitude), which is the end of the troposphere and where the temperature of the atmosphere stops reducing with the increase in altitude (Figure 4a). This is because the lower the temperature of the cold source in the ammonia refrigeration cycle, the higher the Carnot efficiency of the system (Carnot efficiency = (cold heat sink temp—cold heat sink temp)/cold heat sink temp) and the most cooling power at low temperatures can be extracted from the system (Figure 4b). The difference in temperature between the surface (247 K) and the tropopause (193 K) provides the driving force for the ammonia gas to flow from the surface to the tropopause. The main drawbacks of designing the system to operate in the tropopause are the cables, ammonia gas pipeline, and the volume of the airship (Figure 4c). The increase in the dimension of the airship increases the volume of hydrogen to the power of three, increasing the gains in scale of the proposed technology. Figure 4d presents the atmospheric pressure and the pressure of ammonia gas in the pipeline. The ammonia pressure in the pipeline is slightly higher than the atmospheric pressure (1% higher), so the pipeline is light and does not collapse. Figure 4e presents the ammonia gas temperature in the pipeline. The ammonia temperature is limited by the phase change diagram. Given the steep pressure reduction along the pipeline, around 36.3% of the ammonia is liquefied in the gas pipeline (Figure 4f).
Table 2 presents the description of the vertical transport of ammonia gas from the cooling plant to the airship. The vertical ammonia gas pipeline that connects the cooling plant on the surface with the airship in the tropopause is assumed to be 15,000 m. The ammonia evaporation temperature is −33.7 °C so the ammonia pressure is slightly higher than the atmospheric pressure. This is convenient because it reduces the weight of the pipeline and avoids collapsing. The ammonia gas leaves the cooling plant at 30 °C to facilitate the ammonia transport to the airship. The higher the temperature, the better. The total pressure drop in the pipeline is 0.92 bar, and the pressure in the airship is 0.1 bar. This consists of a pressure drop ratio of 8, comparing the inlet and outlet pressure. This huge difference results in a high ammonia gas speed in the vertical pipeline. The ammonia temperature is limited by the phase change diagram. Given the step pressure reduction along the pipeline, around 36.3% of the ammonia liquefies in the gas pipeline.
Figure 5a presents the pressure drop in the pipeline as a result of gravity acceleration, i.e., the ammonia column putting pressure on the gas below. Figure 5b presents the pressure drop along the vertical pipeline due to friction. Table 3 presents more details on estimating the pressure drop from friction along the vertical pipeline. This is used to calculate the ammonia gas speed (Figure 5c) and the diameter of the pipeline (Figure 5d). Table 4 presents the values used to estimate the ammonia gas velocity and pipeline diameter estimation. As can be seen in Figure 5c,d, the velocity and pipeline diameter varies significantly with the pressure change and the amount of ammonia liquified in the pipeline. This shows that it would be very challenging to control the operation of the pipeline. To take into account these changes in velocity and diameter of the pipeline, it was proposed that the pipeline is created with a material that can stretch and compress according to the conditions of the pipeline. The ammonia gas velocity varies from 24 to 58 m/s along the pipeline as shown in Table 4. The ammonia gas mass flowrates leaving the cooling plant and arriving in the airship are 750 and 478, respectively.
Table 5 presents the heat exchanger estimates in the ammonia tubes in the airship. The heat transfer requires a capacity of 654 MWt. This is to liquefy the 478 kg/s of ammonia gas that reaches the airship, assuming a latent heat of 1369 kJ/kg and a temperature difference of 10 °C (between the temperature of ammonia liquefaction (−71 °C) and the temperature in the tropopause (−81 °C)). The proposed tube length for the ammonia tube is 400 m, the diameter of the tubes is 10 m, the number of tubes is 62 and there are three layers of tubes, as shown in Figure 3a. The proposed dimensions, length and width of the airship, are 400 and 200. The height would depend on the weight of the system and the buoyancy required to lift the airship. This paper does not estimate the weight and buoyancy requirements. However, as the pressure of the ammonia in the tubes is the same as the atmospheric pressure, and the density of ammonia is lower than the density of air, the aluminum ammonia tubes fluctuate and contribute to the buoyancy of the airship.
Table 6 presents the potential for electricity generation, cooling potential, and hydrogen liquefaction energy savings. AAC is compared with mechanical green hydrogen liquefaction technologies because hydrogen liquefaction has the potential to be an important industrial process in the future with high renewable cooling energy demand at low temperatures, and mechanical refrigeration is the current technology implemented to liquefy hydrogen. The electricity generated with the gravity electricity generation cable system by lowering liquid ammonia is 49.2 MW. This assumes a liquid ammonia mass flowrate from the airship of 478 kg/s (63.7% of the ammonia in the refrigeration cycle), a generation head of 15,000 m, and 70% efficiency. Assuming an 80% capacity factor results in 345 GWh of electricity. To calculate the total cooling capacity on the AAC plant, we assume the liquid ammonia from the airship (478 kg/s) and the ammonia that liquefies in the vertical pipeline (272 kg/s), i.e., a total liquid ammonia flow of 750 kg/s. The specific cooling capacity is 114.3 MWt, with the liquid ammonia temperature varying from −70 to −33.7 °C, assuming a specific heat of 4.2 kJ/kg K [39]. The latent cooling capacity is 1026.8 MWt at −33.7 °C, assuming a latent heat of 1369 kJ/kg. The total cooling capacity is 1141.1 MWt, assuming no heat losses in the system. This results in a yearly cooling of 8 TWth, assuming a capacity factor of 80%. The theoretical minimum energy required to liquefy hydrogen is 3.7 kWh/kg of H2. However, usually 9.3 kWh/kg of H2 is consumed with conventional technologies, which is equivalent to around 30% of the energy stored within hydrogen. Using AAC, the cold source of the refrigeration system lowers from 40 °C to −33.7 °C, and applying Equation (8) and the enthalpy variation values (Hunt et al., 2023) [40], the electricity consumption lowers to 6.5 kWh/kg of H2. In other words, the electricity requirement for liquefying hydrogen with AAC is 30% smaller than without AAC, both for directly cooling the hydrogen and providing a lower temperature (−30 °C) cold sink for the hydrogen liquefaction refrigeration system. The environmental impact of the technology is related to heating the tropopause. Future work will investigate the impact of AAC in further detail. Table 7 presents the cooling cost estimate.

Global Potential

The global potential for ammonia airship cooling was estimated using 2022 global data on average monthly atmospheric temperature at different altitudes/pressures from ERA5, ECMWF data [44]. Figure 6 compares ammonia phase change and atmospheric pressure and temperature. The temperature difference between the atmospheric temperature at 0.1 bar and the gas–liquid ammonia phase change temperature consists of the potential for ammonia airship cooling. The “Ave. Potential” in Figure 6 consists of the average climate conditions in Jeddah, Saudi Arabia, in 2022, which results in a temperature of 9.84 °C. The “Max potential” in Figure 6 consists of the best global potential for ammonia airship cooling, which results in a temperature of 16.88 °C in the Pacific Ocean close to the Papua New Guinea island.
Figure 7a presents the yearly global potential for ammonia airship cooling at 0.1 bar. This shows that the best potential happens between the Cancer and Capricorn tropics. This is convenient, as it is the global region with the highest demand for cooling. The maximum potential yearly average for cooling is 11.14 °C in the Pacific Ocean. Figure 7b and c show that the potential for AAC does not vary significantly between the winter and summer. However, the winter in the northern hemisphere shows a slightly higher potential. The highest potential in the summer and winter in the northern hemisphere are 9.65 and 12.73 °C, respectively. Another reason that makes the equator an interesting location to install AAC systems is that it is the location with the lowest wind velocities at the tropopause.ch

4. Discussion

Even though wind speeds at the tropopause in the tropical region are significantly lower than in the jet stream [45,46], one main challenge for the AAC plant is the high wind speeds in the tropopause, which can reach up to 450 km/h [45]. To dissipate the forces exerted by high wind speeds, the airship should be built with the smallest possible front area to reduce drag and should have an aerodynamic design to gain altitude during windy periods. This gain in altitude will reduce the strain on the cables that hold the airship connected to the surface, as shown in Figure 8. Future work will clarify the limitations and challenges of the AAC system, especially regarding the strong wind speeds in the tropopause and the control of the pipeline operation.
Ammonia has a global warming potential of approximately zero, meaning it has a negligible impact on global warming over a 100-year time frame. This is because ammonia does not persist in the atmosphere for long, unlike gases like CO2, which can remain for centuries. However, it’s important to note that ammonia can indirectly contribute to climate change through complex chemical reactions in the atmosphere. When ammonia is released into the air, it can react with other compounds to form particulate matter and aerosols, which can have various environmental and health effects. The AAC system takes heat from the surface and transports it to the tropopause, which radiates it into space. If AAC is implemented on a large scale, it would contribute to a negative heat balance of the Earth, and, thus, cool the planet.

5. Conclusions

In conclusion, the world is currently facing a dual challenge of increasing global temperatures and a growing demand for cooling, particularly in tropical and developing countries. Additionally, the transition to a green hydrogen economy is set to raise the need for cooling for hydrogen liquefaction processes. In response to these challenges, this paper has presented a novel and innovative solution in the form of Ammonia Airship Cooling (AAC). AAC harnesses the extremely cold temperatures of the tropopause (−80 °C) using airships and ammonia refrigeration cycles, providing a sustainable and efficient cooling solution. The liquid ammonia, once extracted from the tropopause, can be transported back to the surface to deliver low-temperature cooling services (−33 °C). This technology holds significant promise, particularly in reducing electricity consumption in hydrogen liquefaction plants, a crucial aspect of the green hydrogen production process. Our analysis indicates that the cost of cooling with AAC is estimated at 8.25 USD per MWht, making it an economically viable alternative. Moreover, AAC has the potential to reduce the electricity demand for hydrogen liquefaction by approximately 30%. This represents a significant step towards achieving more sustainable and economically feasible green hydrogen production. It offers an efficient, cost-effective, and environmentally friendly solution that holds great potential for shaping a more sustainable and climate-resilient future. Further research and development efforts should be dedicated to describing in more detail the thermodynamic cycle of the proposed refrigeration cycle with temperature vs. enthalpy and pressure vs. enthalpy diagrams and being dedicated to realizing the full potential of AAC and integrating it into the global energy landscape.

Author Contributions

Conceptualization, J.D.H.; methodology, J.D.H. and C.V.S.; software, F.G.; validation, A.N.; formal analysis, B.Z.; investigation, M.A.V.d.F.; resources, B.v.R.; data curation, A.N.; writing—original draft preparation, J.D.H.; writing—review and editing, B.Z.; visualization, F.G.; supervision, B.v.R.; project administration, B.v.R.; funding acquisition, F.G. All authors have read and agreed to the published version of the manuscript.

Funding

We gratefully acknowledge the financial contribution from the GEIGC project ‘Research on development modes and quantitative assessment of carbon-based resources in life cycle to achieving global carbon neutrality’ (No. SGGEIG00JYJS2200051) to this research.

Data Availability Statement

Data are contained within the article.

Conflicts of Interest

The authors declare no conflicts of interest.

References

  1. Li, K.; Tan, X.; Yan, Y.; Jiang, D.; Qi, S. Directing Energy Transition toward Decarbonization: The China Story. Energy 2022, 261, 124934. [Google Scholar] [CrossRef]
  2. Streimikiene, D.; Baležentis, T.; Volkov, A.; Morkūnas, M.; Žičkienė, A.; Streimikis, J. Barriers and Drivers of Renewable Energy Penetration in Rural Areas. Energies 2021, 14, 6452. [Google Scholar] [CrossRef]
  3. Marinakis, V. Big Data for Energy Management and Energy-Efficient Buildings. Energies 2020, 13, 1555. [Google Scholar] [CrossRef]
  4. Reich, M.; Oesterberg, M.; Regener, T.; Kent, D.; Nawfal, N.; Khames, S. New Performance Motors Set New Benchmarks in Drilling Performance. In Proceedings of the SPE/IADC Middle East Drilling Technology Conference and Exhibition, Abu Dhabi, United Arab Emirates, 20–22 October 2003. [Google Scholar] [CrossRef]
  5. Mihet-Popa, L.; Saponara, S. Toward Green Vehicles Digitalization for the Next Generation of Connected and Electrified Transport Systems. Energies 2018, 11, 3124. [Google Scholar] [CrossRef]
  6. Sarbu, I.; Mirza, M.; Muntean, D. Integration of Renewable Energy Sources into Low-Temperature District Heating Systems: A Review. Energies 2022, 15, 3124. [Google Scholar] [CrossRef]
  7. Namuq, M.; Reich, M.; Al-Zoubi, A. Numerical Simulation and Modeling of a Laboratory MWD Mud Siren Pressure Pulse Propagation in Fluid Filled Pipe. Oil Gas Eur. Mag. 2012, 38, 125–130. [Google Scholar]
  8. Sorknæs, P.; Johannsen, R.M.; Korberg, A.D.; Nielsen, T.B.; Petersen, U.R.; Mathiesen, B.V. Electrification of the Industrial Sector in 100% Renewable Energy Scenarios. Energy 2022, 254, 124339. [Google Scholar] [CrossRef]
  9. Nastasi, B.; Lo Basso, G. Hydrogen to Link Heat and Electricity in the Transition towards Future Smart Energy Systems. Energy 2016, 110, 5–22. [Google Scholar] [CrossRef]
  10. Zakeri, B.; Paulavets, K.; Barreto-Gomez, L.; Echeverri, L.G.; Pachauri, S.; Boza-Kiss, B.; Zimm, C.; Rogelj, J.; Creutzig, F.; Ürge-Vorsatz, D.; et al. Pandemic, War, and Global Energy Transitions. Energies 2022, 15, 6114. [Google Scholar] [CrossRef]
  11. Van de Graaf, T.; Overland, I.; Scholten, D.; Westphal, K. The New Oil? The Geopolitics and International Governance of Hydrogen. Energy Res. Soc. Sci. 2020, 70, 101667. [Google Scholar] [CrossRef]
  12. Hunt, J.D.; Nascimento, A.; Nascimento, N.; Vieira, L.; Romero, O. Possible Pathways for Oil and Gas Companies in a Sustainable Future: From the Perspective of a Hydrogen Economy. Renew. Sustain. Energy Rev. 2022, 160, 112291. [Google Scholar] [CrossRef]
  13. Ghafri, S.; Munro, S.; Cardella, U.; Funke, T.; Notardonato, W.; Trusler, J.; Leachman, J.; Span, R.; Kamiya, S.; Pearce, G.; et al. Hydrogen Liquefaction: A Review of the Fundamental Physics, Engineering Practice and Future Opportunities. Energy Environ. Sci. 2022, 15, 2690–2731. [Google Scholar] [CrossRef]
  14. Aziz, M. Liquid Hydrogen: A Review on Liquefaction, Storage, Transportation, and Safety. Energies 2021, 14, 5917. [Google Scholar] [CrossRef]
  15. Kamran, M.S.; Ahmad, H.O.; Wang, H.S. Review on the Developments of Active Magnetic Regenerator Refrigerators–Evaluated by Performance. Renew. Sustain. Energy Rev. 2020, 133, 110247. [Google Scholar] [CrossRef]
  16. Eckener, H. Protecting Airships against Fire. Nature 1938, 142, 747. [Google Scholar] [CrossRef]
  17. Karataev, V.B.; Grosheva, P.Y.; Shkvarya, L.V. From the History of the Development of Controlled Aerostats (Airships) in the XIX-Early XX Centuries. Bylye Gody 2018, 49, 1159–1165. [Google Scholar] [CrossRef]
  18. Metlen, T.; Palazotto, A.N.; Cranston, B. Economic Optimization of Cargo Airships. CEAS Aeronaut. J. 2016, 7, 287–298. [Google Scholar] [CrossRef]
  19. Trancossi, M.; Dumas, A.; Madonia, M.; Pascoa, J.; Vucinic, D. Fire-Safe Airship System Design. SAE Int. J. Aerosp. 2012, 5, 11–21. [Google Scholar] [CrossRef]
  20. Dumas, A.; Trancossi, M.; Madonia, M. Hydrogen Airships: A Necessary Return Because of High Costs of Helium. In Proceedings of the ASME International Mechanical Engineering Congress and Exposition, Proceedings (IMECE), Houston, TX, USA, 9–15 November 2012; Volume 6, pp. 533–540. [Google Scholar]
  21. Bonnici, M.; Tacchini, A.; Vucinic, D. Long Permanence High Altitude Airships: The Opportunity of Hydrogen. Eur. Transp. Res. Rev. 2014, 6, 253–266. [Google Scholar] [CrossRef]
  22. Provornaya, I.V.; Filimonova, I.V.; Eder, L.V.; Nemov, V.Y.; Zemnukhova, E.A. Prospects for the Global Helium Industry Development. Energy Rep. 2022, 8, 110–115. [Google Scholar] [CrossRef]
  23. Xu, J.; Lin, W. Integrated Hydrogen Liquefaction Processes with LNG Production by Two-Stage Helium Reverse Brayton Cycles Taking Industrial by-Products as Feedstock Gas. Energy 2021, 227, 120443. [Google Scholar] [CrossRef]
  24. Livingston, B. Blimps And Modern Warfare. Sci. Am. 1940, 162, 261–263. [Google Scholar] [CrossRef]
  25. Klemin, A. Future Leviathans of the Skies. Sci. Am. 1925, 132, 166–168. [Google Scholar] [CrossRef]
  26. Dolman, A.J. The Rediscovery of the Airship. Phys. Technol. 1983, 14, 169. [Google Scholar] [CrossRef]
  27. Hunt, J.D.; Nascimento, A.; Zakeri, B.; Barbosa, P.S.F.; Costalonga, L. Seawater Air-Conditioning and Ammonia District Cooling: A Solution for Warm Coastal Regions. Energy 2022, 254, 124359. [Google Scholar] [CrossRef]
  28. Hunt, J.D.; Zakeri, B.; Falchetta, G.; Nascimento, A.; Wada, Y.; Riahi, K. Mountain Gravity Energy Storage: A New Solution for Closing the Gap between Existing Short-and Long-Term Storage Technologies. Energy 2020, 190, 116419. [Google Scholar] [CrossRef]
  29. The Engineering ToolBox Convective Heat Transfer. Available online: https://www.engineeringtoolbox.com/convective-heat-transfer-d_430.html (accessed on 20 December 2023).
  30. The Engineering ToolBox Metals, Metallic Elements and Alloys-Thermal Conductivities. Available online: https://www.engineeringtoolbox.com/thermal-conductivity-metals-d_858.html (accessed on 20 December 2023).
  31. Incropera, F.P.; DeWitt, D.P.; Bergman, T.L.; Lavine, A.S. Fundamentals of Heat and Mass Transfer, 7th ed.; John Wiley & Sons, Inc.: Hoboken, NJ, USA, 2007; Volume 6, ISBN 9780471457282. [Google Scholar]
  32. Wu, G.; Yan, Z.; Zhuang, D.; Ding, G.; Cao, F.; Meng, J. Design Method and Application Effects of Embedded-Clapboard Distributor on Refrigerant Distribution among Multi-Tubes of Micro-Channel Heat Exchangers. Int. J. Refrig. 2020, 119, 420–433. [Google Scholar] [CrossRef]
  33. Cao, H.S.; Vanapalli, S.; Holland, H.J.; Vermeer, C.H.; ter Brake, H.J.M. A Micromachined Joule–Thomson Cryogenic Cooler with Parallel Two-Stage Expansion. Int. J. Refrig. 2016, 69, 223–231. [Google Scholar] [CrossRef]
  34. Xu, J.H.; Zou, S.; Inaoka, K.; Xi, G.N. Effect of Reynolds Number on Flow and Heat Transfer in Incompressible Forced Convection over a 3D Backward-Facing Step. Int. J. Refrig. 2017, 79, 164–175. [Google Scholar] [CrossRef]
  35. Brkić, D. Can Pipes Be Actually Really That Smooth? Int. J. Refrig. 2012, 35, 209–215. [Google Scholar] [CrossRef]
  36. Gluesenkamp, K.R.; Nawaz, K. Separate Sensible and Latent Cooling: Carnot Limits and System Taxonomy. Int. J. Refrig. 2021, 127, 128–136. [Google Scholar] [CrossRef]
  37. Erdinc, M.T. Two-Evaporator Refrigeration System Integrated with Expander-Compressor Booster. Int. J. Refrig. 2023, 154, 349–363. [Google Scholar] [CrossRef]
  38. LMNO Engineering Gas Viscosity Calculator. Available online: https://www.lmnoeng.com/Flow/GasViscosity.php (accessed on 20 December 2023).
  39. The Engineering ToolBox Ammonia-Specific Heat, vs. Temperature and Pressure. Available online: https://www.engineeringtoolbox.com/ammonia-heat-capacity-specific-temperature-pressure-Cp-Cv-d_2016.html (accessed on 20 December 2023).
  40. Hunt, J.D.; Montanari, P.M.; Hummes, D.N.; Taghavi, M.; Zakeri, B.; Romero, O.J.; Zhou, W.; de Freitas, M.A.V.; José de Castro, N.; Schneider, P.S.; et al. Solid Air Hydrogen Liquefaction, the Missing Link of the Hydrogen Economy. Int. J. Hydrogen Energy 2023, 48, 29198–29208. [Google Scholar] [CrossRef]
  41. Jiaxing Inch Eco Materials Co., L. Airship Envelope Fabric TPU Coated Tear Resistant UHMWPE Fabric Inflatable. Available online: https://www.alibaba.com/product-detail/Airship-Envelope-Fabric-TPU-Coated-Tear_1600215218350.html?spm=a2700.galleryofferlist.normal_offer.d_title.21313aecya6E7U (accessed on 20 December 2023).
  42. Wan Star Aluminum Industry, Co. Thin Wall Aluminum Round Tube Customization Aluminum Pipe Fine Drawn Aluminum Tube for Manufacturing of Mechanical Parts. Available online: https://www.alibaba.com/product-detail/Thin-Wall-Aluminum-Round-Tube-Customization_11000007506803.html?spm=a2700.7735675.0.0.47f1WqZBWqZBf1&s=p (accessed on 20 December 2023).
  43. Hunt, J.D.; Zakeri, B.; Jurasz, J.; Tong, W.; Dąbek, P.B.; Brandão, R.; Patro, E.R.; Đurin, B.; Filho, W.L.; Wada, Y.; et al. Underground Gravity Energy Storage: A Solution for Long-Term Energy Storage. Energies 2023, 16, 825. [Google Scholar] [CrossRef]
  44. ECMWF ERA5 Monthly Averaged Data on Pressure Levels from 1940 to Present. Available online: https://cds.climate.copernicus.eu/cdsapp#!/dataset/reanalysis-era5-pressure-levels-monthly-means?tab=overview (accessed on 20 December 2023).
  45. Hunt, J.D.; Byers, E.; Balogun, A.-L.; Leal Filho, W.; Colling, A.V.; Nascimento, A.; Wada, Y. Using the Jet Stream for Sustainable Airship and Balloon Transportation of Cargo and Hydrogen. Energy Convers. Manag. X 2019, 3, 100016. [Google Scholar] [CrossRef]
  46. Hunt, J.D.; Zakeri, B.; Nascimento, A.; de Freitas, M.A.V.; Amorim, F.d.C.; Guo, F.; Witkamp, G.-J.; van Ruijven, B.; Wada, Y. Hydrogen Balloon Transportation: A Cheap and Efficient Mode to Transport Hydrogen. Int. J. Hydrogen Energy 2023, 53, 875–884. [Google Scholar] [CrossRef]
Figure 1. Methodological framework applied in the paper.
Energies 17 00111 g001
Figure 2. Ammonia airship cooling presenting (a) the whole system, (b) the airship, and (c) the ammonia gas pipeline and liquid vessel lift.
Energies 17 00111 g002
Figure 3. (a) Cooling plant description, and (b) ammonia phase change diagram focusing on the regasification pressure and temperature.
Energies 17 00111 g003
Figure 4. Characteristics of the AAC system: (a) atmospheric temperature variation with altitude, (b) Carnot efficiency variation with cold heat sink temperature, (c) airship volume, (d) atmospheric and ammonia pressure, (e) ammonia gas pipeline temperature, and (f) ammonia share liquefied in the pipeline variation with altitude.
Energies 17 00111 g004
Figure 5. AAC system design: (a) pressure drop as a result of the ammonia gas column, (b) pressure drop as a result of friction in the flexible vertical ammonia pipeline, (c) ammonia gas speed in the flexible vertical ammonia pipeline, and (d) flexible vertical ammonia pipeline diameter.
Energies 17 00111 g005
Figure 6. Comparison between the ammonia phase change diagram and atmospheric pressure and temperature.
Energies 17 00111 g006
Figure 7. Global potential for ammonia airship cooling with an airship at 0.1 bar: (a) yearly average, (b) summer, and (c) winter.
Energies 17 00111 g007
Figure 8. Proposed airship design to reduce drag and the impact of wind on the cables.
Energies 17 00111 g008
Table 1. Summary of components and their main role in the system.
ComponentRole in the System
Hydrogen airshipLift the ammonia tubes to the tropopause, where the temperature liquefies the ammonia. Its shape should minimize wind drag, provide additional lift with the wind and provide shade from the Sun to the ammonia tubes.
Ammonia aluminum tubesExchange heat between the tropopause and the ammonia gas to liquefy the ammonia. The pressure inside the tubes is similar to the pressure outside. The tubes are filled with ammonia, which is lighter than air and provides lift to the airship.
Flexible pipelineThe flexible pipeline transports ammonia gas from the cooling plant in the surface to the airship. It also provides lift as the ammonia inside the pipeline is lighter than air.
Liquid ammonia liftsThe lifts due to the liquid ammonia are used to transport the liquid ammonia in insolated tanks from the airship to the cooling plant in the surface. It also generates gravitational electricity with a generator in the cooling plant, similarly to how electricity is generated with Mountain Gravity Energy Storage (MGES) [28].
Cooling plantThe cooling plant regasifies the liquid ammonia providing refrigeration services at −30 °C, which can be used to reduce the energy consumption to liquefy hydrogen.
Table 2. Vertical transport of ammonia gas from the cooling plant to the airship.
DetailValue
Ammonia gas pipeline length (m)15,000
Ammonia gas pipeline inner diameter (m)6400–10,700
Surface ammonia gas pressure (bar)1.02
Temperature in the cooling plant (°C)−33.7
Total pressure drop in the pipeline (bar)0.92
Airship ammonia gas pressure (bar)0.10
Surface ammonia temperature (°C)30
Airship ammonia temperature (°C)−71.0
Ammonia gas viscosity (μPa·s)7–10.3 [38]
Roughness of interior pipe wall (mm)0.1
Ammonia gas velocity (m/s)24–58
Ammonia flowrate (kg/s)750–478
Ammonia flowrate (m3/s)1075–3770
Table 3. Estimation of the pressure drop from friction along the vertical pipeline.
Altitude (km)Ammonia Pressure (bar)Ammonia Temperature (°C)Ammonia Density (kg/m3)Ammonia Gas (%)Horizontal Pressure Drop (bar)Pressure Drop from Friction (bar)
150.101−71.00.10363.70.6060.311
140.135−67.20.13467.30.5920.291
130.166−64.20.16370.20.5760.277
120.194−61.90.18972.50.5580.269
110.222−59.70.21574.60.5370.262
100.253−57.80.24276.70.5130.256
90.303−54.90.28879.80.4850.235
80.354−52.40.33382.60.4520.219
70.404−50.20.37785.20.4150.206
60.465−47.80.42987.90.3730.190
50.544−45.00.49791.20.3240.162
40.623−42.60.56594.20.2690.140
30.707−40.20.63697.20.2070.121
20.808−33.50.706100.00.1370.092
10.901−6.00.701100.00.0680.068
01.02230.00.698100.0--
Table 4. Ammonia gas velocity and pipeline diameter estimation.
Altitude (km)Velocity (m/s)Diameter (m)Viscosity (μPa.s)Reynolds Number (106)Friction Factor
1557.99.17.119.90.039
1445.99.57.199.80.039
1335.610.27.259.40.038
1230.110.57.319.30.037
1126.510.77.379.30.037
1038.48.37.4512.30.040
932.48.67.5212.30.040
827.18.97.5812.00.039
728.48.37.6513.20.040
631.57.57.7315.10.042
526.67.77.814.90.041
424.07.87.8615.20.041
326.37.28.0816.50.043
224.57.58.9914.30.042
133.16.410.314.40.044
Table 5. Heat exchange in the ammonia tubes in the airship.
DetailsValues
Heat transfer in the exchanger (MWt)654.4
Temperature difference for heat transfer (°C)10
Tube length (m)400
Tube diameter (m)10
Number of tubes62
Number of tube layers3
Airship dimensions (m × m × m)400 × 200 × 400
Table 6. Electricity generation, cooling potential, and hydrogen liquefaction energy savings.
DetailsValues
Gravity electricity generation (MW)49.2
Specific heat cooling potential (MWt)114.3
Latent heat cooling potential (MWt)1026.8
Total cooling capacity (MWt)1141.1
Yearly cooling service (TWth)8.0
Hydrogen liquefaction cold energy requirement (kWht/kg H2) 3.7
Hydrogen liquefaction electricity requirement (kWh/kg H2)9.3
Hydrogen liquefaction electricity requirement with AAC (kWh/kg H2)6.5
Table 7. Cooling cost estimate.
DetailsValuesDescription
Capital costs
Hydrogen airship envelope8,400,000The cost of the airship is mainly the envelope cost. The envelope proposed for the airship is ultra-high molecular weight polyethylene (UHMWPE) fabric. Assuming a 400 × 200 × 400 m dimension, the airship envelope area is 400,000 m2 for 21 USD/m2 [41].
Flexible ammonia gas vertical pipeline envelope9,000,000The ammonia gas vertical pipeline has a length of 15 km and an average diameter of 9 m, which results in an area of 430,000 m2. The pipeline is also made of envelope fabric at a cost of 21 USD/m2 [41].
Ammonia tubes18,500,00062 aluminum tubes 400 m long, 10 m diameter, 3 mm thickness, 2640 kg/m3 density, and cost of 3 USD/kg [42].
Gravity electricity generation system and anchor. 98,400,000The cost for a gravity electricity generation system can be assumed to be 2000 USD/kW (Hunt et al., 2020; Hunt et al., 2023) [28,43], assuming an installed capacity of 49.2 MW. Apart from generating electricity with liquid ammonia, the system anchors the airship. It was assumed that the electricity generated is used to supply the electricity requirements by the AAC system.
Cooling plant20,000,000The cooling plant consists of a heat exchanger capable of exchanging 1141 MWt of cold with an average heat exchange temperature of 5 °C.
Total capital costs154,300,000-
Operation and maintenance costs
Airship hydrogen200,000The hydrogen volume in the airship is 16,000,000 m3 at a pressure of 0.1 and density of 0.01245 kg/m3, equivalent to 200,000. It needs to be refueled every year due to hydrogen leakage. Assuming a future cost of hydrogen of 1 USD/kg. The ammonia leakage is neglected.
Operation cost15,430,000The operation cost is low as most of the system will be automated, and it is assumed to be 10% of capital costs.
Maintenance cost30,860,000Due to the harsh operational conditions, the maintenance cost is assumed to be high and equal to 20% of the investment cost per year.
Cost parameters
Lifetime (years)10-
Levelized costs of AAC cooling (USD/MWht)8.25Assuming an interest rate of 5% per year, a 7.9 discount factor,
Levelized costs of mechanical cooling (USD/kWht)15Assuming the cooling provided at −30 °C, a hot source of 40 °C, a COP of 1, an electricity cost of 15 USD/MWh, and a negligible investment cost.
Disclaimer/Publisher’s Note: The statements, opinions and data contained in all publications are solely those of the individual author(s) and contributor(s) and not of MDPI and/or the editor(s). MDPI and/or the editor(s) disclaim responsibility for any injury to people or property resulting from any ideas, methods, instructions or products referred to in the content.

