Article

Impact of Implementing Circular Waste Management System and Energy Recovery in a City with 100,000 Inhabitants on Nitrogen Emissions by 2035

by
Monika Suchowska-Kisielewicz
* and
Andrzej Jędrczak
Institute of Environmental Engineering, The University of Zielona Góra, 65-417 Zielona Góra, Poland
*
Author to whom correspondence should be addressed.
Energies 2024, 17(1), 108; https://doi.org/10.3390/en17010108
Submission received: 21 November 2023 / Revised: 15 December 2023 / Accepted: 18 December 2023 / Published: 24 December 2023
(This article belongs to the Special Issue Smart Green Cities—Energy Treatment and Management)

Abstract

:
Recent years have observed a reconstruction of the waste management system from a linear resource flow economy to a circular economy. This approach is reflected in the provisions of the Waste Framework Directive (2018), which introduces, among others, new recycling targets for municipal waste which require, by 2025, 55% of the municipal waste to be recycled, in 2030—60%, and in 2035—65%. The ambitious targets adopted for preparing for the reuse and recycling of municipal waste will not be achieved without a high level of the recycling of bio-waste. This paper studies the quantification of municipal waste and nitrogen in a circular municipal waste management system (MWM) implemented for a city of 100,000. It was assumed that MWM would meet the requirements in terms of EU and Polish circular waste management goal legislation for the years 2025, 2030 and 2035. The research results showed that the development of a separate waste collection will reduce the waste delivered to MBT. The required MBT capacity will decrease by almost 2.4 times. Moreover, it has been shown that the introduction of a closed-loop MWM will result in an almost two-fold reduction in the amount of nitrogen going to the landfill and an increase in the mass of nitrogen that can be used to fertilize the soil (by approximately 22%). Furthermore, it has been shown that the most favorable option for an organic waste treatment is the anaerobic–aerobic process. This solution provides the highest biogas production and the lowest nitrogen gas emissions to air.

1. Introduction

It is widely recognized that the increasing amount of waste and its inadequate management are conducive to a number of threats to ecosystems and in consequence, to human health. This is partly due to nitrogen emissions from waste, resulting in soil acidification, air pollution, the greenhouse effect, and water eutrophication [1].
Some fractions of municipal waste are rich in nitrogen. The highest nitrogen content is found in kitchen and garden waste (bio-waste). According to the EEA and the European Environment Agency (2020), bio-waste accounted for more than 34% of the mass of municipal waste in Europe in 2017 (ECN Data report 2022—Compost and digestate for a circular bioeconomy: Overiew of Bio-waste Collection, Treatment & Markets Across Europe—European Compost. https://www.compostnetwork.info/wordpress/wp-content/uploads/ECN-rapport-2022.pdf (accessed on 1 March 2023)). In Poland, the share of biodegradable waste in municipal waste in 2021 amounted to approx. 31% [2].
Recent years have observed the reconstruction of the waste management system from a linear resource flow economy to a circular economy. In 2018, a revised Waste Framework Directive introduced several significant changes to bio-waste, including, but not limited to: an obligation for EU Member States to separate and recycle bio-waste at source or to separate its collection from 2023. New recycling targets for municipal waste have also been set. In 2025, 55% of the generated municipal waste mass should be recycled, in 2030—60%, and in 2035—65% [3]. New target values for the recycling of packaging waste have also been set. The very ambitious targets adopted for preparing for the reuse (PfR) and recycling of municipal waste will not be achieved without a high level of the recycling of bio-waste due to its high share in the mass of municipal waste.
Due to its high moisture content and susceptibility to biodegradation, the selectively collected bio-waste is suitable for composting and fermentation, as well as the organic fraction of municipal solid waste (OFMSW—fraction < 80 mm separated from grey waste in a mechanical biological treatment plant) for aerobic and anaerobic stabilization. Most researchers prefer bio-waste fermentation processes and anaerobic stabilization for OFMSW, which, due to their high methane production potential, make it possible to simultaneously recover energy from bio-waste, OFMSW, and compost from bio-waste [4,5,6,7]. More detailed information about the fermentation and composting processes, as well as an explanation of concepts such as selective collection, residual waste, or RDF fraction, is presented in the Supplementary Materials.
The implementation of the concept of the “recycling society”, which is the main idea of the Waste Directive, focuses not only on reducing waste generation and recovering resources and energy, but also on reducing greenhouse gas emissions into the environment from waste treatment processes [8,9], including nitrogen loss [1,10].
There is a lot of work on CO2 and CH4 emissions from waste treatment facilities [8,10], including nitrogen loss [1,10,11], and there are still few publications on the quantification of waste mass flow and reactive nitrogen emissions from mechanical–biological treatment (MBT) facilities in the prospective period to 2035 depicting the effect of introducing a circular economy.
Quantifying the amount of reactive nitrogen emissions from waste is an important issue, because the waste management sector accounts for <5% of global greenhouse gas emissions. NH3 emissions are mainly observed in the composting and storage process, while N2O is generated at every stage of waste management. In the composting process, about 98% of N emissions are NH3 and 2% are N2O [12]. Waste incineration generates mainly NOx emissions. Both NOx and NH3 emissions from waste indirectly cause N2O emissions [13].
Appropriate municipal waste management aimed at recycling and the recovery of bio-waste and energy recovery from waste can significantly contribute to reducing uncontrolled nitrogen emissions.
The research topic of this paper is the quantification of municipal waste mass and substance (nitrogen) flows in a circular municipal waste management system implemented in Poland. Waste and nitrogen mass flows for bio-waste and other selectively collected waste and residual waste for 2020 were adopted according to Statistics Poland (SP); for the remaining years, they were based on the municipal waste generation forecast for cities of 100,000 inhabitants in 2025, 2030, and 2035, as well as on physical and chemical properties of the selected waste fractions. This is intended to provide scientific support in the decision-making process for the selection of treatment solutions for separately collected bio-waste in large cities. Large cities are considered to be cities with a population >50,000. The purpose of this study is to determine the volume of nitrogen emissions from municipal waste treatment facilities in a city with a population of 100 thousand in 2020, in order to project to 2035. It was assumed that the municipal waste management system will meet the requirements in terms of EU and Polish circular waste management goal legislation for the years 2025, 2030, and 2035. Four variants of biodegradable waste treatment technologies were compared: composting and methane digestion for bio-waste, and aerobic and anaerobic stabilization for the organic fraction of municipal solid waste.

2. Materials and Methods

2.1. Waste Management in a City with a Population of 100,000 in 2020–2035

The study was performed for a large city with a population of 100,000 in 2020. It was assumed that in large cities, municipal waste management will be carried out in a way that guarantees the required levels of recycling in 2025, 2030, and 2035. Bio-waste, bulk waste, packaging waste (paper, metal, glass, and plastic) and other recyclable waste will be collected selectively. It will be sent to a sorting plant in order to separate impurities before sending commercial fractions to recyclers. Bio-waste will be subjected to the process of composting (CB variant) or methane digestion (AD) with an aerobic stabilization of the fermentate (AS) (ADB + AS variant). Residual municipal waste will be directed to MBT facilities with OFMSW stabilization under aerobic (COF variant) or anaerobic aerobic variant (ADOF + AS) conditions. The general scheme of waste management is shown in Figure 1.

2.2. Forecast of Changes in the Volume of Municipal Waste Streams from a Large City in the Years 2020–2035

Waste and nitrogen mass flows for bio-waste and other selectively collected waste and residual waste for 2020 were adopted according to Statistics Poland (SP) [14] (Table 1); for the remaining years, they were based on a municipal waste generation forecast for cities of 100,000 inhabitants in 2025, 2030, and 2035, as well as on physical and chemical properties of the selected waste fractions (Table 1).
The amount of municipal waste generated in year “t” was calculated from the following formula:
Q t = N I 2020 × 1 + P G R 100 t 2020 × q t
where:
NI2020—number of inhabitants in 2020;
PGR—average population growth rate increase in the period 2015–2035; a value of 0.43% was adopted, which was determined based on the forecasts of the SP [16] after adjusting the input data and updating the assumptions resulting from historical data for cities with 100,000 inhabitants for the years 2014–2020;
qt—waste generation rate per capita; the value of the indicator for large cities was 395 kg·C−1·year−1 in 2020, and the projection of growth in the value of the index was determined by assuming such a trend in its growth as the growth of average GDP income (gross domestic product per capita) for UE28 in 2013–2018 years;
t—year of projection.
The material (morphological) composition of municipal waste generated in large cities in 2020 was taken from our own research. In 2020, the University of Zielona Góra conducted a study of the composition of mixed municipal waste and selectively collected the waste generated in Zielona Góra [2]. There were changes in the morphological composition in the years 2021–2035, taking into account the observed trends resulting from changes in people’s lifestyles and an increase in the level of prosperity and changes in regulations regarding the reduction or elimination of certain products (e.g., disposable plastic items). The implementation of the assumptions of the circular economy, growing environmental awareness, implementation of anti-smog programs and changes in the surface and ways of using green areas in cities and in individual gardens, as well as the development of housing construction, have also been taken into account.
Table 2 presents the adopted forecasted changes in the rates of the selective collection of individual waste components necessary to achieve the required levels of PfR and the recycling of municipal waste. The projected values of selective collection rates for each type of waste for the calculation years 2025, 2030, and 2035, which should be collected separately and sorted before being sent for recycling, were calculated based on the requirements for EU countries in the new Waste Directive (Directive 2018/851) and losses in the sorting process. For paper, plastics, glass, metals, and wood for recycling, a level consistent with that recommended in the Packaging and Packaging Waste and Other Components Directive has been assumed to ensure that by 2025, at least 55% of municipal waste is recycled, in 2030—60%, and in 2035—65%, in accordance with the provisions of the Framework Directive (Table 2—last row). The levels of material losses in the recycling process of individual waste components were assumed to range from 5 to 50% (plastics).
The degree of decomposition of biodegradable substances in the waste composting process was assumed to be equal to:
  • Composting of bio-waste—50%;
  • Methane fermentation of bio-waste—38%, aerobic stabilization of digestate—12%;
  • oxygen stabilization of OFMSW: kitchen and garden waste—50%, paper—15%, and wood and textiles—5%;
  • anaerobic stabilization of OFMSW, kitchen and garden waste—38% and aerobic stabilization of digestate—12%.
The indicators adopted for the calculation of ammonia emissions in wastewater and gases from aerobic and anaerobic waste treatment processes are presented in Table 3. For the calculations, in addition to the amount of effluent from the aerobic treatment of bio-waste, values close to the average values from the range reported in the literature were taken. In the case of bio-waste composting, the maximum value (0.2) from the range of 0.1–0.2 reported in the literature was adopted, and for the aerobic digester stabilization process the lowest value (0.1) was adopted. The duration of the processes was assumed: the stabilization was carried out for a shorter time (2–3 weeks) compared to composting (8–12 weeks).
Mass flow analysis (MFA) of waste and nitrogen in the waste management system was developed using the STAN model (https://www.stan2web.net (accessed on 8 April 2022)). STAN is used to perform a material flow analysis (MFA) according to the Austrian standard ONORM S 2096 (MFA), taking into account data uncertainty. The tool enables the calculation of unknown flows using an integrated balancing approach [24].
STAN is often used to present mass flows regarding waste management [15,25,26,27] enabling the presentation of both flow of waste materials, resulting products, and emissions in a visually clear and transparent manner.

3. Results

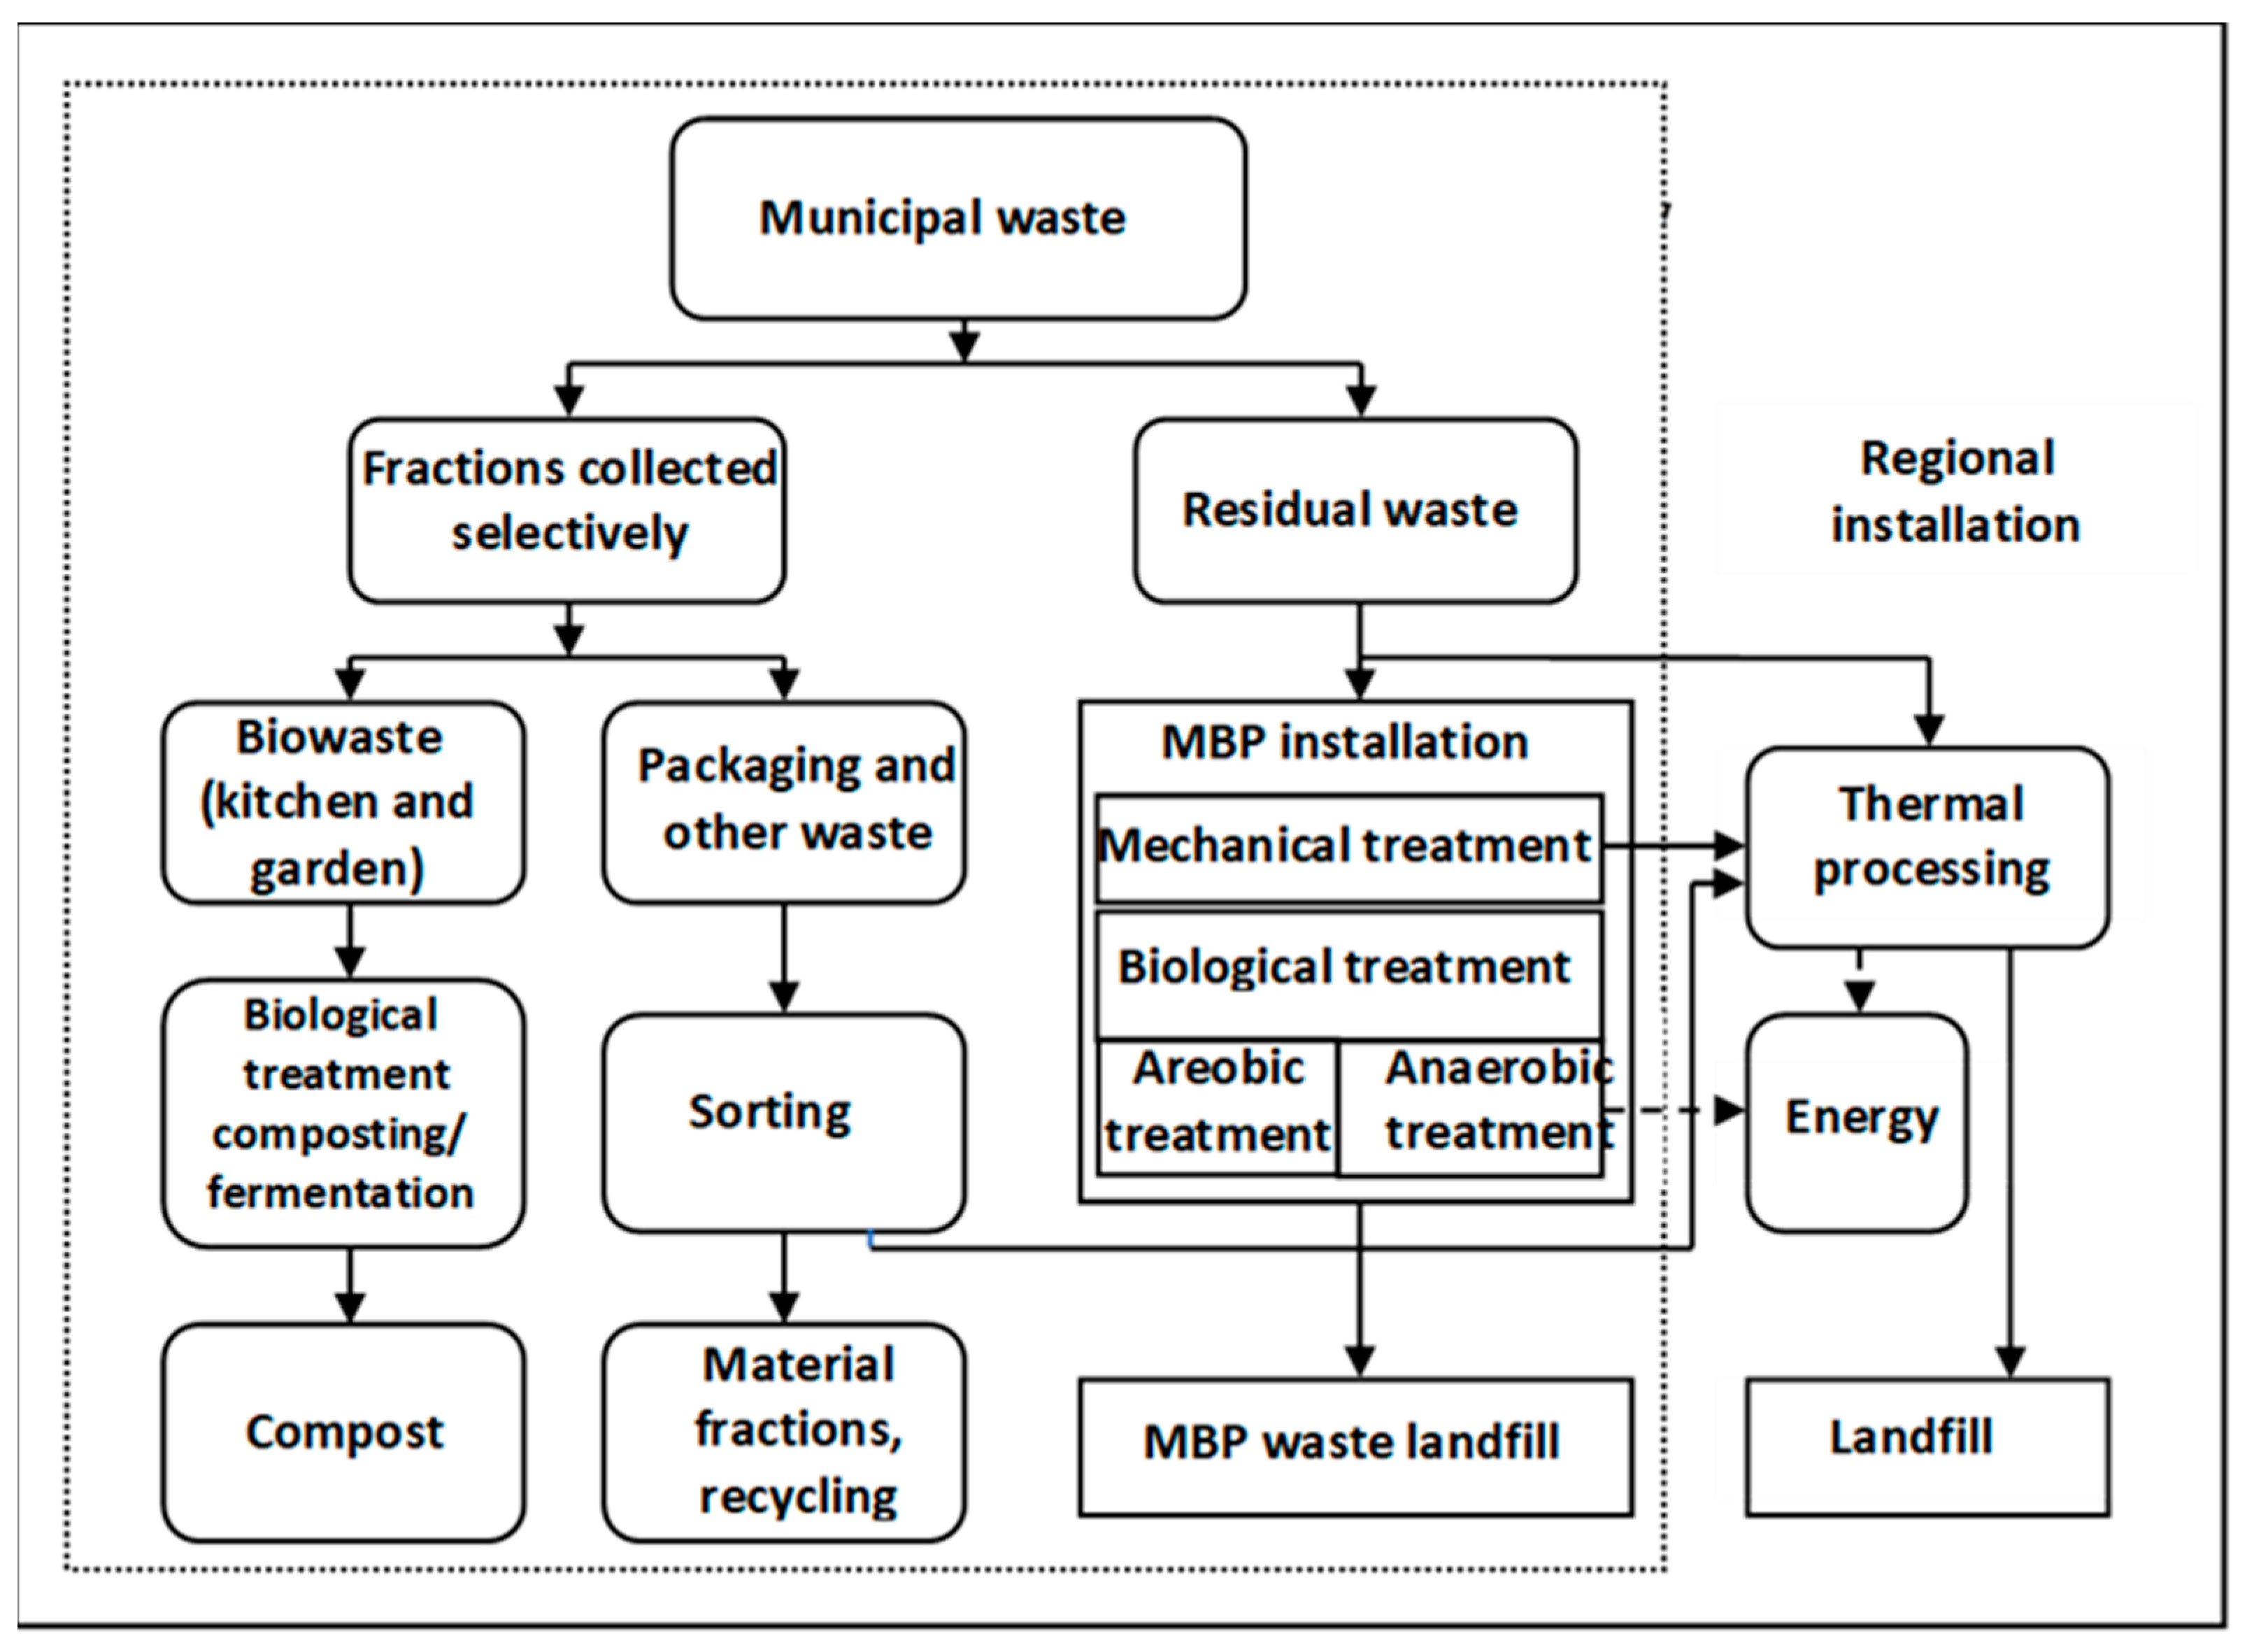
3.1. Analysis of the Flow of Waste Streams in the Waste Management System

The forecast of mass flows of waste and nitrogen in the waste management system is presented in Figure 2 for 2020, 2025, 2030, and 2035 using the STAN tool.
Calculations of mass flows of waste and nitrogen were made for four combinations of biodegradable waste treatment solutions present in municipal waste: CB + COF system:selectively collected bio-waste is composted; the <80 mm fraction, separated from the residual municipal waste in the existing MBT installation (OFMSW), is stabilized in aerobic conditions; CB + ADOF + AS system: selectively collected bio-waste is composted and the OFMSW is stabilized in anaerobic conditions; ADB + AS + COF system: selectively collected bio-waste is processed in anaerobic conditions and the OFMSW is stabilized in aerobic conditions; ADB + AS + ADOF + AS system: selectively collected bio-waste and biofraction are processed in anaerobic conditions.
The diagrams presented above illustrate the beneficial impact of the implementation of the requirements of the Waste Framework Directive on the change in the amount of waste treated in MBT installations in the perspective of 2035, when Poland and EU countries are obliged to recycle 65% of the municipal waste generated.
Mechanical–biological waste processing installations in their current form serve primarily to reduce the mass of stored biodegradable waste and to reduce emissions of pollutants from stored waste, biogas, and leachates.
The product of biological waste processing in the MBT installation, both in aerobic and anaerobic conditions, due to the high content of heavy metals and other pollutants, cannot be treated as a fertilizer that can be used naturally. It is generally disposed of in a landfill. Biological stabilization is intended to ensure that the waste, after being deposited in a landfill, has a low negative impact on the environment.
The implementation of the new Waste Framework Directive will result in a reduction in the amount of waste processed in MBT facilities and, consequently, a reduction in emissions of pollutants (including nitrogen) into the environment. A detailed analysis of these figures is shown in the figures below.
Figure 3 shows changes in the amount of generated municipal waste, selectively collected bio-waste, sorted waste directed to the recycling installation, and residual waste delivered to the MBT installation in the years 2020–2035.
In the analyzed period of fifteen years, the amount of municipal waste generated in cities with a population of 100,000 will increase by about 16%, despite a decrease in the population by over 6%. According to the forecast, the amount of material waste directed to the recycling installation will increase 2.7 times, and the amount of the mass of bio-waste subjected to composting or fermentation will increase by 22% (Figure 2 and Figure 3).
The intensive development of selective waste collection will result in a decrease in the mass of residual waste delivered to the MBT installation. The required capacity of these installations will decrease from 21.5 to 9.0 thousand Mg (close to 2.4 times). The released capacity of the MBT installation should be used, after modernization, for sorting selectively collected raw materials (mechanical part) and for the composting or fermentation of bio-waste (biological part), which is a solution recommended in earlier papers [7,28,29]. It is indicated that the MBT plants will be converted into a material recover and biological treatment (MRBT) plant [30].

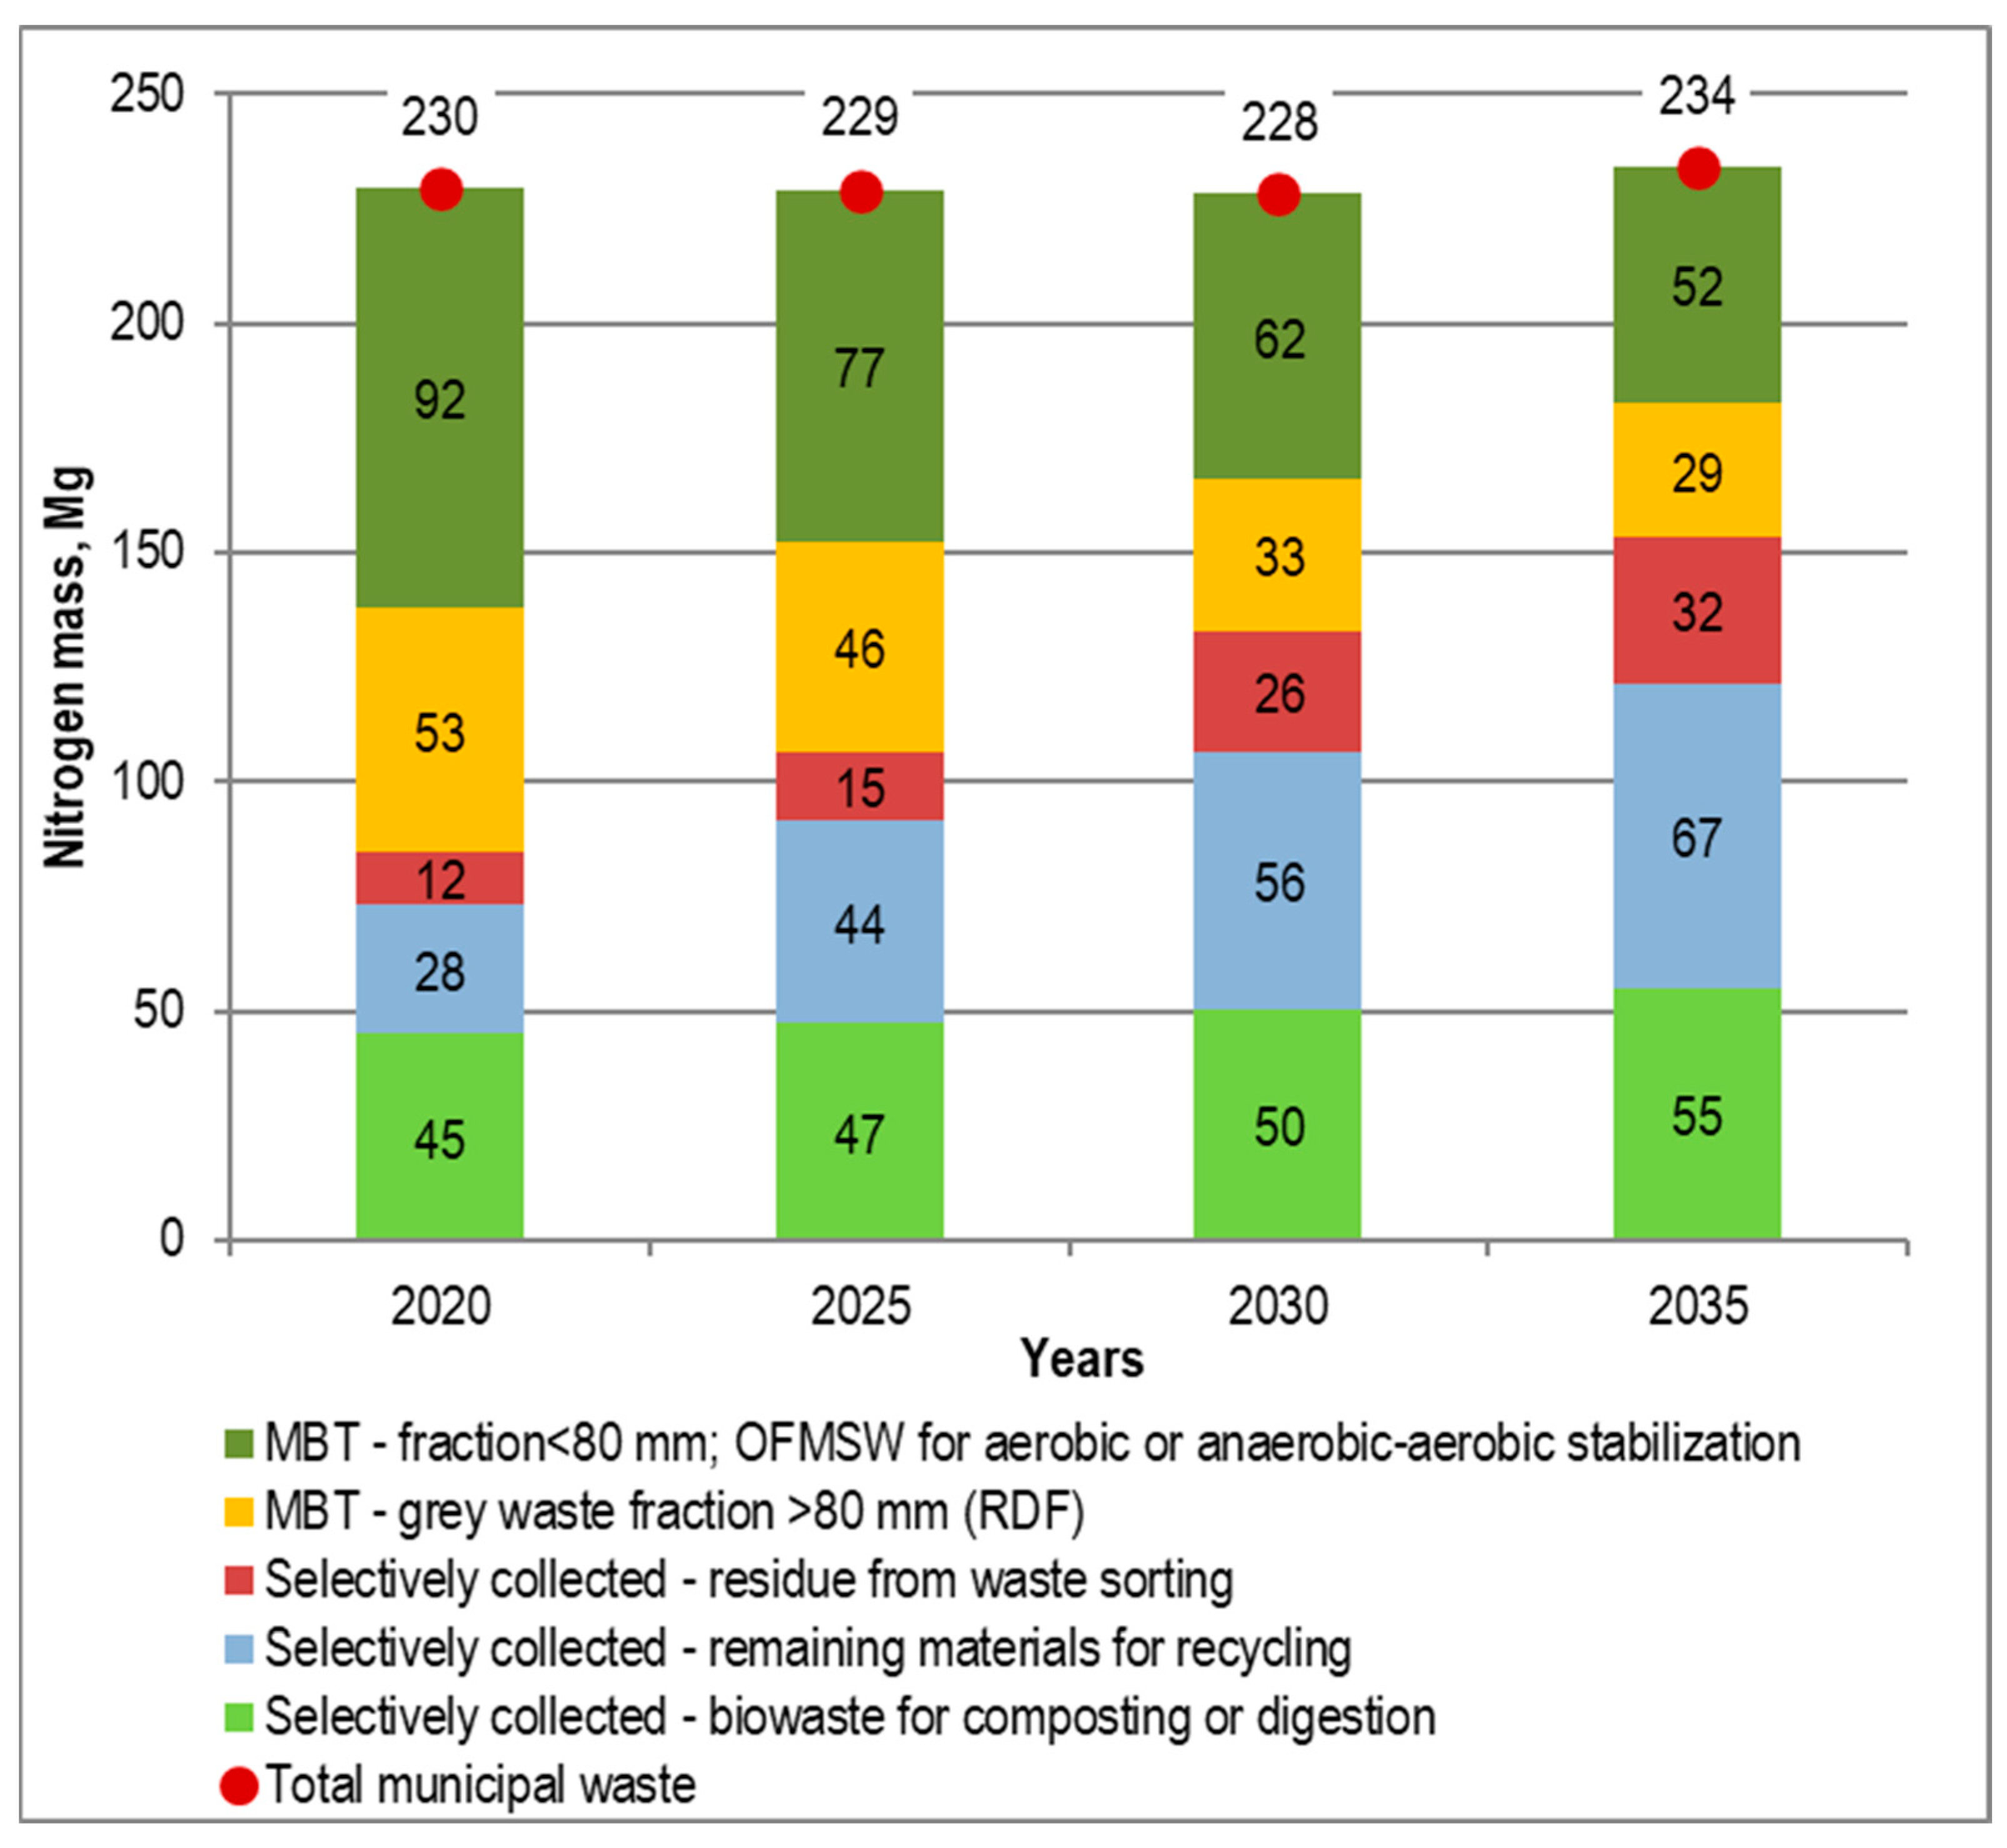
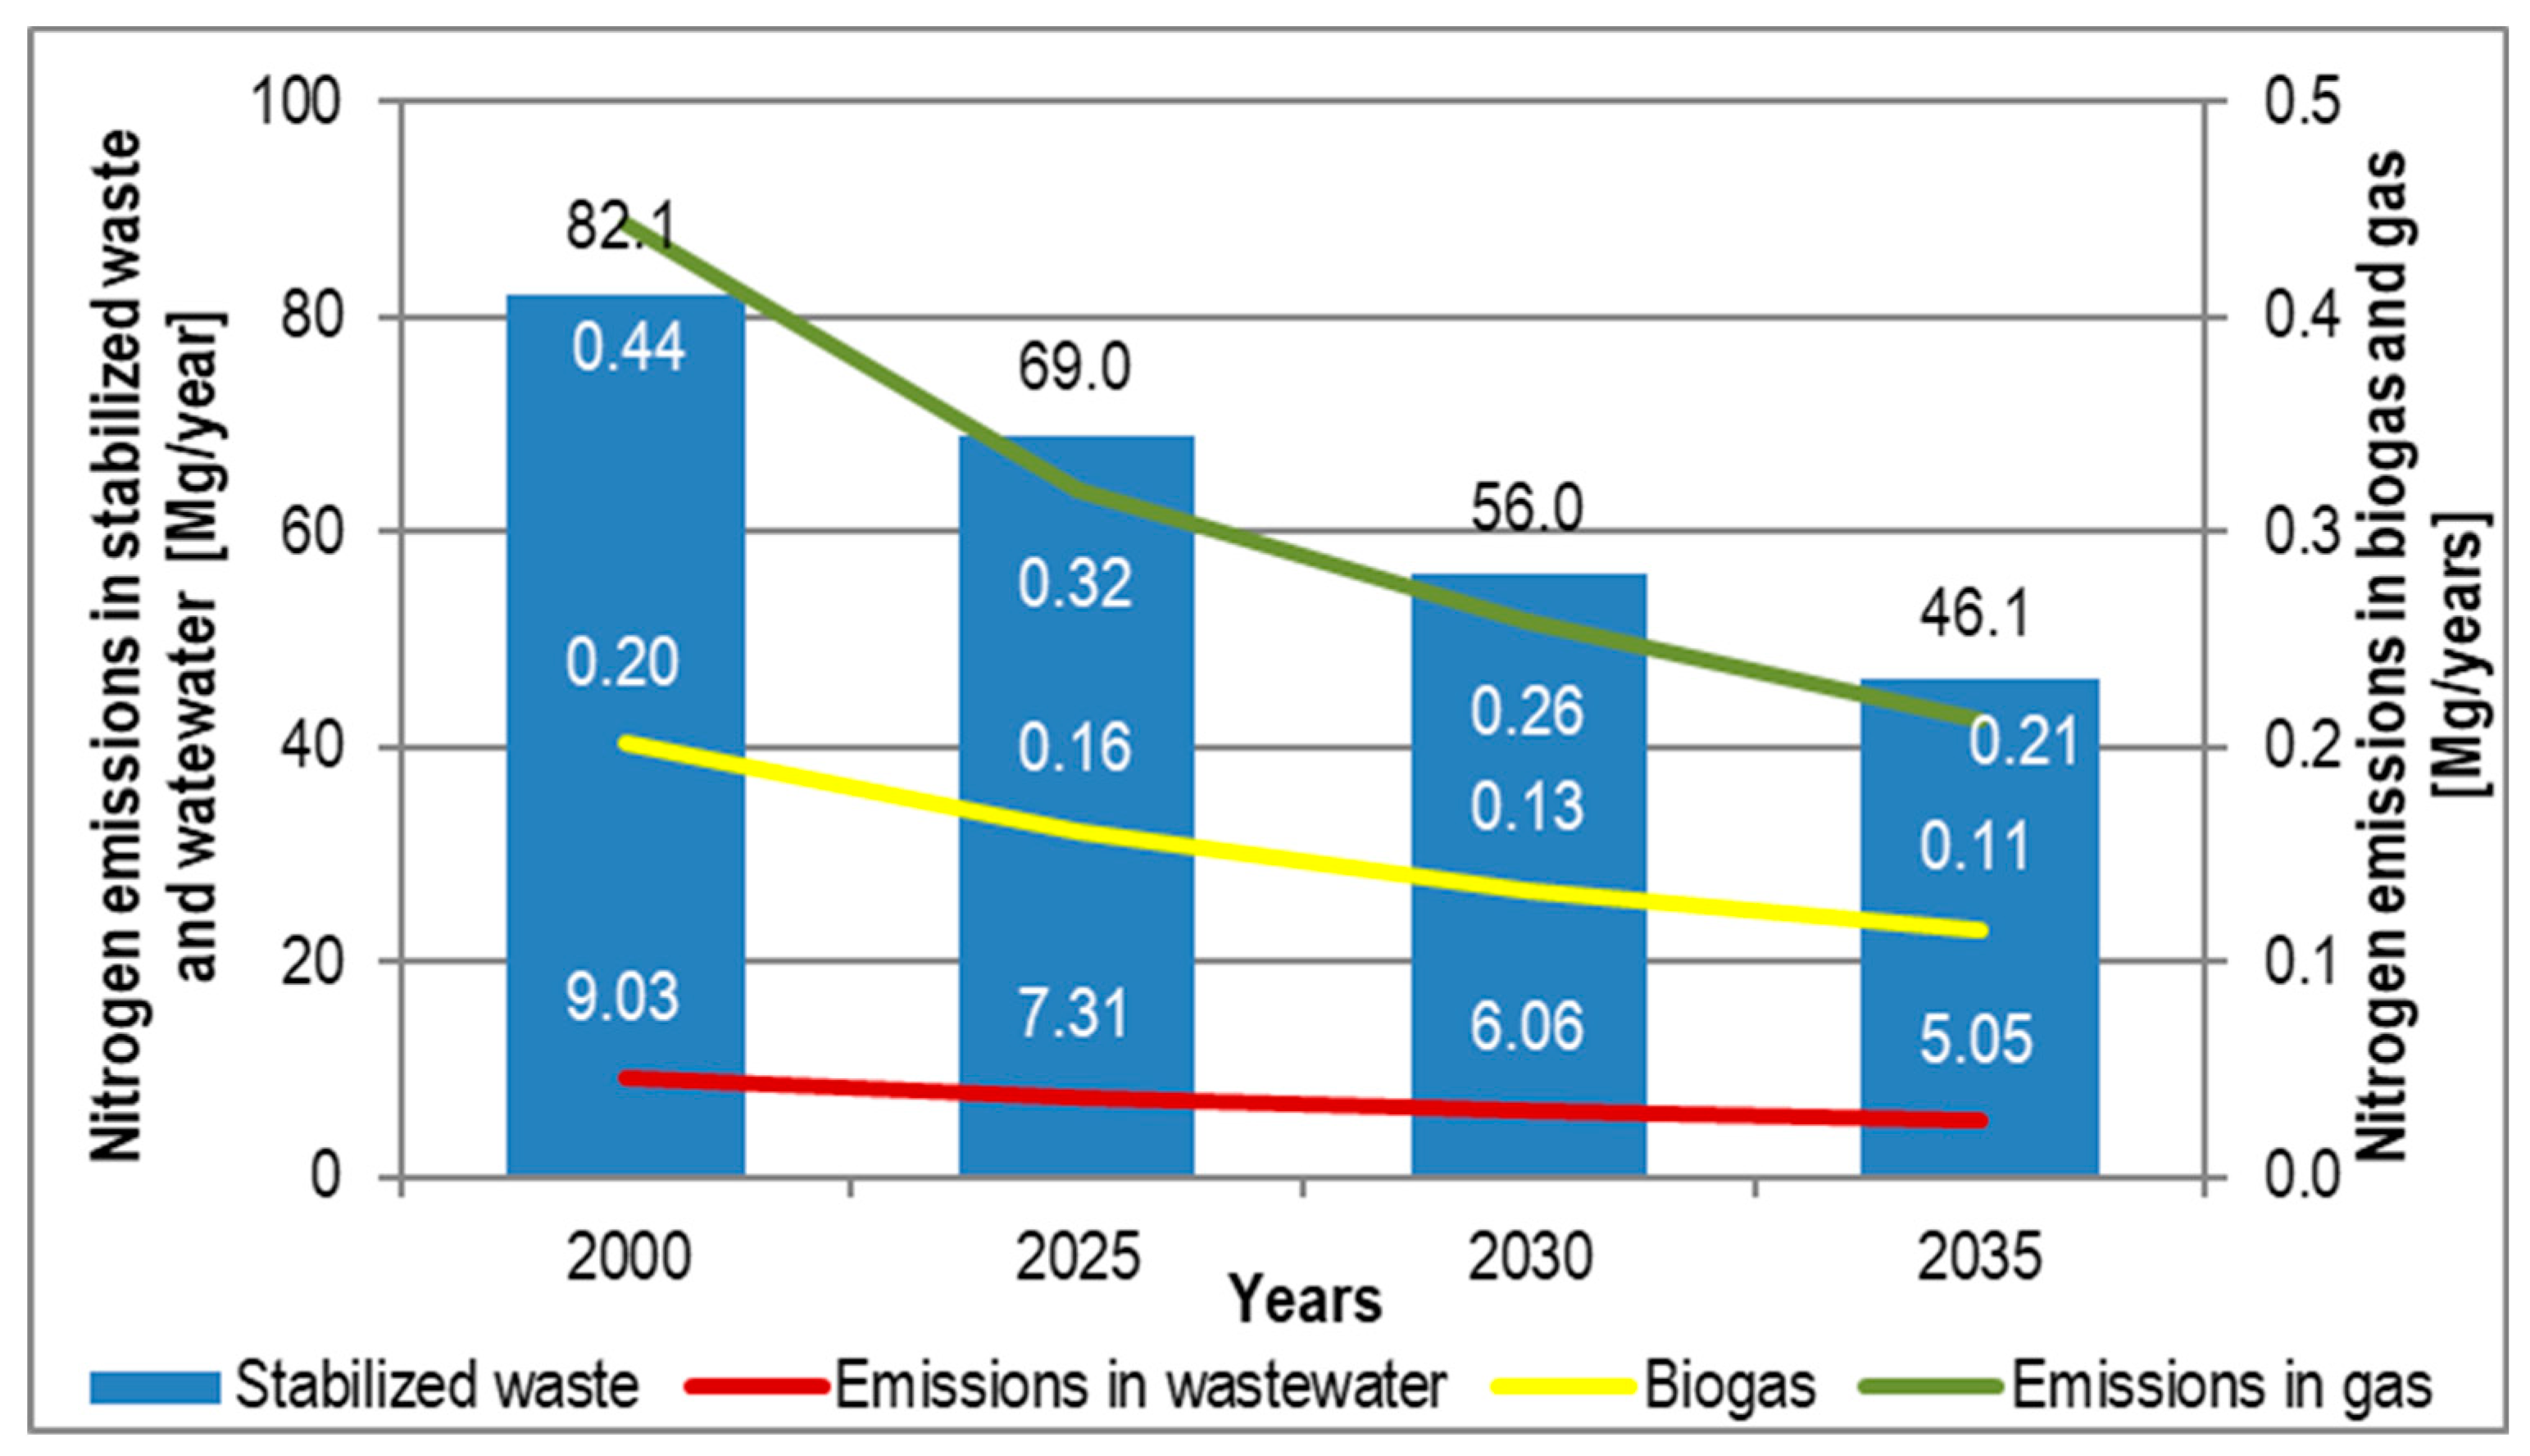
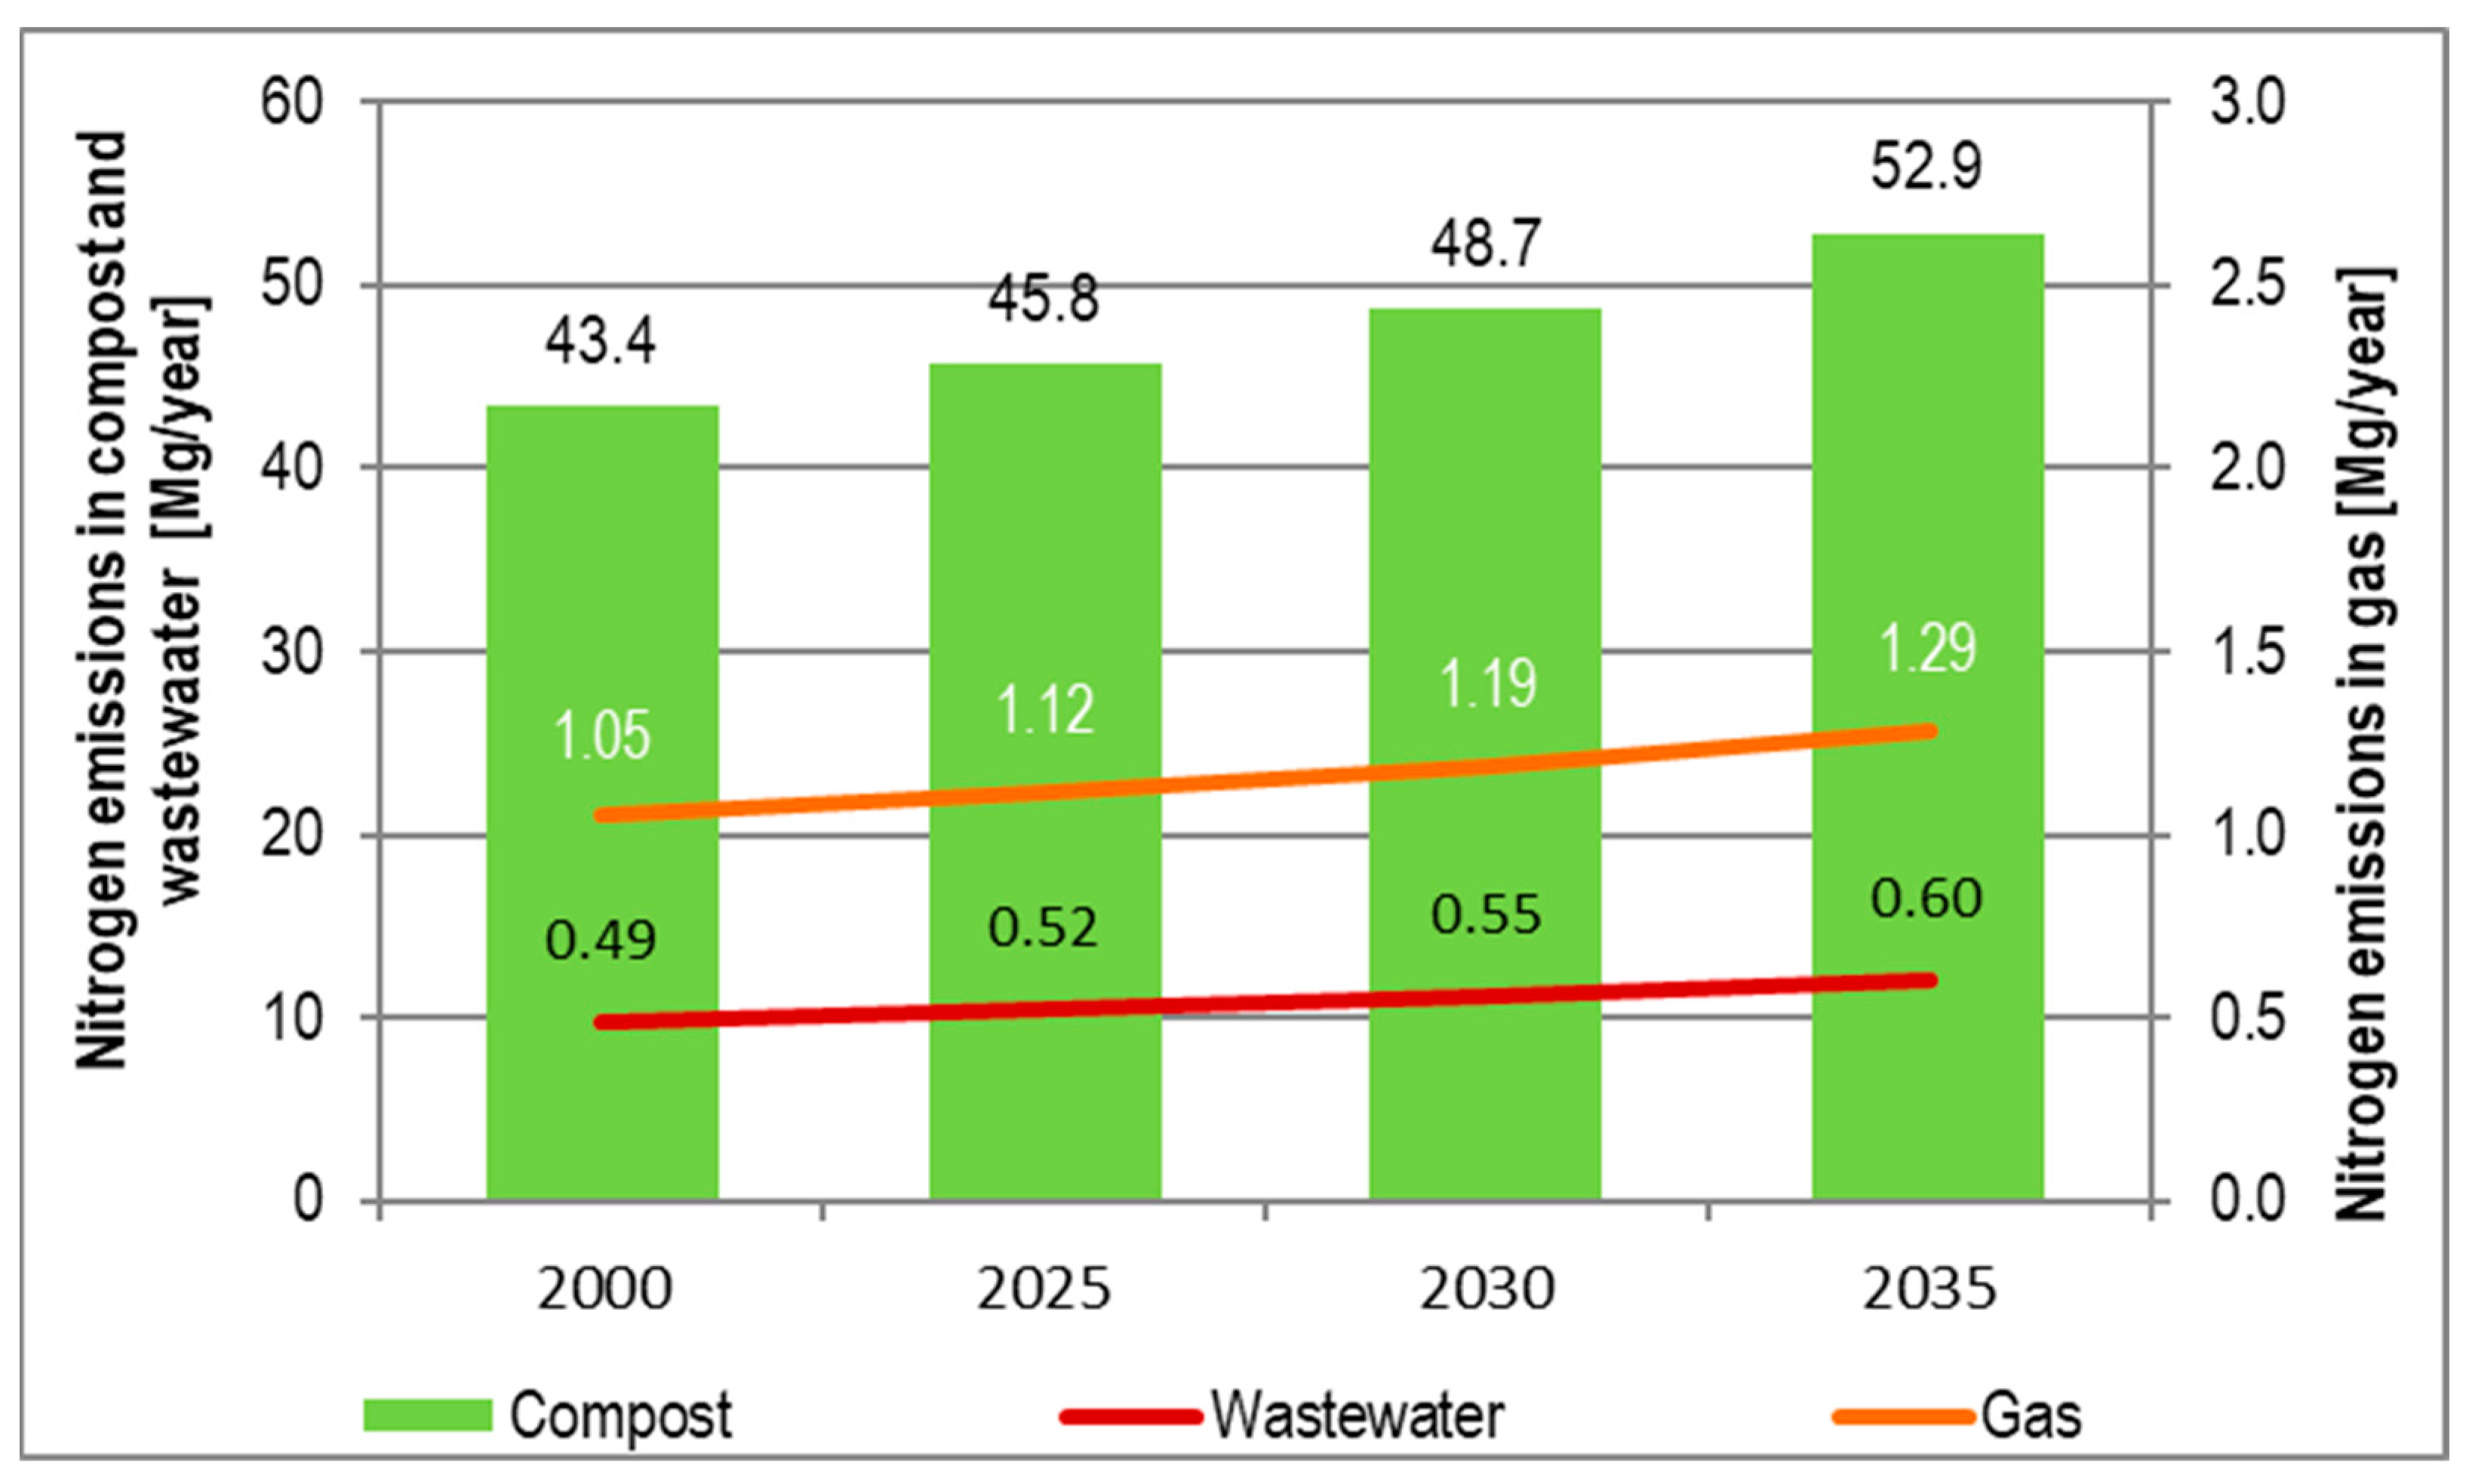
3.2. Nitrogen Flow in Waste Management from 2020 to 2035

Figure 4 shows nitrogen flows in the waste management system.
Nitrogen content in municipal waste generated in cities with populations of 100,000 will increase by 2% in the years 2020–2035, i.e., 8 times less than the increase in the mass of generated municipal waste. This will be a consequence of the decrease in the content of nitrogen-containing waste components in municipal waste, mainly kitchen waste.
In 2020, nitrogen in bio-waste sent for biological processing accounted for 19.6% of the total amount of nitrogen contained in the generated municipal waste. Nitrogen contained in the <80 mm fraction, sent for biostabilization in the MBT installation, accounted for 40% of its content in municipal waste. In 2035, these shares will be 23.4% and 22.0%, respectively.
The total amount of nitrogen contained in selectively collected waste sent for recycling in the years 2021–2035 increased by 22% in bio-waste, and by 137% in material waste, excluding bio-waste (Figure 2).
Figure 5 shows changes in the nitrogen content in the final solid product produced in the process of stabilization of the aerobic fraction < 80 mm in the MBT installation (stabilized waste) and the amount of nitrogen emissions in leachates and gas from this process in the years 2020–2035 (variant COF). Figure 6 shows changes in nitrogen content in the stabilized waste, in wastewater from the dewatering of the fermenter, and from the stage of aerobic stabilization, as well as the amount of emissions in biogas and gas from the process of the aerobic stabilization of the fermenter (variant ADOF + AS).
The analysis of nitrogen flows presented in Diagrams 2–6 shows a successive reduction of nitrogen emissions to the environment from the processing of residual waste in the MBT installation, both in the case of the stabilization of the subscreen fraction in aerobic processing and in anaerobic processing. This is a consequence of a decrease in the mass of waste sent for processing in the MBT installation due to increased levels of selectively collected bio-waste and material waste. In the period from 2020 to 2035, the amount of nitrogen removed in the stabilizer to the landfill decreased from 88.9 to 50.2 Mg/year in aerobic processing and from 88.9 to 49.9 Mg/year in anaerobic processing (by approximately 44%). Nitrogen emission from the process of the aerobic stabilization of residual waste in wastewater decreased from 1.91 to 0.85 MgN/year (by 55%), and in gas from 1.03 to 0.49 MgN/year (by 52%). In anaerobic processing, the nitrogen emission in wastewater from the dewatering of the fermenter decreased from 2.30 to 1.28 MgN/year (by 44%), from 0.20 to 0.11 MgN/year (by 43%) in biogas, from 0.11 to 0.052 MgN/year (by 52%) in the final aerobic treatment of the fermenter, and from 0.44 to 0.21 kgN/year (by 52%) in gas.
Nitrogen flows, in the process of composting selectively collected bio-waste (variant CB), and their fermentation in the stage of aerobic fermentation (variant ADB + AS), are shown in Figure 7 and Figure 8.
In the period from 2020 to 2035, the amount of nitrogen introduced into the soil in compost increases from 41.5 to 50.7 Mg/year, both in the case of bio-waste composting and in the case of anaerobic–aerobic processing (with an increase of 22%). This is a consequence of an increase in the level of the selective collection of bio-waste from 53% to nearly 70%. Nitrogen emissions from bio-waste composting will increase by approximately 22%, both in wastewater (from 2.26 to 2.76 MgN/year) and in gas (from 1.10 to 1.35 MgN/year). In anaerobic processing, nitrogen emissions in wastewater from dewatering the fermenter will increase from 2.90 to 3.54 MgN/year, from 0.25 to 0.30 MgN/year (by 22%) in biogas, from a final aerobic treatment of the fermenter from 0.046 to 0.057 MgN/year in wastewater, and from 0.19 to 0.23 kgN/year (also with an increase of 22%) in gas.

4. Discussion

MBT installations, in their current shape, are primarily used to reduce the mass of landfilled biodegradable waste and to reduce pollutant emissions from landfilled waste, in biogas and leachate [31]. The product of biological waste treatment in the MBT installation, both in aerobic and anaerobic conditions, due to the high content of heavy metals and other pollutants, is not treated as a fertilizer that can be used in nature. It is generally disposed of in a landfill.
The implementation of the provisions of the new waste directive and the implementation of the strategy of recycling at the source or a selective collection of bio-waste from 2023 will change the operation of MBT installations, which will be renamed MRBT (Material recovery and biological treatment plant) installations [30]. These installations will be focused on the recovery of materials from residual waste as well as the use of the infrastructure of the biological part of the existing MBT installations for biological treatment, in addition to the OFMSW fraction, and also of separately collected bio-waste. This will lead to a reduction in pollutant emissions into the environment from these installations, including nitrogen emissions; this is thanks to, among others, the increased material recycling and production of fertilizers or soil improvers, which will be returned to the soil environment.
An unquestionable effect of introducing a closed-loop waste management will be a nearly two-fold reduction in the amount of nitrogen entering the landfill with waste after the MBT process. In the analyzed perspective period of 2020–2035, increasing the separate collection of bio-waste will contribute to an increase in the mass of nitrogen that can be used for land fertilization, in each of the four considered systems, by about 22%.
The amount of nitrogen in compost entering the soil environment in 2035 in the ADB + AS—COF and ADB + AS—ADOF + AS variants will be about 49.6 Mg/year, but will be lower in the CB—ADOF + AS and CB—COF variants by about 6%.
From the variants of the biodegradable waste treatment analyzed in the article, it is possible to choose the ones that are most favorable in terms of economic and environmental aspects for a large city.
Figure 9 compares the amounts of nitrogen contributed to the environment in compost and stabilized waste and Figure 10 compares the amounts of nitrogen emitted in wastewater, gases, and biogas for four combinations of biodegradable waste treatment solutions found in municipal waste for the considered study period of 2020–2035:
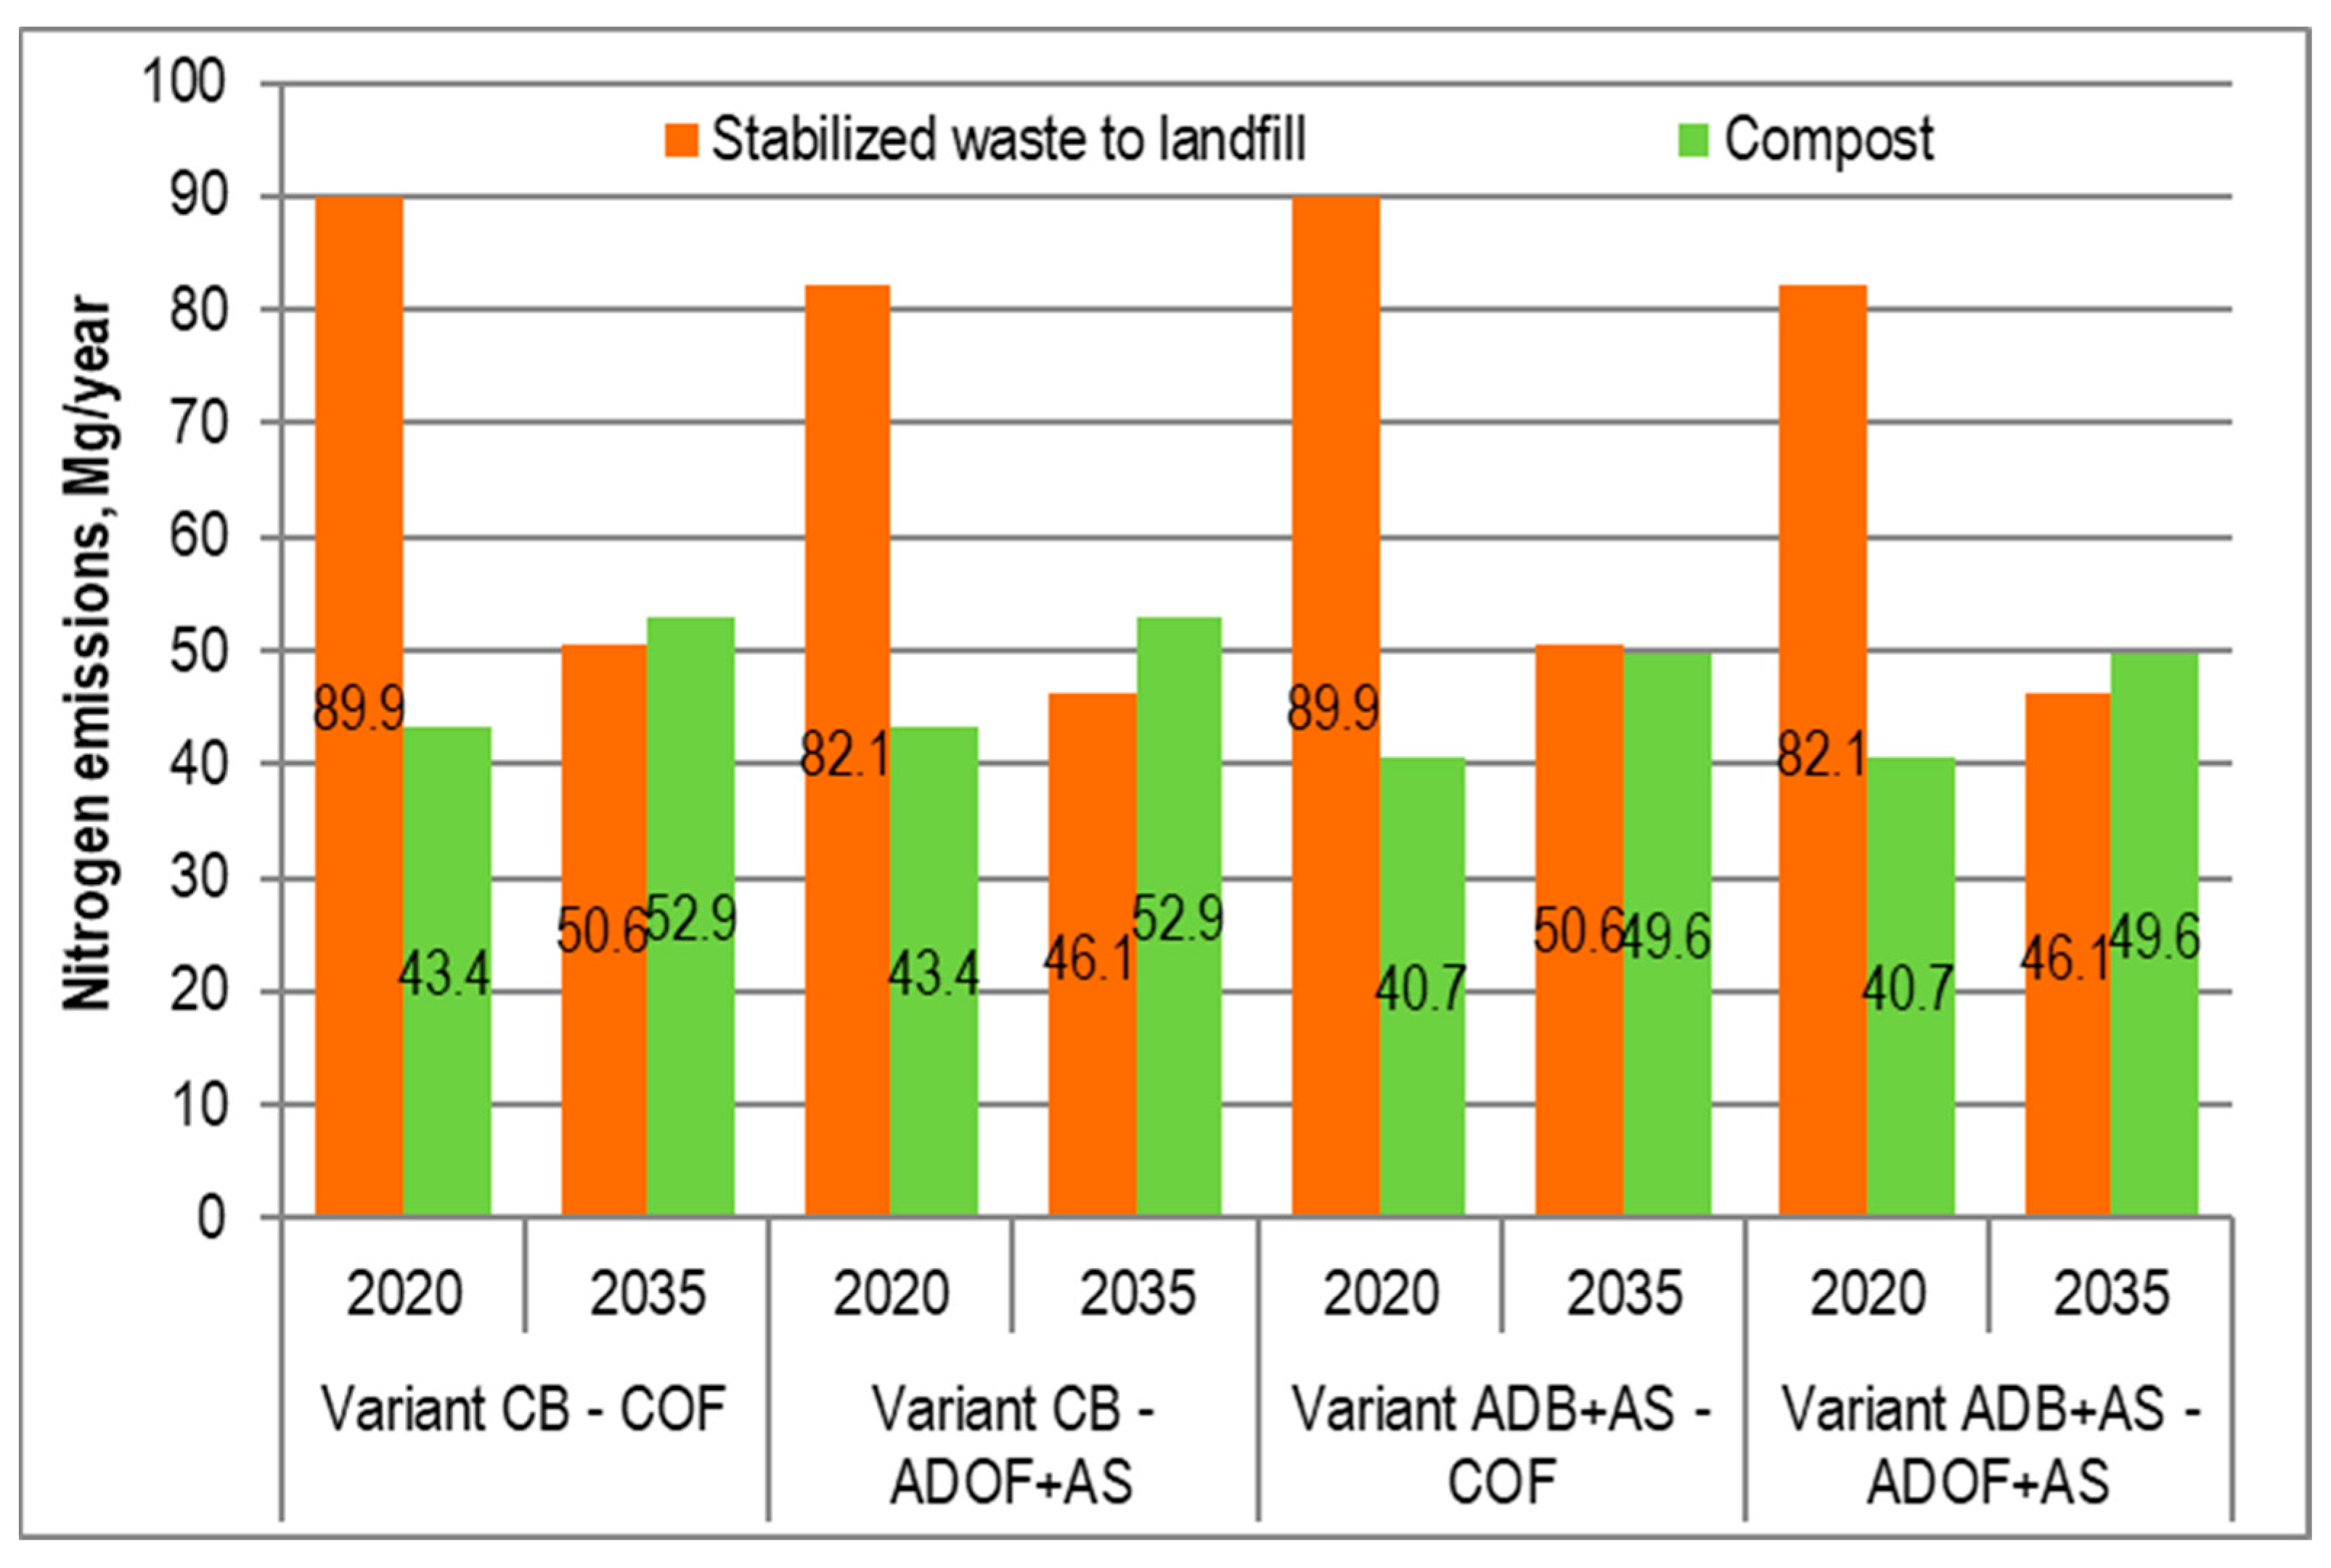
  • CB—COF variant: selectively collected bio-waste is composted, and OFMSW (the <80 mm fraction separated from residual municipal waste in the existing MBT plant), is stabilized under aerobic conditions;
  • CB—ADOF + AS system: selectively collected bio-waste is composted, and OFMSW is stabilized under anaerobic conditions;
  • ADB + AS—COF system: selectively collected bio-waste is treated under anaerobic–oxygen conditions, and OFMSW is stabilized under aerobic conditions;
  • ADB + AS—ADOT + AS system: selectively collected bio-waste and OFMSW are treated under anaerobic–oxygen conditions.
Taking into account the magnitude of nitrogen emissions, the goals of the Waste Directive, and the need to increase the share of obtaining energy from renewable sources, it can be concluded that the most favorable waste management option for the city of one hundred thousand is a system in which both separately collected bio-waste and OFMSW are treated under anaerobic–oxygen conditions (ADB + AS—ADOF + AS variant) (Figure 10). This solution provides the highest biogas production and the lowest nitrogen gas emissions. The disadvantages of the system are the highest nitrogen emissions in the wastewater and the need to rebuild the biological part of existing MBT plants, since in most plants the biological stabilization of waste is currently carried out under aerobic conditions. In such facilities, for economic and technical reasons, it is more favorable to choose the ADB + AS—COF variant, in which selectively collected bio-waste is treated under anaerobic conditions, and OFMSW is stabilized under aerobic conditions in the existing MBT facility. Although biogas production in 2035 will be 27% lower, there will be no need to reconstruct the biological part of the existing MBT plant, and nitrogen emissions in wastewater will be lower by about 50%, and biogas will be lower by 25%.
Variants with methane fermentation are characterized by high nitrogen content in wastewater (Figure 10). A good direction of action in this area is the development of recycling or recovery technologies for nitrogen contained in wastewater [32].

5. Conclusions

  • Taking into account the magnitude of nitrogen emissions, the goals of the Waste Directive and the need to increase the share of obtaining energy from renewable sources, it can be concluded that the most favorable waste management option for the city of one hundred thousand is a system in which both the separately collected bio-waste and OFMSW are treated under anaerobic–aerobic conditions (ADB + AS—ADOF + AS variant).
  • For economic and technical reasons, it is more favorable to choose the ADB + AS—COF variant, in which the selectively collected bio-waste is treated under anaerobic conditions, and OFMSW is stabilized under aerobic conditions in the existing MBT facility. Although biogas production in 2035 will be 27% lower, there will be no need to reconstruct the biological part of the existing MBT plant, and nitrogen emissions in wastewater will be lower by about 50%, and biogas will be lower by 25%.
  • Variants with methane fermentation are characterized by a high nitrogen content in wastewater. A good direction of action in this area is the development of recycling or recovery technologies for nitrogen contained in wastewater.

Supplementary Materials

The following supporting information can be downloaded at: https://www.mdpi.com/article/10.3390/en17010108/s1.

Author Contributions

M.S.-K., Writing—Original Draft, Methodology, Investigation, Validation, and Writing—Reviewing and Editing; A.J., Writing—Original Draft, Methodology, Investigation, Validation, and Writing—Reviewing and Editing. All authors have read and agreed to the published version of the manuscript.

Funding

This research was funded by National science center (NCN, Poland) grant number UMO-2018/29/Z/ST10/02986.

Data Availability Statement

The datasets used and/or analyzed during the current study are available from the corresponding author upon a reasonable request.

Conflicts of Interest

The authors declare no conflict of interest.

References

  1. Yu, K.; Li, S.; Sun, X.; Kang, Y. Maintaining the ratio of hydro soluble carbon and nitrogen within the optimal range to accelerate green waste composting. Waste Manag. 2020, 105, 405–413. [Google Scholar] [CrossRef] [PubMed]
  2. Jędrczak, A. Report on the Composition of Municipal Waste in Zielona Góra in 2020; University of Zielona Góra: Zielona Góra, Poland, 2021. [Google Scholar]
  3. Directive (EU) 2018/851 of the European Parliament and of the Council of 30 May 2018 Amending Directive 2008/98/EC on Waste. Available online: https://www.eea.europa.eu/policy-documents/directive-eu-2018-851-of (accessed on 1 February 2022).
  4. Heo, N.H.; Park, S.C.; Kang, H. Effects of mixture ratio and hydraulic retention time on single-stage anaerobic co-digestion of food waste and waste activated sludge. J. Environ. Sci. Health Part A 2004, 39, 1739–1756. [Google Scholar] [CrossRef] [PubMed]
  5. Adhikari, B.K.; Barrington, S.; Martinez, J. Predicted growth of world urban food waste and methane production. Waste Manag. Res. 2006, 24, 421–433. [Google Scholar] [CrossRef] [PubMed]
  6. Li, R.; Chen, S.; Li, X.; Saifullah Lar, J.; He, Y.; Zhu, B. Anaerobic codigestion of kitchen waste with cattle manure for biogas production. Energy Fuel 2009, 23, 2225–2228. [Google Scholar] [CrossRef]
  7. Jędrczak, A. Properties of the organic fraction directed to biostabilization in MBT installations during the heating season. Civ. Environ. Eng. 2018, 28, 65–78. [Google Scholar] [CrossRef]
  8. Mia, S.; Uddin Md, E.; Kader, M.A.; Ahsan, A.; Mannan, M.A.; Hossain, M.M.; Solaiman, Z.M. Pyrolysis and co-composting of municipal organic waste in Bangladesh: A quantitative estimate of recyclable nutrients, greenhouse gas emissions, and economic benefits. Waste Manag. 2018, 75, 503–513. [Google Scholar] [CrossRef] [PubMed]
  9. Zhou, Z.; Tang, Y.; Dong, J.; Chi, Y.; Ni, M.; Li, N.; Zhang, Y. Environmental performance evolution of municipal solid waste management by life cycle assessment in Hangzhou, China. J. Environ. Manag. 2018, 227, 23–33. [Google Scholar] [CrossRef]
  10. Parnaudeau, V.; Génermont, S.; Hénault, C.; Farrugia, A.; Robert, P. Nicolardot. Measured and Simulated Nitrogen Fluxes after Field Application of Food-Processing and Municipal Organic Wastes. J. Environ. Qual. 2009, 38, 268–280. [Google Scholar] [CrossRef]
  11. Suddick, E.C.; Whitney, P.; Townsend, A.R.; Davidson, E.A. The role of nitrogen in climate change and the impacts of nitrogen–climate interactions in the United States: Foreword to thematic issue. Biogeochemistry 2013, 114, 1–10. [Google Scholar] [CrossRef]
  12. Barton, P.K.; Atwater, J.W. Nitrous Oxide Emissions and the Anthropogenic Nitrogen in Wastewater and Solid Waste. J. Environ. Eng. 2002, 128, 138–147. [Google Scholar] [CrossRef]
  13. Beck-Friis, B.; Smårs, S.; Jönsson, H.; Kirchmann, H. Gaseous Emissions of Carbon Dioxide, Ammonia and Nitrous Oxide from Organic Household Waste in a Compost Reactor under Different Temperature Regimes. J. Agric. Eng. Res. 2001, 78, 423–430. [Google Scholar] [CrossRef]
  14. SP, 2021: Environment 2021. Available online: https://stat.gov.pl/en/topics/environment-energy/environment/environment-2021,8,4.html (accessed on 23 August 2022).
  15. Markic, D.N.; Carapina, H.S.; Bjelic, D.; Bjelic, L.S.; Ilic, P.; Pesic, Z.S.; Kikanovicz, O. Using Material Flow Analysis for Waste Management Planning. Pol. J. Environ. Stud. 2019, 28, 255–265. [Google Scholar] [CrossRef] [PubMed]
  16. SP 2022: Municipal Population Forecast for 2017–2030 (Experimental Study). Available online: https://stat.gov.pl/obszary-tematyczne/ludnosc/prognoza-ludnosci/prognoza-ludnosci-gmin-na-lata-2017-2030-opracowanie-eksperymentalne,10,1.html (accessed on 23 August 2022).
  17. Department for Environment, Food & Rural Affairs. Review of Environmental and Health Effects of Waste Management: Municipal Solid Waste and Similar Wastes, DEFRA, London. 2004. Available online: https://www.gov.uk/government/publications/review-of-environmental-and-health-effects-of-waste-management-municipal-solid-waste-and-similar-wastes (accessed on 1 January 2021).
  18. Thomé-Kozmiensky, K.J. Biologische Abfallbehandlung; EF-Verlag für Energie-und Umwelttechnik: Berlin, Germany, 1995. [Google Scholar]
  19. Loll, U. Sickerwasser aus Kompostierungs-und Anaerobanlagen. Entsorg. Prax. 2006, 7–8, 52–58. [Google Scholar]
  20. Phong, N.T. Greenhouse Gas Emissions from Composting and Anaerobic Digestion Plants. Inaugural Dissertation. Institut für Nutzpflanzenwissenschaften und Ressourcenschutz (INRES) Lehr-und Forschungsbereich Pflanzenernährung der Rheinischen Friedrich-Wilhelms-Universität zu Bonn. 2012. Available online: https://d-nb.info/104305586X/34 (accessed on 1 March 2021).
  21. Smet, E.; Van Langenhove, H.; De Bo, I. The emission of volatile compounds during the aerobic and the combined anaerobic/aerobic composting biowaste. Atmos. Environ. 1999, 33, 1295–1303. [Google Scholar] [CrossRef]
  22. Doedens, H. Emissionen aus der Mechanisch-Biologischen Abfallbehandlung, w: Müll-Handbuch; Springer: Berlin/Heidelberg, Germany, 2002; Volume 9, pp. 1–23. [Google Scholar]
  23. European Commission. Integrated Pollution Prevention and Control Reference Document on Best Available Techniques for the Waste Treatments Industries; European Commission: Luxembourg, 2006. [Google Scholar]
  24. Cencic, O.; Rechberger, H. Material Flow Analysis with Software STAN. J. Environ. Eng. Manag. 2008, 18, 3–7. [Google Scholar]
  25. Tang, J.; Brunner, P.H. Globalising MFA-Decision Support for Waste Management in Cities Based on the Software STAN; International Solid Waste Association (ISWA): Rotterdam, The Netherlands, 2014. [Google Scholar]
  26. Allesch, A.; Brunner, P.H. Material Flow Analysis as a Tool to Improve Waste Management Systems: The Case of Austria. Environ. Sci. Technol. 2017, 51, 540–551. [Google Scholar] [CrossRef]
  27. Thushari, I.; Vicheanteab, J.; Janjaroen, D. Material flow analysis and life cycle assessment of solid waste management in urban green areas, Thailand. Sustain. Environ. Res. 2020, 30, 21. [Google Scholar] [CrossRef]
  28. Den Boer, E.; den Boer, J.; Jager, J. Planowanie i Optymalizacja Gospodarki Odpadami. In Podręcznik Prognozowania Ilości i Jakości Odpadów Komunalnych Oraz Oceny Zgodności Systemów Gospodarki Odpadami z Zasadami Zrównoważonego Rozwoju; PZITS Oddz: Wrocław, Poland, 2005. [Google Scholar]
  29. Połomka, J.; Jędrczak, A. Efficiency of waste processing in the MBT system. Waste Manag. 2019, 96, 9–14. [Google Scholar] [CrossRef]
  30. Favoino, E. Building a bridge strategy for residual waste. Material recovery and biological treatment to manage residua waste within a circular economy. Policy Brief 2020. Available online: https://majorprojects.planningportal.nsw.gov.au/prweb/PRRestService/mp/01/getContent?AttachRef=SUB-11169426%2120201116T062622.468%20GMT (accessed on 1 March 2021).
  31. Münnich, K.; Mahler, C.F.; Fricke, K. Pilot project of mechanical-biological treatment of waste in Brazil. Waste Manag. 2006, 26, 150–157. [Google Scholar] [CrossRef]
  32. Righetto, I.; Al-Juboori, R.A.; Kaljunen, J.U.; Huynh, N.; Mikola, A. Nitrogen Recovery from Landfill Leachate Using Lab- and Pilot-Scale Membrane Contactors: Research into Fouling Development and Membrane Characterization Effects. Membranes 2022, 12, 837. [Google Scholar] [CrossRef] [PubMed]
Figure 1. Waste management scheme.
Energies 17 00108 g001
Figure 2. Analysis of mass flows of waste and nitrogen in the waste management system: (a)—for 2020, (b)—for 2025, (c)—for 2030, and (d)—for 2035. Export 1: CB + COF; Export 2: CB + ADOF + AS; Export 3: ADB + AS+ COF; Export 4: ADB + AS+ ADOF + AS.
Energies 17 00108 g002aEnergies 17 00108 g002bEnergies 17 00108 g002cEnergies 17 00108 g002d
Figure 3. Changes in the amount of generated municipal waste, selectively collected bio-waste, sorted waste directed to the recycling installation, and waste remaining for mechanical and biological treatment in the years 2020–2035.
Energies 17 00108 g003
Figure 4. Nitrogen flows in the waste management system in the years 2020–2035.
Energies 17 00108 g004
Figure 5. Changes in nitrogen content in the stabilized waste after the process of stabilization of the aerobic fraction < 80 mm in the MBT installation and in nitrogen emissions in sewage and gas, in the years 2020–2035 (variant COF).
Energies 17 00108 g005
Figure 6. Changes in the nitrogen content of the stabilizer in the process of anaerobic stabilization in MBT and nitrogen emissions in wastewater, biogas, and gas from the aerobic stage, in the years 2020–2035 (variant ADOF + AS).
Energies 17 00108 g006
Figure 7. Nitrogen emissions from composting processing (CB) of bio-waste in 2020–2035 (variant CB).
Energies 17 00108 g007
Figure 8. Nitrogen emissions from aerobic fermentation of bio-waste in 2020–2035 (variant ADB + AS).
Energies 17 00108 g008
Figure 9. Nitrogen emissions to the environment from stabilized waste directed to landfill from compost.
Energies 17 00108 g009
Figure 10. Amounts of nitrogen emitted in sewage, gases, and biogas.
Energies 17 00108 g010
Table 1. Moisture content and content of organic substances and total nitrogen in the mass of components of mixed municipal waste.
ParameterParticipation of the Component in the Mass of MSW [2]Generation Rate per Capita [2]Selective Collection Levels [14]Moisture [15]Ignition Losses [15]Total Nitrogen [15]
%kg/(PE·Year)%%% DM% DM
Kitchen waste21.886.337.355871.7
Garden waste11.646.072.857841.2
Paper and cardboard15.360.333.738870.2
Multi-material packaging1.45.714.725912.5
Plastics15.059.123.515950
Glass9.738.343.7530
Metal2.18.312.810100
Clothing. textiles3.011.70.730853.6
Wood0.62.50.120900.2
Hazardous waste0.20.731.425500.2
Mineral waste. including the ash fraction4.216.815.144466.3
Mineral waste1.66.341.91050
Other7.429.125.22030.00.5
Bulky waste6.124.160.01050.00.8
Municipal waste100.0395.036.932.963.30.87
Data from 2020.
Table 2. Assumed and projected changes in the rates of selective collection of individual waste components necessary to achieve the required levels PfR and recycling of municipal waste.
ParameterRatio Values in Years, in [%]
2020 *202520302035
Kitchen waste40.544.449.254.7
Green waste76.684.289.594.7
Paper and cardboard37.483.394.494.4
Multi-material packaging18.437.556.362.5
Plastics39.283.391.791.7
Glass48.677.883.383.3
Metal13.573.784.284.2
Clothing. Textiles0.817.629.435.3
Wood0.227.833.333.3
Hazardous waste36.958.870.682.4
Mineral waste. including the ash fraction8.925.031.337.5
Mineral waste34.576.984.692.3
Other38.853.861.584.6
Bulky waste100.0100.0100.0100.0
Achieved level of PfR and MSW recycling36.255.061.465.1
* Values achieved in Zielona Góra in 2020.
Table 3. Ammonia emission factors in wastewater and gases from aerobic and anaerobic waste treatment processes.
ProcessBio-Waste TreatmentOFMSW Treatment in the MBT Installation
The Amount of Sewage
[m3/Mg]
Concentration of NH3
[gN/m3]
NH3 Emissions in Sewage [kgN/Mg]Emission in Gases [kgN/Mg]The Amount of Sewage
[m3/Mg]
Concentration of NH3
[gN/m3]
NH3 Emissions in Sewage [kgN/Mg]Emission in Gases [kgN/Mg]
Composting0.1–0.2 [17]100–633 [18]
209–470 [19]
-0.052–
0.576 [20] 0.152 [21]
0.26–0.47 [22]
0.26 [17]
70–875 [18]
60–125 [19]
0.160 [17]0.300–1.00 [22]
0.12 [23]
Parameters adopted for the calculations0.23500.0700.150.302500.0750.12
Methane fermentationBiogas---0.05 *---0.04 *
Digestate dewatering-560–1490 [19]---560–1490 [19]--
Parameters adopted for the calculations-800---800--
Aerobic stabilization of the digestate--0.0073 [17]
−0.16 [23]
0.041 [21] -0.0073 [17]
−0.16 [23]
0.041 [21]
Parameters adopted for the calculations0.12500.0250.0410.12500.0250.041
* The assumed NH3 concentration in biogas was 250 mgN/m3.
Disclaimer/Publisher’s Note: The statements, opinions and data contained in all publications are solely those of the individual author(s) and contributor(s) and not of MDPI and/or the editor(s). MDPI and/or the editor(s) disclaim responsibility for any injury to people or property resulting from any ideas, methods, instructions or products referred to in the content.

