Article

Research on Wake Field Characteristics and Support Structure Interference of Horizontal Axis Tidal Stream Turbine

1
College of Water Conservancy and Hydropower Engineering, Hohai University, No. 1 Xikang Road, Nanjing 210098, China
2
College of Energy and Electrical Engineering, Hohai University, Nanjing 210098, China
3
Huaishu New River Management Office of Jiangsu Province, Huaian 223001, China
4
Luoyun Water Conservancy Project Management Divison in Jiangsu Province, Suqian 223800, China
*
Author to whom correspondence should be addressed.
Energies 2023, 16(9), 3891; https://doi.org/10.3390/en16093891
Submission received: 24 March 2023 / Revised: 24 April 2023 / Accepted: 3 May 2023 / Published: 4 May 2023
(This article belongs to the Special Issue Recent Advances in Wind Farms)

Abstract

:
The harnessing and utilization of tidal current energy have emerged as prominent topics in scientific inquiry, due to their vast untapped resource potential, leading to numerous investigations into the efficacy of hydrokinetic turbines under various operational conditions. This paper delineates the wake field characteristics and performance of horizontal axis tidal stream turbines under the influence of support structures, using a comprehensively blade-resolved computational fluid dynamics (CFDs) model that employs Reynolds-averaged Navier–Stokes (RANS) equations in combination with the RNG k-ε turbulence model. To achieve this, the study utilized experimental tank tests and numerical simulations to investigate the distribution characteristics and recuperative principles of the turbine’s wake field. The velocity distribution and energy augmentation coefficient of the wake field showed strong agreement with the experimental results. To further assess the effect of support structures on the flow field downstream of the unit and its performance, the hydrodynamic attributes of the turbine wake field were analyzed with and without support structures. The interference elicited by the support structure modified the velocity distribution of the near-wake flow field, resulting in a 4.41% decrease in the turbine’s power coefficient (Cp), significantly impacting the turbine’s instantaneous performance.

1. Introduction

In recent times, the development and implementation of tidal current energy have emerged as critical components of energy strategy, significantly contributing to sustainable economic and social development; alleviating energy scarcity in coastal regions, especially on islands; and safeguarding the ecological environment [1]. The horizontal axis tidal stream turbine represents the most prevalent form of tidal energy conversion devices, with the hydrodynamic properties and flow characteristics of the trailing wake field attracting considerable academic interest in recent years [2,3,4,5,6]. To optimize the harnessing of oceanic energy, an array of turbines must be deployed; however, numerous uncertainties remain. For instance, the hydrodynamic attributes of the trailing wake field and flow characteristics exert considerable impact on the fatigue load of downstream turbines, as well as the spacing configurations and efficiency of tidal energy turbine arrays.
Contemporary tidal current trends [7] have stimulated a surge in theoretical, numerical [8], and experimental investigations [9,10,11] into hydrodynamic energy devices. Nevertheless, the majority of extant research on three-dimensional numerical simulations concentrates on steady-state calculations, resulting in a relatively sparse body of literature addressing the transient effects of support interference. The axial force, peak static pressure, torque, and power of turbine blades increase with rising flow velocity [12], exhibiting a robust correlation between torque coefficient fluctuations and vortex generation in the blades [13,14]. Optimal energy utilization is attained within arrays exhibiting both lateral and longitudinal spacing in the proximal wake region, while downstream distances produce disordered wake trajectories, diminishing energy utilization by subsequent turbines [15]. The degree of inter-turbine interference and blockage effects critically impacts turbine performance [16]. Consequently, a turbine’s power and thrust output may decline when positioned in the wake of an upstream turbine (at a distance less than the centerline diameter) [17].
Moreover, the support structure significantly affects the overall resistance within the channel, consequently diminishing the total fluid flow through the turbine and reducing power generation by up to 40% [18]. Evidence indicates that flow recovery in the wake of the support structure accelerates in the presence of waves [19]. Subhash Muchala’s study utilizes a blade-resolved CFD model to investigate tidal turbine performance with cylindrical and elliptical support structures, finding that the cylindrical support results in higher integrated rotor force coefficients and a greater impact on the wake velocity compared to the elliptical support [20]. The research of A. Mason-Jones examines the interaction between a turbine and various stanchion geometries, revealing that hydrofoil and elliptical cross sections produce the least downstream disturbance, while square and diamond cross sections result in significant power reduction due to hydrodynamic interactions [21]. Zia Ur Rehman’s study investigates the impact of varying tower diameters on the performance and wake of Tidal Current Turbines using Computational Fluid Dynamics simulations, revealing an optimal tower diameter for maximizing the coefficients of both performance and thrust [22].
Consequently, the manuscript also explores the influence of the support structure on wake field distribution, hydrodynamic properties, and transient performance. The remainder of the paper is structured as follows: Section 2 describes the experimental setup and measurements; Section 3 introduces the numerical model; Section 4 presents the in situ assessment results of the employed anti-fouling coatings; Section 4 encompasses the analysis and discourse of numerical and experimental findings; and Section 5 summarizes the conclusions.

2. Experimental Setup and Measurement

The experiment took place in a large wave flume located in the Harbor and Navigation Hydrodynamics Laboratory of Shandong Jiaotong University. The laboratory’s wave flume measures 1.2 m in width, 50 m in length, and 1.4 m in height. The turbine has a diameter (D) of 0.3 m and a turbulence intensity of 0.07. Flow measurements were acquired both upstream and downstream of the turbine (in the X direction) across 17 Y–Z sections (ranging from 1.5 to 18 D), covering −1.2 to 1.2 D along the Z-axis and 0.8 to −1 D along the Y-axis, with an interval of 0.1 D between measurements, as illustrated in Figure 1.
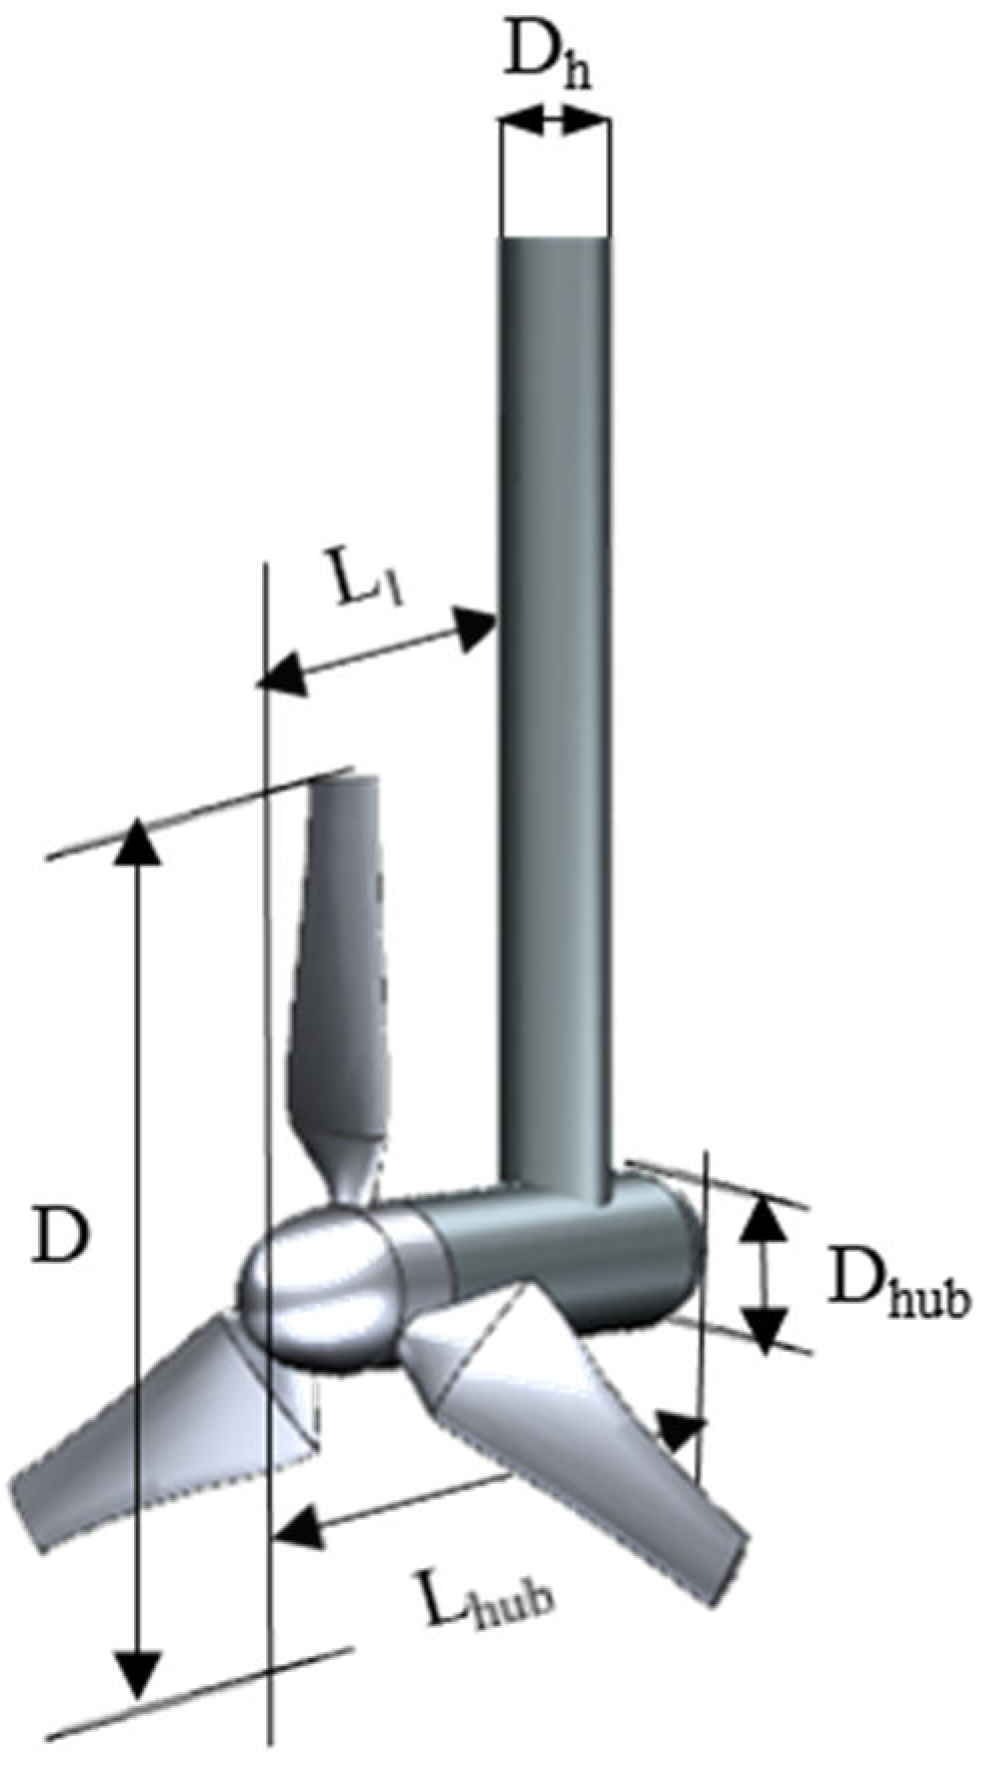
The model turbine’s blades are predicated on a three-blade design developed by Hohai University, employing the NREL-S822 [5,23] airfoil and constructed from a 6061 aluminum alloy. The runner’s diameter is D = 300 mm, the support structure’s diameter is Dh = 36 mm, the hub’s diameter is Dhub = 50 mm, and the hub’s length is Lhub = 100 mm. The distance between the support structure and the runner’s center is L1 = 60 mm. With a tip speed ratio of 3.9 and a designed flow velocity of 0.4 m/s, the experimental water depth measures 0.6 m, and the runner’s center is situated 0.3 m above the tank’s floor. The hydraulic turbine experimental model’s structural components are depicted in Figure 2.
Sink velocity was determined using a miniature Nortek Acoustic Doppler Velocimeter (ADV), boasting a measurement accuracy of mm/s + 1 (+0.5%). To guarantee data reliability, the ADV’s experimental sampling frequency was set at 200 Hz, with a sampling duration of 180 s. Maintaining a signal-to-noise ratio exceeding 16 dB and a correlation above 80% facilitated the capture of transient velocity characteristics. The ADV, affixed to a sliding track above the flume, could traverse the flume’s width and depth, measuring flow velocities at various positions. The installation schematic is presented in Figure 3.

3. Numerical Model

The fundamental equations of the computational fluid dynamics (CFDs) theory encompass the conservation equations for mass, momentum, and energy. In the experimental setting, both the temperature of the tidal stream and the water turbine display negligible short-term variations, leading to the assumption of no heat transfer between the water turbine and seawater. Due to the primarily turbulent nature of the water flow within the turbine, the turbulence equations must also be considered. Consequently, the governing equations for analyzing the wake field of tidal stream turbines are as follows:
Continuity equation:
ρ t + div ( ρ u ) = 0
Momentum equation:
( ρ u ) t + div ( ρ u u ) = div ( μ grad ( u ) ) ρ x + S u
( ρ v ) t + div ( ρ v u ) = div ( μ grad ( v ) ) ρ y + S v
( ρ w ) t + div ( ρ w u ) = div ( μ grad ( w ) ) ρ z + S w
grad ( * ) = ( * ) x + ( * ) y + ( * ) z
In this context, Su, Sv, and Sw denote the generalized source terms of the momentum conservation equations.
Cp represents the power coefficient derived from ocean currents by the turbine, serving as a crucial parameter for turbine performance. Ct is the thrust coefficient corresponding to the load along the impeller’s rotational axis, while the tip speed ratio (TSR) denotes the ratio of the blade tip’s rotational speed to the inlet fluid velocity. UDef signifies the velocity deficit. The respective equations are as follows:
C p = P / ( 1 / 2 ρ U 0 3 π R 2 )
C t = F X / ( 1 / 2 ρ S U 0 2 )
T S R = ω R / U 0
  U D e f = 1 U / U 0
where P is the turbine power, ρ is the fluid density, R is the radius of turbine inlet surface, U is the velocity component of streamwise (axial velocity), and U0 is the velocity of the fluid.
The RNG k-ε model, proposed by Yakhot and Orszag (1986), is based on the renormalization group method. Similar in form to the standard k-ε, this theory yields an effective viscosity derived from the analysis, accounting for the influence of low Reynolds numbers and the appropriate treatment of the near-wall region by utilizing the Gaussian statistical method under equilibrium conditions [24]. After performing a series of operations to eliminate small-scale components and rescale the residual portion, the equation governing large-scale motion is obtained, enabling better management of flows with elevated strain rates and streamline curvature, thereby enhancing computational accuracy [25]. Turbulence, as a complex fluid motion, exerts a significant impact on the turbine and its wake. The CFD simulation model used in this study was the RNG k-ε model, which was chosen based on a thorough consideration of the water flow environment and the characteristics of the water turbine. The expressions are as follows:
( ρ k ) t + ( ρ k u i ) x i = x i μ + μ t σ k k x i + G k ρ ε
( ρ ε ) t + ( ρ ε u i ) x i = x i μ + μ t σ ε ε x i + C ε 1 ε k G k C ε 2 * ρ ε 2 k
C ε 2 * = C ε 2 + C μ η 3 ( 1 η / η 0 ) 1 + β η 3
where μt denotes the turbulent viscosity coefficient, while Gk signifies the term responsible for generating turbulence kinetic energy (k) due to the average velocity gradient. The constants Cμ, Cε1, Cε2, σk, and σε constitute empirical values, with respective magnitudes of 0.0845, 1.42, 1.68, 0.7194, and 0.7194.
Figure 4 depicts the computational domain, which is a rectangular region with a width of 4 D (1.2 m), a length of 30 D (9 m), and a height of 0.6 m. A cylindrical region with a diameter of 1.1 D and a thickness of 0.3 D was designated as the rotating zone surrounding the rotor, with the remaining area defined as the stationary domain. In the steady-state configuration, a frozen rotor interface is employed for the rotor, while a transient rotor interface is utilized in unsteady calculations [26]. The steady-state numerical simulation adopts a rotating coordinate reference system within the rotating region, and a static coordinate system in other flow areas. In contrast, the unsteady numerical simulation incorporates sliding grid technology. The inlet flow is assigned a velocity boundary condition of 0.4 m/s of magnitude, and the outlet is configured as a pressure outlet, with the flow proceeding from left to right. The top boundary surface is assigned symmetry, while the other walls are designated as wall boundaries. Given that the turbine constitutes a rotary machine, both steady-state and unsteady-state calculation methods are employed. The unsteady calculation’s time step is set at 0.005 s, corresponding to a 3° blade rotation duration, with 20 iterations per time step.
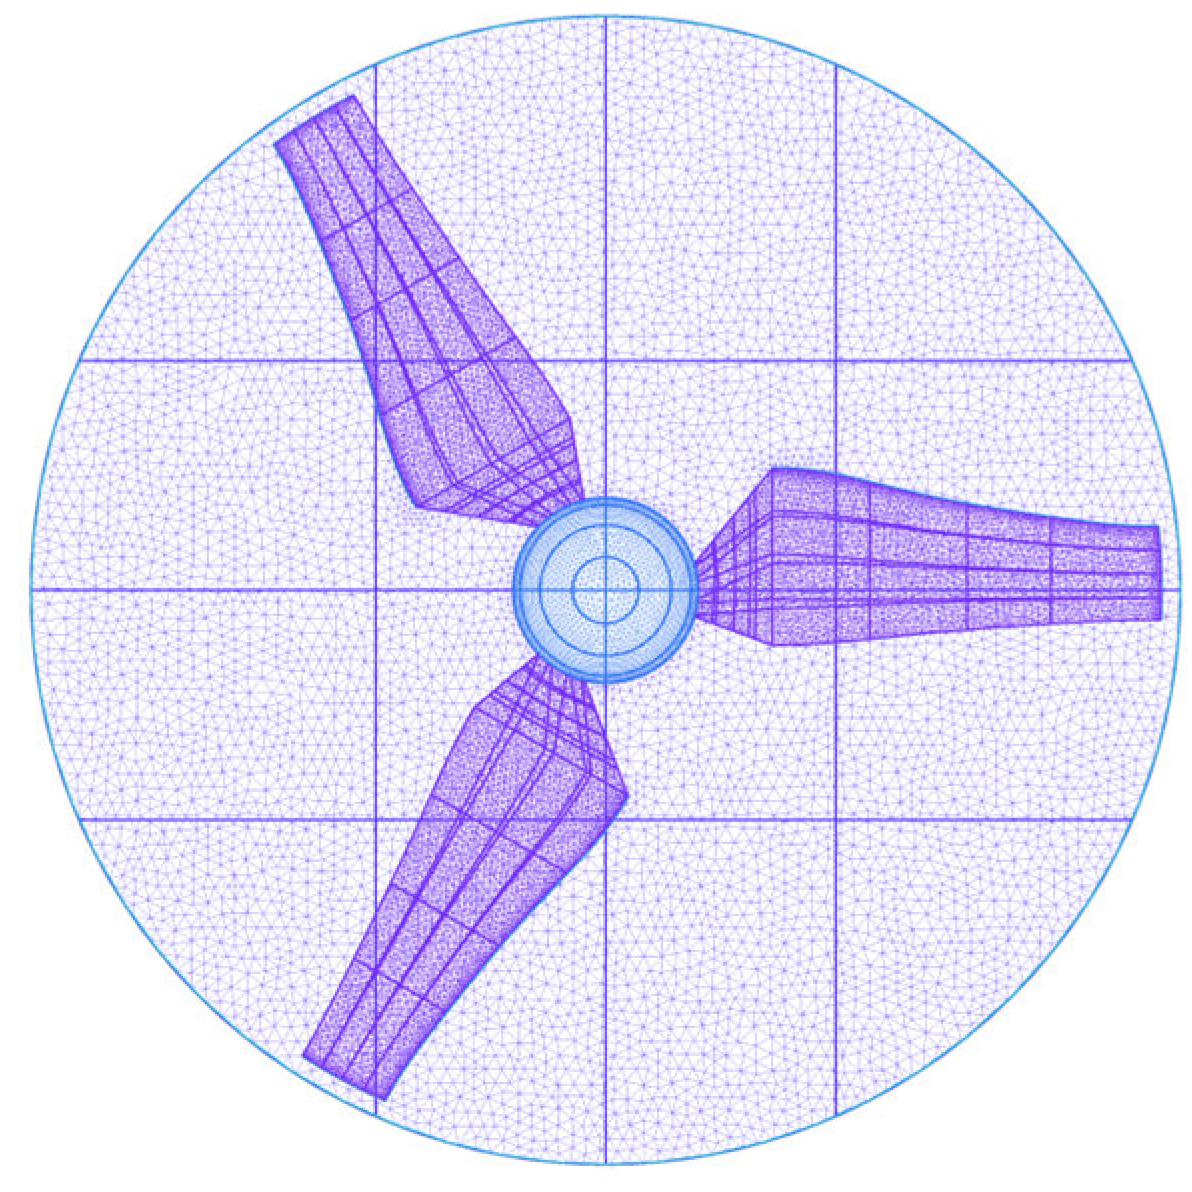
The accuracy of numerical calculations related to the turbine is significantly influenced by the quality and quantity of the computational grid. Employing a sparse grid may result in substantial discretization errors, compromising the accuracy of the computed outcome. Conversely, utilizing an excessively dense grid could lead to the inefficient use of computational resources. Therefore, it is essential to validate the grid-independent turbine to ensure a balance between accuracy and computational efficiency. As depicted in Table 1, a mesh count exceeding approximately 3.3 million is ascertained, wherein the relative difference of the power coefficient (Cp) falls within 1%. As evident in the runner domain mesh map (Figure 5), the flow surrounding the rotor blades is intricate. As a result, to capture the complex flow field in detail, partial refinement is executed within the rotating regions. A balance between computational cost and accuracy yields 1.87 million cells in the water body and 1.45 million cells external to the wheel.

4. Results and Discussion

4.1. Hydrodynamic Analysis

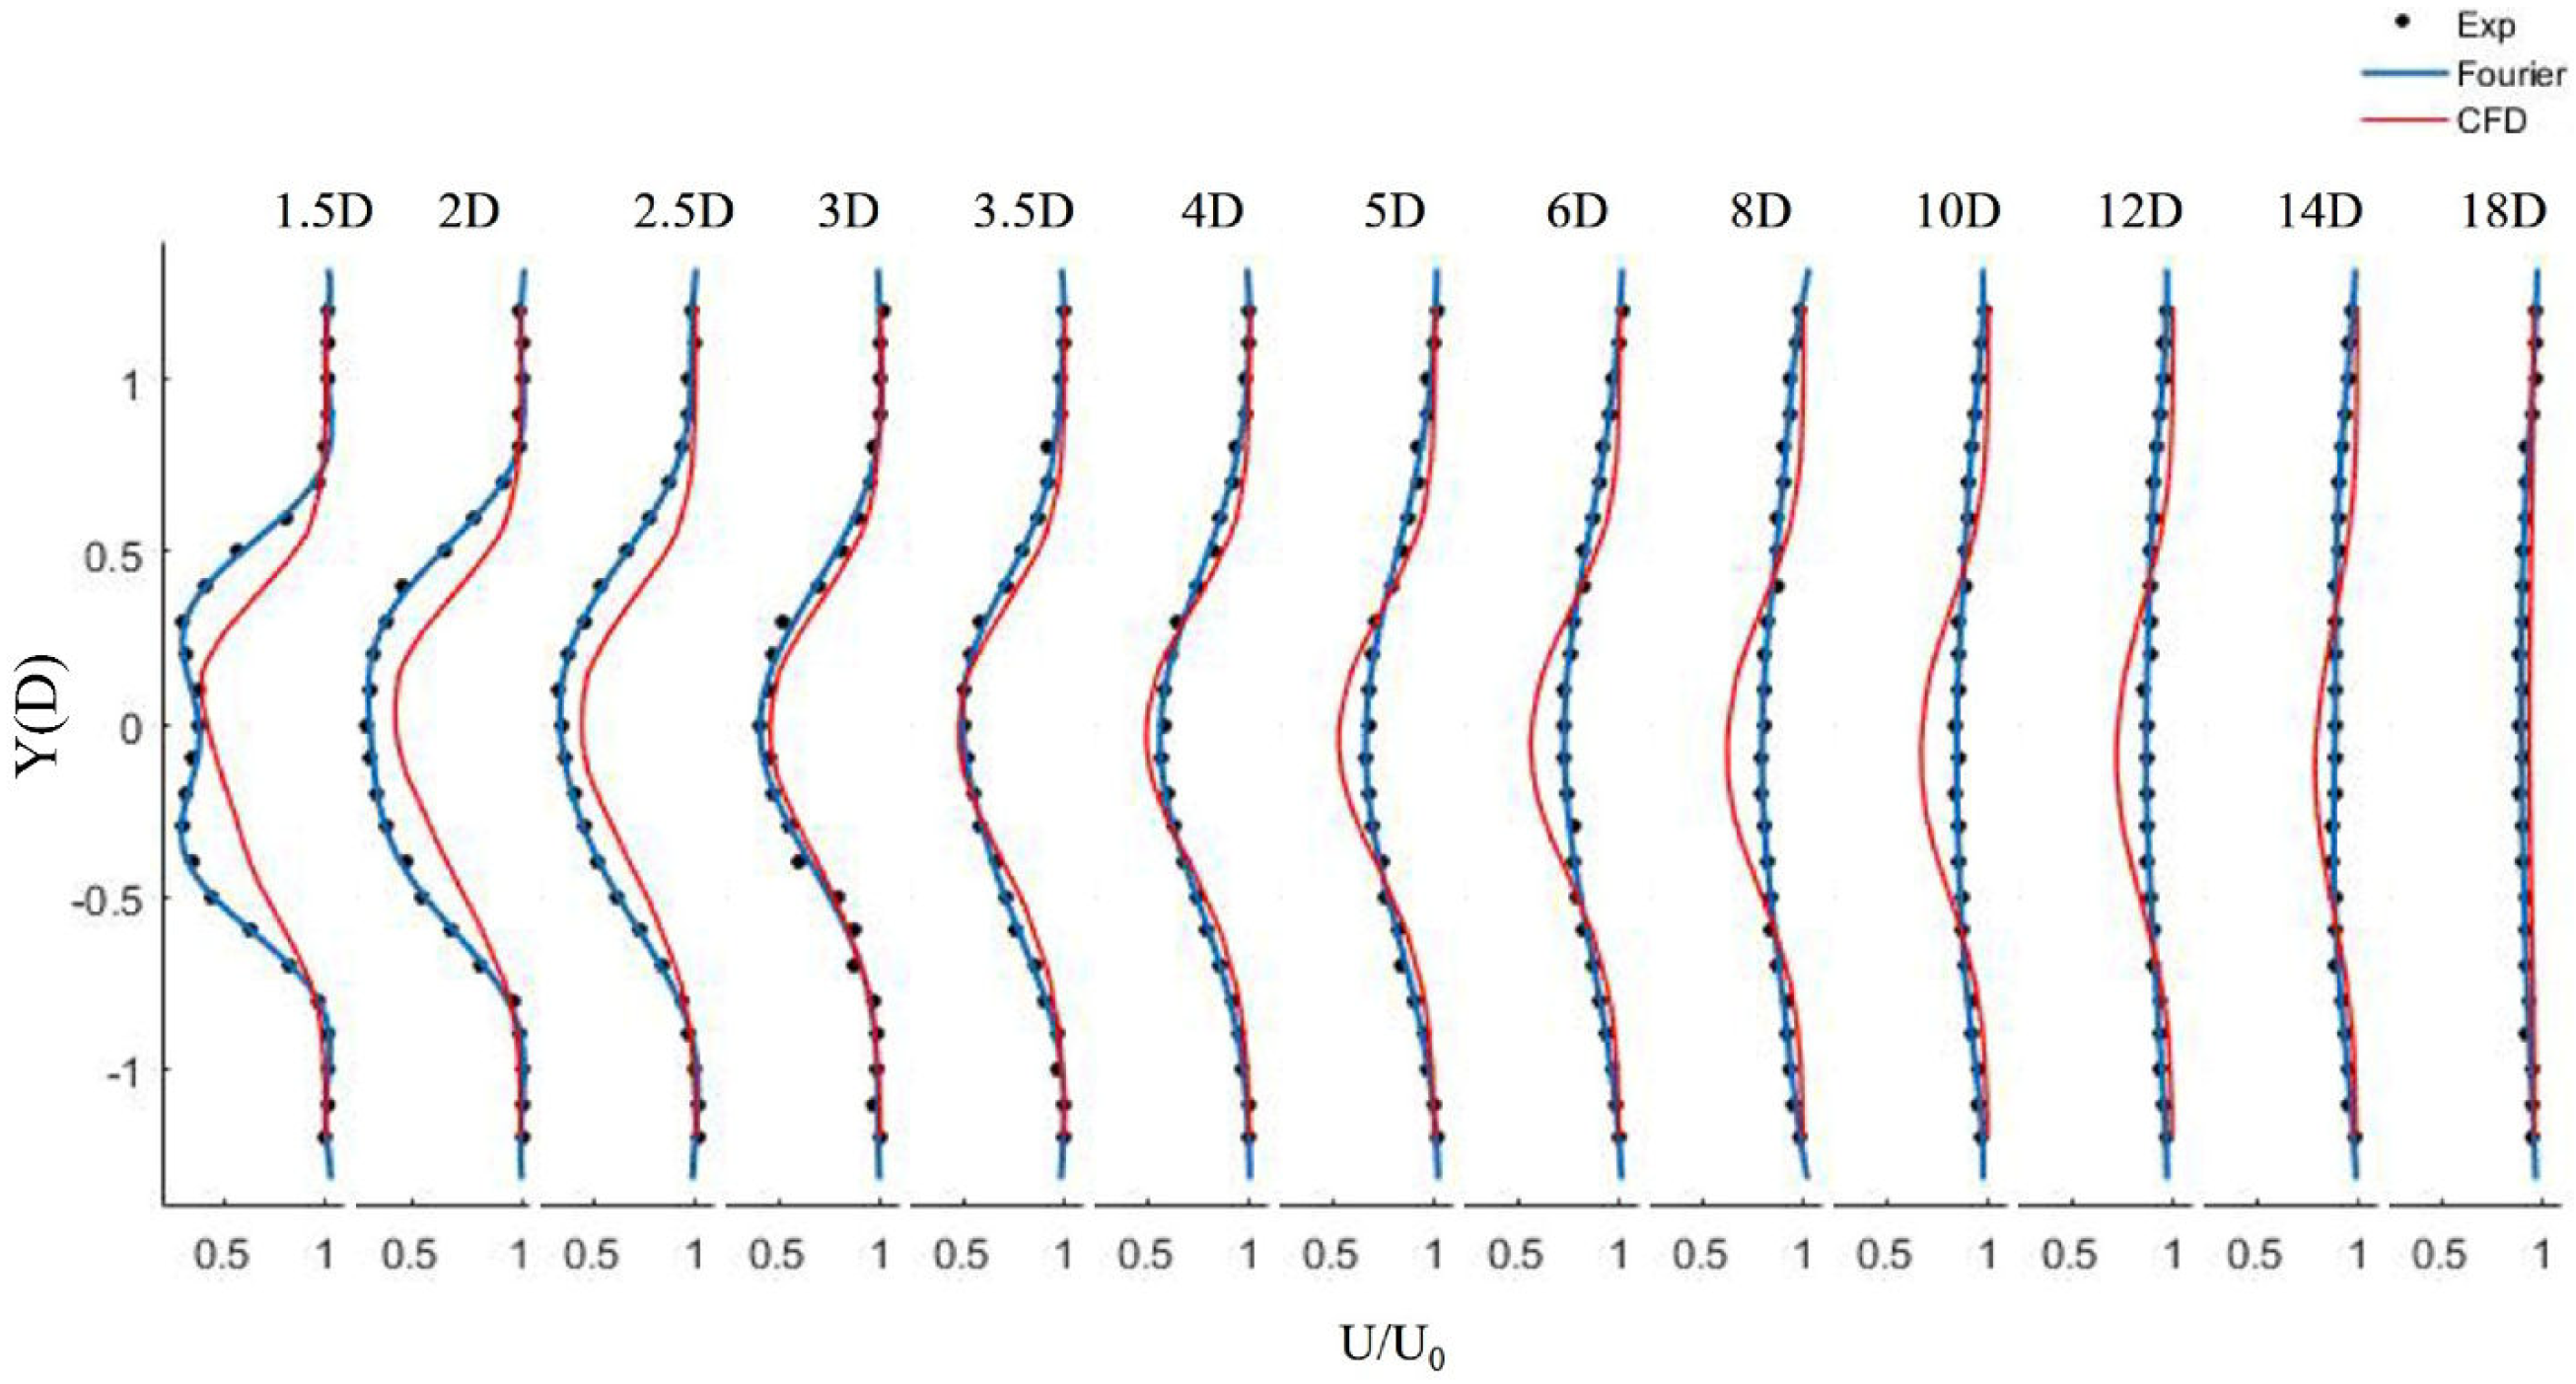
Figure 6 and Figure 7 present the dimensionless distribution curves of the axial component of time-averaged velocity along the XY and XZ sections, respectively. The detailed data are in Tables S1 and S2 of the Supplementary Materials. As depicted in Figure 6, flow velocity exhibits symmetric distribution around the runner’s center, with the lowest velocities occurring at the extremities of the swept area for 1.5 D and subsequently behind the hub. Flow continuity causes the velocities on either side to exceed the inlet flow velocity, aligning with Chen et al.’s research findings [27]. Downstream of the turbine, the flow velocity distribution exhibits considerable variation within the 1.5–5 D range, with U/U0 exceeding 0.5. In the 6–12 D region, flow velocity recovers to a certain extent and gradually equals the velocities on both sides, due to the momentum and energy exchange resulting from the wake flow’s expansion and continuous inflow.
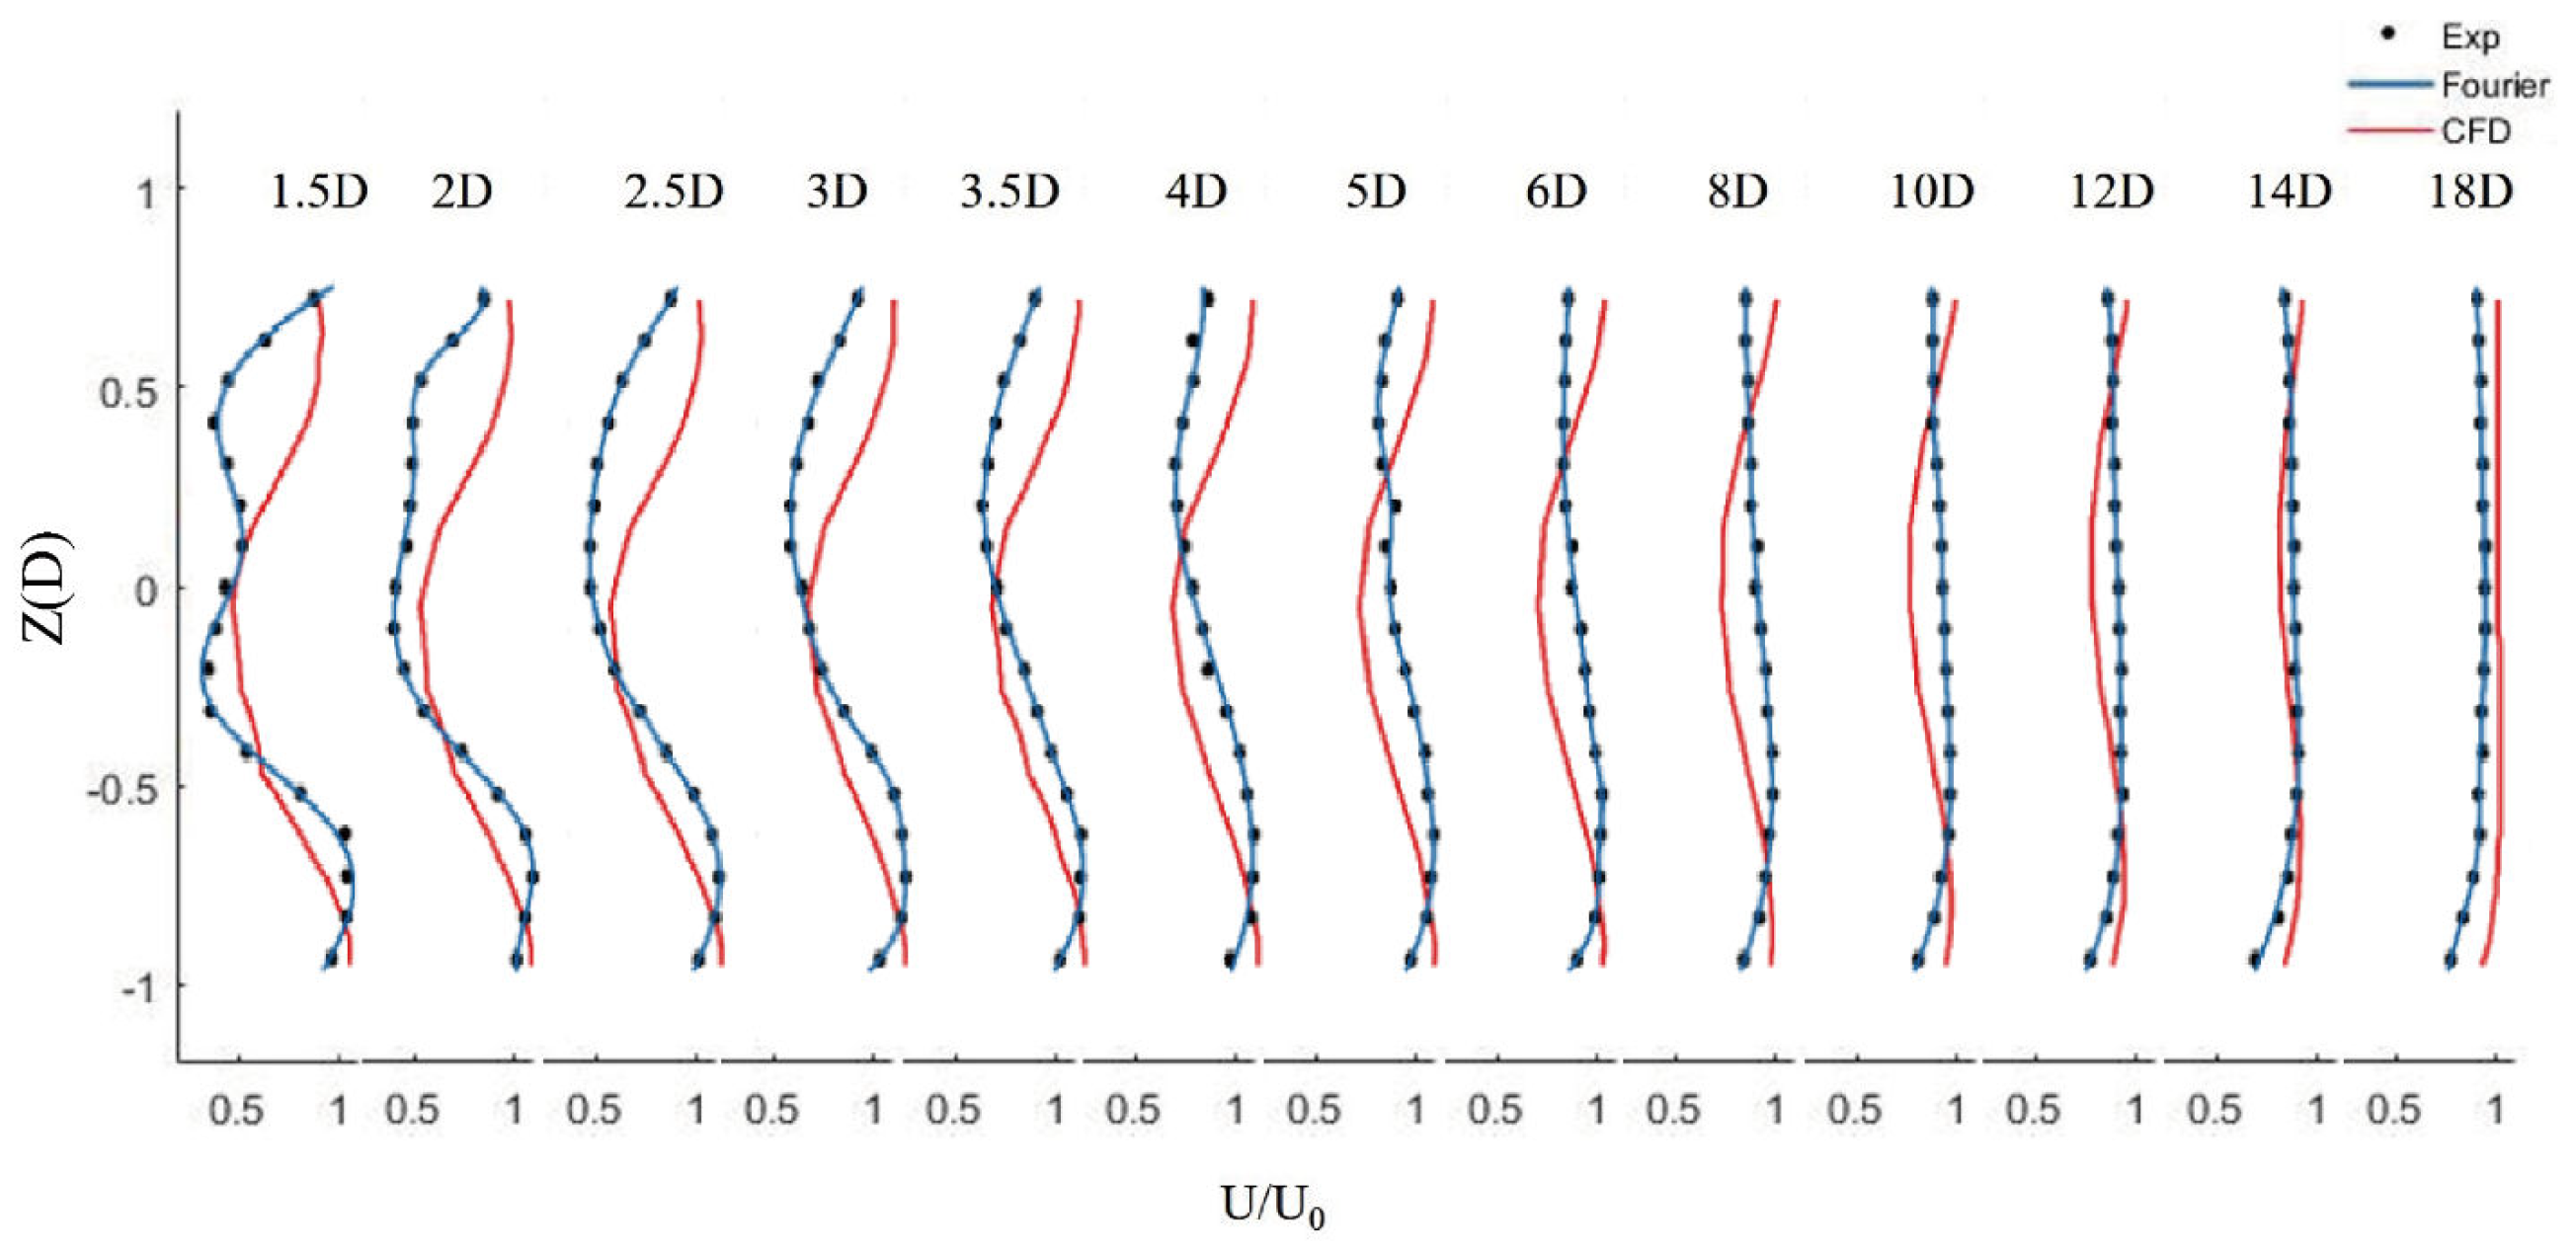
As observed in Figure 7, two valleys appear downstream of the turbine at 1.5 D, signifying that the turbine’s rotational effect significantly impacts the flow field. At 5 D, the valley value recovers to approximately 70% of the inlet velocity. Between 3 D and 6 D behind the turbine, the maximum velocity loss occurs between the upper blade tip and the hub due to the blade’s rotation blocking effect. As the wake flow develops, this blocking effect weakens, and the wake flow gradually recovers.
As illustrated in Figure 6 and Figure 7, there are some discrepancies between the simulation results presented in this study and the experimentally measured data. However, previous research [5,14] has repeatedly pointed out that the turbulence structure of the wake field in experiments exhibits unstable anisotropic characteristics. Consequently, the complex features near the wake, which are critical parameters for nearby turbines, may not be accurately captured by conventional RANS-implemented isotropic turbulence models. Such deviations have also been observed in studies [28,29]. In the numerical calculations of the discretized models used in this work, some actual conditions have been idealized, resulting in a certain degree of deviation between the computational points and the characteristic curves. Nonetheless, the agreement is within the acceptable margin of error, indicating that the numerical results are sufficiently reliable. Furthermore, several studies have employed the same turbulence models [20,21,22] and boundary condition settings [30] for simulating the performance and wake of tidal stream turbines. Thus, the accuracy of the numerical simulation methods and results in this study is deemed appropriate.
In the experiment, the discrepancies between the measuring device’s error and the numerical simulation’s accuracy fall within the acceptable range. Overall, the results from the three-dimensional, full-scale numerical simulation method exhibit strong agreement with the experimental findings, validating the feasibility and accuracy of the employed simulation approach for investigating horizontal axis turbines.
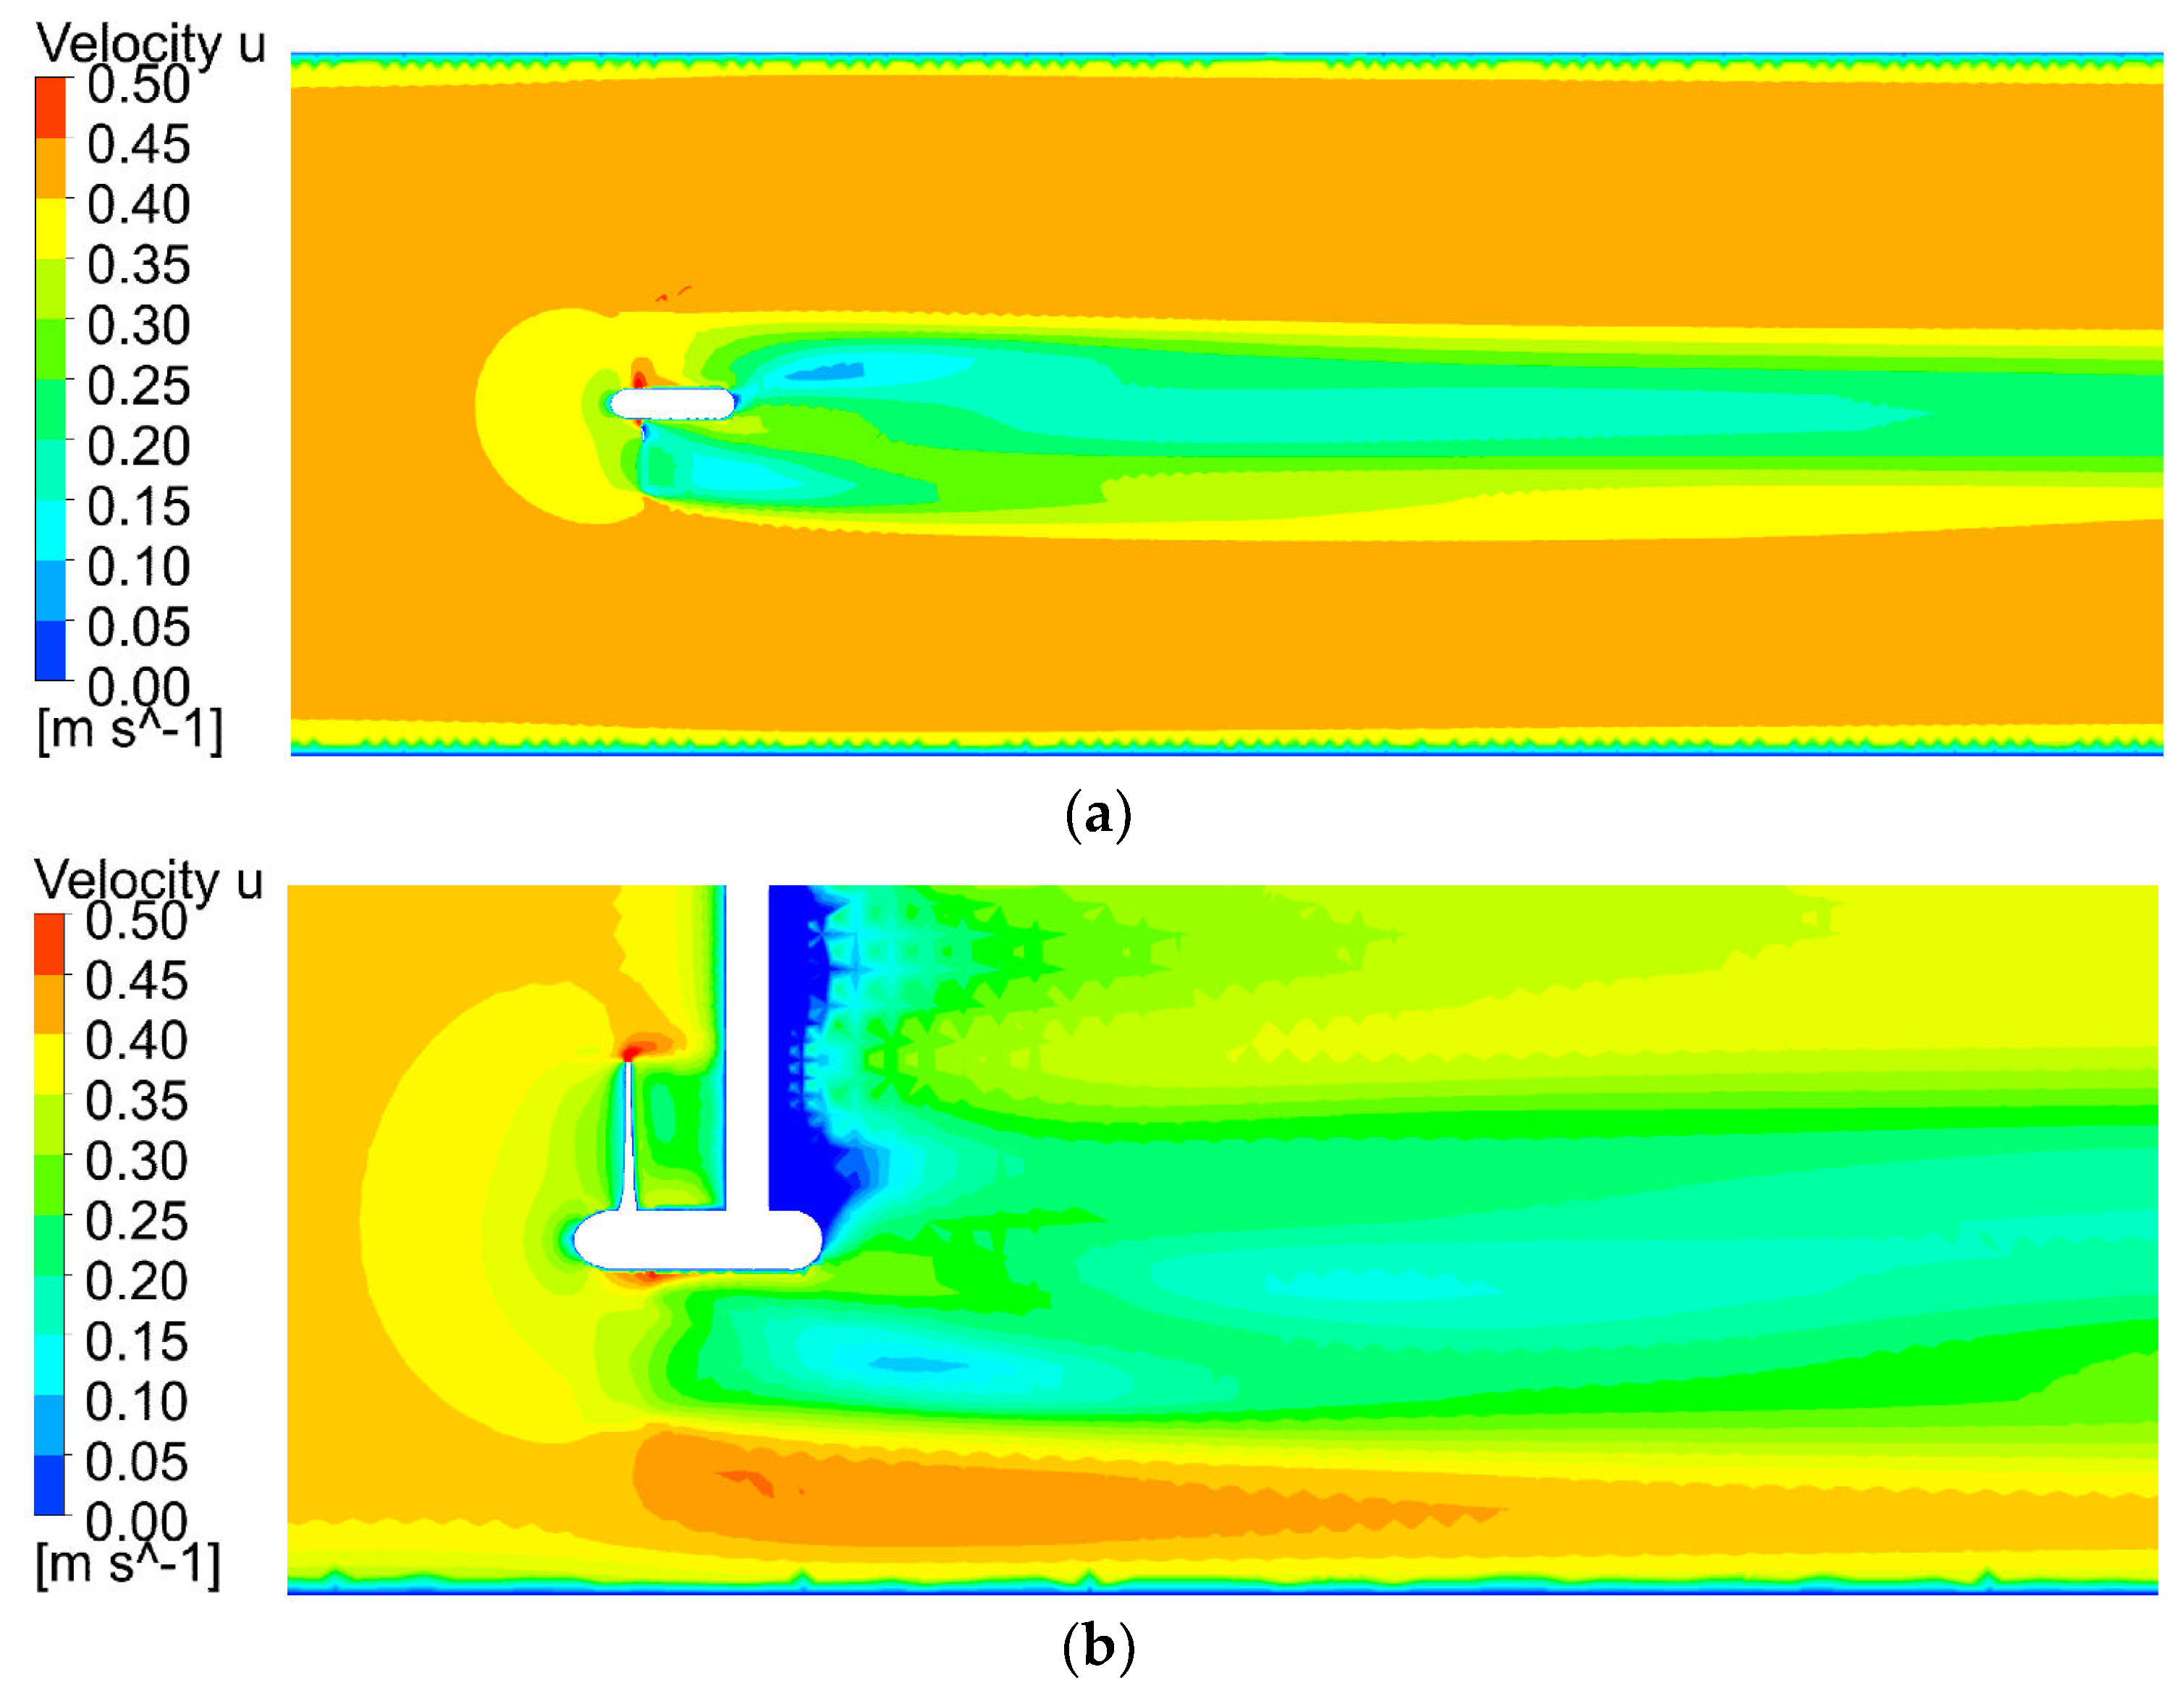
Figure 8 illustrates the cloud diagram of axial velocity U changes within the wake field. It is evident that as water flows towards the turbine, axial velocity U decreases due to the turbine blade’s rotation and its inherent obstruction. After water passes through the turbine, the axial velocity U within the wake experiences a sharp reduction compared to the external axial velocity. The turbine’s rotational effect amplifies the velocity at the blade tip. Owing to the obstructive impact of the hub and the column, the flow field’s velocity directly behind the hub significantly attenuates, influencing the velocity distribution in the near-wake region. The water that has traversed the turbine continuously diffuses laterally and surpasses the turbine’s diameter, which is congruent with the conclusions drawn by Hou et al. [31].
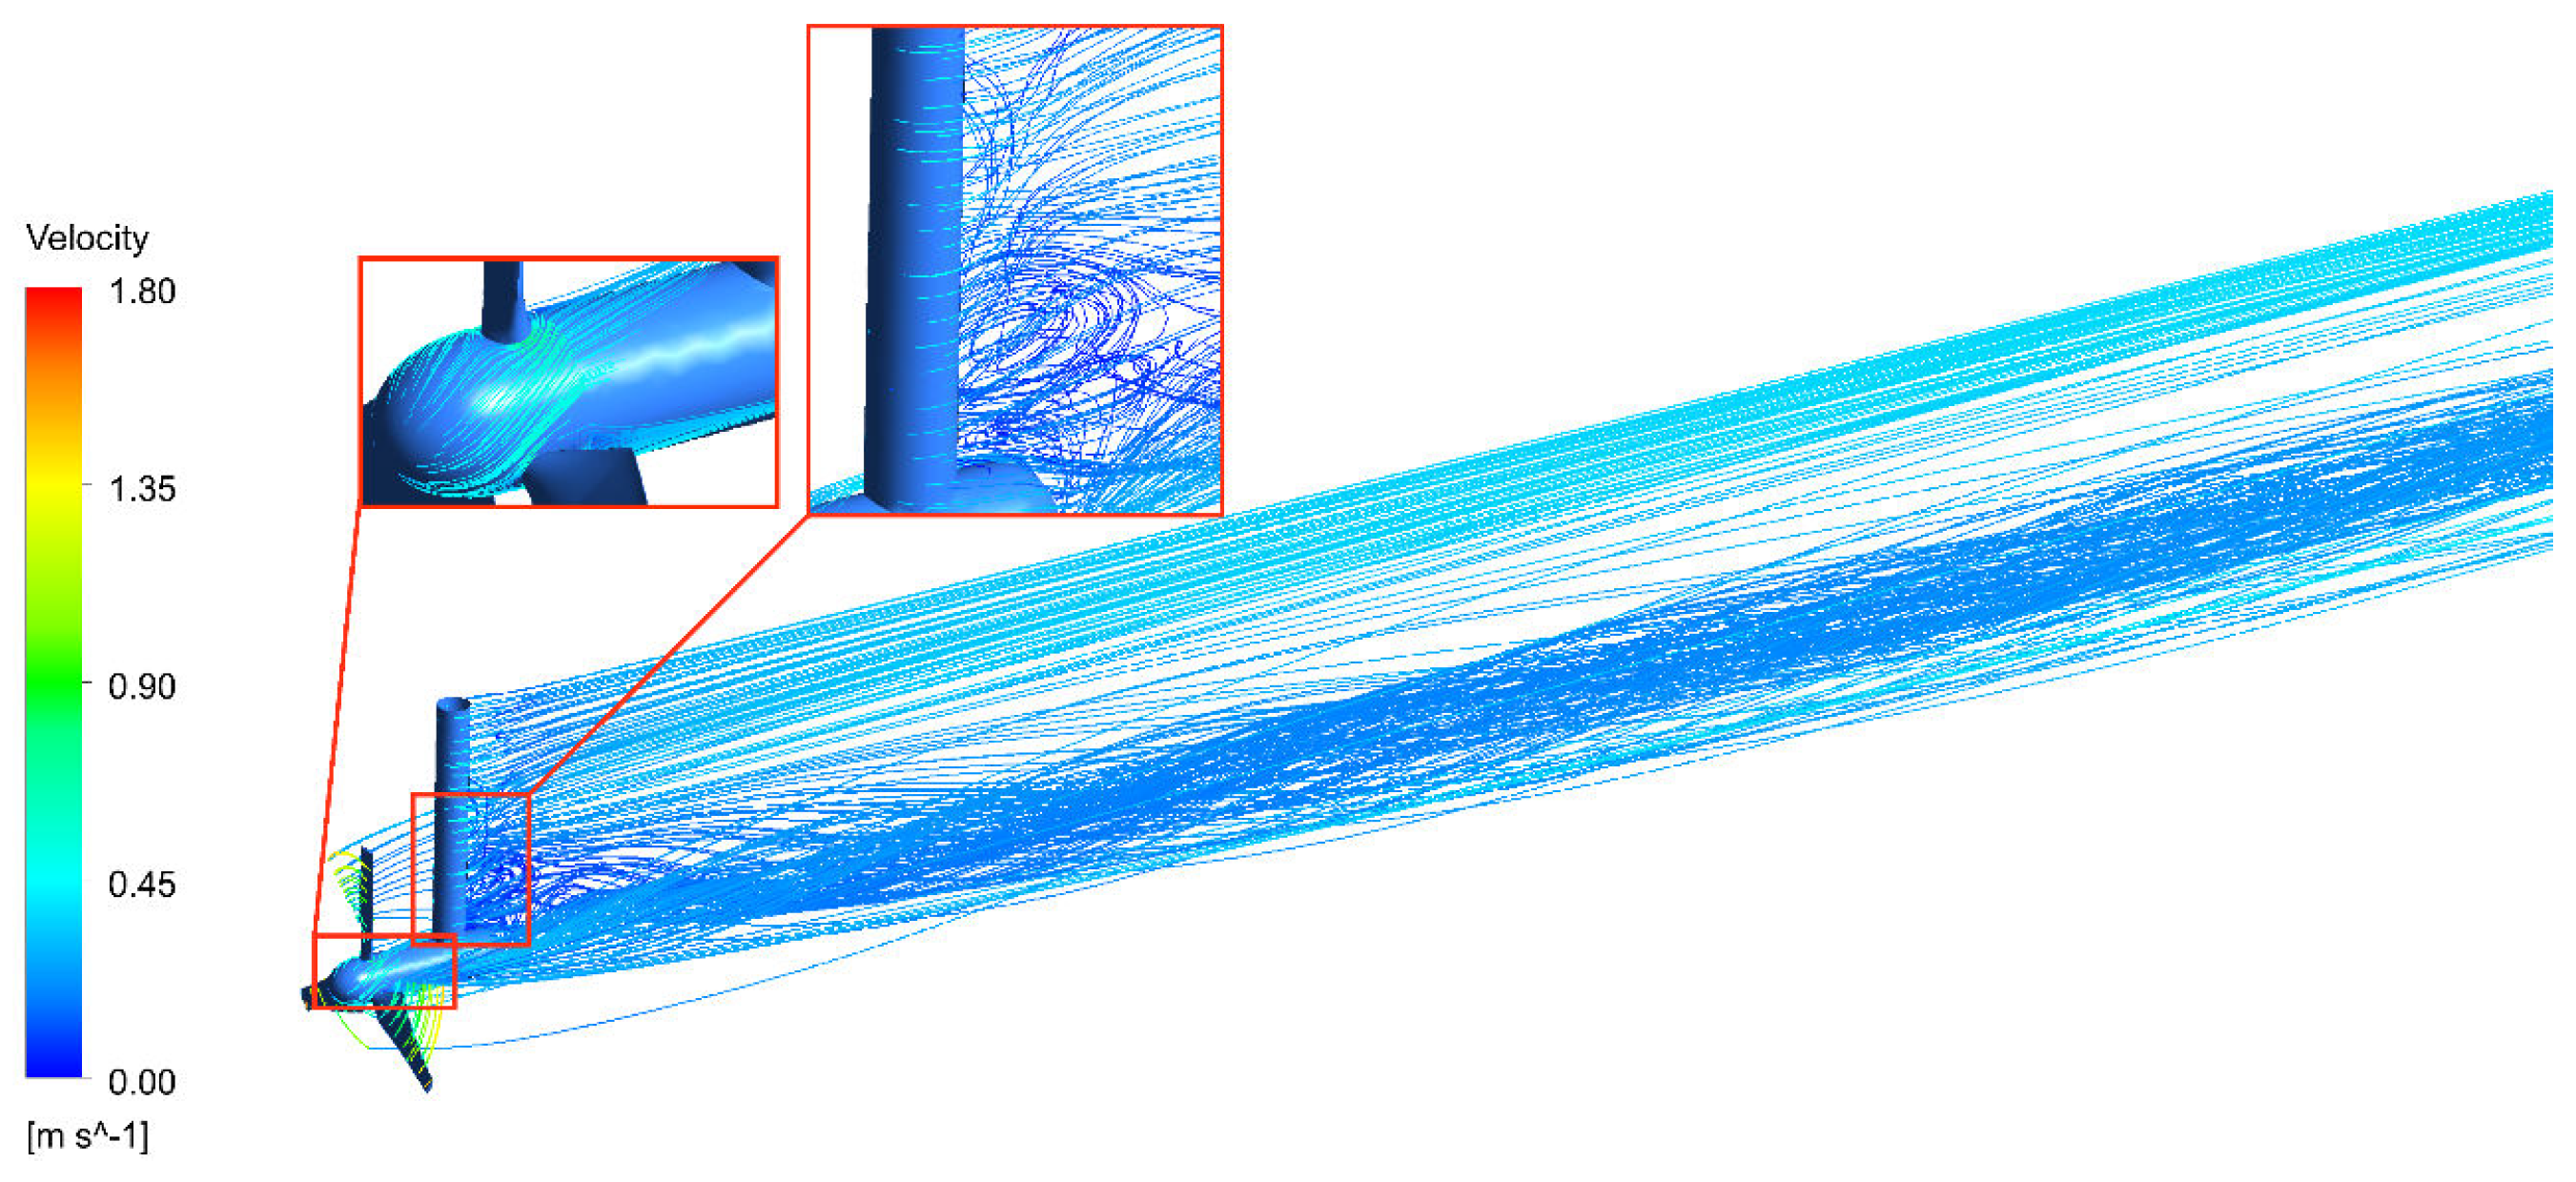
Figure 9 presents a streamline diagram of the turbine wake flow field, where the streamlines depict the motion of each fluid particle within the flow field. The diagram clearly demonstrates the generation of a vortex around the hub due to the turbine’s rotation, with velocities (after the rotor) reaching up to 1.8 m/s. As a result, a portion of the water flows through the hub, and under the influence of rotation, a spiral streamline forms behind the hub. This dark-colored streamline exhibits a significant velocity loss. Hub vortices are produced and evolve uniformly in the far wake area. The support structure displays the minimum velocity near its rear, and cylindrical flow occurs around it. In summary, blades, hubs, and support structures each possess distinct characteristics that influence the wake field of a turbine.

4.2. Analysis of the Influence of Support Structure on Turbine Performance

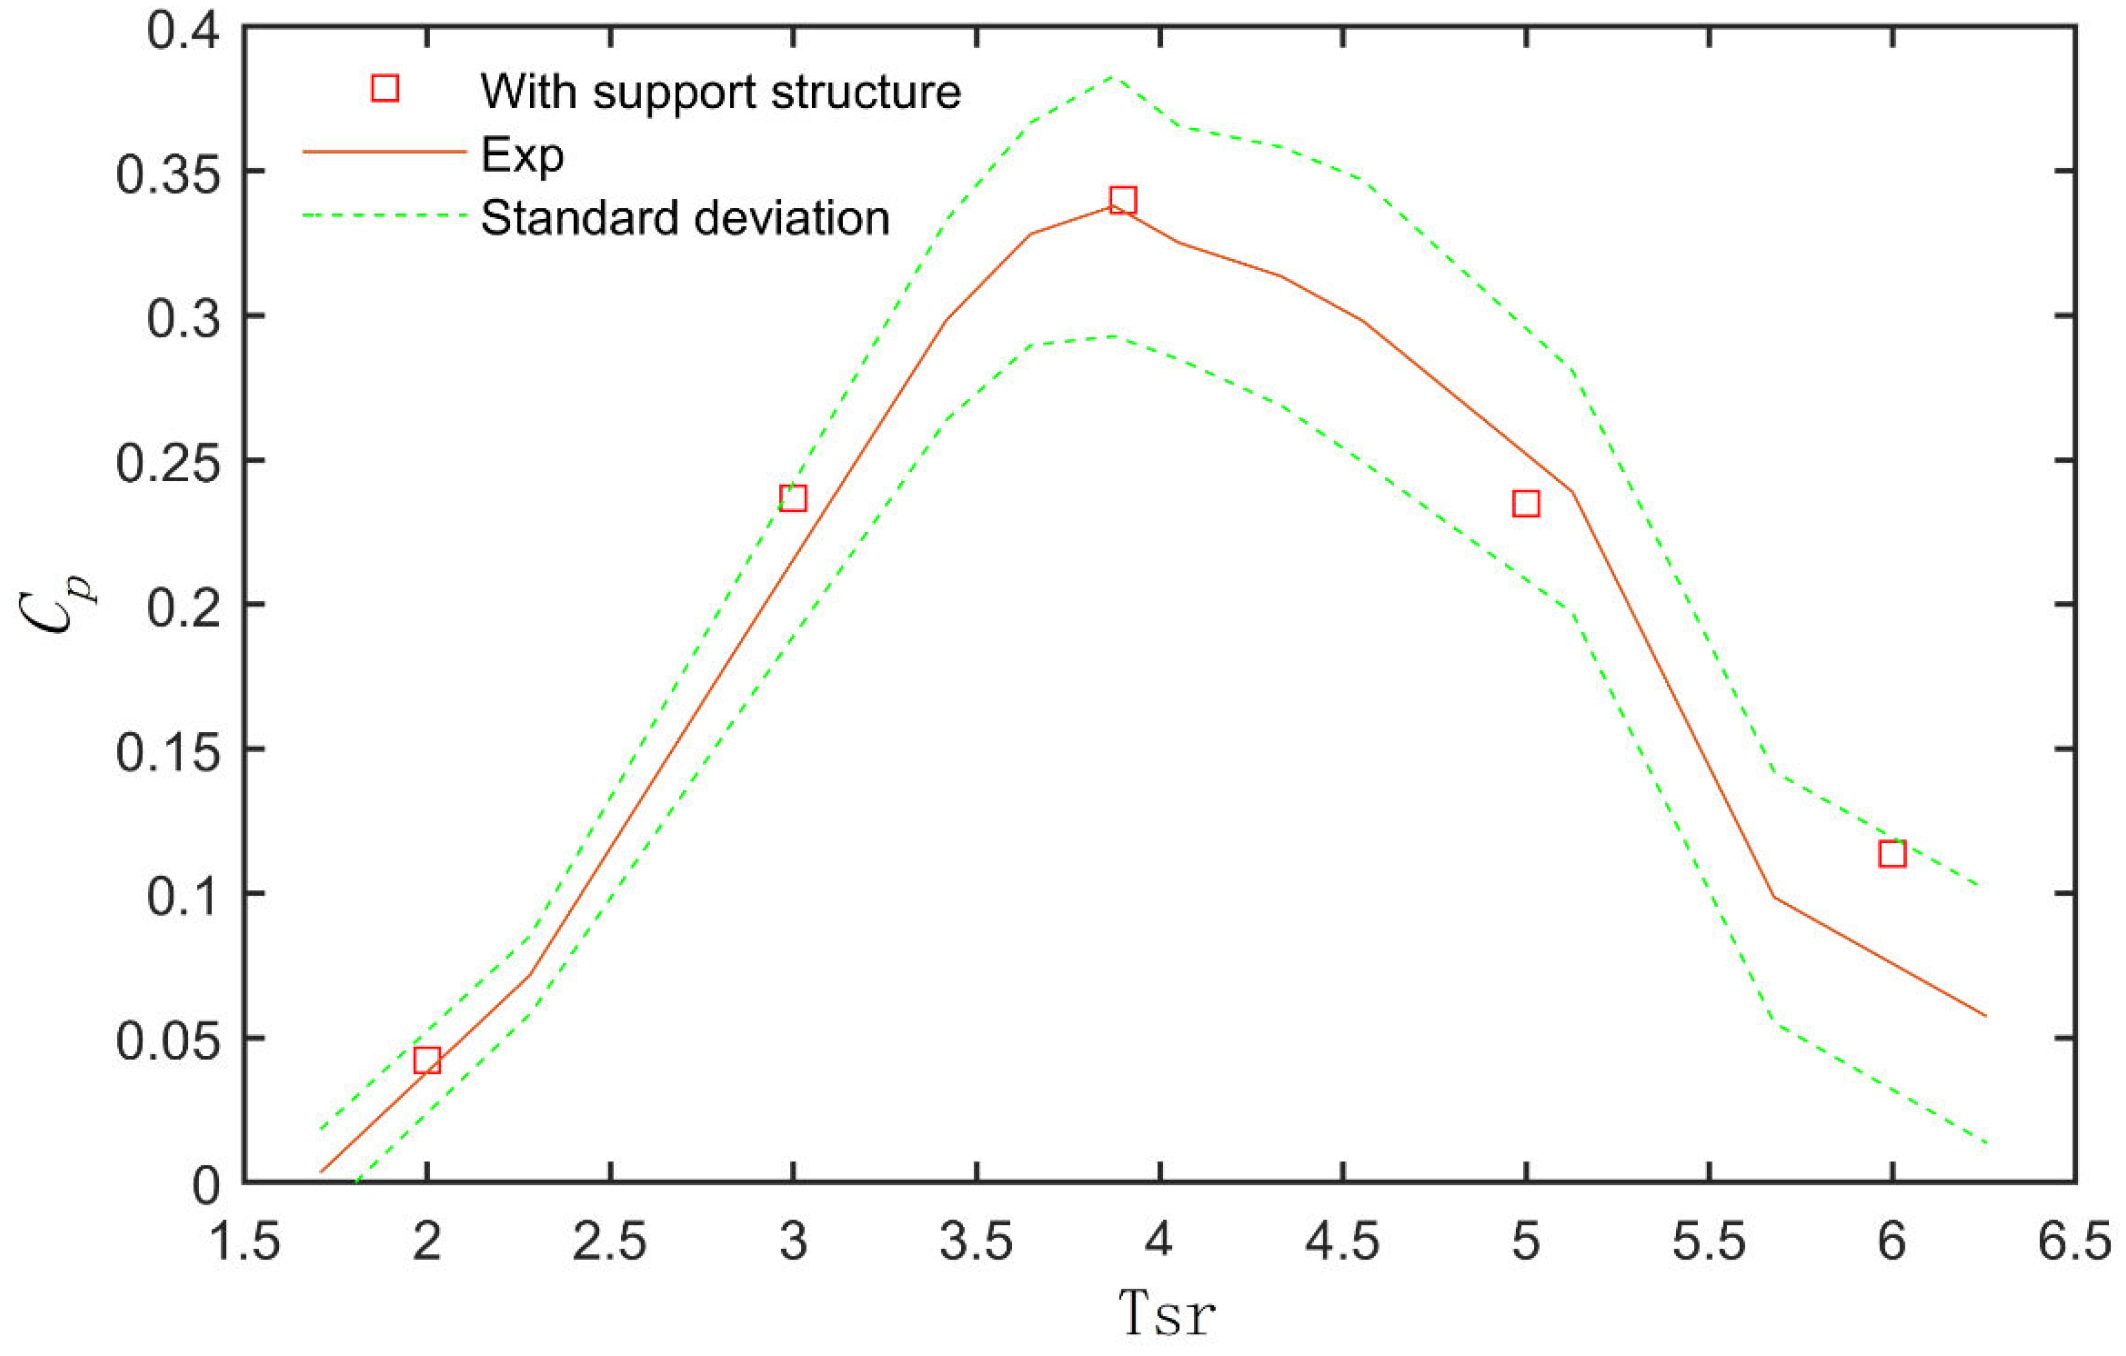
To further analyze the influence of the support column structure on the flow field and turbine performance, the hydrodynamic characteristics of the turbine wake field with and without the support column structure were studied using a turbine impeller. The incoming flow direction (with a mean velocity of 0.4 m/s) was aligned with the support structure. Figure 10 displays the variation curve of the turbine’s Cp with the tip speed ratio. As shown in Figure 10, the simulated results agree well with the experimental values, only the simulated Cp is larger than the test in the high-speed ratio condition. However, the results are all within the experimentally measured power coefficient data’s standard deviation.
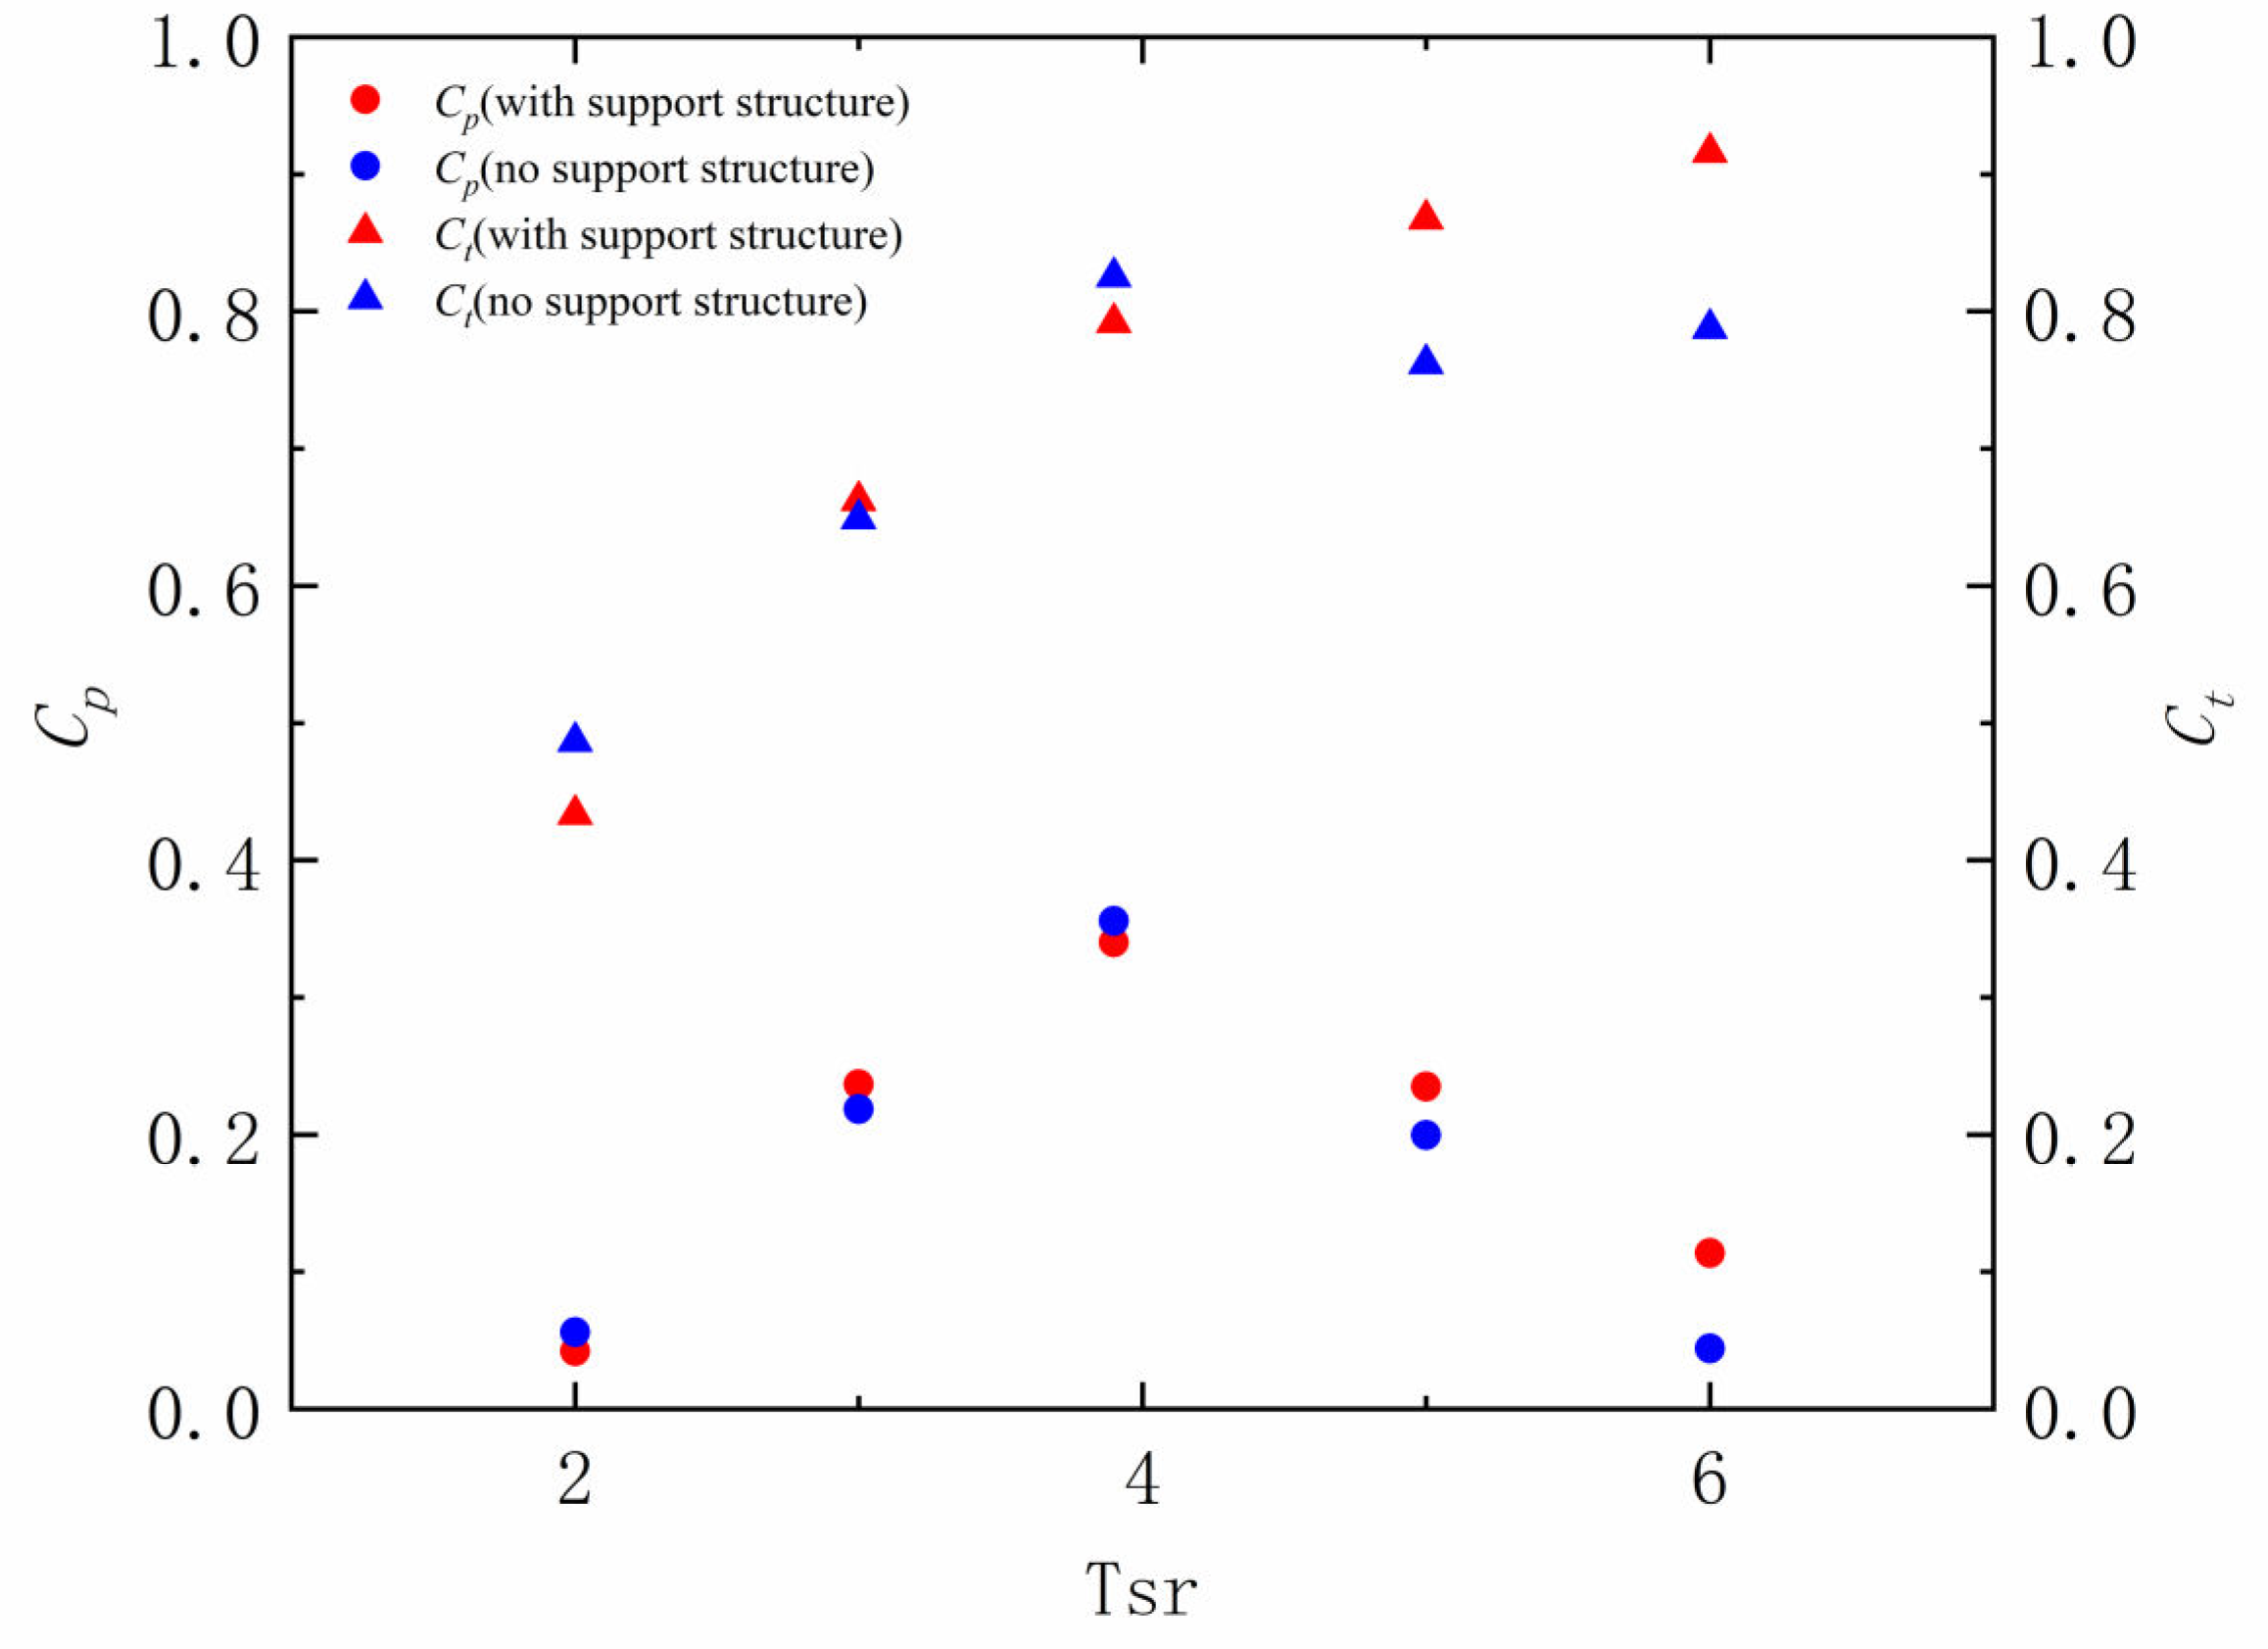
Figure 11 illustrates the average axial load coefficient for the water turbine impeller under the two types of structures, along with the change in tip speed ratio (TSR). The support column reduces the turbine’s Cp to some extent, by 4.41%, which in turn diminishes the turbine’s performance. In the low-speed ratio condition, when the tip speed ratio (TSR) is 2, the Cp of the turbine without the column structure is higher than that with the column structure. In the high-speed ratio condition, the Cp of the turbine without the column structure is higher than that with the column structure. The Cp showed an increasing and then decreasing trend, while the force coefficient increases with the tip speed ratio, although a small drop is observed at a tip speed ratio of 4.5. Overall, the force coefficient, in line with the power coefficient curve, tends to be lower with the support column than without it at high tip speed ratios. This can be partly explained by the more significant impact of turbine rotation at high tip speed ratios and the increased water blockage with the pillar compared to without the support column.
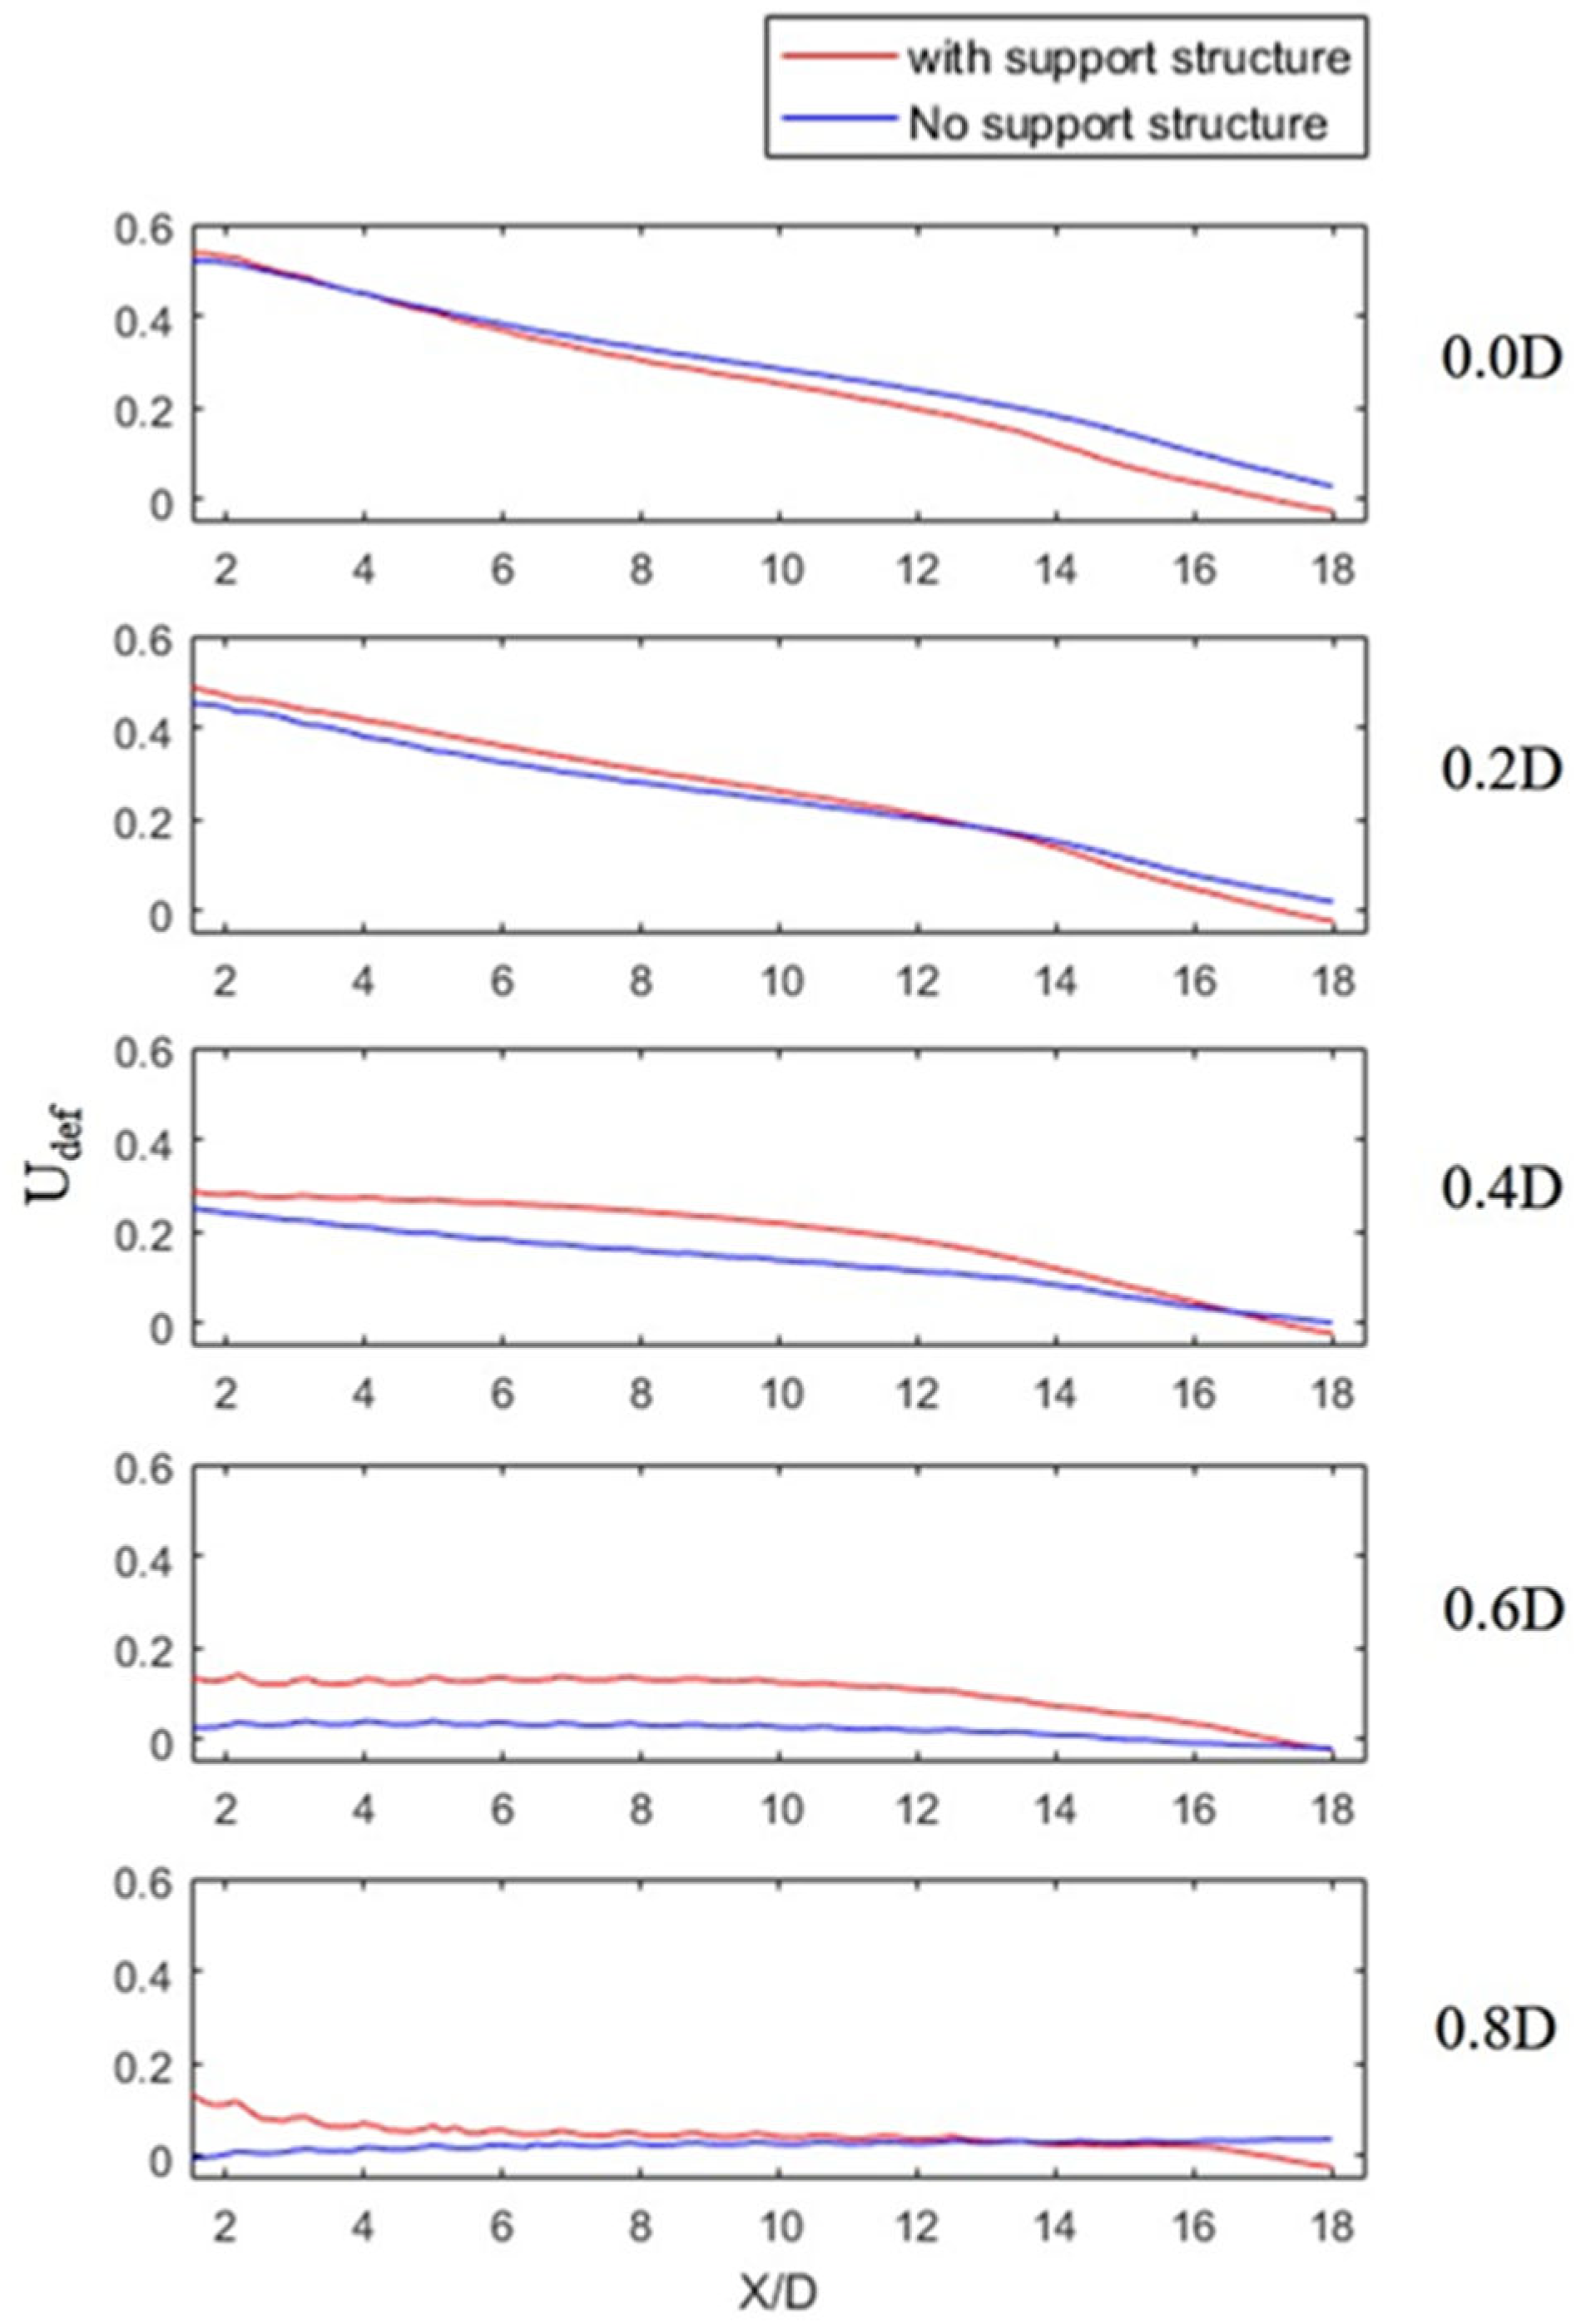
Figure 12 displays the distribution curves of the turbine wake at different downstream positions (0, 0.2, 0.4, 0.6, and 0.8 D) from the rotation centerline of the turbine, while the velocity distribution curve is shown in Figure 13. It can be observed from the velocity loss curves UDef at different positions behind the turbine that the speed recovery of the turbine wake is different depending on the distance from the centerline. The downstream speed losses tend to increase with closeness to the hub center, resulting in the smallest loss at 0.8 D. In this regard, the maximum attenuation of all curves occurred at the centerline 0 D curve, and the overall velocity loss was the most severe. The maximum velocity loss (1.5 D) at 0.2 D with and without the column was 48.88% and 45.27%, respectively, compared with 28.82% and 25.06% at 0.4 D, 14.14% and 4.02% at 0.6 D, and 13.15% and 3.68% at 0.8 D. Meanwhile, the recovered velocity at 18 D with and without the column was −2.45% and 2.87%, respectively, compared with −2.09% and 2.03% at 0.4 D, −2.22% and −1.89% at 0.6 D, and −2.32% and 3.68% at 0.8 D.
Based on the above analysis, the presence of the turbine in the flow field leads to an increased influence range of the wake field compared to the turbine’s diameter. The support column of the turbine has a blocking effect on the wake field near the turbine, resulting in increased velocity loss. This effect is most pronounced along the centerline, where the column obstructs the flow. As the downstream distance increases, the fluid velocity around the far wake slightly rises under the guidance of the support column and free liquid level. It becomes evident that the support column at the rear of the turbine has a significant impact on the flow velocity in the flow field. Therefore, it is crucial to study the effects of the support column and the distribution characteristics of the wake field to optimize the development and utilization of the power in the flow. By understanding these dynamics, engineers and researchers can make informed decisions when designing and deploying horizontal axis turbines for extracting energy from water currents.
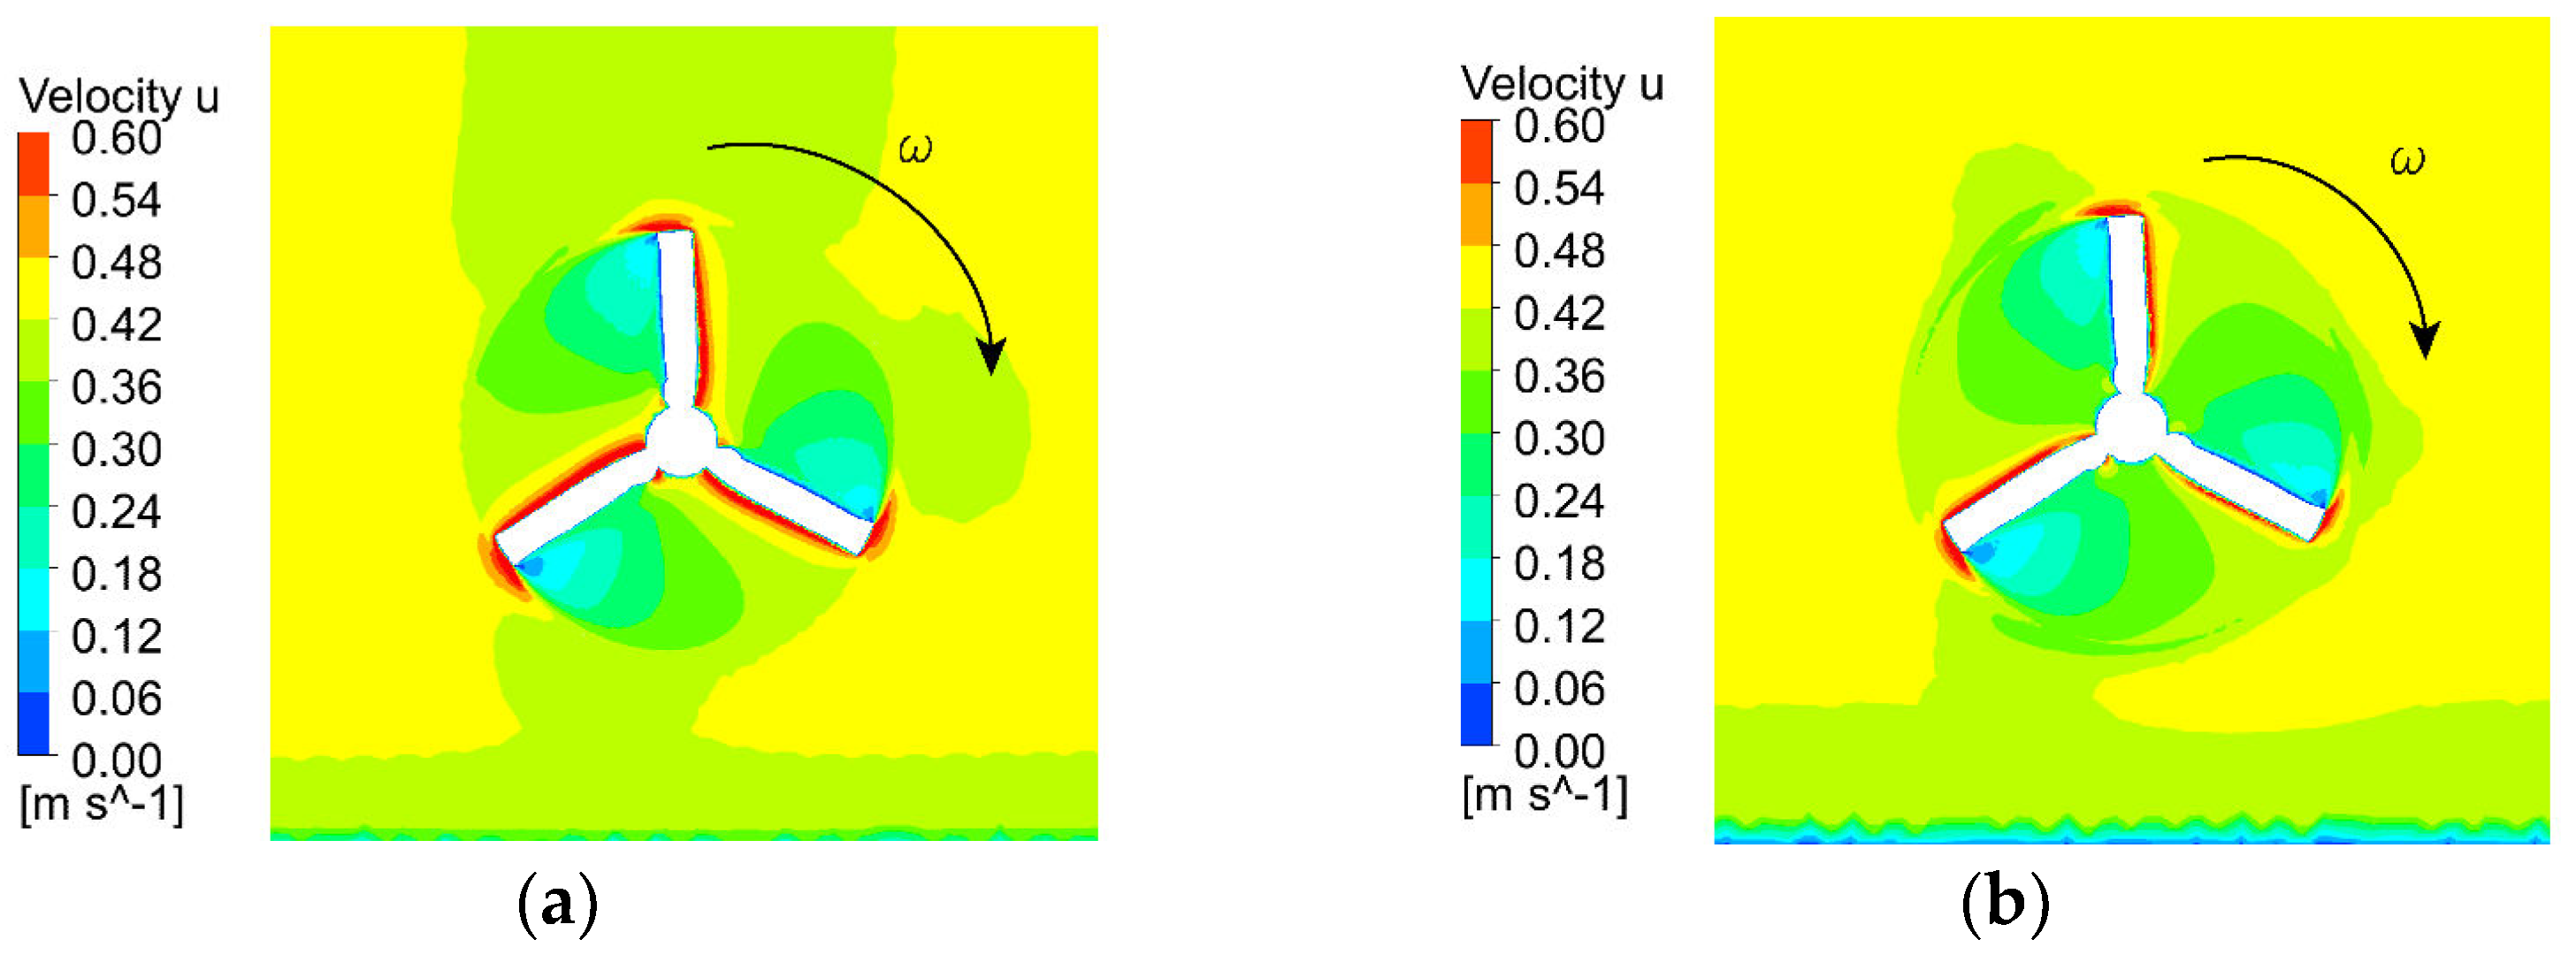
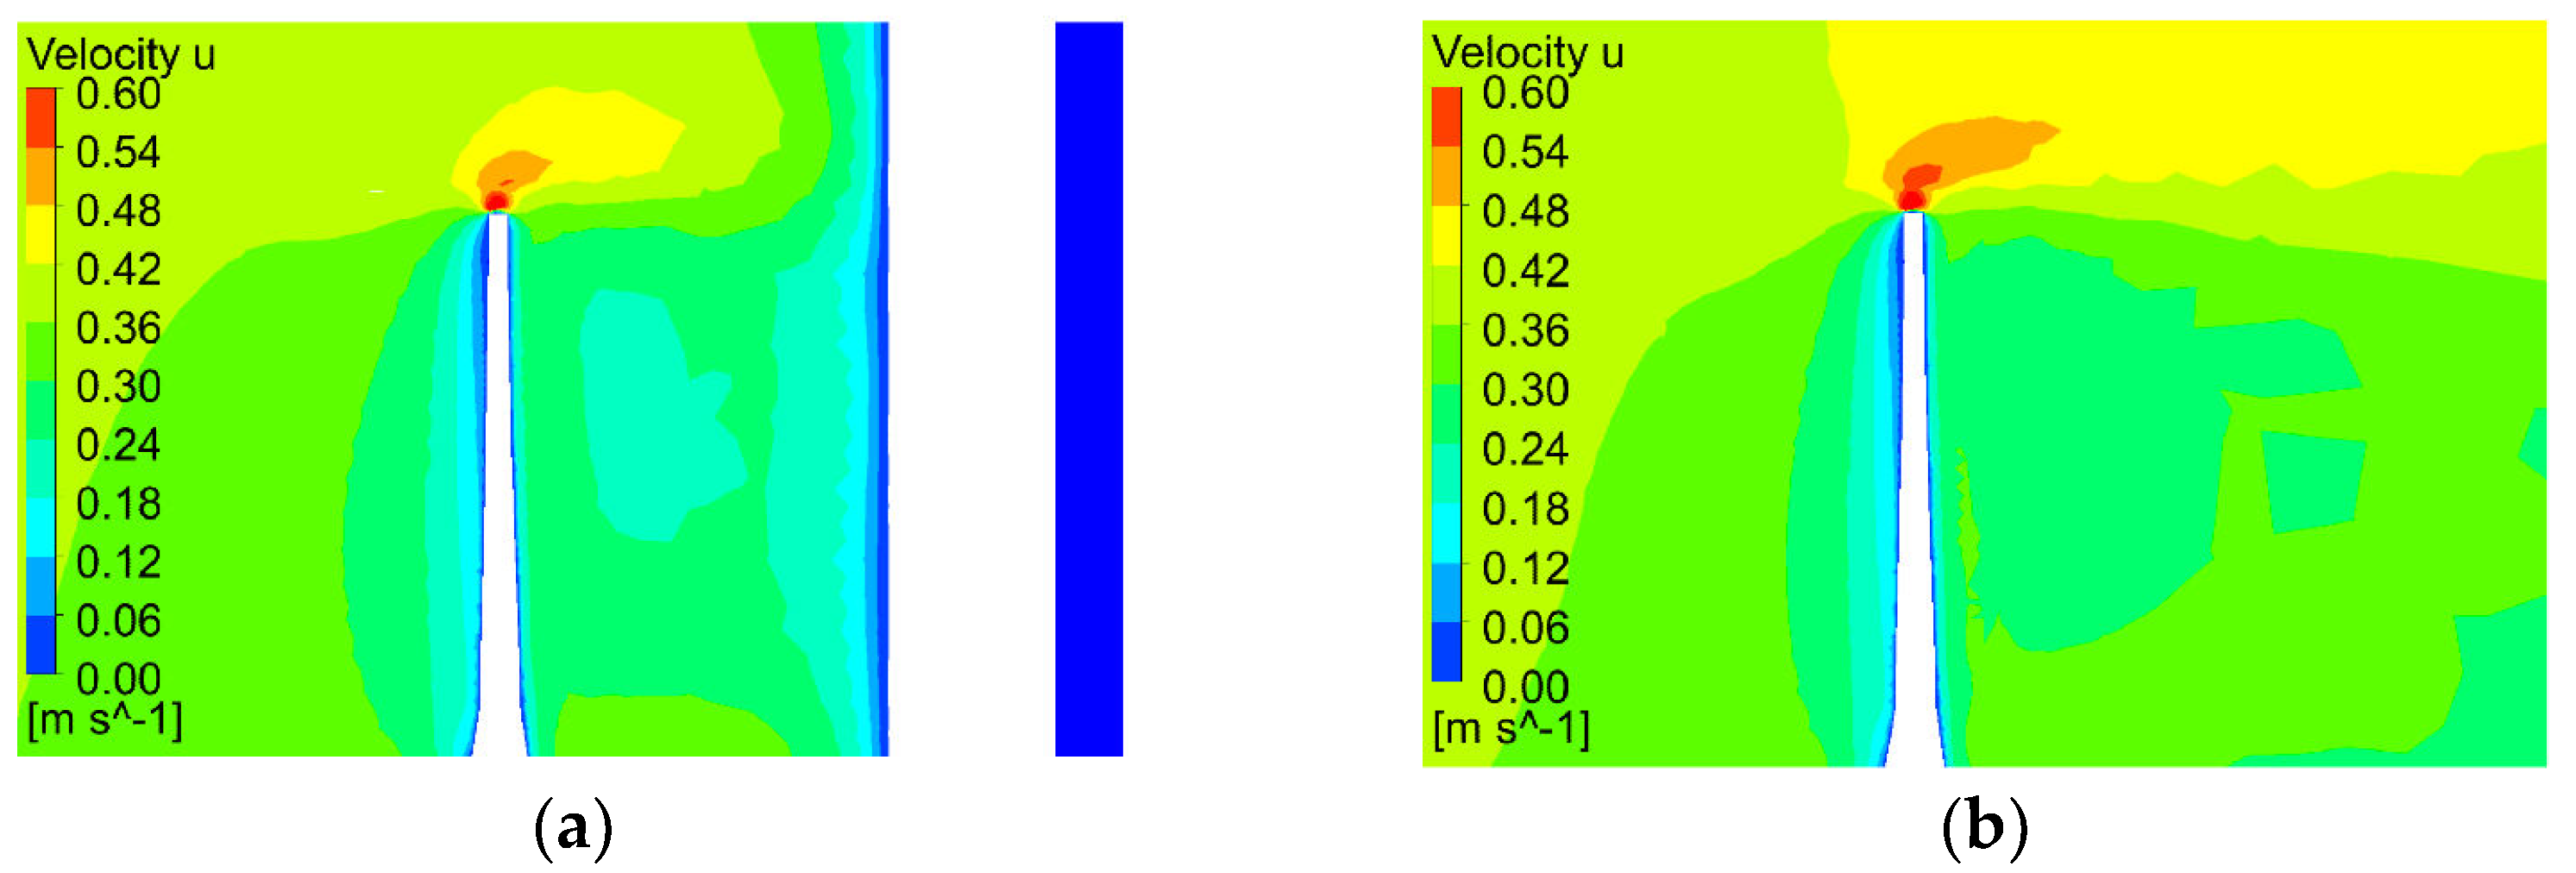
Figure 14 presents the cross-sectional velocity cloud diagram of the runner under different structural conditions. Due to the runner’s rotation direction, the blade’s leading edge speed is the highest, and its slope is the steepest. Low velocity is observed behind the blade, which can cause flow separation on the blade surface, in agreement with the findings of J.N. et al. [32]. Comparing the velocity cloud maps of the lower sections of the two structures, it is evident that the flow field velocity U above the blade and the area near the blade’s trailing edge decrease to some extent under the influence of the rear struts. Figure 15 displays the velocity cloud map of the blade tip at the XZ section of the runner under different structures. The blocking action of the column reduces the range of the high-velocity zone outside the blade tip. To better understand these effects, Figure 16 presents a snapshot of the velocity cloud map distributed at the tip section. The velocity difference between the leading and trailing edges of the blade is mostly concentrated at 2/3 of the blade length. Figure 17 illustrates the static pressure distribution cloud map of the blade section, with differences arising from the variations In the flow velocity U of the fluid under the two support conditions. In general, the lower the flow velocity U on the blade’s upstream surface, the higher the pressure; conversely, the lower the velocity U on the back surface, the lower the pressure. This leads to the generation of lift and drag forces on the blade. The static pressure distribution pattern of the two structures is roughly the same. Under the influence of the column, the pressure on the backside of the blade rises more quickly along the Y direction, and the flow field range of 75 to 190 Pa towards the water surface of the blade is slightly reduced. This difference contributes to the discrepancy between the power coefficient and the thrust coefficient under the two structures.
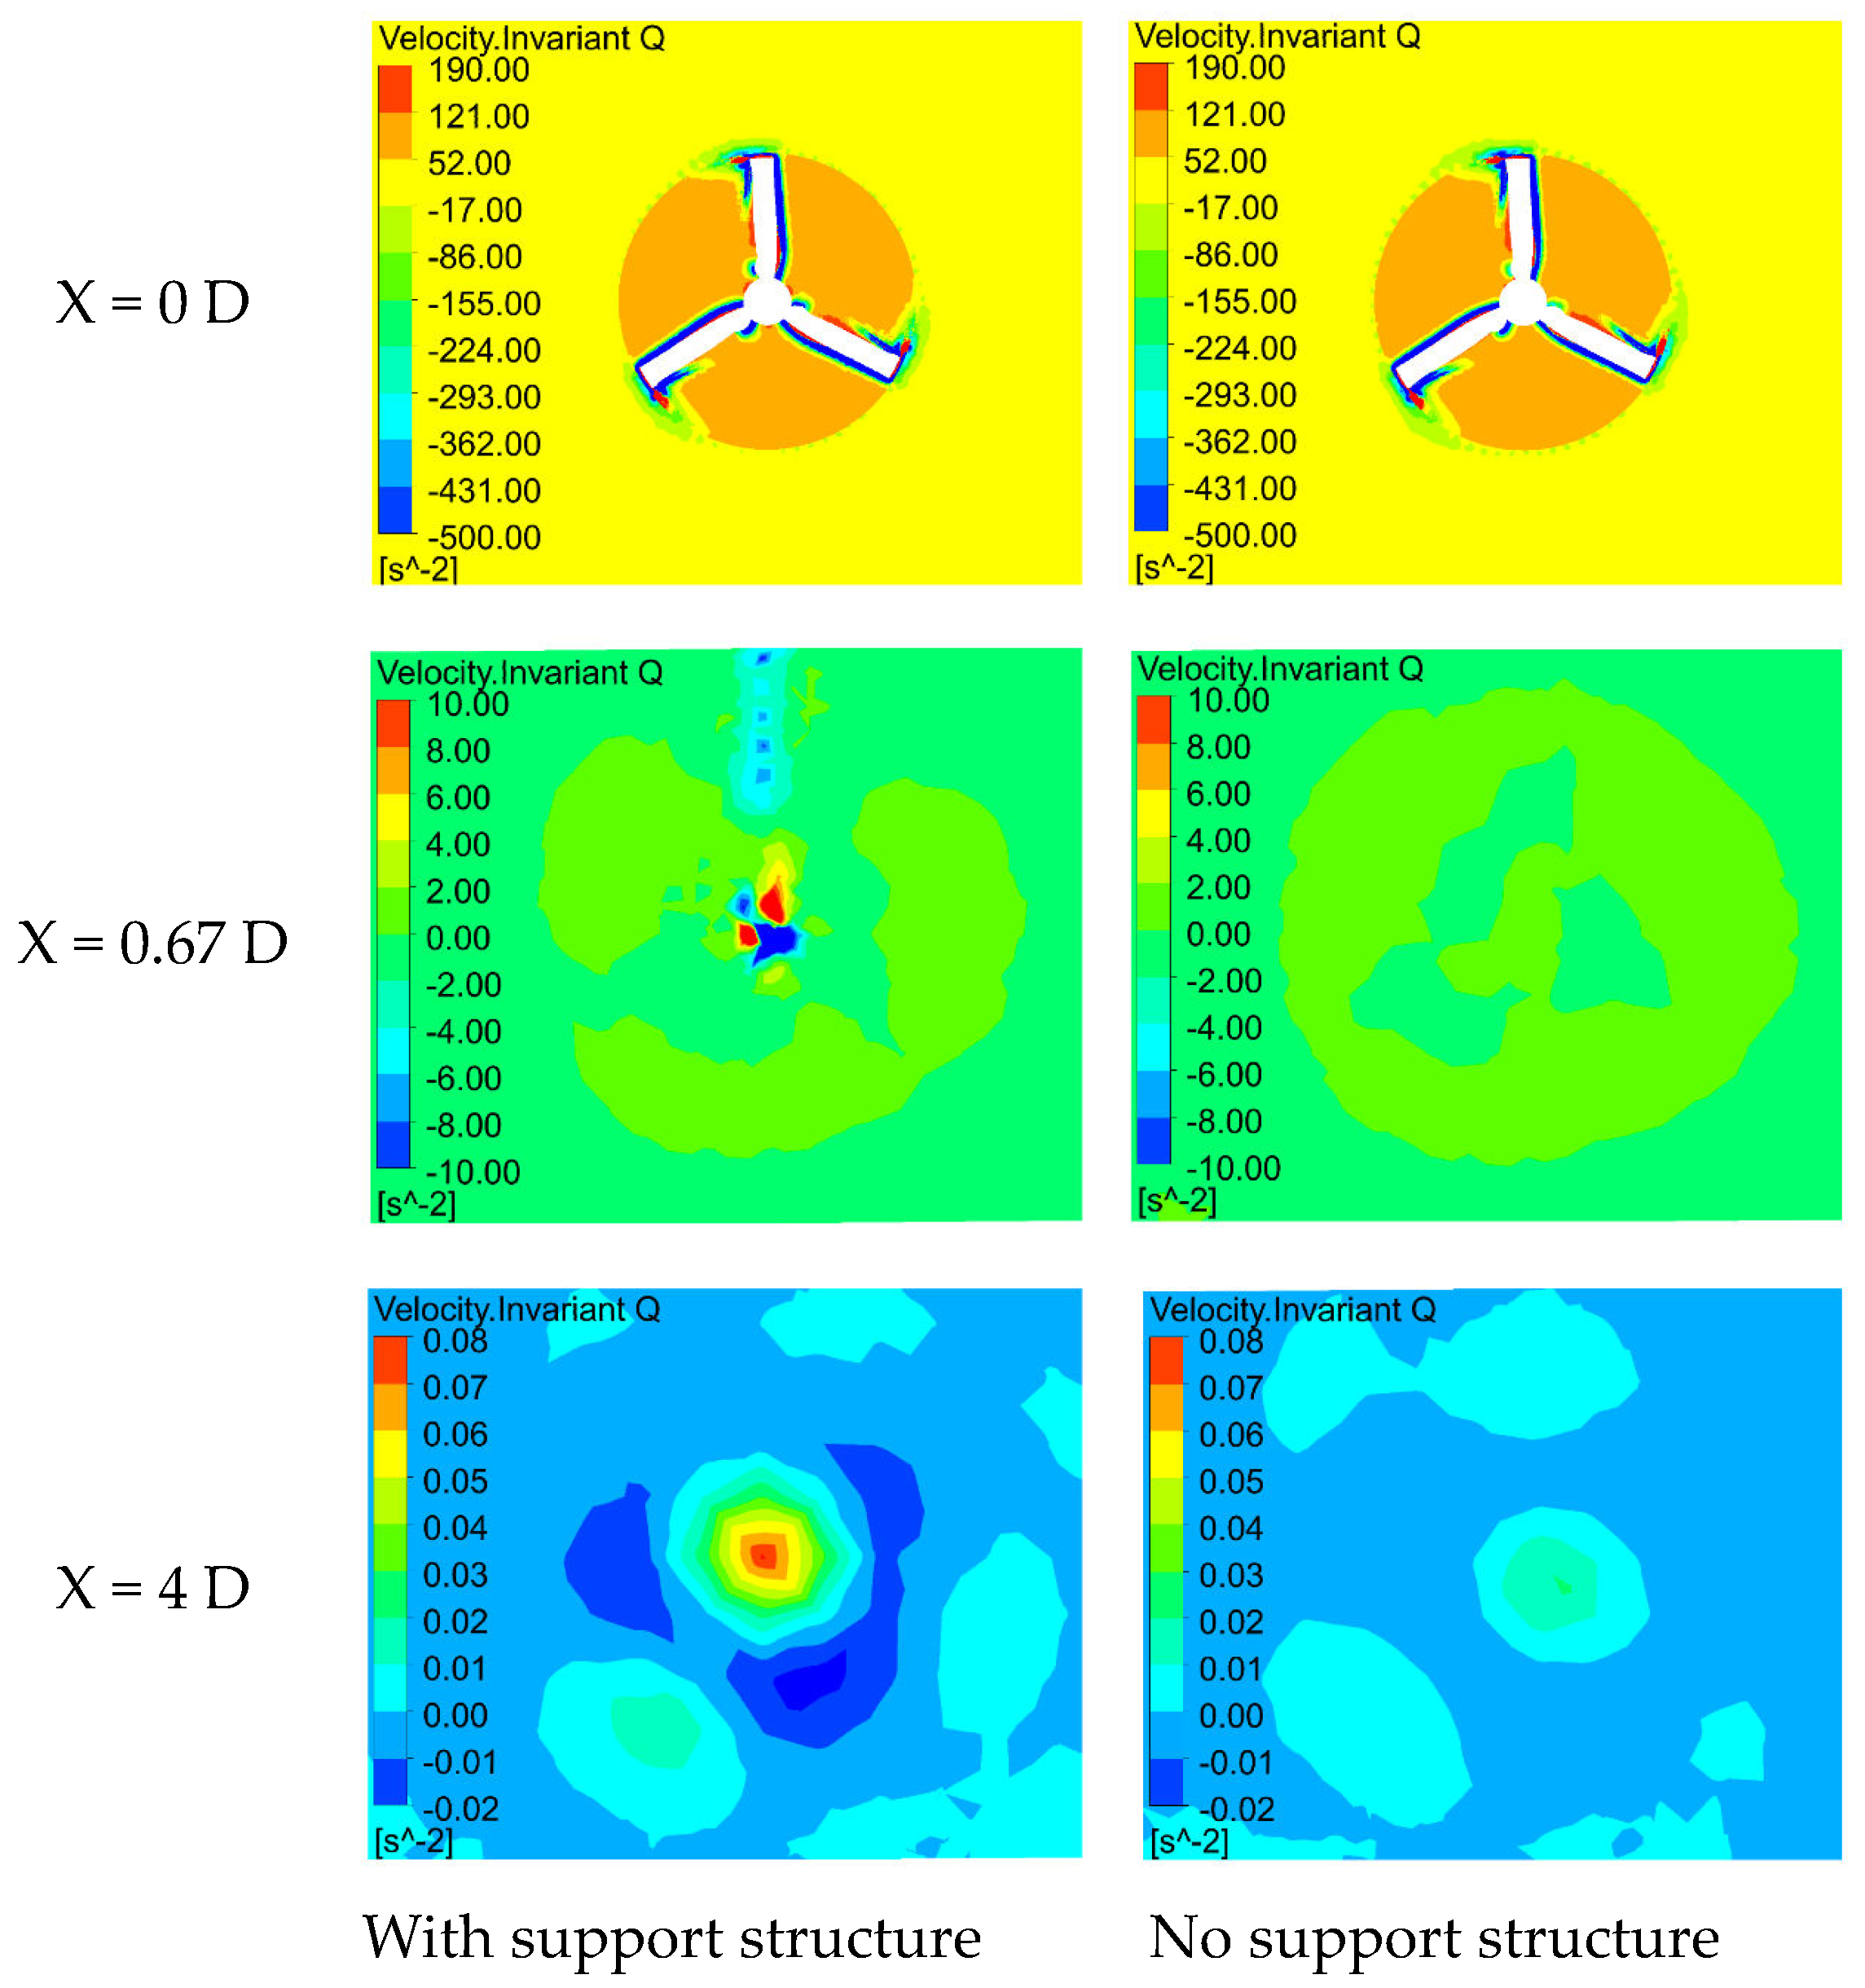
Figure 18 displays the vorticity cloud map of the YZ section, with Figure 18 representing the X = 0 D, 0.67 D, and 4 D positions, respectively. These positions correspond to the blade length, proximity to the column, and distance from the column. It is evident that the vorticity magnitude and distribution pattern change as a function of the downstream distance from the turbine. At X = 0 D, the vorticity amplitude is large and concentrated near the blade surface, primarily due to the influence of the turbine’s rotational effect. As the wake flow expands and diffuses, the amplitude of the vorticity in the far wake field decreases. At X = 0.67 D, the vorticity amplitude is significantly reduced. A Karman vortex is present behind the column due to the flow around the cylinder, which affects the vorticity distribution near the wake area. At X = 4 D, the vorticity amplitude is minimal, primarily affected by the hub obstruction, while the effects of the column are minimal.
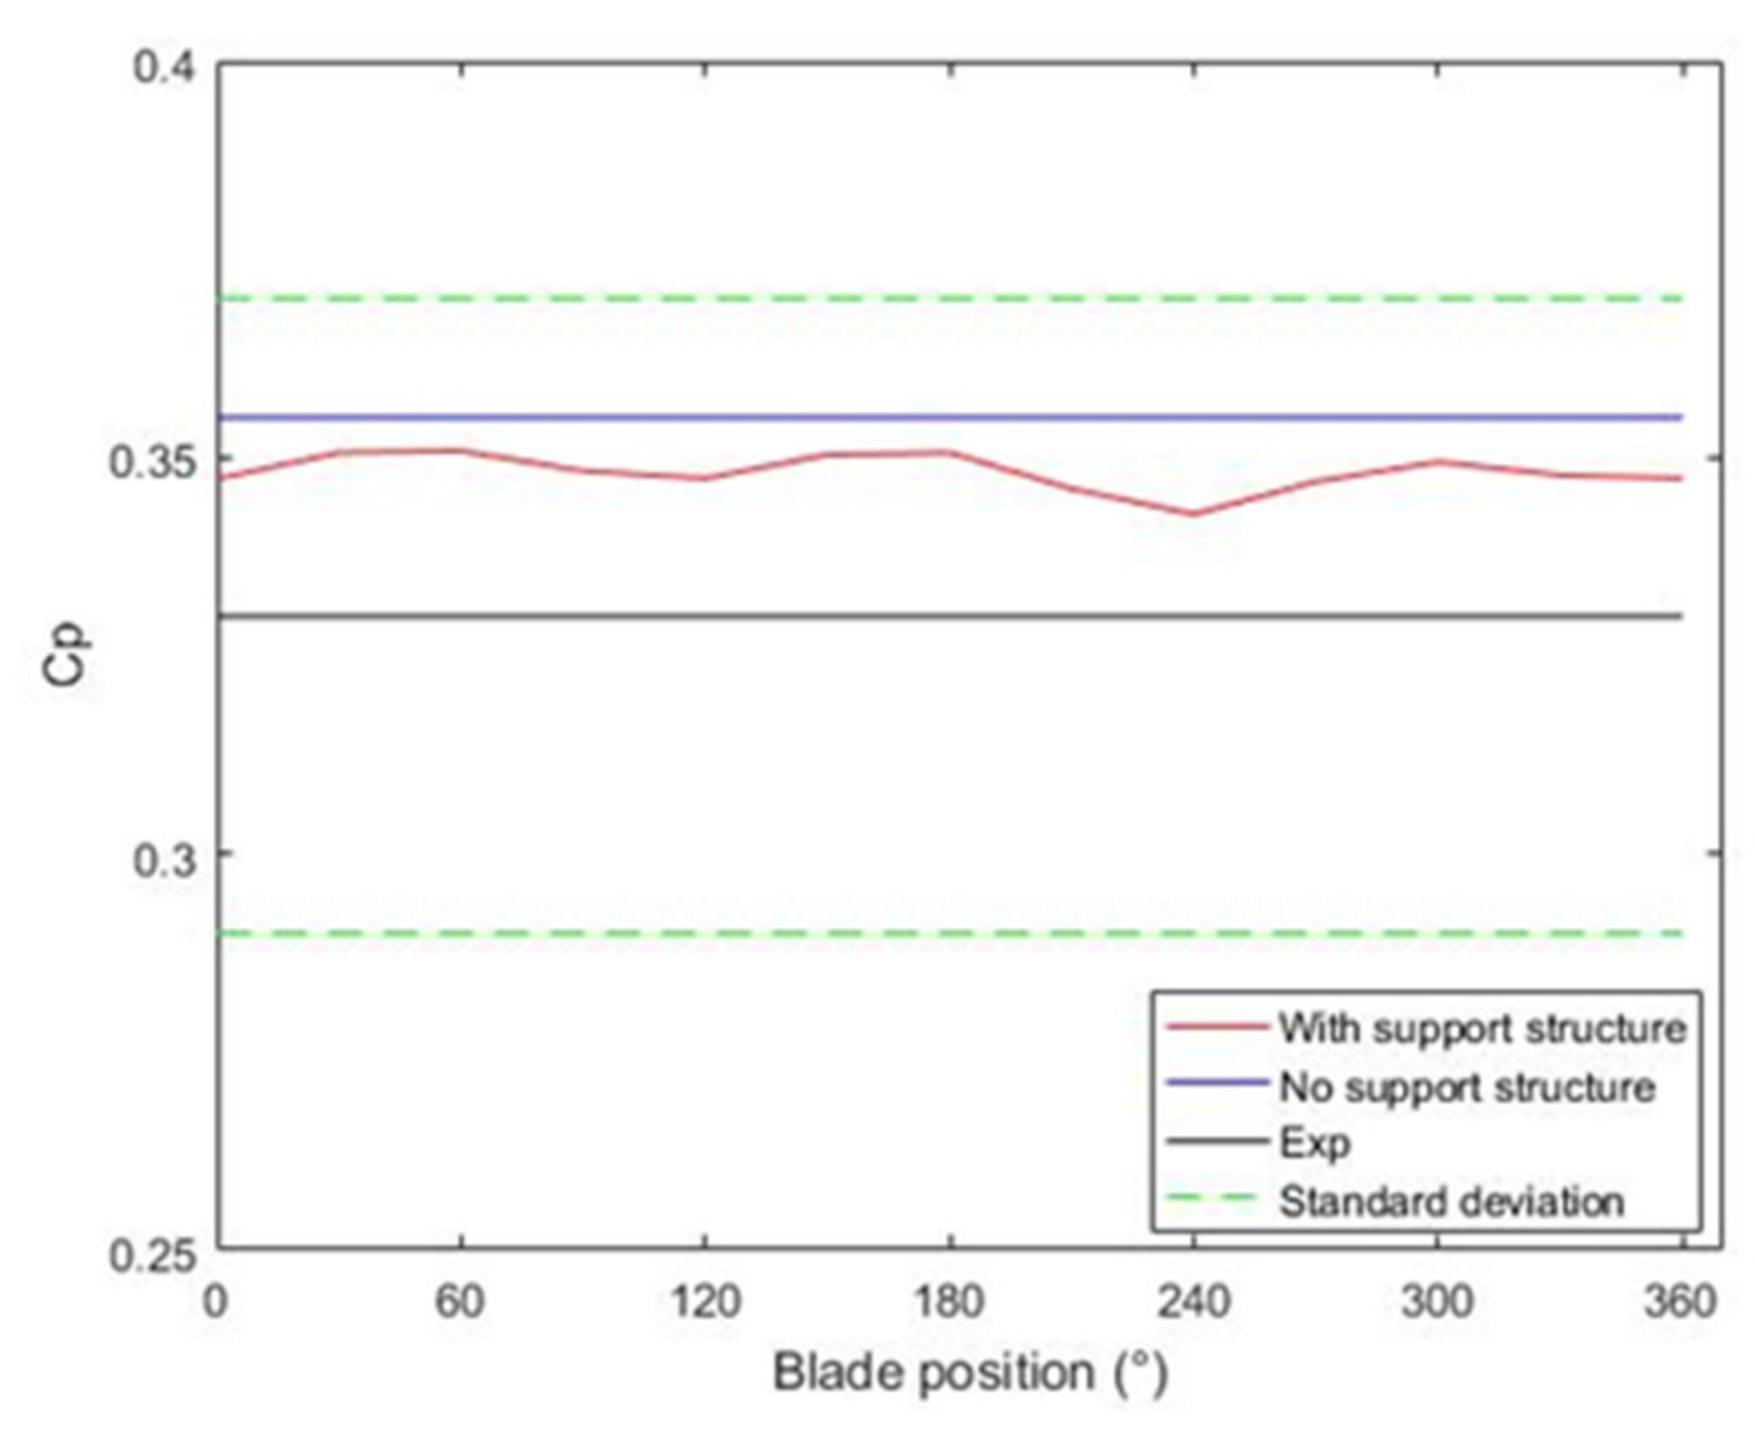
Figure 19 presents a comparison of the instantaneous power coefficient (Cp) with respect to the blade position. When compared to the turbine-alone configuration, the interaction between the three blades and the support column causes fluctuations in the Cp, resulting in a 4% reduction in the maximum power coefficient. Furthermore, the minimum instantaneous value of the impeller’s energy acquisition coefficient appears at small angles, suggesting that the interference from the support column significantly affects turbine performance.

5. Conclusions

In this study, both experimental and CFD-based methods were employed to investigate the wake field characteristics of a horizontal tidal axis stream turbine, focusing on the effects of the support column on the wake field distribution and turbine performance. The main conclusions are as follows.
(1)
In the transverse flow field, the most significant speed loss occurs at the centerline (the rotational axis of the blades), where the support structure obstructs the flow.
(2)
Close to the optimal tip speed ratio for maximum energy conversion, the support column decreases the turbine’s Cp by 4.41%. The support column’s effect on the turbine impeller’s average axial load coefficient is similar, with the support column structure causing a noticeable blockage in the flow at the optimal tip speed ratio, resulting in a slight decrease in the axial load coefficient.
(3)
With the presence of the column structure, the maximum velocity attenuation of the wake field is increased by 3.96%, which occurs at 1.67 D behind the turbine’s centerline. The column reduces both the rate and range of velocity attenuation in the high-velocity zone outside the blade tip, significantly impacting the vorticity in the near wake field.
(4)
The power coefficient, Cp, exhibits periodicity due to the interaction between the blade and the support column, leading to a reduction in the turbine’s average performance.
This study enhances the comprehension of the flow field dynamics in tidal flow turbines, specifically the effects of the support column on turbine performance and wake field distribution. The comparison and analysis of simulation and experimental data demonstrate the usefulness of CFD methods in providing valuable insights for fluid machinery engineering applications. Future research will concentrate on investigating the impact of the column’s shape and its location concerning the upstream and downstream wake field.

Supplementary Materials

The following supporting information can be downloaded at: https://www.mdpi.com/article/10.3390/en16093891/s1, Table S1. 1D lateral wake field distribution diagram at installation elevation. Table S2. 1D longitudinal wake field distribution diagram of installation elevation.

Author Contributions

Data curation, H.G.; methodology, Y.Z.; investigation, J.Z. and C.Y.; software, Z.Z.; resources, B.L.; writing—original draft, J.Z. All authors have read and agreed to the published version of the manuscript.

Funding

This research was funded by National Natural Science Foundation of China, China (Grant No. 52271275).

Data Availability Statement

The data that support this manuscript are available from Y.Z. upon reasonable request.

Acknowledgments

Thanks to Zhang for his advice.

Conflicts of Interest

The authors declare no conflict of interest.

References

  1. Shen, L.; Zhong, S.; Hu, S. Opportunities and challenges of natural resources research of China in the New Era. J. Nat. Resour. 2020, 35, 1773–1788. [Google Scholar] [CrossRef]
  2. Djama Dirieh, N.; Thiebot, J.; Guillou, S.; Guillou, N. Blockage Corrections for Tidal Turbines-Application to an Array of Turbines in the Alderney Race. Energies 2022, 15, 3475. [Google Scholar] [CrossRef]
  3. Liu, J.; Lin, H.; Purimitla, S.R.; Dass, M.E.T. The effects of blade twist and nacelle shape on the performance of horizontal axis tidal current turbines. Appl. Ocean. Res. 2017, 64, 58–69. [Google Scholar] [CrossRef]
  4. Zhang, Y.; Zhang, J.; Lin, X.; Wang, R.; Zhang, C.; Zhao, J. Experimental investigation into downstream field of a horizontal axis tidal stream turbine supported by a mono pile. Appl. Ocean. Res. 2020, 101, 102257. [Google Scholar] [CrossRef]
  5. Zhang, Y.; Zang, W.; Zheng, J.; Cappietti, L.; Zhang, J.; Zheng, Y.; Fernandez-Rodriguez, E. The influence of waves propagating with the current on the wake of a tidal stream turbine. Appl. Energy 2021, 290, 116729. [Google Scholar] [CrossRef]
  6. Zhang, Y.; Zhang, Z.; Zheng, J.; Zhang, J.; Zheng, Y.; Zang, W.; Lin, X.; Fernandez-Rodriguez, E. Experimental investigation into effects of boundary proximity and blockage on horizontal-axis tidal turbine wake. Ocean. Eng. 2021, 225, 108829. [Google Scholar] [CrossRef]
  7. Jo, C.H.; Hwang, S.J. Review on Tidal Energy Technologies and Research Subjects. China Ocean. Eng. 2020, 34, 137–150. [Google Scholar] [CrossRef]
  8. Masters, I.; Williams, A.; Croft, T.N.; Togneri, M.; Edmunds, M.; Zangiabadi, E.; Fairley, I.; Karunarathna, H. A Comparison of Numerical Modelling Techniques for Tidal Stream Turbine Analysis. Energies 2015, 8, 7833–7853. [Google Scholar] [CrossRef]
  9. Alves, J.S.; Gato, L.M.C.; Falcao, A.F.O.; Henriques, J.C.C. Experimental investigation on performance improvement by mid-plane guide-vanes in a biplane-rotor Wells turbine for wave energy conversion. Renew. Sustain. Energy Rev. 2021, 150, 111497. [Google Scholar] [CrossRef]
  10. Wu, M.; Stratigaki, V.; Troch, P.; Altomare, C.; Verbrugghe, T.; Crespo, A.; Cappietti, L.; Hall, M.; Gomez-Gesteira, M. Experimental Study of a Moored Floating Oscillating Water Column Wave-Energy Converter and of a Moored Cubic Box. Energies 2019, 12, 1834. [Google Scholar] [CrossRef]
  11. Zang, W.; Zheng, Y.; Zhang, Y.; Lin, X.; Li, Y.; Fernandez-Rodriguez, E. Numerical Investigation on a Diffuser-Augmented Horizontal Axis Tidal Stream Turbine with the Entropy Production Theory. Mathematics 2023, 11, 116. [Google Scholar] [CrossRef]
  12. Ahmadi, M.H.B.; Yang, Z. The evolution of turbulence characteristics in the wake of a horizontal axis tidal stream turbine. Renew. Energy 2020, 151, 1008–1015. [Google Scholar] [CrossRef]
  13. Zhang, Y.; Zhang, Z.; Zheng, J.; Zheng, Y.; Zhang, J.; Liu, Z.; Fernandez-Rodriguez, E. Research of the array spacing effect on wake interaction of tidal stream turbines. Ocean. Eng. 2023, 276, 114227. [Google Scholar] [CrossRef]
  14. Zhang, Z.; Zhang, Y.; Zheng, Y.; Zhang, J.; Fernandez-Rodriguez, E.; Zang, W.; Ji, R. Power fluctuation and wake characteristics of tidal stream turbine subjected to wave and current interaction. Energy 2023, 264, 126185. [Google Scholar] [CrossRef]
  15. Turnock, S.R.; Phillips, A.B.; Banks, J.; Nicholls-Lee, R. Modelling tidal current turbine wakes using a coupled RANS-BEMT approach as a tool for analysing power capture of arrays of turbines. Ocean. Eng. 2011, 38, 1300–1307. [Google Scholar] [CrossRef]
  16. Vogel, C.; Willden, R. Multi-rotor tidal stream turbine fence performance and operation. Int. J. Mar. Energy 2017, 19, 198–206. [Google Scholar] [CrossRef]
  17. Apsley, D.D.; Stallard, T.; Stansby, P.K. Actuator-line CFD modelling of tidal-stream turbines in arrays. J. Ocean. Eng. Mar. Energy 2018, 4, 259–271. [Google Scholar] [CrossRef]
  18. Muchala, S.; Willden, R.H.J. Impact of tidal turbine support structures on realizable turbine farm power. Renew. Energy 2017, 114, 588–599. [Google Scholar] [CrossRef]
  19. Cao, Y.; Liu, A.; Yu, X.; Liu, Z.; Tang, X.; Wang, S. Experimental tests and CFD simulations of a horizontal wave flow turbine under the joint waves and currents. Ocean. Eng. 2021, 237, 109480. [Google Scholar] [CrossRef]
  20. Muchala, S.; Willden, R.H. Influence of support structures on tidal turbine power output. J. Fluids Struct. 2018, 83, 27–39. [Google Scholar] [CrossRef]
  21. Mason-Jones, A.; O’Doherty, D.M.; Morris, C.E.; O’Doherty, T. Influence of a velocity profile & support structure on tidal stream turbine performance. Renew. Energy 2013, 52, 23–30. [Google Scholar] [CrossRef]
  22. Rehman, Z.U.; Badshah, S.; Rafique, A.F.; Badshah, M.; Jan, S.; Amjad, M. Effect of a Support Tower on the Performance and Wake of a Tidal Current Turbine. Energies 2021, 14, 1059. [Google Scholar] [CrossRef]
  23. Zang, W.; Zheng, Y.; Zhang, Y.; Zhang, J.; Fernandez-Rodriguez, E. Experiments on the mean and integral characteristics of tidal turbine wake in the linear waves propagating with the current. Ocean. Eng. 2019, 173, 1–11. [Google Scholar] [CrossRef]
  24. Qian, Y.; Zhang, Y.; Sun, Y.; Wang, T. Numerical investigations of the flow control effect on a thick wind turbine airfoil using deformable trailing edge flaps. Energy 2023, 265, 126327. [Google Scholar] [CrossRef]
  25. Lee, J.H.; Park, S.; Kim, D.H.; Rhee, S.H.; Kim, M.-C. Computational methods for performance analysis of horizontal axis tidal stream turbines. Appl. Energy 2012, 98, 512–523. [Google Scholar] [CrossRef]
  26. Li, C.; Zheng, Y.; Zhang, Y.; Kan, K.; Xue, X.; Fernandez-Rodriguez, E. Stability Optimization and Analysis of a Bidirectional Shaft Extension Pump. J. Fluids Eng. -Trans. Asme 2020, 142, 6374. [Google Scholar] [CrossRef]
  27. Chen, Y.; Lin, B.; Lin, J.; Wang, S. Effects of stream turbine array configuration on tidal current energy extraction near an island. Comput. Geosci. 2015, 77, 20–28. [Google Scholar] [CrossRef]
  28. Peng, B.; Zhang, Y.; Zheng, Y.; Wang, R.; Fernandez-Rodriguez, E.; Tang, Q.; Zhang, Z.; Zang, W. The effects of surge motion on the dynamics and wake characteristics of a floating tidal stream turbine under free surface condition. Energy Convers. Manag. 2022, 266, 115816. [Google Scholar] [CrossRef]
  29. Li, L.-J.; Zheng, J.-H.; Peng, Y.-X.; Zhang, J.-S.; Wu, X.-G. Numerical investigation of flow motion and performance of a horizontal axis tidal turbine subjected to a steady current. China Ocean. Eng. 2015, 29, 209–222. [Google Scholar] [CrossRef]
  30. Arabgolarcheh, A.; Jannesarahmadi, S.; Benini, E. Modeling of near wake characteristics in floating offshore wind turbines using an actuator line method. Renew. Energy 2022, 185, 871–887. [Google Scholar] [CrossRef]
  31. Thiebot, J.; du Bois, P.B.; Guillou, S. Numerical modeling of the effect of tidal stream turbines on the hydrodynamics and the sediment transport-Application to the Alderney Race (Raz Blanchard), France. Renew. Energy 2015, 75, 356–365. [Google Scholar] [CrossRef]
  32. Goundar, J.N.; Ahmed, M.R. Marine current energy resource assessment and design of a marine current turbine for Fiji. Renew. Energy 2014, 65, 14–22. [Google Scholar] [CrossRef]
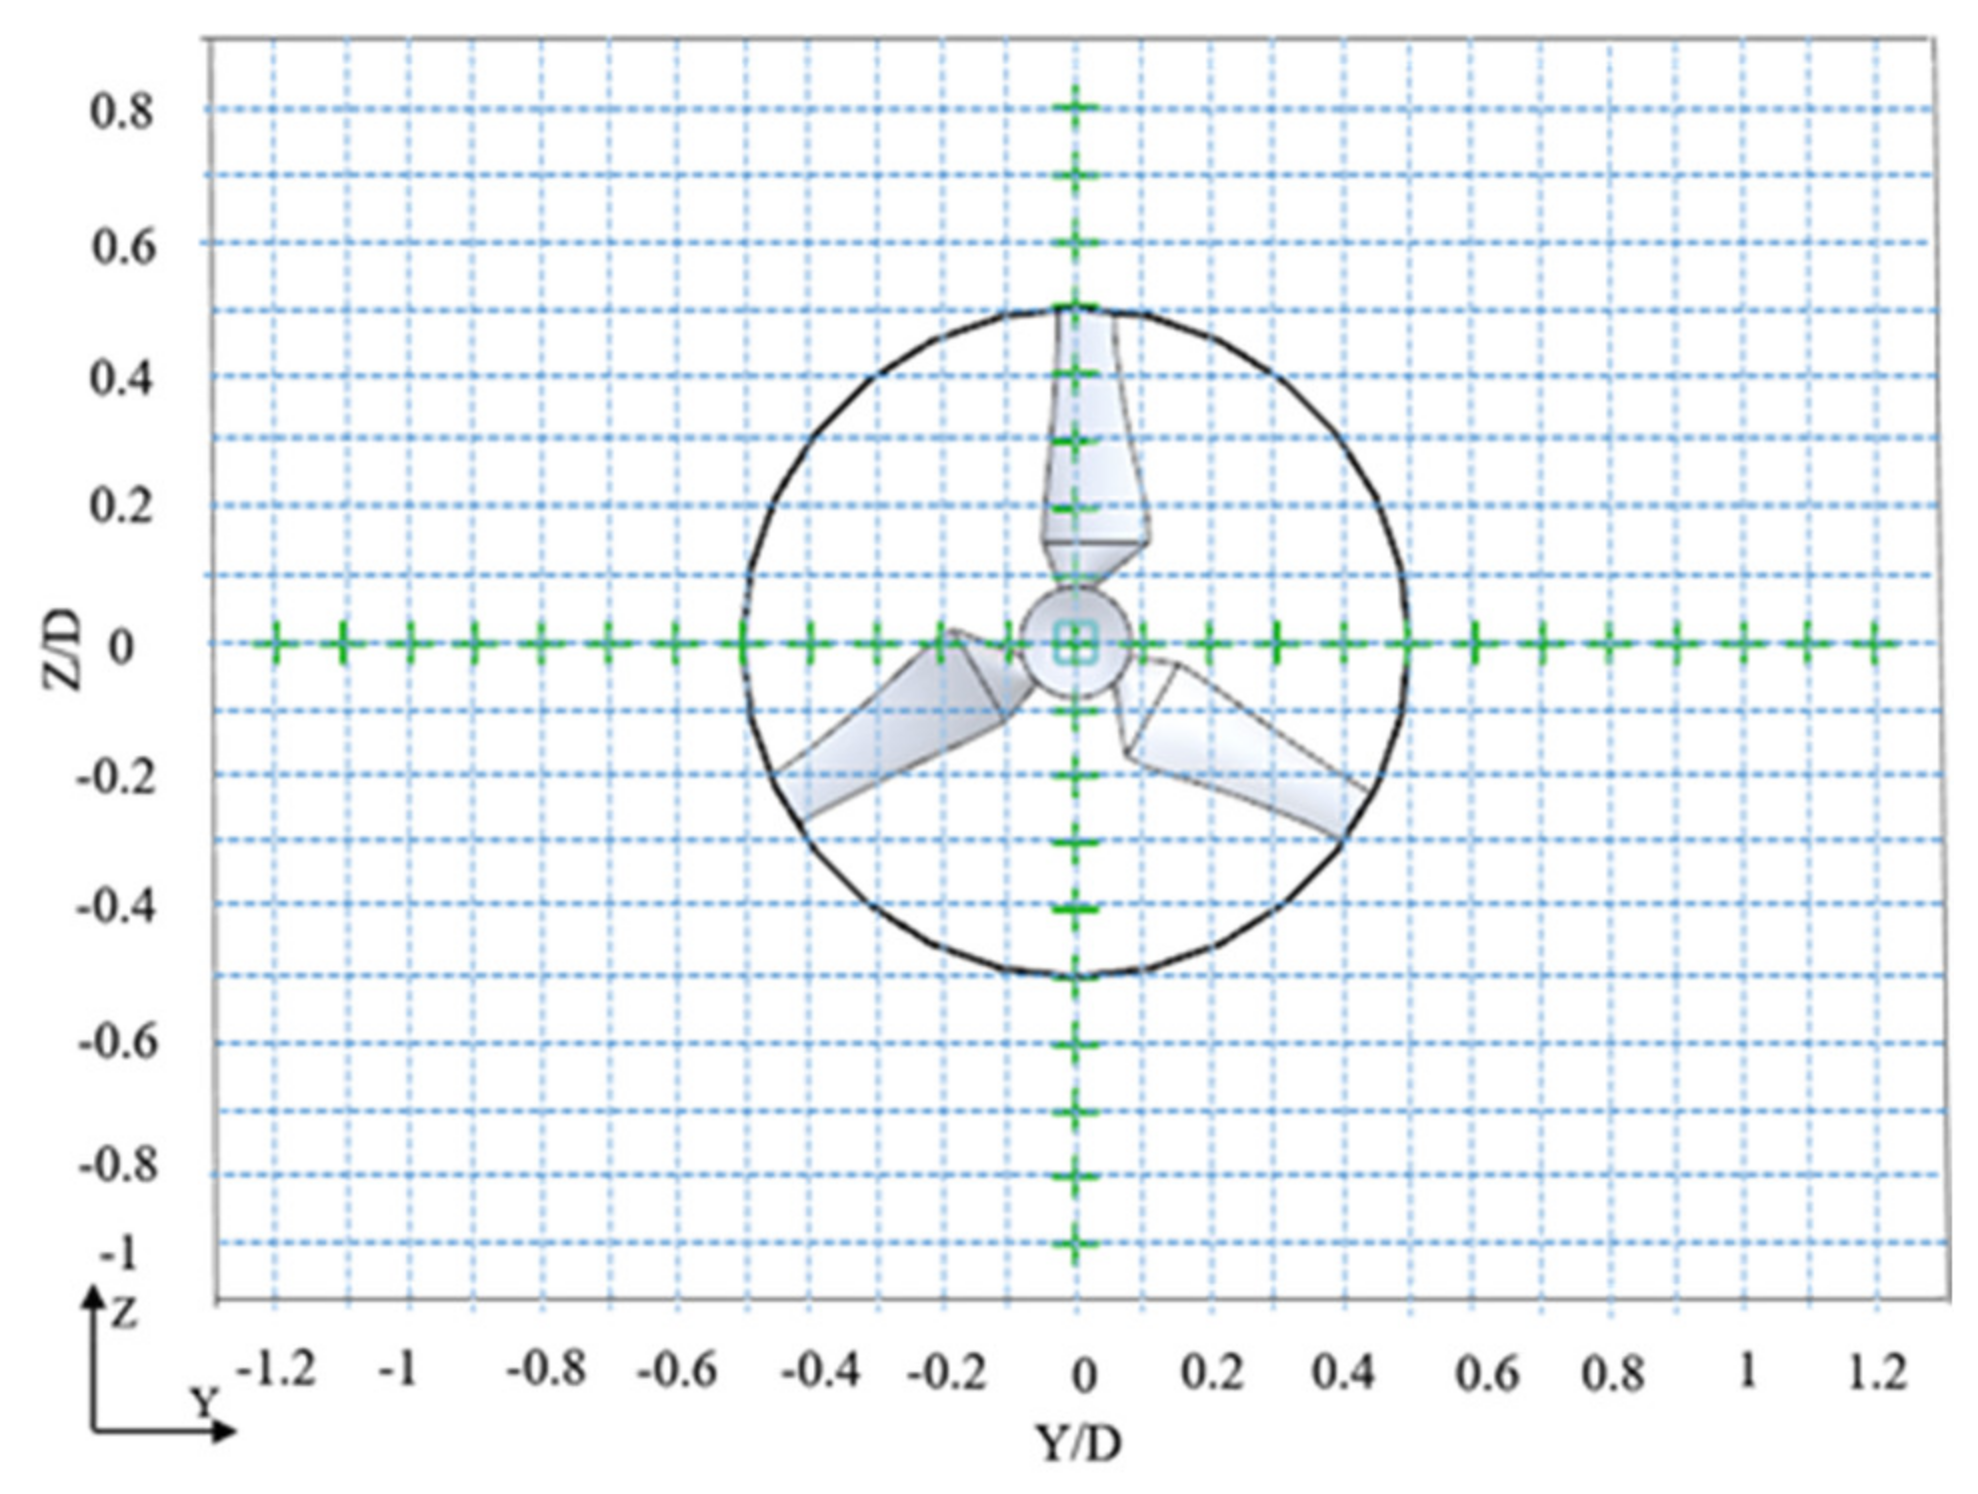
Figure 1. Schematic diagram of YZ plane measuring points.
Energies 16 03891 g001
Figure 2. Dimensional drawing of component structure.
Energies 16 03891 g002
Figure 3. Installation equipment diagram.
Energies 16 03891 g003
Figure 4. CFD calculation model.
Energies 16 03891 g004
Figure 5. Schematic diagram of the runner mesh domain.
Energies 16 03891 g005
Figure 6. 1 D lateral wake field distribution diagram at installation elevation.
Energies 16 03891 g006
Figure 7. 1 D longitudinal wake field distribution diagram at installation elevation.
Energies 16 03891 g007
Figure 8. Contours of velocity change. (a) In lateral flow field; (b) In longitudinal flow field.
Energies 16 03891 g008
Figure 9. Streamline distribution diagram of the horizontal axis tidal stream turbine.
Energies 16 03891 g009
Figure 10. The curve of power coefficient (Cp) with tip speed ratio (TSR).
Energies 16 03891 g010
Figure 11. The curve of power coefficient (Cp) and thrust coefficient (Ct) with tip speed ratio (TSR).
Energies 16 03891 g011
Figure 12. Schematic diagram of velocity curve interception. (a) With support structure; (b) No support structure.
Energies 16 03891 g012
Figure 13. Velocity attenuation curves at different positions in the wake field.
Energies 16 03891 g013
Figure 14. Velocity cloud diagram of runner YZ section. (a) With support structure; (b) No support structure.
Energies 16 03891 g014
Figure 15. XZ section velocity cloud diagram of blade tip. (a) With support structure; (b) No support structure.
Energies 16 03891 g015
Figure 16. Blade section velocity cloud diagram. (a) With support structure; (b) No support structure.
Energies 16 03891 g016
Figure 17. Blade section pressure cloud diagram. (a) With support structure; (b) No support structure.
Energies 16 03891 g017
Figure 18. Vortex cloud diagram X of YZ section of turbine.
Energies 16 03891 g018
Figure 19. Comparison chart of instantaneous value Cp.
Energies 16 03891 g019
Table 1. Mesh independence verification of computational domain.
CaseNo. of CellsMean Power Coefficient CpRelative Error (%)
Coarsest2,000,000 (2.0 M)0.285416.1
Coarse2,700,000 (2.7 M)0.30629.99
Medium3,000,000 (3.0 M)0.32175.44
Fine3,300,000 (3.3 M)0.3402-
Finest4,200,000 (4.2 M)0.34030.03
Disclaimer/Publisher’s Note: The statements, opinions and data contained in all publications are solely those of the individual author(s) and contributor(s) and not of MDPI and/or the editor(s). MDPI and/or the editor(s) disclaim responsibility for any injury to people or property resulting from any ideas, methods, instructions or products referred to in the content.