Article

Long-Term Self-Discharge Measurements and Modelling for Various Cell Types and Cell Potentials

Research Group Electromobility and Learning Systems, Technische Hochschule Ingolstadt, D-85049 Ingolstadt, Germany
*
Authors to whom correspondence should be addressed.
Energies 2023, 16(9), 3889; https://doi.org/10.3390/en16093889
Submission received: 30 March 2023 / Revised: 25 April 2023 / Accepted: 28 April 2023 / Published: 4 May 2023

Abstract

:
Self-discharge of lithium-ion cells leads to voltage decay over time. In this work, the self-discharge was measured at 30 °C for three cell types at various voltage levels for about 150 days in a constant voltage mode determining the current at a high precision (float current). All cells exhibit a transient part leading to a steady-state, which is no longer influenced by reversible effects. To study the effect of the check-ups on the steady-state float current, the cells, interrupted and not interrupted by check-ups, were compared. The results indicate that both the transient processes and steady-state currents are highly reproducible. In the first period of the float current, the polarization dominates the measured current, followed by the anode overhang effect dominating the process for a period of 5–30 days. After the decline of both processes, a mostly constant steady-state in the order of µA is observed. The check-up interruption generally shows no apparent effect on the reached steady-state and results only in an extended settling time. A model to simulate the transient process and steady-state of float currents was developed. The model shows a high accuracy in reproducing the results and identifying the time needed to reach the steady-state.

1. Introduction

Lithium-ion batteries are widely used in many applications, including electric vehicles and power tools, and there is a growing demand for long-lasting cells [1,2]. The determination of the electrical characteristics of lithium-ion batteries, such as capacity, internal resistance, impedance, and self-discharge rate, is essential for the determination of their performance and end-of-life expectancy. Especially for uninterruptable power supply (UPS) applications, determining and understanding self-discharge is very important but also challenging [3,4].
Self-discharge was measured in two ways. One is resting a cell at a defined voltage in an open-circuit mode and measuring the voltage decay over time. The other strategy is to keep the defined voltage constant in a potentiostatic experiment measuring the current over time. In case the voltage decay during open-circuit-voltage (OCV) is not measurably changing the self-discharge rate and the constant voltage (CV) experiment is not triggering additional aging mechanisms, both strategies should achieve the same results for self-discharge [5].
A good example of an OCV experiment was performed by Deutschen et al. [6], who measured the voltage decay for a period of 160 days for 40 Ah NMC/graphite cells. They observed a faster decay in the first 20–30 days, followed by a linear-like decay. Therefore, the slope of the linear-like decay increased with higher temperatures.
The constant voltage experiment was performed by Lewerenz et al. [7] using LFP/graphite for various temperatures at 100% SOC/3.6 V. The experiments lasted for up to 180 days. For 25 °C and 40 °C, they found a transient part after a check-up for 30–50 days, followed by a steady-state current that was constant at 25 °C and linearly rising over time at 40 °C. At higher temperatures, the steady-state current was found to change over time and among the cells, highlighting that the cell is not in a stable condition anymore. Moreover, they did not link the steady-state current to a simple reversible loss of state-of-charge, but to the capacity loss rate measured during check-ups. Theiler et al. [8] evaluated the steady-state in a similar experiment using NCA/graphite for five different cell voltages. They also found a high correlation with the capacity fade rate. Zilberman et al. [9] came to similar results for nickel-rich cathodes and silicon-graphite anodes. This implies that self-discharge after the transient part ages irreversibly. However, a clear theory about this link has not yet been reported.
Thus, both strategies show comparable results: an initial transient process converting into a constant/linear steady-state. The initial transient process is likely linked to charge redistribution in the cell e.g., from smaller to larger particles, from separator near to separator far particles, and within a particle. The time constant in that case depends on the diffusion length which is lowest in the direction of electrode thickness in the µm range and largest over the electrode area in the cm range. The charge redistribution over the electrode area is reported in the literature as the anode overhang effect or passive electrode effect and was found in conjunction with a larger geometrical anode to cathode area [7]. Because only lithium ions are transported through the electrode due to this effect, this is regarded to be reversible as no irreversible reaction takes place [10]. Distinguishing between reversible and irreversible capacity loss is also essential, with anode overhang [11] being a major contributor to reversible capacity loss. The anode overhang can influence the early capacity trajectory in the order of weeks to several months of storage depending on area, SOC, and temperature [11,12] and potentially lead to misinterpretation of self-discharge measurements [12].
Modelling of the diffusion and especially the anode overhang helps interpret the underlying steady-state self-discharge current, which correlates with aging. In order to combine the factors influencing the effect of the anode overhang, numerous models have been developed. A Newman-type 0D-electrochemical model was presented by Fath et al. [13]. This model resolved different areas of the anode overhang by superposition. Schmalstieg et al. [14] integrated the passive anode in a pseudo-2D-electrochemical model and showed that it allowed simulating the effect of the anode overhang. The model-based approach of Hildenbrandt et al. [15] highlighted the importance of integrating the near and far anode overhang effects while undergoing capacity tests. Hüfner et al. [16] demonstrated the importance of temperature and graphite anode voltage curve for a suitable model. In conclusion, self-discharge and the reversible transient effects, such as anode overhang effect, are not yet fully understood. Therefore, data for different cell types and cell voltages that are evaluated with a dedicated model are necessary.
The scope of this paper is to measure the self-discharge rate over a long period for three different cell types at different cell potentials. Therefore, the cells are kept at a constant voltage while measuring the float current that flows to keep the voltage constant with high precision.
The main focus is to measure the different phases of self-discharge, assign them to transport and aging mechanisms, and to fit a model to the results. Therefore, the influence of a check-up procedure, reproducibility, and float voltage dependence are analyzed and compared. First, the necessary data filtering is described in Section 2. The results are separated into the high-current range in Section 3.1 and the low-current range in Section 3.2. The developed model including polarization, anode overhang, and steady-state effects is presented in Section 3.3 and Section 3.4.

2. Materials and Methods

For this study, 30 cylindrical 18650 cells of three different cell types with different cathode active materials and capacities were investigated. Detailed information about the test cells is given in Table 1 with the abbreviations A123, PAN, and SAN that will be used in the following. The cells were tested using a 0–5 V/5 A LBTa2030 battery-cycler from Arbin Instruments. The cells were placed in an ACS temperature chamber (DY110). All tests were performed at a constant chamber temperature of 30 °C.
The cells are initially and intermediately characterized by a check-up. The evaluation of the check-up is beyond the scope of this paper and will be discussed in a follow-up paper. In this paper, only the influence on the transient process is considered. The check-up started with a capacity test at a higher current, followed by a low-current cycle. Finally, a pulse test was performed.
The cells were aged, keeping the cells at a constant voltage (float voltage) according to the test matrix in Table 2. Therefore, the cells are charged from a fully discharged state with 0.1 C constant current to the desired float voltage. Thereafter, the experiment started, and the float currents during the constant voltage phase were evaluated. One group of cells was interrupted by check-ups, and the other group was floated continuously after the initial check-up (Table 2).
The data towards lower float currents of roughly 1 mA reveals substantial control noise, making strong filtering of the raw data necessary. The origin of the noise can be attributed to either the measurement system or to the temperature fluctuations within the climate chamber. The latter causes an increase or decrease in the open-circuit voltage (OCV) during temperature rises due to the entropy effect in the lithium-ion cells [17] and vice versa. The magnitude and the sign of the entropy coefficient depend strongly on the cell’s chemistry and float voltage [18]. Therefore, temperature change of cells with different float voltages will result in changes with different magnitudes and signs. A significant contribution of this effect was not observed during our measurements.
In contrast, the temperature dependence of the measurement system is independent of the cell characteristics and therefore has the same sign and roughly the same magnitude. The challenges of the measurement system are the noise of the voltage measurement and the quantization of the output current. A large quantization of current and voltage causes the final value of the current to never reach a constant level, but to always oscillate between quantization steps. Additionally, these values are not only influenced by environmental temperature but also by humidity changes, leading to short-term and long-term drifts.
As most of the noise is in phase for several float voltages, the contribution of the measurement system appears to be the most significant, making excessive filtering necessary. For filtering, we used the obtained cumulated charge of the float current data for the derivation of the float current. On the one hand, filtering the measured current directly was not an efficient solution. Due to the fact that the measurement values have a remarkably high noise and fluctuate between two values, the filtered current did not show a reasonable current course. Therefore, it cannot be concluded whether the preformed filtering is reasonably good or not. On the other hand, filtering the cumulated charge resulted in a much more precise course than filtering the measured current data, and is thus used for the derivation of the float current. The cumulated charge curve is then subdivided into three main sections, as shown in Figure 1a.
The identification of these sections was performed using the breakpoints function in MATLAB. The first section does not need filtering and is therefore taken as measured. The two other sections are then filtered using the Shape Language Modelling (SLM) tool [19]. It is a curve-fitting tool used to build an infinite number of curve types from data. The idea is to use a set of shape primitives to provide curve-fitting prescriptions based on the identified breakpoints. The only difference between sections two and three is the degree of fitting used for the SLM tool. For the second section, a higher polynomial degree is used than in the third section, which uses a first-order polynomial. An example of the filtering results for the SAN cell at 3.7 V is shown in Figure 1b.
As we can see from Figure 1c, the disturbances that occur during the measurement are neglected and the course of the cumulated charge is fitted to the best of our knowledge. After obtaining the filtered curves, we derive the float current from the cumulated charge over time. To reduce the need for sophisticated filtering in future experiments, we are developing an optimized measurement hardware for future examinations of float currents that features a low temperature and humidity dependency as well as fine quantization of voltage/current control and measurement.

3. Results and Discussion

3.1. Transient Process at High Currents

The results for the transient part of the unfiltered float currents higher than 1 mA are displayed in Figure 2. The results are separated by cell type in three graphs. In each graph, the cell voltages are illustrated by their color rising from blue to red with higher cell voltage. The transient parts after the check-ups are plotted on top of each other, showing only small deviations for a specific cell voltage. Thus, the transient process is independent of the check-up frequency. The time constant of this process is not clearly dependent on cell voltage, as no sorting according to voltage (color) is observable. While the trends of the A123 cells with an LFP cathode are not comparable to the other cell types, the PAN (NCA) and SAN (NMC) with a layered oxide cathode show a comparable trend in cell voltages > 3.7 V. Only the dark blue lines show differences that might be explained by a 66 mV voltage difference.

3.2. Transient Process at Low Currents

The transient process at low currents shown in Figure 3 is plotted in the same structure as Figure 2, while the different transient parts are plotted one after another. As mentioned earlier, the low-current data were filtered to correct the noise of the measurement device. Firstly, we must highlight that the sorting and the shape of the transient process are significantly different from the results in Figure 2. Therefore, we conclude that in this part, another effect is dominating the transient phase.
For all three cell types, the float currents sorted mostly according to their cell voltage, with the exception of bright blue lines in all three graphs and dark blue for A123. This sorting, according to the voltage, indicates that a process involving aging is likely. Except for PAN 4.0 V and 4.2 V the float currents settled to a relatively constant value. The high reproducibility of the two cells for SAN at 4.2 V is eye-catching, showing hardly any deviation. At the lowest voltages in dark blue for A123 and SAN, an undershoot of float currents was observed, which lead to an intermediate discharge of the cells, and after a few days a positive value was finally reached.
Sorting and undershooting are valuable hints that this transient process is dominated by the anode overhang effect. Moreover, in a simple cell disassembling (not shown here), we found a large anode overhang for A123 with continuous double-sided coating, whereas for the PAN, the outermost anode was coated single-sided. As the SAN was not disassembled, we deduce a comparably large anode overhang for A123 and SAN, explaining the strong undershoot at low cell voltage.
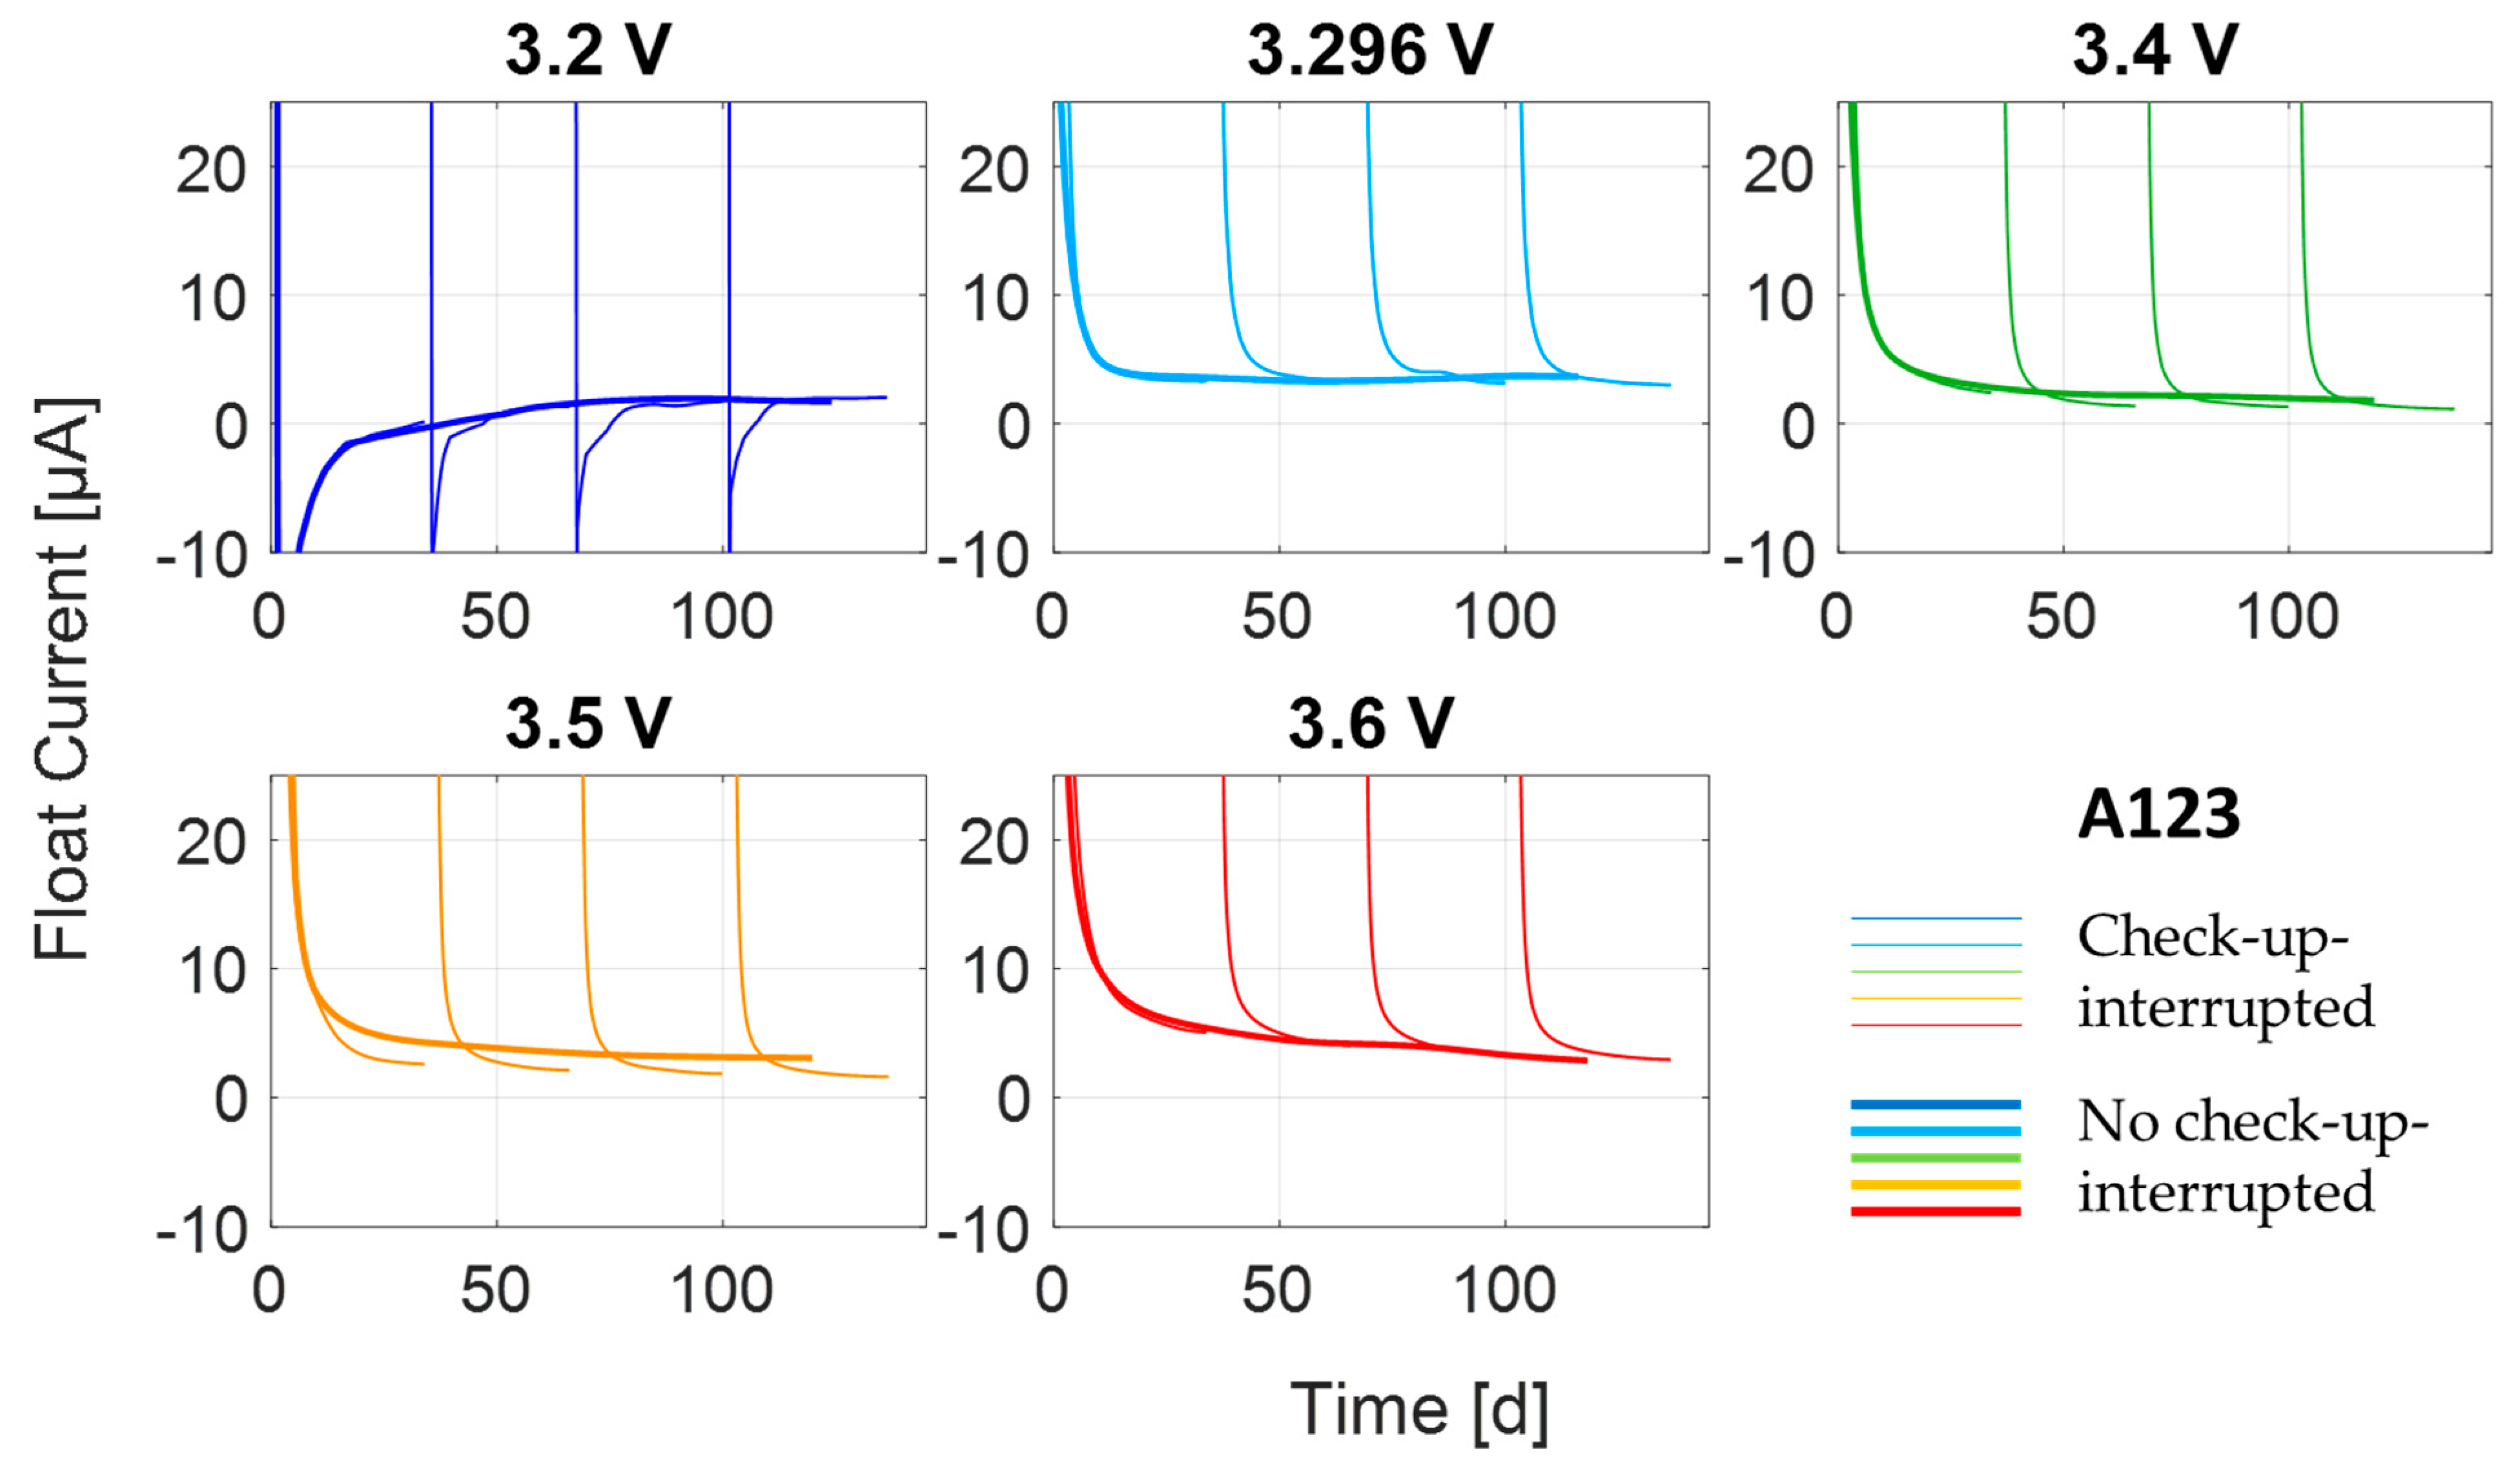
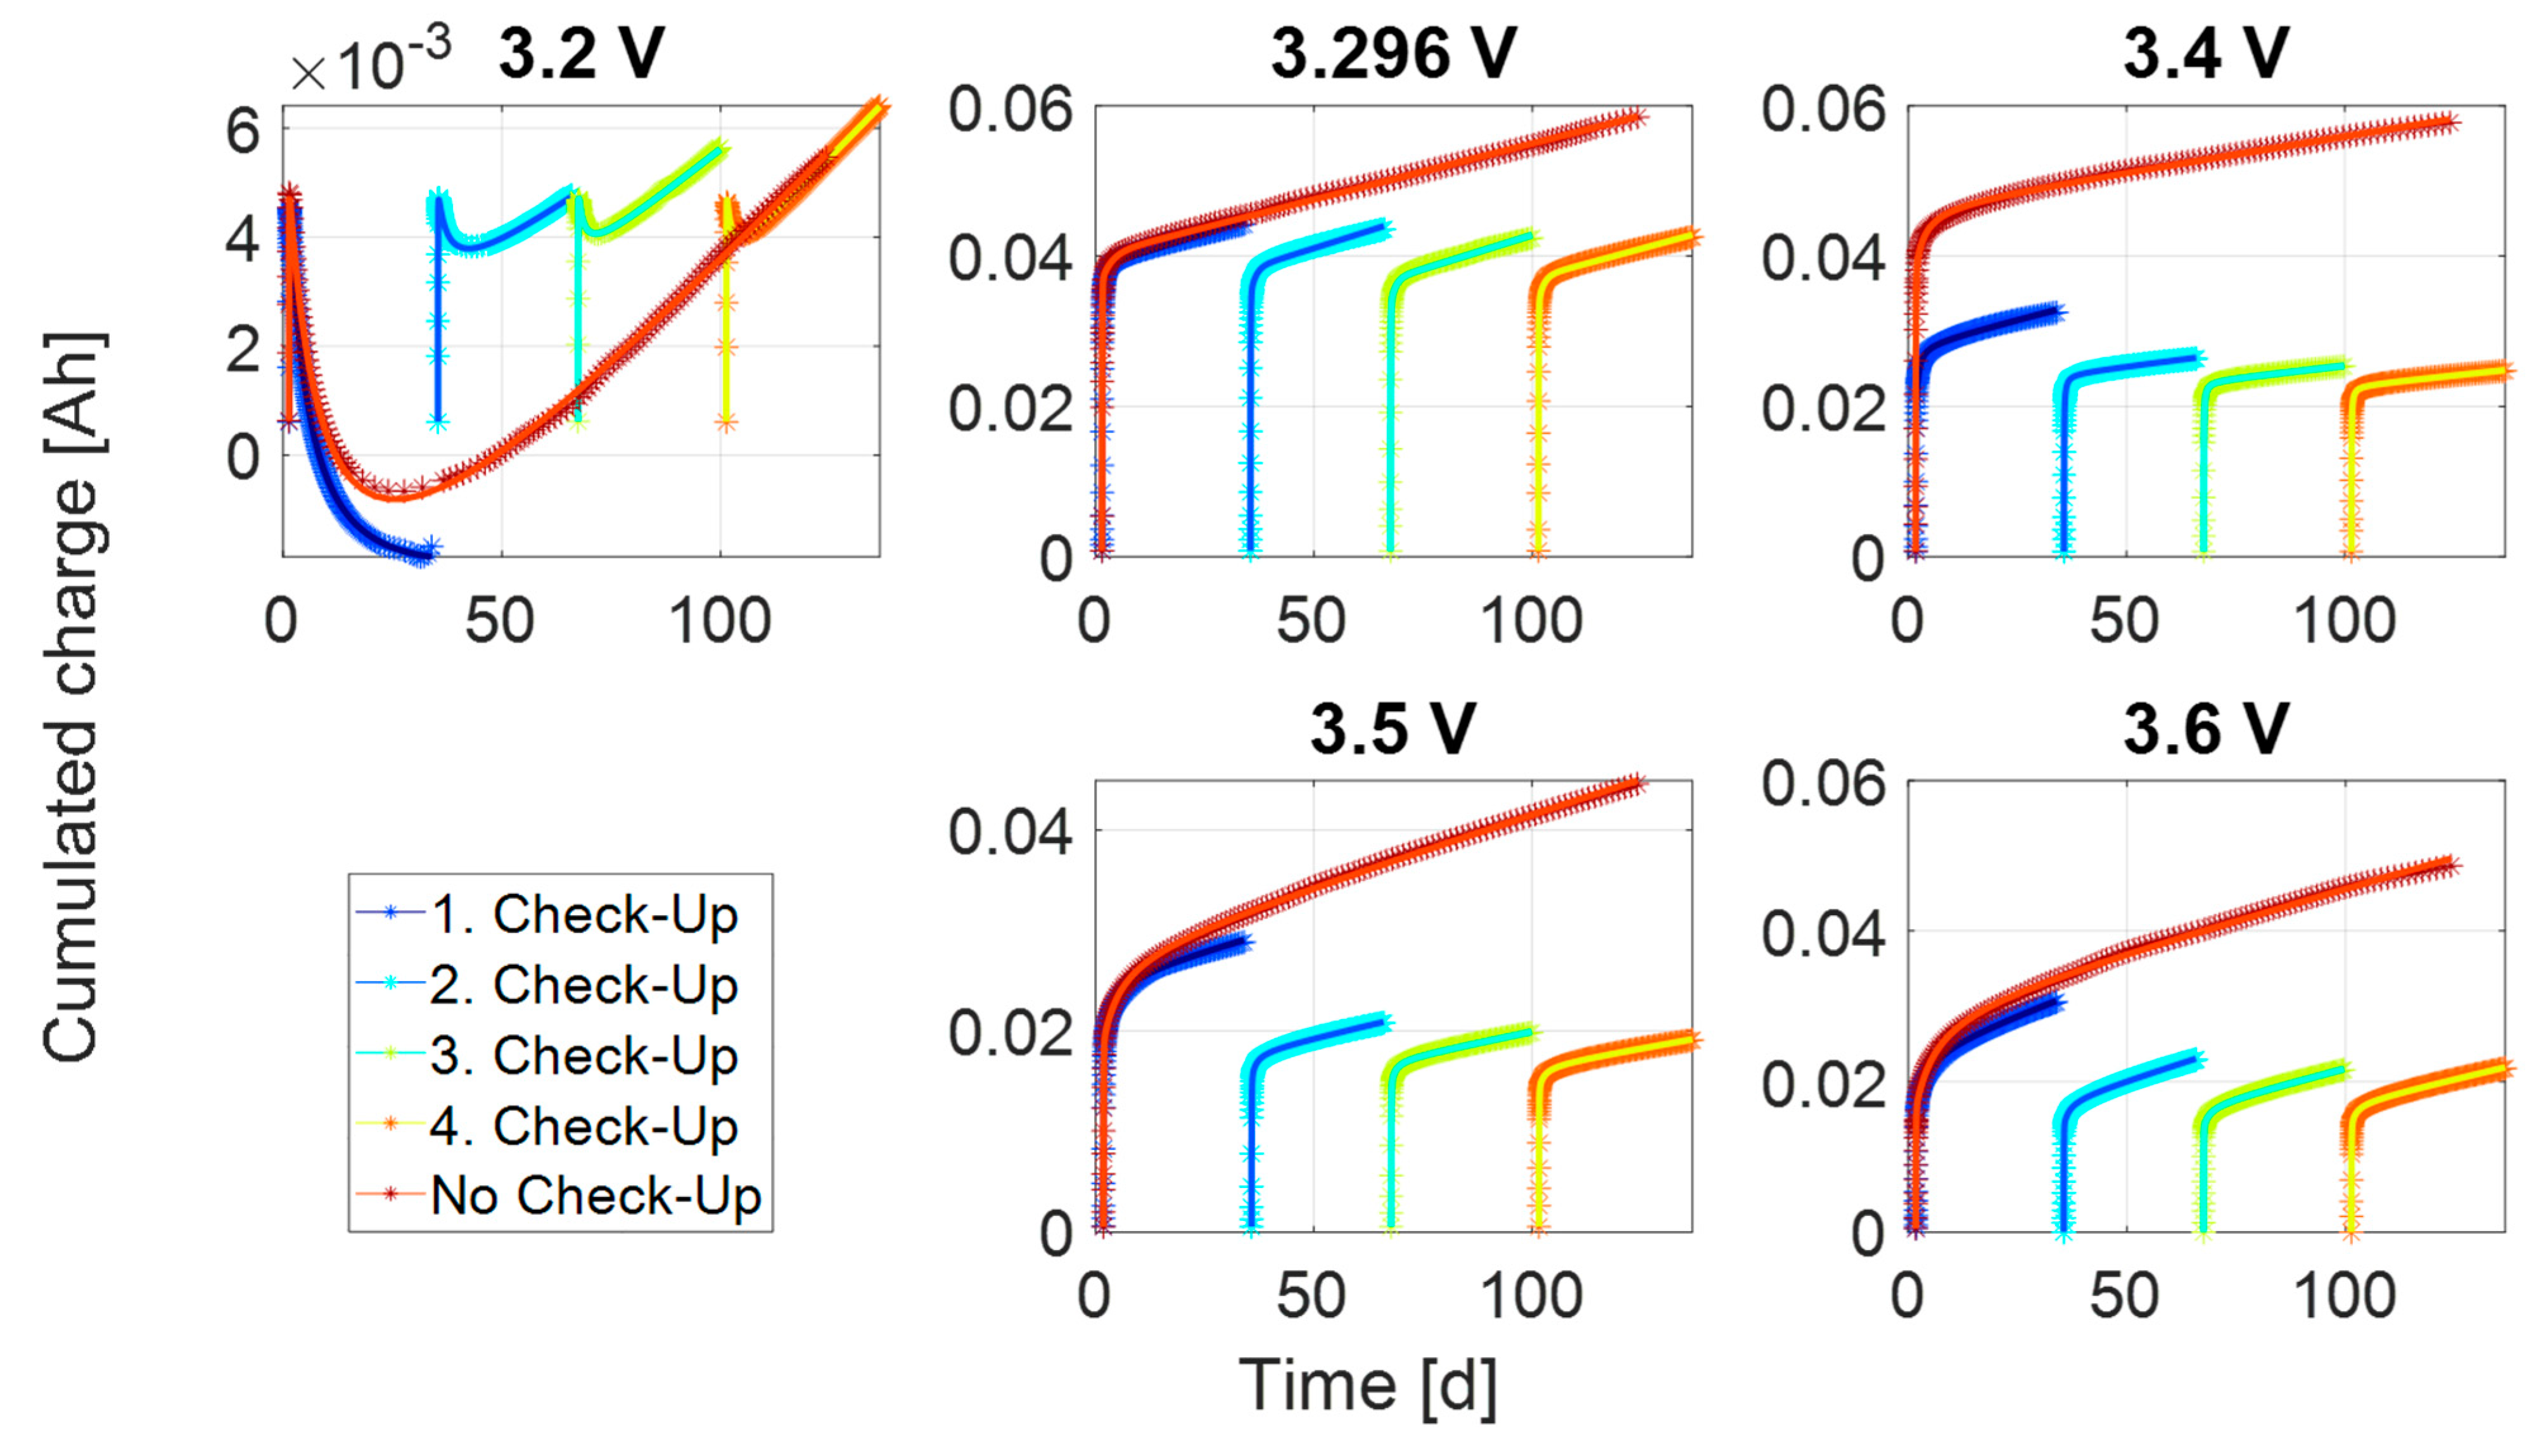
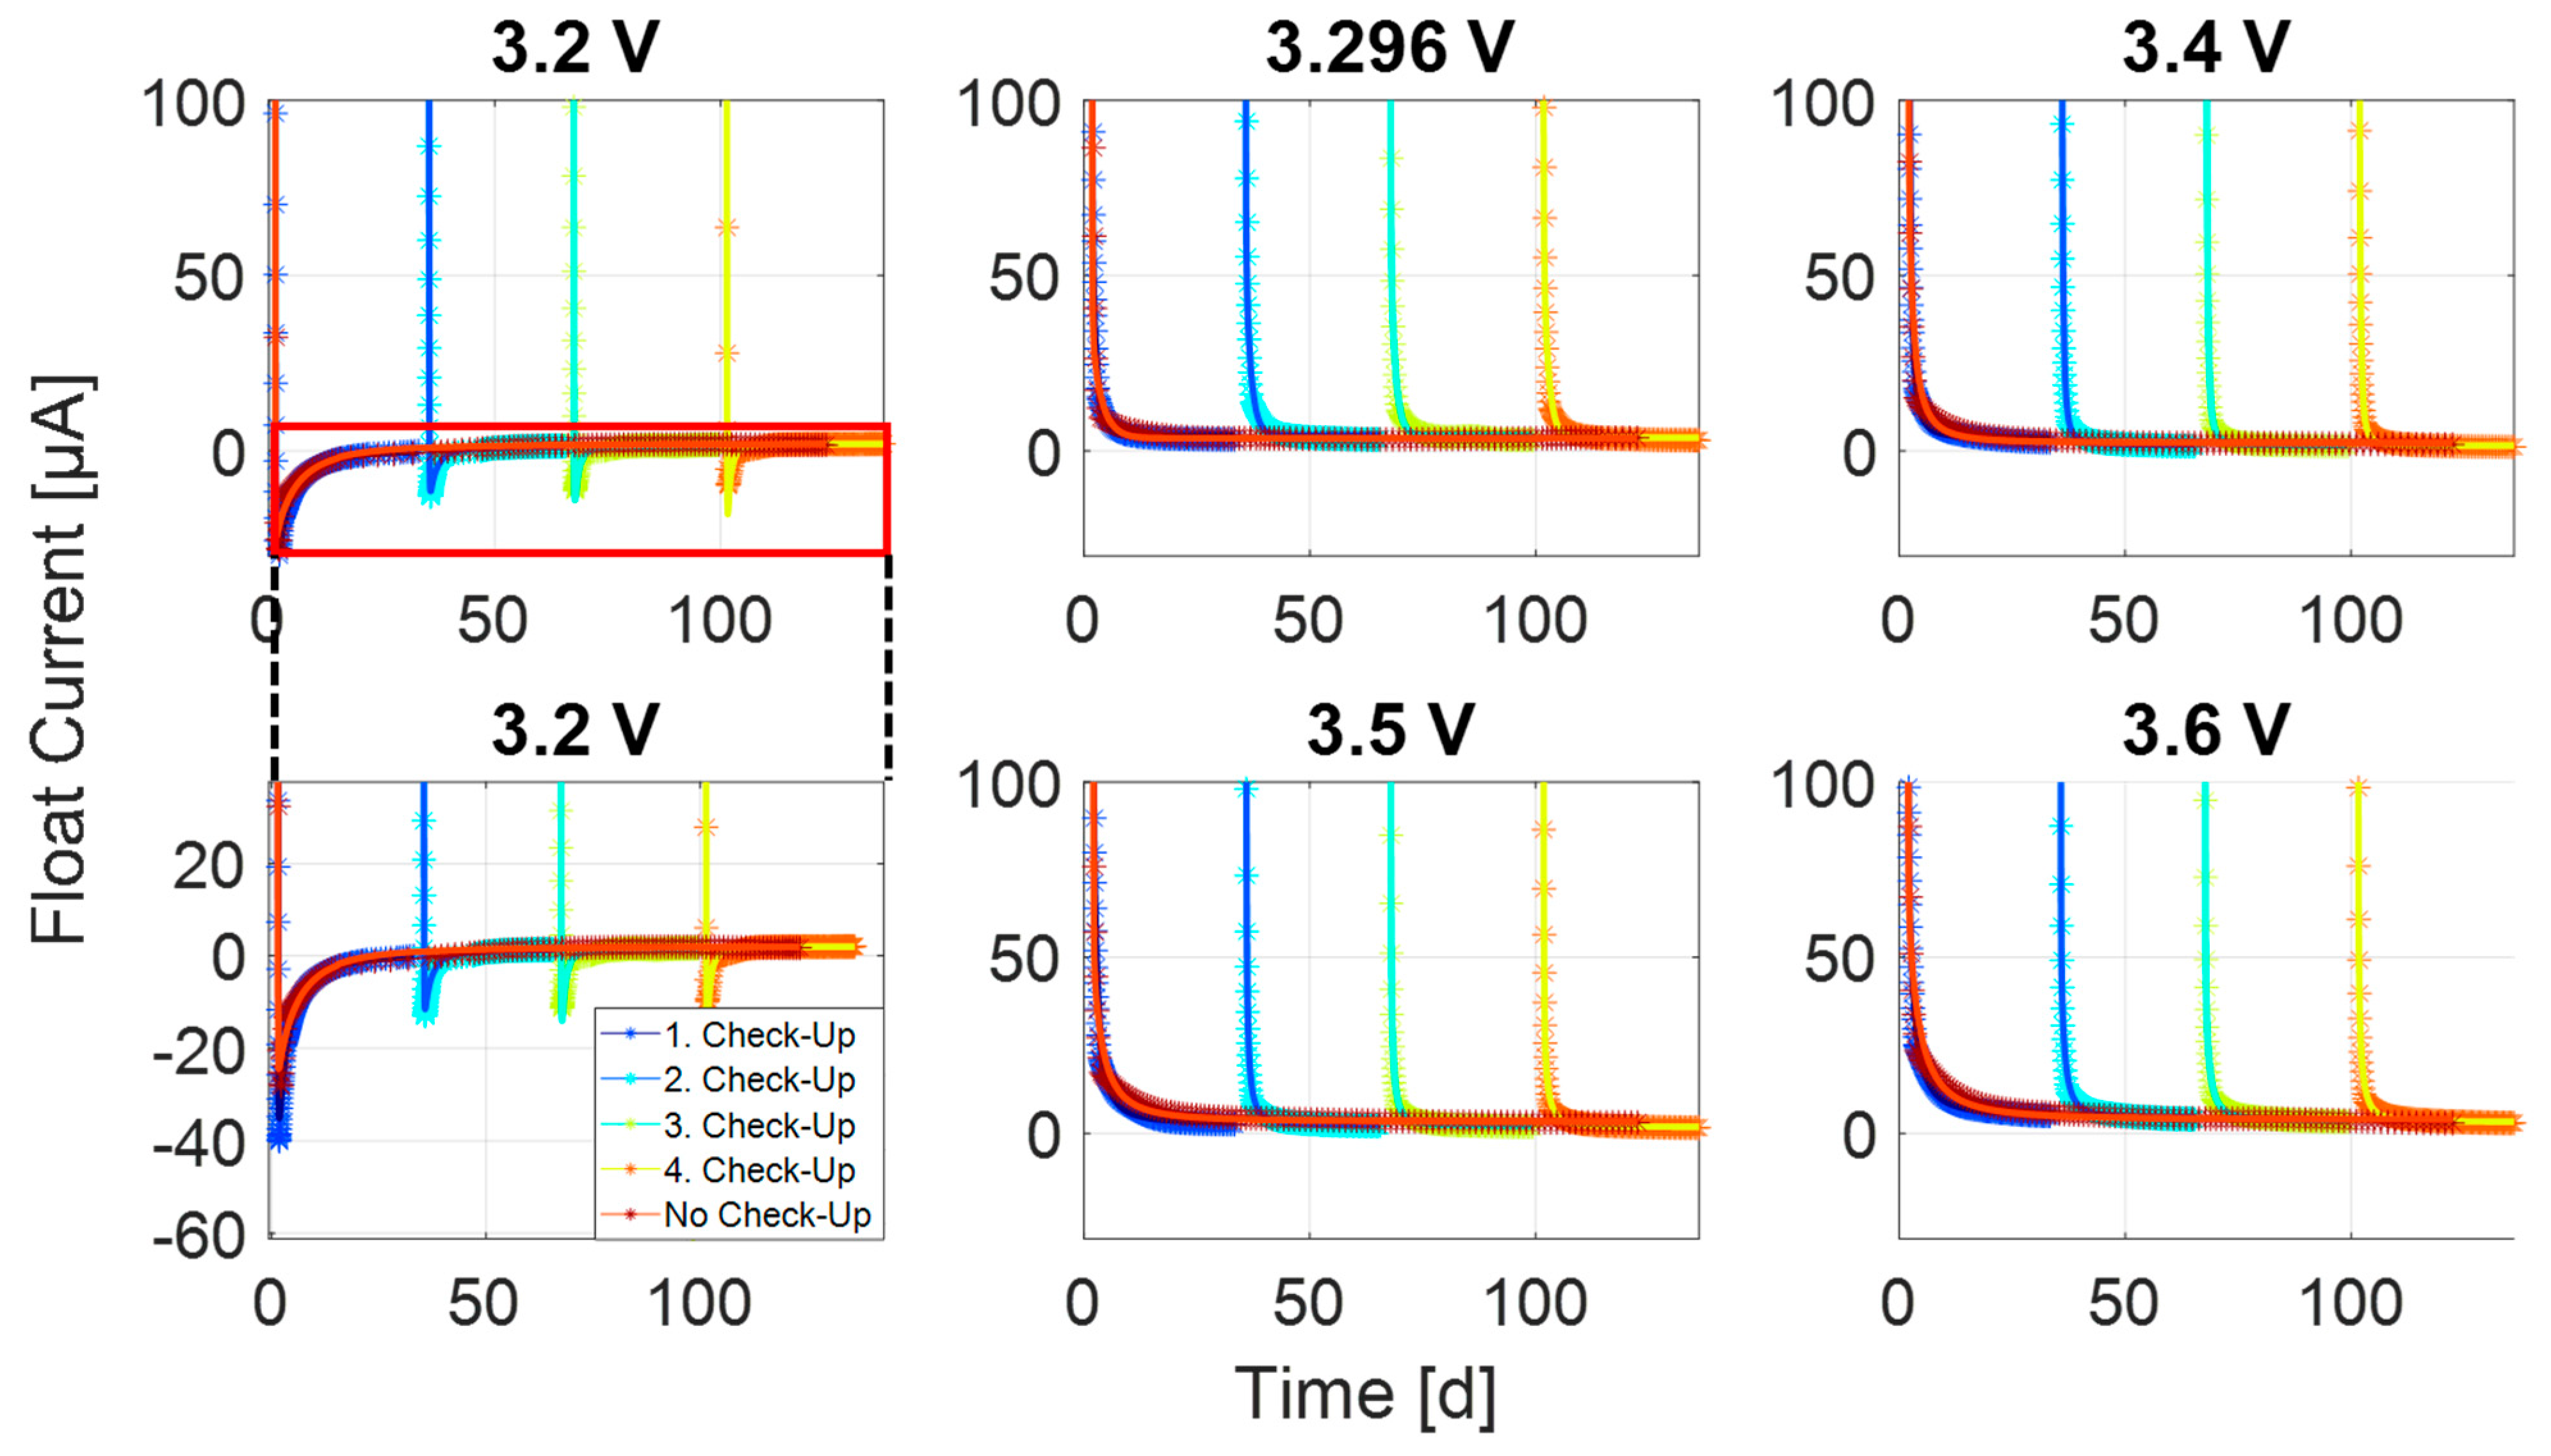
Illustrating the influence of the check-up during the transient process to reach the steady-state, the check-up interrupted tests, shown in Figure 3, are plotted over time together with noninterrupted tests in the following figures. For better visibility, the noninterrupted tests are displayed in bold.
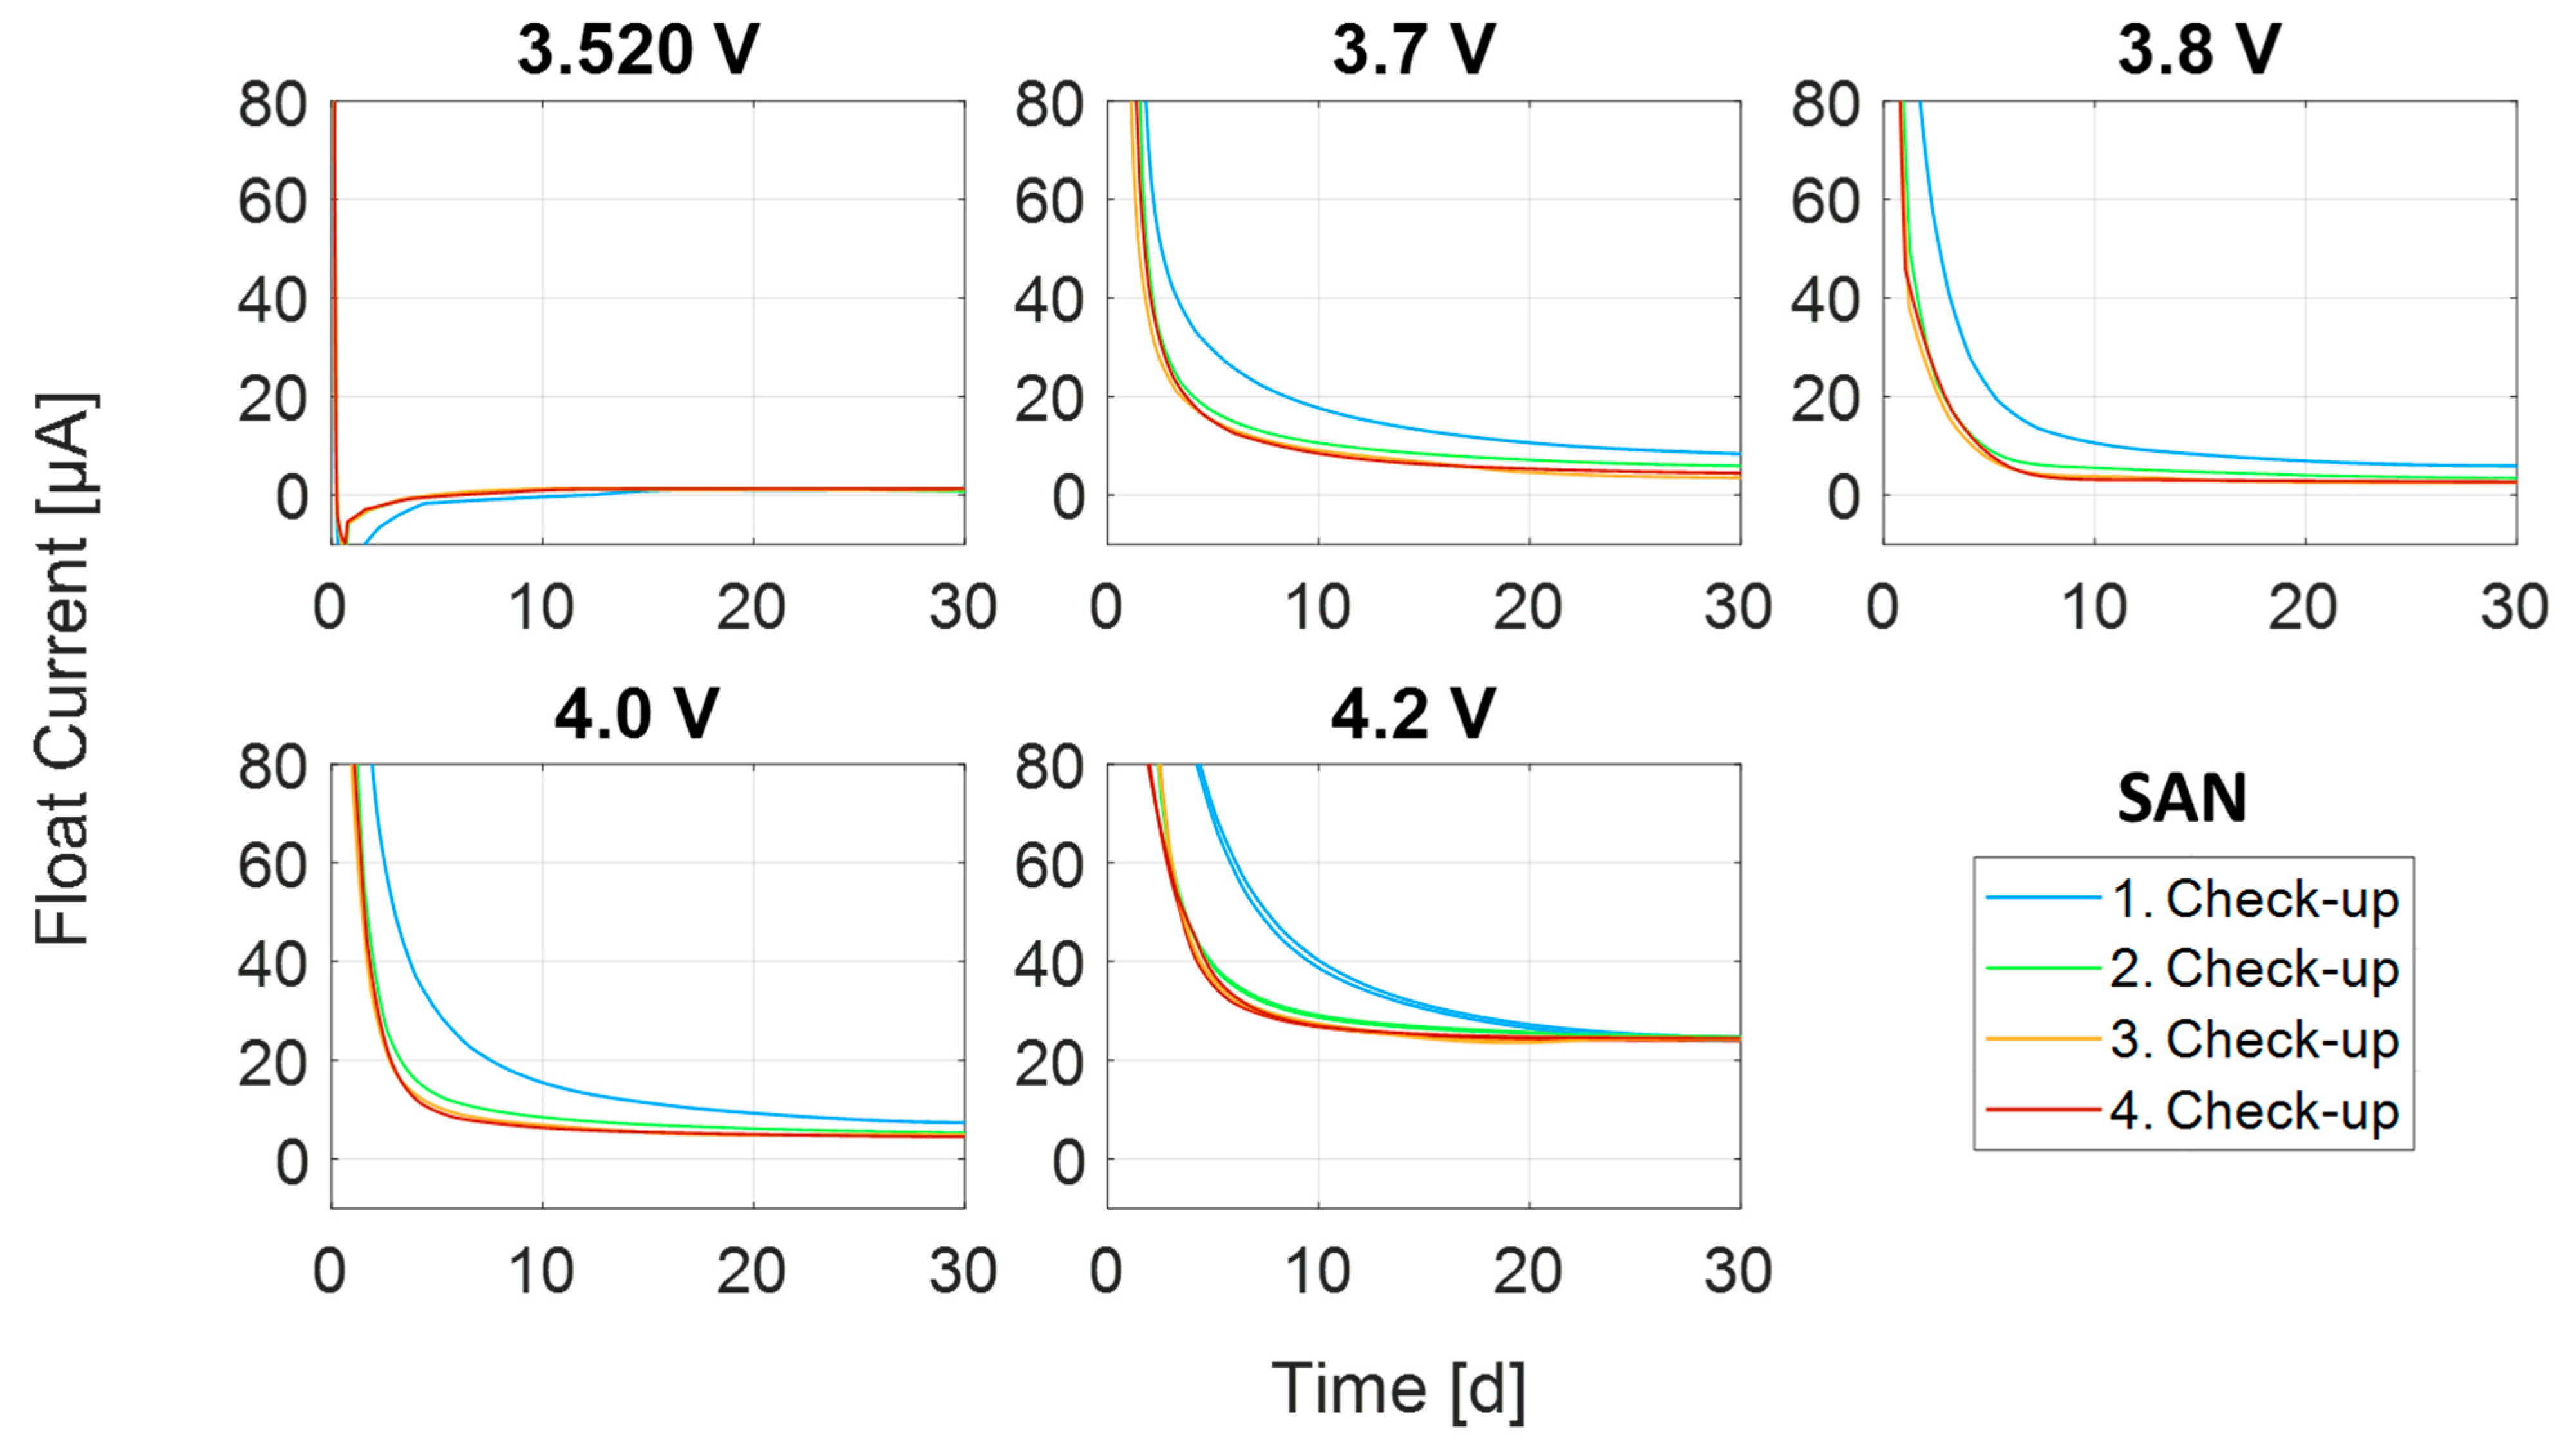
The results for A123 are shown in Figure 4, with one subplot for each float voltage showing that the steady-state voltage is, in general, independent of check-up interruptions. Only at 3.5 V, the steady-state float currents exhibit a deviation. As we investigated only one cell for each test, we cannot exclude cell-to-cell variations here. Such differences were not observed in PAN (Figure 5) or SAN (Figure 6), supporting the assumption of cell-to-cell variation. A further peculiarity is found for the SAN at 4.2 V cell, which is not interrupted by check-ups. For this cell, an intermediate rise from day 80 to day 120 is visible, which cannot be explained so far and might be a measurement artifact. Except for cell A123 at 3.5 V, a very high reproducibility of the first run for both cells was obtained. Exemplarily for SAN, the subsequent transient processes are plotted in Figure 7 for low currents on top of each other.
The results show that the transient phase after the first check-up behaves differently, while the subsequent transient phases are hardly distinguishable. Considering the anode overhang as the root cause in this case, the average SOC of the anode overhang is very low in the first run. In the following runs, the SOC of the anode overhang will be closer to the float voltage for the test leading to a smaller time constant. As 3.52 V is the delivery voltage, the cell potential of the anode overhang does not change over the runs, and the differences between first to the subsequent runs are comparably low. The plots for the A123 and PAN are displayed in Appendix A.1.

3.3. Steady-State Process

The steady-state of the float current is reached when the transient processes of the polarization and anode overhang effect become insignificantly low. Therefore, the steady-state was in all cases a positive current. The determination of the achieved steady-state current measurements was performed without check-up interruptions with the help of interpolation. As for SAN 3.52 V, no uninterrupted test was conducted, and the check-up-interrupted test was used. The steady-state polynomial extrapolation back to day zero is shown in Figure 8 for all three cell types. For almost all cell types and SOC, the steady-state appears to be constant over the test duration, rise, and some show a decay. The decay is a hint for an after formation of the cell or a successive passivation of the active area of the electrode surface. The PAN at 4.0 V and 4.2 V show the most significant decay. The rise for SAN 4.2 V hints to increasing active area. As the check-up-interrupted cells do not show this rise, we cannot conclude a general behavior. This can also be observed among some other cell types for the steady-state. Therefore, a more precise measurement of the steady-state and more cells to understand the reproducibility are necessary, especially for measuring such low currents.

3.4. Modelling

In the next step, the data are fitted to a self-developed model to better understand which processes occur during the floating of the cell and when the cell reaches a steady-state. It is assumed that after reaching a steady-state only irreversible parasitic side reactions take place. For this, a mathematical model was developed and implemented in MATLAB 2021. The model is based on numerical equations, where each equation corresponds to a physical or electrochemical process. The GlobalSearch curve fitting procedure of the MATLAB Optimization Toolbox was used to efficiently and effectively find the global minimum or maximum of a function with continuous variables [20]. To avoid local minima and maxima, fmincon [21] was used to explore a wider range of starting points. In the following, we fit the physical numerical model to the filtered charge curves.

3.4.1. Mathematical Physical Model

As deduced from our measurement results and depicted in Figure 9a, the following physical and electrochemical processes were modelled: polarization (1), anode overhang (2a–2b), and steady-state (3). After the ohmic resistance and charge transfer resistance are concluded within the first minutes, the diffusion starts to dominate. The processes in the z-direction over the electrode thickness and between the electrodes will be named polarization in the following. The diffusion length in the z-direction is in the order of 200–500 µm with a coating thickness of 100–200 µm and separator thickness of 20 µm. This process is dominant in the first hours while floating, as is shown in Figure 2. The polarization process is based on Fick’s law of diffusion [22,23] as:
J = D · c x   w i t h   D = D 0 · e x p ( E R · T )
with the particle current density J , the diffusion coefficient D , the concentration c , and the location x . For the determination of D (based on the Arrhenius law) the pre-exponential D 0 , the activation energy E , the gas constant R , as well as the temperature T are required. In our measurements, T was set at a constant of 30 °C, making our diffusion model temperature-independent. In general, a point load will spread indefinitely quickly, according to the Fick’s law-based diffusion model; nevertheless, it will slow down exponentially until the concentration differences at each location equalize [24]. Based on Fick’s law of diffusion, the following numerical function represents the cumulated charge trend of the polarization Q Pol :
Q Pol = a · 1 e x p t b c
a is the prefactor describing the total polarization charge, and c is the time constant of the polarization process. The exponent b , ranging from 0.1 to 1, ensures that the polarization process reaches a steady zero value, to resemble the nature of the polarization [25].
The next dominant process is the anode overhang effect. The anode overhang effect balances the inhomogeneous lithium-ion concentrations in the xy plane of the graphite electrode. As the electrode height and length are in the order of 6 cm × (60 to 100) cm, a significantly longer duration of the anode overhang effect compared to the polarization process is expected. It has a positive or a negative influence on the float current depending on the applied float voltage/SOC. If the float SOC is lower than the initial SOC at which the cell was delivered, we observe a positive float current and vice versa. Thus, the signs of the polarization and the anode overhang effect are both positive. Only for float voltages lower than the delivery voltage can the sign of the anode overhang effect be negative. After a period of approximately 24 h, during which the transport processes in the z-direction of the electrode plane decay almost completely, the dominance of the anode overhang effect arises. This point can be best observed the for lowest float voltages where a minimum due to negative anode overhang is observable, as sketched as 2a in Figure 9a and in Figure 3 for A123 and SAN. The speed of lithium-ion exchange over the electrode area due to anode overhang is driven in the first line by migration and in the second line by diffusion. Migration is a function of the potential difference between two areas and is, due to its directional behavior, faster than the statistical transport of diffusion. Additionally, the temperature dependence follows the Arrhenius law but is neglected here, as we kept the temperature constant at 30 °C throughout the tests. The migration in the graphite anode can be best understood by its half-cell curve, as depicted in Figure 9b. The migration force of the anode overhang increases with a higher Δ V between the initial voltage V S O C 0 and the float voltage V S O C / + . In the case of Δ V = 0 , only the slow diffusion process is active, resulting in a very low compensation current. In the literature, the anode overhang is separated into near (1–5 mm) and far parts (5 mm to a few cm) [26]. As the anode overhang is typically very unsymmetrically distributed, the anode voltage curve is smeared out, and the migration process can be approximated best with a simple exponential function. The cumulated charge flow Q AOH due to the anode overhang is modeled as:
Q AOH = ( Q S O C 0 Q S O C / + ) · 1 e x p t e · t + f
with the time t and the linear function e · t + f being the time constant. The prefactor ( Q S O C 0 Q S O C / + ) , determined from the anode OCV, is the charge difference between the initial and the floating voltages. The sign determination of the Q AOH is illustrated in Figure 9b. If the SOC is smaller (SOC) compared to the initial SOC (SOC0), the sign becomes negative, and positive for larger SOCs (SOC+). Compared with the polarization model function, there are two main differences in the model for the anode overhang. For the anode overhang, instead of a time constant, a linear relationship time constant was used to model the time constant of the exponential function. This method was also used in [27] to simulate the battery dynamic processes, which take a longer time to decay (anode overhang effect). The time constant of the linear relationship is evident according to the measurements performed in [27] and is probably caused by the use of composite electrodes in commercial full cells, which deviate from the fixed value for a material with known geometry. Based on the obtained linear relationship, a new model is presented. Additionally, we used no exponent because overfitting our model resulted in falsified simulation results when analyzing each effect on its own.
The last effect, which dominates after a period of 15–35 days, is the steady-state. It is then modelled in a simple approach as a linear function in the cumulated charge representation:
Q SSt = g · t
g is the prefactor resembling the self-discharge current and t is the time. To summarize, the following model is then used for the fitting procedure, with each term representing a specific process:
Q Model = a · 1 e x p t b c + d · 1 e x p t e · t + f + g · t
In total, seven variables were fitted with given start values as well as upper and lower boundaries to achieve a physically meaningful modelling approach for the float current resembling the self-discharge rate.

3.4.2. Optimization and Fitting

Based on the given mathematical functions, a global optimization of the parameters was performed to improve the quality of the model. The objective of the optimization was to minimize the deviations between the cumulated charge curves of the float current tests and the simulation results. To calculate the deviations between the measured and simulated charges, we used the Euclidean norm vector. Therefore, the simulated cumulated charge Q simulated is subtracted from the measured cumulated charge Q measured , and the Euclidean norm of the resulting vector is calculated as follows:
min error = ( Q measured Q simulated ) 2
In addition, some boundary conditions were defined. To ensure the dominance of the polarization process at the beginning of the floating, in Equation (5), the factor b must be larger than the factor d . Moreover, the time constant of the anode overhang process must be larger than that of the polarization. This ensures the longevity of the anode overhang when compared to the polarization process [15].
Figure 10 shows the measured (solid lines) and simulated (asterisks) cumulated charge curves of the A123 cell at the measured potentials, with both positive and negative anode overhang effects.
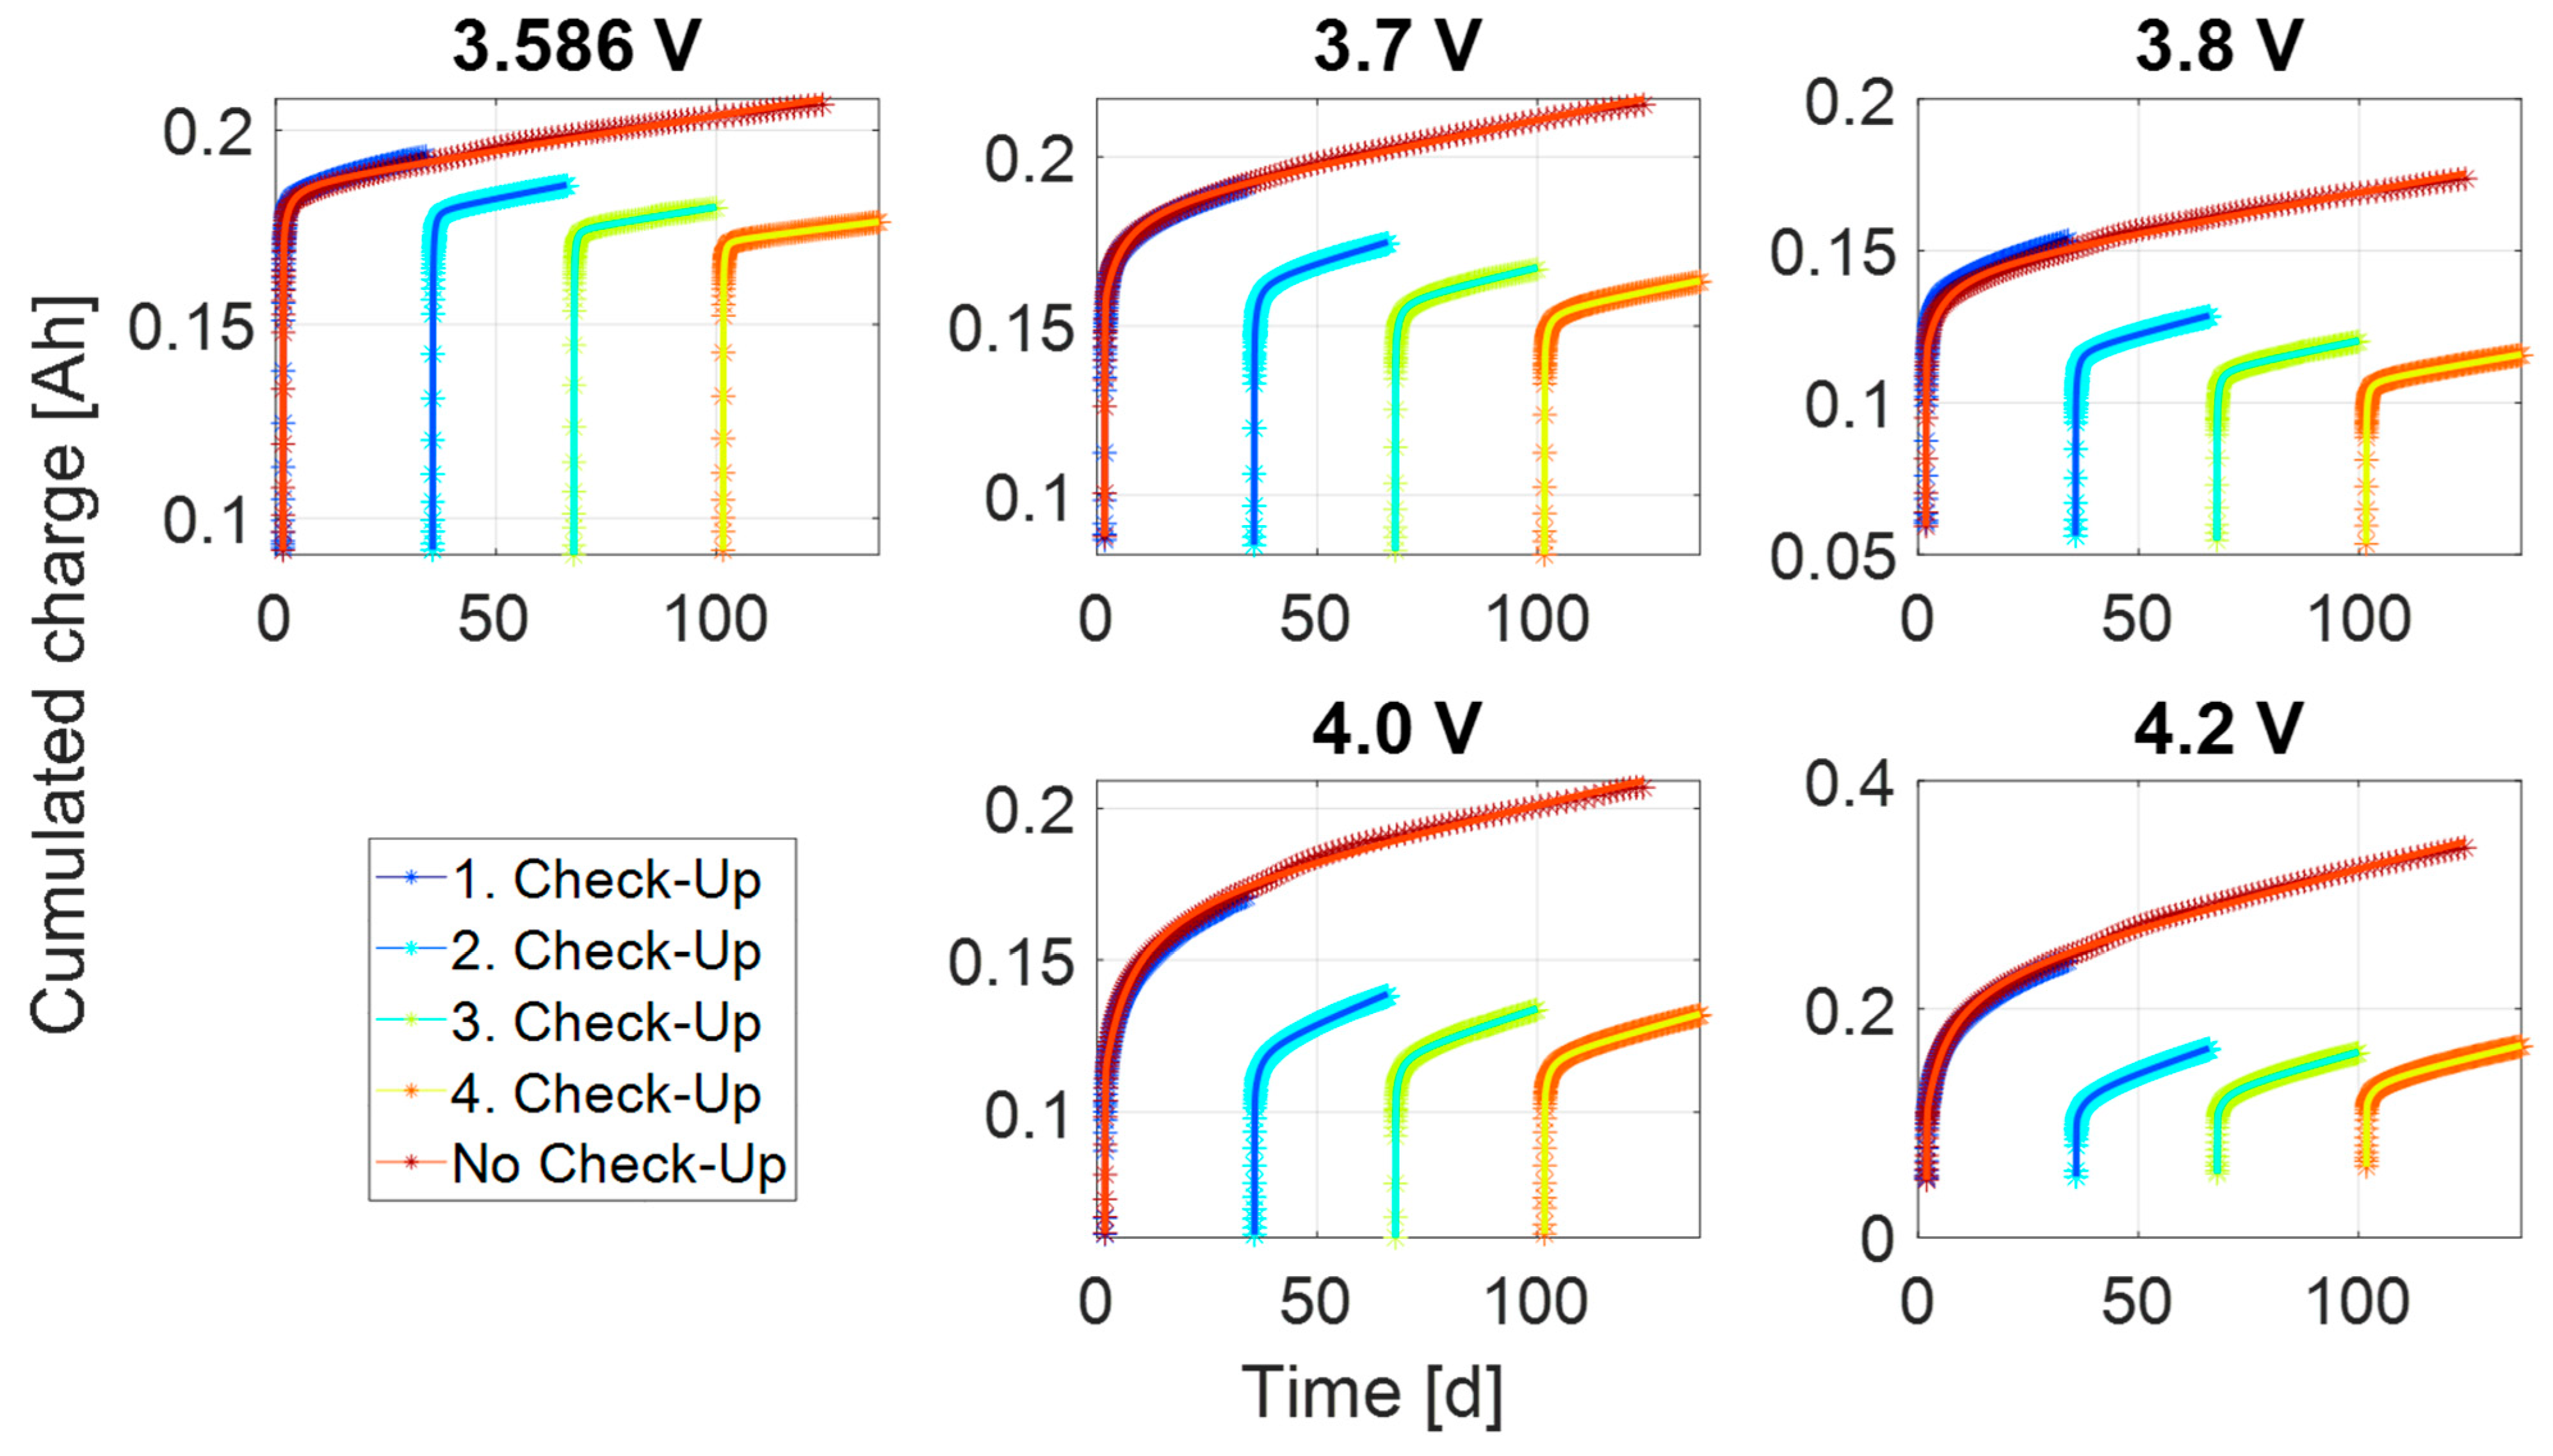
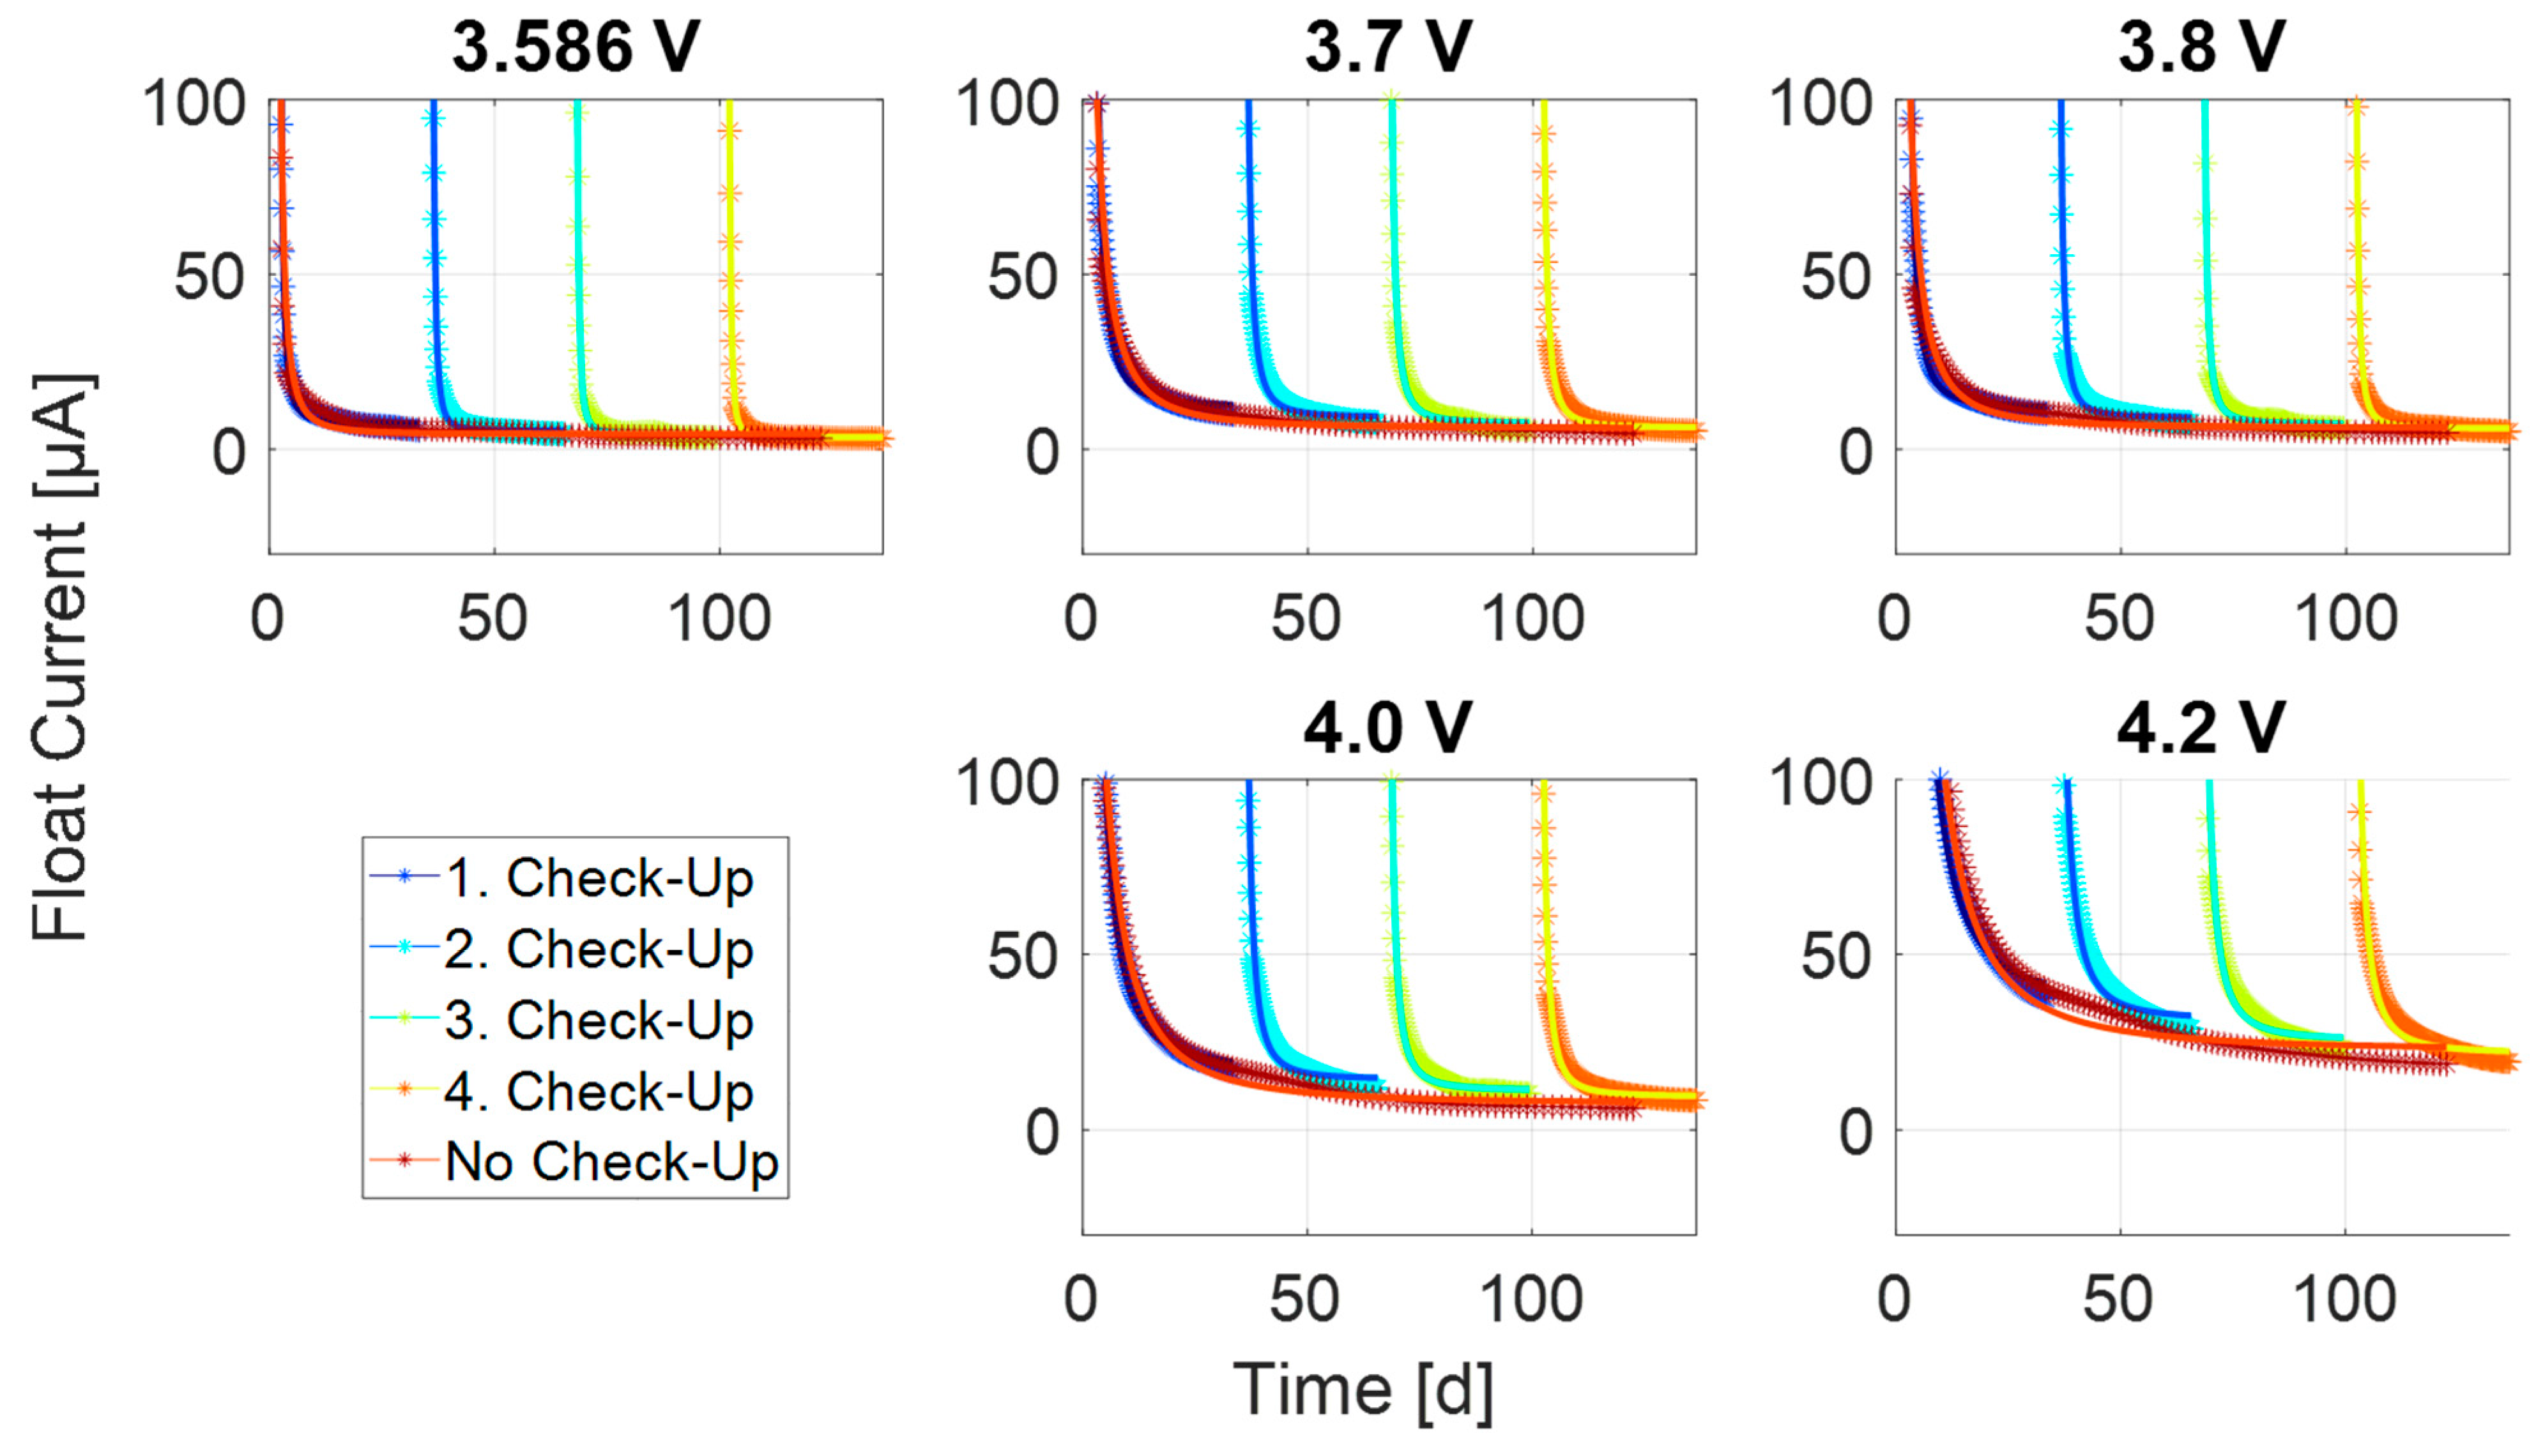
From the simulated cumulated charge, we derived the float current simulation and compared the simulations and measurements of the same cell at the same cell potentials in Figure 11. The positive and negative anode overhang effects are displayed, showing a high accuracy between the measurement and the simulation with a mean error of approximately 5%. The cumulated charge simulations of the SAN and PAN as well as the derived float current simulation are found in Appendix A.2.

3.4.3. Transient Process

To gain more insight into the validity and usability of the model, we determined the simulated time constants of the transient processes. To determine the time constants, each simulated effect (anode overhang or polarization) was fitted to a simple two-parameter exponential function using the MATLAB function fitobject. The time constant is derived from the fitobject returning a measure to compare the different time constants.
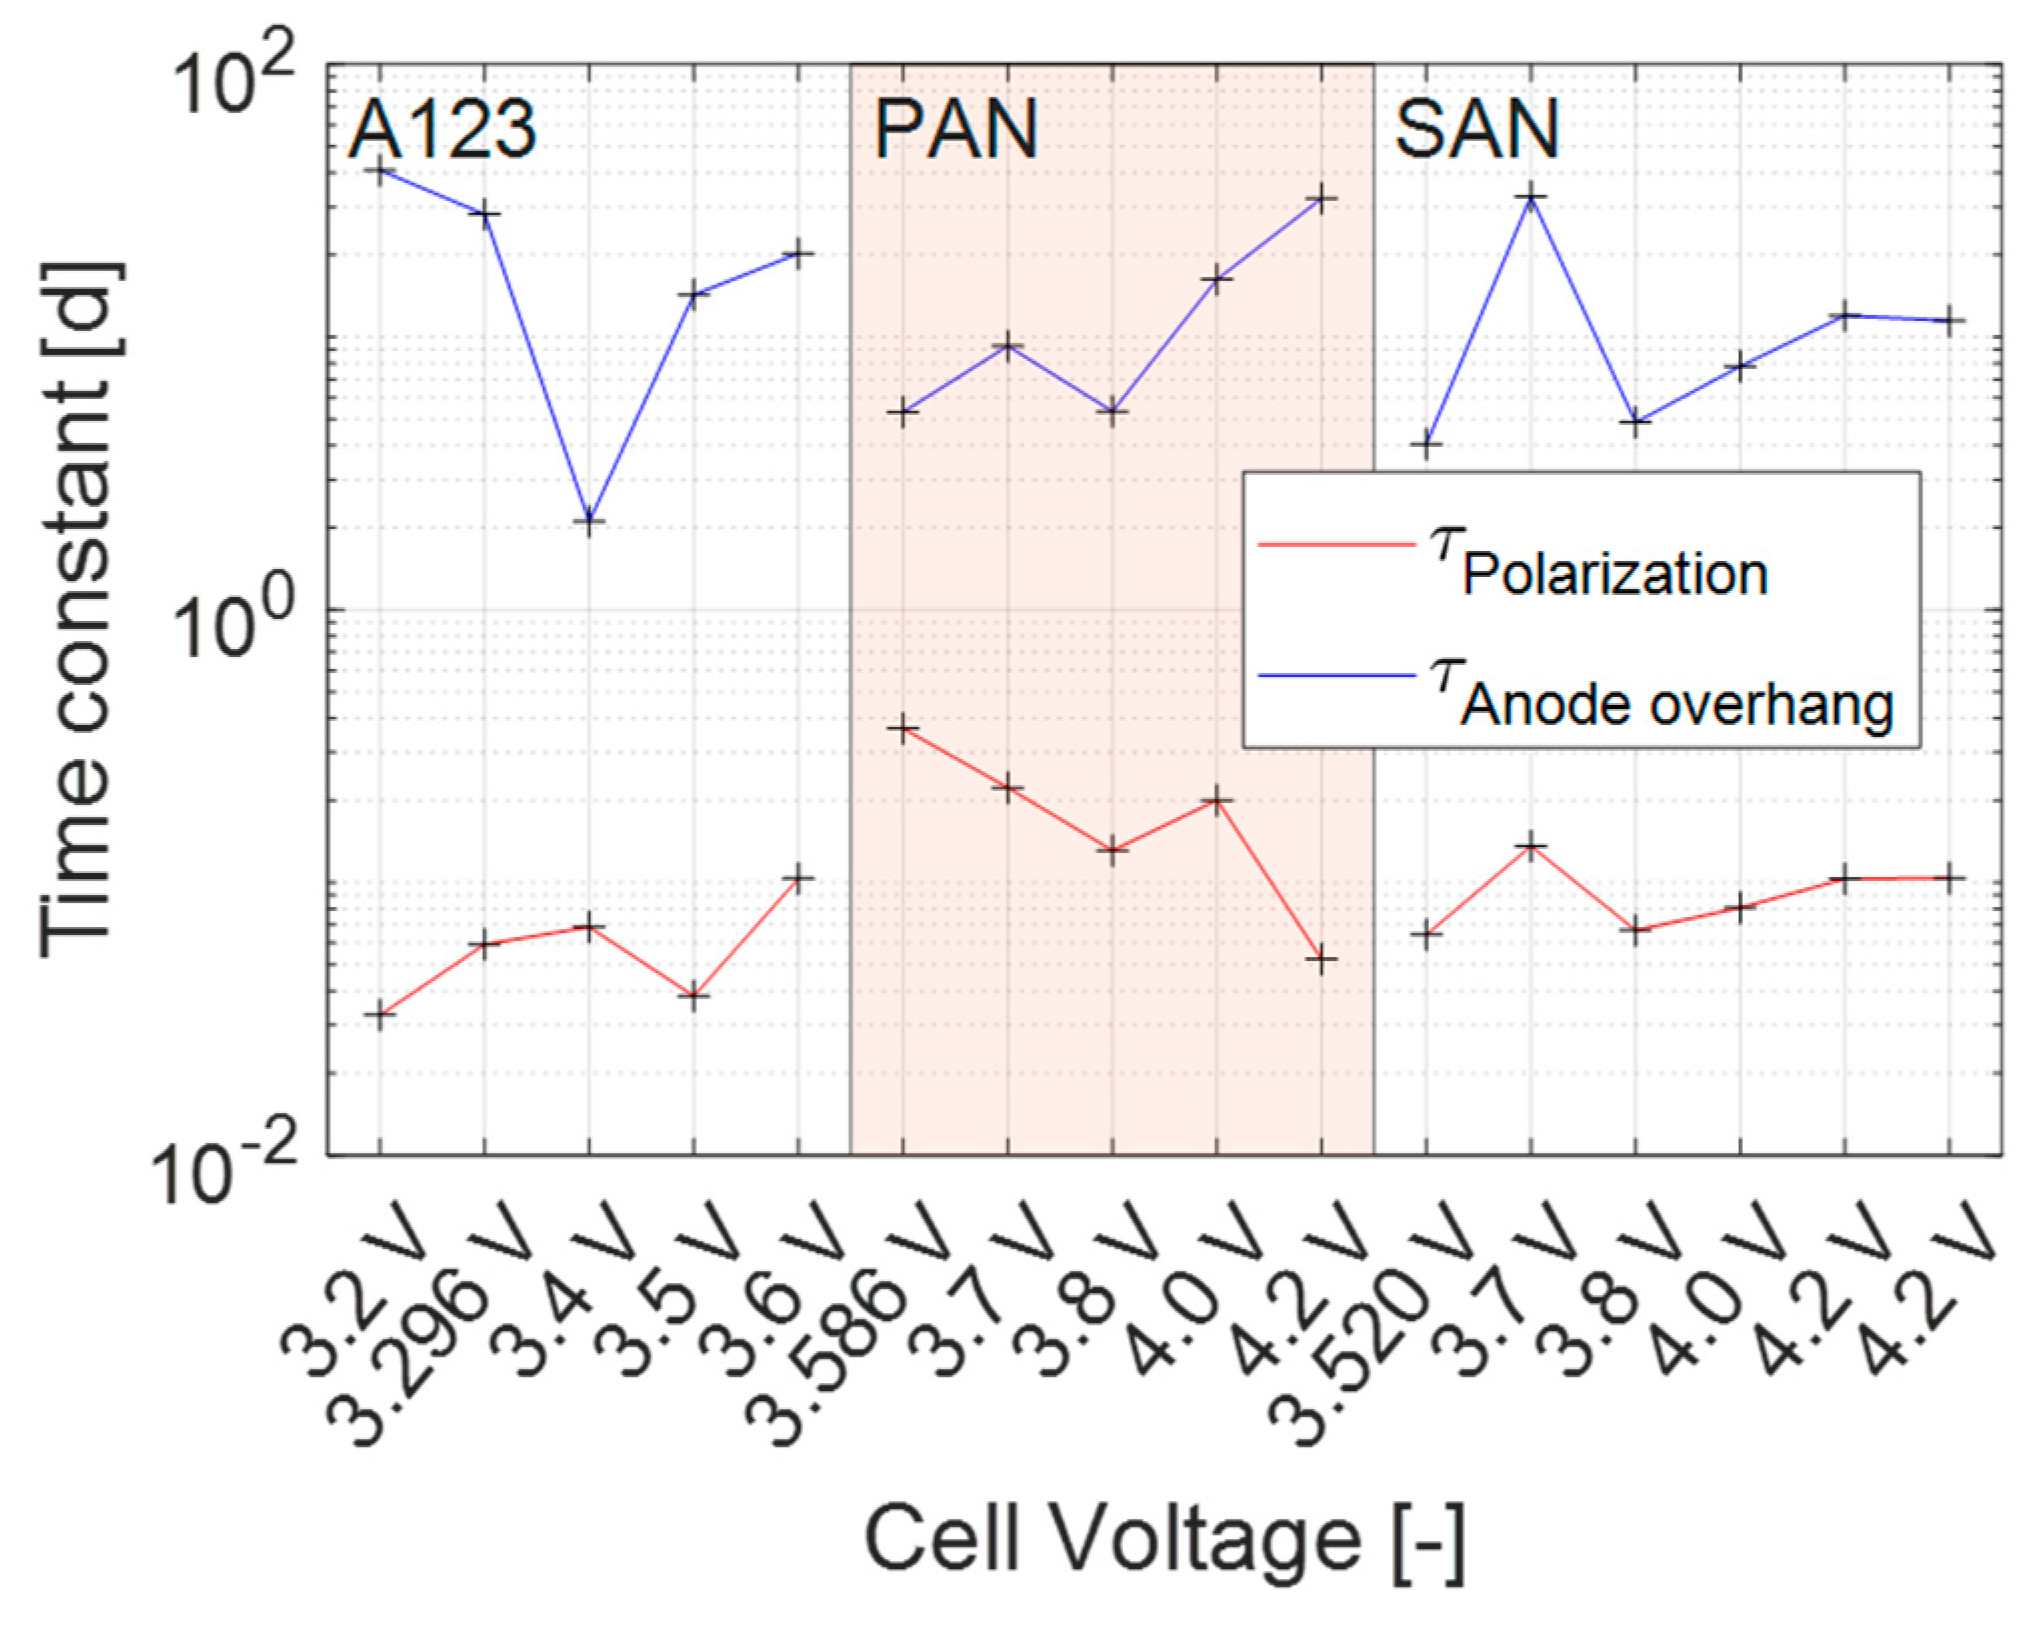
In Figure 12, we show that the simulated exponential time constants necessary to reach 63% of the anode overhang effect are in the range of 3–30 days, whereas the time constants of the polarization are in the range of 7–14 h. Both time constants are in their respective estimated ranges, with some minor exceptions [15].

3.4.4. Steady-State Process

As mentioned in Section 3.3, the steady-state of the float current is reached when the transient processes of polarization and anode overhang effect become negligible. To compare the duration after the check-ups within the maximum duration of 30 days, all durations were scaled with 30 days being the maximum to provide a comparison between the check-up and non-check-up test setups. To achieve this, we define the steady-state in our model by an anode overhang current change smaller than 0.1 µA/day. The calculated times to reach a steady-state are shown in Figure 13.
In Figure 13a, the time required to reach the steady-state during the 1st check-up is compared to the one without check-ups. It is clearly visible that for the A123 and SAN, a comparable time with and without check-ups is needed to reach the steady-state. They ranged 5–18 days for the A123 and for the SAN 6–25 days. As for the PAN, we see a strong difference with and without check-ups in the cells at 4.0 V and 4.2 V. This is because the steady-state is reached very late in both cases, and therefore the time required differs significantly, as was seen in the measurements before.
Figure 13b shows the difference between the first, second, third, and fourth check-ups. The apparent trend is that reaching the steady-state after the second, third and fourth check-up takes less time than during the first check-up as observed earlier from the measurements. A possible explanation for this is that the anode overhang for the 1st check-up is at delivery SOC and reaches over floating a new equilibrium at the float SOC. Thus, after the 2nd and following check-ups, only smaller changes in the SOC of the anode overhang take place that are caused by the variation of the SOC in the active anode during the check-up. This is also supported by the fact that when the floating voltage is equal to the delivery voltage (presented with more decimal places), the time to reach the steady-state hardly changes over repeated check-ups, especially for the A123 at 3.296 V.

4. Conclusions

In this contribution, we demonstrated the long-term self-discharge measurements for various fixed cell voltages and three different cell types. We demonstrated that the transient process at higher currents is dominated by polarization effects with no clear order according to the cell voltage. This is followed by the anode overhang effect over the electrode area at lower currents. Thereafter, most of the cells reached a constant steady-state, with only two clear exceptions at higher cell potentials. The steady-state currents sort in general by cell voltage with only some deviations at very low SOCs, especially for the A123 cell type.
A generally high reproducibility was obtained regarding the transient process and steady-state currents, with only two exceptions that might be caused by cell-to-cell variation or measurement error. The interruption of check-ups influenced only the time to reach the steady-state but not the steady-state itself. Thus, check-ups distort the lithium distribution in the cell, but not the final steady-state self-discharge current.
The implemented model included three effects (polarization, anode overhang, and steady-state). The polarization represented the processes between the electrodes over their thickness, whereas the anode overhang represented the processes over the lateral electrode area with significantly longer diffusion lengths. The model showed the importance of considering the effect of the anode overhang and how it influences the time that is needed to reach a steady-state. The time required for the anode overhang to decay and not have an influence lies within the range of 5–30 days.
Finally, the true self-discharge is the steady-state, which is significantly lower than generally discussed in the literature, which includes the polarization and the anode overhang effects. Finding the origin of the steady-state current with a potential link to cell aging will be the scope of follow-up publications. Another aspect not covered by this paper is the temperature dependence of the steady-state, which can be implemented over temperature steps and ramps, leading to fast characterization of a cell, once the polarization and anode overhang effects are negligible.

Author Contributions

Conceptualization, M.L. and C.E.; methodology, M.L. and M.A.; validation, M.L., M.A., M.E. and R.S.; formal analysis, M.L., M.A., M.E. and R.S.; investigation, M.L. and M.A.; resources, M.L. and C.E.; data curation, M.L. and M.A.; writing—original draft preparation, M.L. and M.A.; writing—review and editing, M.L., M.A., M.E. and R.S.; supervision, M.L.; project administration, M.L. and C.E.; funding acquisition, M.L. and C.E. All authors have read and agreed to the published version of the manuscript.

Funding

This research was funded by two projects. (1) Grant number: 440701024 funded by the German Research Foundation (DFG); (2) Grant number: 03XP0442 funded by the German Federal Ministry of Education and Research (BMBF).

Data Availability Statement

For data, please refer to the corresponding author.

Acknowledgments

Special thanks for the fruitful discussion and support to Felix Hildenbrand, Katharina Golder, Simon Diehl, and Pablo Morales Torricos.

Conflicts of Interest

The authors declare no conflict of interest.

Appendix A

Appendix A.1

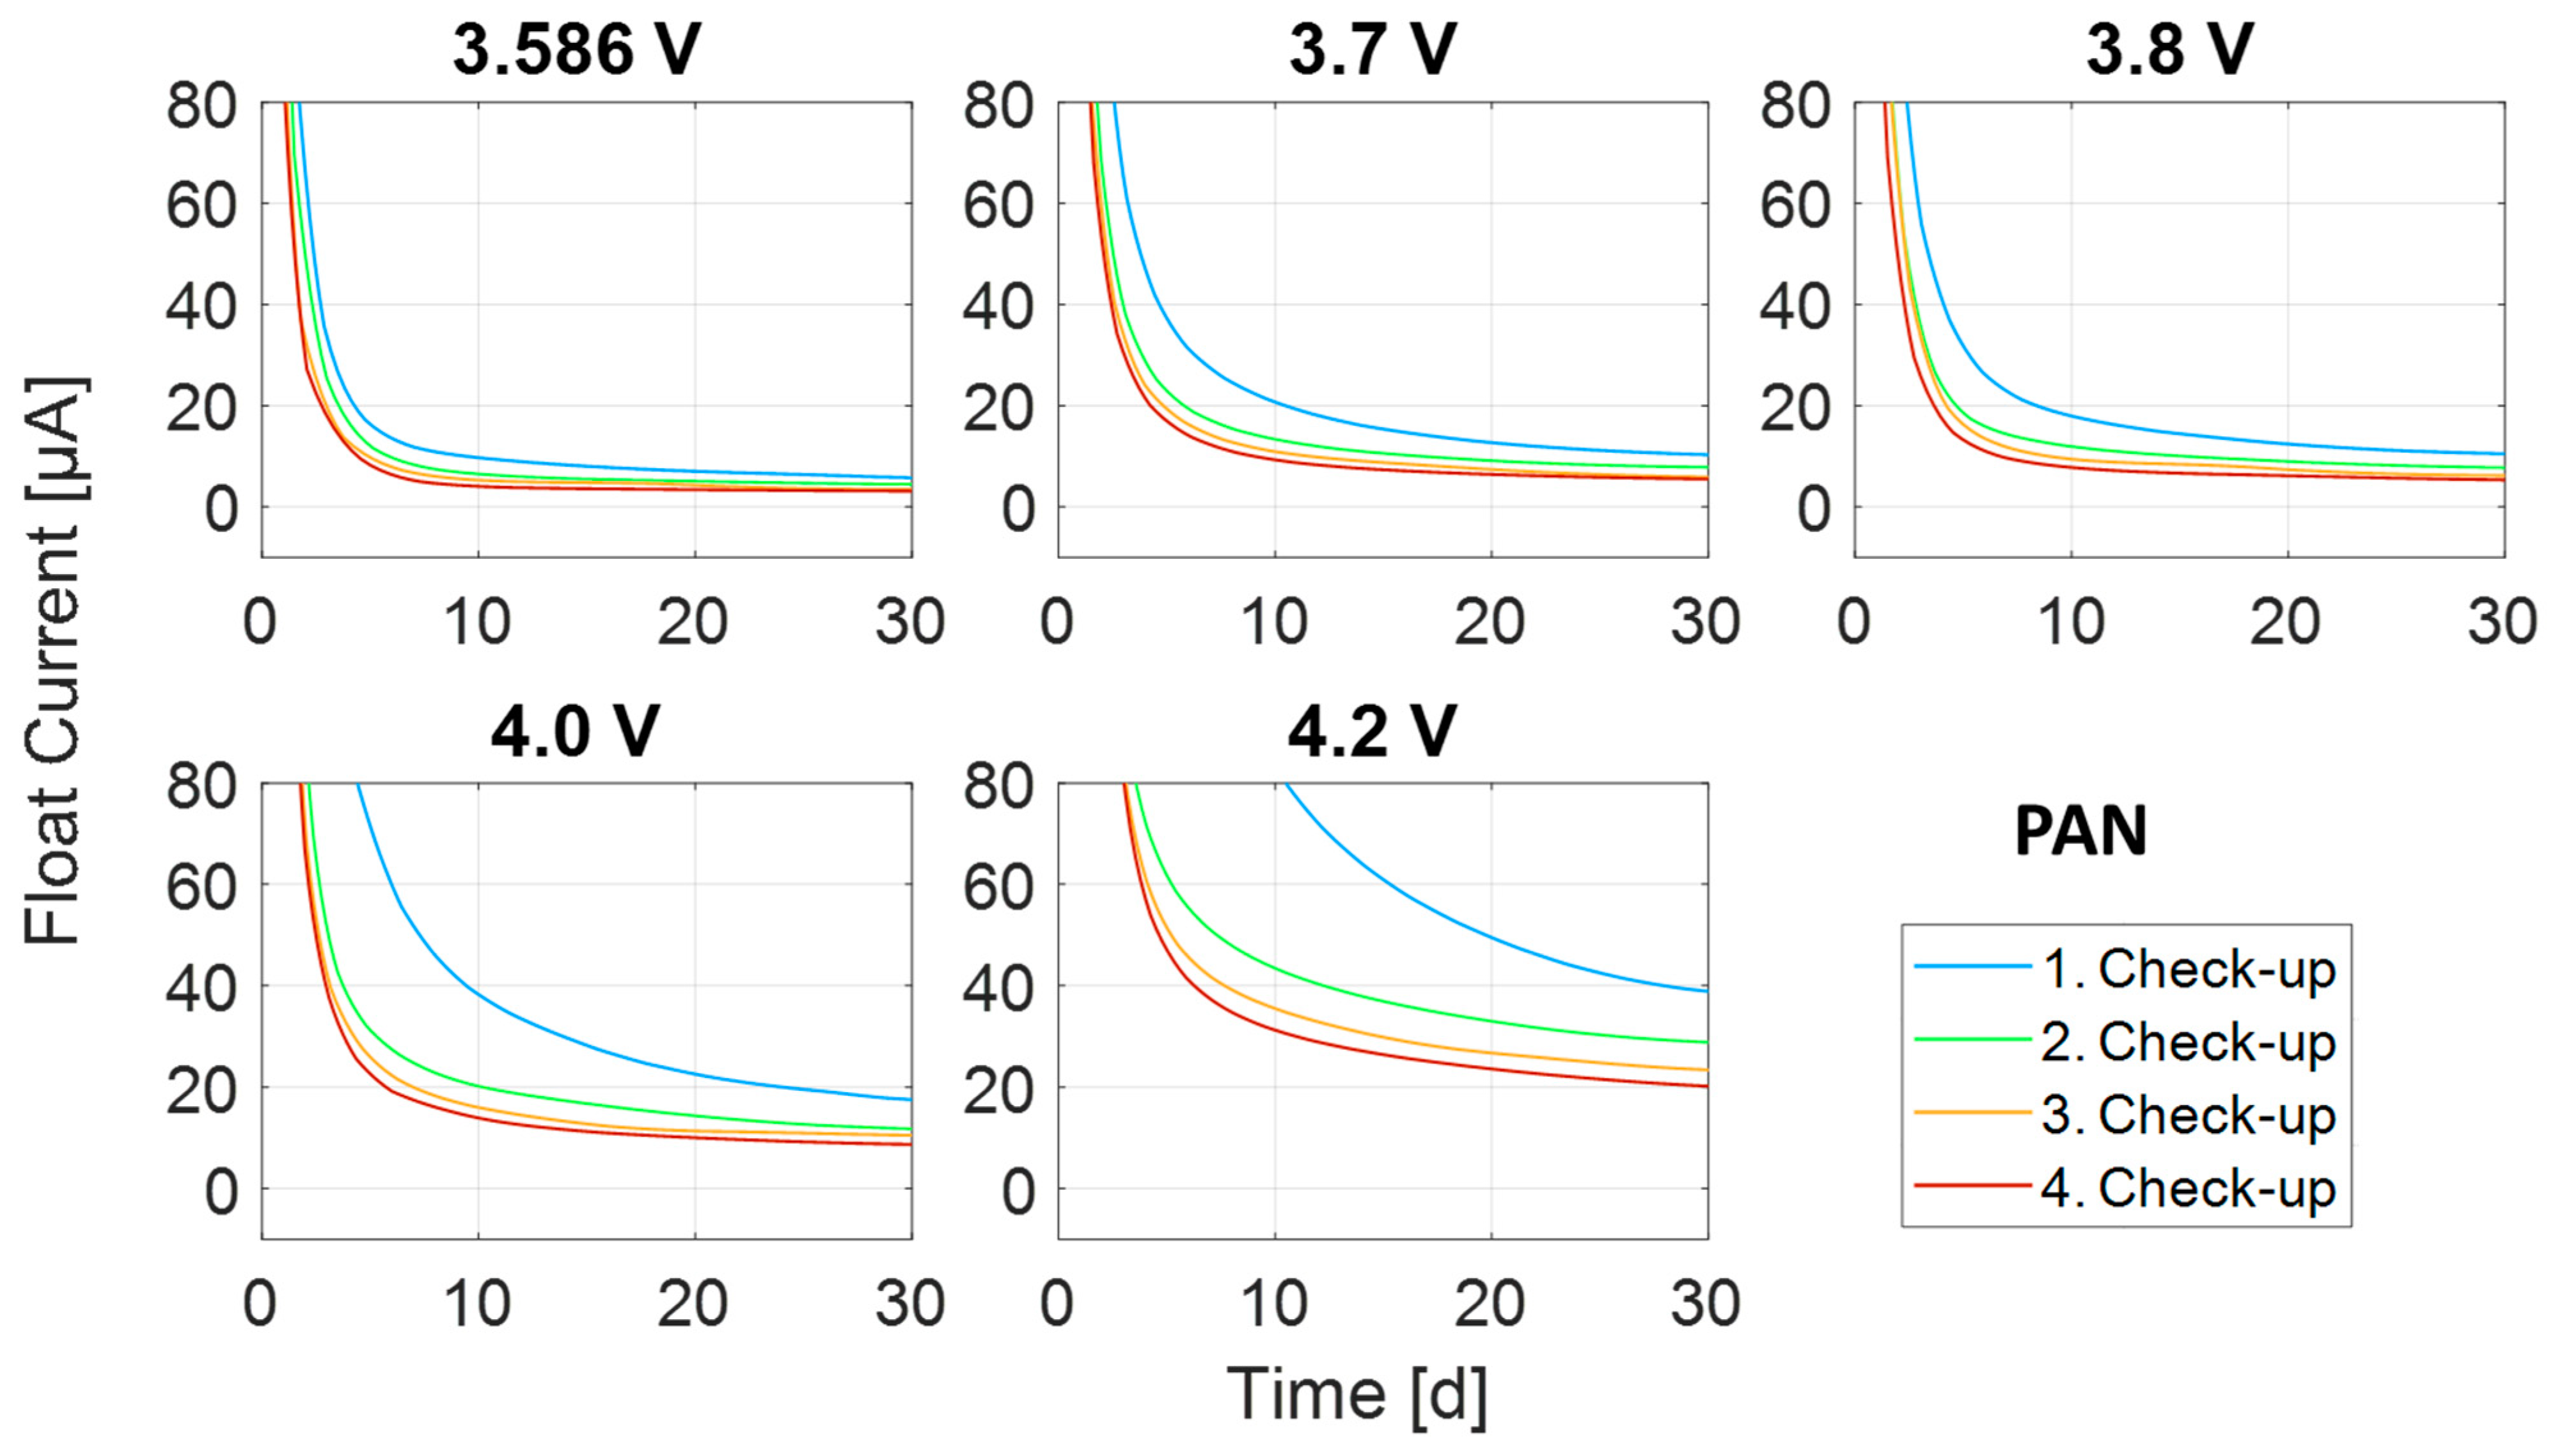
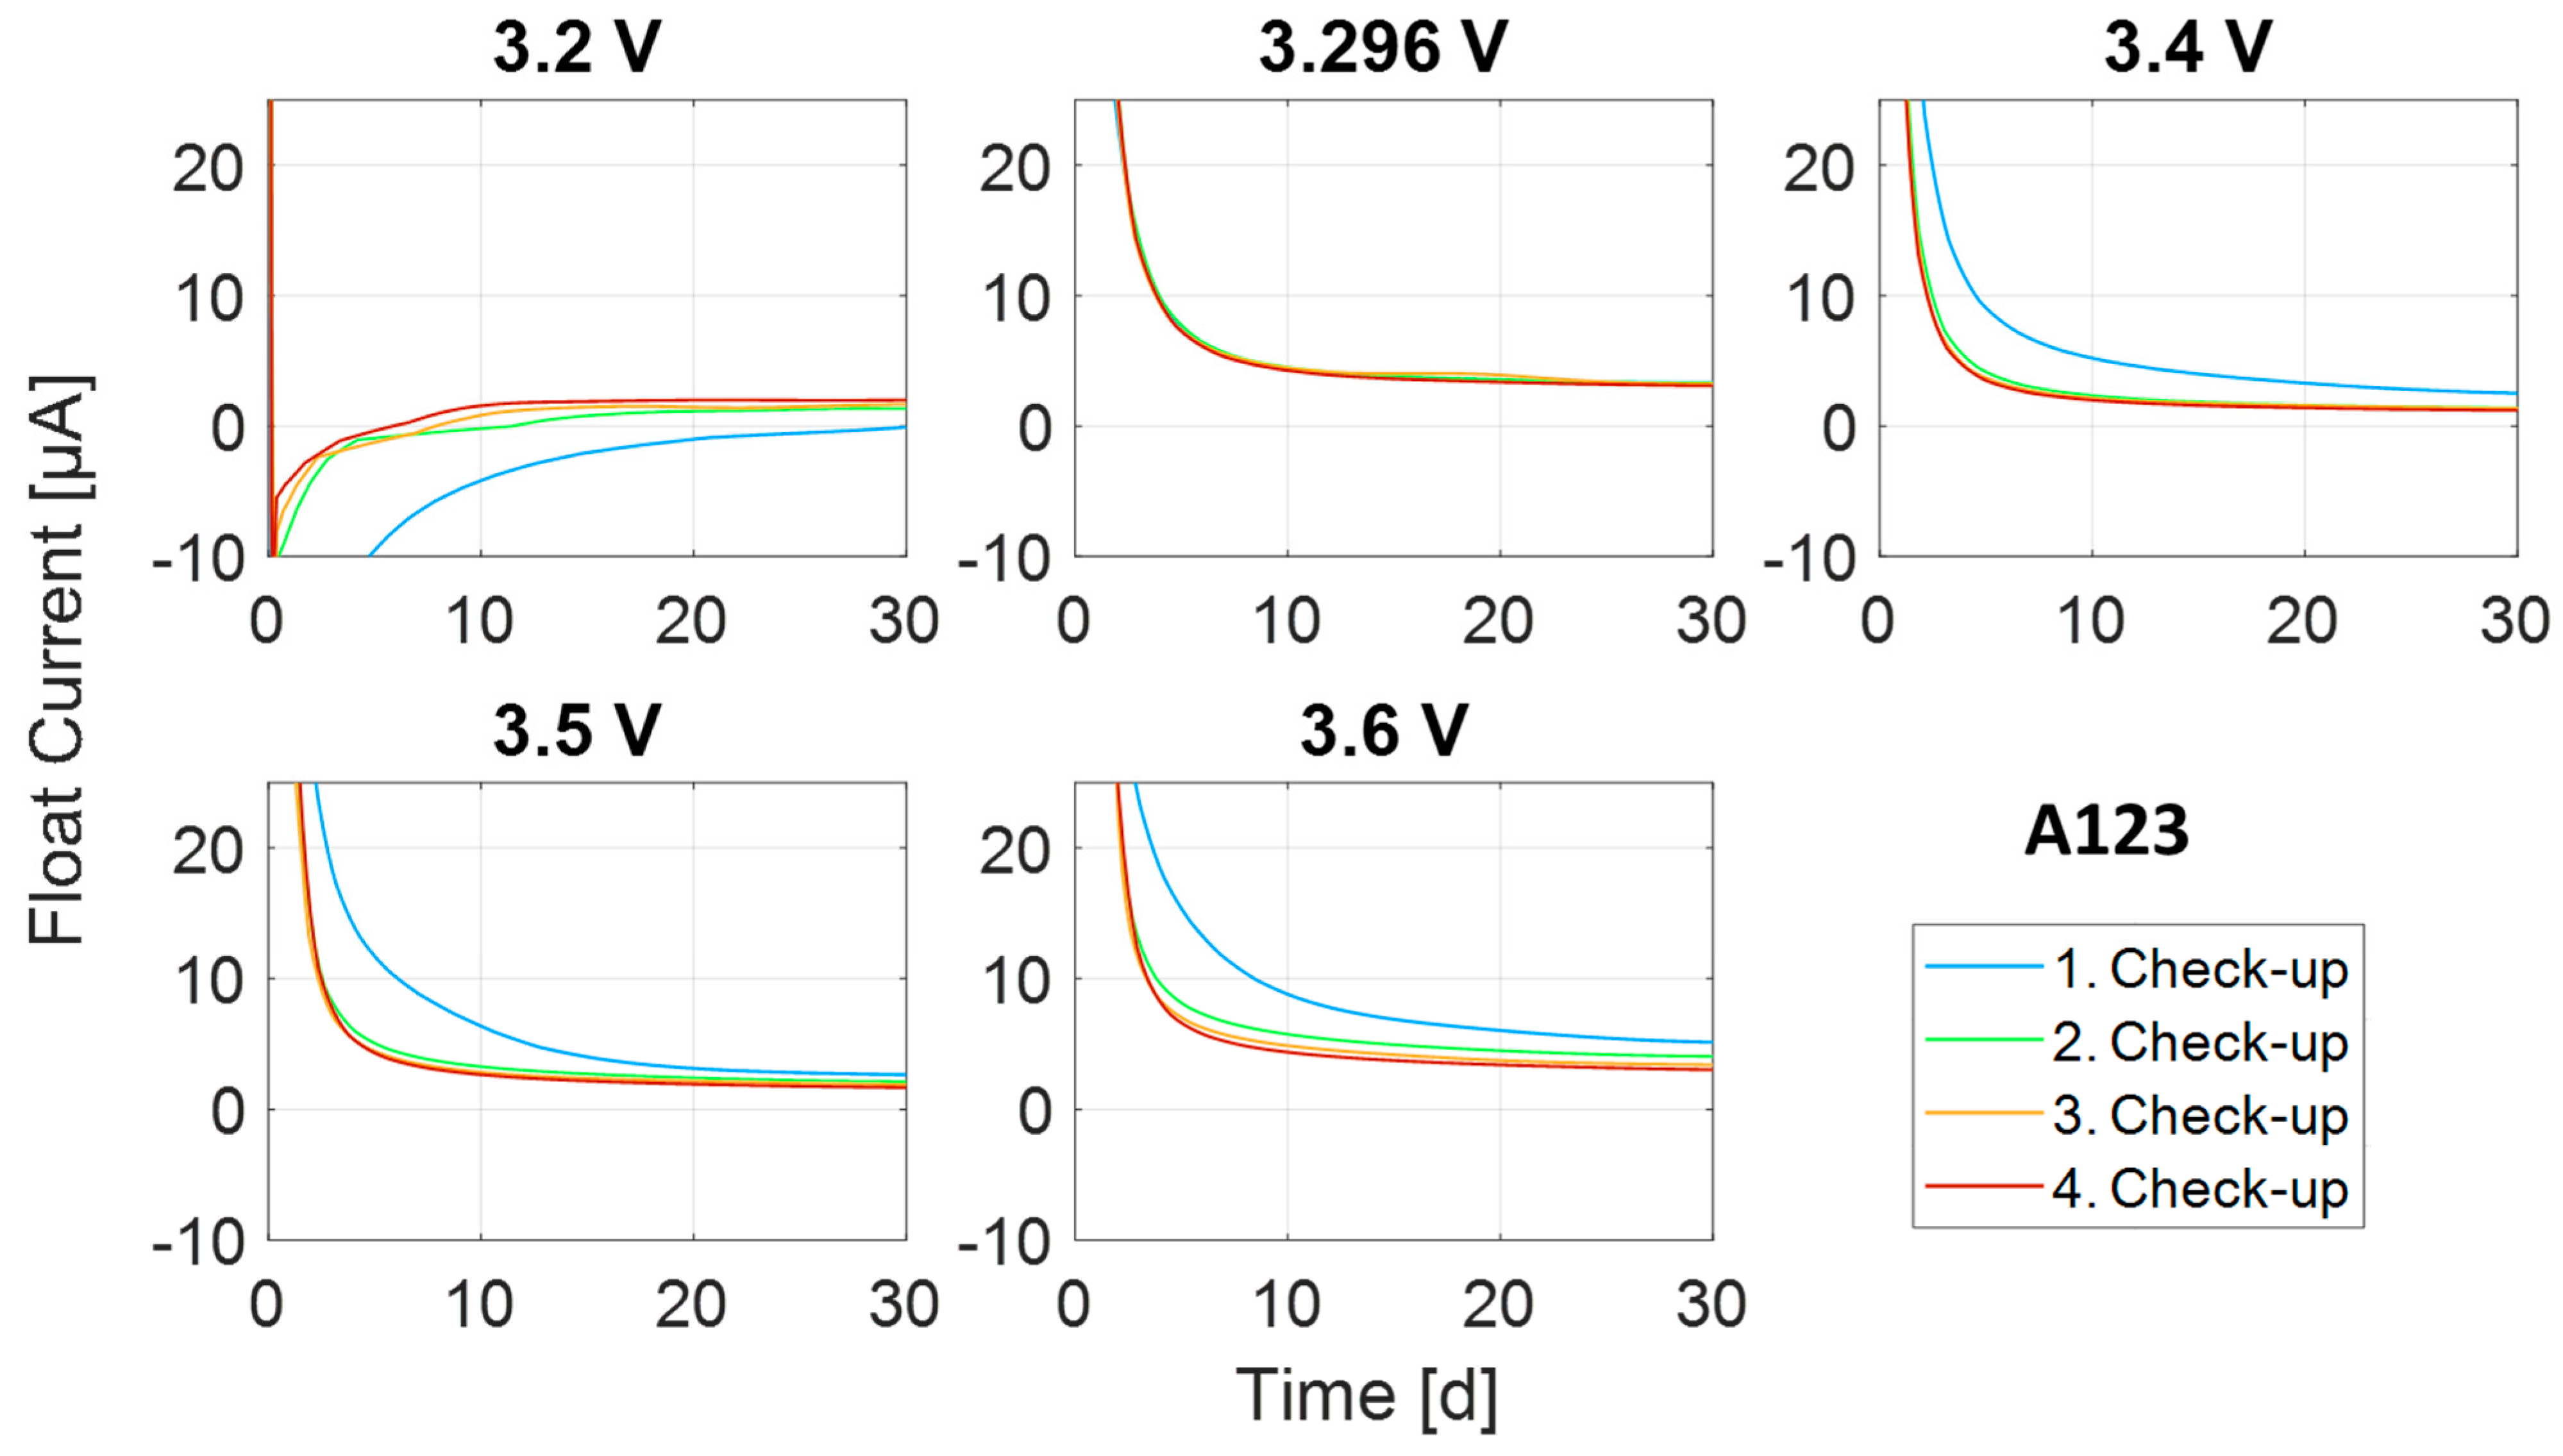
The low currents for the PAN are plotted in Figure A1 for low currents on top of each other. The results show that the transient phase after the first check-up behaves differently for all voltages except for 3.52 V, where the behavior is more comparable and reproducible, while the subsequent transient phases are hardly distinguishable. As for the 4.0 V and 4.2 V, it becomes apparent that the steady-state is not reached. The plots for the A123 are shown in Figure A2. Again, the first check-up behaves differently for all cell voltages except at 3.296 V.
Figure A1. Transient process for various float voltages of the example cell type PAN. The transient processes of the first 130 days are shifted to the respective end of the last checkup to show the differences in time constants between the 1st and following check-ups. Each subplot represents the data for one float voltage.
Energies 16 03889 g0a1
Figure A2. Transient process for various float voltages of the example cell type A123. The transient processes of the first 130 days are shifted to the respective end of the last checkup to show the differences in time constants between the 1st and following check-ups. Each subplot represents the data for one float voltage.
Energies 16 03889 g0a2

Appendix A.2

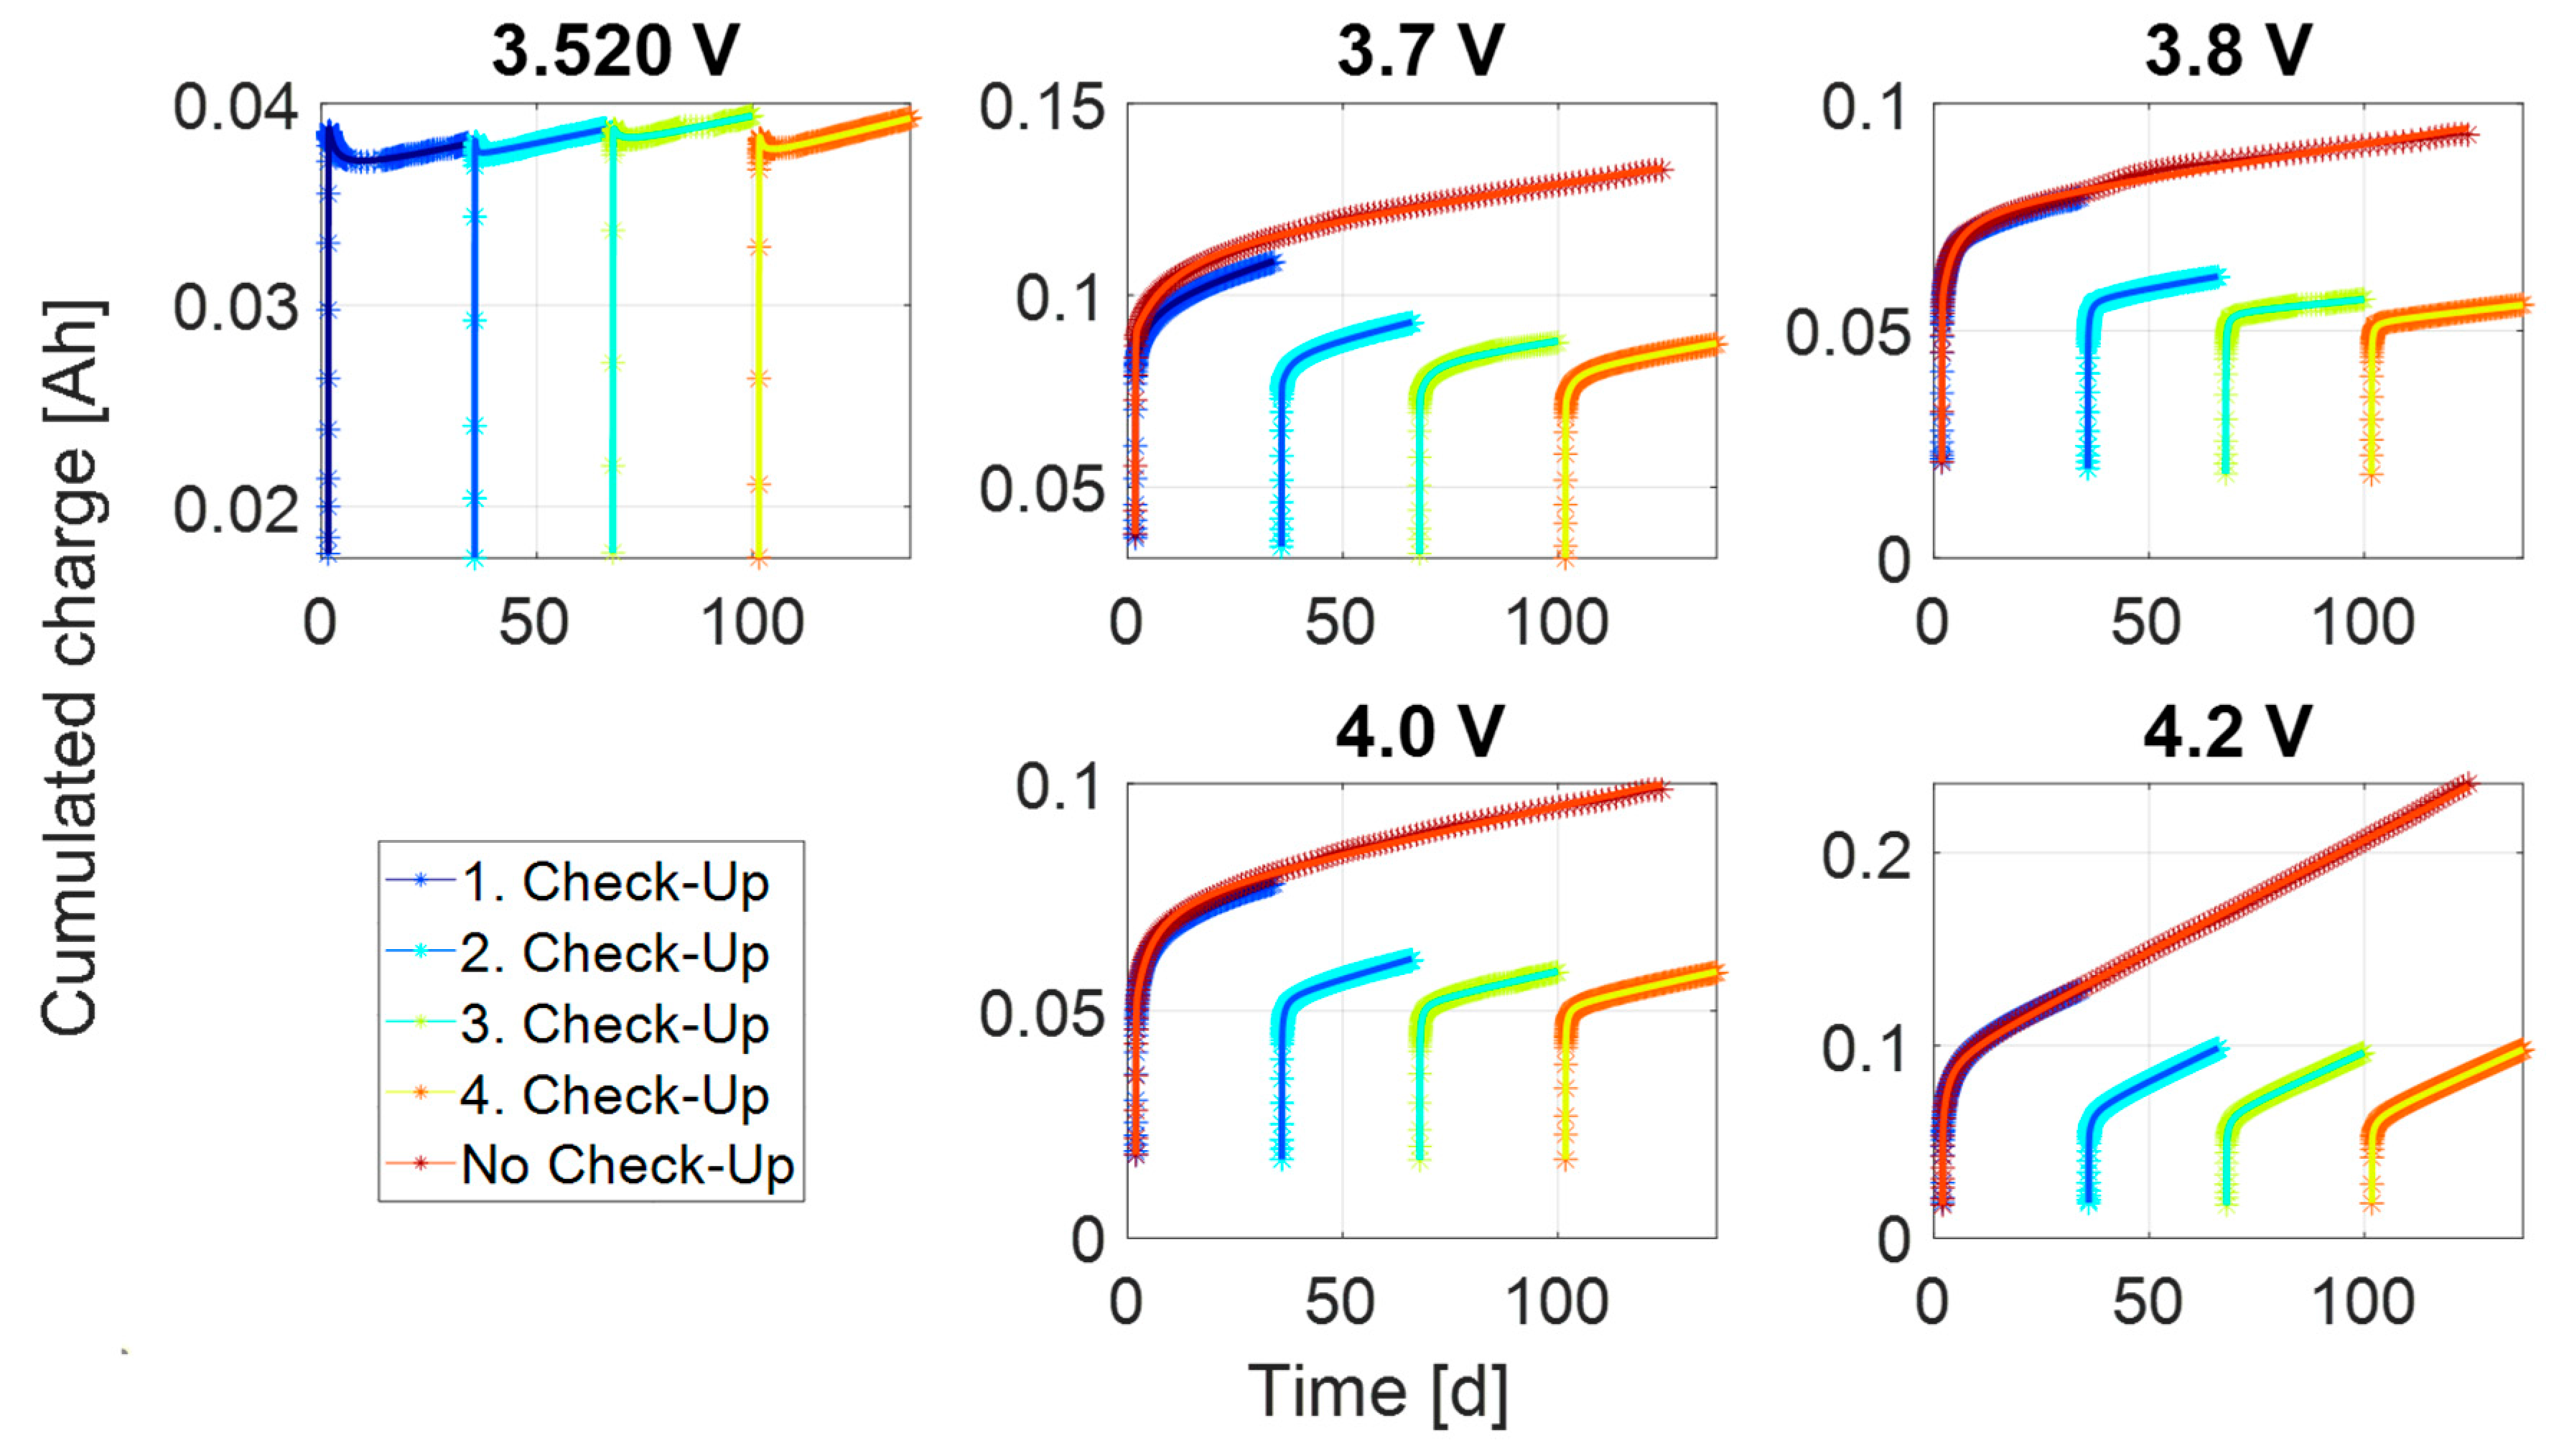
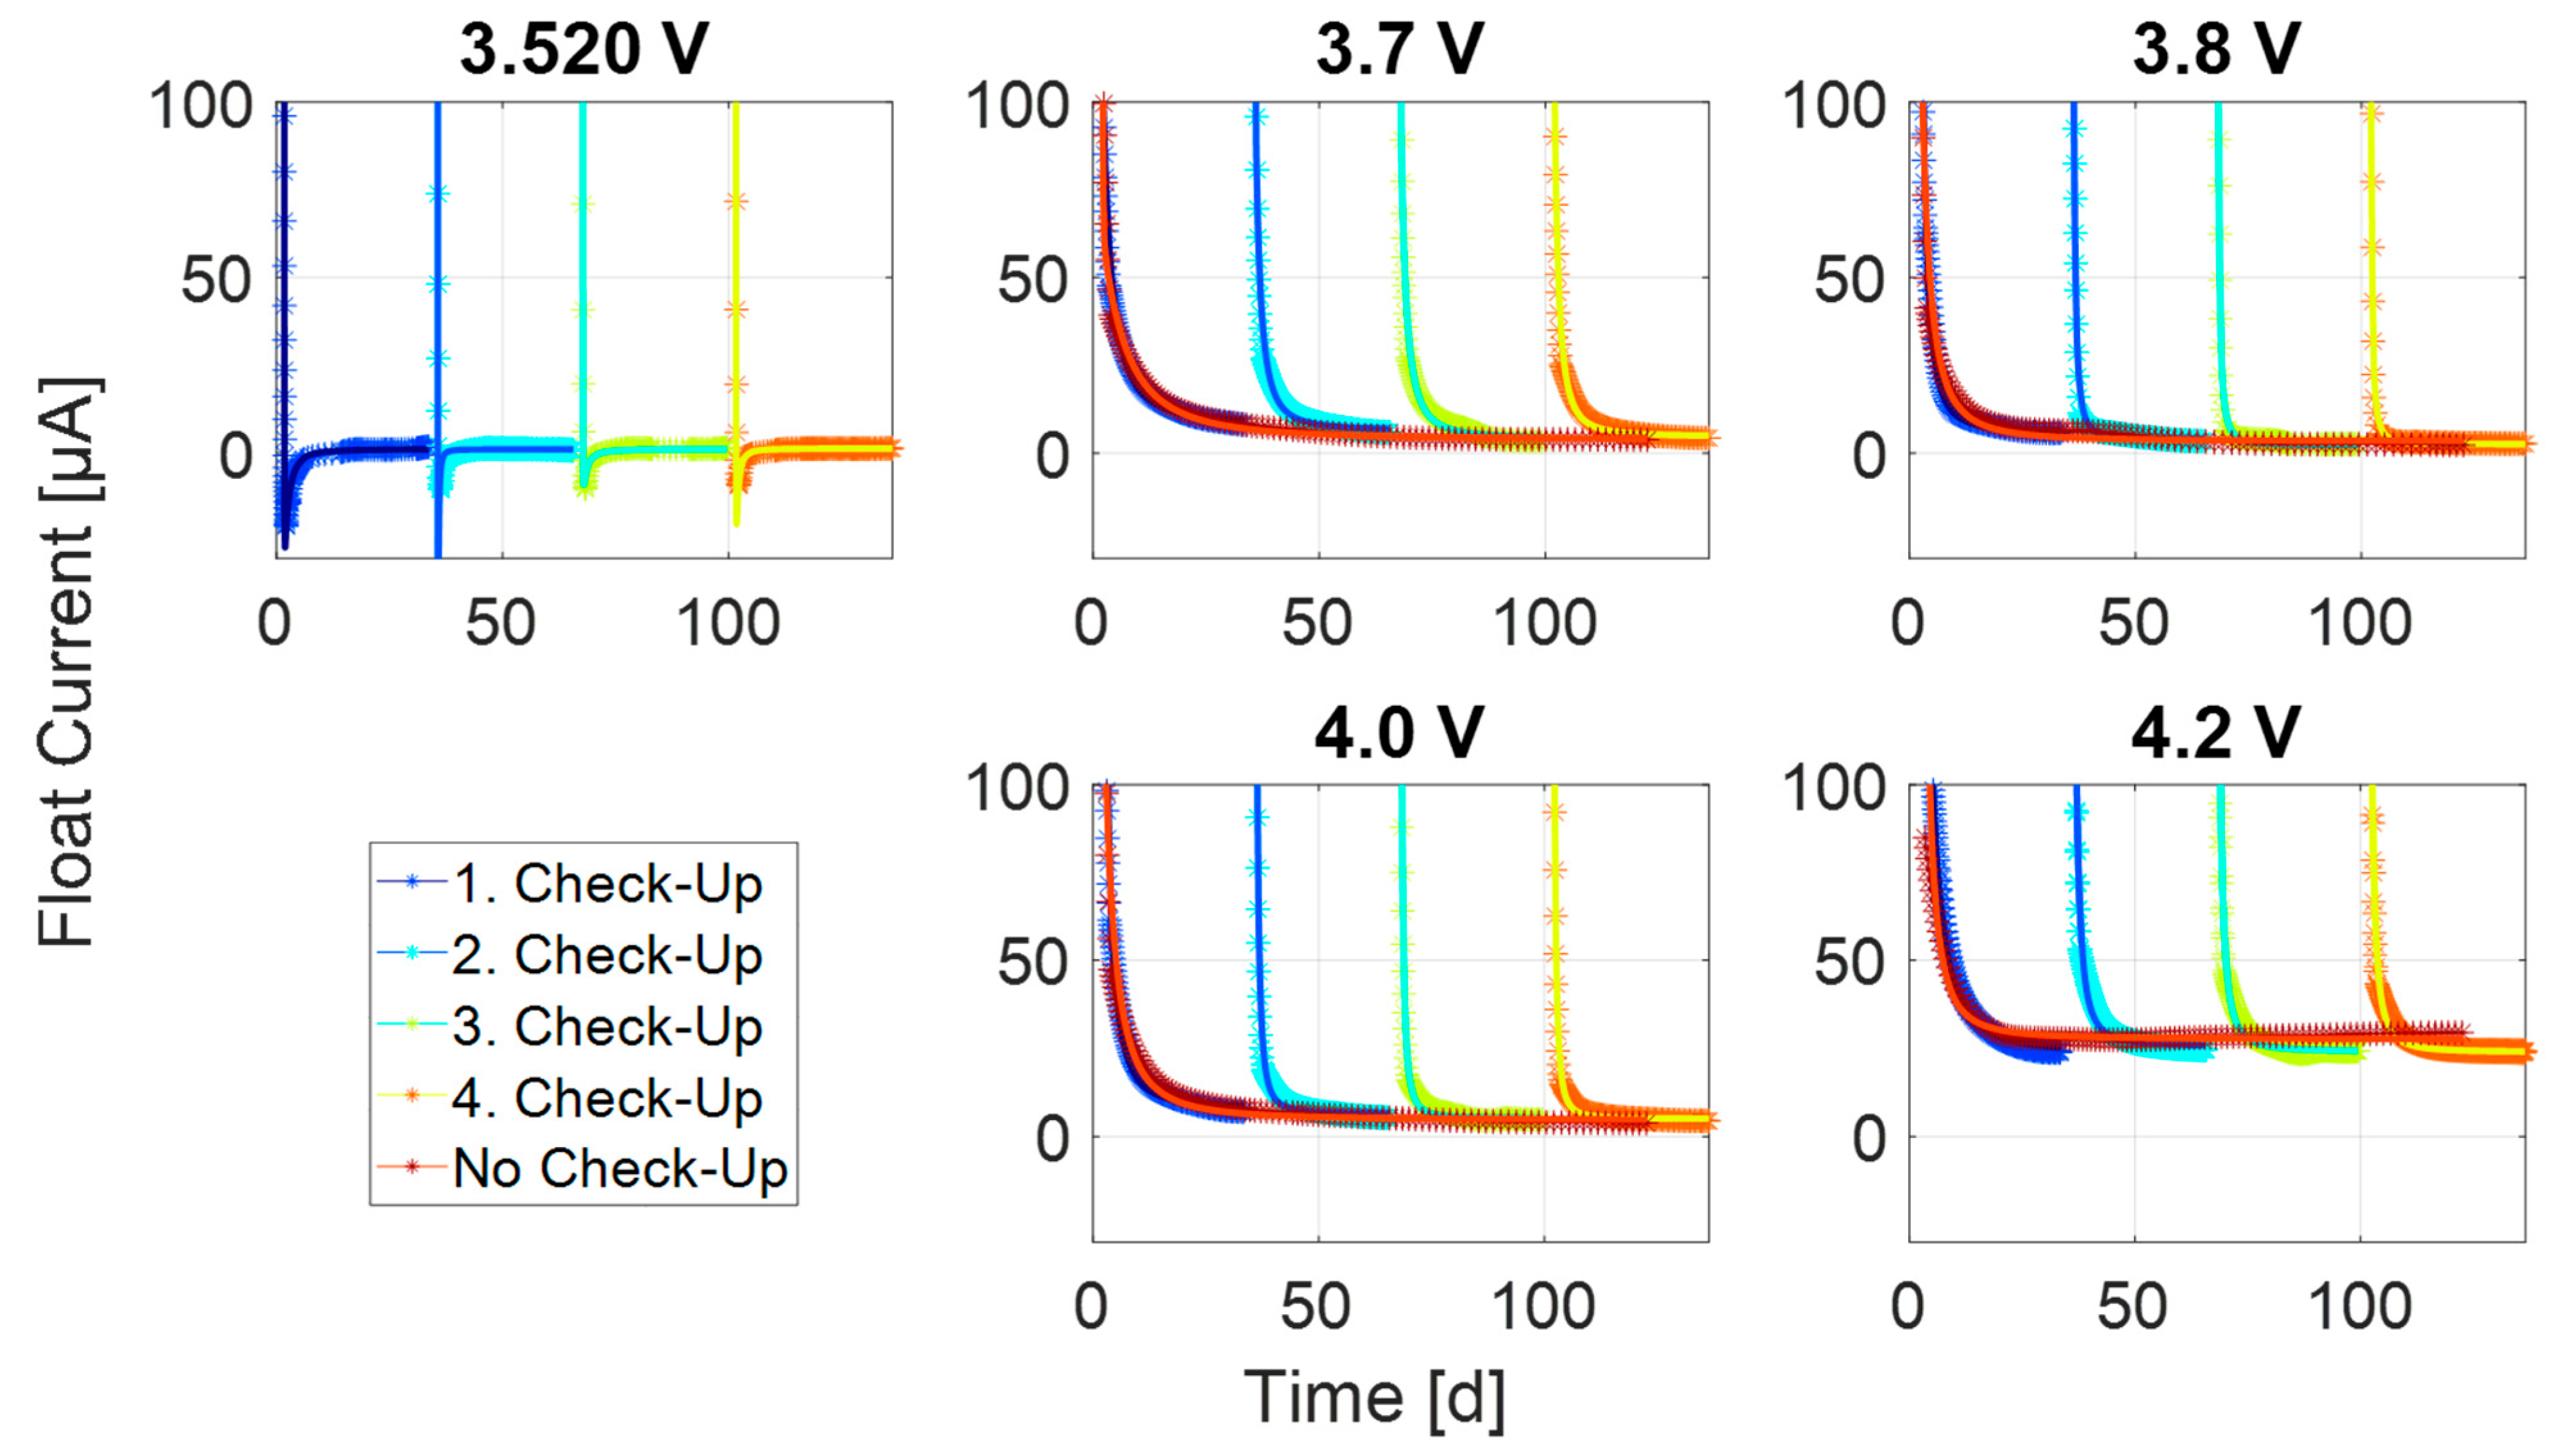
The comparison between the simulation results and the measurements for the SAN (Figure A3 and Figure A4) and for the PAN (Figure A5 and Figure A6) show the accuracy and the validity of the implemented model.
Figure A3. Comparison of the cumulated charge simulations and measurement results of the SAN at all measured voltages for all four check-ups and for the case without a check-up (solid lines represent the simulation and asterisks represent the measurement).
Energies 16 03889 g0a3
Figure A4. Comparison of the float current simulations and measurement results of the SAN at all measured voltages for all four check-ups and for the case without a check-up (solid lines represent the simulation and asterisks represent the measurement).
Energies 16 03889 g0a4
Figure A5. Comparison of the cumulated charge simulations and measurement results of the PAN at all measured voltages for all four check-ups and for the case without a check-up (solid line represent the simulation and asterisks represent the measurement).
Energies 16 03889 g0a5
Figure A6. Comparison of the float current simulations and measurement results of the PAN at all measured voltages for all four check-ups and for the case without a check-up (solid lines represent the simulation and asterisks represent the measurement).
Energies 16 03889 g0a6

References

  1. Diouf, B.; Pode, R. Potential of lithium-ion batteries in renewable energy. Renew. Energy 2015, 76, 375–380. [Google Scholar] [CrossRef]
  2. Dai, Q.; Kelly, J.C.; Gaines, L.; Wang, M. Life Cycle Analysis of Lithium-Ion Batteries for Automotive Applications. Batteries 2019, 5, 48. [Google Scholar] [CrossRef]
  3. Saw, L.H.; Ye, Y.; Tay, A. Electro-thermal analysis and integration issues of lithium ion battery for electric vehicles. Appl. Energy 2014, 131, 97–107. [Google Scholar] [CrossRef]
  4. Abdul-Jabbar, T.A.; Obed, A.A.; Abid, A.J. Design of an Uninterrupted Power Supply with Li-Ion Battery Pack: A Proposal for a Cost-Efficient Design with High Protection Features. J. Tech. 2021, 3, 1–10. [Google Scholar] [CrossRef]
  5. Käbitz, S.; Gerschler, J.B.; Ecker, M.; Yurdagel, Y.; Emmermacher, B.; André, D.; Mitsch, T.; Sauer, D.U. Cycle and calendar life study of a graphite|LiNi1/3Mn1/3Co1/3O2 Li-ion high energy system. Part A: Full cell characterization. J. Power Sources 2013, 239, 572–583. [Google Scholar] [CrossRef]
  6. Deutschen, T.; Gasser, S.; Schaller, M.; Siehr, J. Modeling the self-discharge by voltage decay of a NMC/graphite lithium-ion cell. J. Energy Storage 2018, 19, 113–119. [Google Scholar] [CrossRef]
  7. Lewerenz, M.; Münnix, J.; Schmalstieg, J.; Käbitz, S.; Knips, M.; Sauer, D.U. Systematic aging of commercial LiFePO4|Graphite cylindrical cells including a theory explaining rise of capacity during aging. J. Power Sources 2017, 345, 254–263. [Google Scholar] [CrossRef]
  8. Theiler, M.; Endisch, C.; Lewerenz, M. Float Current Analysis for Fast Calendar Aging Assessment of 18650 Li(NiCoAl)O2/Graphite Cells. Batteries 2021, 7, 22. [Google Scholar] [CrossRef]
  9. Zilberman, I.; Sturm, J.; Jossen, A. Reversible self-discharge and calendar aging of 18650 nickel-rich, silicon-graphite lithium-ion cells. J. Power Sources 2019, 425, 217–226. [Google Scholar] [CrossRef]
  10. Lewerenz, M.; Dechent, P.; Sauer, D.U. Investigation of capacity recovery during rest period at different states-of-charge after cycle life test for prismatic Li(Ni1/3Mn1/3Co1/3)O2-graphite cells. J. Energy Storage 2019, 21, 680–690. [Google Scholar] [CrossRef]
  11. Gyenes, B.; Stevens, D.A.; Chevrier, V.L.; Dahn, J.R. Understanding Anomalous Behavior in Coulombic Efficiency Measurements on Li-Ion Batteries. J. Electrochem. Soc. 2015, 162, A278–A283. [Google Scholar] [CrossRef]
  12. Lewerenz, M.; Fuchs, G.; Becker, L.; Sauer, D.U. Irreversible calendar aging and quantification of the reversible capacity loss caused by anode overhang. J. Energy Storage 2018, 18, 149–159. [Google Scholar] [CrossRef]
  13. Fath, J.P.; Alsheimer, L.; Storch, M.; Stadler, J.; Bandlow, J.; Hahn, S.; Riedel, R.; Wetzel, T. The influence of the anode overhang effect on the capacity of lithium-ion cells—A 0D-modeling approach. J. Energy Storage 2020, 29, 101344. [Google Scholar] [CrossRef]
  14. Schmalstieg, J.; Käbitz, S.; Ecker, M.; Sauer, D.U. A holistic aging model for Li(NiMnCo)O2 based 18650 lithium-ion batteries. J. Power Sources 2014, 257, 325–334. [Google Scholar] [CrossRef]
  15. Hildenbrand, F.; Ditscheid, D.; Barbers, E.; Sauer, D.U. Influence of the anode overhang on the open-circuit voltage and the ageing of lithium-ion batteries—A model based study. Appl. Energy 2023, 332, 120395. [Google Scholar] [CrossRef]
  16. Hüfner, T.; Oldenburger, M.; Bedürftig, B.; Gruhle, A. Lithium flow between active area and overhang of graphite anodes as a function of temperature and overhang geometry. J. Energy Storage 2019, 24, 100790. [Google Scholar] [CrossRef]
  17. Friedrich, F.; Pieper, S.; Gasteiger, H.A. Entropy Measurements of Li-Ion Battery Cells with Li- and Mn-Rich Layered Transition Metal Oxides via Linear Temperature Variation. J. Electrochem. Soc. 2021, 168, 120502. [Google Scholar] [CrossRef]
  18. Shi, W.; Zheng, J.; Xiao, J.; Chen, X.; Polzin, B.J.; Zhang, J.-G. The Effect of Entropy and Enthalpy Changes on the Thermal Behavior of Li-Mn-Rich Layered Composite Cathode Materials. J. Electrochem. Soc. 2016, 163, A571–A577. [Google Scholar] [CrossRef]
  19. D’Errico, J. SLM—Shape Language Modeling. Available online: https://www.mathworks.com/matlabcentral/fileexchange/24443-slm-shape-language-modeling (accessed on 10 October 2022).
  20. The MathWorks, Inc. Global Optimization Toolbox User’s Guide; The MathWorks, Inc.: Natick, MA, USA, 2011. [Google Scholar]
  21. Ugray, Z.; Lasdon, L.; Plummer, J.; Glover, F.; Kelly, J.; Martí, R. Scatter Search and Local NLP Solvers: A Multistart Framework for Global Optimization. INFORMS J. Comput. 2007, 19, 313–484. [Google Scholar] [CrossRef]
  22. Persson, K.; Sethuraman, V.A.; Hardwick, L.J.; Hinuma, Y.; Meng, Y.S.; van der Ven, A.; Srinivasan, V.; Kostecki, R.; Ceder, G. Lithium Diffusion in Graphitic Carbon. J. Phys. Chem. Lett. 2010, 1, 1176–1180. [Google Scholar] [CrossRef]
  23. Kizilyalli, M.; Corish, J.; Metselaar, R. Definitions of Terms for Diffusion in the Solid State. Pure Appl. Chem. 1999, 71, 1307–1325. [Google Scholar] [CrossRef]
  24. Katopodes, N.D. Diffusive Mass Transfer. In Free-Surface Flow; Elsevier: Amsterdam, The Netherlands, 2019; pp. 184–270. ISBN 9780128154892. [Google Scholar]
  25. Yang, J.; Du, C.; Wang, T.; Gao, Y.; Cheng, X.; Zuo, P.; Ma, Y.; Wang, J.; Yin, G.; Xie, J.; et al. Rapid Prediction of the Open-Circuit-Voltage of Lithium Ion Batteries Based on an Effective Voltage Relaxation Model. Energies 2018, 11, 3444. [Google Scholar] [CrossRef]
  26. Wilhelm, J.; Seidlmayer, S.; Keil, P.; Schuster, J.; Kriele, A.; Gilles, R.; Jossen, A. Cycling capacity recovery effect: A coulombic efficiency and post-mortem study. J. Power Sources 2017, 365, 327–338. [Google Scholar] [CrossRef]
  27. Pei, L.; Wang, T.; Lu, R.; Zhu, C. Development of a voltage relaxation model for rapid open-circuit voltage prediction in lithium-ion batteries. J. Power Sources 2014, 253, 412–418. [Google Scholar] [CrossRef]
Figure 1. (a) Measured cumulated charge of the float current for the SAN cell at 3.7 V after the first checkup subdivided into three sections for different filtering procedures. (b) Measured and filtered cumulated charge of the SAN cell at 3.7 V after the first checkup. (c) Zoomed in section to show the quality of the filtering procedure.
Energies 16 03889 g001
Figure 2. Transient process for various float voltages in the first 2–3 h after the constant current phase for A123, PAN, and SAN cell types. For each float voltage, the four transient processes after a check-up are plotted on top of each other. No filtering was carried out for these diagrams.
Energies 16 03889 g002
Figure 3. Transient process for various float voltages in the first 130 days for A123, PAN, and SAN cell types. The 30-day transient process was interrupted by a check-up.
Energies 16 03889 g003
Figure 4. Transient process for various float voltages in the first phase of 130 days comparing the difference between check-up-interrupted (thin lines) and non-interrupted (thick lines) measurements for A123. Each subplot represents the data for one float voltage.
Energies 16 03889 g004
Figure 5. Transient process for various float voltages in the first phase of 130 days comparing the difference between check-up-interrupted (thin lines) and non-interrupted (thick lines) measurements for PAN. Each subplot represents the data for one float voltage.
Energies 16 03889 g005
Figure 6. Transient process for various float voltages in the first phase of 130 days comparing the difference between check-up-interrupted (thin lines) and non-interrupted (thick lines) measurements for SAN. Each subplot represents the data for one float voltage. For 3.52 V no uninterrupted tests were conducted due to limitations of test channels. At 4.2 V, two interrupted cells are displayed on top of each other.
Energies 16 03889 g006
Figure 7. Transient process for various float voltages of the example cell type SAN. The transient processes during the first 130 days are shifted to the respective end of the last check-up to show the differences in time constants between the 1st and the following check-ups. Each subplot represents the data for one float voltage. At 4.2 V, the results of two different cells were plotted on top of each other.
Energies 16 03889 g007
Figure 8. Steady-state process for various float voltages in the first phase of 130 days for A123, PAN, and SAN cell types. For this evaluation, the data without check-up interruption is used (the solid lines are the measurement curves, and the dashed lines are the extrapolated curves).
Energies 16 03889 g008
Figure 9. (a) Exemplary curve of the measured voltage and current while floating. The three main phenomena are depicted as 1 polarization 2a, 2b positive and negative anode overhang, respectively, and 3 steady-state. (b) Measured anode OCV of the A123 with some points used in the floating measurements to illustrate the calculation of the sign and value of the anode-overhang cumulated charge prefactor.
Energies 16 03889 g009
Figure 10. Comparison of the cumulated charge simulations and measurement results of the A123 at all measured voltages for all four check-ups and for the case without a check-up (solid lines represent the simulation and points represent the measurement).
Energies 16 03889 g010
Figure 11. Comparison of the float current simulation and measurement results of the A123 at all measured voltages for all four check-ups and for the case without a check-up (solid lines represent the simulation and asterisks represent the measurement).
Energies 16 03889 g011
Figure 12. The simulated time constants of the anode overhang (red) and polarization (blue) processes.
Energies 16 03889 g012
Figure 13. Comparison of the time required to reach a steady-state for all cell types at all measured voltages based on the model between (a) first check-up and without check-up and (b) first check-up, second check-up, third check-up and fourth check-up.
Energies 16 03889 g013
Table 1. Specifications of the three used battery cell types.
Short NameA123PANSAN
ProducerA123PanasonicSanyo
Cell typeAPR18650M-A1NCR18650BUR18650AAN
CathodeLFP:
LiFePO4
NCA:Li(Ni0.81Co0.16Al0.03)O2NMC:
Li(NixMnyCoz)O2
AnodeGraphiteGraphiteGraphite
Nom. Capacity 1.1 Ah3.2 Ah2.15 Ah
Nom. Voltage3.3 V3.6 V3.6 V
Max charge current3.6 C0.5 C0.7 C
Max. discharge voltage2.0 V3.0 V3.0 V
Max. charge voltage3.6 V4.2 V4.2 V
Energy density93 Wh/kg248 Wh/kg180 Wh/kg
Storage voltage (SOC) before test 3.296 V (26%)3.586 V (28%)3.520 V (14%)
Table 2. Test matrix for the three cell types A123, PAN, and SAN. The last two columns on the right state the number of cells in the test conditions that were interrupted by check-ups or that were not interrupted. The float voltages with a higher precision are the cell potentials, as they are delivered by the manufacturer.
Cell TypeFloat
Voltage
# Checkup-
Interrupted
# Not
Interrupted
A1233.2 V 11
3.296 V11
3.4 V11
3.5 V11
3.6 V11
PAN3.586 V11
3.7 V11
3.8 V11
4.0 V11
4.2 V11
SAN3.520 V10
3.7 V11
3.8 V11
4.0 V11
4.2 V21
Disclaimer/Publisher’s Note: The statements, opinions and data contained in all publications are solely those of the individual author(s) and contributor(s) and not of MDPI and/or the editor(s). MDPI and/or the editor(s) disclaim responsibility for any injury to people or property resulting from any ideas, methods, instructions or products referred to in the content.