Abstract
South Africa’s energy network is under severe pressure due to low supply and overwhelming demand. With an increase in renewable energy providers, specifically wind energy, knowing how the supply can satisfy the electricity demand may relieve apprehensions. This research aims to provide insight into the wind energy supply of South Africa and question how well this supply meets the demand of South Africa. The methodology used in this work highlights the importance of access to public datasets to dispel misconceptions in the energy industry. Additionally, the work supports network planning and the arguments for increasing wind energy penetration on the South African grid. Wind profiles and the typical energy production of South African wind farms are compared to electricity demand. The geographical spacing of the operational wind farms is considered. It is observed that wind energy supply assists in the peak electricity hourly demand as well as seasonal peaks. Furthermore, South Africa’s coast is analysed to determine the offshore wind power potential, where shallow and deep waters are considered. It is observed that South Africa has a high potential for offshore wind, even after losses are applied.
1. Introduction
For the last 15 years, South Africa has faced an energy supply problem [1]. The energy network has been overwhelmed with demand to the extent that Eskom, who supplies 95% of South Africa’s electricity [2], has implemented a measure to cut electricity supply, deemed load shedding. The government-owned utility company has historically been able to provide electricity at competitive rates, but due to a decline in the energy availability factor, it has significantly increased the cost of electricity. Eskom started a new build program in 2007 with plans to have 4800 MW [3] and 4764 MW [4] of power online by the end of 2014 from their Kusile and Medupi power stations, respectively [5]. These plants are more than ZAR 286 billion over budget and delayed—the Kusile power station is expected to only be completed in 2023 [6].
This has resulted in serious consequences for South Africa, and independent power producers (IPPs) have been introduced to assist with sustaining South Africa’s electricity demand. The IPPs that have come online are all renewable energy sources, as this technology has become more financially competitive with conventional energy sources around the world [7]. The renewable energy sector in South Africa, specifically wind energy, has seen a rapid growth in recent years, starting in 2011 with 633.99 MW [8] and now with 3357 MW of installed capacity, which is expected to increase to 17742 MW by 2030 [9]. There are a total of 36 wind farms in operation in South Africa. The renewable energy detractors maintain that this type of energy is unreliable and requires significant backup to be viable. In the UK, discussions around wind’s ability to provide power when needed highlight the benefits of offshore wind as a more secure supply source [10]. A highly interconnected grid allows for the rapid adoption of renewable energy due to the grid flexibility [11], but this is not always replicable. A study was conducted in 2022, where the placement of renewable energy sources was found to be very important for an efficient implementation [12].
Eskom produces an annual report outlining the connection capacity of the country. Figure 1 shows the different regions in South Africa along with their connection capacities. It is clear that there is a significant amount of connection capacity in most regions, with the exception of the Northern Cape and Pelly regions, which have no remaining connection capacity. This could be due to the excellent wind and solar resources available in the Northern Cape and the many existing energy plants there. Mpumalanga has the highest connection capacity of 6520 MW.
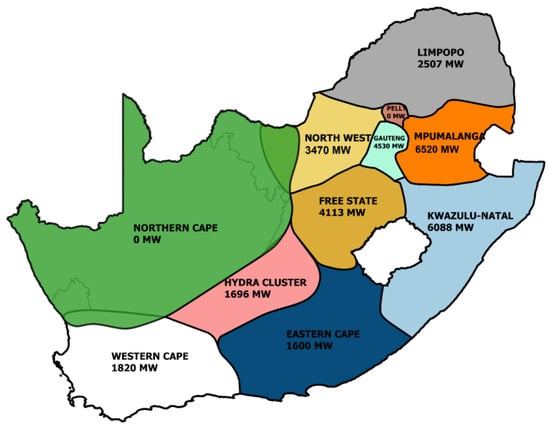
Figure 1.
Connection capacity in South Africa [13].
Wind speeds are critical to the viability of wind farms since they are directly proportional to the farm’s power production and in turn, financial health. Aside from what the wind speeds are, and consequently the power production, it is also important to know when the wind is best and worst performing (whose metric is speed). This is especially important with South Africa’s movement to renewable energy, specifically wind energy, with Eskom’s Just Energy Transition (JET) aiming to achieve net-zero carbon emissions by 2050 [14]. Knowing when wind energy is most likely to peak throughout the day can assist Eskom and other energy providers in making provision for a lack of wind energy supply in times of high demand each day.
Understanding the wind profiles of South Africa, onshore and offshore, can be exceptionally useful when considering the demand requirements. South Africa has been investigating offshore wind as a long-term energy supply method to combat its struggling electricity network. Offshore wind energy has the major advantage over onshore wind energy in that there is an improved likelihood of higher capacity factors which are obtained as a result of consistently higher wind speeds over the ocean. A study looked at the current wind farm distribution in the UK and using ERA5 data, estimated the mean capacity factor to be around 32%. When taking into account the planned offshore developments and the same models, the mean capacity factor increased to 39.7% [15]. When looking at farms on either side of the UK, which has a relatively small geographic displacement, there was a noticeable difference in the capacity factors [16]. This means that the geographical spacing of potential wind farms can have a significant impact on when, and how much, energy is supplied to the grid.
There are two overarching types of offshore wind turbines, namely fixed-bottom turbines and floating-bottom turbines. The main differences, illustrated in Figure 2, are expanded on below:
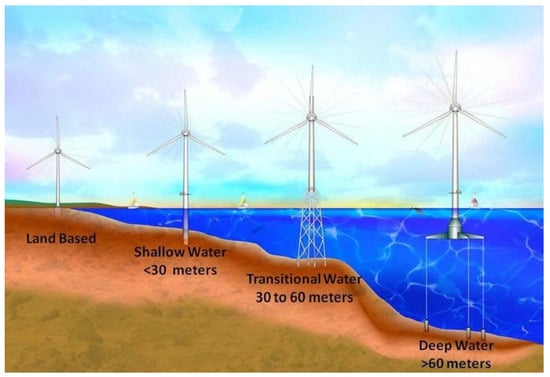
Figure 2.
Difference in wind turbine types [17].
- 1.
- Fixed turbines have their foundation anchored directly to the seabed, meaning that they remain in a fixed position. Floating turbines have a floating foundation, with tethers connecting them to the seabed to prevent them from drifting away.
- 2.
- Fixed turbines are to be used up to water depths of 60 m [18], and floating turbines are used for deeper waters.
- 3.
- Fixed-turbine wind farms are significantly cheaper than floating-turbine wind farms. This is due to the very high cost of the substructure and foundations of the floating platform of floating turbines [19].
- 4.
- Floating turbines have a much larger operational area. Due to floating turbines being further away from the shore, there is more space for development and less risk of other influences such as policy and environmental barriers.
It is important to keep these main differences in mind so that there is some context for the offshore analysis in this research. This is especially true with South Africa’s vast range of bathymetry, which is further explored in this research. Due to the limits of the geographical placement of these turbines, the total energy potential and supply profiles from each type are different. It is also expected that these turbines will increase in hub height. The US Office of Energy Efficiency and Renewable Energy predicts that offshore wind turbines can reach hub heights of about 150 m by 2035, as indicated by Figure 3. It is therefore also important to perform evaluations on these greater elevations to align with future offshore wind developments.
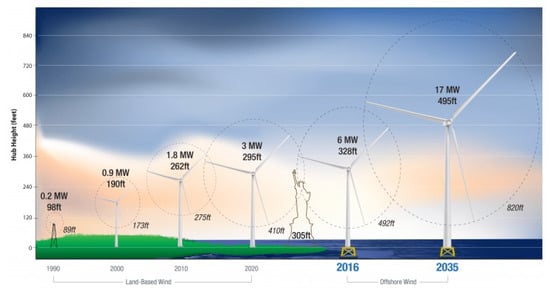
Figure 3.
Prediction of increasing hub heights of wind turbines [20].
This research follows the form described below. Section 2, titled data inputs, introduces all input data that were used. This includes the format that the data were acquired in and which restrictions were placed on the data. Section 3, titled methodology, explains how the research was performed. This section forms the foundation of the modelling and computation in this work. Section 4, titled onshore results, illustrates the results of the wind profiling in South Africa and compares this to the demand. This is examined on a daily and monthly (seasonal) basis. The modelled capacity factors are also examined. Section 5, titled offshore results, captures the offshore potential of South Africa, keeping in context the different types of offshore turbines mentioned before. Losses are applied to the model, and an estimation is provided, together with promising areas for future development. Section 6, titled conclusion, summarises the research, observations, and key results.
2. Data Inputs
All data for this research were obtained from publicly available data sets. The most critical information for this work was the details around each commercially operational wind farm in South Africa. Details on each wind farm’s specification—type of turbine (and consequently power curve information), number of turbines, and their geographical location—were needed to correctly model the energy production. Due to the controversial nature of renewable energy, there are multiple websites providing details of wind energy in South Africa. Figure 4 is an example of the interface of such a website, energydesk.africa [21]. This was used in conjunction with thewindpower.net [22] to collect the aforementioned data.
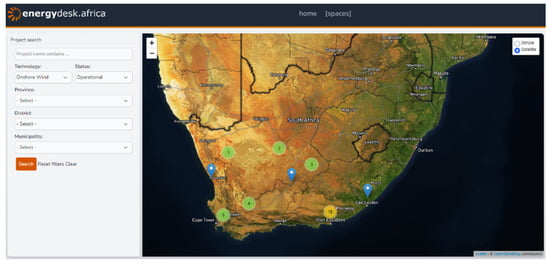
Figure 4.
energydesk.africa’s [21] user interface and where SA wind farms are visible.
Through that website, a user can select a map and display results using filters. The filters include options such as energy type, operational status, and location. Once a farm is selected, the farm’s nameplate rating and operational date are supplied. In addition, a satellite image shows where that farm is located.
Wind speed data are required to calculate the power output of each wind farm. The Climate System Analysis Group (CSAG) of the University of Cape Town (UCT) provides a time series of wind speeds, generated by a mesoscale simulation data set [23], which was created for the Wind Atlas of South Africa (WASA). The interface to the dataset is in the form of a map, as shown in Figure 5. A user can select a location through a search bar, where text or coordinates can be inserted, or select the location manually. The interface then selects the nearest data point to the desired location and provides the data in a CSV format.
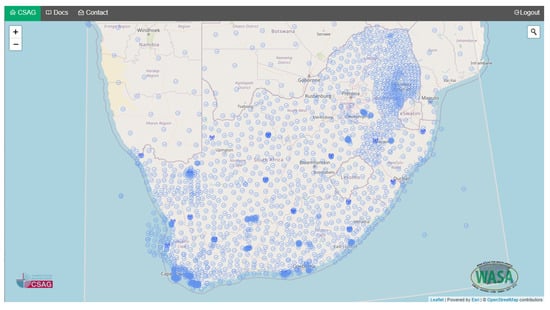
Figure 5.
Time series database interface [23].
CSAG’s data set provides annual, seasonal and diurnal variations of wind speed and direction in South Africa. These time series data are over a 30-year period from 1990 to 2019 at a 30 min temporal resolution and a 3 km spatial resolution. The data set contains the wind speed and direction at 20 m, 60 m, 100 m, 120 m, and 160 m, as well as the temperature at 2 m.
Eskom is responsible for the generation, transmission, and distribution of electricity. To keep the public informed, Eskom has an online data portal providing regular information on the status of electricity in the country. The data portal houses information on generation by electricity type, such as wind and solar. Data are also available on the demand requirements for the country. Eskom produces the observed hourly average demand, expressed in MW, from 2018 to 2022.
South Africa’s bathymetry and offshore wind speed data were obtained from the Global Wind Atlas. The bathymetry showed ocean depths around South Africa’s coast over all ranges. The wind speeds were obtained at elevations of 100 m and 150 m. These were in Tag Image File (TIF) formats.
3. Methodology
The methodology of this research took the form of five major steps. The farm specifications and Eskom data described in Section 2 were initially acquired. After this, a centroid for each wind farm’s location was found. This formed the basis for further processing, namely, the wind data processing and energy supply and demand calculations. South Africa’s offshore wind was then explored. These steps are visualised in the flow diagram of Figure 6.
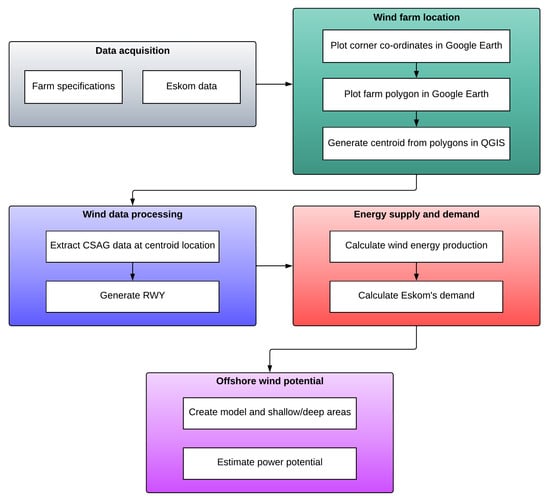
Figure 6.
Flow diagram of this research.
The wind speed data were extracted by providing a location. Utility scale wind farms cover a large area and thus can experience a variation in wind speeds from one location to another. A simplification was adopted where the central coordinate of the wind farm was used to represent the full area.
South African wind farms do not publish the exact location of their turbines or the boundaries of the farm itself. During the development of these farms, public engagement takes place, and such information is available. However, this research required data from some farms that have been operational for more than five years, and access to all of their documentation is limited. This problem was solved by finding each wind farm in Google Earth and mapping its corner coordinates manually.
As displayed in Figure 7, a polygon was created to clearly define the boundary of each farm. This information was imported into Quantum Geographic Information System (QGIS) where the central coordinate was calculated. The calculated centroid was used as an input to CSAG’s extraction, whose data were used to calculate a reference wind year (RWY).
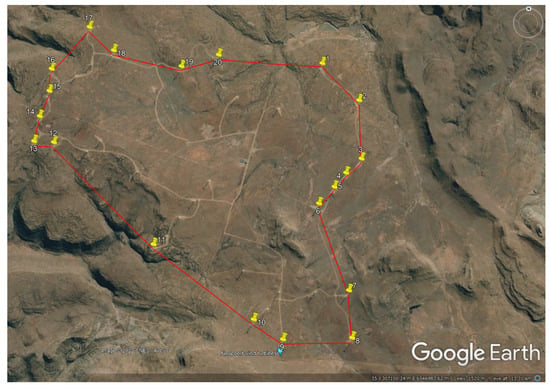
Figure 7.
Noupoort Wind Farm’s corner coordinates mapped in Google Earth.
A typical meteorological year (TMY) is an approach used in building thermal performance to represent multiyear measured meteorological data. This method is common for solar data. A TMY has natural diurnal and seasonal variations and represents the typical climatic conditions for a specific location [24]. Similarly, a RWY method has been proposed [25], which was used in this research. This method makes use of the Finkelstein and Schafer statistic, FS in Equation (1), in the same fashion as done for a TMY. The major difference is the number of parameters considered.
In Equation (1), is the absolute difference between the long-term cumulative distribution function (CDF) and the yearly CDF for i, a day in the related month. The number of records for that month is given by n. For any parameter used, the CDF is given by Equation (2):
Using FS, individual months can be compared with long-term averages. Since there are multiple parameters that determine the climate, weighting factors are introduced. The weighting factors are specific to each parameter and differ from those used in a TMY calculation. For wind energy studies, wind speed, wind direction, temperature, and pressure are the major concerns. Details on the weighting factors applied can be found in [25].
Different wind farms may use the same type of turbine, but they may be placed on differently sized towers. Wind speed data are only provided at specific heights that may not match the hub height of a turbine. When using Equation (4) to calculate the power production, it is important to use the wind speed data at the hub height of the turbine of interest. Wind speed increases with an increase in height above the ground and using the incorrect height would increase or decrease the estimated power produced [26]. This means that the wind speed input data must be adjusted. If the turbine height does not match the known wind speeds at 20 m, 60 m, 100 m, 120 m, and 160 m, from the input data, the adjusted wind speed was calculated using Equation (3) [27] as
where:
is the wind speed at the adjusted height (m/s);
h is the hub height (m);
l is a height less than the adjusted height (m) where ;
g is a height greater than the adjusted height (m) where ;
is the wind speed at height l (m/s);
is the wind speed at height g (m/s).
Once the correct wind speeds had been calculated, the power output could be calculated. This was achieved by acquiring power curve data for each of the 36 wind farms. After these data were acquired, they were interpolated to create a smooth curve, as illustrated in Figure 8. This information combined with the number of turbines at each farm provided a convenient platform for calculating the power produced from the entire wind farm given the wind speed.
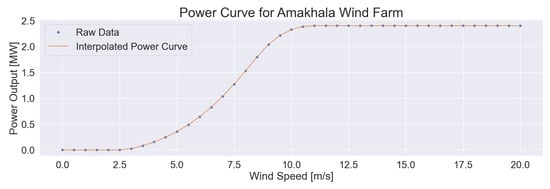
Figure 8.
Power curve for Amakhala Wind Farm with raw as well as interpolated data.
The power output per farm can be calculated [28] as
where:
f is the farm of concern;
is the power at wind farm f (MW);
is the adjusted wind speed at farm f (m/s);
is the interpolated power curve of farm f;
n is the number of turbines at farm f.
The energy produced by a wind turbine cannot be taken from the power curve and wind speed relationship directly. There are losses experienced during the energy conversion process. The losses can be mechanical, operational, or electrical in nature. Over years of monitoring, the wind industry has developed conservative estimates for these losses [29]. Table 1 shows the losses applied to this study.

Table 1.
Loss factors applied to power production values.
These values were applied in a randomised fashion to simulate the randomness of nature. This resulted in a nonuniform application of these values to the time series data. However, the overall losses experienced during a wind farm’s operation were equal to the value listed in Table 1. The random nature of these losses meant that on a day when the wind farm could have produced maximum power, it may have a mechanical loss factor of 30%, but on a day when the farm was producing less power it may have no mechanical losses applied. Figure 9 shows the effect of this randomisation where the derated curve was not simply lowered by a set factor but instead had smaller oscillations out of sync with the original curve.
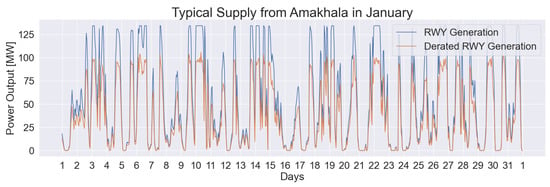
Figure 9.
Generation vs. derated generation of Amakhala Wind Farm.
To obtain the offshore wind power potential, the bathymetry first needed to be analysed. A TIF file of the bathymetry was imported into QGIS. Using the raster calculator, the bathymetry was broken down into different sections, each as their own layer, to indicate the different ocean depths of interest—in particular 0 to −60 m and −60 to −1000 m. These two regions represent the areas where fixed and floating turbine development can occur. A limit of −1000 m was decided upon for the power evaluations in this research. The surface area for each region was then calculated by adding the surface areas at each bathymetry value in that respective region, whose information was in the TIF file.
Similarly, the wind-speed TIF files for 100 and 150 m were imported into QGIS. Using the previously segmented bathymetry regions together with the wind speed rasters in the raster calculator, the wind speeds at 100 and 150 m could be obtained each for ocean depths of 0 to −60 m and −60 to −1000 m. This allowed for a closer inspection of each scenario and a further analysis.
To estimate the power potential, an array density was calculated. This is described in more detail in Section 5. The array density, together with the surface area, provided an estimation of the power potential. Losses were then applied to obtain somewhat more realistic values. These losses are shown in Table 2 [30,31].

Table 2.
Losses applied to the offshore wind power model.
Wake losses: When the wind comes into contact with the turbine and moves its blades, it creates a wake which results in slower moving air to downstream turbines. This can depend on the turbine spacing and turbulence. The result of the lower wind speed is a reduced power generation.
Electrical losses: When a turbine’s blades rotate, this mechanical energy is converted into electrical energy. During this conversion process, some losses are incurred, such as resistive cables and transformers.
Availability losses: wind turbines sometimes experience downtime due to several factors such as maintenance, weather conditions and failure.
Grid connection losses: the unavoidable resistance in electrical transmission cables over long distances when connecting to the grid results in some losses.
Turbine performance: over time, the turbine produces slightly less power, and the power curve is no longer as initially expected, resulting in less energy produced.
Curtailment loss: sometimes, the power of the wind turbines has to be intentionally reduced to compensate mismatches in supply and demand from the grid.
4. Onshore Results
The wind speed throughout the day can be described by a wind profile. To see an overview of the wind speeds at South African wind farms, the operational farms were divided up into four regions, as displayed in Table 3. By dividing the wind farms into regions, an overview of the wind profiles in each general area became apparent.

Table 3.
Wind farms associated with each region.
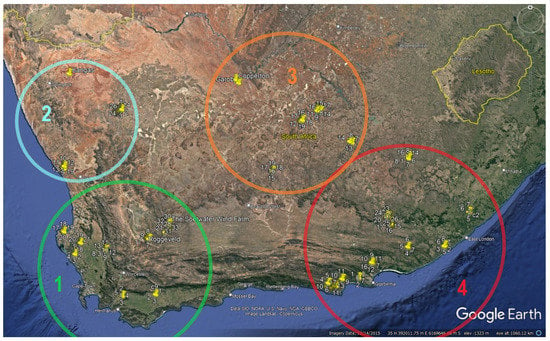
Figure 10.
South African wind-farm regions.
- Region 1:
- Western Cape Area;
- Region 2:
- Northern Cape (Western Area);
- Region 3:
- Northern Cape (Eastern Area);
- Region 4:
- Eastern Cape Area.
Data were obtained for wind speeds of every hour of a typical year using the RWY at each wind farm. To do this, the wind speeds were summed at a particular hour throughout the year and divided by the number of times the hour occurred, which was dependent on whether there was a leap year or not.
Figure 11 shows the hourly wind speed profiles for each region. It is clear that region 2 provided the largest variation in wind speeds with a minimum and maximum of 6.0 m/s and 9.5 m/s, respectively. Region 4 had the most consistent profile, while all regions showed a late morning dip with a peak in the evening. The variation in these wind speed profiles is important to the consistency of the overall supply. It is observed in Figure 11 that region 2 had a much more significant dip in wind speed in the morning hours compared to the other profiles, with its minimum speed occurring at 8:00. Region 4, which did not dip as much in the morning hours, compensated for region 2 in this vein. A similar situation occurred in the evening hours, where the peak of region 2 compensated for the lower supply of region 4.
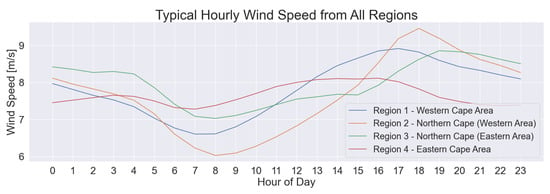
Figure 11.
Typical hourly wind speed in all four regions.
Combining all of the regions into a single profile, as shown in Figure 12, it was observed that the wind speeds took the form of a sine wave. At the start of the day, the wind speed was around 7.8 m/s and slowly decreased to just around 6.9 m/s at 07:00. Then, throughout the day, the wind speed increased to a typical maximum just above 8.4 m/s at 17:00 before reducing back to 7.9 m/s, closely matching the wind speed at the start of the day. Therefore, one could expect a minimum typical wind power production in the morning hours (05:00–10:00) and maximum typical wind power production in the evening hours (15:00–20:00). As expected, after examining Figure 11, the typical wind speed at its lowest (at 7:00 and 8:00) was higher than the lows seen in the individual wind speed profiles due to each region’s compensation for another and provided a more consistent wind speed supply profile.
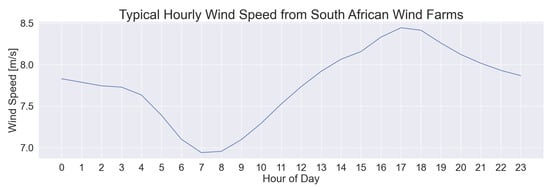
Figure 12.
Typical wind speeds from South African wind farms.
The average typical energy produced from each region is shown in Figure 13. It is observed that region 2 had the highest hourly energy produced, at 18:00. This was an expected result since that region also produced the highest wind speed. Regions 1 and 4 appeared to be underperforming compared to the Northern Cape regions, displaying the exceptional viability of wind farms in the Northern Cape.
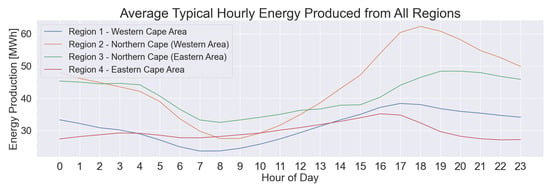
Figure 13.
Energy comparison across regions.
One can categorise these four profiles in Figure 13 into two sets: regions 2 and 3, and regions 1 and 4. The first set of regions 2 and 3 appeared to be supplying a similar amount of energy in the early morning hours. Then, in the later morning hours, region 3 compensated for region 2’s more aggressive dip. The opposite occurred in the evening hours, where region 2’s more aggressive peak compensated for region 2’s lower energy production. Furthermore, the second set of regions 1 and 4 compensated for each other at 4:00–12:00 and 17:00–23:00. Overall, each set compensated for each other’s energy supply. This variability resulted in a more consistent cumulative energy supply profile as an outcome of the geographical spacing of the wind farms and consequently wind resources. The aforementioned observations aligned with what was seen when inspecting the wind speed supply profiles.
Eskom supplies data on observed wind energy supply for South Africa. Eskom’s 2021–2022 data were used to compare against the wind energy model’s estimation of South Africa’s hourly energy supply. The results are illustrated in Figure 14.
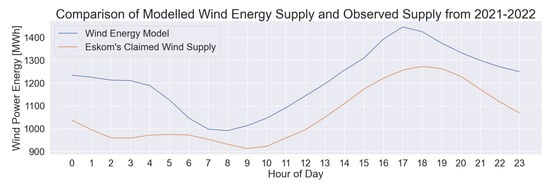
Figure 14.
Wind energy model validation.
The wind energy model closely matched Eskom’s claimed supply, with a Pearson correlation coefficient of 0.912. Although the two models showed significant similarities, it was observed that the wind energy model produced higher energy values compared to Eskom’s claimed supply and there was a noticeable difference in estimates in from 00:00 to 04:00.
The difference in overall supplied energy could be due to the model accounting for all 36 operational wind farms, whereas Eskom only adds data to its database when a farm starts its operations and receives data from these farms. The result was that the data acquired from Eskom did not account for the most recently commissioned wind farms. The early morning discrepancy was explained in a similar fashion. The newer wind farms were located in region 3 where the supply curve had a morning peak.
Garob Wind Farm became operational on 31 December 2021. It has a significant contribution to the grid with a capacity of 144.9 MW. This wind farm is one of the examples of its power not being accounted for in Eskom’s 2021 data. In Figure 15, Garob makes a clear contribution to the supply between midnight and 04:00, explaining the difference in Figure 14. Furthermore, the wind farms not accounted for in Eskom’s wind supply data reduced the cumulative supply reported versus reality. This explained the higher modelled supply across all hours of the day, with the shape of the two curves looking similar with the exception of the discrepancy in early morning hours, as explained before.
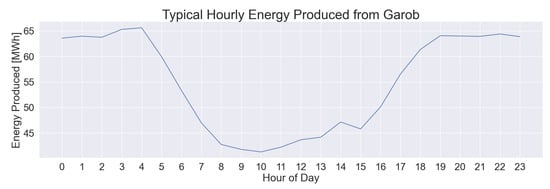
Figure 15.
Garob Wind Farm’s typical hourly production.
Eskom’s energy demand is plotted together with the typical hourly wind energy production in Figure 16. It is clear that wind supply offered a contribution to the peak demand from around 16:00. There was a large difference in the later morning hours when wind power production fell short of demand. As wind energy becomes a higher percentage of South Africa’s energy supply, this shortfall is something that needs to be examined. Other renewable energy sources, such as PV, where the maximum energy supplied is during the day, could compensate for this.

Figure 16.
Comparison of wind energy supply and electricity demand.
Although hourly power production offers great insight as to how power supply and demand look throughout the day, they do not tell the full story. Monthly energy production was therefore also calculated to determine the supply and demand throughout the year. Figure 17 displays Eskom’s monthly demand compared to the typical monthly wind energy supply.

Figure 17.
Monthly wind energy supply vs. Eskom demand.
It was observed that Eskom’s demand peaked at around 20,000 GWh in the winter months. The wind energy production also peaked during that time. This means that as wind energy becomes more predominant, it has the potential to assist the South African grid in winter, when a higher amount of energy is used.
To further inspect the seasonal wind energy supply, a heat map of the aggregate hourly wind energy production is illustrated in Figure 18. This shows which hour of the day per month is producing the most energy. It was observed that in the summer months, the maximum hourly energy was produced in the evening hours, indicated by very dark green blocks. The opposite was also visible, where yellow blocks indicated the minimum hourly energy produced occurred in the morning hours of the summer months.
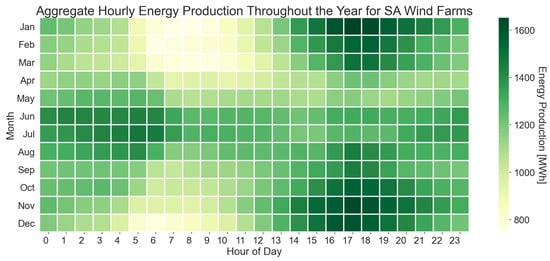
Figure 18.
Heat map of aggregate hourly energy production.
Although the winter months did not produce the peak hourly energy, they did produce the most consistent energy. This was explained by the relatively darker shades of green appearing throughout most of the day in, for example, June and July. This was an expected result since these consistent darker shades added up to more than what was produced in the extremes of the summer months, resulting in a higher overall energy production in the winter months, corresponding with Figure 17.
Capacity factors offer great insight in how a wind farm is performing compared to its maximum capability. The previously calculated power production values can be used to provide capacity factor estimates, as shown in Table 4. Only two farms achieved a capacity factor of above 40%, Roggeveld (40.03%) and Noupoort (41.85%). Other notable mentions are Mulilo De Aar 2 North (39.28%), Noblesfontein (39.39%), and Karusa (39.40%). The Darling wind farm had the lowest capacity factor of 19.19%. This is, however, South Africa’s oldest wind farm, becoming operational in 2008, with just four turbines and a capacity of 5.2 MW. Overall, South African wind farms have a reasonable performance with an average capacity factor of 33.43%, which is comparable to that of the U.S.A. with a capacity factor of 34.6% in 2021 [32] and significantly exceeds the global average of 25% [33].

Table 4.
Modelled capacity factors of all operational wind farms in South Africa.
5. Offshore Results
In an effort to study the wind profiles of South Africa in the offshore case, it is important to first create an understanding of South Africa’s waters. Illustrated in Figure 19 below is South Africa’s coastline, with bathymetry (ocean depth) values indicated. It is clear that South Africa has a large range of bathymetry. This is something that needs to be further examined when considering the types of offshore turbines to be used.
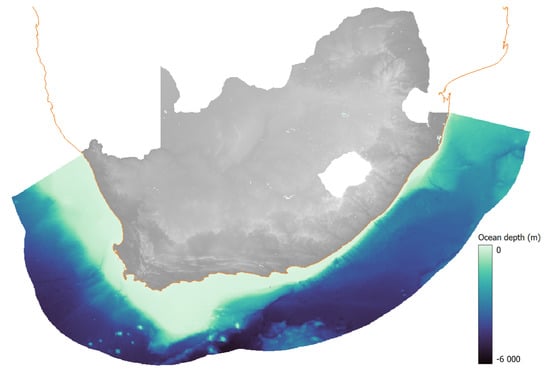
Figure 19.
Bathymetry for the South African coast.
As mentioned in the introduction, the two types of turbines, namely, fixed and floating, have different ocean depths at which they are typically used. For fixed turbines, this is between 0 and −60 m, and for floating turbines, this is between −60 and −1000 m. Using QGIS, these two regions of interest can be shown. The regions are displayed in Figure 20.
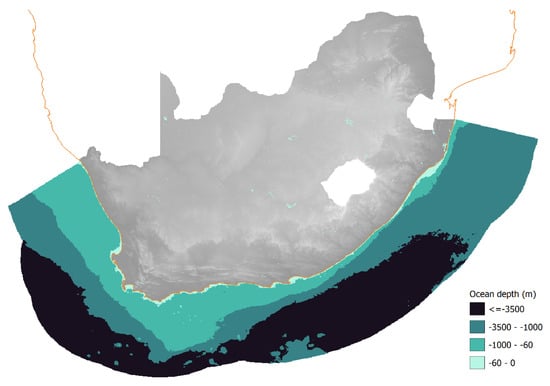
Figure 20.
Different bathymetry regions for the South African coast.
The regions of interest can provide an estimate of the fixed and floating capacity of South Africa’s offshore generation. For each region (0 to −60 m and −60 to −1000 m), the surface area was calculated in QGIS. This was performed using Equation (5).
where:
d is the surface area of the region of interest (km);
a is the lower bound of the region of interest, ;
b is the upper bound of the region of interest, ;
n is the depth;
is the number of pixels counted at depth n;
p is the surface area per pixel (m).
The surface area provides an important foundation for estimating the amount of offshore wind available in South Africa. The surface areas for the potential development of fixed and floating turbines are presented in Table 5. When considering the surface area for the ocean depths between 0 to −60 m and −60 to −1000 m, it is clear that South Africa has deep waters, and this can prove to be a challenge in developing fixed-bottom offshore wind farms.

Table 5.
Surface areas for fixed and floating turbines in South Africa.
The average wind speeds around South Africa’s coast can provide a good overview of regions that should be further researched for wind farm development. Pictured below are the wind speeds for shallow (0 to −60 m) and deep (−60 to −1000 m) waters at a 100 and 150 m elevation.
As illustrated in Figure 21 and Figure 22, the shallow waters of South Africa do not extend very far. This means that fixed-bottom farms do not have as much potential as one would hope. One area that stands out is along the east coast between two towns of Durban and Richards Bay. Commercial ports and other infrastructure also exist nearby, resulting in an appealing location. There appears to be a large area where shallow waters exist and high average wind speeds of over 9 m/s. This area is highlighted in Figure 23.
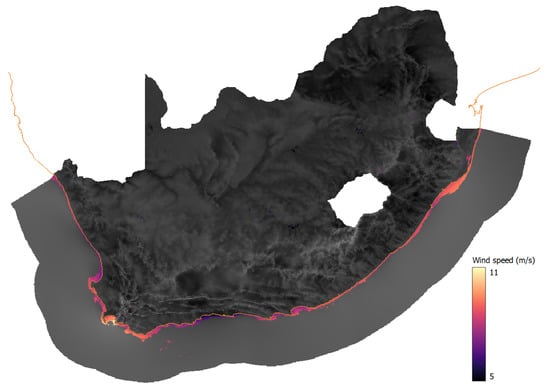
Figure 21.
Average wind speeds at a 100 m elevation for ocean depths of 0 to −60 m.
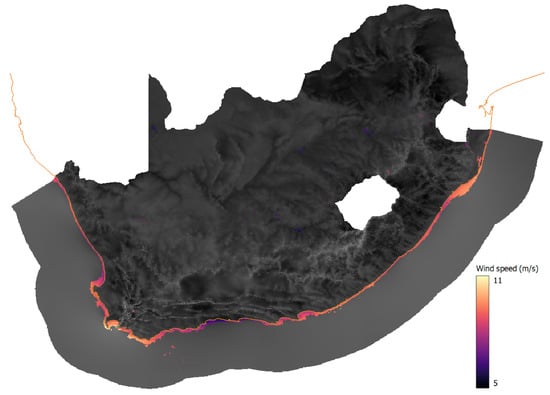
Figure 22.
Average wind speeds at a 150 m elevation for ocean depths of 0 to −60 m.
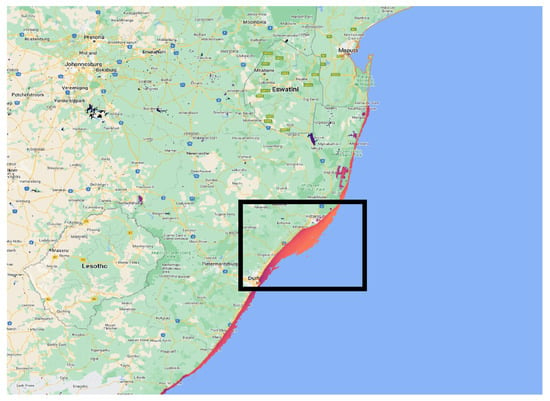
Figure 23.
Area between Durban and Richards Bay that shows a high potential for offshore development, indicated by the black box above.
Deeper waters from −60 to −1000 m in South Africa, shown in Figure 24 and Figure 25, appear to show higher wind speeds. South Africa has a large coast for the development of floating turbine wind farms. A few regions show great potential. The wind speeds at 150 m (Figure 22 and Figure 25) are higher than those at 100 m, as expected. As time goes on and offshore technology develops further, with greater hub heights and larger rotor diameters, South Africa’s coast will be able to take advantage of these excellent wind speeds at the higher elevation. A clear observation from Figure 22 is that the waters off of the east coast are very deep, even close to the shore. This creates a large barrier to entry of the offshore wind market in this region, despite very good average wind speeds.
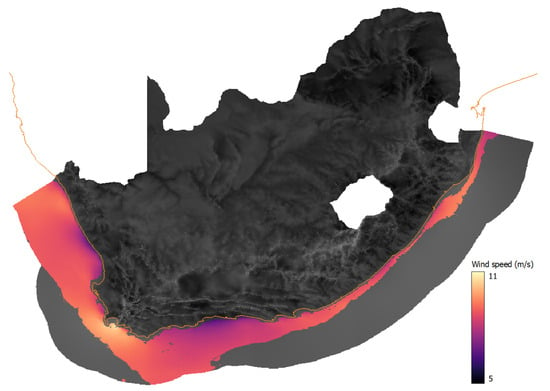
Figure 24.
Average wind speeds at 100 m elevation for ocean depths of −60 to −1000 m.
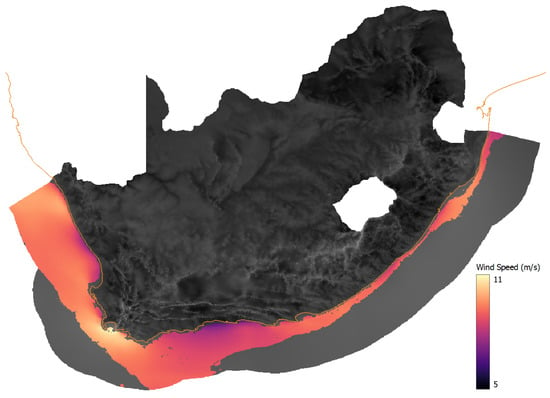
Figure 25.
Average wind speeds at 150 m elevation for ocean depths of −60 to −1000 m.
The regions that display excellent wind speeds are marked in Figure 26. The map of South Africa is overlaid with the wind speeds at a 100 m elevation. These regions are marked I–IV:
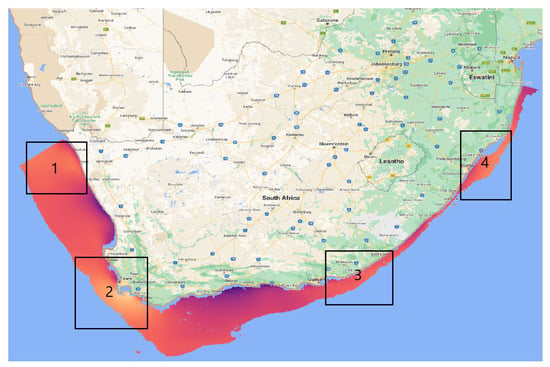
Figure 26.
Regions showing a great offshore wind potential.
- Region I:
- West coast (near Northern Cape);
- Region II:
- South west coast/The Cape (near Western Cape);
- Region III:
- East coast (near Eastern Cape);
- Region IV:
- North east coast (near KwaZulu-Natal).
These locations become ever so more attractive when considering that regions II, III, and IV are all close to commercial harbours, which reduces the logistical barrier to entry. As for performance, these regions have very good average wind speeds of ∼9 m/s. Region II shows even higher average wind speeds of closer to 10 m/s. The west coast offers opportunity to generate power for the nascent green hydrogen market, but access to the grid may be constrained. The south coast does have shallower waters but faces extensive biodiversity concerns. The east coast has heavy industries along the coast and excess grid capacity so farms in this region can alleviate the current energy deficit in the country.
An estimation for the estimated installed wind power capacity for shallow and deep waters was calculated. This was done by computing an array density in MW/km2, and multiplying this by the surface areas calculated in Table 5. The Vestas V164-9.5 MW was chosen as the turbine of choice due to it surpassing the V164-8.0 MW with its newer technology, generating more power and being more forward-looking with respect to current offshore wind turbines. The power curve for the Vestas V164-9.5 MW is shown in Figure 27.
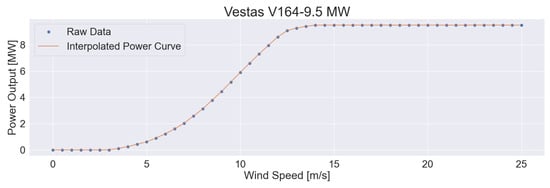
Figure 27.
Power curve of Vestas V164-9.5 MW.
The Vestas V164-9.5 MW has a rotor diameter of 164 m. The array density [34] for a 10-rotor-diameter wind farm, using Equation (6), was 3.53 MW/km2.
where:
is the array density, i.e., power per unit area (MW/km2);
n is the number of turbines in the array;
is rated power of the turbine (MW);
A is area of the array (km2).
Equation (6) assumes that the wind turbines are evenly spaced and do not interact with each other. However, it is known that losses in the system occur which reduce the overall power generation. These can be due to wake effects, electrical, or other losses. These losses are shown in Table 2, which can be combined to obtain an overall loss of in Equation (8).
The estimated power for shallow and deep waters can be calculated by using a combination of the array density, loss, and surface areas, as in Equation (9). The results are tabulated in Table 6.
where:

Table 6.
Power potential in fixed and floating regions in South Africa.
r is the region of interest, i.e., fixed or floating;
is the array density, i.e., power per unit area (MW/km2);
is the power for region r (MW);
L is the loss;
is surface area of region r (km2).
South Africa shows great signs of offshore wind potential even after losses are applied, as observed in Table 6. Since this power is expected to be produced from different regions, each region is expected to produce a different supply profile, which would be valuable information to assist the grid’s demands and to determine if the respective supply profiles will be fit for purpose. It is clear that there are different regions in South Africa with a significant difference in wind speeds, as observed in Figure 26, and this will need to be further evaluated. A future study should look at the offshore wind profiles of the South African coast, while also considering other factors that could influence the development of wind farms.
6. Conclusions
In conclusion, it is clear that wind energy supply aids South Africa’s electricity demand during the evening peaks as well as during the highly demanding winter months. This is a promising result for the wind industry and an added motivation for the commissioning of new wind farms. It should be noted that the wind energy supply cannot strongly assist with the daytime peak demand—all regions experience an energy production dip in the late morning. However, the geographical distribution of the wind farms allows each region to compensate for shortfalls in each other’s supply curve, leading to a more stable cumulative supply curve. Furthermore, the clear heat-map indication that wind energy supply is lower during the sunny late morning and midday of summer offers as a suggestion for PV to offset this dip in renewable energy supply.
It was also observed that regions 2 and 3 offered a lot of promise in terms of energy production. These Northern Cape regions were the best-performing regions and should be strongly considered for future wind projects. South Africa’s wind farms are not performing poorly, with a respectable average capacity factor comparable to other wind-incentivised countries and above the global average. The sustained wind speeds offshore and studies related to the offshore technical potential in South African waters could fill the gap seen in currently used onshore locations [34].
South Africa shows great signs of offshore potential, with 64 and 764 GW of power that can potentially be installed using fixed and floating turbines, respectively. Different regions were identified to be preferable locations to pursue offshore development and harness its increased capacity factor. These areas are bound to have variation in their supply profiles, which will need to be further investigated. South Africa’s waters face many challenges that need to be carefully considered, such as deep waters, biodiversity, and policy and shipping restrictions.
Author Contributions
Conceptualization, S.K. and G.E.; methodology, S.K. and G.E.; software, S.K.; validation, S.K. and G.E.; formal analysis, S.K. and G.E.; investigation, S.K. and G.E.; resources, S.K. and G.E.; data curation, S.K.; writing—original draft preparation, S.K.; writing—review and editing, S.K. and G.E.; visualization, S.K.; supervision, G.E.; project administration, S.K.; funding acquisition, S.K. and G.E. All authors have read and agreed to the published version of the manuscript.
Funding
This research was funded by the Council for Scientific and Industrial Research (CSIR).
Institutional Review Board Statement
Not applicable.
Informed Consent Statement
Not applicable.
Data Availability Statement
All datasets used in this research are publicly available.
Acknowledgments
The authors gratefully acknowledge the support of the Climate System Analysis Group (CSAG) of the University of Cape Town (UCT).
Conflicts of Interest
The authors declare no conflict of interest.
References
- iWYZE, O.M. Load Shedding: The What, When and Why-Old Mutual iWYZE. 2019. Available online: https://www.iwyze.co.za/post/load-shedding-stages-schedules (accessed on 11 October 2022).
- Department of Public Enterprises. Eskom. Available online: https://dpe.gov.za/state-owned-companies/eskom/#:~:text=Eskom%20generates%20approximately%2095%25%20of (accessed on 11 October 2022).
- Eskom. Coal Fired Power Stations. 2021. Available online: https://www.eskom.co.za/eskom-divisions/gx/coal-fired-power-stations/ (accessed on 11 October 2022).
- Eskom. Eskom Medupi’s Last Unit Achieves Commercial Operation, Marking Completion of the Project-Eskom. 2021. Available online: https://www.eskom.co.za/eskom-medupis-last-unit-achieves-commercial-operation-marking-completion-of-the-project/ (accessed on 11 October 2022).
- Tshidavhu, F.; Khatleli, N. An assessment of the causes of schedule and cost overruns in South African megaprojects: A case of the critical energy sector projects of Medupi and Kusile. Acta Structilia 2020, 27, 119–143. [Google Scholar] [CrossRef]
- Yelland, C. Falling Short: Medupi and Kusile an Eskom Plan Designed to Fail. 2021. Available online: https://www.biznews.com/thought-leaders/2021/03/17/eskom-medupi-kusile-yelland (accessed on 11 October 2022).
- Kåberger, T. Progress of renewable electricity replacing fossil fuels. Glob. Energy Interconnect. 2018, 1, 48–52. [Google Scholar] [CrossRef]
- Peters, H.D. Statement by the Minister of Energy, Hon. Dipuo Peters, MP, on the Occasion of the Announcement of Preferred Bidders in Respect of the First Window of 3 725 MW under the Renewable Energy IPP Bidding Programme. 2011. Available online: http://www.energy.gov.za/files/media/pr/2011/MinisterRemarksIPPBidsAnnouncement7Dec2011.pdf (accessed on 11 October 2022).
- Department of Mineral Resources and Energy. Independent Power Producers Procurement Programme (IPPPP) An Overview. 2021. Available online: https://www.ipp-projects.co.za/Publications/GetPublicationFile?fileid=2d03d621-6dc4-ec11-956e-2c59e59ac9cd&fileName=20220318_IPP%20Office%20Q3%20Overview%202021-22%20WEB%20VERSION.PDF (accessed on 11 October 2022).
- Thornton, H.E.; Scaife, A.A.; Hoskins, B.J.; Brayshaw, D.J. The relationship between wind power, electricity demand and winter weather patterns in Great Britain. Environ. Res. Lett. 2017, 12, 064017. [Google Scholar] [CrossRef]
- Sijm, J.; Koutstaal, P.; Ozdemir, O.; van Hout, M. Energy Transition Implications for Demand and Supply of Power System Flexibility: A Case Study of the Netherlands Within an EU Electricity Market and Trading Context. Eur. Dimens. Ger. Energy Transit. 2019, 363–394. [Google Scholar] [CrossRef]
- Kockel, C.; Nolting, L.; Priesmann, J.; Praktiknjo, A. Does renewable electricity supply match with energy demand?—A spatio-temporal analysis for the German case. Appl. Energy 2022, 308, 118226. [Google Scholar] [CrossRef]
- Eskom. Transmission Generation Connection Capacity Assessment of the 2024 Transmission Network (GCCA–2024). 2022. Available online: https://www.eskom.co.za/wp-content/uploads/2022/04/Generation-Connection-Capacity-Assessment-GCCA-2024-rev15-Final.pdf (accessed on 11 October 2022).
- Eskom. Just Energy Transition (JET) Fact Sheet #001. 2021. Available online: https://www.eskom.co.za/wp-content/uploads/2021/10/JETFactsheet13Oct2021.pdf (accessed on 24 October 2022).
- Drew, D.R.; Cannon, D.J.; Brayshaw, D.J.; Barlow, J.F.; Coker, P.J. The Impact of Future Offshore Wind Farms on Wind Power Generation in Great Britain. Resources 2015, 4, 155–171. [Google Scholar] [CrossRef]
- Feng, Y.; Tavner, P.; Long, H. Early experiences with UK Round 1 offshore wind farms. Proc. Inst. Civ. Eng. Energy 2010, 163, 167–181, Invited paper. [Google Scholar] [CrossRef]
- Song, H.; Robertson, A.; Jonkman, J.; Sewell, D. Incorporation of Multi-Member Substructure Capabilities in FAST for Analysis of Offshore Wind Turbines; Offshore Technology Conference: Houston, TX, USA, 2012. [Google Scholar] [CrossRef]
- Park, S.; Lackner, M.A.; Pourazarm, P.; Rodríguez Tsouroukdissian, A.; Cross-Whiter, J. An investigation on the impacts of passive and semiactive structural control on a fixed bottom and a floating offshore wind turbine. Wind Energy 2019, 22, 1451–1471. [Google Scholar] [CrossRef]
- Wu, X.; Hu, Y.; Li, Y.; Yang, J.; Duan, L.; Wang, T.; Adcock, T.; Jiang, Z.; Gao, Z.; Lin, Z.; et al. Foundations of offshore wind turbines: A review. Renew. Sustain. Energy Rev. 2019, 104, 379–393. [Google Scholar] [CrossRef]
- Hartman, L. Wind Turbines: The Bigger, the Better. 2022. Available online: https://www.energy.gov/eere/articles/wind-turbines-bigger-better (accessed on 24 March 2023).
- energydesk.africa. Onshore Wind. 2022. Available online: https://energydesk.africa/database/?technology=ONSHOREWIND (accessed on 11 October 2022).
- thewindpower.net. South Africa Wind Farms Database. Available online: https://www.thewindpower.net/storecountryen.php?idzone=58 (accessed on 11 October 2022).
- CSAG. Wind Atlas for South Africa Time Series Data. 2022. Available online: https://www.csag.uct.ac.za/wind-atlas-for-south-africa-time-series-data/ (accessed on 11 October 2022).
- Pusat, S.; Ekmekçi, I.; Akkoyunlu, M.T. Generation of typical meteorological year for different climates of Turkey. Renew. Energy 2015, 75, 144–151. [Google Scholar] [CrossRef]
- Pusat, S.; Karagöz, Y. A new reference wind year approach to estimate long term wind characteristics. Adv. Mech. Eng. 2021, 13, 168781402110212. [Google Scholar] [CrossRef]
- Wizelius, T. Developing Wind Power Projects Theory and Practice; Routledge: London, UK, 2006. [Google Scholar]
- Hadi, D.F.A. Diagnosis of the Best Method for Wind Speed Extrapolation. Int. J. Adv. Res. Electr. Electron. Instrum. Eng. 2015, 4, 8176–8183. [Google Scholar]
- Kasper, D. Wind Energy and Power Calculations. Available online: https://www.e-education.psu.edu/emsc297/node/649 (accessed on 11 October 2022).
- Olauson, J.; Edström, P.; Rydén, J. Wind turbine performance decline in Sweden. Wind Energy 2017, 20, 2049–2053. [Google Scholar] [CrossRef]
- Sørensen, T.; Nielsen, P.; Thøgersen, M. Recalibrating Wind Turbine Wake Model Parameters-Validating the Wake Model Performance for Large Offshore Wind Farms. 2006. Available online: https://citeseerx.ist.psu.edu/document?repid=rep1&type=pdf&doi=956b36b4ff68a8b401834829c6a61619d7abd396 (accessed on 24 March 2023).
- Lee, J.C.Y.; Fields, M.J. An overview of wind-energy-production prediction bias, losses, and uncertainties. Wind. Energy Sci. 2021, 6, 311–365. [Google Scholar] [CrossRef]
- Mueller, M. What Is Generation Capacity? 2020. Available online: https://www.energy.gov/ne/articles/what-generation-capacity (accessed on 11 October 2022).
- Lucena, J.D.A.Y.; Lucena, K.A.A. Wind energy in Brazil: An overview and perspectives under the triple bottom line. Clean Energy 2019, 3, 69–84. [Google Scholar] [CrossRef]
- Rae, G.; Erfort, G. Offshore wind energy–South Africa’s untapped resource. J. Energy South. Afr. 2020, 31, 26–42. [Google Scholar] [CrossRef]
Disclaimer/Publisher’s Note: The statements, opinions and data contained in all publications are solely those of the individual author(s) and contributor(s) and not of MDPI and/or the editor(s). MDPI and/or the editor(s) disclaim responsibility for any injury to people or property resulting from any ideas, methods, instructions or products referred to in the content. |
© 2023 by the authors. Licensee MDPI, Basel, Switzerland. This article is an open access article distributed under the terms and conditions of the Creative Commons Attribution (CC BY) license (https://creativecommons.org/licenses/by/4.0/).