Article

Statistical Optimization of Chemo Sonic Liquefaction in Macroalgae for Biohydrogen Generation—An Energy-Effective Approach

by
Shabarish Shankaran
1,
Tamilarasan Karuppiah
1,
Rajesh Banu Jeyakumar
2 and
Godvin Sharmila Vincent
3,*
1
Department of Civil Engineering, Vel Tech Rangarajan Dr. Sagunthala R&D Institute of Science and Technology, Avadi, Chennai 600062, Tamil Nadu, India
2
Department of Biotechnology, Central University of Tamil Nadu, Thiruvarur 610005, Neelakudi, India
3
Department of Civil Engineering, Mar Ephraem College of Engineering and Technology, Marthandam 629171, Tamil Nadu, India
*
Author to whom correspondence should be addressed.
Energies 2023, 16(7), 3017; https://doi.org/10.3390/en16073017
Submission received: 21 January 2023 / Revised: 22 March 2023 / Accepted: 24 March 2023 / Published: 25 March 2023
(This article belongs to the Special Issue Biomass and Bio-Energy)

Abstract

:
In this study, a combined pretreatment method of sonication and alkali (KOH) liquefaction (SAL) was used to increase the production of biohydrogen from macroalgae (Chaetomorpha antennina) in an energy-efficient manner. Sonication liquefaction (SL) was accomplished by varying the sonic intensities from 10% to 70% and the pretreatment time from 5 to 60 min. The ideal liquefaction conditions in SL were determined to be 50% for sonic intensity, and 30 min of pretreatment time which produces liquefied organics (LO) release of 2650 mg/L. By adjusting the pH of the alkali (KOH) from 8 to 12, SAL was carried out under SL optimal conditions. With a liquefaction efficiency of 24.61% and LO release of 3200 mg/L, pH 11 was the best for effective macroalgal liquefaction in SAL. SAL (4500 kJ/kg TS) consumed less ultrasonic specific energy (USE) than SL (9000 kJ/kg TS). More VFA was produced in SAL (2160 mg/L) than SL (1070 mg/L). Compared to SL (120 mL H2/g COD/0.005 moles of H2/g COD), SAL produced the most biohydrogen of 141 mL H2/g COD/0.006 moles of H2/g COD. The combined pretreatment (SAL) increases the LO release, which ultimately results in an additional 15% increment in biohydrogen production compared to the SL, along with 44.4% of energy savings. Overall, SAL was determined to be energy efficient in biohydrogen production.

1. Introduction

One of the most serious issues in the present-day scenario is global warming and environmental catastrophe, which makes the world insecure. The need for fossil fuels is steadily expanding. The available reserves of fossil fuels are dwindling fast, and all indications suggest they will soon be depleted [1]. Fossil fuels are extensively employed around the globe, but they are unsustainable because of the intensified carbon emissions of greenhouse gases, making the ecosystem destructive [2]. According to new International Energy Agency (IEA) estimates, global incentives for the consumption of fossil fuels surged in 2022, surpassing USD 1 trillion for the first time as turbulence in the energy markets drove fuel prices in international markets considerably higher than the many consumers actually paid. The IEA has evaluated instances in which consumers have paid significantly less than the market price of the fuel itself for many years. Based on the most recent preliminary forecasts for 2022, oil subsidies will have risen to about 85%, since natural gas and electricity consumption subsidies are expected to be more than doubled. In such instances, renewable energy sources such as biofuels must be considered more [3,4]. Hydrogen is recognized as the finest renewable energy source since it produces less carbon, with water vapour as a major byproduct. Hydrogen has elevated energy content per unit weight (142 KJ/g) compared with other fuel sources [5]. The energy density of hydrogen is 120 MJ/kg, making it more prominent in energy generation [6]. In addition, hydrogen is considered to be three times as abundant as helium in the globe [7,8]. The production of hydrogen via fossil fuel combustion results in the emission of greenhouse gases which ultimately results in natural imbalance [9]. To overcome this issue, bio-oriented hydrogen production by microbes through anaerobic fermentation would be an eco-friendly substitute for fossil fuel-based hydrogen production [10]. The microbes perform biological action over the biomass to produce biohydrogen in the anaerobic fermentation [11]. To bring out a scalable system, effective biohydrogen production and balanced system performance are essential [12]. The substrate or biomass for biofuel production should be economically viable, easily approachable, available abundantly, and convincing in pretreatment and bioenergy generation [13]. The production of biofuels uses various biomass resources, including wood, crops, agro-waste, municipal solid waste, and micro- and macroalgae [14].
Compared to other biomass, macroalgae or seaweed is considered the third-generation biomass most effective in producing biofuels [15,16], since macroalgae grow in aquatic environments such as marine areas and are much more productive than terrestrial floras which are therefore plentiful and accessible biomass [17]. A photo-synthetic organism called macroalgae is rich in biopolymer components, mainly carbohydrates. It is more adaptable and simpler to pretreat due to the absence of lignin in its cell wall. Because of its complicated structure and low hydrolysis efficiency, macroalgae require pretreatment to liberate more biopolymers and produce more biohydrogen [18]. Numerous pretreatment methods, including physical, chemical, mechanical, and biological ones, are described in the scientific literature. Each of these methods has advantages and disadvantages [19]. For instance, chemical pretreatment would be efficient, but the expense of the chemicals and the environmental risks are disadvantages. The efficiency of liquefaction increases with biological pretreatment, but cultivating microbes is challenging and time-consuming [20]. Sonication is a powerful mechanical pretreatment in which pressure waves and cavity bubbles caused by ultrasonic waves liquefy the cell walls of macroalgae [21]. As a result, it may exhibit higher liquefaction efficiency, and the liquefaction process proceeds more quickly than with other pretreatment methods. Since the liquefaction process requires more energy than other processes, the sonicator is an electronic device that depends on a power supply. This sonicator energy consumption issue can be solved by combining the sonication process with an alkali additive such as KOH.
When KOH is added to macroalgae during the sonication process, it separates into the cations K+ and the anions OH-. Anions OH- deposit over the macroalgae cell wall and cause it to soften, while cations K+ transform into bubbles and disintegrate the cell wall [22]. The simultaneous action of cations and anions weakens the macroalgae cell wall, which improves the efficiency of biomolecule liberation and liquefaction and lowers the energy requirement during the sonication process. Until now, liquefaction methods that combined disperser with acid, microwave with acid and acid-thermal were effective in biohydrogen production from macroalgae. Nevertheless, no studies have been published with research on the liquefaction of marine macroalgae (Chaetomorpha antennina), employing sonication and KOH in biohydrogen production. As a result, in this study, the marine macroalgae (Chaetomorpha antennina) was liquefied with a unique combinative method, KOH -availed sonication. The main goals of this study are to (1) optimize the liquefaction conditions for SAL to perform energy-efficiently; (2) conduct kinetic analysis for SL and analyze its effectiveness; (3) evaluate the positive effects of this combined SAL over macroalgae; (4) assess the impact of SAL on the production of biohydrogen; and (5) conduct an energy evaluation of SAL to determine its field practicability.

2. Materials and Methods

2.1. Sampling of Macroalgae

The macroalgae of the Chaetomorpha antennina species were gathered in Chennai, Tamil Nadu, India in the Ennore coastal region (13°12′23.4864″ N, 80°19′38.0100″ E). Water was the only cleaning agent used separate undesirable particles from macroalgae. The sample was divided into small pieces that measured 2 cm in length for effective cell wall liquefaction during sonication, and it was then dried in the shade. The biomass was then stored in a refrigerator for upcoming analysis.

2.2. Sonic Liquefaction (SL)

An ultrasonicator (Model VCX130, New Town, CT, USA) with a 20 kHz frequency was used for the macroalgae pretreatment. A total of 250 mL of water and 5 g of macroalgae biomass were added to a 1000 mL beaker for the sonication pretreatment. During the investigation study, a range of ultrasound intensities from 10% to 70% was used for 5 to 60 min. To assess the release of liquefied organics (LO) and potential for liquefaction, samples of the sonication process were taken at 5-minute intervals for each intensity.

2.3. Sonic Alkali Liquefaction (SAL)

Based on the optimum conditions obtained via SL, SAL was performed by differing the pH from 8 to 12 with KOH in order to obtain better liquefaction efficiency. SAL investigation was conducted with a sample water ratio of 1:50 in a 1000 mL beaker. The LO liberation and liquefaction capability analysis of this combined pretreatment was carried out regularly.

2.4. Anaerobic Fermentation Study

Evaluation of the volatile fatty acids (VFA) produced during an anaerobic fermentation process confirms profitable biohydrogen production and liquefaction potential in macroalgae [23]. Control (no pretreatment, CL), SL, and SAL pretreatments were carried in a three-dimensional perspective. For the three samples—control, SL, and SAL—anaerobic fermentation was carried out for three days. As an inoculum, digested sludge from an anaerobic treatment facility was used [24]. All three samples were kept in separate 250 mL serum bottles at a 9:1 ratio with the digested sludge. The acetogenic phase of anaerobic fermentation was reached, and the amount of VFAs produced was assessed. To achieve this, 50 mM of 2-Bromo ethane sulphonic acid (BESA), a suppressor of the methanogenic phase, was added to each of the three serum bottles. Nitrogen gas was injected into every bottle of serum to maintain an oxygen-free environment. A stopper was used to secure each serum bottle, which was then set inside an orbital shaker. Around 150 rpm and 35 °C were the speed and temperatures at which the orbital shaker was operated. For VFA analysis, a distillation method was used [25].

2.5. Experimental Analysis for Biohydrogen Production (EABP)

The mesophilic condition, in which EABP was performed for CL, SL, and SAL, was considered. As a study reactor, three 150 mL serum bottles were used. The serum bottles (CL, SL, and SAL) contained 5% nutrient, 25% anaerobic digested sludge, and 25% biomass. The inoculum was heated to about 100 °C for 30 min to eliminate the methanogenic microbes. This was performed to increase the production of biohydrogen [26]. Adjusting the probe kept a pH of 5.5 inside the serum bottles. All the serum bottles were filled with N2 gas and tightly sealed with rubber stoppers to ensure no oxygen was present. All sealed serum bottles were placed in a shaking incubator at a temperature and rotational speed of 130 rpm. A gas chromatograph with a thermal conductivity detector and a stainless steel column containing Porapak Q (3.25 mm diameter, 2 cm length, 80/100 mesh) was used to produce hydrogen. The study was conducted in the triplet approach method [27].
Equation (1) and a nonlinear curve fit (Gompertz fit) were used to estimate the total H2 production as shown below.
AH = PHP × exp (−exp(−r(IH − LH)),
where
AH—Accumulated hydrogen production (mL),
PHP—Potential of hydrogen production (mL H2/g COD),
r—Maximum hydrogen production rate (mL H2/g COD),
IH—Initial stage of hydrogen production (days),
LH—Lag stage of hydrogen production (days).

2.6. Analysis of Constituents

Based on standard procedures mentioned by American Public Health Association as prescribed by Kumar et al. [28], LO, total chemical oxygen demand (TCOD) and VFA have been evaluated. A centrifuge instrument was used to grind the macroalgae before analyzing these constituents and a spectrophotometer was used to determine the LO parameter values [29,30]. The LO was determined by calculating the total amount of biomolecules (proteins, carbohydrates) released from macroalgae. Protein analysis was conducted by the lowrys method [31] and carbohydrate analysis was conducted by the anthrone method [32]. TCOD analysis was conducted by the titrimetric method. VFA analysis was conducted by distillation method [28].

2.7. Estimation of USE

“USE” refers to the amount of specific energy the sonicator consumes to liquefy the substrate cell wall. The following Equation (2) indicates the USE consumed by the sonicator in this investigation to liquefy the macroalgae cell wall:
USE = PS × TS/VS × TS,
where
USE—Ultrasonic specific energy (kJ/kg TS),
P—The amount of power utilized by the sonicator to liquefy the macroalgae cell wall (kW),
F—Time taken for sonic liquefaction (second),
Vs—Sample volume (L),
TS—Total solids (kg).

2.8. Energy Evaluation

The amount of energy throughout the operation is one among the most critical facets of vast biofuel production. In addition to cost savings, even the least energy for input should yield the highest lucrative energy for output [33]. This study examined the amount of energy required to break down the macroalgae biomass of 1 kg to produce H2 gas. Beyond 50% sonic intensity, there was no energy loss in the form of heat in the working medium since the temperature was 45 °C. It is similar to the work of Ushani et al. [34], in which SL was performed for sludge where there was no heat loss effect though the sonic intensity was increased beyond 50% at a temperature not more than 50 °C. Equation (3) was used to calculate the total estimated energy that was obtained (3):
CE = OE − IE,
where
CE—Cumulative energy (kWh),
OE—Output energy (kWh),
IE—Input energy (kWh).
According to Equation (4), the input energy is the energy consumed by the sonicator to liquefy the macroalgae cell wall:
IE = PS × TL × CR × S,
where
IE—Input energy (kWh),
PS—The amount of power used in the sonication process (kW/kg),
TL—Time spent on liquefaction (hours),
CR—Capacity of reactor (m3),
S—Substrate (kg/m3).
According to Equation (5), the output energy was determined by a number of factors such as biological load on the reactor, the reactor capacity, and the production of hydrogen:
OE = BMB × L COD × HY × VR × BCF,
where
OE—Output energy (kWh),
BMB—Biocompatibility of macroalgae biomass (g COD/g COD),
L COD—COD load (g COD/m3),
HY—Hydrogen yield (m3/g COD),
CR—Capaciy of reactor (m3),
BCF—Biohydrogen conversion factor.
The profit or loss in the energy was illustrated by determining the upward and downward cumulative energy amounts in the SL and SAL processes.
The energy correlation is obtained in Equation (6):
Ec = OE/IE,
where
Ec—Energy correlation,
OE—Output energy (kWh),
IE—Input energy (kWh).

3. Results and Discussion

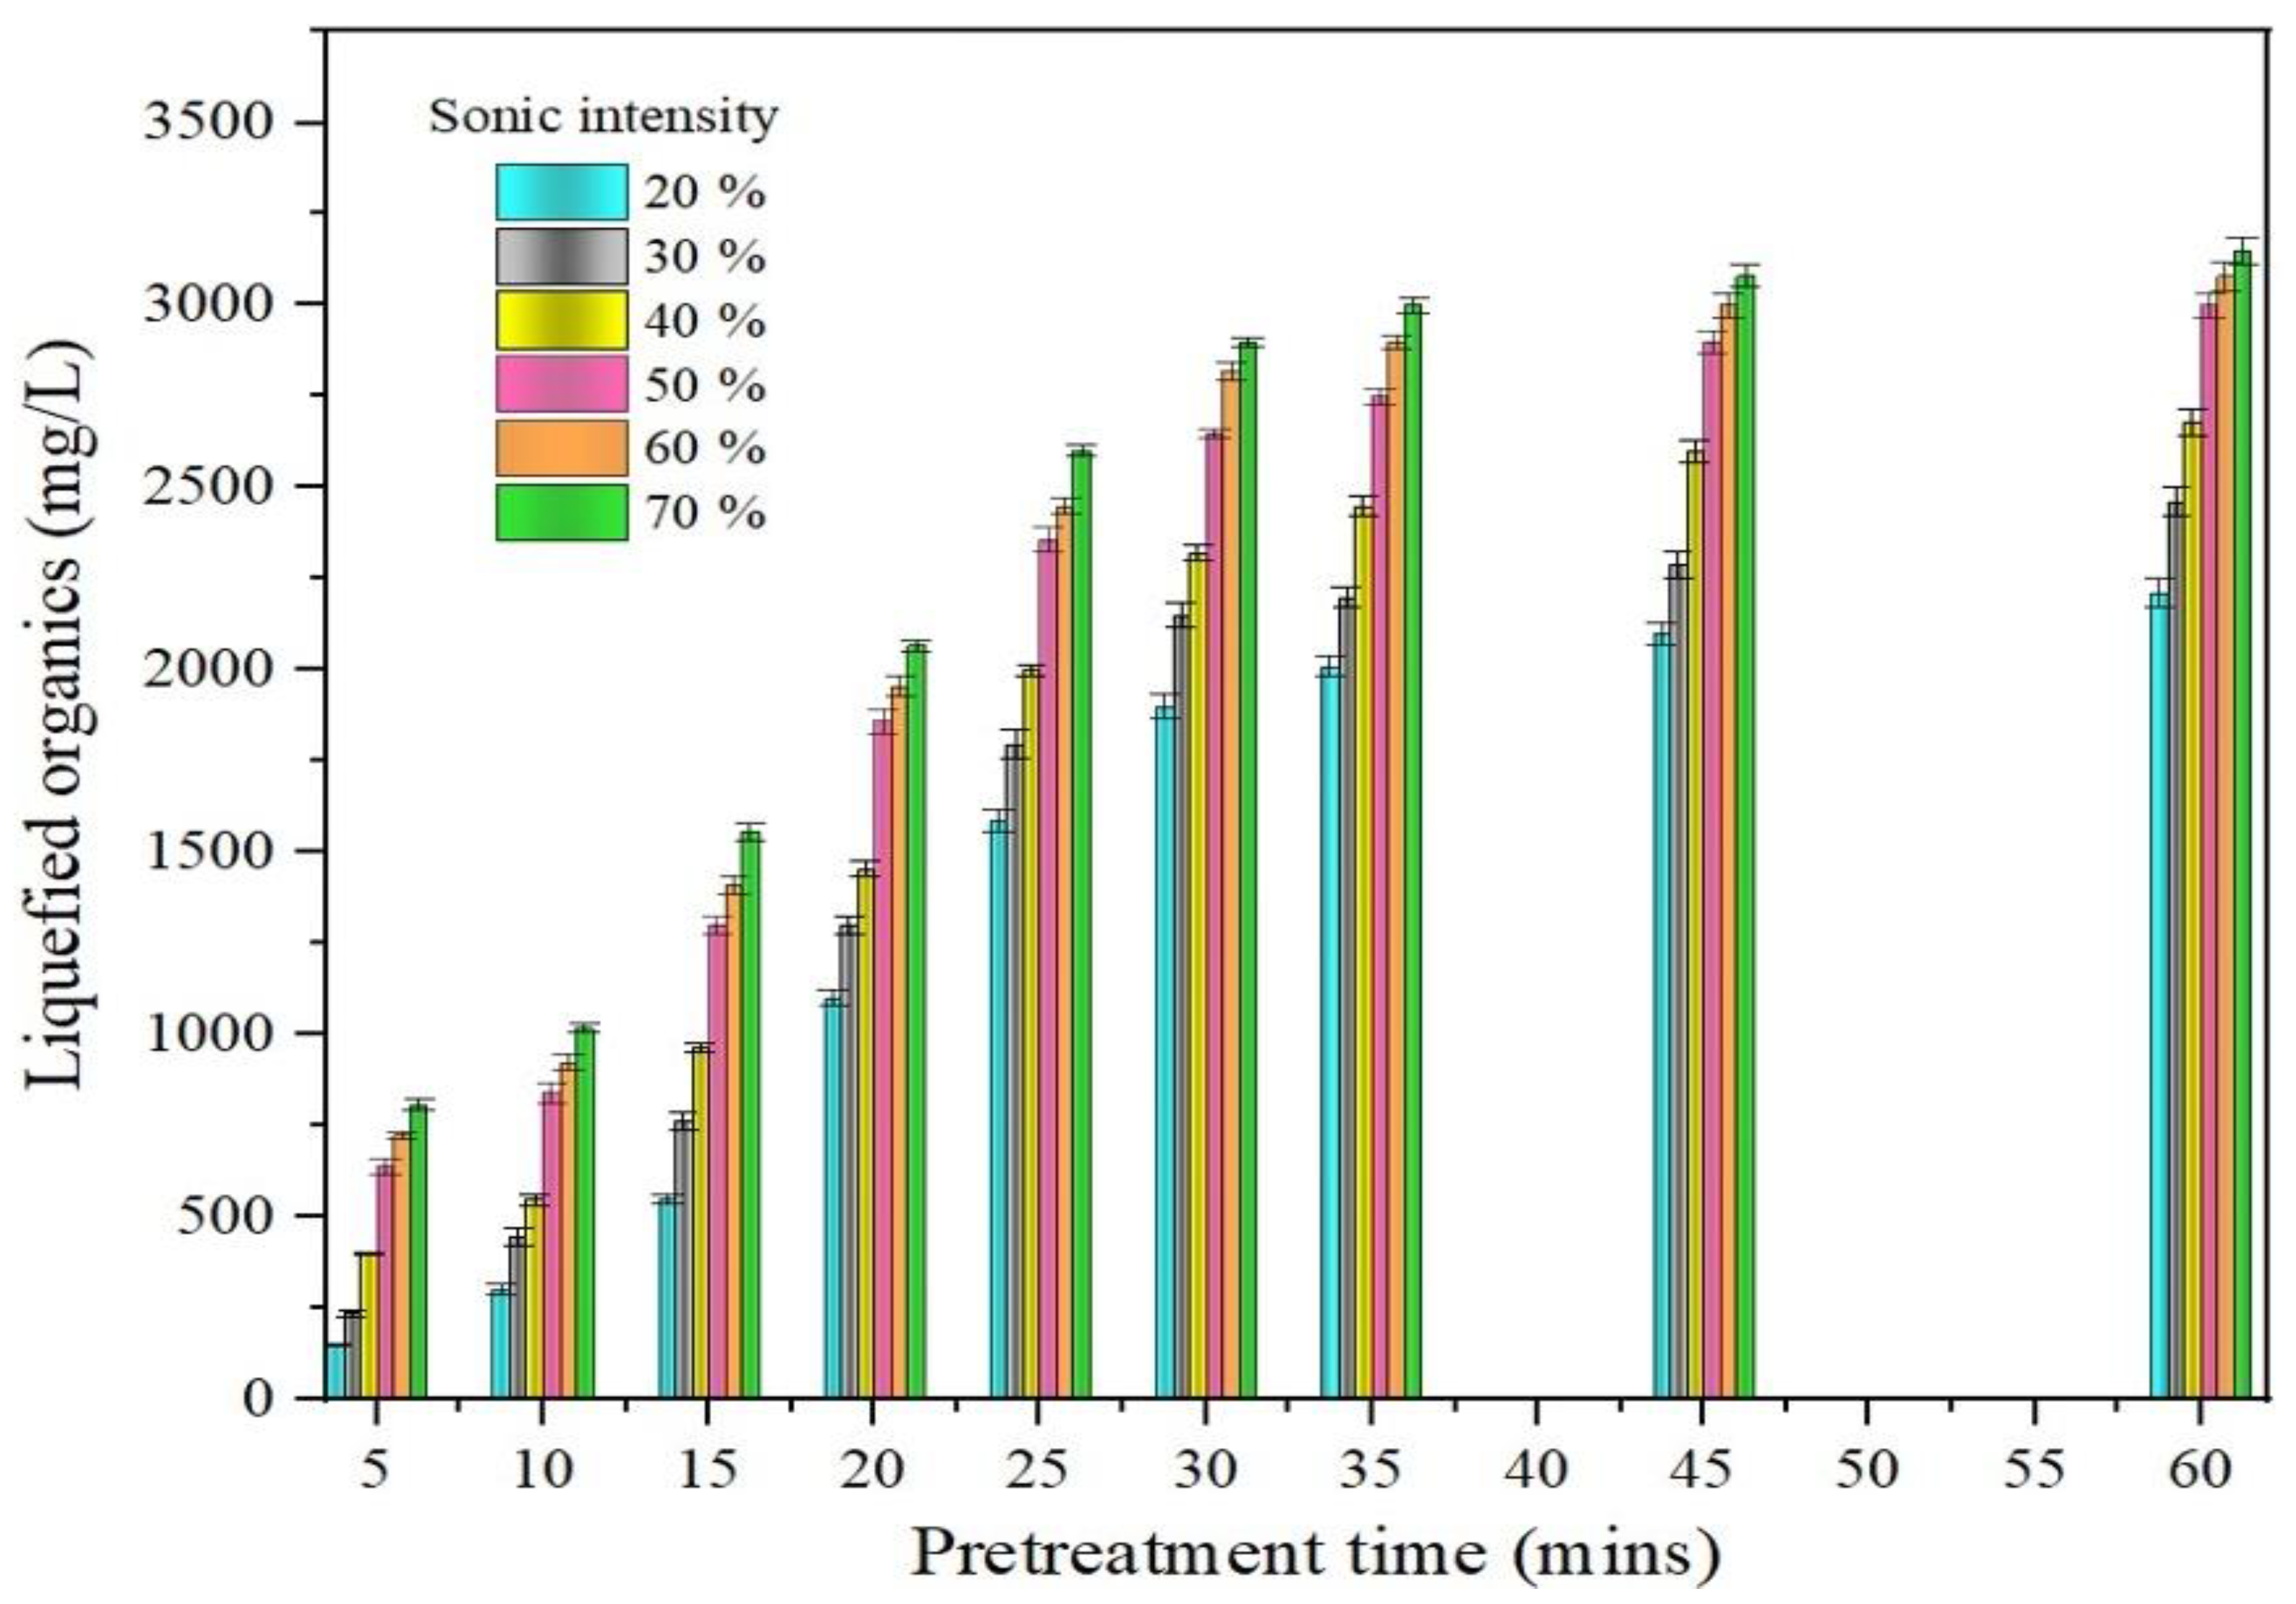
3.1. Influence of SL on Liquefied Organics Release from Macroalgae

The SL approach analyzed the liquefaction efficiency based on the liquefied organics (LO) released [34]. Figure 1 illustrates the LO release as a function of sonication intensity and time period. The sonication procedure was carried out using a sonicator for a timeframe of 5–60 min, with sonic intensities fluctuating from 10% to 70%. The sonic impulses created during the SL process cause the macroalgae to liquefy. The macroalgae subjected to liquefaction was held under the probe of the sonicator, where pressure waves and cavity bubbles predominate due to excessive ultrasonic waves.
The macroalgae become liquefied as a result of the cavity bubbles and pressure wave formation [35]. For analysis, the macroalgae sample that was liquefied throughout the SL process was taken on a regular basis for every intensity from 10% to 70%. Figure 1 shows that the discharge of LO was divided into two divisions: immediate division (5–30 min) and leisurely division (30–60 min). An identical LO generation process was observed in the work of Tamilarasan et al. [36]. Figure 1 represents that the release of LO tends to increase as the sonication pretreatment time rises.
Figure 1 clearly shows that the release of LO was significant until 30 min in faster phase, whereas the release of LO was minimum beyond 30 min in slower phase. According to the results obtained, a consistent trend in the slower phase was identified after 30 min. Based on this consistent trend in the slower phase, it is proved that the majority of the LO was discharged in the faster phase within 30 min. In the sonication process, the sonicator pretreatment time is highly valued [37]. The optimum pretreatment duration in SL is, therefore, 30 min. Additionally, the pretreatment’s sonic intensity is a key component in SL. With a LO range of 1900–2320 mg/L at the optimum pretreatment period of 30 min, less discharge in LO was seen when the intensity level was maintained between 10% and 40%. Liquefaction was partially complete at this point in intensity. It is comparable to the work of Shabarish et al. [38], in which a similar range of LO (1540–2217 mg/L) was detected between the same intensity levels at 30 min. When the intensity was increased to 50%, the macroalgae cell wall was destroyed and liquefied as a result of the combined effects of excessive ultrasonic power, pressure waves, and intensification of additional cavity bubbles. This caused a massive increase in LO release of about 2650 mg/L. There was only a minimum release after a 50% intensity increase, where a LO release range of 2819–2900 mg/L was observed. This is due to the fact that the majority of the LO was released at 50% sonic intensity. As a result, 50% was chosen as the optimum intensity for SL. After considering all of these factors, it was confirmed that a sonic intensity of 50% and a pretreatment time of 30 min were most effective for SL.

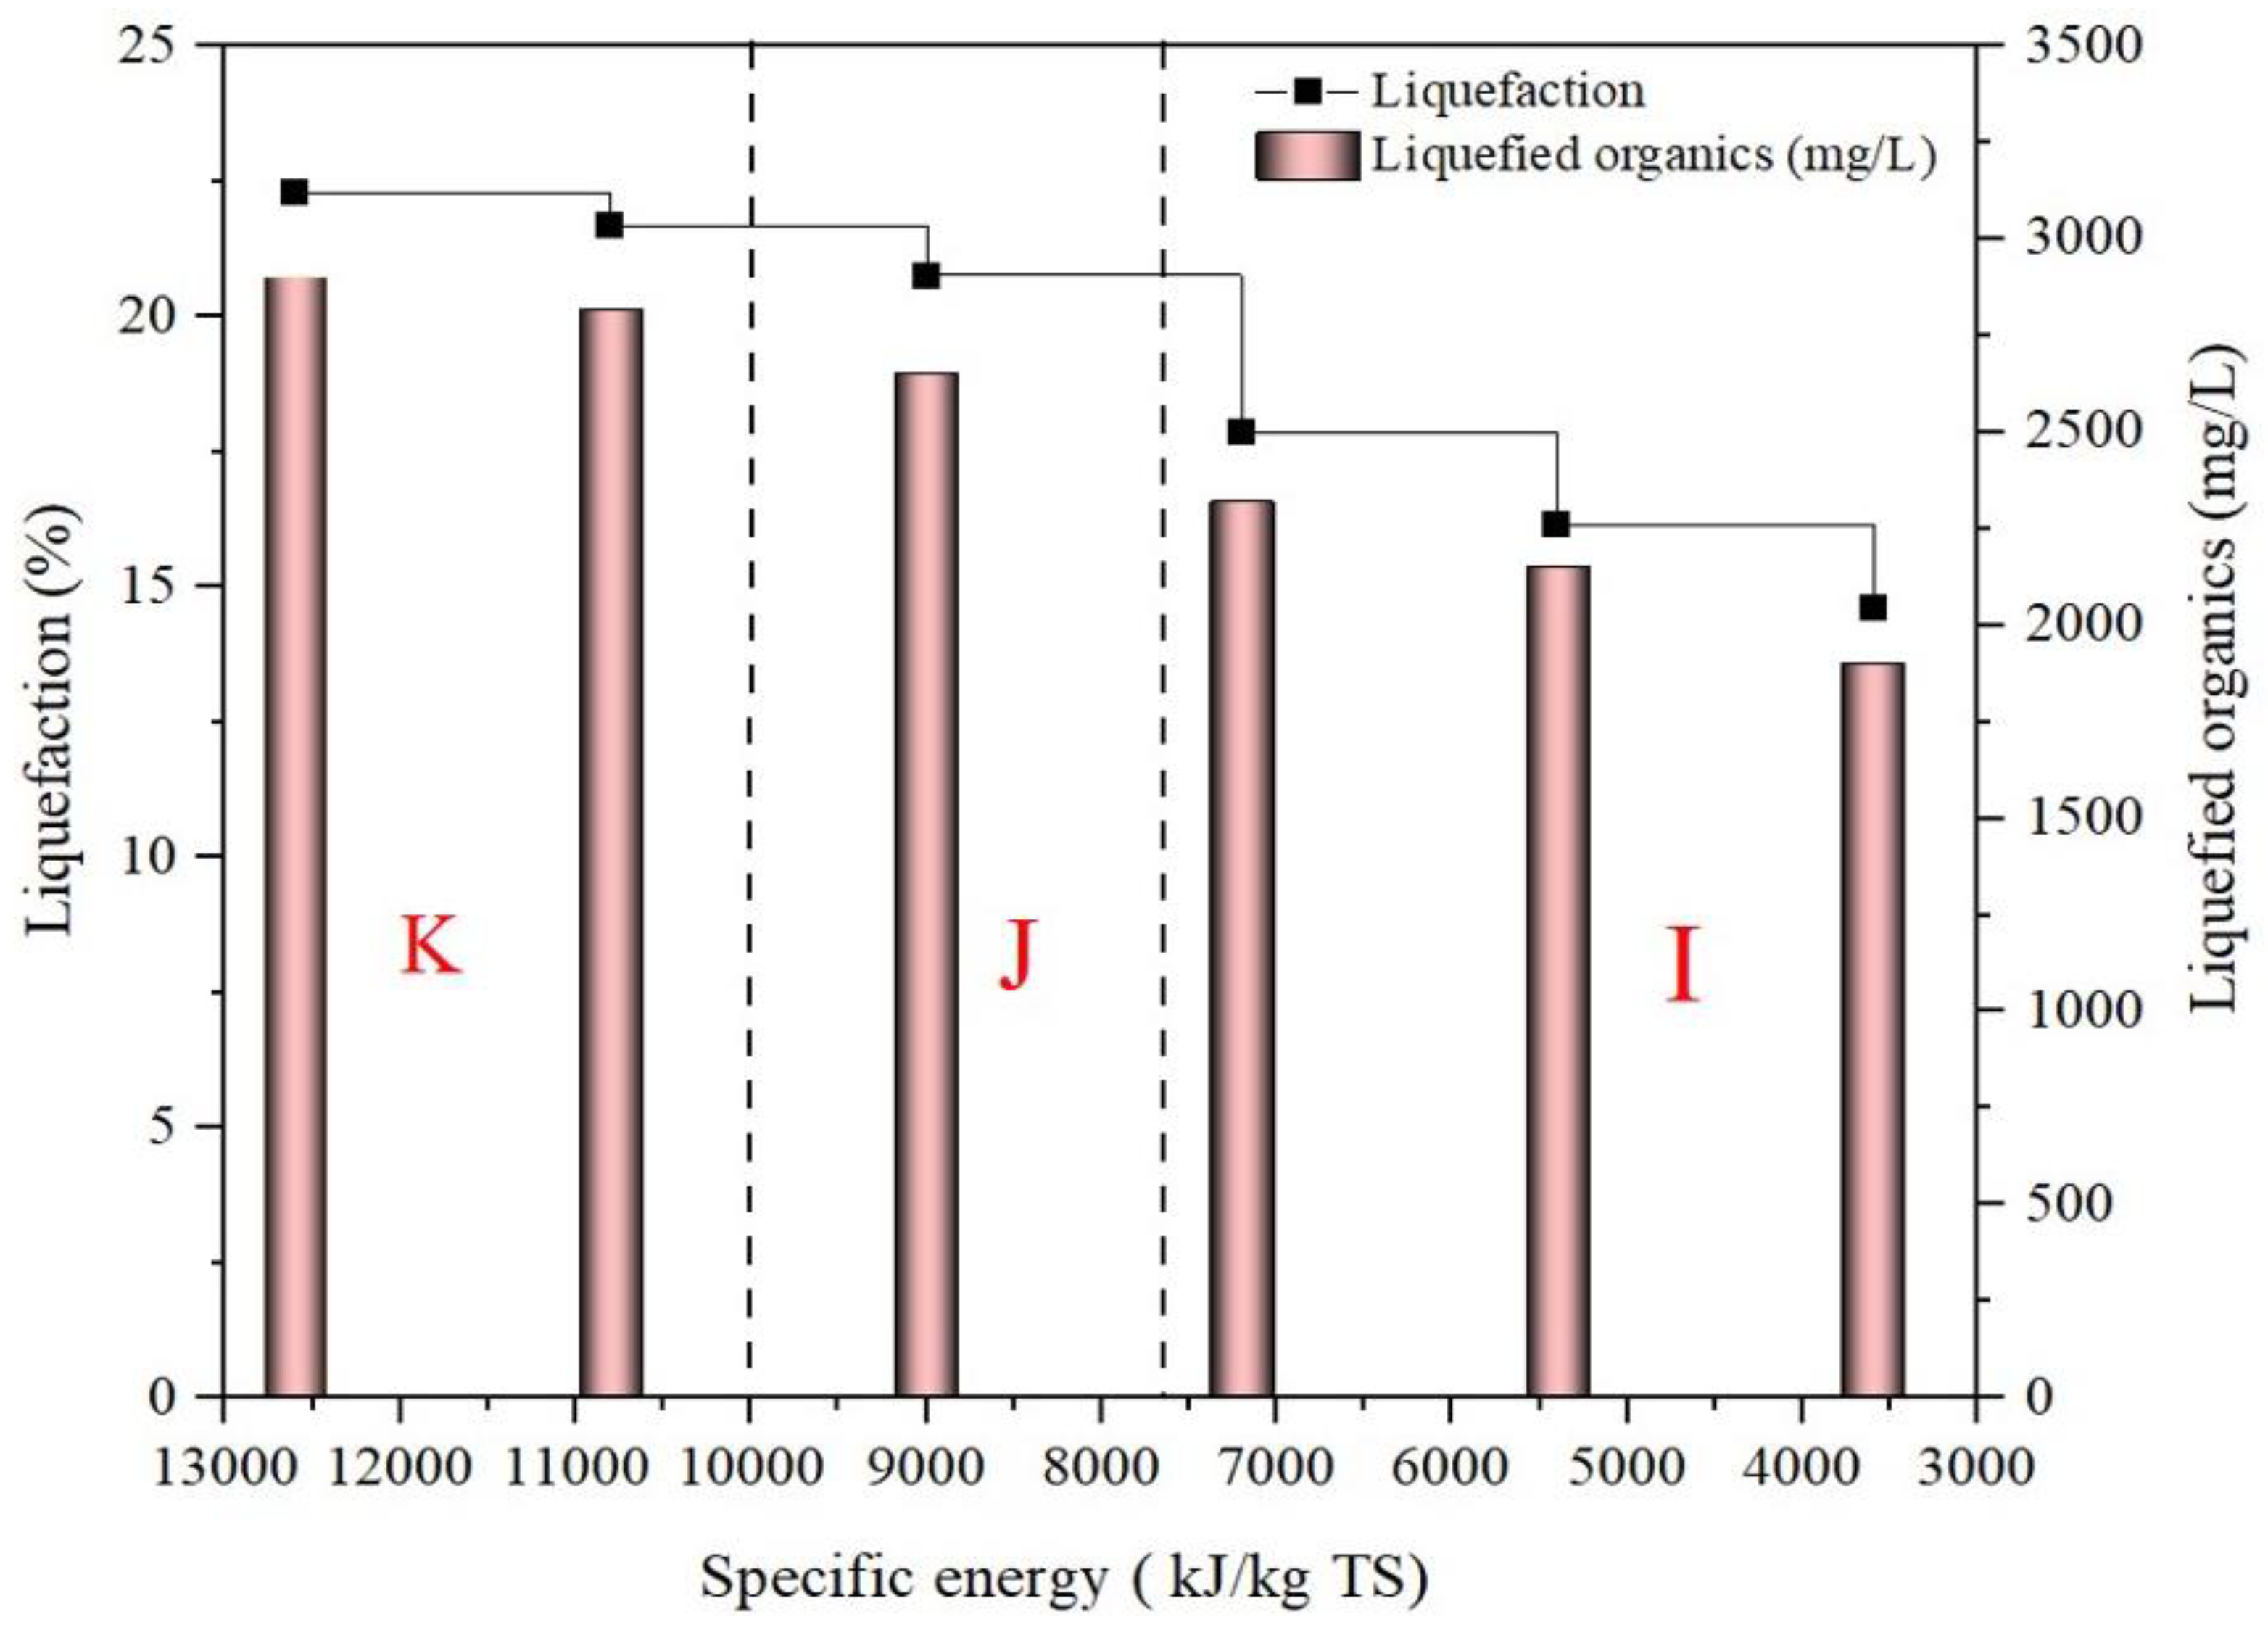
3.2. Impact in Liquefaction via USE

In massive biofuel production, the quantity of energy used to carry out the process has a significant economic impact. During biofuel production, USE receives special attention. Figure 2 shows SL outcomes regarding sonic intensity and USE. The liquefaction tendency increases as the USE input increases at all sonic intensities, as it was mentioned in Figure 2.
The liquefaction ability was divided into three parts: I, J and K. Delayed liquefaction is represented by part I, which relates to intensities ranging from 20% to 40%. Part I of the study showed liquefaction of 14.61–17.84% with a USE input of 3600–7200 kJ/kg TS. The percentage of liquefaction obtained was insignificant and can be abandoned for further inquiry. Part J is recognized by a faster percentage of liquefaction between 40% and 50%. Liquefaction increased in part J, peaking at 20.76% at 9000 kJ/kg TS USE input and 50% sonic intensity. Subsequently, part K ranges from 50% to 70%. There was not much liquefaction increase in part K despite of increasing the sonicator intensity and USE from 50% to 70% and from 9000 kJ/kg TS to 12,600 kJ/kg TS, respectively. For instance, 10,800 kJ/kg TS USE input was needed to improve the liquefaction from 20.76% to 21.78%. As conclusion, simply increasing the sonicator intensities during the SL process may be ineffective. Instead, it was discovered that a USE input of 9000 kJ/kg TS was favorable for SL.

3.3. Impact of SAL on LO and Biomolecules Expulsion

KOH has a great deal of potential for rupturing the adhesive linkage of the cell wall, which enhances cellulose decrystallization [39,40]. When KOH is added to a sample of macroalgae, it separates into cations (K+) and anions (OH). The cations are transformed into bubbles, which collide with and shatter the macroalgae cell wall, resulting in salts settling at the bottom of the beaker due to solvation. Conversely, the anions build up on the cell wall and cause it to collapse, speeding up and simplifying the sonication process. As a result, less energy is used by the sonicator; consequently, KOH, an alkali, acts as a catalyst to improve the sonication pretreatment. In this investigation, KOH was combined with the SL method to enhance the liquefaction capability, in accordance with the abovementioned certainties. Figure 3 depicts the release of LO and biomolecules at different pH values. The inclusion of alkali was conducted by adjusting the pH between 8 and 12. Table 1 shows composition of biomolecules released at various pH levels.
With the optimized conditions of SL (50% sonic intensity, 30 min pretreatment time), SAL was performed, in which the pH of the samples was adjusted. Every 5 min once during SAL’s operational time, a sample of liquefied biomass was obtained and evaluated for every pH ranging from 8 to 12. The sequence of LO and biomolecules (protein, carbohydrates) in Figure 3 shows two dissimilar stages: a rapid and a stagnant stage. The rapid stage exists from pH 8 to pH 11, with a LO release of 2100–3200 mg/L. This demonstrates that the combined pretreatment is extremely beneficial since more LO were discharged in SAL (3200 mg/L) than in SL (2650 mg/L), as shown in Figure 3. The simultaneous effect of SAL, which causes the breaking of the macroalgae cell wall and the liberation of biomolecules, could explain the huge increase in the liberation of LO during the rapid stage. This is similar to the work of Kumar et al. [41], who implemented a combination of microwave and hydrogen peroxide to obtain 1750 mg/L SCOD release from macroalgae. The slow phase occurs between pH 11 and pH 12, with a LO release of 3200–3280 mg/L. Between pH 8 and pH 11, there was a significant increase in the release of LO, while beyond pH 11, there was only a minor increase. This is because a substantial majority of LO was expelled at pH 11, sufficient to liquefy the cell wall of macroalgae. Since more biomolecules were released at pH 11, liquefaction efficiency also increased. At this optimum pH 11, a liquefaction efficiency of 24.6% was obtained. Hence, liquefaction is directly proportional to pH 11. Increasing the pH level above 11 may raise the price of chemicals rather than enhance the solubility of macroalgae. Figure 3 demonstrates that in SAL, 24.6% optimum liquefaction efficiency was obtained to release a LO of 3200 mg/L.
The existence of biomolecules in macroalgae, notably carbohydrates, stimulates hydrogen synthesis. The emergence of biomolecules from pH 8 to pH 12 is depicted in Figure 3. The biomolecule pattern is undeniably comparable to the LO pattern, and it can be divided into two conditions: vigorous and indolent. The vigorous condition commences with a pH of 8 and terminates at a pH of 11. In this vigorous condition, a considerable rise in biomolecules release was observed up to a pH of 11, with a biomolecule release in the range of 2047–3051 mg/L. Above pH 11, the indolent condition begins, with a biomolecule release of 3100 mg/L, indicating that the preponderance of biomolecules was released at pH 11. The combined action of SAL pretreatment allows for excellent liquefaction of macroalgae cell wall and biomolecule release into the liquid form of the macroalgae. This combined SAL approach was explored in macroalgae (Chaetomorpha antennina) for the first time to reduce the energy consumption of the sonicator and also for efficient biohydrogen production. As an outcome of the foregoing facts, it can be claimed that SAL is more successful in liquefying and liberating biomolecules.

3.4. Assessment and Generation of VFA in Samples

Figure 4a shows the VFA analysis results during anaerobic fermentation performed on the CL, SL and SAL samples. Figure 4b shows the hourly variations of VFA in CL, SL and SAL. At the initiation of hydrolysis, the complicated biomolecules released during pretreatment were converted into simple monomers. At the end of acetogenesis, the simple monomers were changed into VFA [42]. The macromolecules were transformed to VFA by the inoculum microorganism bioactivity [43]. For a period of 72 h, anaerobic fermentation was conducted. As anticipated, the protein and carbohydrate content of SAL dropped dramatically from 1655, 967 mg/L to 615, 384 mg/L after 72 h, confirming hydrolysis capability. On the other hand, protein and carbohydrate levels in SL dropped somewhat from 1325 to 780 mg/L to 516 to 320 mg/L. Compared to SAL, biomolecule concentrations were shown decrease substantially less in SL.
This demonstrated the efficiency of synergetic pretreatment by proving that highly liquefied biomolecules were readily available to fermentative bacteria [44]. This is equivalent to the work of Gao et al. [45], who proposed a combined approach of hydroxyl radical and thermal pretreatment to improve the biodegradability of algae. Contrarily, the CL sample which was not pretreated does not reveal a substantial decrease; instead, a development in biomolecules was seen. In control, protein and carbohydrate concentrations were increased from 160,120 mg/L to 200,150 mg/L. Since the biomolecules in the CL were not liquefied due to the lack of pretreatment, the microbes attempted to liquefy the macroalgae cell wall and release the biomolecules on their own. Instead of fermentation, disintegration was used to achieve this release. After the fermentation process, the increased VFA production should lead to a higher hydrogen yield. To ensure the pretreatment and biohydrogen production in the fermentation process, the VFA production study was carried out. The highest level of VFA liberation boosted biohydrogen production during fermentation [46]. After 72 h of anaerobic fermentation, SAL produced more VFA (2160 mg/L) than SL (1070 mg/L) and CL (183 mg/L) due to the alkali-induced sonication effect and efficient breakdown of liquefied biomolecules by acidogenic bacteria. The data illustrated SALʹs utility in VFA generation, demonstrating that SAL produces more biohydrogen at the end of the anaerobic fermentation reaction. This is because in SAL, the combined action of KOH and sonication resulted in the release of more proteins and carbohydrates. The released proteins and carbohydrates were effectively consumed by microbes in VFA generation, which produced more biohydrogen at the end of the fermentation process.

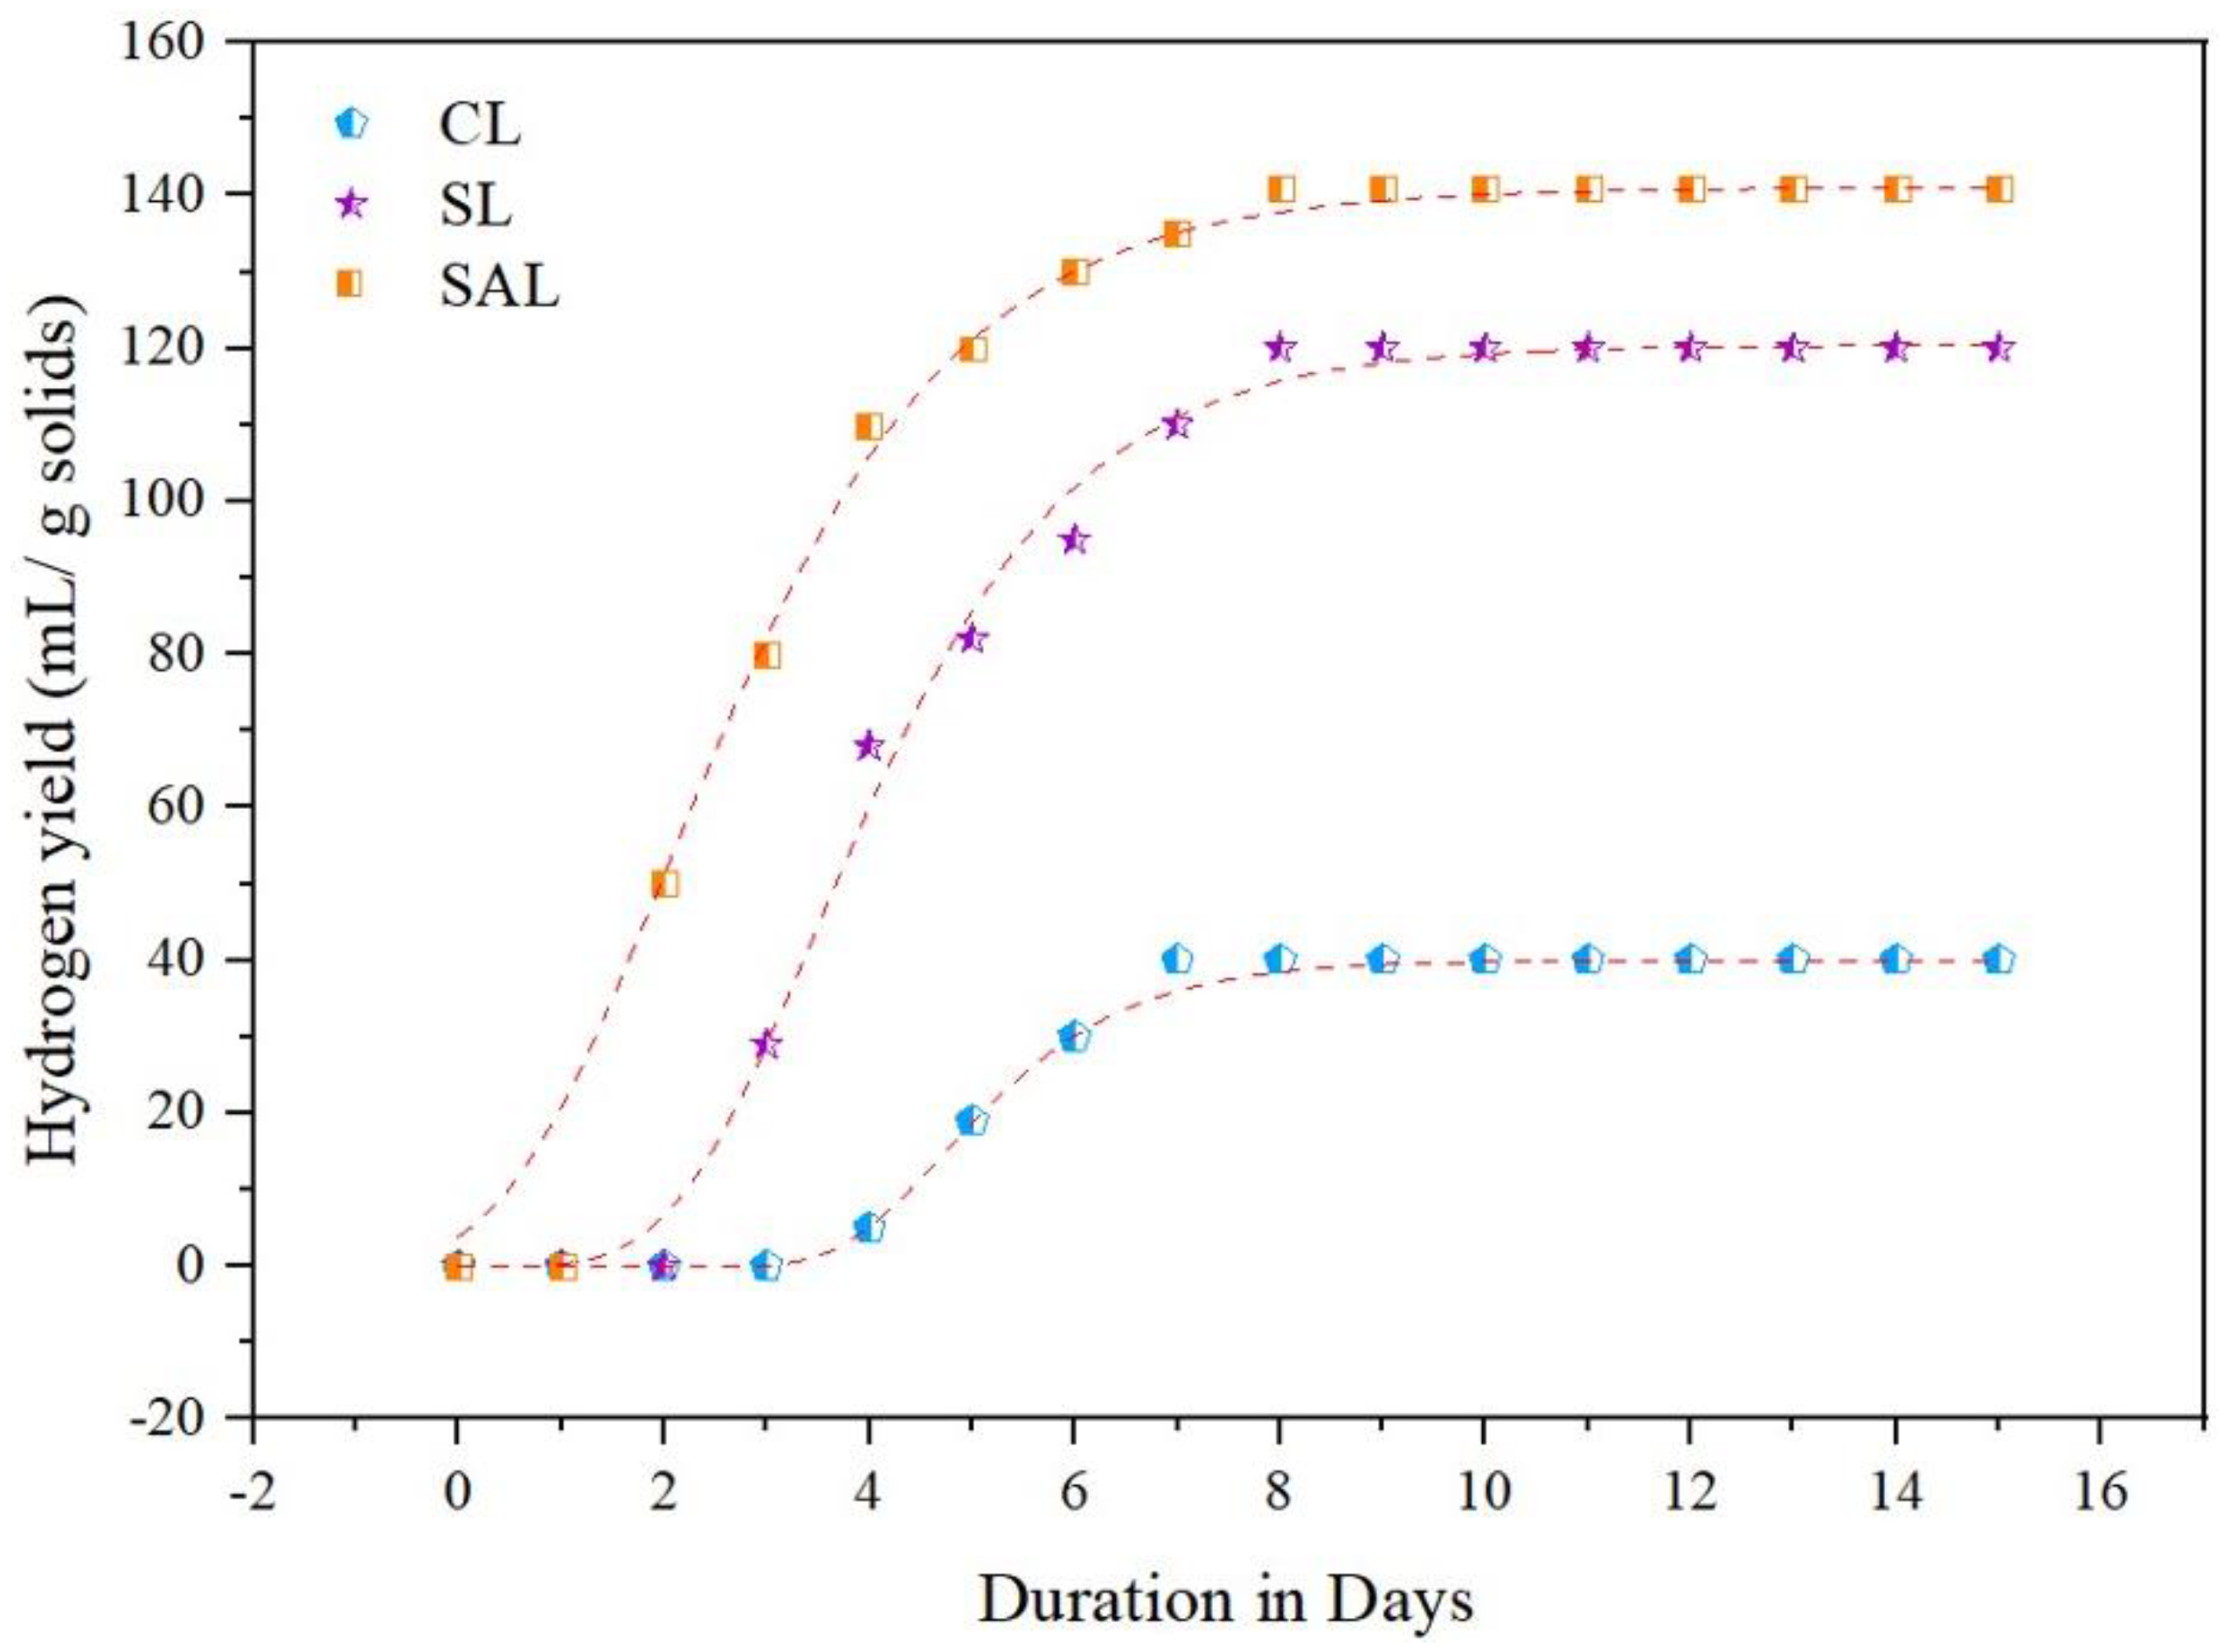
3.5. Biohydrogen Emission and Analysis in Control, SL and SAL

Figure 5 illustrates the biohydrogen emission in CL, SL and SAL. As shown in Figure 6, the biohydrogen formation was distinguishable with CL, SL and SAL. The biohydrogen analysis requires 15 days to complete. Despite an increase in biohydrogen generation with increasing days of fermentation, the biohydrogen generation rate in CL (40 mL H2/g COD, which is 0.001 moles of H2) was lower than SL (120 mL H2/g COD, which is 0.005 moles of H2/g COD) and SAL (141 mL H2/g COD which is 0.006 moles of H2) on the eighth day of fermentation. The reason behind this was that the microorganisms in the inoculum were more comfortable in biologically digesting the macroalgae when it was in soluble form than solid form in producing biohydrogen. Because of the strong hydrolysis impact produced by the combined effect of KOH and sonication, the SAL sample yielded more biohydrogen than the CL and SL samples. Biohydrogen generation was accelerated by hydrogen-producing bacteria using the acetogenic substance [47]. The combinative liquefaction process applied over the macroalgae allowed the microbes in the inoculum to produce biohydrogen satisfactorily. Similarly, the biohydrogen generation potential of various substrates varies depending on the composition, liquefying efficiency, and pretreatment conditions. The discharged biomolecules constituents, especially proteins and carbohydrates, are reduced as a result of the successful biomolecule consumption by microorganisms. This results in the increased production of VFA and biohydrogen. The breakdown of biomolecules is the first step in the biohydrogen fermentation process. Biohydrogen is formed when hydrogen-producing microbes break down biomolecules. Fermentative bacteria used biomolecules as an electron and energy source [48]. These biomolecules were subsequently used by hydrogen-producing bacteria which convert them into biohydrogen. The liquefied biomolecules were successfully consumed by the inoculum (anaerobic sludge) bacteria which are converted into monosaccharides, ultimately increasing the biohydrogen emission. Biohydrogen production can be classified into four stages: the slower stage, boosted stage, enhanced stage and stable stage. Slower stage can be seen in the early stages of the process (i.e., until the third day), where biohydrogen generation is minimum for all samples. This may be due to the microbes’ incapacity to quickly adapt to the environment in which it was present.
The production of biohydrogen steadily increased after the third day in the boosted stage, with biohydrogen production of 5/0.000, 68/0.002, and 110/0.004 mL H2/g COD/moles of H2 in the CL, SL and SAL, respectively. In the enhanced stage, the escalating scenario of biohydrogen shows effective microbial proliferation and fermentation. On the eighth day, the steady stage of fermentation begins, with biohydrogen production of 40/0.001, 120/0.005 and 141/0.006 mL H2/g COD/moles of H2 for CL, SL and SAL, respectively, after which biohydrogen production does not improve any further. As noticed in the summary of this stable stage in Figure 5, the biohydrogen generators have exploited the liquefied feedstock unconditionally. Compared to SL (120 mL H2/g COD/0.005 moles of H2) and the CL (40 mL H2/g COD/0.001 moles of H2), SAL produced a highest biohydrogen output of 141 mL H2/g COD/0.006 moles of H2.
This is due to the combined effect of sonication and KOH. The SAL pretreatment allows the anaerobic microbes in the inoculum sludge to easily approach the macroalgae biomolecules, resulting in more biohydrogen production. Table 2 provides the kinetics constants for CL, SL and SAL samples based on Gompertz modelling. SAL has a maximum hydrogen production rate and potential (141 mL H2/g COD/0.006 moles of H2 and 0.79 mL H2/g COD) in comparison to SL (120 mL H2/g COD/0.005 moles of H2) and 0.73 mL/d) and CL (40 mL H2/g COD/0.001 moles of H2 and 0.53 mL/d). In comparison to the CL (4.72 days) and SL (3.49 days), SAL has a very short preliminary period (2.32 days). The correlation coefficient of 0.994 obtained in observational data indicates an excellent fit. The study of Tamilarasan et al. [49] showed a similar fit range. Compared to SL (120 mL H2/g COD/0.005 moles of H2) and CL (40 mL H2/g COD/0.001 moles of H2), SAL had the highest hydrogen production rate (141 mL H2/g COD/0.006 moles of H2), demonstrating the combinative potential of sonication and KOH [50].

3.6. Energy Parameter Exploration

To evaluate energy, the total energy consumed by 1 kg of macroalgae was considered. The entire energy analysis between SL and SAL is shown in Figure 6, which comprises the optimum condition, entire energy utilized, biohydrogen production energy, energy ratio and net energy. In order to accomplish efficient liquefaction, the energy which is taken as input should be matched by the energy which is generated as output in biohydrogen production [50]. In the evaluation, the biohydrogen output energy (OE) and sonication input energy (IE) of SL and SAL at an optimum configuration were considered. The energy constants for evaluating SL and SAL were calculated with a liquefaction efficiency of 20.76% as a benchmark. These parameters were used to compute the IE of SL (0.1 kWh/kg solids) and SAL (0.05 kWh/kg solids). Almost 50% of IE was reduced in SAL in comparison to SL. The OE of 0.09 kWh/kg solids was attained for both SL and SAL since the liquefaction efficiency of 20.76% was kept as an index to calculate the energy parameters. It was clearly understood that for an optimum liquefaction efficiency of 20.76%, SAL consumed less IE (0.05 kWh/kg solids) than SL (0.1 kWh/kg solids) to produce OE of 0.09 kWh/kg solids. The lesser energy consumption by SAL showed that the combined action of KOH and sonication was an energy-effective approach in biohydrogen production. Net energy (NE) and energy ratio (ER) are the two most important parameters in determining energy competency and liquefaction potential. The NE (−0.042 kWh) and ER (0.8) of SL were lower than those of SAL, which had a greater NE (0.031 kWh) and ER (1.8). The SAL method is believed to be profitable when the ER is larger than 1. This demonstrates that the combined SAL is more energy effective than SL.

4. Conclusions

According to the findings of this study, SAL pretreatment with an optimum pH of about 11 at a USE of 10,800 kJ/kg TS was shown to be a successful condition for the generation of biohydrogen. This investigation identified pH as a crucial factor in determining the liquefaction efficiency and making it acceptable for biohydrogen production. SAL resulted in a 24.6% liquefaction efficiency and a 141 mL H2/g COD/0.006 moles of H2 higher biohydrogen production. Thus, macroalgae liquefaction for biohydrogen production was determined to be an effective process using sonication combined with KOH in an alkali environment. Although utilizing macroalgae as a source of biofuel has many advantages, it also has significant drawbacks. Sustainable alternatives to bio-refineries should be investigated and implemented in a way that satisfies the general public. The coastal population should be made aware of biotechnologies and their consequences before establishing the biorefinery.

Author Contributions

Writing—original draft preparation, S.S.; writing—review and editing, conceptualization, methodology, data curation, supervision, T.K.; conceptualization, methodology, R.B.J.; writing—review and editing, validation, G.S.V. All authors have read and agreed to the published version of the manuscript.

Funding

This research received no external funding.

Data Availability Statement

Not applicable.

Conflicts of Interest

The authors declare no conflict of interest.

References

  1. Sangita, M.; Dilip, K.; Brajesh, S.; Pravin, K.S. Biofuels and their sources of production: A review on cleaner sustainable alternative against conventional fuel, in the framework of the food and energy nexus. Energy Nexus 2021, 4, 100036. [Google Scholar] [CrossRef]
  2. Jeswani, H.K.; Chilvers, A.; Azapagic, A. Environmental sustainability of biofuels: A Review. Proc. Math. Phys. Eng. Sci. 2020, 476, 20200351. [Google Scholar] [CrossRef]
  3. Khan, S.; Siddique, R.; Sajjad, W.; Nabi, G.; Hayat, K.M.; Duan, P.; Yao, L. Biodiesel production from algae to overcome the energy crisis. Hayati 2017, 24, 163–167. [Google Scholar] [CrossRef]
  4. Tirath, R.; Raj, M.; Chandrasekhar, K.; Deepak, K.; Shveta, S.; Ravindra, K.; Anil, K.P.; Kim, S.-H. Microalgae biomass deconstruction using green solvents: Challenges and future opportunities. Bioresour. Technol. 2023, 369, 128429. [Google Scholar] [CrossRef]
  5. Yin, Y.; Wang, J. Pretreatment of macroalgal laminaria japonica by combined microwave-acid method for biohydrogen production. Bioresour. Technol. 2018, 268, 52–59. [Google Scholar] [CrossRef]
  6. Møller, K.T.; Jensen, T.R.; Akiba, E.; Li, H.-W. Hydrogen—A sustainable energy carrier. Prog. Nat. Sci. 2017, 27, 34–40. [Google Scholar] [CrossRef]
  7. Rahman, S.N.A.; Masdar, M.S.; Rosli, M.I.; Majlan, E.H.; Husaini, T.; Kamarudin, S.K.; Daud, W.R.W. Overview of biohydrogen technologies and application in fuel cell technology. Renew. Sustain. Energy Rev. 2016, 66, 137–162. [Google Scholar] [CrossRef]
  8. Alka, P.; Rekha, D.; Jyoti, G.; Jyothi, C.; Vivek, A.; Pramod, H.B. Insights into renewable hydrogen energy: Recent advances and prospects. Mater. Sci. Technol. 2020, 3, 319–327. [Google Scholar] [CrossRef]
  9. Rai, P.K.; Singh, S.P. Integrated Dark- and Photo-Fermentation: Recent advances and provisions for improvement. Int. J. Hydrogen Energy 2016, 41, 19957–19971. [Google Scholar] [CrossRef]
  10. Khan, M.A.; Ngo, H.H.; Guo, W.; Liu, Y.; Zhang, X.; Guo, J.; Chang, S.W.; Nguyen, D.D.; Wang, J. Biohydrogen production from anaerobic digestion and its potential as renewable energy. Renew. Energy 2018, 129, 754–768. [Google Scholar] [CrossRef]
  11. Wang, J.; Yin, Y. Fermentative hydrogen production using various biomass-based materials as feedstock. Renew. Sustain. Energy Rev. 2018, 92, 284–306. [Google Scholar] [CrossRef]
  12. Sadia, S.; Bakhtawar, J.; Irfan, M.; Shakir, H.A.; Khan, M.; Ali, S. Role of substrate to improve biomass to biofuel production technologies. In Clean Energy Production Technologies; Springer: Singapore, 2021; pp. 127–156. ISBN 9789811570698. [Google Scholar]
  13. Sharmila, V.G.; Kumar, M.D.; Pugazhendi, A.; Bajhaiya, A.K.; Gugulothu, P.; Banu, J.R. Biofuel production from macroalgae: Present scenario and future scope. Bioengineered 2021, 12, 9216–9238. [Google Scholar] [CrossRef]
  14. Baihui, C.; Zhihua, C.; Dabin, G.; Yu, L. Investigations on the pyrolysis of microalgal-bacterial granular sludge: Products, kinetics, and potential mechanisms. Bioresour. Technol. 2022, 349, 126328. [Google Scholar] [CrossRef]
  15. Jung, K.A.; Lim, S.-R.; Kim, Y.; Park, J.M. Opportunity and Challenge of seaweed bioethanol based on life cycle CO2 assessment. Environ. Prog. Sustain. Energy 2017, 36, 200–207. [Google Scholar] [CrossRef]
  16. Tan, I.S.; Lam, M.K.; Foo, H.C.Y.; Lim, S.; Lee, K.T. Advances of macroalgae biomass for the third generation of bioethanol production. Chin. J. Chem. Eng. 2020, 28, 502–517. [Google Scholar] [CrossRef]
  17. Wu, Y.N.; Mattsson, M.; Ding, M.W.; Wu, M.T.; Mei, J.; Shen, Y.L. Effects of different pretreatments on improving biogas production of macroalgae fucus vesiculosus and fucus serratus in baltic sea. Energy Fuels 2019, 33, 2278–2284. [Google Scholar] [CrossRef]
  18. Lymperatou, A.; Engelsen, T.K.; Skiadas, I.V.; Gavala, H.N. Different pretreatments of beach-cast seaweed for biogas production. J. Clean. Prod. 2022, 362, 132277. [Google Scholar] [CrossRef]
  19. Sharmila, V.G.; Banu, J.R.; Kumar, M.D.; Kumar, S.A.; Gopalakrishnan, K. Algal Biorefinery towards Decarbonization: Economic and Environmental Consideration. Bioresour. Technol. 2022, 364, 128103. [Google Scholar] [CrossRef]
  20. Shankaran, S.; Tamilarasan, K.; Banu, J.R. Chemo-sonic pretreatment approach on marine macroalgae for energy efficient biohydrogen production. Sustainability 2022, 14, 12849. [Google Scholar] [CrossRef]
  21. Korai, R.M.; Wachemo, A.C.; Yue, L.; Jaffar, M.; Li, Z.; Shahbaz, M.; Yuan, H.; Li, X. Effect of ultrasonic application during KOH pretreatment and anaerobic process on digestion performance of wheat straw. RSC Adv. 2020, 10, 9290–9298. [Google Scholar] [CrossRef]
  22. Tamilarasan, K.; Banu, J.R.; Kumar, M.D.; Sakthinathan, G.; Park, J.-H. Influence of mild-ozone assisted disperser pretreatment on the enhanced biogas generation and biodegradability of green marine macroalgae. Front. Energy Res. 2019, 7, 89. [Google Scholar] [CrossRef]
  23. Jayakrishnan, U.; Deka, D.; Das, G. Regulation of volatile fatty acid accumulation from waste: Effect of inoculum pretreatment. Water Environ. Res. 2021, 93, 1019–1031. [Google Scholar] [CrossRef] [PubMed]
  24. Woo, H.C.; Kim, Y.H. Eco-efficient recovery of bio-based volatile C2-6 fatty acids. Biotechnol. Biofuels 2019, 12, 92. [Google Scholar] [CrossRef] [Green Version]
  25. Primasari, B.; Tamin, M.Z.A.; Mustafa, M.A.H. Effects of different pretreatment methods on anaerobic mixed microflora for hydrogen production and COD reduction from domestic effluent. IOP Conf. Ser. Mater. Sci. Eng. 2019, 602, 012061. [Google Scholar] [CrossRef]
  26. Jung, J.K.; Kim, I.G.; Chung, K.S.; Baek, U.B. Gas chromatography techniques to evaluate the hydrogen permeation characteristics in rubber: Ethylene propylene diene monomer. Sci. Rep. 2021, 11, 4859. [Google Scholar] [CrossRef]
  27. Kavitha, S.; Banu, J.R.; Subitha, G.; Ushani, U.; Yeom, I.T. Impact of thermo-chemo-sonic pretreatment in solubilizing waste activated sludge for biogas production: Energetic analysis and economic assessment. Bioresour. Technol. 2016, 219, 479–486. [Google Scholar] [CrossRef]
  28. APHA; AWWA. WEF, Standard Methods for the Examination of Water and Wastewater, 21st ed.; American Public Health Association/American Water Works Association/Water Environment Federation: Washington, DC, USA, 2005. [Google Scholar]
  29. Kumar, D.; Eswari, A.P.; Park, J.-H.; kumar, S.A.; Banu, J.R. Biohydrogen generation from macroalgal biomass, chaetomorpha antennina through surfactant aided microwave disintegration. Front. Energy Res. 2019, 7, 78. [Google Scholar] [CrossRef] [Green Version]
  30. Malafronte, L.; Yilmaz-Turan, S.; Krona, A.; Martinez-Sanz, M.; Vilaplana, F.; Lopez-Sanchez, P. Macroalgae Suspensions Prepared by Physical Treatments: Effect of Polysaccharide Composition and Microstructure on the Rheological Properties. Food Hydrocoll. 2021, 120, 106989. [Google Scholar] [CrossRef]
  31. Laxminandan, S.; Deeptimayi, D.; Pritijyotsna, S.; Taslima, N.A.; Siba, P.P. Quantitation of total protein content in some common edible food sources by lowry protein assay. Lett. Appl. NanoBioScience 2020, 9, 1275–1283. [Google Scholar] [CrossRef]
  32. Chloe, R.; Nicole, O.C.; Diveena, J.; Alan, B.; Fiona, R. Selection and optimization of protein and carbohydrate assays for the characterization of marine biofouling. Anal. Methods 2020, 12, 2228–2236. [Google Scholar] [CrossRef]
  33. Kannah, R.Y.; Kavitha, S.; Preethi; Karthikeyan, O.P.; Kumar, G.; Dai-Viet, N.V.; Banu, J.R. Techno-economic assessment of various hydrogen production methods—A Review. Bioresour. Technol. 2021, 319, 124175. [Google Scholar] [CrossRef]
  34. Ushani, U.; Banu, J.R.; Tamilarasan, K.; Kavitha, S.; Yeom, I.T. Surfactant coupled sonic pretreatment of waste activated sludge for energetically positive biogas generation. Bioresour. Technol. 2017, 241, 710–719. [Google Scholar] [CrossRef]
  35. Rashad, S.; El-Chaghaby, G.; Lima, E.C.; Simoes dos reis, G. Optimizing the ultrasonic-assisted extraction of antioxidants from ulva lactuca algal biomass using factorial design. Biomass Convers. Biorefin. 2021. [Google Scholar] [CrossRef]
  36. Tamilarasan, K.; Kavitha, S.; Selvam, A.; Banu, J.R.; Yeom, I.T.; Nguyen, D.D.; Saratale, G.D. Cost-effective, low thermo-chemo disperser pretreatment for biogas production potential of marine macroalgae chaetomorpha antennina. Energy 2018, 163, 533–545. [Google Scholar] [CrossRef]
  37. Jarahizadeh, H.; Dinani, S.T. Influence of applied time and power of ultrasonic pretreatment on convective drying of potato slices. Food Sci. Biotechnol. 2019, 28, 365–376. [Google Scholar] [CrossRef]
  38. Shabarish, S.; Tamilarasan, K.; Banu, J.R.; Sharmila, V.G. Biohydrogen production from macroalgae via sonic biosurfactant disintegration: An energy efficient approach. Resour. Environ. Sustain. 2023, 11, 100093. [Google Scholar] [CrossRef]
  39. Xiao, Q.; Wang, X.; Zhang, J.; Zhang, Y.; Chen, J.; Chen, F.; Xiao, A. Pretreatment techniques and green extraction technologies for agar from gracilaria lemaneiformis. Mar. Drugs 2021, 19, 617. [Google Scholar] [CrossRef] [PubMed]
  40. Manali, K.; Tirath, R.; Vijayaraj, M.; Anju, C.; Ravi, P.G.; Deepak, K.T.; Kumar, R. Structural features of dilute acid, steam exploded, and alkali pretreated mustard stalk and their impact on enzymatic hydrolysis. Carbohydr. Polym. 2015, 124, 265–273. [Google Scholar] [CrossRef]
  41. Kumar, M.D.; Kannah, R.Y.; Kumar, G.; Sivashanmugam, P.; Banu, J.R. A novel energetically efficient combinative microwave pretreatment for achieving profitable hydrogen production from marine macro algae (ulva reticulate). Bioresour. Technol. 2020, 301, 122759. [Google Scholar] [CrossRef] [PubMed]
  42. Shiyan, G.; Wenyi, Z.; Huige, X.; Ruji, W.; Jiyang, S.; Min, Z.; Yi, L. The effect of anaerobic co-fermentation on acidification performance of food waste and cardboard waste. Water Sci. Technol. 2022, 85, 839–850. [Google Scholar] [CrossRef]
  43. Ramos-Suarez, M.; Zhang, Y.; Outram, V. Current perspectives on acidogenic fermentation to produce volatile fatty acids from waste. Rev. Environ. Sci. Biotechnol. 2021, 20, 439–478. [Google Scholar] [CrossRef]
  44. Menzel, T.; Neubauer, P.; Junne, S. Role of microbial hydrolysis in anaerobic digestion. Energies 2020, 13, 5555. [Google Scholar] [CrossRef]
  45. Gao, L.; Li, D.; Gao, F.; Liu, Z.; Hou, Y.; Chen, S.; Zhang, D. Hydroxyl radical-aided thermal pretreatment of algal biomass for enhanced biodegradability. Biotechnol. Biofuels. 2015, 8, 194. [Google Scholar] [CrossRef] [PubMed] [Green Version]
  46. Deng, C.; Lin, R.; Kang, X.; Wu, B.; Wall, D.; Murphy, J.D. Improvement in biohydrogen and volatile fatty acid production from seaweed through addition of conductive carbon materials depends on the properties of the conductive materials. Energy 2022, 239, 122188. [Google Scholar] [CrossRef]
  47. Pugazhendhi, A.; Kumar, G.; Sivagurunathan, P. Microbiome involved in anaerobic hydrogen producing granules: A mini review. Biotechnol. Rep. 2019, 21, e00301. [Google Scholar] [CrossRef]
  48. Chen, Y.; Yin, Y.; Wang, J. Biohydrogen production using macroalgal biomass of laminaria japonica pretreated by gamma irradiation as substrate. Fuel 2022, 309, 122179. [Google Scholar] [CrossRef]
  49. Tamilarasan, K.; Kavitha, S.; Banu, J.R.; Arulazhagan, P.; Yeom, I.T. Energy-efficient methane production from macroalgal biomass through chemo disperser liquefaction. Bioresour. Technol. 2017, 228, 156–163. [Google Scholar] [CrossRef]
  50. Banu, J.R.; Kannah, R.Y.; Kavitha, S.; Ashikvivek, A.; Bhosale, R.R.; Kumar, G. Cost effective biomethanation via surfactant coupled ultrasonic liquefaction of mixed microalgal biomass harvested from open raceway pond. Bioresour. Technol. 2020, 304, 123021. [Google Scholar] [CrossRef]
Figure 1. Impact of SL on LOR.
Energies 16 03017 g001
Figure 2. Impact of SL specific energy on LOR and liquefaction efficiency.
Energies 16 03017 g002
Figure 3. Impact of SAL on LOR and biomolecule release.
Energies 16 03017 g003
Figure 4. (a) VFA generation in CL, SL and SAL. (b) Hourly variations in CL, SL and SAL.
Energies 16 03017 g004
Figure 5. Biohydrogen generation in CL, SL and SAL.
Energies 16 03017 g005
Figure 6. Energy evaluation in SL and SAL.
Energies 16 03017 g006
Table 1. Composition of biomolecules at various pH levels.
S. NopHComposition (mg/L)
Proteins Carbohydrates
1 81267630
2 91404723
3 101635843
4 11 (Optimum)20141037
5 1221781122
Table 2. Kinetic analysis for various liquefied samples through Gompertz modelling.
S. No.Samplesk
(mL/d)
HP
(mL)
Hl
(days)
R2
1SAL0.791412.320.994
2SL0.731203.490.997
3CL0.53404.720.993
SAL—Sonic alkali liquefaction; SL—Sonic liquefaction; k—Hydrogen production rate; Hp—Hydrogen production potential; Hl—Lag stage; R2—correlation coefficient.
Disclaimer/Publisher’s Note: The statements, opinions and data contained in all publications are solely those of the individual author(s) and contributor(s) and not of MDPI and/or the editor(s). MDPI and/or the editor(s) disclaim responsibility for any injury to people or property resulting from any ideas, methods, instructions or products referred to in the content.

